21 January 2018 Beverages Monthly Latam Consumer...
82
Latam Consumer Monthly Beverages Industry Update Latin America Industry Latam Consumer Monthly Date 21 January 2018 Deutsche Bank Markets Research 2017 Review and 2018 Outlook (January 2018) 2017 was a much better year than 2016 both in absolute and relative terms Almost 80% of our covered stocks showed positive returns in 2017, but only 39% managed to outperform their respective MSCI country index (versus 59% and 28%, respectively, 2016). As we noted throughout the year, there was a wide divergence between discretionary retailers and staples stocks: 2017 was an exceptional year for Brazilian discretionary retailers, which (with the exception of Lojas Americanas) posted very high positive returns in USD terms and outperformed the Brazil MSCI Index by at least 50% driven by an incipient economic recovery, a sharp drop in inflation, monetary easing and a falling unemployment rate. In addition, several blue-chip staples stocks also performed well (albeit to a lesser extent). On the other hand, most Brazilian meat producers/ packers had another bad year, mired by ongoing government investigations, high leverage and management turnover. But the biggest negative surprise was Liverpool, which bore the brunt of investors' fears (exaggerated, in our view) regarding Amazon's expansion into Latin America. Updating annual total return analysis In this issue, we update our long-term total return analysis (last published in the January 2017 issue) for the stocks in our coverage universe, to reflect 2017 results. While last year was not a good year in terms of index outperformance, our analysis continues to underscore the long-term attractiveness of the Latam Consumer sector (as most of the stocks with 10-year records have outperformed). 2018 could be volatile (MX/BR elections), so we remain generally defensive With GDP growth expected to pick up in all major Latam markets, 2018 should be a generally positive year for consumer stocks. We expect discretionary retail stocks (the stars of 2017) to decelerate, giving the stage to food retailers (our Buy- rated names in this space are CBD, FEMSA, Exito and Carrefour Brasil). There is one exception: we believe that Liverpool, the one stock in the discretionary space that fell in 2017, will stage a comeback (as should Kimberly-Clark de Mexico, another strong-MXN play). Among Food and Beverage companies we continue to prefer Chile-based Andina (undervalued with significant Brazil exposure) and Concha y Toro (on cost reduction program and potential strong harvest), Mexico- based Gruma and Grupo Bimbo (both beneficiaries of US tax reform, and oversold in our view) and Brazil-based Minerva (on favorable cattle cycle and synergies from the Southern Cone acquisition in 2017). Jose Yordan Research Analyst +1-212-250-5528 Marcel Moraes Research Analyst +1-904-271-2470 Yusuf Jamal, CFA Research Associate Kaila Lopez Research Associate +1-904-645-1197 Deutsche Bank Securities Inc. Deutsche Bank does and seeks to do business with companies covered in its research reports. Thus, investors should be aware that the firm may have a conflict of interest that could affect the objectivity of this report. Investors should consider this report as only a single factor in making their investment decision. DISCLOSURES AND ANALYST CERTIFICATIONS ARE LOCATED IN APPENDIX 1. MCI (P) 083/04/2017. Distributed on: 22/01/2018 04:06:14 GMT 7T2se3r0Ot6kwoPa
Transcript of 21 January 2018 Beverages Monthly Latam Consumer...

21 January 2018
Beverages
Latam Consumer Monthly
BeveragesIndustry Update
Latin America Industry
Latam ConsumerMonthly
Date21 January 2018
Deutsche BankMarkets Research
2017 Review and 2018 Outlook(January 2018)2017 was a much better year than 2016 both in absolute and relative termsAlmost 80% of our covered stocks showed positive returns in 2017, but only39% managed to outperform their respective MSCI country index (versus 59%and 28%, respectively, 2016). As we noted throughout the year, there wasa wide divergence between discretionary retailers and staples stocks: 2017was an exceptional year for Brazilian discretionary retailers, which (with theexception of Lojas Americanas) posted very high positive returns in USD termsand outperformed the Brazil MSCI Index by at least 50% driven by an incipienteconomic recovery, a sharp drop in inflation, monetary easing and a fallingunemployment rate. In addition, several blue-chip staples stocks also performedwell (albeit to a lesser extent). On the other hand, most Brazilian meat producers/packers had another bad year, mired by ongoing government investigations,high leverage and management turnover. But the biggest negative surprise wasLiverpool, which bore the brunt of investors' fears (exaggerated, in our view)regarding Amazon's expansion into Latin America.
Updating annual total return analysisIn this issue, we update our long-term total return analysis (last published inthe January 2017 issue) for the stocks in our coverage universe, to reflect 2017results. While last year was not a good year in terms of index outperformance,our analysis continues to underscore the long-term attractiveness of the LatamConsumer sector (as most of the stocks with 10-year records have outperformed).
2018 could be volatile (MX/BR elections), so we remain generally defensiveWith GDP growth expected to pick up in all major Latam markets, 2018 shouldbe a generally positive year for consumer stocks. We expect discretionary retailstocks (the stars of 2017) to decelerate, giving the stage to food retailers (our Buy-rated names in this space are CBD, FEMSA, Exito and Carrefour Brasil). There isone exception: we believe that Liverpool, the one stock in the discretionary spacethat fell in 2017, will stage a comeback (as should Kimberly-Clark de Mexico,another strong-MXN play). Among Food and Beverage companies we continueto prefer Chile-based Andina (undervalued with significant Brazil exposure) andConcha y Toro (on cost reduction program and potential strong harvest), Mexico-based Gruma and Grupo Bimbo (both beneficiaries of US tax reform, and oversoldin our view) and Brazil-based Minerva (on favorable cattle cycle and synergiesfrom the Southern Cone acquisition in 2017).
Jose Yordan
Research Analyst
+1-212-250-5528
Marcel Moraes
Research Analyst
+1-904-271-2470
Yusuf Jamal, CFA
Research Associate
Kaila Lopez
Research Associate
+1-904-645-1197
Deutsche Bank Securities Inc.
Deutsche Bank does and seeks to do business with companies covered in its research reports. Thus, investors should beaware that the firm may have a conflict of interest that could affect the objectivity of this report. Investors should considerthis report as only a single factor in making their investment decision. DISCLOSURES AND ANALYST CERTIFICATIONSARE LOCATED IN APPENDIX 1. MCI (P) 083/04/2017.
Distributed on: 22/01/2018 04:06:14 GMT
7T2se3r0Ot6kwoPa

21 January 2018
Beverages
Latam Consumer Monthly
Table Of Contents
DB Related Research—December...................................... 3Latin America: Carrefour Brasil Initiation, JBS Reinstatement...........................3Global: Update on Russian Food Retailers & ICBP beverage buyout................. 4
DB LatAm Consumer Coverage Summaries.......................5
Updated Total Return Analysis........................................... 92017 Recap.........................................................................................................9(A) Mexican bakers (Bimbo and Gruma) still out of sync.................................12(B) Brazilian protein producers still performing poorly.....................................14(C) Beverages remain the most consistent...................................................... 18(D) Large-cap food retailers among Top 10 in 2017........................................ 25(E) Discretionary retailers the most recent stars..............................................28(F) Second-tier Mexican food retailers stuck in neutral................................... 35(G) Colombia-based Exito still recovering........................................................ 37(H) Cosmetics/HPC remains resilient............................................................... 38
Global Peer Valuation Tables.............................................40
Historical Valuation Multiples........................................... 52LatAm Food stocks.......................................................................................... 52LatAm Beverage stocks....................................................................................54LatAm Household & Personal Care stocks...................................................... 57LatAm Retail stocks......................................................................................... 58
Input Cost Tracker.............................................................63Beverage raw materials: world sugar stabilizing near multi-year l...................63Grain prices generally stable (with only wheat rising); Brazil ca......................64Pulp still rising from multi-year lows; oil keeps rising amid glo.......................66
Brazil Protein Update........................................................ 68
Update on the Consumer (BR, MX, CL, CO).....................69Brazil: recovery continues to proceed, but political risks remain.....................69Mexico: some positive signs, but NAFTA and the 2018 election rema............ 71Chile: recovery to pick up despite pause in easing cycle, as the..................... 73Colombia: with oil rising, looks like the worst is over..................................... 74
Valuation and Risks.......................................................... 76
Page 2 Deutsche Bank Securities Inc.
Deu
tsche B
ank S
ecurities In
c.Pag
e 3
DB Related Research—DecemberLatin America: Carrefour Brasil Initiation, JBS Reinstatement
■ Lojas Americanas - Slower SSS through 2019 - lowering TP to R$16 - Marcel Moraes - 3 Jan 2018
■ B2W - Updating estimates as marketplace offsets competitive pressure - Marcel Moraes - 21 Dec 2017
■ Falabella - Incorporating the shifting macro trends into estimates - maintain Hold - Marcel Moraes - 20 Dec 2017
■ Carrefour Brasil - Cashing in on C&C channel growth - Initiate at Buy - Marcel Moraes - 17 Dec 2017
■ CBD-GPA - Updating estimates on 2018E food inflation- Marcel Moraes - 14 Dec 2017
■ JBS - Earnings momentum taking a back seat to corporate woes (reinstating w/Hold) - Jose Yordan - 13 Dec 2017
■ FEMSA/KOF - Trimming estimates/targets (maintain Hold on KOF and Buy on FMX) - Jose Yordan - 13 Dec 2017
■ Gruma - Remains attractive on valuation and potential boost from US tax reform- Jose Yordan - Dec 01, 2017
21
Janu
ary 201
8
Beverag
es
Latam C
on
sum
er Mo
nth
ly

Pag
e 4D
eutsch
e Ban
k Secu
rities Inc.
Global: Update on Russian Food Retailers & ICBP beverage buyout
■ Indofood CBP - Beverage buy-out: ICBP takes over - Raja Abdalla - Dec 27, 2017
■ Jubilant Foodworks - Extension of 'everyday value' to Rs99 price point; another positive - Manoj Menon - Dec 19, 2017
■ Indofood - An entrance opportunity - Raja Abdalla - Dec 15, 2017
■ Unilever Indonesia - Revving up the engine - Raja Abdalla - Dec 13, 2017
■ United Spirits Alert - Price hikes could potentially boost sentiment - Manoj Menon - Dec 11, 2017
■ Meiji Holdings - Hints of the new mid-term plan - Joseph Cairnes - Dec 07, 2017
■ Fonterra Alert - Weak 1Q update, investor day wrap - Adrian Allbon - Dec 07, 2017
■ Russian Food Retailers - Getting tougher - Tomasz Krukowski - Dec 06, 2017
■ Retail Alert - Amazon is on - better late than never - Michael Simotas - Dec 05, 2017
■ Tiger Brands - Feedback from our management lunches - Caron Bramwell - Dec 04, 2017
21
Janu
ary 201
8
Beverag
es
Latam C
on
sum
er Mo
nth
ly

Deu
tsche B
ank S
ecurities In
c.Pag
e 5
DB LatAm Consumer Coverage SummariesFigure 1: Summary Views - DB-Covered LatAm Food/Beverage/HPC Stocks
Buy-Rated
Company Price Target Positives Concerns Catalysts
KCM 41.00 * Defensive/highly cash generative with long-standing dividend growth * Low disclosure/transparency * Pulp price/other raw material news flow; quarterly earnings
(Buy) (MXN/share) * Diversified product portfolio serving all socioeconomic levels * Negative impact from MXN weakness could reignite in the event * Strong MXN
* Margins should rebound from lower input costs, stronger MXN political uncertainty resurfaces
Minerva 24.25 * Sole "pure play" Brazilian beef packer; best positioned to * FX and cattle price volatility; falling local beef demand * Pace of de-leveraging and/or FCF generation
(Buy) (BRL/share) benefit from Brazil's current leadership of global export trade * Relatively limited geographic and protein diversification * Additional FX weakness helps export margins (2/3 of revenues)
* Best-in-class management; low-cost producer w/ stable margins * Sharply lower cattle costs in BR
CC Andina 32.00 * Strong market share/FCF (high dividends once de-leveraging over) * Volume impact of weak economies in Chile, Argentina and Brazil * More M&A news
(Buy) (USD/ADS) * Strong management team * Continuing operating challenges and FX in Argentina * Speed and magnitude of synergies from logistics projects in Chile
* Margins turning around after years of declines * Volatility in sugar prices globally
Grupo Bimbo 58.00 * Strong market position/FCF in Mexico * Overhang from potential (although now dormant) equity issuance * Synergies from Sara Lee/ Canada Bread acquisitions
(Buy) (MXN/share) * Improving returns in US as Sara Lee deal synergies show in full * Future use of free cash (dividends or more M&A?) * FX/wheat prices
* Deleveraging story/eventually high dividend growth * Ability to sustain/extend recent margin gains if grains go higher
Gruma 332.00 * Margin accretion should resume in 2018 after pause in 2017 * Ability to sustain/extend recent margin gains if grains go higher '* Use of free cash after de-leveraging process over
(Buy) (MXN/share) * Cost cutting initiatives should add to impact of lower grain costs
* New generation of control family managing for profits, not sales growth
FEMSA 109.00 * Strong competitive advantage in KOF, Oxxo * Future use of free cash flow * Potential sale of Heineken stake (and capital deployment thereafter)
(Buy) (USD/ADS) * Balance sheet, FCF generation remain strong * Current weakness in Mexico fuel unit margins * Initiation of share buyback program, dividend hike would be positive
* New revenue streams from Mexico gas stations, Chile pharma/C-stores * Rising labor costs in Oxxo unit * OXXO results/margins, pace of expansion
Concha y Toro 48.00 * Benefits from weak CLP as exports are over 2/3 of revenues * Old World producers still taking market share from New World * Gross margin recovery on the back of CLP weakness
(Buy) (USD/ADS) * EV/EBITDA & PE valuations at 10-year lows * Timing and magnitude of export volume recovery remains uncertain * Australia production decline could mean pricing power
* New real estate initiative to monetize non-planted land * High cost of grapes after another weak harvest
Hold Rated
Company Price Target Positives Concerns Catalysts
AmBev 6.15 * Best-in-class management/Low-cost producer * Raw materials volatility; Argentina FX; potential IOC elimination * Quarterly earnings
(Hold) (USD/ADS) * Substantial free cash generation; high dividend yield * Uncertainty about magnitude of volume growth in 2017/ 2018 * Market share evolution
* Growing Caribbean business on the back of vulnerable Brazilian economy * Resumption of share buybacks
CCU 25.00 * Efficiency initiatives implemented in 2014 still paying off * High labor costs in Chile/ Argentina * Chile beer volumes/pricing, degree of margin turnaround
(Hold) (USD/ADS) * Strong and conservative management team * Chile beer competition especially after Bud license expiration in '15 * Success in Colombia market investments
* Soft drink business momentum * Entering Colombia at an uncertain economic time
Coke FEMSA 72.50 * Strong market share/FCF generation * Political/energy crisis in Venezuela could generate large losses * Resolution of Venezuela uncertainty
(Hold) (USD/ADS) * Brazil turnaround likely in 2018 * Potential sugar tax in Philippines * Positive outcome in Philippines tax legislation
* Strong management team * Concentrate price increase in 2017 (in Mexico)
BRF - Brasil Foods 15.50 * Scale: largest poultry processor in the world * BRL strength could put a cap on potential margin enhancement * Quarterly earnings versus consensus
(Hold) (USD/ADS) * Input cost outlook turning benign after 2016 corn shortage in Brazil * Potential changes in IOC mechanism/ tax deductibility * News flow on M&A and/or global trade barriers
* Strategy change from production to consumer orientation * Recent management turnover
JBS SA 11.50 * Largest fully diversified protein company in the world * Size of hedge positions (if any) * News on various investigations in BR, corporate restructuring
(Hold) (BRL/share) * Improving earnings should traslate into substantial deleveraging * LT profitability of Pilgrim's Pride is predicated on industry discipline * Execution of intended IPO of JBSFI subsidiary
* Overhang of ongoing government investigation into controllers * Speed of deleveraging process/FCF generation
Arca Continental 140.00 * Strong market share/FCF (paid as dividends) * Entry into US market came at a high price * Volume/sales turnaround (in quarterly results)
(Hold) (MXN/share) * Synergies from recent acquisitions * Progress of various M&A synergies
* Respected management/Leading-edge technology
Natura 26.50 * More favorable top-line growth in Brazil (macro+revenue initiatives) * Execution risks associated with the turnaround of TBS * More favorable sales and margin dynamics in Brazil
(Hold) (BRL/share) * Accelerated growth and rising profitability on international operations * More competition from existing (e.g. O Boticário) and new players
* Diversifying sales mix into online and retail channels * Financial leverage weighing on cash flow generation, dividend yield
Note: For additional information on all stocks mentioned here please refer to our website at: http://gm.db.com
Source: Deutsche Bank
21
Janu
ary 201
8
Beverag
es
Latam C
on
sum
er Mo
nth
ly

Pag
e 6D
eutsch
e Ban
k Secu
rities Inc.
Figure 2: Summary Views—DB-Covered LatAm Retail Stocks
Buy-Rated
Company Price Target Positives Concerns Catalysts
Carrefour Brasil 20.50 * Sound exposure to fastest-growing/high ROIC channel * Intensified competition with CBD * Normalized food prices and growth plan may offer upside to top-line(Buy) (R$/share) * Large scale, spread platform offering sound bargaining power * Not good track record from running supermarkets in Brazil * Attractive growth-adjusted valuation
* Lower-priced stores create resilient business model * Good bargaining power for M&A; complementary assetsLiverpool 187.50 * Dominant position in the growing d-store market in Mexico * Amazon entry into Mexico * Same-store-sales evolution(Buy) (MXN/share) * Conservative/experienced management; ROIC above cost of capital * Efforts to be less aggressive in credit terms could lead to * Pace of expansion in consumer credit
* Poised to benefit from MXN recovery and Suburbia acquisition diminishing SSS growth trend * Higher stock liquidity (especially if from more secondary sales)Almacenes Exito 23,400 * Market leader, strong brand, clear strategy, excellent management * Corporate governance * More/faster realization of synergies from CBD acquisition(Buy) (COP/share) * Faster monetization of real estate assets via new JV structure * Competition in Colombian retail sector * Improvements in operating performance at CBD and Group Casino
* High margin express/high-end stores and complementary businesses * Sovereign downgrade risk * Increased liquidity (over $5 million / day)CBD 107.00 * Continued move into higher-return cash and carry format * Fragile economic recovery threatening sales and margins * Improved outlook for 2018 triggering more favorable sales/margin(Buy) (R$/share) * SSS acceleration and strong financial discipline allowing margin gain * Intensified competition with Carrefour * Normalized food prices in 2H18 accelerating SSS
* More favorable consumer spending and lowering interest rates * Intercompany transactions potentially conflicting minority/controlling shldr * Potential sale of Via Varejo fueling faster roll-out of stores
Hold-Rated
Company Price Target Positives Concerns Catalysts
Arezzo 32.00 * Leading player in the fragmented fashionable footwear market * Growth is excessively dependent on new brands/projects *High expectation with regards to new brands(Hold) (BRL/share) * Asset-light; Highly profitable business, high dividend yield * Volatile economic environment threatens sales to multi-brand retailers *Valuation trading above historical averages
* Sound execution and brand building skills * Rising SG&A threatening margin expansionB2W 16.50 * Compelling LT growth prospects for e-commerce/marketplace * Competition with Amazon and Mercado Libre intensifying * Increased marketplace potentially improving economics(Hold) (BRL/share) * Best in class technological/distribution platform * Continued CF drain due to competition * Lower CAPEX; a relief to cash flow
* Most recognized brands; Superior shopping experience/service level * Intensified competition preventing accelerated margin gainCencosud 2,000 * Well-diversifed asset base, highly exposed to resilient food retail * High financial leverage * Sustainable turnaround in profitability(Hold) (CLP/share) * Restructuring leading to increased sales productivity and profitability * Fragile competitive positioning in Brazil and some other markets * Successful spinoff/private placement of real estate assets
* Potential IPO of the mall business; cash and new projects * Complex business model, low-return assetsChedraui 40.00 * Clear low price strategy, friendly layout, remodel efforts, strong brand * Slower-than-expected economic recovery in Mexico * Return to growth in top line above most peers(Hold) (MXN/share) * Investments in IT/ distribution improving working capital management * Disruptions in plan to accelerate organic growth * M&A activity (could be positive or negative depending on valuation)
* Labor issues in the US potentially impacting SSSFalabella 7,000 * Experienced management, sound execution skills * Complex business model, low-return assets * Improved inventory management leading to gross margin gains(Hold) (CLP/share) * Diversified and highly exposed to healthier LatAm markets * Decelerating economies threatening sales and margins * Continued fixed cost dilution in core Chilean market
* Leading competitive positioning, strong brands, improving ROIC * Stock trades at premium valuation to peersHering 23.00 * Gradual improvements to brand mgmt and shopping experience * Execution risks for new projects/store concepts (pricing, assortment) * Gradual return to SSS growth(Hold) (BRL/share) * High dividend yield (4-6%) * Potential need for redistributing profitability through supply chain
* High return/cash flow from asset-light vertically integrated model * Weak sales threatening operating marginsLojas Americanas 16.00 * Flexible portfolio and defensive product mix protecting sales' growth * Exposure to cash demanding e-commerce business *New food/beverage business model offering new growth avenue(Hold) (BRL/share) * Cost oriented financial discipline allowing for competitive prices * Relevant deceleration in SSS and margins threatening expectations * Diminishing return obtained from new stores
* Sound LT growth opportunities through highly accepted store concept * B&M currently trading at an extremely high valuation * Actively looking for acquisitions, unpredictable changes to bus. modelSoriana 44.00 * Cost cutting, inventory management leading to better margins * Low returns and share liquidity levels * Higher-than-expected comp sales (Hold) (MXN/share) * Reduction of the company’s leverage * Lower than average organic growth * Any significant increase in share liquidity
* Remodeling effort leading to stronger SSS growth Lojas Renner 34.00 * Well-recognized brand, widespread platform, reduced fashion risk * Fragile economic recovery risking SSS growth and margins * Highly competitive stores leading to market share gains(Hold) (BRL/share) * Mature internal processes / corporate structure * Gross margins may not reach high expectations; Push-pull distribution * New financial institution boosting results from credit business
* Sound planning and execution by management * Business model execution: brand building,new formats, supply chain * Tight financial discipline protecting marginsWalmex 47.20 * Strong margins/ ROIC * High valuation vs. growth, ROIC * Faster-than-expected sustained SSS growth(Hold) (MXN/share) * Sound channel exposure; Leadership in discount supermarkets * Low pace of store growth
* Continued growth and synergies coming from Central America * Store saturation and increased competition from peers
Note: For additional information on all stocks mentioned here please refer to our website at: http://gm.db.com
Source: Deutsche Bank
21
Janu
ary 201
8
Beverag
es
Latam C
on
sum
er Mo
nth
ly

Deu
tsche B
ank S
ecurities In
c.Pag
e 7
Figure 3: DB-Covered LatAm Consumer Valuation Summary
16-Jan-18 Listing Share
Potential
Return EV Market Cap
Ticker Rating Crncy Price 12M TP (%) (US$ M) (US$ M) 17E 18E 17E 18E 17E 18E 17E 18E 17E 18E 17E 18E 17E 18E 17E 18E
FOOD
Grupo Bimbo BIMBOA.MX Buy MXN 44.40 58.00 31.8 14,963 11,078 14.4 11.4 9.6 7.9 1.0 1.0 27.5 20.0 0.8 0.7 3.2 2.8 8.9 5.5 0.7 1.2
Brasil Foods BRFS.N Hold USD 12.28 15.50 27.5 14,139 9,811 14.6 10.8 9.5 7.7 1.3 1.2 28.3 15.2 0.9 0.9 2.5 2.3 4.4 6.0 0.4 1.2
Gruma GRUMAB.MX Buy MXN 245.94 332.00 36.8 6,372 5,646 13.0 11.4 10.6 9.4 1.7 1.5 18.0 15.6 1.5 1.4 4.2 2.7 1.0 4.3 1.3 1.8
JBS SA JBSS3.SA Hold BRL 9.70 11.50 20.8 22,345 8,114 7.8 6.8 5.2 4.7 0.4 0.4 5.4 5.6 0.1 0.1 0.9 0.8 21.9 31.5 0.4 2.2
Minerva BEEF3.SA Buy BRL 10.28 24.25 136.6 2,305 719 7.2 5.7 6.5 5.2 0.7 0.5 20.7 33.5 0.2 0.2 6.4 5.6 NM 10.4 1.6 0.7
Total/Average 35,368 12.6 10.1 8.7 7.3 1.1 1.0 21.0 14.9 0.8 0.7 2.7 2.2 9.4 11.5 0.7 1.5
BEVERAGES
Ambev ABEV.N Hold USD 6.75 6.15 (4.4) 99,793 106,053 20.1 17.0 16.5 14.1 6.9 6.4 29.3 24.7 6.9 6.3 8.1 8.3 3.3 5.1 3.9 4.5
Andina AKOb.N Buy USD 29.70 32.00 10.4 5,105 4,686 13.1 11.4 9.1 7.9 1.6 1.5 24.8 20.9 1.4 1.3 3.2 3.0 3.7 5.6 2.5 2.6
Arca Continental AC.MX Hold MXN 136.81 140.00 4.0 19,177 12,804 18.3 14.9 13.6 11.3 2.5 2.2 20.5 21.1 1.7 1.4 2.6 2.6 0.8 4.2 1.7 1.7
CCU CCU.N Hold USD 28.57 25.00 (10.5) 5,371 5,278 14.1 12.5 10.1 9.3 1.9 1.8 25.1 21.7 1.9 1.8 2.7 2.6 1.7 0.5 2.1 2.0
Coke Femsa KOF.N Hold USD 72.91 72.50 2.2 18,720 15,317 13.7 12.2 8.7 8.0 1.7 1.6 20.1 18.9 1.3 1.2 2.3 2.1 8.0 8.0 2.6 2.8
Concha y Toro VCO.N Buy USD 40.80 48.00 19.5 1,851 1,524 20.0 15.1 14.2 11.4 1.8 1.7 21.8 18.1 1.4 1.4 1.7 1.5 NM 3.6 2.1 1.8
Femsa FMX.N Buy USD 97.50 109.00 13.5 34,778 34,888 16.2 14.1 10.6 9.5 1.4 1.2 31.2 23.9 1.4 1.3 2.6 2.5 8.0 4.3 1.3 1.7
Total/Average 180,550 18.3 15.6 14.1 12.2 4.8 4.4 28.0 23.5 4.6 4.2 5.8 5.9 4.4 5.0 3.0 3.5
RETAIL
Arezzo & Co. ARZZ3.SA Hold BRL 59.20 32.00 (42.2) 1,311 1,627 22.7 19.5 19.9 17.3 3.1 2.8 29.9 26.8 3.2 2.9 6.5 7.6 2.8 2.4 3.4 3.7
B2W BTOW3.SA Hold BRL 18.96 16.50 (13.0) 3,163 2,702 34.3 18.2 16.0 11.4 1.4 1.4 NM NM 1.1 1.1 2.2 2.3 NM NM 0.0 0.0
Carrefour Brasil CRFB3.SA Buy BRL 14.51 20.50 42.5 9,057 8,893 9.3 9.4 7.7 7.6 0.6 0.5 20.0 18.7 0.6 0.6 2.5 2.3 5.7 2.9 0.0 1.2
CBD PCAR4.SA Buy BRL 75.00 107.00 43.6 5,010 6,156 10.0 9.7 6.6 6.3 0.4 0.3 34.0 27.3 0.4 0.4 2.5 2.3 6.1 7.6 0.3 0.9
Cencosud CEN.SN Hold CLP 1885 2000 7.5 12,785 8,842 11.7 11.0 8.8 8.2 0.7 0.6 18.1 17.4 0.5 0.4 1.2 1.2 6.3 10.5 1.7 1.4
Chedraui CHDRAUIB.MX Hold MXN 40.77 40.00 (1.2) 1,773 2,085 7.6 6.1 5.5 4.5 0.4 0.3 17.8 15.6 0.4 0.4 1.2 1.1 6.0 4.2 0.0 0.7
Cia Hering HGTX3.SA Hold BRL 24.43 23.00 (1.7) 1,356 1,219 21.7 18.4 16.7 14.4 2.7 2.5 17.4 16.9 2.8 2.6 3.6 3.3 1.1 3.3 4.8 4.1
Exito IMI.CN Buy COP 16820.0 23400.0 40.4 8,995 2,623 12.1 11.2 8.1 7.5 0.4 0.4 33.8 20.9 0.1 0.1 0.8 0.8 22.7 27.6 1.0 1.2
Falabella FAL.SN Hold CLP 6,299 7,000 12.5 21,213 25,306 21.2 19.5 16.2 15.1 2.2 2.1 29.6 26.4 1.7 1.6 3.4 3.1 1.0 1.3 2.3 1.4
Liverpool LIVEPOLC1.MX Buy MXN 131.19 187.50 43.8 9,506 9,341 11.5 9.8 9.6 8.2 1.5 1.3 18.2 14.1 1.4 1.3 2.0 1.8 1.2 2.7 0.6 0.9
Lojas Americanas LAME4.SA Hold BRL 15.60 16.00 2.7 12,333 7,708 19.7 16.2 14.5 12.2 2.3 2.1 146.0 43.1 1.6 1.5 12.7 10.4 2.5 3.1 0.4 0.2
Lojas Renner LREN3.SA Hold BRL 36.32 34.00 (5.1) 8,047 7,991 21.2 17.5 16.8 14.1 3.5 3.0 32.7 27.3 3.3 2.9 8.0 6.8 1.0 1.5 1.0 1.3
Soriana SORIANAB.MX Hold MXN 40.34 44.00 10.3 4,746 3,852 9.7 8.4 7.1 6.3 0.6 0.5 15.9 13.8 0.5 0.4 1.2 1.2 6.8 7.8 0.0 1.3
Wal-Mart de Mexico WALMEX.MX Hold MXN 46.90 47.20 5.1 41,931 43,443 17.8 16.0 14.1 12.8 1.4 1.3 24.8 22.6 1.4 1.3 5.2 5.2 2.4 4.1 5.4 4.5
Total/Average 132,359 16.9 14.9 12.9 11.6 1.5 1.4 32.5 23.4 1.4 1.3 4.3 4.0 3.2 4.3 2.6 2.3
COSMETICS, HPC
Natura NATU3.SA Hold BRL 33.01 26.50 (16.7) 4,482 4,404 13.1 11.4 10.2 9.0 1.8 1.6 29.5 23.5 1.5 1.4 9.5 7.9 6.7 7.1 1.8 3.0
KCM KIMBERA.MX Buy MXN 35.48 41.00 20.4 6,225 5,801 16.2 14.0 13.2 11.7 3.1 2.9 24.6 20.8 2.7 2.5 15.7 16.5 2.5 4.5 4.7 4.9
Total/Average 10,205 14.8 12.9 11.9 10.5 2.5 2.3 26.7 22.0 2.2 2.0 13.0 12.8 4.3 5.6 3.4 4.0
FCF Yield
(%)
Div. Yield
(%)EV/EBIT EV/EBITDA EV/Sales P/E P/Sales P/BV
Note: For additional information on all stocks mentioned here please refer to our website at: http://gm.db.com
Source: Deutsche Bank estimates
21
Janu
ary 201
8
Beverag
es
Latam C
on
sum
er Mo
nth
ly

Pag
e 8D
eutsch
e Ban
k Secu
rities Inc.
Figure 4: DB-Covered LatAm Consumer Share Price Performance Summary
31-Dec-17
Ticker Share Price High Low 1M 3M 6M 9M 12M YTD 1M 3M 6M 9M 12M YTD Rel. Index
FOOD
Bimbo BIMBOA.MX MXN 43.51 48.51 42.19 -4.9% -8.3% -12.1% -10.3% -2.5% -2.5% -4.1% 0.9% -3.3% -8.0% -16.4% -16.4% IPC
Brasil Foods BRFS.N USD 11.26 15.26 10.79 -4.8% -21.9% -4.5% -8.1% -23.7% -23.7% -8.7% -20.0% -25.8% -20.4% -48.3% -48.3% Bovespa
Gruma GRUMAB.MX MXN 249.30 286.38 227.25 0.2% -13.2% -3.0% -9.1% -0.2% -0.2% 1.0% -4.1% 5.8% -6.8% -14.1% -14.1% IPC
JBS SA JBSS3.SA BRL 9.81 12.50 5.98 18.6% 10.1% 50.1% -8.2% -15.5% -15.5% 14.7% 12.0% 28.7% -20.5% -40.1% -40.1% Bovespa
Marfrig MRFG3.SA BRL 7.32 7.90 5.36 4.5% 8.0% 8.2% 22.4% 8.8% 8.8% 0.7% 9.8% -13.2% 10.1% -15.8% -15.8% Bovespa
Minerva BEEF3.SA BRL 10.65 12.97 9.34 -4.9% -9.3% -13.6% 4.2% -13.9% -13.9% -8.8% -7.4% -34.9% -8.1% -38.5% -38.5% Bovespa
Average 1.5% -5.8% 4.2% -1.5% -7.8% -7.8% -0.9% -1.5% -7.1% -8.9% -28.9% -28.9%
BEVERAGES
AmBev ABEV.N USD 6.46 6.98 5.06 3.9% -2.0% 17.7% 12.2% 31.6% 31.6% 0.0% -0.1% -3.7% -0.1% 7.0% 7.0% Bovespa
Andina AKOb.N USD 30.00 30.56 21.50 15.2% 8.9% 18.1% 28.3% 33.5% 33.5% -1.2% 0.6% -8.4% 3.1% -11.8% -11.8% IPSA
Arca Continental AC.MX MXN 135.93 141.37 103.54 2.2% 1.2% -8.2% 0.4% 32.5% 32.5% 3.0% 10.4% 0.6% 2.7% 18.6% 18.6% IPC
CCU CCU.N USD 29.58 29.58 20.50 17.2% 9.8% 12.7% 17.1% 41.0% 41.0% 0.8% 1.5% -13.8% -8.1% -4.3% -4.3% IPSA
Concha y Toro VCO.N USD 36.45 37.56 30.94 7.8% 10.0% 17.6% 7.2% 12.5% 12.5% -8.6% 1.7% -9.0% -17.9% -32.8% -32.8% IPSA
Femsa FMX.N USD 93.90 103.31 74.19 1.3% -1.7% -4.5% 6.1% 23.2% 23.2% 2.2% 7.4% 4.3% 8.4% 9.3% 9.3% IPC
KOF KOF.N USD 69.62 90.90 59.91 1.8% -9.7% -17.8% -2.9% 9.6% 9.6% 2.7% -0.6% -9.0% -0.6% -4.4% -4.4% IPC
Average 7.0% 2.4% 5.1% 9.7% 26.3% 26.3% -0.2% 3.0% -5.6% -1.8% -2.6% -2.6%
RETAIL
Arezzo & Co. ARZZ3.SA BRL 54.70 55.00 25.05 13.2% 4.4% 67.0% 66.5% 114.4% 114.4% 9.3% 6.3% 45.7% 54.2% 89.8% 89.8% Bovespa
B2W BTOW3.SA BRL 20.50 25.67 10.20 19.3% -7.5% 75.0% 58.5% 97.4% 97.4% 15.4% -5.6% 53.7% 46.2% 72.8% 72.8% Bovespa
CBD PCAR4.SA BRL 78.93 80.85 54.30 9.3% 0.4% 21.0% 25.4% 41.6% 41.6% 5.4% 2.3% -0.3% 13.1% 17.0% 17.0% Bovespa
Cencosud CEN.SN CLP 1810 2080 1569 17.3% -3.9% 10.6% -3.7% 4.4% 4.4% 0.9% -12.2% -16.0% -28.8% -40.9% -40.9% IPSA
Chedraui CHDRAUIB.MX MXN 36.08 41.39 35.39 -4.8% -8.0% -10.5% -14.0% 2.4% 2.4% -4.0% 1.1% -1.7% -11.7% -11.5% -11.5% IPC
Cia Hering HGTX3.SA BRL 25.62 32.00 15.08 -3.2% -14.1% 29.6% 36.1% 66.4% 66.4% -7.1% -12.2% 8.2% 23.9% 41.8% 41.8% Bovespa
Exito IMI.CN COP 16560.00 16640.00 14620.00 1.3% 5.4% 10.5% 4.8% 11.7% 11.7% -5.1% 3.6% 2.6% -4.8% -2.4% -6.9% IGBC
Falabella FAL.SN CLP 6,145 6,411 5,206 17.5% 2.6% 21.6% 20.0% 25.3% 25.3% 1.1% -5.7% -4.9% -5.1% -20.1% -20.1% IPSA
Liverpool LIVEPOLC1.MX MXN 124.30 168.59 115.59 -5.0% -21.6% -20.0% -18.3% -12.4% -12.4% -4.2% -12.5% -11.2% -16.0% -26.4% -26.4% IPC
Lojas Americanas LAME4.SA BRL 17.05 20.35 13.25 10.9% -15.5% 21.7% -0.5% -1.5% -1.5% 7.0% -13.6% 0.3% -12.8% -26.1% -26.1% Bovespa
Lojas Renner LREN3.SA BRL 35.49 37.60 22.90 2.4% -6.1% 29.5% 21.9% 50.4% 50.4% -1.4% -4.2% 8.1% 9.6% 25.8% 25.8% Bovespa
Soriana SORIANAB.MX MXN 39.88 46.00 39.44 -6.6% -12.0% -13.1% -13.0% -6.6% -6.6% -5.8% -2.9% -4.3% -10.6% -20.5% -20.5% IPC
Wal-Mart de Mexico WALMEX.MX MXN 48.19 48.19 34.89 3.9% 7.1% 5.4% 7.2% 37.0% 37.0% 4.8% 16.3% 14.2% 9.6% 23.1% 23.1% IPC
Average 5.8% -5.3% 19.1% 14.7% 33.1% 33.1% 1.3% -3.0% 7.3% 5.1% 9.4% 9.1%
COSMETICS, HPC
Natura NATU3.SA BRL 33.06 35.45 22.47 10.4% 1.1% 28.5% 8.8% 41.0% 41.0% 6.5% 3.0% 7.2% -3.4% 16.5% 16.5% Bovespa
KCM KIMBERA.MX MXN 34.65 40.99 32.47 -0.9% -13.3% -16.9% -18.1% -2.2% -2.2% 0.0% -4.2% -8.1% -15.7% -16.2% -16.2% IPC
Average 4.7% -6.1% 5.8% -4.6% 19.4% 19.4% 3.2% -0.6% -0.5% -9.6% 0.2% 0.2%
52-Week Absolute Share Price Performance (% change) Relative Share Price Performance (% change)
Listing Crncy
Note: For additional information on all stocks mentioned here please refer to our website at: http://gm.db.com
Source: Deutsche Bank estimates & Bloomberg Finance LP.
21
Janu
ary 201
8
Beverag
es
Latam C
on
sum
er Mo
nth
ly

21 January 2018
Beverages
Latam Consumer Monthly
Updated Total ReturnAnalysis
2017 Recap
In 2017, almost 80% of our covered stocks showed positive returns while only39% managed to outperform their respective MSCI country index. As we notedthroughout the year, there was a wide divergence between discretionary retailersand staples stocks: 2017 was an exceptional year for Brazilian discretionaryretailers, which (with the exception of Lojas Americanas) posted very high positivereturns in USD terms and outperformed the Brazil MSCI Index by at least 50%driven by an incipient economic recovery, sharp drop in inflation, monetaryeasing and a falling unemployment rate. But many blue-chip staples stocks alsoperformed well (albeit to a lesser extent), as illustrated in Figures 5-6 below. On theother hand, most Brazilian meat producers/packers had another bad year, miredby ongoing government investigations, high leverage and management turnover.But the biggest negative surprise was Liverpool, which bore the brunt of investors'fears (exaggerated, in our view) regarding Amazon's expansion.
Figure 5: Absolute 1-year Total Return (%, in USD terms) Figure 6: Relative 1-year Total Return (versus homecountry MSCI index, in USD terms)
-40 -30 -20 -10 0 10 20 30 40 50 60 70 80 90 100 110 120
BRF
Liverpool
JBS
Minerva
Soriana
Bimbo
Gruma
KCM
Chedraui
Lojas Americanas
Cencosud
Marfrig
KOF
Exito
Concha y Toro
FMX
Falabella
Arca
Ambev
Andina
Walmex
CBD
Natura
CCU
Lojas Renner
Hering
B2W
Arezzo
-50 -40 -30 -20 -10 0 10 20 30 40 50 60 70 80 90 100
BRF
Cencosud
JBS
Liverpool
Minerva
Concha y Toro
Soriana
Bimbo
KCM
Lojas Americanas
Falabella
Gruma
Chedraui
Marfrig
Andina
KOF
Exito
CCU
FMX
Ambev
Arca
Walmex
Natura
CBD
Lojas Renner
Hering
B2W
Arezzo
Source: Factset Source: Factset
For the five-year period ending 2017, Gruma again topped the list with averagereturns of 44%, while Exito delivered the worst average dollar returns (-13%).Arca and Minerva dropped out of the Top 5 while Lojas Renner held on to its #2position, now closely followed by Arezzo and B2W. On a relative basis, roughlyhalf of our covered stocks showed local market outperformance (versus over twothirds for the five-year period ended 2016).
Deutsche Bank Securities Inc. Page 9

21 January 2018
Beverages
Latam Consumer Monthly
Figure 7: Absolute 5-year Total Return (average annual%, in USD terms)
Figure 8: Relative 5-year Total Return (average annual %versus home country MSCI index, in USD terms)
-20 -10 0 10 20 30 40 50
Exito
Soriana
KOF
Minerva
Chedraui
Natura
BRF
Cencosud
Liverpool
Marfrig
Hering
Lojas Americanas
KCM
Bimbo
Walmex
Ambev
FMX
Arca
Andina
Concha y Toro
Falabella
CBD
JBS
CCU
B2W
Arezzo
Lojas Renner
Gruma
-20 -10 0 10 20 30 40 50
Natura
Minerva
BRF
Hering
KOF
Cencosud
Soriana
Exito
Chedraui
Marfrig
Ambev
Lojas Americanas
KCM
Liverpool
Andina
Concha y Toro
Falabella
JBS
Walmex
CBD
Bimbo
CCU
FMX
Arca
B2W
Arezzo
Lojas Renner
Gruma
Source:Factset Source:Factset
Over a 10-year period (a slightly smaller sample, as two of our covered stocks donot yet have a 10-year record), Hering, Gruma and Lojas Renner remained in thefirst 3 spots while Lojas Americanas was replaced by Minerva at #4 and slid tothe #5 position. It is worth highlighting that Hering is still on top only as a result ofits explosive growth in 2007-2010; so given its current position near the bottomof the 5-year average returns list, its lead in the 10-year standings may slip.
Figure 9: 10-year Total Return (average annual %, inUSD terms)
Figure 10: Relative 10-year Total Return (average annual% versus home country MSCI index, in USD terms)
0 10 20 30 40 50 60
Soriana
Concha y Toro
BRF
Bimbo
JBS
Walmex
Marfrig
Liverpool
KCM
KOF
Exito
B2W
Andina
FMX
CCU
Cencosud
Natura
Arca
Falabella
CBD
Ambev
Lojas Americanas
Minerva
Lojas Renner
Gruma
Hering
-10 0 10 20 30 40 50
Concha y Toro
Soriana
Exito
BRF
KCM
JBS
Andina
Bimbo
Marfrig
KOF
CCU
Walmex
Liverpool
Cencosud
B2W
Natura
FMX
Falabella
Ambev
Arca
CBD
Lojas Americanas
Minerva
Lojas Renner
Gruma
Hering
Source: Factset Source: Factset
Page 10 Deutsche Bank Securities Inc.

21 January 2018
Beverages
Latam Consumer Monthly
Given the FX weakness of the past 10 years, it should be comforting to long-terminvestors that the majority of our Latam Consumer coverage universe (includingall that have a 10-year record) showed positive dollar returns (and all but twooutperformed their local indices).
Finally, over a 20-year period (a smaller sample, as only 16 of our covered stockshave a 20-year record), Lojas Americanas, Gruma and Falabella remained firm inthe first 3 spots, and all showed positive average returns (56% ourperformed theirlocal indices).
Figure 11: 20-year Total Return (average annual %, inUSD terms)
Figure 12: Relative 20-year Total Return (average annual% versus home country MSCI index, in USD terms)
0 10 20 30 40 50 60
Soriana
KCM
Andina
KOF
Concha y Toro
Bimbo
CCU
Liverpool
Walmex
Exito
CBD
BRF
Ambev
Falabella
Gruma
Lojas Americanas
-10 0 10 20 30
KCM
Soriana
Exito
Andina
KOF
Bimbo
Concha y Toro
CCU
Liverpool
CBD
Walmex
BRF
Ambev
Falabella
Gruma
Lojas Americanas
Source: Factset & Deutsche Bank Source: Factset & Deutsche Bank
In the rest of this section, we comment on individual stock performance data.
Deutsche Bank Securities Inc. Page 11

21 January 2018
Beverages
Latam Consumer Monthly
(A) Mexican bakers (Bimbo and Gruma) still out of sync
Still with wildly divergent average returns, but given their similarities oneshould expect greater coupling over time (starting in 2018)As shown below, BIMBOA.MX has delivered USD average annual returns of-2%/7% over 5-year and 10-year horizons respectively (with declines in the past4 years), and has beaten the MSCI Mexico index in 8 of the last 11 years.
Figure 13: Bimbo Stock Performance
Stock Performance in US$ (%)
Year Q1 Q2 Q3 Q4 Year
2007 1.1 22.5 -9.6 6.7 19.5 0.7 20.2
2008 0.7 8.7 -4.1 -32.7 -29.3 0.8 -28.6
2009 -11.4 42.4 4.6 19.3 57.4 0.6 58.0
2010 33.1 -19.1 3.2 16.1 28.9 0.5 29.5
2011 -1.6 10.0 -17.5 6.9 -4.5 0.5 -4.0
2012 14.2 4.7 2.2 3.4 26.3 0.5 26.8
2013 24.2 -5.8 2.6 -0.7 19.1 0.9 20.0
2014 -12.0 8.7 -1.2 -4.8 -10.0 0.0 -10.0
2015 2.8 -8.7 -2.5 5.3 -3.6 0.5 -3.1
2016 12.0 4.1 -14.9 -13.6 -14.2 0.6 -13.6
2017 8.4 1.8 -3.9 -8.2 -2.5 0.7 -1.8
5 yr avg 7.1 0.0 -4.0 -4.4 -2.3 0.5 -1.7
10 yr avg 7.0 4.7 -3.1 -0.9 6.7 0.6 7.3
20 yr avg 5.7 3.4 -1.2 3.0 10.2 0.8 11.0
Dividend
Yield
Total
Return
Source: Factset
Figure 14: Bimbo Relative to Bolsa Index Figure 15: Bimbo Relative to MSCI Mexico
Year Q1 Q2 Q3 Q4 Year
2007 -5.7 11.9 -5.6 9.0 8.7
2008 -6.4 10.2 16.5 -4.0 10.9
2009 2.5 9.5 -12.4 5.7 5.2
2010 23.4 -8.7 -6.8 -1.5 1.9
2011 -2.2 10.8 4.8 -2.8 10.5
2012 -1.9 7.7 -4.0 -2.5 -0.3
2013 18.0 6.8 4.7 -7.6 22.2
2014 -7.1 2.4 -2.9 7.8 0.2
2015 4.8 -8.8 9.9 6.4 11.3
2016 4.4 11.0 -12.8 -4.3 -3.3
2017 -7.9 -5.0 -4.5 0.9 -10.7
5 yr avg 2.5 1.3 -1.1 0.6 4.0
10 yr avg 2.8 3.6 -0.8 -0.2 4.8
20 yr avg 0.0 1.6 1.7 -3.2 -1.4
Year Q1 Q2 Q3 Q4 Year
2007 -4.7 10.5 -4.9 9.9 10.2
2008 -4.3 14.1 15.1 -2.5 14.6
2009 2.6 7.8 -13.0 6.8 4.4
2010 25.4 -9.7 -7.9 -0.2 3.0
2011 -2.1 11.3 2.5 -2.1 8.9
2012 -1.2 6.6 -4.3 -1.9 -0.7
2013 18.3 5.8 4.6 -7.7 21.1
2014 -7.0 2.4 -3.0 7.8 0.2
2015 4.9 -8.5 10.1 6.9 12.3
2016 3.7 11.6 -12.2 -5.2 -3.5
2017 -7.3 -4.3 -5.0 0.4 -16.0
5 yr avg 2.5 1.4 -1.1 0.5 2.8
10 yr avg 3.3 3.7 -1.3 0.2 4.4
20 yr avg 0.3 1.7 1.5 -2.3 -0.6
Source: Factset Source: Factset
Page 12 Deutsche Bank Securities Inc.

21 January 2018
Beverages
Latam Consumer Monthly
But surprisingly (given the similarities with Bimbo in terms of geographical andFX/raw material exposure), Gruma shares have continued to outperform Bimbo’s,although in 2017 only by 3.3 percentage points. The stock’s five- and ten-yearperformance differed substantially as a result of Gruma’s substantial derivativeslosses (over $1 billion) in late 2008, which drove the stock to near collapse. Wenow rate both stocks Buy, and in 2018 we believe both could appreciate by morethan 30% (see Figure 3).
Figure 16: Gruma Stock Performance
Stock Performance in US$ (%)
Year Q1 Q2 Q3 Q4 Year
2007 -13.1 4.9 -2.0 2.5 -8.5 0.0 -8.5
2008 -28.4 16.2 -26.6 -74.9 -84.7 0.0 -84.7
2009 -25.5 182.7 64.4 1.0 249.6 0.0 249.6
2010 28.3 -31.7 -7.3 31.1 6.5 0.0 6.5
2011 11.4 -1.2 -14.9 7.3 0.5 0.0 0.5
2012 41.9 -9.2 16.2 6.5 59.4 0.0 59.4
2013 46.7 2.0 22.8 36.0 150.0 0.0 150.0
2014 9.7 44.6 -10.8 0.0 41.5 1.0 42.5
2015 19.1 1.3 7.6 1.0 31.1 0.7 31.8
2016 14.1 -10.5 -7.9 -3.1 -8.8 0.8 -8.0
2017 9.6 -6.5 12.1 -13.1 -0.2 1.7 1.5
5 yr avg 19.8 6.2 4.8 4.2 42.7 0.8 43.6
10 yr avg 12.7 18.8 5.6 -0.8 44.5 0.4 44.9
20 yr avg 5.3 8.1 3.3 3.5 25.2 1.1 26.4
Dividend
Yield
Total
Return
Source: Factset
Figure 17: Gruma Relative to Bolsa Index Figure 18: Gruma Relative to MSCI Mexico
Year Q1 Q2 Q3 Q4 Year
2007 -20.0 -5.7 2.0 4.8 -19.3
2008 -35.5 17.7 -6.0 -46.2 -44.4
2009 -11.6 149.8 47.5 -12.7 197.4
2010 18.6 -21.3 -17.3 13.6 -20.5
2011 10.8 -0.4 7.4 -2.4 15.5
2012 25.8 -6.2 10.0 0.6 32.8
2013 40.6 14.7 25.0 29.1 153.1
2014 14.7 38.4 -12.5 12.6 51.8
2015 21.0 1.2 20.0 2.1 46.1
2016 6.5 -3.5 -5.9 6.2 2.2
2017 -6.8 -13.4 11.5 -4.1 -8.4
5 yr avg 15.2 7.5 7.6 9.2 49.0
10 yr avg 8.4 17.7 8.0 -0.1 42.6
20 yr avg -0.4 6.4 6.2 -2.7 13.6
Year Q1 Q2 Q3 Q4 Year
2007 -19.0 -7.1 2.7 5.7 -17.8
2008 -33.4 21.6 -7.4 -44.7 -40.7
2009 -11.5 148.1 46.9 -11.5 196.5
2010 20.6 -22.2 -18.5 14.8 -19.5
2011 10.9 0.0 5.1 -1.7 14.0
2012 26.5 -7.3 9.7 1.1 32.4
2013 40.8 13.7 24.9 29.0 152.0
2014 14.8 38.4 -12.6 12.5 51.7
2015 21.2 1.5 20.2 2.7 47.1
2016 5.8 -2.9 -5.2 5.4 2.0
2017 -6.2 -12.7 11.0 -4.5 -13.7
5 yr avg 15.3 7.6 7.6 9.0 47.8
10 yr avg 9.0 17.8 7.4 0.3 42.2
20 yr avg 0.0 6.4 6.0 -1.9 14.5
Source: Factset Source: Factset
Deutsche Bank Securities Inc. Page 13

21 January 2018
Beverages
Latam Consumer Monthly
(B) Brazilian protein producers still performing poorly
All negatively impacted by "Weak Flesh" scandal in 2017, and in a strange turnof events BRF is now the worst-performing over a 10-year periodNext, we turn to the Brazil-based protein producers. Of these, BRF took thebiggest fall, on the back of the "Weak Flesh" investigation and internal strife(that led to a complete change in the top management team). At this time lastyear, it had been the best long-term performer in the group by far, with 10-yearreturns averaging 18% (but with a slightly negative 5-year return). Recall thatBRF as a merged entity only began officially in 2009, but because the mergerwas announced in 2008, Perdigão’s stock began to reflect the impact of theproposed merger in the same year, so the initial period of appreciation (2009)post-announcement is now more than five years in the past. One year later, BRFShas the worst ten-year record in the peer group, although it is still positive (7.3%).
Figure 19: Brasil Foods Stock Performance
Stock Performance in US$ (%)
Year Q1 Q2 Q3 Q4 Year
2007 -3.9 40.5 14.7 14.4 77.1 1.3 78.4
2008 -7.5 18.2 -30.5 -32.4 -48.7 0.6 -48.1
2009 -2.1 53.2 38.5 -1.8 104.1 0.5 104.6
2010 3.1 -2.0 15.6 8.4 26.6 1.1 27.7
2011 15.1 -10.5 2.2 12.6 18.6 2.0 20.5
2012 1.1 -23.7 14.6 19.4 5.5 0.7 6.3
2013 7.3 -0.8 10.6 -13.9 1.3 1.8 3.1
2014 -3.8 20.7 -1.9 0.4 14.3 1.5 15.8
2015 -17.0 6.8 -16.2 -21.0 -41.3 0.4 -40.9
2016 3.4 -2.7 20.9 -12.9 5.9 3.3 9.2
2017 -18.0 -2.7 22.0 -23.6 -25.6 0.4 -25.2
5 yr avg -5.6 4.2 7.1 -14.2 -9.1 1.5 -7.6
10 yr avg -1.8 5.6 7.6 -6.5 6.1 1.2 7.3
20 yr avg -2.0 3.6 9.6 7.9 20.0 1.9 21.8
Dividend
Yield
Total
Return
Source: Factset
Figure 20: Brasil Foods Relative to Bovespa Index Figure 21: Brasil Foods Relative to MSCI Brazil
Year Q1 Q2 Q3 Q4 Year
2007 -11.4 14.3 -1.7 5.2 4.8
2008 -4.7 0.9 6.6 4.9 6.4
2009 -12.5 5.5 7.0 -15.7 -40.3
2010 2.9 12.2 -5.6 6.5 20.5
2011 14.1 -5.2 31.6 4.7 45.7
2012 -15.2 0.1 6.3 17.3 7.7
2013 13.5 22.3 1.2 -6.8 28.0
2014 -6.2 12.7 6.6 15.2 28.2
2015 -2.1 0.0 17.6 -17.8 0.4
2016 -25.5 -16.6 9.2 -15.9 -63.0
2017 -28.6 4.5 -1.7 -21.6 -52.5
5 yr avg -9.8 4.6 6.6 -9.4 -11.8
10 yr avg -6.4 3.7 7.9 -2.9 -1.9
20 yr avg -6.8 3.1 11.9 -3.0 2.2
Year Q1 Q2 Q3 Q4 Year
2007 -9.4 17.6 -5.4 1.7 1.7
2008 -1.9 0.5 7.7 5.8 8.9
2009 -14.0 14.0 11.8 -13.9 -17.2
2010 3.6 14.0 -5.4 5.7 22.8
2011 13.1 -5.2 29.9 5.0 43.4
2012 -12.0 -3.7 10.3 17.2 9.0
2013 8.7 17.5 2.9 -7.7 20.0
2014 -5.8 15.0 7.3 16.0 31.7
2015 -1.5 0.7 17.9 -16.7 2.1
2016 -24.0 -16.0 10.2 -13.9 -55.5
2017 -27.7 4.6 -0.4 -20.8 -42.8
5 yr avg -10.1 4.4 7.6 -8.6 -8.9
10 yr avg -6.1 4.1 9.2 -2.3 2.2
20 yr avg -6.0 3.4 11.3 -1.0 5.7
Source: Factset Source: Factset
Page 14 Deutsche Bank Securities Inc.

21 January 2018
Beverages
Latam Consumer Monthly
Arguably, JBS should have fallen more than BRF, as it was also negativelyimpacted by a corporate governance crisis unleashed by May 2017 revelationsof bribery at the highest levels (of JBS and the Brazilian government); but a well-executed asset divestiture program and a sharp turnaround in profitability in mostoperating units offset the damage from the scandals.
Figure 22: JBS Stock Performance
Stock Performance in US$ (%)
Year Q1 Q2 Q3 Q4 Year
2008 21.3 27.1 -51.7 -14.0 -36.0 0.2 -35.8
2009 7.9 57.3 44.3 3.3 152.9 0.3 153.2
2010 -16.7 -4.8 1.8 0.1 -19.2 0.0 -19.2
2011 -16.6 -4.4 -43.2 66.7 -24.5 0.0 -24.5
2012 26.1 -27.3 10.9 -11.5 -10.1 1.0 -9.1
2013 15.1 -13.2 18.9 6.8 26.9 0.9 27.7
2014 -7.5 0.3 8.3 12.8 13.3 1.5 14.8
2015 5.4 18.5 -19.9 -26.0 -25.9 3.3 -22.6
2016 -1.0 1.0 16.6 -3.7 12.2 0.0 12.2
2017 -8.2 -38.7 36.3 10.1 -15.6 0.4 -15.2
5 yr avg 0.8 -6.4 12.0 0.0 2.2 1.2 3.4
10 yr avg 2.6 1.6 2.2 4.4 7.4 0.7 8.1
Dividend
Yield
Total
Return
Source: Factset
Figure 23: JBS Relative to Bovespa Index Figure 24: JBS Relative to MSCI Index
Year Q1 Q2 Q3 Q4 Year
2008 24.2 9.9 -14.6 23.3 19.2
2009 -2.5 9.6 12.8 -10.6 8.5
2010 -16.9 9.4 -19.4 -1.8 -25.3
2011 -17.6 0.9 -13.8 58.7 2.6
2012 9.9 -3.5 2.6 -13.6 -7.9
2013 21.2 10.0 9.4 13.9 53.5
2014 -9.8 -7.7 16.7 27.6 27.2
2015 20.4 11.8 13.9 -22.8 15.8
2016 -29.9 -12.8 4.9 -6.7 -56.7
2017 -18.8 -31.5 12.6 12.0 -42.5
5 yr avg -3.4 -6.1 11.5 4.8 -0.5
10 yr avg -2.0 -0.4 2.5 8.0 -0.6
Year Q1 Q2 Q3 Q4 Year
2008 27.0 9.5 -13.5 24.3 21.7
2009 -4.0 18.1 17.6 -8.8 31.6
2010 -16.2 11.2 -19.2 -2.5 -23.0
2011 -18.6 0.9 -15.5 59.0 0.3
2012 13.1 -7.4 6.5 -13.8 -6.6
2013 16.4 5.2 11.2 13.0 45.5
2014 -9.5 -5.4 17.5 28.4 30.7
2015 21.0 12.5 14.2 -21.7 17.5
2016 -28.4 -12.3 5.8 -4.7 -49.1
2017 -17.9 -31.4 14.0 12.8 -32.8
5 yr avg -3.7 -6.3 12.5 5.6 2.4
10 yr avg -1.7 0.1 3.9 8.6 3.6
Source: Factset Source: Factset
Deutsche Bank Securities Inc. Page 15

21 January 2018
Beverages
Latam Consumer Monthly
Figure 25: Marfrig Stock Performance
Stock Performance in US$ (%)
Year Q1 Q2 Q3 Q4 Year
2008 19.5 27.4 -30.1 -64.7 -62.5 0.0 -62.5
2009 3.6 122.1 27.8 16.0 241.0 2.6 243.6
2010 3.9 -17.8 8.7 -8.2 -14.9 0.3 -14.6
2011 -3.9 9.9 -66.5 38.6 -51.0 1.3 -49.6
2012 37.7 -26.6 25.7 -28.8 -9.5 0.0 -9.5
2013 1.1 -18.9 -19.9 -37.6 -59.1 0.0 -59.1
2014 14.7 39.0 0.5 -15.6 35.3 0.0 35.3
2015 -44.9 44.9 -1.7 -10.9 -30.1 0.0 -30.1
2016 14.1 -4.2 -8.4 26.4 26.5 0.0 26.5
2017 -11.4 13.4 0.3 7.9 8.7 0.0 8.7
5 yr avg -5.3 14.8 -5.9 -6.0 -3.7 0.0 -3.7
10 yr avg 3.4 18.9 -6.4 -7.7 8.5 0.4 8.9
Dividend
Yield
Total
Return
Source: Factset
Figure 26: Marfrig Relative to Bovespa Index Figure 27: Marfrig Relative to MSCI Brazil
Year Q1 Q2 Q3 Q4 Year
2008 22.3 10.2 7.1 -27.4 -7.3
2009 -6.8 74.4 -3.7 2.0 96.7
2010 3.7 -3.6 -12.6 -10.1 -21.0
2011 -4.9 15.2 -37.1 30.7 -23.8
2012 21.5 -2.7 17.4 -30.9 -7.4
2013 7.2 4.2 -29.4 -30.5 -32.4
2014 12.4 31.0 9.0 -0.8 49.2
2015 -30.0 38.1 32.1 -7.7 11.7
2016 -14.8 -18.1 -20.1 23.4 -42.3
2017 -22.1 20.7 -23.5 9.8 -18.3
5 yr avg -9.5 15.2 -6.4 -1.1 -6.4
10 yr avg -1.1 16.9 -6.1 -4.1 0.5
Year Q1 Q2 Q3 Q4 Year
2008 25.2 9.8 8.1 -26.5 -4.8
2009 -8.3 82.9 1.2 3.8 119.8
2010 4.4 -1.8 -12.4 -10.9 -18.6
2011 -5.9 15.2 -38.8 31.0 -26.1
2012 24.6 -6.6 21.4 -31.0 -6.0
2013 2.4 -0.5 -27.7 -31.4 -40.4
2014 12.8 33.3 9.8 0.0 52.7
2015 -29.4 38.8 32.4 -6.5 13.4
2016 -13.3 -17.5 -19.1 25.4 -34.8
2017 -21.2 20.8 -22.1 10.7 -8.6
5 yr avg -9.7 15.0 -5.4 -0.4 -3.5
10 yr avg -0.9 17.4 -4.7 -3.5 4.6
Source: Factset Source: Factset
Page 16 Deutsche Bank Securities Inc.

21 January 2018
Beverages
Latam Consumer Monthly
Figure 28: Minerva Stock Performance
Stock Performance in US$ (%)
Year Q1 Q2 Q3 Q4 Year
2008 -28.2 20.6 -65.6 -56.9 -87.2 0.0 -87.2
2009 -5.8 121.3 104.4 1.0 330.2 0.0 330.2
2010 27.3 -10.6 5.9 4.3 25.7 0.9 26.6
2011 -5.7 -21.1 -15.1 7.0 -32.4 5.9 -26.5
2012 36.4 8.4 31.9 -0.9 93.2 0.0 93.2
2013 18.3 -27.7 -3.4 7.4 -11.2 0.0 -11.2
2014 -8.2 12.4 4.3 -29.0 -23.6 0.0 -23.6
2015 -38.3 60.7 -9.3 0.3 -9.7 0.0 -9.7
2016 -6.1 -9.4 3.3 26.3 11.0 0.0 11.0
2017 -17.7 20.9 -4.7 -9.3 -14.0 1.6 -12.4
5 yr avg -10.4 11.4 -2.0 -0.8 -9.5 0.3 -9.2
10 yr avg -2.8 17.5 5.2 -5.0 28.2 0.9 29.1
Dividend
Yield
Total
Return
Source: Factset
Figure 29: Minerva Relative to Bovespa Index Figure 30: Minerva Relative to MSCI Brazil
Year Q1 Q2 Q3 Q4 Year
2008 -25.4 3.3 -28.4 -19.6 -32.0
2009 -16.2 73.6 72.9 -13.0 185.9
2010 27.1 3.6 -15.3 2.4 19.6
2011 -6.7 -15.8 14.3 -1.0 -5.3
2012 20.2 32.3 23.6 -3.0 95.4
2013 24.5 -4.5 -12.9 14.6 15.5
2014 -10.5 4.4 12.7 -14.2 -9.8
2015 -23.3 53.9 24.4 3.5 32.0
2016 -35.0 -23.3 -8.4 23.3 -57.8
2017 -28.3 28.1 -28.4 -7.4 -40.9
5 yr avg -14.5 11.7 -2.5 4.0 -12.2
10 yr avg -7.4 15.6 5.5 -1.4 20.2
Year Q1 Q2 Q3 Q4 Year
2008 -22.6 2.9 -27.3 -18.7 -29.5
2009 -17.7 82.1 77.8 -11.1 208.9
2010 27.8 5.4 -15.1 1.7 22.0
2011 -7.7 -15.8 12.6 -0.7 -7.6
2012 23.3 28.4 27.5 -3.1 96.7
2013 19.7 -9.3 -11.1 13.7 7.5
2014 -10.1 6.7 13.5 -13.4 -6.2
2015 -22.7 54.6 24.7 4.7 33.7
2016 -33.5 -22.7 -7.4 25.4 -50.3
2017 -27.4 28.2 -27.1 -6.5 -31.3
5 yr avg -14.8 11.5 -1.5 4.8 -9.3
10 yr avg -7.1 16.1 6.8 -0.8 24.4
Source: Factset Source: Factset
Deutsche Bank Securities Inc. Page 17

21 January 2018
Beverages
Latam Consumer Monthly
(C) Beverages remain the most consistent
Turning to happier subjects, we now look at the Beverages sector, starting withits bellwether (and still best-performing company long term), AmBev. Over thepast five years, ABV has produced average total returns of positive 0.6%, whilethe cleaner 10-year total return average of 19% remains at the top of the LatAmbeverage space, at least on an absolute basis (on 10-year relative basis, AC.MXhas done slightly better than ABEV).
Figure 31: Ambev Stock Performance
Stock Performance in US$ (%)
Year Q1 Q2 Q3 Q4 Year
2007 12.6 27.4 4.5 -2.9 45.6 2.13 47.7
2008 6.4 -16.1 -13.8 -18.9 -37.6 4.23 -33.4
2009 7.8 35.8 26.9 22.9 128.1 2.28 130.4
2010 -9.3 10.2 22.4 25.5 53.5 1.27 54.8
2011 -8.8 19.1 -9.1 17.7 16.3 2.91 19.2
2012 14.5 -7.2 -0.2 9.7 16.3 2.50 18.9
2013 0.8 -11.8 2.7 -4.2 -12.5 2.99 -9.5
2014 0.8 -5.0 -7.0 -5.0 -15.4 4.52 -10.9
2015 -7.4 5.9 -19.7 -9.0 -28.3 2.68 -25.6
2016 16.1 14.1 3.0 -19.4 10.1 3.55 13.6
2017 17.3 -4.7 20.0 -2.0 31.6 3.90 35.5
5 yr avg 5.5 -0.3 -0.2 -7.9 -2.9 3.53 0.6
10 yr avg 3.8 4.0 2.5 1.7 16.2 3.08 19.3
20 yr avg 3.1 5.0 0.7 9.7 21.3 2.03 23.3
Dividend
Yield
Total
Return
Source: Factset
Figure 32: Ambev Relative to Bovespa Index Figure 33: Ambev Relative to MSCI Brazil
Year Q1 Q2 Q3 Q4 Year
2007 5.2 1.2 -11.9 -12.1 -26.7
2008 9.2 -33.4 23.4 18.4 17.5
2009 -2.6 -12.0 -4.6 8.9 -16.2
2010 -9.5 24.5 1.2 23.6 47.4
2011 -9.8 24.4 20.3 9.8 43.4
2012 -1.7 16.6 -8.5 7.7 18.5
2013 6.9 11.4 -6.8 3.0 14.2
2014 -1.5 -13.0 1.5 9.8 -1.5
2015 7.5 -0.9 14.1 -5.8 13.5
2016 -12.8 0.2 -8.7 -22.4 -58.8
2017 6.7 2.6 -3.7 0.0 4.6
5 yr avg 1.4 0.1 -0.7 -3.1 -5.6
10 yr avg -0.8 2.0 2.8 5.3 8.3
20 yr avg -1.8 4.4 3.0 -0.7 3.5
Year Q1 Q2 Q3 Q4 Year
2007 7.2 4.5 -15.6 -15.6 -29.8
2008 12.0 -33.8 24.4 19.4 20.0
2009 -4.2 -3.4 0.2 10.8 6.9
2010 -8.8 26.2 1.4 22.9 49.7
2011 -10.7 24.4 18.6 10.1 41.2
2012 1.4 12.7 -4.5 7.5 19.8
2013 2.1 6.6 -5.0 2.1 6.2
2014 -1.2 -10.7 2.2 10.5 2.0
2015 8.1 -0.2 14.4 -4.6 15.2
2016 -11.2 0.8 -7.7 -20.3 -51.2
2017 7.6 2.7 -2.4 3.8 14.3
5 yr avg 1.1 -0.2 0.3 -1.7 -2.7
10 yr avg -0.5 2.5 4.2 6.2 12.4
20 yr avg -0.9 4.8 2.4 1.4 7.0
Source: Factset Source: Factset
The rest of the beverage sector has continued to perform well (in some cases,steadier than AmBev), but there is a greater divergence in returns after thecontinued FX volatility in 2017.
Page 18 Deutsche Bank Securities Inc.

21 January 2018
Beverages
Latam Consumer Monthly
In Chile, it was a great year for beverage companies with CCU, Andina and Conchay Toro all showing solid positive returns (in USD terms) of 45%, 37% and 20%respectively. Among these, Andina and CCU qualified among the year's Top 10performers (with CCU at #5 and Andina at #9).
In the case of Andina, the 5-year average return is now 2.0% (after 28% and 37%returns in 2016 and 2017, respectively), and on a 10-year timeframe the averagereturn rose to 13%. Andina still lags peer Arca Continental by this measure(despite their similarities in terms of operational excellence), but no longer lagsCoca-Cola FEMSA.
Figure 34: Andina Stock Performance
Stock Performance in US$ (%)
Year Q1 Q2 Q3 Q4 Year
2007 15.0 4.8 -10.0 -6.7 1.3 1.6 2.9
2008 19.1 -26.2 1.4 -13.2 -22.7 4.9 -17.8
2009 10.1 17.7 1.1 16.9 53.1 2.1 55.2
2010 -0.4 9.7 28.8 5.0 47.8 1.8 49.6
2011 -4.0 -2.1 -15.7 8.9 -13.7 1.8 -11.9
2012 28.6 -3.0 5.7 9.1 43.9 1.8 45.7
2013 6.6 -14.2 -4.2 -16.7 -27.0 1.2 -25.8
2014 -21.5 4.3 -13.6 -12.8 -38.4 2.4 -36.0
2015 -10.2 33.0 2.1 -13.9 5.1 2.6 7.7
2016 10.5 8.3 7.4 -2.7 25.0 2.4 27.5
2017 4.4 8.8 10.8 6.7 34.2 2.5 36.8
5 yr avg -2.0 8.0 0.5 -7.9 -0.2 2.2 2.0
10 yr avg 4.3 3.6 2.4 -1.3 10.8 2.3 13.1
20 yr avg 1.4 2.7 -1.3 4.8 7.8 2.6 10.4
Dividend
Yield
Total
Return
Source: Factset
Figure 35: Andina Relative to IPSA Index Figure 36: Andina Relative to MSCI Chile
Year Q1 Q2 Q3 Q4 Year
2007 7.6 -16.4 -6.4 -3.2 -19.9
2008 10.7 -11.9 13.6 12.1 16.5
2009 -4.0 -18.9 -4.3 1.7 -36.2
2010 -2.0 6.3 -4.9 -1.1 -1.3
2011 4.4 -8.2 11.7 0.7 9.9
2012 9.6 5.5 3.9 8.4 32.2
2013 2.0 1.0 0.4 -9.3 -5.4
2014 -18.8 2.1 -7.9 -8.9 -28.5
2015 -9.2 36.0 15.5 -12.2 23.3
2016 -2.8 5.7 6.4 -4.4 5.7
2017 -12.2 10.0 -6.3 -1.6 -0.4
5 yr avg -8.2 11.0 1.6 -7.3 -1.0
10 yr avg -2.2 2.8 2.8 -1.5 1.6
20 yr avg -3.5 1.9 -0.9 0.4 -3.6
Year Q1 Q2 Q3 Q4 Year
2007 8.3 -13.9 -7.3 -4.7 -19.5
2008 9.7 -13.2 11.9 13.1 14.6
2009 -3.1 -14.6 -4.4 2.1 -28.3
2010 -0.4 8.3 -3.6 -0.5 6.0
2011 4.3 -9.3 10.7 1.2 8.4
2012 11.4 7.0 4.6 10.1 38.3
2013 2.5 1.2 1.4 -9.3 -3.9
2014 -18.6 2.9 -5.7 -7.2 -23.9
2015 -9.6 37.3 15.8 -12.5 24.0
2016 -1.8 7.7 9.1 -4.7 11.8
2017 -11.0 11.9 -6.1 -0.3 -5.6
5 yr avg -7.7 12.2 2.9 -6.8 0.5
10 yr avg -1.7 3.9 3.4 -0.8 4.1
20 yr avg -2.9 2.5 -0.5 0.6 -2.0
Source: Factset Source: Factset
Deutsche Bank Securities Inc. Page 19

21 January 2018
Beverages
Latam Consumer Monthly
Among Chilean beverage names, CCU had the best performance, with a 46%return following a poor performance (with negative 3.3% return) in 2016, bringingits average 5- and 10-year total return to 4% and 14% respectively (as illustratedbelow). CCU remained among the Top 5 performers for 2017. CCU’s ADSs havetraded over 20 years, and over this time frame they show a solid 13% averagetotal return.
Figure 37: CCU Stock Performance
Stock Performance in US$ (%)
Year Q1 Q2 Q3 Q4 Year
2007 5.3 16.5 1.7 -5.6 17.7 2.1 19.8
2008 1.1 -17.0 11.3 -13.5 -19.3 4.3 -15.0
2009 -0.4 27.2 -4.2 14.8 39.2 5.0 44.3
2010 -5.0 16.2 29.4 8.9 55.5 2.2 57.7
2011 -4.1 0.8 -12.0 25.9 7.0 1.7 8.7
2012 20.2 -20.6 14.2 10.3 20.3 1.4 21.7
2013 5.5 -13.4 -6.1 -10.1 -22.8 1.6 -21.2
2014 -6.7 4.9 -5.9 -14.2 -21.0 1.7 -19.3
2015 10.0 1.9 3.7 0.6 17.0 2.3 19.3
2016 2.0 3.6 -13.8 3.6 -5.6 2.3 -3.3
2017 20.3 4.3 2.9 11.3 43.7 2.1 45.7
5 yr avg 6.2 0.3 -3.8 -1.8 2.2 2.0 4.2
10 yr avg 4.3 0.8 1.9 3.8 11.4 2.5 13.9
20 yr avg 3.4 -1.2 0.8 6.3 10.4 2.7 13.0
Dividend
Yield
Total
Return
Source: Factset
Figure 38: CCU Relative to Chile IPSA Figure 39: CCU Relative to MSCI Chile
Year Q1 Q2 Q3 Q4 Year
2007 -2.1 -4.7 5.2 -2.0 -3.4
2008 -7.3 -2.7 23.5 11.9 19.9
2009 -14.6 -9.5 -9.6 -0.4 -50.1
2010 -6.6 12.8 -4.4 2.8 6.3
2011 4.2 -5.3 15.4 17.6 30.7
2012 1.3 -12.1 12.4 9.5 8.6
2013 1.0 1.9 -1.5 -2.8 -1.2
2014 -4.0 2.7 -0.2 -10.3 -11.2
2015 11.0 4.9 17.0 2.2 35.1
2016 -11.3 1.1 -14.7 1.8 -24.9
2017 3.7 5.4 -14.1 3.0 9.1
5 yr avg 0.1 3.2 -2.7 -1.2 1.4
10 yr avg -2.3 -0.1 2.4 3.5 2.2
20 yr avg -1.6 -2.0 1.2 1.9 -1.1
Year Q1 Q2 Q3 Q4 Year
2007 -1.4 -2.3 4.3 -3.5 -3.1
2008 -8.3 -4.0 21.8 12.8 18.0
2009 -13.7 -5.1 -9.7 0.0 -42.2
2010 -5.1 14.8 -3.0 3.4 13.6
2011 4.2 -6.4 14.4 18.2 29.1
2012 3.1 -10.6 13.1 11.3 14.7
2013 1.5 2.1 -0.5 -2.8 0.2
2014 -3.8 3.6 2.0 -8.6 -6.5
2015 10.6 6.2 17.3 1.9 35.8
2016 -10.3 3.0 -12.0 1.6 -18.8
2017 4.9 7.3 -13.9 4.3 3.8
5 yr avg 0.6 4.4 -1.4 -0.7 2.9
10 yr avg -1.7 1.1 2.9 4.2 4.8
20 yr avg -1.0 -1.4 1.6 2.1 0.5
Source: Factset Source: Factset
Page 20 Deutsche Bank Securities Inc.
21 January 2018
Beverages
Latam Consumer Monthly
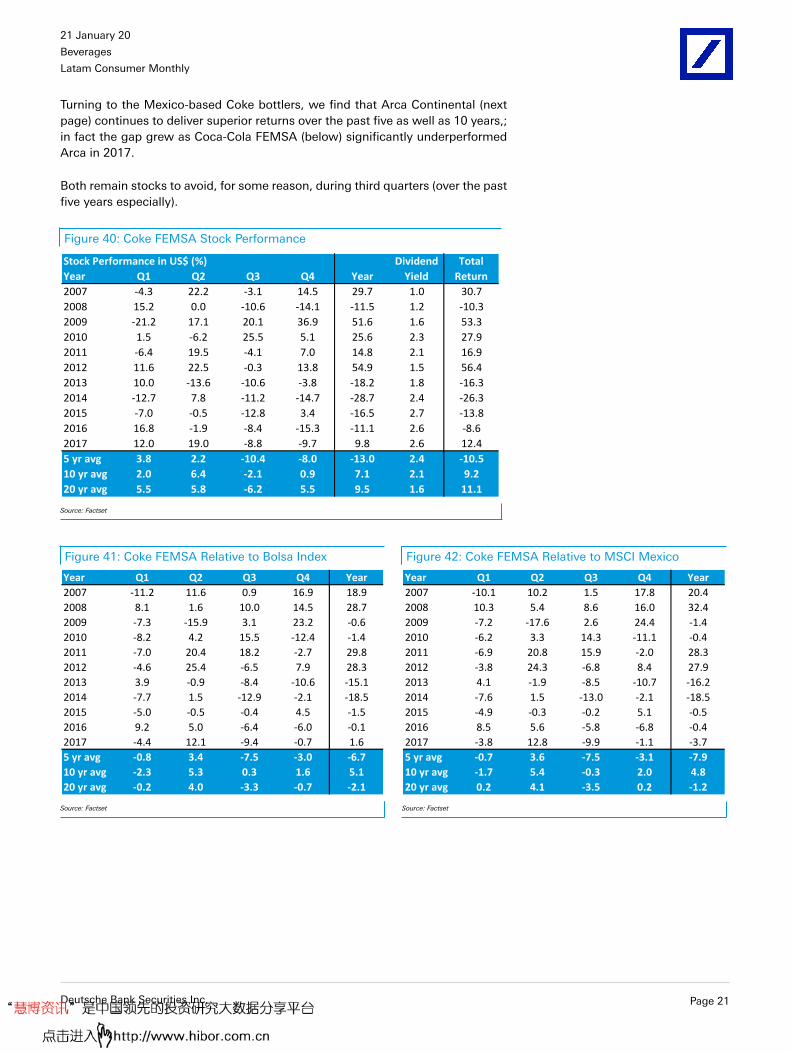
Turning to the Mexico-based Coke bottlers, we find that Arca Continental (nextpage) continues to deliver superior returns over the past five as well as 10 years,;in fact the gap grew as Coca-Cola FEMSA (below) significantly underperformedArca in 2017.
Both remain stocks to avoid, for some reason, during third quarters (over the pastfive years especially).
Figure 40: Coke FEMSA Stock Performance
Stock Performance in US$ (%)
Year Q1 Q2 Q3 Q4 Year
2007 -4.3 22.2 -3.1 14.5 29.7 1.0 30.7
2008 15.2 0.0 -10.6 -14.1 -11.5 1.2 -10.3
2009 -21.2 17.1 20.1 36.9 51.6 1.6 53.3
2010 1.5 -6.2 25.5 5.1 25.6 2.3 27.9
2011 -6.4 19.5 -4.1 7.0 14.8 2.1 16.9
2012 11.6 22.5 -0.3 13.8 54.9 1.5 56.4
2013 10.0 -13.6 -10.6 -3.8 -18.2 1.8 -16.3
2014 -12.7 7.8 -11.2 -14.7 -28.7 2.4 -26.3
2015 -7.0 -0.5 -12.8 3.4 -16.5 2.7 -13.8
2016 16.8 -1.9 -8.4 -15.3 -11.1 2.6 -8.6
2017 12.0 19.0 -8.8 -9.7 9.8 2.6 12.4
5 yr avg 3.8 2.2 -10.4 -8.0 -13.0 2.4 -10.5
10 yr avg 2.0 6.4 -2.1 0.9 7.1 2.1 9.2
20 yr avg 5.5 5.8 -6.2 5.5 9.5 1.6 11.1
Dividend
Yield
Total
Return
Source: Factset
Figure 41: Coke FEMSA Relative to Bolsa Index Figure 42: Coke FEMSA Relative to MSCI Mexico
Year Q1 Q2 Q3 Q4 Year
2007 -11.2 11.6 0.9 16.9 18.9
2008 8.1 1.6 10.0 14.5 28.7
2009 -7.3 -15.9 3.1 23.2 -0.6
2010 -8.2 4.2 15.5 -12.4 -1.4
2011 -7.0 20.4 18.2 -2.7 29.8
2012 -4.6 25.4 -6.5 7.9 28.3
2013 3.9 -0.9 -8.4 -10.6 -15.1
2014 -7.7 1.5 -12.9 -2.1 -18.5
2015 -5.0 -0.5 -0.4 4.5 -1.5
2016 9.2 5.0 -6.4 -6.0 -0.1
2017 -4.4 12.1 -9.4 -0.7 1.6
5 yr avg -0.8 3.4 -7.5 -3.0 -6.7
10 yr avg -2.3 5.3 0.3 1.6 5.1
20 yr avg -0.2 4.0 -3.3 -0.7 -2.1
Year Q1 Q2 Q3 Q4 Year
2007 -10.1 10.2 1.5 17.8 20.4
2008 10.3 5.4 8.6 16.0 32.4
2009 -7.2 -17.6 2.6 24.4 -1.4
2010 -6.2 3.3 14.3 -11.1 -0.4
2011 -6.9 20.8 15.9 -2.0 28.3
2012 -3.8 24.3 -6.8 8.4 27.9
2013 4.1 -1.9 -8.5 -10.7 -16.2
2014 -7.6 1.5 -13.0 -2.1 -18.5
2015 -4.9 -0.3 -0.2 5.1 -0.5
2016 8.5 5.6 -5.8 -6.8 -0.4
2017 -3.8 12.8 -9.9 -1.1 -3.7
5 yr avg -0.7 3.6 -7.5 -3.1 -7.9
10 yr avg -1.7 5.4 -0.3 2.0 4.8
20 yr avg 0.2 4.1 -3.5 0.2 -1.2
Source: Factset Source: Factset
Deutsche Bank Securities Inc. Page 21
21 January 2018
Beverages
Latam Consumer Monthly
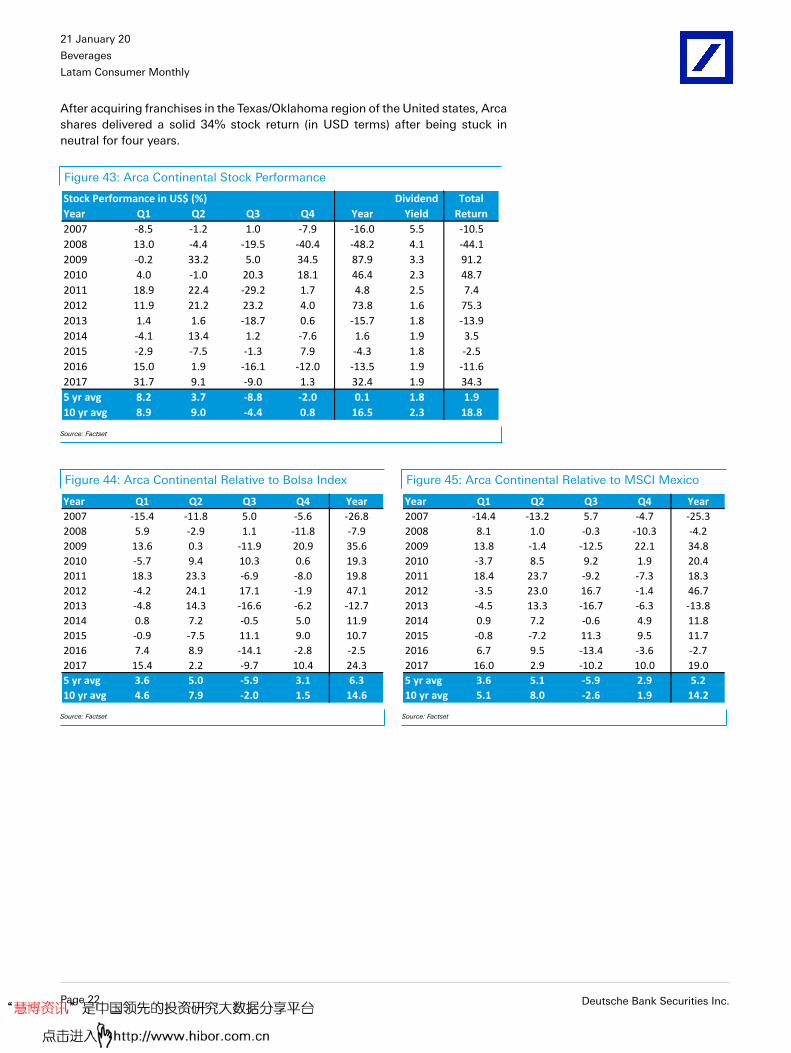
After acquiring franchises in the Texas/Oklahoma region of the United states, Arcashares delivered a solid 34% stock return (in USD terms) after being stuck inneutral for four years.
Figure 43: Arca Continental Stock Performance
Stock Performance in US$ (%)
Year Q1 Q2 Q3 Q4 Year
2007 -8.5 -1.2 1.0 -7.9 -16.0 5.5 -10.5
2008 13.0 -4.4 -19.5 -40.4 -48.2 4.1 -44.1
2009 -0.2 33.2 5.0 34.5 87.9 3.3 91.2
2010 4.0 -1.0 20.3 18.1 46.4 2.3 48.7
2011 18.9 22.4 -29.2 1.7 4.8 2.5 7.4
2012 11.9 21.2 23.2 4.0 73.8 1.6 75.3
2013 1.4 1.6 -18.7 0.6 -15.7 1.8 -13.9
2014 -4.1 13.4 1.2 -7.6 1.6 1.9 3.5
2015 -2.9 -7.5 -1.3 7.9 -4.3 1.8 -2.5
2016 15.0 1.9 -16.1 -12.0 -13.5 1.9 -11.6
2017 31.7 9.1 -9.0 1.3 32.4 1.9 34.3
5 yr avg 8.2 3.7 -8.8 -2.0 0.1 1.8 1.9
10 yr avg 8.9 9.0 -4.4 0.8 16.5 2.3 18.8
Dividend
Yield
Total
Return
Source: Factset
Figure 44: Arca Continental Relative to Bolsa Index Figure 45: Arca Continental Relative to MSCI Mexico
Year Q1 Q2 Q3 Q4 Year
2007 -15.4 -11.8 5.0 -5.6 -26.8
2008 5.9 -2.9 1.1 -11.8 -7.9
2009 13.6 0.3 -11.9 20.9 35.6
2010 -5.7 9.4 10.3 0.6 19.3
2011 18.3 23.3 -6.9 -8.0 19.8
2012 -4.2 24.1 17.1 -1.9 47.1
2013 -4.8 14.3 -16.6 -6.2 -12.7
2014 0.8 7.2 -0.5 5.0 11.9
2015 -0.9 -7.5 11.1 9.0 10.7
2016 7.4 8.9 -14.1 -2.8 -2.5
2017 15.4 2.2 -9.7 10.4 24.3
5 yr avg 3.6 5.0 -5.9 3.1 6.3
10 yr avg 4.6 7.9 -2.0 1.5 14.6
Year Q1 Q2 Q3 Q4 Year
2007 -14.4 -13.2 5.7 -4.7 -25.3
2008 8.1 1.0 -0.3 -10.3 -4.2
2009 13.8 -1.4 -12.5 22.1 34.8
2010 -3.7 8.5 9.2 1.9 20.4
2011 18.4 23.7 -9.2 -7.3 18.3
2012 -3.5 23.0 16.7 -1.4 46.7
2013 -4.5 13.3 -16.7 -6.3 -13.8
2014 0.9 7.2 -0.6 4.9 11.8
2015 -0.8 -7.2 11.3 9.5 11.7
2016 6.7 9.5 -13.4 -3.6 -2.7
2017 16.0 2.9 -10.2 10.0 19.0
5 yr avg 3.6 5.1 -5.9 2.9 5.2
10 yr avg 5.1 8.0 -2.6 1.9 14.2
Source: Factset Source: Factset
Page 22 Deutsche Bank Securities Inc.

21 January 2018
Beverages
Latam Consumer Monthly
Historically, the returns of FEMSA (Coca-Cola FEMSA’s parent company) hadclosely tracked those of its largest subsidiary, but starting in 2013 the returns ofthe two stocks been more divergent. In 2016 FMX fell 17% (2x the decline in KOF),while in 2017 FMX rose by 24% (2x the increase in KOF).
Figure 46: FEMSA Stock Performance
Stock Performance in US$ (%)
Year Q1 Q2 Q3 Q4 Year
2007 -4.1 6.4 -5.1 2.5 -0.9 1.2 0.3
2008 9.9 8.6 -17.0 -21.1 -21.8 0.6 -21.2
2009 -14.9 26.6 18.1 26.1 60.6 1.0 61.6
2010 -0.2 -9.2 17.6 10.0 17.1 1.1 18.2
2011 4.4 13.1 -1.7 6.6 23.7 1.4 25.1
2012 18.3 7.8 4.0 8.0 43.2 1.4 44.7
2013 13.1 -8.4 -6.4 0.0 -3.1 1.6 -1.5
2014 -3.4 0.6 -1.8 -3.5 -8.0 0.0 -8.0
2015 5.8 -5.0 0.1 4.8 5.4 1.4 6.8
2016 4.0 -5.8 0.7 -17.1 -18.2 1.6 -16.6
2017 15.2 12.0 -3.0 -1.4 23.5 1.4 24.9
5 yr avg 6.9 -1.3 -2.1 -3.4 -0.1 1.2 1.1
10 yr avg 5.2 4.0 1.1 1.3 12.2 1.1 13.4
Dividend
Yield
Total
Return
Source: Factset
Figure 47: FEMSA Relative to Bolsa Index Figure 48: FEMSA Relative to MSCI Mexico
Year Q1 Q2 Q3 Q4 Year
2007 -11.0 -4.2 -1.1 4.8 -11.6
2008 2.8 10.1 3.6 7.6 18.5
2009 -1.0 -6.3 1.2 12.5 8.4
2010 -9.9 1.2 7.6 -7.5 -9.9
2011 3.8 13.9 20.6 -3.0 38.7
2012 2.2 10.8 -2.1 2.1 16.6
2013 7.0 4.2 -4.3 -6.8 0.0
2014 1.5 -5.7 -3.5 9.1 2.3
2015 7.7 -5.1 12.5 5.9 20.4
2016 -3.6 1.2 2.7 -7.9 -7.3
2017 -1.1 5.2 -3.6 7.6 15.4
5 yr avg 2.3 0.0 0.8 1.6 6.2
10 yr avg 0.9 3.0 3.5 2.0 10.3
Year Q1 Q2 Q3 Q4 Year
2007 -10.0 -5.6 -0.5 5.7 -10.1
2008 4.9 14.0 2.2 9.1 22.2
2009 -0.9 -8.0 0.6 13.6 7.6
2010 -7.9 0.3 6.4 -6.3 -8.9
2011 3.9 14.4 18.3 -2.4 37.2
2012 2.9 9.7 -2.5 2.6 16.2
2013 7.2 3.2 -4.4 -6.9 -1.1
2014 1.6 -5.7 -3.6 9.0 2.2
2015 7.9 -4.8 12.6 6.5 21.4
2016 -4.3 1.7 3.4 -8.7 -7.5
2017 -0.5 5.9 -4.1 7.2 10.1
5 yr avg 2.4 0.1 0.8 1.4 5.0
10 yr avg 1.5 3.1 2.9 2.4 9.9
Source: Factset Source: Factset
Deutsche Bank Securities Inc. Page 23

21 January 2018
Beverages
Latam Consumer Monthly
Finally, winemaker Concha y Toro was the third best performer among Chileanbeverage names in 2017, on the back of 10-year low valuations and theannouncement of a major cost reduction program and strategy review (includinginitiatives to monetize its unplanted real estate). The fact that grape/third-partywine costs again disappointed (impacting costs toward the end of the year) had alimiting effect on the stock’s upside, but the improved long-term outlook provedmore important in sparking a turnaround in the stock.
After two consecutive years of weak wine harvests in Chile, the upcoming harvest(March 2018 ) will likely be better than expected, leading to a margin reboundin 2H18. The ongoing cost reduction program (with a aim to double operatingincome by 2022) should yield significant savings in the SG&A line in 2018 and2019.
Figure 49: Concha y Toro Stock Performance
Stock Performance in US$ (%)
Year Q1 Q2 Q3 Q4 Year
2007 12.4 48.4 -6.3 -11.0 39.0 1.8 40.8
2008 -11.2 -7.1 2.5 -14.3 -27.5 2.0 -25.5
2009 10.0 12.0 13.1 5.2 46.6 2.1 48.7
2010 3.0 -9.9 17.0 0.0 8.6 2.0 10.6
2011 -3.4 16.1 -34.2 7.2 -20.9 2.6 -18.3
2012 20.4 -15.0 7.1 -6.7 2.2 1.7 4.0
2013 3.5 -2.9 -3.2 -0.9 -3.6 1.9 -1.7
2014 9.3 -1.3 -3.1 -0.3 4.2 2.0 6.2
2015 5.5 -15.6 -5.1 -9.4 -23.4 2.6 -20.8
2016 16.3 -9.4 10.6 -8.0 7.1 2.5 9.7
2017 5.6 -8.9 7.8 13.8 18.0 2.3 20.3
5 yr avg 8.0 -7.6 1.4 -1.0 0.5 2.3 2.7
10 yr avg 5.9 -4.2 1.3 -1.4 1.1 2.2 3.3
20 yr avg 6.2 3.1 -0.1 1.3 9.8 1.9 11.7
Dividend
Yield
Total
Return
Source: Factset
Figure 50: Concha y Toro Relative to Chile IPSA Figure 51: Concha y Toro Relative to MSCI Chile
Year Q1 Q2 Q3 Q4 Year
2007 4.9 27.2 -2.8 -7.5 17.8
2008 -19.6 7.2 14.8 11.0 11.7
2009 -4.2 -24.6 7.8 -10.0 -42.7
2010 1.4 -13.3 -16.8 -6.1 -40.5
2011 5.0 10.0 -6.8 -1.1 2.7
2012 1.4 -6.5 5.3 -7.5 -9.5
2013 -1.1 12.3 1.4 6.5 18.0
2014 12.0 -3.5 2.6 3.5 14.0
2015 6.5 -12.6 8.3 -7.7 -5.2
2016 2.9 -11.9 9.6 -9.8 -12.2
2017 -11.0 -7.7 -9.2 5.5 -16.6
5 yr avg 1.9 -4.7 2.5 -0.4 -0.4
10 yr avg -0.7 -5.1 1.7 -1.6 -8.0
20 yr avg 1.2 2.3 0.3 -3.1 -1.6
Year Q1 Q2 Q3 Q4 Year
2007 5.6 29.6 -3.7 -9.0 18.2
2008 -20.6 6.0 13.1 12.0 9.8
2009 -3.2 -20.3 7.6 -9.6 -34.8
2010 2.9 -11.3 -15.4 -5.5 -33.2
2011 4.9 8.9 -7.8 -0.5 1.2
2012 3.3 -5.0 6.0 -5.7 -3.4
2013 -0.6 12.6 2.4 6.5 19.4
2014 12.2 -2.6 4.8 5.3 18.7
2015 6.1 -11.3 8.6 -8.1 -4.5
2016 4.0 -10.0 12.3 -10.0 -6.1
2017 -9.8 -5.8 -9.0 6.8 -21.9
5 yr avg 2.4 -3.4 3.8 0.1 1.1
10 yr avg -0.1 -3.9 2.2 -0.9 -5.5
20 yr avg 1.8 2.9 0.7 -2.9 -0.1
Source: Factset Source: Factset
Page 24 Deutsche Bank Securities Inc.

21 January 2018
Beverages
Latam Consumer Monthly
(D) Large-cap food retailers among Top 10 in 2017
Starting with the large cap retailers, we see Walmex with improving 5-year and10-year average returns (-1% and +9% respectively, about five points above lastyear’s respective averages) on the back of its strong rally in 2017 (despite achallenging environment in Mexico). Walmex bounced back into the list of Top10 performers in Latam Consumer in 2017 due to successful competitive pricing,efficiency gains and sound channel exposure (wholesale and discount stores)translating into high single digit sales growth.
Figure 52: Walmex Stock Performance
Stock Performance in US$ (%)
Year Q1 Q2 Q3 Q4 Year
2007 -2.5 -11.3 -3.2 -6.0 -21.4 1.6 -19.8
2008 22.3 -6.1 -13.7 -21.9 -22.6 1.6 -21.0
2009 -12.2 26.2 17.5 29.4 68.3 1.2 69.5
2010 13.9 -13.2 13.4 14.0 27.8 1.1 28.9
2011 4.1 -1.1 -21.9 18.5 -4.7 1.2 -3.5
2012 22.7 -20.8 5.8 15.7 19.0 1.1 20.1
2013 0.4 -14.5 -6.6 0.0 -19.8 0.0 -19.8
2014 -9.2 12.7 -6.0 -14.4 -17.7 1.6 -16.1
2015 16.2 -2.6 0.5 2.8 17.0 1.3 18.3
2016 -5.0 -0.5 -7.6 -18.3 -28.6 1.5 -27.1
2017 27.4 1.6 -1.3 7.3 37.0 1.3 38.3
5 yr avg 6.0 -0.7 -4.2 -4.5 -2.4 1.2 -1.3
10 yr avg 8.1 -1.8 -2.0 3.3 7.6 1.2 8.8
20 yr avg 8.3 0.7 -2.1 5.4 13.3 1.1 14.5
Dividend
Yield
Total
Return
Source: Factset
Figure 53: Walmex Relative to Bolsa Index Figure 54: Walmex Relative to MSCI Mexico
Year Q1 Q2 Q3 Q4 Year
2007 -9.4 -21.9 0.8 -3.7 -32.2
2008 15.2 -4.5 6.9 6.7 17.7
2009 1.7 -6.8 0.5 15.7 16.0
2010 4.2 -2.8 3.4 -3.5 0.8
2011 3.5 -0.3 0.4 8.9 10.3
2012 6.6 -17.8 -0.4 9.9 -7.7
2013 -5.7 -1.8 -4.5 -6.8 -16.7
2014 -4.3 6.4 -7.7 -1.8 -7.5
2015 18.2 -2.6 12.9 3.9 32.0
2016 -12.6 6.4 -5.5 -9.0 -17.6
2017 11.1 -5.3 -2.0 16.3 28.8
5 yr avg 1.3 0.6 -1.4 0.5 3.8
10 yr avg 3.8 -2.9 0.4 4.0 5.6
20 yr avg 2.6 -1.0 0.8 -0.8 1.7
Year Q1 Q2 Q3 Q4 Year
2007 -8.4 -23.3 1.5 -2.8 -30.7
2008 17.4 -0.7 5.5 8.2 21.3
2009 1.8 -8.5 -0.1 16.9 15.2
2010 6.2 -3.7 2.2 -2.2 1.8
2011 3.6 0.1 -1.9 9.5 8.8
2012 7.3 -18.9 -0.7 10.4 -8.1
2013 -5.4 -2.8 -4.6 -6.9 -17.8
2014 -4.2 6.4 -7.8 -1.8 -7.5
2015 18.3 -2.4 13.1 4.4 33.0
2016 -13.3 7.0 -4.9 -9.8 -17.8
2017 11.7 -4.6 -2.5 15.9 23.5
5 yr avg 1.4 0.7 -1.3 0.3 2.7
10 yr avg 4.3 -2.8 -0.2 4.4 5.3
20 yr avg 2.9 -0.9 0.6 0.1 2.6
Source: Factset Source: Factset
Deutsche Bank Securities Inc. Page 25
21 January 2018
Beverages
Latam Consumer Monthly
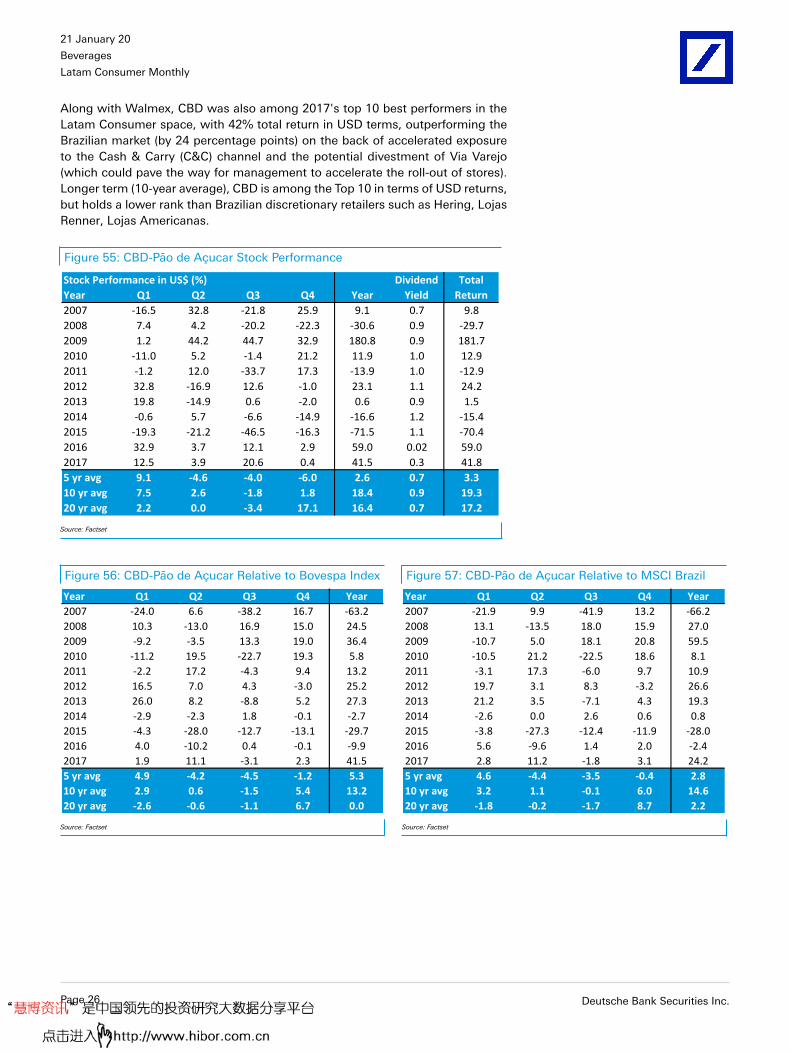
Along with Walmex, CBD was also among 2017's top 10 best performers in theLatam Consumer space, with 42% total return in USD terms, outperforming theBrazilian market (by 24 percentage points) on the back of accelerated exposureto the Cash & Carry (C&C) channel and the potential divestment of Via Varejo(which could pave the way for management to accelerate the roll-out of stores).Longer term (10-year average), CBD is among the Top 10 in terms of USD returns,but holds a lower rank than Brazilian discretionary retailers such as Hering, LojasRenner, Lojas Americanas.
Figure 55: CBD-Pão de Açucar Stock Performance
Stock Performance in US$ (%)
Year Q1 Q2 Q3 Q4 Year
2007 -16.5 32.8 -21.8 25.9 9.1 0.7 9.8
2008 7.4 4.2 -20.2 -22.3 -30.6 0.9 -29.7
2009 1.2 44.2 44.7 32.9 180.8 0.9 181.7
2010 -11.0 5.2 -1.4 21.2 11.9 1.0 12.9
2011 -1.2 12.0 -33.7 17.3 -13.9 1.0 -12.9
2012 32.8 -16.9 12.6 -1.0 23.1 1.1 24.2
2013 19.8 -14.9 0.6 -2.0 0.6 0.9 1.5
2014 -0.6 5.7 -6.6 -14.9 -16.6 1.2 -15.4
2015 -19.3 -21.2 -46.5 -16.3 -71.5 1.1 -70.4
2016 32.9 3.7 12.1 2.9 59.0 0.02 59.0
2017 12.5 3.9 20.6 0.4 41.5 0.3 41.8
5 yr avg 9.1 -4.6 -4.0 -6.0 2.6 0.7 3.3
10 yr avg 7.5 2.6 -1.8 1.8 18.4 0.9 19.3
20 yr avg 2.2 0.0 -3.4 17.1 16.4 0.7 17.2
Dividend
Yield
Total
Return
Source: Factset
Figure 56: CBD-Pão de Açucar Relative to Bovespa Index Figure 57: CBD-Pão de Açucar Relative to MSCI Brazil
Year Q1 Q2 Q3 Q4 Year
2007 -24.0 6.6 -38.2 16.7 -63.2
2008 10.3 -13.0 16.9 15.0 24.5
2009 -9.2 -3.5 13.3 19.0 36.4
2010 -11.2 19.5 -22.7 19.3 5.8
2011 -2.2 17.2 -4.3 9.4 13.2
2012 16.5 7.0 4.3 -3.0 25.2
2013 26.0 8.2 -8.8 5.2 27.3
2014 -2.9 -2.3 1.8 -0.1 -2.7
2015 -4.3 -28.0 -12.7 -13.1 -29.7
2016 4.0 -10.2 0.4 -0.1 -9.9
2017 1.9 11.1 -3.1 2.3 41.5
5 yr avg 4.9 -4.2 -4.5 -1.2 5.3
10 yr avg 2.9 0.6 -1.5 5.4 13.2
20 yr avg -2.6 -0.6 -1.1 6.7 0.0
Year Q1 Q2 Q3 Q4 Year
2007 -21.9 9.9 -41.9 13.2 -66.2
2008 13.1 -13.5 18.0 15.9 27.0
2009 -10.7 5.0 18.1 20.8 59.5
2010 -10.5 21.2 -22.5 18.6 8.1
2011 -3.1 17.3 -6.0 9.7 10.9
2012 19.7 3.1 8.3 -3.2 26.6
2013 21.2 3.5 -7.1 4.3 19.3
2014 -2.6 0.0 2.6 0.6 0.8
2015 -3.8 -27.3 -12.4 -11.9 -28.0
2016 5.6 -9.6 1.4 2.0 -2.4
2017 2.8 11.2 -1.8 3.1 24.2
5 yr avg 4.6 -4.4 -3.5 -0.4 2.8
10 yr avg 3.2 1.1 -0.1 6.0 14.6
20 yr avg -1.8 -0.2 -1.7 8.7 2.2
Source: Factset Source: Factset
Page 26 Deutsche Bank Securities Inc.

21 January 2018
Beverages
Latam Consumer Monthly
Finally, Cencosud was not able to repeat its 2016 performance and showeda modest stock return (+7.0%) in USD terms. Intensified competition in manymarkets where Cencosud operates and a slowdown in consumption in Chilenegatively impacted Cencosud. With ongoing restructuring and visible efficiencygains in some operations, it remains to be seen whether the stock can againmatch its low-teens 10-year trailing average (of 15%).
Figure 58: Cencosud Stock Performance
Stock Performance in US$ (%)
Year Q1 Q2 Q3 Q4 Year
2007 9.8 21.0 -5.3 2.4 28.7 1.5 30.2
2008 6.4 -30.3 -19.8 -40.7 -64.7 2.4 -62.3
2009 17.2 57.8 4.4 23.4 138.3 1.2 139.6
2010 15.7 14.7 50.4 16.3 132.3 0.9 133.2
2011 -9.3 0.6 -24.7 7.2 -26.4 1.1 -25.3
2012 14.4 -16.1 10.1 -10.5 -5.4 0.8 -4.6
2013 16.2 -19.6 -11.0 -19.1 -32.7 1.1 -31.6
2014 -8.5 -0.2 -10.3 -15.4 -30.7 0.8 -29.9
2015 -4.9 1.3 -19.2 2.8 -20.0 1.8 -18.1
2016 26.5 12.9 5.1 -6.4 40.6 1.1 41.6
2017 9.1 -13.4 15.4 -3.5 5.3 1.7 7.0
5 yr avg 7.7 -3.8 -4.0 -8.3 -7.5 1.3 -6.2
10 yr avg 8.3 0.8 0.0 -4.6 13.7 1.3 15.0
Dividend
Yield
Total
Return
Source: Factset
Figure 59: Cencosud Relative to Chile IPSA Figure 60: Cencosud Relative to MSCI Chile
Year Q1 Q2 Q3 Q4 Year
2007 2.3 -0.2 -1.8 5.9 7.5
2008 -2.0 -16.0 -7.5 -15.3 -25.6
2009 3.0 21.1 -0.9 8.3 49.0
2010 14.2 11.3 16.6 10.2 83.1
2011 -1.0 -5.4 2.7 -1.1 -2.7
2012 -4.6 -7.7 8.3 -11.2 -17.1
2013 11.6 -4.4 -6.3 -11.8 -11.0
2014 -5.8 -2.4 -4.6 -11.5 -20.9
2015 -3.9 4.3 -5.9 4.5 -1.8
2016 13.2 10.4 4.1 -8.1 21.2
2017 -7.4 -12.2 -1.6 -11.8 -29.3
5 yr avg 1.5 -0.8 -2.9 -7.7 -8.4
10 yr avg 1.7 -0.1 0.5 -4.8 4.5
Year Q1 Q2 Q3 Q4 Year
2007 3.0 2.2 -2.6 4.4 7.9
2008 -3.0 -17.3 -9.3 -14.4 -27.4
2009 4.0 25.5 -1.1 8.6 56.9
2010 15.7 13.3 18.0 10.8 90.5
2011 -1.0 -6.6 1.7 -0.5 -4.3
2012 -2.7 -6.1 9.0 -9.5 -11.0
2013 12.1 -4.1 -5.3 -11.8 -9.6
2014 -5.6 -1.5 -2.4 -9.8 -16.2
2015 -4.3 5.6 -5.6 4.1 -1.1
2016 14.2 12.3 6.8 -8.4 27.3
2017 -6.3 -10.3 -1.4 -10.5 -34.6
5 yr avg 2.0 0.4 -1.6 -7.2 -6.8
10 yr avg 2.3 1.1 1.0 -4.1 7.0
Source:Factset Source:Factset
Deutsche Bank Securities Inc. Page 27

21 January 2018
Beverages
Latam Consumer Monthly
(E) Discretionary retailers the most recent stars
Great year in Brazil and Chile, but negative returns in MexicoFalabella (by far the largest stock in the subsector) again delivered strong returnsin 2017 after a nice rebound in 2016 following three years of negative returns.It is also noteworthy that FAL holds Top-3 spot in average 20-year dollar returnamong our covered companies.
Figure 61: Falabella Stock Performance
Stock Performance in US$ (%)
Year Q1 Q2 Q3 Q4 Year
2007 21.5 21.4 -4.5 -1.8 38.4 1.9 40.2
2008 11.4 -22.2 -16.9 -24.7 -45.8 1.5 -44.2
2009 17.4 27.7 11.3 34.2 124.1 0.8 124.9
2010 -0.6 10.0 52.1 14.5 90.3 1.0 91.3
2011 -9.9 3.2 -24.2 -1.9 -30.8 1.3 -29.5
2012 24.2 -4.4 9.2 2.0 32.5 0.9 33.4
2013 16.7 -6.7 -14.7 -6.3 -12.9 1.2 -11.8
2014 -2.3 3.7 -16.9 -11.2 -25.2 1.4 -23.8
2015 14.2 -8.9 -11.5 3.1 -5.0 1.8 -3.2
2016 9.8 9.0 -4.0 8.1 24.1 1.5 25.7
2017 5.9 -2.1 19.0 2.1 26.1 2.3 28.4
5 yr avg 8.9 -1.0 -5.6 -0.8 1.4 1.6 3.0
10 yr avg 8.7 0.9 0.4 2.0 17.7 1.4 19.1
20 yr avg 6.6 3.8 -1.0 7.3 23.4 1.6 25.0
Dividend
Yield
Total
Return
Source: Factset
Figure 62: Falabella Relative to Chile IPSA Figure 63: Falabella Relative to MSCI Chile
Year Q1 Q2 Q3 Q4 Year
2007 14.1 0.2 -1.0 1.8 17.2
2008 3.0 -7.9 -4.6 0.6 -6.6
2009 3.2 -8.9 6.0 19.1 34.8
2010 -2.2 6.5 18.3 8.4 41.2
2011 -1.5 -2.8 3.3 -10.2 -7.2
2012 5.3 4.1 7.5 1.3 20.8
2013 12.1 8.6 -10.0 1.1 8.7
2014 0.4 1.5 -11.2 -7.3 -15.3
2015 15.2 -5.8 1.8 4.8 13.1
2016 -3.6 6.5 -5.0 6.4 4.8
2017 -10.6 -1.0 2.0 -6.1 -8.5
5 yr avg 2.7 2.0 -4.5 -0.2 0.6
10 yr avg 2.1 0.1 0.8 1.8 8.6
20 yr avg 1.7 3.0 -0.6 2.8 11.9
Year Q1 Q2 Q3 Q4 Year
2007 14.8 2.7 -1.8 0.3 17.6
2008 2.0 -9.2 -6.3 1.6 -8.5
2009 4.2 -4.5 5.8 19.4 42.7
2010 -0.7 8.5 19.7 9.0 48.5
2011 -1.6 -4.0 2.2 -9.6 -8.7
2012 7.1 5.6 8.1 3.0 26.9
2013 12.6 8.8 -9.0 1.0 10.1
2014 0.6 2.4 -8.9 -5.6 -10.7
2015 14.8 -4.6 2.1 4.4 13.9
2016 -2.6 8.4 -2.3 6.1 10.9
2017 -9.4 0.9 2.2 -4.8 -13.8
5 yr avg 3.2 3.2 -3.2 0.2 2.1
10 yr avg 2.7 1.2 1.4 2.5 11.1
20 yr avg 2.3 3.7 -0.2 3.1 13.5
Source:Factset Source:Factset
Page 28 Deutsche Bank Securities Inc.

21 January 2018
Beverages
Latam Consumer Monthly
On the other hand, after an almost 40% decline in 2016, Liverpool continued tofall on the back of investor concerns regarding Amazon's entry into Mexico (aswell as a slightly higherthan-trend seasonal peak in NPLs).
But this was only the fourth year (of the last 11) in which Liverpool showednegative returns, and the 10-year average remains solid at 8.9%.
Figure 64: Liverpool Stock Performance
Stock Performance in US$ (%)
Year Q1 Q2 Q3 Q4 Year
2007 24.6 23.8 1.0 -0.8 54.6 0.7 55.3
2008 0.6 1.6 -22.0 -36.9 -49.6 1.0 -48.6
2009 -11.9 45.3 12.9 12.8 63.2 0.7 63.9
2010 20.9 -9.2 9.1 26.6 51.7 0.6 52.3
2011 6.5 2.2 -14.7 16.3 7.9 0.6 8.6
2012 10.0 -0.1 5.4 19.3 38.2 1.4 39.6
2013 16.1 -3.4 -2.3 -0.2 9.4 0.0 9.4
2014 -6.7 13.3 -4.6 -9.5 -8.8 0.5 -8.2
2015 13.5 -0.5 9.7 4.3 29.3 0.4 29.7
2016 -8.5 -15.0 -0.1 -22.8 -40.0 0.6 -39.4
2017 8.1 -4.9 9.8 -28.2 -18.9 0.6 -18.3
5 yr avg 4.5 -2.1 2.5 -11.2 -5.8 0.4 -5.4
10 yr avg 4.9 2.9 0.3 -1.8 8.2 0.7 8.9
20 yr avg 3.3 3.5 -0.7 4.9 12.7 1.0 13.7
Dividend
Yield
Total
Return
Source:Factset
Figure 65: Liverpool Relative to Bolsa Index Figure 66: Liverpool Relative to MSCI Mexico
Year Q1 Q2 Q3 Q4 Year
2007 17.7 13.3 5.0 1.5 43.8
2008 -6.4 3.2 -1.4 -8.2 -9.3
2009 2.0 12.4 -4.1 -0.8 11.0
2010 11.2 1.2 -0.8 9.1 24.6
2011 5.9 3.1 7.5 6.6 22.9
2012 -6.1 2.9 -0.8 13.5 11.5
2013 10.0 9.3 -0.2 -7.0 12.5
2014 -1.8 7.1 -6.3 3.1 1.5
2015 15.5 -0.5 22.1 5.4 44.3
2016 -16.1 -8.0 1.9 -13.6 -29.0
2017 -8.3 -11.8 9.1 -19.1 -27.1
5 yr avg -0.1 -0.8 5.3 -6.2 0.4
10 yr avg 0.6 1.9 2.7 -1.1 6.3
20 yr avg -2.4 1.7 2.2 -1.3 1.0
Year Q1 Q2 Q3 Q4 Year
2007 18.8 11.9 5.7 2.4 45.3
2008 -4.3 7.0 -2.8 -6.7 -5.6
2009 2.2 10.7 -4.6 0.4 10.1
2010 13.2 0.3 -2.0 10.3 25.7
2011 6.0 3.5 5.2 7.3 21.4
2012 -5.4 1.8 -1.1 14.0 11.1
2013 10.3 8.3 -0.3 -7.1 11.4
2014 -1.7 7.1 -6.4 3.1 1.5
2015 15.6 -0.2 22.3 6.0 45.3
2016 -16.8 -7.4 2.6 -14.4 -29.2
2017 -7.7 -11.1 8.7 -19.6 -32.4
5 yr avg 0.0 -0.7 5.3 -6.4 -0.7
10 yr avg 1.1 2.0 2.1 -0.7 5.9
20 yr avg -2.1 1.8 2.0 -0.4 1.9
Source:Factset Source:Factset
Deutsche Bank Securities Inc. Page 29
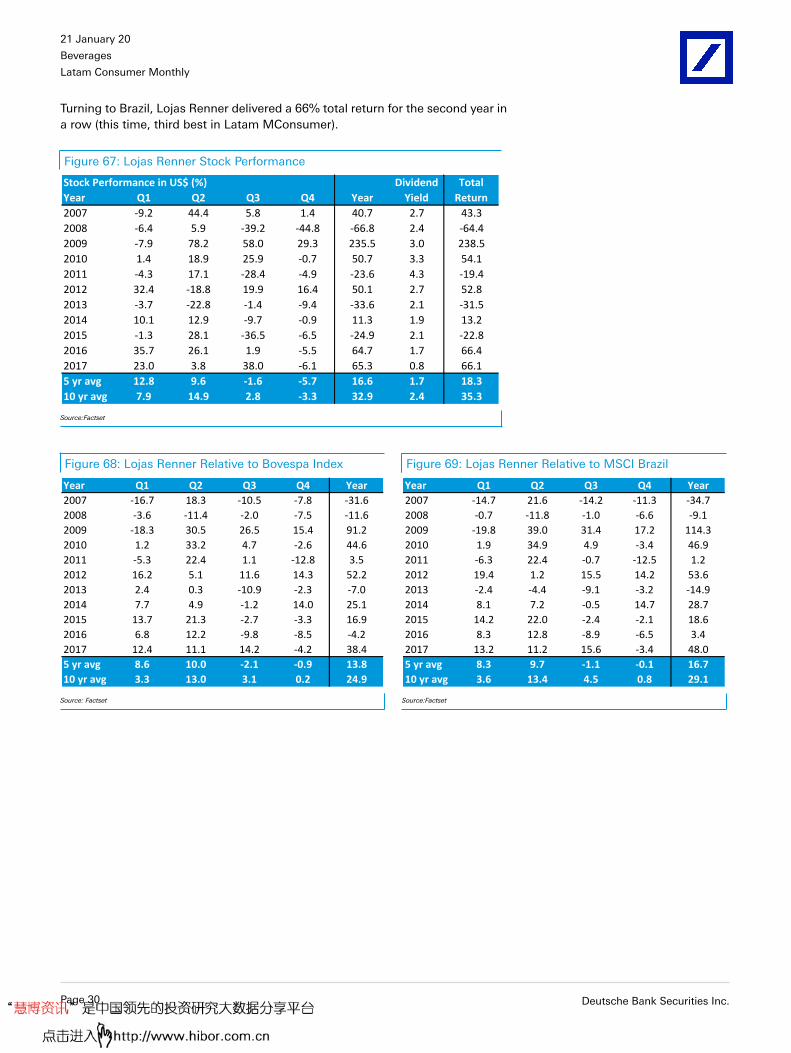
21 January 2018
Beverages
Latam Consumer Monthly
Turning to Brazil, Lojas Renner delivered a 66% total return for the second year ina row (this time, third best in Latam MConsumer).
Figure 67: Lojas Renner Stock Performance
Stock Performance in US$ (%)
Year Q1 Q2 Q3 Q4 Year
2007 -9.2 44.4 5.8 1.4 40.7 2.7 43.3
2008 -6.4 5.9 -39.2 -44.8 -66.8 2.4 -64.4
2009 -7.9 78.2 58.0 29.3 235.5 3.0 238.5
2010 1.4 18.9 25.9 -0.7 50.7 3.3 54.1
2011 -4.3 17.1 -28.4 -4.9 -23.6 4.3 -19.4
2012 32.4 -18.8 19.9 16.4 50.1 2.7 52.8
2013 -3.7 -22.8 -1.4 -9.4 -33.6 2.1 -31.5
2014 10.1 12.9 -9.7 -0.9 11.3 1.9 13.2
2015 -1.3 28.1 -36.5 -6.5 -24.9 2.1 -22.8
2016 35.7 26.1 1.9 -5.5 64.7 1.7 66.4
2017 23.0 3.8 38.0 -6.1 65.3 0.8 66.1
5 yr avg 12.8 9.6 -1.6 -5.7 16.6 1.7 18.3
10 yr avg 7.9 14.9 2.8 -3.3 32.9 2.4 35.3
Dividend
Yield
Total
Return
Source:Factset
Figure 68: Lojas Renner Relative to Bovespa Index Figure 69: Lojas Renner Relative to MSCI Brazil
Year Q1 Q2 Q3 Q4 Year
2007 -16.7 18.3 -10.5 -7.8 -31.6
2008 -3.6 -11.4 -2.0 -7.5 -11.6
2009 -18.3 30.5 26.5 15.4 91.2
2010 1.2 33.2 4.7 -2.6 44.6
2011 -5.3 22.4 1.1 -12.8 3.5
2012 16.2 5.1 11.6 14.3 52.2
2013 2.4 0.3 -10.9 -2.3 -7.0
2014 7.7 4.9 -1.2 14.0 25.1
2015 13.7 21.3 -2.7 -3.3 16.9
2016 6.8 12.2 -9.8 -8.5 -4.2
2017 12.4 11.1 14.2 -4.2 38.4
5 yr avg 8.6 10.0 -2.1 -0.9 13.8
10 yr avg 3.3 13.0 3.1 0.2 24.9
Year Q1 Q2 Q3 Q4 Year
2007 -14.7 21.6 -14.2 -11.3 -34.7
2008 -0.7 -11.8 -1.0 -6.6 -9.1
2009 -19.8 39.0 31.4 17.2 114.3
2010 1.9 34.9 4.9 -3.4 46.9
2011 -6.3 22.4 -0.7 -12.5 1.2
2012 19.4 1.2 15.5 14.2 53.6
2013 -2.4 -4.4 -9.1 -3.2 -14.9
2014 8.1 7.2 -0.5 14.7 28.7
2015 14.2 22.0 -2.4 -2.1 18.6
2016 8.3 12.8 -8.9 -6.5 3.4
2017 13.2 11.2 15.6 -3.4 48.0
5 yr avg 8.3 9.7 -1.1 -0.1 16.7
10 yr avg 3.6 13.4 4.5 0.8 29.1
Source: Factset Source:Factset
Page 30 Deutsche Bank Securities Inc.

21 January 2018
Beverages
Latam Consumer Monthly
Lojas Americanas (below) remains one of the top-5 performers over the longerterm (with 10-year CAGR of 20% and 20-year CAGR of 52%), but 2017 wasdefinitely not a good year for the stock despite the outstanding performance ofits traded subsidiary B2W (next page).
Figure 70: Lojas Americanas Stock Performance
Stock Performance in US$ (%)
Year Q1 Q2 Q3 Q4 Year
2007 20.9 19.9 22.2 5.9 87.8 0.4 88.2
2008 -16.1 -15.6 -24.5 -54.7 -75.8 0.3 -75.5
2009 8.5 63.1 35.2 34.7 222.5 0.4 222.9
2010 -16.1 -9.1 34.5 -0.9 1.7 0.8 2.5
2011 -3.1 17.9 -19.7 2.5 -5.9 0.8 -5.1
2012 26.7 -16.6 26.3 20.9 61.4 0.6 62.0
2013 -5.2 -25.7 5.2 -10.2 -33.4 0.9 -32.5
2014 8.9 8.9 -14.6 5.0 6.3 0.7 7.1
2015 -16.2 3.3 -30.6 6.5 -36.0 0.6 -35.5
2016 23.4 9.3 24.6 -13.2 45.9 0.5 46.3
2017 9.0 -12.2 35.4 -20.3 3.3 0.1 3.4
5 yr avg 4.0 -3.3 4.0 -6.5 -2.8 0.6 -2.2
10 yr avg 2.0 2.3 7.2 -3.0 19.0 0.6 19.6
20 yr avg 7.4 0.1 8.1 16.6 43.0 8.9 51.9
Dividend
Yield
Total
Return
Source: Factset
Figure 71: Lojas Americanas Relative to Bovespa Index Figure 72: Lojas Americanas Relative to MSCI Brazil
Year Q1 Q2 Q3 Q4 Year
2007 13.5 -6.2 5.9 -3.3 15.5
2008 -13.3 -32.8 12.6 -17.4 -20.7
2009 -1.9 15.4 3.7 20.8 78.1
2010 -16.3 5.2 13.3 -2.8 -4.4
2011 -4.0 23.2 9.7 -5.5 21.2
2012 10.4 7.3 18.0 18.9 63.5
2013 0.9 -2.5 -4.2 -3.1 -6.8
2014 6.6 1.0 -6.2 19.8 20.1
2015 -1.3 -3.5 3.2 9.6 5.7
2016 -5.5 -4.6 12.9 -16.2 -23.0
2017 -1.6 -4.9 11.7 -18.4 -23.6
5 yr avg -0.2 -2.9 3.5 -1.6 -5.5
10 yr avg -2.6 0.4 7.5 0.6 11.0
20 yr avg 2.5 -0.4 10.4 6.2 25.3
Year Q1 Q2 Q3 Q4 Year
2007 15.5 -2.9 2.2 -6.8 12.4
2008 -10.5 -33.2 13.7 -16.5 -18.2
2009 -3.4 23.9 8.6 22.6 101.2
2010 -15.6 6.9 13.5 -3.5 -2.0
2011 -5.0 23.2 8.0 -5.2 18.9
2012 13.6 3.4 22.0 18.7 64.9
2013 -3.8 -7.3 -2.5 -4.0 -14.7
2014 6.9 3.2 -5.4 20.5 23.7
2015 -0.7 -2.8 3.5 10.8 7.4
2016 -4.0 -4.0 13.9 -14.2 -15.5
2017 -0.7 -4.9 13.0 -17.5 -14.0
5 yr avg -0.5 -3.1 4.5 -0.9 -2.6
10 yr avg -2.3 0.8 8.8 1.2 15.2
20 yr avg 3.4 -0.1 9.8 8.2 28.8
Source: Factset Source:Factset
Deutsche Bank Securities Inc. Page 31

21 January 2018
Beverages
Latam Consumer Monthly
After consecutive two years of negative returns, B2W stood among top-5 bestperformers of 2017 with more than 100% return. We note that third quarterreturns for B2W have been exceptionally strong over the last two years (and onaverage, over the long term), usually followed by negative 4Q performance. In2017, the news of Amazon's foray into Brazilian retail market was the main driver.
Figure 73: B2W Stock Performance
Stock Performance in US$ (%)
Year Q1 Q2 Q3 Q4 Year
2007 3.5 22.9 12.8 -15.2 21.7 0.2 21.9
2008 -15.4 9.4 -35.5 -57.1 -74.4 0.7 -73.7
2009 -8.2 102.1 47.6 -1.9 168.7 0.2 168.9
2010 -21.5 -22.4 10.7 2.7 -30.8 0.2 -30.6
2011 -26.8 -11.2 -35.1 -39.1 -74.3 0.0 -74.3
2012 -5.7 -36.3 81.1 58.2 72.1 0.0 72.1
2013 -11.0 -59.9 114.7 1.7 -22.0 0.0 -22.0
2014 89.6 15.2 5.4 -37.0 45.1 0.0 45.1
2015 -26.1 5.2 -43.1 3.2 -54.4 0.0 -54.4
2016 4.8 -27.3 67.3 -36.2 -18.6 0.0 -18.6
2017 27.1 -9.2 89.3 -7.5 101.9 0.0 101.9
5 yr avg 16.9 -15.2 46.7 -15.2 10.4 0.0 10.4
10 yr avg 0.7 -3.5 30.2 -11.3 11.3 0.1 11.4
Dividend
Yield
Total
Return
Source:Factset
Figure 74: B2W Relative to Bovespa Index Figure 75: B2W Relative to MSCI Brazil
Year Q1 Q2 Q3 Q4 Year
2007 -4.0 -3.2 -3.6 -24.4 -50.6
2008 -12.6 -7.9 1.7 -19.8 -19.3
2009 -18.6 54.4 16.1 -15.9 24.3
2010 -21.7 -8.2 -10.5 0.8 -36.9
2011 -27.8 -6.0 -5.6 -47.0 -47.2
2012 -21.9 -12.4 72.8 56.1 74.2
2013 -4.9 -36.7 105.2 8.8 4.6
2014 87.3 7.2 13.8 -22.1 58.9
2015 -11.1 -1.6 -9.4 6.3 -12.6
2016 -24.1 -41.2 55.6 -39.2 -87.5
2017 16.5 -2.0 65.5 -5.6 101.9
5 yr avg 12.7 -14.9 46.2 -10.3 13.1
10 yr avg -3.9 -5.4 30.5 -7.7 6.1
Year Q1 Q2 Q3 Q4 Year
2007 -2.0 0.1 -7.3 -27.9 -53.7
2008 -9.7 -8.3 2.8 -18.9 -16.8
2009 -20.1 62.9 21.0 -14.0 47.4
2010 -21.0 -6.4 -10.3 0.1 -34.6
2011 -28.8 -6.0 -7.4 -46.7 -49.5
2012 -18.8 -16.3 76.8 55.9 75.6
2013 -9.7 -41.5 107.0 7.9 -3.4
2014 87.6 9.5 14.6 -21.4 62.5
2015 -10.6 -0.9 -9.1 7.5 -11.0
2016 -22.6 -40.6 56.6 -37.1 -79.9
2017 17.3 -1.9 66.9 -4.7 84.6
5 yr avg 12.4 -15.1 47.2 -9.6 10.6
10 yr avg -3.6 -4.9 31.9 -7.1 7.5
Source: Factset Source:Factset
Page 32 Deutsche Bank Securities Inc.

21 January 2018
Beverages
Latam Consumer Monthly
One of the best long-term performers in all of Latam Consumer, Hering once againposted a strong return (of 71%) in 2017 (after a return of 27% in 2016). Over a10-year period, it remains on top in terms of average returns by a shrinking butstill comfortable margin.
Figure 76: Cia Hering Stock Performance
Stock Performance in US$ (%)
Year Q1 Q2 Q3 Q4 Year
2007 102.3 27.0 -4.3 4.5 157.0 1.7 158.7
2008 -12.9 29.6 -40.1 -14.6 -42.3 2.5 -39.8
2009 -15.8 117.1 84.4 46.7 394.5 2.7 397.2
2010 16.5 33.0 64.8 13.6 189.8 3.1 192.9
2011 13.4 24.6 -26.4 2.8 7.0 3.2 10.2
2012 48.5 -27.0 19.7 -9.2 17.8 3.8 21.6
2013 -12.7 -20.9 6.7 -16.1 -38.2 2.8 -35.4
2014 -4.3 -16.8 0.3 -24.8 -39.9 4.4 -35.5
2015 -32.6 -23.8 -9.8 9.0 -49.5 5.8 -43.7
2016 8.0 11.6 19.5 -16.1 20.8 6.4 27.3
2017 21.8 5.3 50.9 -14.1 66.3 4.8 71.1
5 yr avg -4.0 -8.9 13.5 -12.4 -8.1 4.8 -3.3
10 yr avg 3.0 13.3 17.0 -2.3 52.6 4.0 56.6
Dividend
Yield
Total
Return
Source: Factset
Figure 77: Cia Hering Relative to Bovespa Index Figure 78: Cia Hering Relative to MSCI Brazil
Year Q1 Q2 Q3 Q4 Year
2007 94.8 0.9 -20.6 -4.8 84.7
2008 -10.1 12.4 -3.0 22.7 12.9
2009 -26.2 69.4 52.9 32.7 250.1
2010 16.3 47.2 43.6 11.7 183.7
2011 12.4 29.9 3.1 -5.1 34.1
2012 32.3 -3.1 11.4 -11.3 20.0
2013 -6.6 2.3 -2.8 -9.0 -11.5
2014 -6.6 -24.8 8.8 -9.9 -26.1
2015 -17.7 -30.5 24.0 12.1 -7.8
2016 -20.9 -2.3 7.8 -19.1 -48.0
2017 11.2 12.6 27.2 -12.2 39.3
5 yr avg -8.1 -8.6 13.0 -7.6 -10.8
10 yr avg -1.6 11.3 17.3 1.3 44.7
Year Q1 Q2 Q3 Q4 Year
2007 96.8 4.2 -24.3 -8.3 81.7
2008 -7.3 12.0 -1.9 23.6 15.4
2009 -27.7 77.9 57.7 34.6 273.2
2010 17.0 49.0 43.8 10.9 186.0
2011 11.4 29.9 1.3 -4.8 31.8
2012 35.5 -7.0 15.3 -11.4 21.3
2013 -11.4 -2.5 -1.0 -9.9 -19.5
2014 -6.2 -22.5 9.5 -9.2 -22.5
2015 -17.1 -29.9 24.3 13.3 -6.1
2016 -19.4 -1.7 8.8 -17.0 -40.5
2017 12.1 12.7 28.5 -11.3 49.0
5 yr avg -8.4 -8.8 14.0 -6.8 -7.9
10 yr avg -1.3 11.8 18.6 1.9 48.8
Source:Factset Source: Factset
Deutsche Bank Securities Inc. Page 33

21 January 2018
Beverages
Latam Consumer Monthly
Finally, Arezzo (a relative newcomer) was the best performer of the year, afterposting a return of 118%. It also gained a position among the top-5 performingstocks over a 5-year period.
Figure 79: Arezzo Stock Performance
Stock Performance in US$ (%)
Year Q1 Q2 Q3 Q4 Year
2012 39.9 -14.9 21.7 7.2 55.3 1.0 56.3
2013 4.5 -23.8 14.6 -28.4 -34.7 2.1 -32.6
2014 -3.4 17.5 -16.8 -14.9 -19.6 2.4 -17.2
2015 -24.3 0.6 -35.3 6.2 -47.7 4.2 -43.5
2016 24.1 26.9 -3.6 -4.5 45.1 3.3 48.4
2017 28.4 -0.1 60.1 4.3 114.2 3.8 117.9
5 yr avg 5.9 4.2 3.8 -7.4 11.5 3.1 14.6
Dividend
Yield
Total
Return
Source: Factset
Figure 80: Arezzo Relative to Bovespa Index Figure 81: Arezzo Relative to MSCI Brazil
Year Q1 Q2 Q3 Q4 Year
2012 23.7 9.0 13.3 5.1 57.5
2013 10.6 -0.7 5.1 -21.2 -8.1
2014 -5.7 9.5 -8.3 -0.1 -5.7
2015 -9.3 -6.1 -1.6 9.4 -5.9
2016 -4.8 13.0 -15.3 -7.5 -23.8
2017 17.8 7.1 36.4 6.3 87.2
5 yr avg 1.7 4.6 3.3 -2.6 8.7
Year Q1 Q2 Q3 Q4 Year
2012 26.9 5.1 17.3 5.0 58.8
2013 5.8 -5.5 6.9 -22.1 -16.0
2014 -5.3 11.8 -7.5 0.7 -2.2
2015 -8.8 -5.5 -1.3 10.6 -4.2
2016 -3.3 13.6 -14.3 -5.4 -16.3
2017 18.6 7.2 37.7 7.1 96.9
5 yr avg 1.4 4.3 4.3 -1.8 11.6
Source: Factset Source: Factset
Page 34 Deutsche Bank Securities Inc.

21 January 2018
Beverages
Latam Consumer Monthly
(F) Second-tier Mexican food retailers stuck in neutral
In Mexico, the second-tier food retailers have generally delivered disappointingreturns, and 2017 was no exception. Soriana’s total return has been negative forthe past five years and it continues to underperform the Mexican indices over thepast 5, 10 and 20 years.
Figure 82: Soriana Stock Performance
Stock Performance in US$ (%)
Year Q1 Q2 Q3 Q4 Year
2007 35.9 7.4 -2.9 -15.2 20.2 0.0 20.2
2008 11.3 18.1 -18.5 -26.4 -21.1 0.0 -21.1
2009 -22.6 39.8 9.8 1.8 21.0 0.6 21.6
2010 19.0 -15.0 9.7 15.4 28.0 0.0 28.0
2011 10.8 -15.9 -31.4 17.0 -25.3 0.8 -24.4
2012 20.3 8.0 4.3 16.5 58.0 0.0 58.0
2013 3.2 -4.8 -13.4 9.9 -6.4 0.8 -5.6
2014 -13.3 8.3 -0.1 -18.0 -23.1 0.0 -23.1
2015 -6.7 -12.1 -5.0 7.4 -16.4 0.0 -16.4
2016 4.5 -1.8 5.7 -12.0 -4.5 0.0 -4.5
2017 7.0 0.0 -1.0 -11.9 -6.6 0.0 -6.6
5 yr avg -1.0 -2.1 -2.7 -4.9 -11.4 0.2 -11.2
10 yr avg 3.4 2.5 -4.0 0.0 0.4 0.2 0.6
20 yr avg 4.5 2.8 -4.6 5.5 6.0 0.3 6.3
Dividend
Yield
Total
Return
Source:Factset
Figure 83: Soriana Relative to Bolsa Index Figure 84: Soriana Relative to MSCI Mexico
Year Q1 Q2 Q3 Q4 Year
2007 29.1 -3.2 1.1 -12.9 9.4
2008 4.2 19.7 2.1 2.3 19.2
2009 -8.7 6.9 -7.2 -11.9 -31.3
2010 9.3 -4.6 -0.3 -2.1 1.0
2011 10.2 -15.1 -9.1 7.3 -10.3
2012 4.2 11.0 -1.8 10.6 31.3
2013 -2.9 7.9 -11.3 3.1 -3.3
2014 -8.3 2.0 -1.7 -5.4 -12.8
2015 -4.8 -12.1 7.4 8.4 -1.4
2016 -3.1 5.2 7.7 -2.8 6.4
2017 -9.3 -6.9 -1.6 -2.9 -14.8
5 yr avg -5.7 -0.8 0.1 0.1 -5.2
10 yr avg -0.9 1.4 -1.6 0.7 -1.6
20 yr avg -1.2 1.0 -1.6 -0.8 -5.6
Year Q1 Q2 Q3 Q4 Year
2007 30.1 -4.6 1.8 -11.9 10.9
2008 6.3 23.6 0.7 3.8 22.9
2009 -8.5 5.2 -7.8 -10.7 -32.1
2010 11.3 -5.5 -1.5 -0.9 2.0
2011 10.3 -14.6 -11.4 7.9 -11.8
2012 4.9 9.9 -2.1 11.1 30.9
2013 -2.7 6.9 -11.4 3.0 -4.4
2014 -8.2 2.0 -1.9 -5.4 -12.8
2015 -4.6 -11.9 7.6 9.0 -0.4
2016 -3.7 5.8 8.3 -3.6 6.2
2017 -8.7 -6.2 -2.1 -3.3 -20.1
5 yr avg -5.6 -0.7 0.1 -0.1 -6.3
10 yr avg -0.4 1.5 -2.1 1.1 -1.9
20 yr avg -0.9 1.1 -1.8 0.1 -4.7
Source:Factset Source:Factset
Deutsche Bank Securities Inc. Page 35

21 January 2018
Beverages
Latam Consumer Monthly
Finally Chedraui, a relative newcomer (at least as a listed name), had done only abit better than Soriana in its short history. In 2017, Chedraui recovered showed atotal return of 2.7% but underperformed the Mexico MSCI Index by 11%.
Figure 85: Chedraui Stock Performance
Stock Performance in US$ (%)
Year Q1 Q2 Q3 Q4 Year
2011 5.7 -2.2 -23.0 3.7 -17.4 0.6 -16.7
2012 3.6 2.5 -4.6 27.0 28.6 0.6 29.2
2013 4.8 8.5 -14.4 11.9 8.9 0.0 8.9
2014 -16.9 19.5 0.8 -18.7 -18.5 0.6 -17.9
2015 5.6 -6.1 -8.6 2.3 -7.3 0.6 -6.8
2016 20.6 -22.8 -11.6 -17.7 -32.3 0.0 -32.3
2017 18.8 -4.1 -2.4 -7.9 2.3 0.3 2.7
5 yr avg 6.6 -1.0 -7.2 -6.0 -9.4 0.3 -9.1
Dividend
Yield
Total
Return
Source:Factset
Figure 86: Chedraui Relative to Bolsa Index Figure 87: Chedraui Relative to MSCI Mexico
Year Q1 Q2 Q3 Q4 Year
2011 5.1 -1.3 -0.7 -6.0 -2.4
2012 -12.5 5.5 -10.8 21.1 2.0
2013 -1.4 21.2 -12.3 5.0 12.0
2014 -11.9 13.2 -0.8 -6.0 -8.2
2015 7.5 -6.1 3.8 3.4 7.7
2016 13.0 -15.8 -9.6 -8.5 -21.3
2017 2.5 -11.0 -3.1 1.1 -5.8
5 yr avg 1.9 0.3 -4.4 -1.0 -3.1
Year Q1 Q2 Q3 Q4 Year
2011 5.2 -0.9 -3.0 -5.3 -3.9
2012 -11.8 4.4 -11.1 21.6 1.6
2013 -1.1 20.2 -12.4 4.9 10.9
2014 -11.8 13.3 -1.0 -6.1 -8.3
2015 7.6 -5.9 4.0 4.0 8.7
2016 12.3 -15.2 -9.0 -9.3 -21.5
2017 3.1 -10.3 -3.5 0.7 -11.1
5 yr avg 2.0 0.4 -4.4 -1.2 -4.3
Source:Factset Source:Factset
Page 36 Deutsche Bank Securities Inc.

21 January 2018
Beverages
Latam Consumer Monthly
(G) Colombia-based Exito still recovering
Considering the economic headwinds it faced in 2017, Colombia’s AlmacenesExito delivered a satisfactory return in 2017 and still has a long way to recoverfrom the large stumble in 2015 that resulted from a corporate action initiated byits parent company Casino (through which Exito acquired control of CBD in Brazil)put a dent on the stock’s long-term performance.
On a 10-year basis average returns remain solid, but as the explosive growth in theearly years of this period begin to drop off the average calculation, it has droppedin magnitude to the 9% level.
Figure 88: Exito Stock Performance
Stock Performance in US$ (%)
Year Q1 Q2 Q3 Q4 Year
2007 19.8 -15.8 3.0 14.8 19.3 1.8 21.0
2008 -8.0 -14.6 -24.6 -10.0 -46.7 2.6 -44.1
2009 -5.6 53.8 24.0 17.3 111.2 1.2 112.5
2010 -5.2 3.8 32.3 -2.1 27.5 1.0 28.5
2011 19.9 -5.3 -13.9 10.4 7.9 1.2 9.1
2012 10.0 14.5 -1.0 22.6 53.0 1.2 54.2
2013 -10.1 -8.2 3.3 -9.3 -22.7 1.8 -20.9
2014 -2.9 11.5 -12.7 -16.3 -20.9 1.8 -19.1
2015 -21.7 -9.2 -50.9 -1.0 -65.4 4.3 -61.1
2016 22.8 -6.5 4.6 -2.8 16.7 4.5 21.2
2017 6.7 -5.2 4.8 5.4 11.8 1.0 12.8
5 yr avg -1.1 -3.5 -10.2 -4.8 -16.1 2.7 -13.4
10 yr avg 0.6 3.5 -3.4 1.4 7.2 2.1 9.3
Dividend
Yield
Total
Return
Source:Factset
Figure 89: Exito Relative to Colombia IGBC Figure 90: Exito Relative to MSCI Colombia
Year Q1 Q2 Q3 Q4 Year
2007 22.5 -27.8 8.1 12.0 12.9
2008 -0.4 -12.8 -12.6 10.6 -10.1
2009 0.9 7.7 -2.9 20.0 42.3
2010 -16.3 0.8 6.6 -0.9 -14.7
2011 24.1 -7.9 1.7 12.8 27.0
2012 -18.1 24.7 -4.9 15.9 25.5
2013 -3.0 5.9 -7.8 -1.0 -3.9
2014 -6.7 4.9 -2.8 11.1 6.8
2015 -0.3 -12.1 -26.8 9.5 -20.4
2016 0.7 -8.6 2.7 -1.2 -8.3
2017 2.5 -6.8 -1.2 3.6 -1.8
5 yr avg -1.4 -3.3 -7.2 4.4 -5.5
10 yr avg -1.7 -0.4 -4.8 8.0 4.2
Year Q1 Q2 Q3 Q4 Year
2007 25.8 -32.7 4.0 11.3 6.6
2008 -3.3 -17.5 -15.4 8.8 -19.0
2009 4.9 3.7 -10.3 19.4 34.7
2010 -15.3 0.9 0.7 3.6 -13.3
2011 19.9 -10.5 -0.9 8.8 15.0
2012 -7.8 17.1 -3.1 10.3 21.4
2013 -3.3 6.9 -5.8 2.3 0.9
2014 -7.6 5.8 -4.0 6.8 1.4
2015 -2.1 -10.7 -27.3 9.0 -21.5
2016 0.8 -8.8 2.4 0.0 -7.2
2017 1.4 -6.9 -1.1 5.1 -1.9
5 yr avg -2.2 -2.7 -7.2 4.7 -5.6
10 yr avg -1.2 -2.0 -6.5 7.4 1.1
Source:Factset Source:Factset
Deutsche Bank Securities Inc. Page 37

21 January 2018
Beverages
Latam Consumer Monthly
(H) Cosmetics/HPC remains resilient
Natura, despite a pull back in 2Q17, managed to post its best performance since2012, riding the wave of investor optimism on Brazil discretionary consumerdemand. In 2017, it was among top-10 best performers in the Latam Consumerspace and also outperformed the Brazilian MSCI Index by impressive 24%.
Longer term, NATU3 is still showing high-teens returns over a 10-year time frame(but negative in the last five).
Figure 91: Natura Stock Performance
Stock Performance in US$ (%)
Year Q1 Q2 Q3 Q4 Year
2007 -19.7 28.2 -17.8 -20.1 -32.4 5.7 -26.7
2008 7.2 1.3 -7.6 -15.1 -14.7 6.1 -8.6
2009 20.8 34.1 35.9 16.1 155.8 3.8 159.6
2010 -2.9 9.7 21.0 7.0 37.9 3.5 41.4
2011 -1.6 -11.7 -30.9 12.8 -32.3 5.3 -27.0
2012 11.9 7.0 17.0 5.2 47.3 3.4 50.7
2013 -14.5 -11.8 3.0 -21.1 -38.8 4.8 -33.9
2014 -3.7 0.0 -10.7 -20.6 -31.7 5.2 -26.5
2015 -29.8 5.3 -44.8 21.2 -50.4 3.6 -46.9
2016 26.1 6.3 20.8 -26.4 19.1 1.2 20.3
2017 29.2 -15.1 27.2 1.0 40.9 1.8 42.7
5 yr avg 1.5 -3.1 -0.9 -9.2 -12.2 3.3 -8.9
10 yr avg 4.3 2.5 3.1 -2.0 13.3 3.9 17.2
Dividend
Yield
Total
Return
Source:Factset
Figure 92: Natura Relative to Bovespa Figure 93: Natura Relative to MSCI Brazil
Year Q1 Q2 Q3 Q4 Year
2007 -27.2 2.1 -34.1 -29.3 -104.7
2008 10.0 -15.9 29.6 22.2 40.4
2009 10.4 -13.6 4.4 2.2 11.4
2010 -3.1 24.0 -0.2 5.1 31.8
2011 -2.6 -6.5 -1.5 4.8 -5.2
2012 -4.3 30.8 8.6 3.1 49.5
2013 -8.4 11.3 -6.5 -14.0 -12.1
2014 -6.0 -7.9 -2.3 -5.8 -17.8
2015 -14.8 -1.4 -11.0 24.4 -8.7
2016 -2.8 -7.6 9.1 -29.4 -49.8
2017 18.6 -7.9 3.4 3.0 14.0
5 yr avg -2.7 -2.7 -1.4 -4.4 -14.9
10 yr avg -0.3 0.5 3.4 1.6 5.4
Year Q1 Q2 Q3 Q4 Year
2007 -25.2 5.4 -37.8 -32.8 -107.7
2008 12.8 -16.3 30.7 23.1 42.9
2009 8.9 -5.1 9.3 4.0 34.5
2010 -2.4 25.7 0.0 4.3 34.1
2011 -3.5 -6.4 -3.2 5.1 -7.5
2012 -1.1 27.0 12.6 2.9 50.8
2013 -13.2 6.6 -4.7 -14.9 -20.1
2014 -5.6 -5.6 -1.5 -5.1 -14.3
2015 -14.3 -0.8 -10.7 25.6 -7.0
2016 -1.3 -7.0 10.0 -27.4 -42.2
2017 19.4 -7.8 4.8 3.8 23.6
5 yr avg -3.0 -2.9 -0.4 -3.6 -12.0
10 yr avg 0.0 1.0 4.7 2.2 9.5
Source:Factset Source:Factset
Page 38 Deutsche Bank Securities Inc.

21 January 2018
Beverages
Latam Consumer Monthly
Finally, Kimberly-Clark de Mexico (KCM) had amediocre year on the back of risinginput costs (e.g. fiber and electricity prices), along with a weaker MXN. Thecompany’s dividend yields remain the most consistent among Latin Consumernames, but a bruising price war in 2014 and a weak MXN in 2016 & 2017 tookaway some of its historical consistency in terms of stock returns.
Figure 94: KCM Stock Performance
Stock Performance in US$ (%)
Year Q1 Q2 Q3 Q4 Year
2007 -1.5 -3.8 4.8 -3.7 -4.5 5.3 0.8
2008 1.0 -8.0 5.4 -23.4 -25.0 5.9 -19.1
2009 -1.1 17.8 9.4 7.0 36.4 4.9 41.3
2010 26.8 2.0 10.4 -4.1 36.9 4.2 41.1
2011 0.8 6.1 -21.5 4.6 -12.2 4.5 -7.6
2012 23.4 -12.0 22.5 6.1 41.2 3.6 44.8
2013 37.7 -8.0 -9.9 -2.2 11.5 3.6 15.1
2014 -5.4 4.5 -15.7 -7.8 -23.1 4.4 -18.7
2015 -3.6 3.0 4.4 3.6 7.4 1.8 9.2
2016 3.8 -3.6 -3.1 -20.0 -22.5 4.1 -18.4
2017 19.0 -1.7 -3.8 -13.2 -2.3 4.6 2.3
5 yr avg 10.3 -1.2 -5.6 -7.9 -5.8 3.7 -2.1
10 yr avg 10.2 0.0 -0.2 -4.9 4.8 4.2 9.0
20 yr avg 5.7 -1.6 -1.9 2.1 3.7 4.6 8.3
Dividend
Yield
Total
Return
Source: Factset
Figure 95: KCM Relative to Bolsa Index Figure 96: KCM Relative to MSCI Mexico
Year Q1 Q2 Q3 Q4 Year
2007 -8.4 -14.4 8.8 -1.4 -15.2
2008 -6.1 -6.5 26.0 5.3 15.3
2009 12.8 -15.1 -7.6 -6.7 -15.9
2010 17.1 12.4 0.4 -21.6 9.8
2011 0.2 7.0 0.8 -5.1 2.8
2012 7.3 -9.0 16.4 0.2 14.5
2013 31.5 4.7 -7.8 -9.1 14.6
2014 -0.4 -1.8 -17.3 4.8 -12.8
2015 -1.6 2.9 16.7 4.7 22.4
2016 -3.8 3.3 -1.0 -10.8 -11.5
2017 2.7 -8.5 -4.5 -4.2 -10.4
5 yr avg 5.7 0.1 -2.8 -2.9 0.4
10 yr avg 6.0 -1.1 2.2 -4.2 2.9
20 yr avg 0.0 -3.3 1.1 -4.1 -8.0
Year Q1 Q2 Q3 Q4 Year
2007 -7.3 -15.8 9.4 -0.5 -13.7
2008 -4.0 -2.6 24.6 6.8 19.0
2009 12.9 -16.8 -8.2 -5.5 -16.7
2010 19.1 11.4 -0.8 -20.4 10.9
2011 0.3 7.4 -1.5 -4.4 1.3
2012 8.0 -10.1 16.0 0.7 14.1
2013 31.8 3.7 -7.9 -9.2 13.5
2014 -0.3 -1.8 -17.5 4.8 -12.9
2015 -1.5 3.2 16.9 5.2 23.3
2016 -4.5 3.9 -0.4 -11.6 -11.7
2017 3.3 -7.8 -5.0 -4.6 -15.7
5 yr avg 5.7 0.2 -2.8 -3.1 -0.7
10 yr avg 6.5 -0.9 1.6 -3.8 2.5
20 yr avg 0.4 -3.2 0.9 -3.3 -7.1
Source:Factset Source:Factset
Deutsche Bank Securities Inc. Page 39
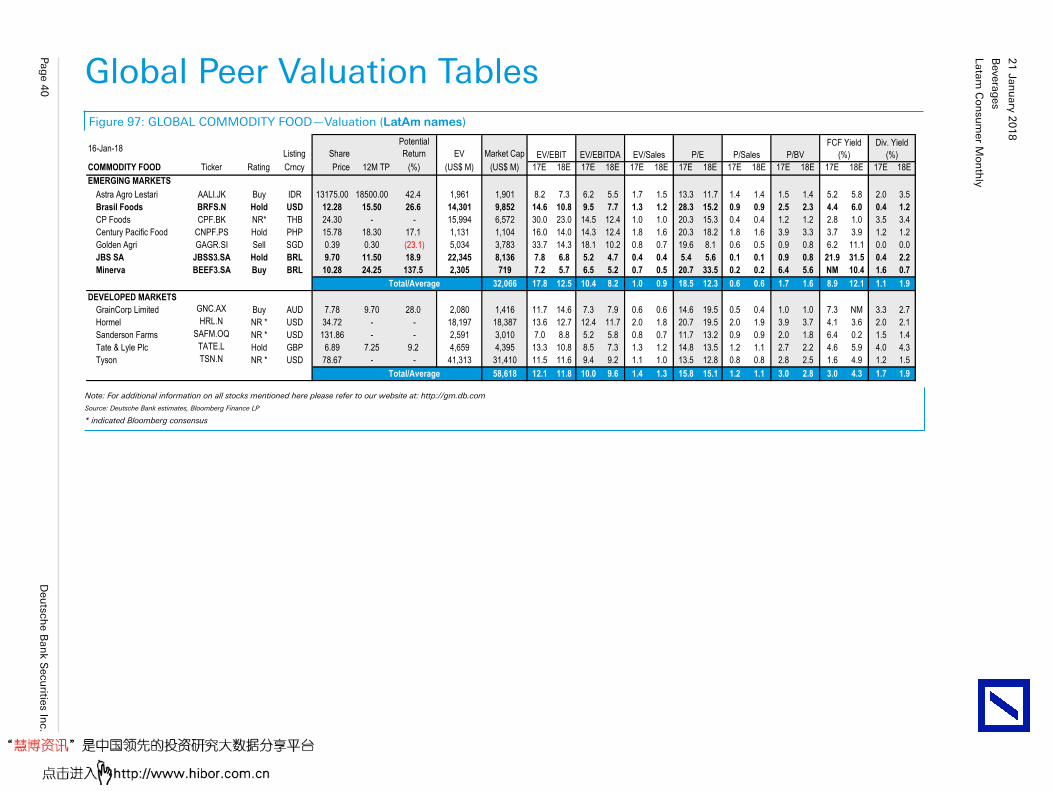
Pag
e 40
Deu
tsche B
ank S
ecurities In
c.
Global Peer Valuation TablesFigure 97: GLOBAL COMMODITY FOOD—Valuation (LatAm names)
16-Jan-18Listing Share
Potential
Return EV Market Cap
COMMODITY FOOD Ticker Rating Crncy Price 12M TP (%) (US$ M) (US$ M) 17E 18E 17E 18E 17E 18E 17E 18E 17E 18E 17E 18E 17E 18E 17E 18E
EMERGING MARKETS
Astra Agro Lestari AALI.JK Buy IDR 13175.00 18500.00 42.4 1,961 1,901 8.2 7.3 6.2 5.5 1.7 1.5 13.3 11.7 1.4 1.4 1.5 1.4 5.2 5.8 2.0 3.5
Brasil Foods BRFS.N Hold USD 12.28 15.50 26.6 14,301 9,852 14.6 10.8 9.5 7.7 1.3 1.2 28.3 15.2 0.9 0.9 2.5 2.3 4.4 6.0 0.4 1.2
CP Foods CPF.BK NR* THB 24.30 - - 15,994 6,572 30.0 23.0 14.5 12.4 1.0 1.0 20.3 15.3 0.4 0.4 1.2 1.2 2.8 1.0 3.5 3.4
Century Pacific Food CNPF.PS Hold PHP 15.78 18.30 17.1 1,131 1,104 16.0 14.0 14.3 12.4 1.8 1.6 20.3 18.2 1.8 1.6 3.9 3.3 3.7 3.9 1.2 1.2
Golden Agri GAGR.SI Sell SGD 0.39 0.30 (23.1) 5,034 3,783 33.7 14.3 18.1 10.2 0.8 0.7 19.6 8.1 0.6 0.5 0.9 0.8 6.2 11.1 0.0 0.0
JBS SA JBSS3.SA Hold BRL 9.70 11.50 18.9 22,345 8,136 7.8 6.8 5.2 4.7 0.4 0.4 5.4 5.6 0.1 0.1 0.9 0.8 21.9 31.5 0.4 2.2
Minerva BEEF3.SA Buy BRL 10.28 24.25 137.5 2,305 719 7.2 5.7 6.5 5.2 0.7 0.5 20.7 33.5 0.2 0.2 6.4 5.6 NM 10.4 1.6 0.7
Total/Average 32,066 17.8 12.5 10.4 8.2 1.0 0.9 18.5 12.3 0.6 0.6 1.7 1.6 8.9 12.1 1.1 1.9
DEVELOPED MARKETS
GrainCorp Limited GNC.AX Buy AUD 7.78 9.70 28.0 2,080 1,416 11.7 14.6 7.3 7.9 0.6 0.6 14.6 19.5 0.5 0.4 1.0 1.0 7.3 NM 3.3 2.7
Hormel HRL.N NR * USD 34.72 - - 18,197 18,387 13.6 12.7 12.4 11.7 2.0 1.8 20.7 19.5 2.0 1.9 3.9 3.7 4.1 3.6 2.0 2.1
Sanderson Farms SAFM.OQ NR * USD 131.86 - - 2,591 3,010 7.0 8.8 5.2 5.8 0.8 0.7 11.7 13.2 0.9 0.9 2.0 1.8 6.4 0.2 1.5 1.4
Tate & Lyle Plc TATE.L Hold GBP 6.89 7.25 9.2 4,659 4,395 13.3 10.8 8.5 7.3 1.3 1.2 14.8 13.5 1.2 1.1 2.7 2.2 4.6 5.9 4.0 4.3
Tyson TSN.N NR * USD 78.67 - - 41,313 31,410 11.5 11.6 9.4 9.2 1.1 1.0 13.5 12.8 0.8 0.8 2.8 2.5 1.6 4.9 1.2 1.5
Total/Average 58,618 12.1 11.8 10.0 9.6 1.4 1.3 15.8 15.1 1.2 1.1 3.0 2.8 3.0 4.3 1.7 1.9
P/BV
FCF Yield
(%)
Div. Yield
(%)P/SalesEV/EBIT EV/EBITDA EV/Sales P/E
Note: For additional information on all stocks mentioned here please refer to our website at: http://gm.db.com
Source: Deutsche Bank estimates, Bloomberg Finance LP
* indicated Bloomberg consensus
21
Janu
ary 201
8
Beverag
es
Latam C
on
sum
er Mo
nth
ly

Deu
tsche B
ank S
ecurities In
c.Pag
e 41
Figure 98: GLOBAL COMMODITY FOOD—Operating Indicators (LatAm)
16-Jan-18
COMMODITY FOOD 16A 17E 18E 16A 17E 18E 16A 17E 18E 15A 16A 17E 18E 15A 16A 17E 18E 15A 16A 17E 18E 15A 16A 17E 18E 15A 16A 17E 18E
EMERGING MARKETS
Astra Agro Lestari 1,062 1,179 1,251 275 316 349 25.9 26.8 27.9 -45.2 32.7 14.8 10.4 -78.1 NA 4.0 12.0 5.5 14.1 11.8 12.4 6.3 12.6 10.3 11.1 2.7x 1.0x 0.7x 0.5x
Brasil Foods 9,774 11,303 11,726 1,104 1,505 1,791 11.3 13.3 15.3 -14.9 -34.8 36.3 19.0 2.1 -87.2 NA 81.8 21.4 2.8 8.4 15.6 22.1 7.1 9.8 13.2 1.6x 3.1x 2.4x 2.2x
CP Foods 13,107 15,636 16,800 1,212 1,116 1,310 9.2 7.1 7.8 4.8 43.2 -7.9 17.3 -4.3 22.6 -27.5 32.4 17.1 11.6 19.1 19.5 NA NA NA NA 6.1x 5.5x 6.8x 5.9x
Century Pacific Food 596 629 688 79 80 89 13.3 12.7 12.9 21.9 27.6 0.7 11.2 -1.2 24.8 -0.6 11.0 22.8 23.2 20.6 19.8 22.0 19.6 18.7 19.6 0.5x 0.4x 0.1x -0.3x
Golden Agri 7,209 6,380 7,084 525 278 465 7.3 4.4 6.6 -4.0 8.6 -47.0 67.1 NA NA -60.3 NA 0.0 12.0 4.5 10.4 2.3 7.3 4.5 10.0 5.8x 5.6x 9.9x 5.3x
JBS SA 48,867 50,500 52,664 3,221 4,314 4,798 6.6 8.5 9.1 -12.6 -16.1 33.9 11.2 61.1 -92.0 NA NA 17.9 1.5 8.2 14.6 8.7 13.8 8.7 9.8 3.7x 4.2x 3.1x 2.5x
Minerva 2,767 3,504 4,135 284 361 438 10.3 10.3 10.6 10.2 -7.2 27.2 21.3 35.1 NA -29.4 -39.5 NA NA 27.1 17.9 25.4 17.5 15.9 18.1 4.2x 3.5x 4.2x 3.3x
Total/Average 83,382 89,132 94,348 6,700 7,970 9,238 8.0 8.9 9.8 -8.4 -5.6 20.3 17.9 8.2 -23.5 -6.5 41.9 15.0 4.4 10.8 15.5 8.5 10.4 7.4 9.0
DEVELOPED MARKETS
GrainCorp Limited 3,092 3,506 5,956 190 299 421 6.1 8.5 7.1 -33.1 7.5 57.4 40.8 -46.9 -4.9 NA 27.3 2.5 3.0 7.9 5.1 2.4 3.3 6.5 4.7 3.2x 3.4x 1.8x 1.6x
Hormel 9,523 9,116 9,886 1,457 1,401 1,469 15.3 15.4 14.9 16.9 16.9 -3.9 4.9 18.4 21.9 -3.0 7.0 17.4 18.0 18.2 18.1 15.8 18.8 NA NA 0.1x -0.1x -0.2x 0.2x
Sanderson Farms 3,134 3,335 3,465 379 538 496 12.1 16.1 14.3 -8.0 -7.8 42.0 -7.7 -11.8 -12.1 50.1 -10.4 22.0 16.8 21.2 16.2 21.9 16.9 NA NA -0.5x -0.6x -0.8x -0.7x
Tate & Lyle Plc 3,179 3,545 3,666 409 532 622 12.9 15.0 17.0 -26.9 -24.8 30.0 17.0 -89.7 NA 48.7 -2.9 3.0 16.6 21.7 17.4 13.5 14.9 19.5 15.5 1.6x 1.4x 1.0x 0.8x
Tyson 36,881 38,039 40,558 3,583 3,960 4,411 9.7 10.4 10.9 29.5 19.1 10.5 11.4 9.4 39.0 17.2 11.2 13.1 18.3 19.1 19.5 8.2 12.0 NA NA 2.1x 1.7x 2.5x 2.0x
Total/Average 55,810 57,540 63,531 6,018 6,729 7,419 10.8 11.7 11.7 18.4 14.1 14.1 12.4 -39.3 1.8 45.9 -2.6 12.6 17.2 18.6 17.6 9.8 13.1 1.6 1.3
Sales (USDm) EBITDA (USDm) EBITDA Margin (%) EBITDA Growth (%) EPS Growth (%) ROE (%) ROIC (%) Net Debt/ EBITDA
Note: For additional information on all stocks mentioned here please refer to our website at: http://gm.db.com
Source: Company reports and Deutsche Bank estimates
21
Janu
ary 201
8
Beverag
es
Latam C
on
sum
er Mo
nth
ly
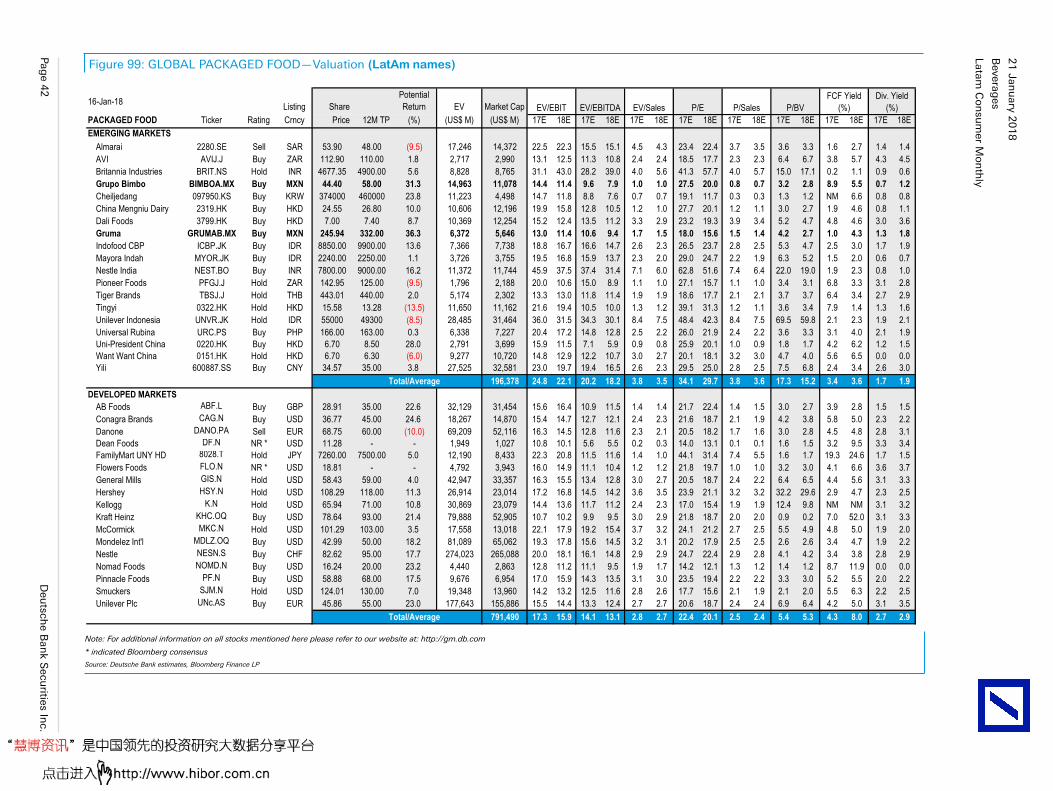
Pag
e 42
Deu
tsche B
ank S
ecurities In
c.
Figure 99: GLOBAL PACKAGED FOOD—Valuation (LatAm names)
16-Jan-18Listing Share
Potential
Return EV Market Cap
PACKAGED FOOD Ticker Rating Crncy Price 12M TP (%) (US$ M) (US$ M) 17E 18E 17E 18E 17E 18E 17E 18E 17E 18E 17E 18E 17E 18E 17E 18E
EMERGING MARKETS
Almarai 2280.SE Sell SAR 53.90 48.00 (9.5) 17,246 14,372 22.5 22.3 15.5 15.1 4.5 4.3 23.4 22.4 3.7 3.5 3.6 3.3 1.6 2.7 1.4 1.4
AVI AVIJ.J Buy ZAR 112.90 110.00 1.8 2,717 2,990 13.1 12.5 11.3 10.8 2.4 2.4 18.5 17.7 2.3 2.3 6.4 6.7 3.8 5.7 4.3 4.5
Britannia Industries BRIT.NS Hold INR 4677.35 4900.00 5.6 8,828 8,765 31.1 43.0 28.2 39.0 4.0 5.6 41.3 57.7 4.0 5.7 15.0 17.1 0.2 1.1 0.9 0.6
Grupo Bimbo BIMBOA.MX Buy MXN 44.40 58.00 31.3 14,963 11,078 14.4 11.4 9.6 7.9 1.0 1.0 27.5 20.0 0.8 0.7 3.2 2.8 8.9 5.5 0.7 1.2
Cheiljedang 097950.KS Buy KRW 374000 460000 23.8 11,223 4,498 14.7 11.8 8.8 7.6 0.7 0.7 19.1 11.7 0.3 0.3 1.3 1.2 NM 6.6 0.8 0.8
China Mengniu Dairy 2319.HK Buy HKD 24.55 26.80 10.0 10,606 12,196 19.9 15.8 12.8 10.5 1.2 1.0 27.7 20.1 1.2 1.1 3.0 2.7 1.9 4.6 0.8 1.1
Dali Foods 3799.HK Buy HKD 7.00 7.40 8.7 10,369 12,254 15.2 12.4 13.5 11.2 3.3 2.9 23.2 19.3 3.9 3.4 5.2 4.7 4.8 4.6 3.0 3.6
Gruma GRUMAB.MX Buy MXN 245.94 332.00 36.3 6,372 5,646 13.0 11.4 10.6 9.4 1.7 1.5 18.0 15.6 1.5 1.4 4.2 2.7 1.0 4.3 1.3 1.8
Indofood CBP ICBP.JK Buy IDR 8850.00 9900.00 13.6 7,366 7,738 18.8 16.7 16.6 14.7 2.6 2.3 26.5 23.7 2.8 2.5 5.3 4.7 2.5 3.0 1.7 1.9
Mayora Indah MYOR.JK Buy IDR 2240.00 2250.00 1.1 3,726 3,755 19.5 16.8 15.9 13.7 2.3 2.0 29.0 24.7 2.2 1.9 6.3 5.2 1.5 2.0 0.6 0.7
Nestle India NEST.BO Buy INR 7800.00 9000.00 16.2 11,372 11,744 45.9 37.5 37.4 31.4 7.1 6.0 62.8 51.6 7.4 6.4 22.0 19.0 1.9 2.3 0.8 1.0
Pioneer Foods PFGJ.J Hold ZAR 142.95 125.00 (9.5) 1,796 2,188 20.0 10.6 15.0 8.9 1.1 1.0 27.1 15.7 1.1 1.0 3.4 3.1 6.8 3.3 3.1 2.8
Tiger Brands TBSJ.J Hold THB 443.01 440.00 2.0 5,174 2,302 13.3 13.0 11.8 11.4 1.9 1.9 18.6 17.7 2.1 2.1 3.7 3.7 6.4 3.4 2.7 2.9
Tingyi 0322.HK Hold HKD 15.58 13.28 (13.5) 11,650 11,162 21.6 19.4 10.5 10.0 1.3 1.2 39.1 31.3 1.2 1.1 3.6 3.4 7.9 1.4 1.3 1.6
Unilever Indonesia UNVR.JK Hold IDR 55000 49300 (8.5) 28,485 31,464 36.0 31.5 34.3 30.1 8.4 7.5 48.4 42.3 8.4 7.5 69.5 59.8 2.1 2.3 1.9 2.1
Universal Rubina URC.PS Buy PHP 166.00 163.00 0.3 6,338 7,227 20.4 17.2 14.8 12.8 2.5 2.2 26.0 21.9 2.4 2.2 3.6 3.3 3.1 4.0 2.1 1.9
Uni-President China 0220.HK Buy HKD 6.70 8.50 28.0 2,791 3,699 15.9 11.5 7.1 5.9 0.9 0.8 25.9 20.1 1.0 0.9 1.8 1.7 4.2 6.2 1.2 1.5
Want Want China 0151.HK Hold HKD 6.70 6.30 (6.0) 9,277 10,720 14.8 12.9 12.2 10.7 3.0 2.7 20.1 18.1 3.2 3.0 4.7 4.0 5.6 6.5 0.0 0.0
Yili 600887.SS Buy CNY 34.57 35.00 3.8 27,525 32,581 23.0 19.7 19.4 16.5 2.6 2.3 29.5 25.0 2.8 2.5 7.5 6.8 2.4 3.4 2.6 3.0
Total/Average 196,378 24.8 22.1 20.2 18.2 3.8 3.5 34.1 29.7 3.8 3.6 17.3 15.2 3.4 3.6 1.7 1.9
DEVELOPED MARKETS
AB Foods ABF.L Buy GBP 28.91 35.00 22.6 32,129 31,454 15.6 16.4 10.9 11.5 1.4 1.4 21.7 22.4 1.4 1.5 3.0 2.7 3.9 2.8 1.5 1.5
Conagra Brands CAG.N Buy USD 36.77 45.00 24.6 18,267 14,870 15.4 14.7 12.7 12.1 2.4 2.3 21.6 18.7 2.1 1.9 4.2 3.8 5.8 5.0 2.3 2.2
Danone DANO.PA Sell EUR 68.75 60.00 (10.0) 69,209 52,116 16.3 14.5 12.8 11.6 2.3 2.1 20.5 18.2 1.7 1.6 3.0 2.8 4.5 4.8 2.8 3.1
Dean Foods DF.N NR * USD 11.28 - - 1,949 1,027 10.8 10.1 5.6 5.5 0.2 0.3 14.0 13.1 0.1 0.1 1.6 1.5 3.2 9.5 3.3 3.4
FamilyMart UNY HD 8028.T Hold JPY 7260.00 7500.00 5.0 12,190 8,433 22.3 20.8 11.5 11.6 1.4 1.0 44.1 31.4 7.4 5.5 1.6 1.7 19.3 24.6 1.7 1.5
Flowers Foods FLO.N NR * USD 18.81 - - 4,792 3,943 16.0 14.9 11.1 10.4 1.2 1.2 21.8 19.7 1.0 1.0 3.2 3.0 4.1 6.6 3.6 3.7
General Mills GIS.N Hold USD 58.43 59.00 4.0 42,947 33,357 16.3 15.5 13.4 12.8 3.0 2.7 20.5 18.7 2.4 2.2 6.4 6.5 4.4 5.6 3.1 3.3
Hershey HSY.N Hold USD 108.29 118.00 11.3 26,914 23,014 17.2 16.8 14.5 14.2 3.6 3.5 23.9 21.1 3.2 3.2 32.2 29.6 2.9 4.7 2.3 2.5
Kellogg K.N Hold USD 65.94 71.00 10.8 30,869 23,079 14.4 13.6 11.7 11.2 2.4 2.3 17.0 15.4 1.9 1.9 12.4 9.8 NM NM 3.1 3.2
Kraft Heinz KHC.OQ Buy USD 78.64 93.00 21.4 79,888 52,905 10.7 10.2 9.9 9.5 3.0 2.9 21.8 18.7 2.0 2.0 0.9 0.2 7.0 52.0 3.1 3.3
McCormick MKC.N Hold USD 101.29 103.00 3.5 17,558 13,018 22.1 17.9 19.2 15.4 3.7 3.2 24.1 21.2 2.7 2.5 5.5 4.9 4.8 5.0 1.9 2.0
Mondelez Int'l MDLZ.OQ Buy USD 42.99 50.00 18.2 81,089 65,062 19.3 17.8 15.6 14.5 3.2 3.1 20.2 17.9 2.5 2.5 2.6 2.6 3.4 4.7 1.9 2.2
Nestle NESN.S Buy CHF 82.62 95.00 17.7 274,023 265,088 20.0 18.1 16.1 14.8 2.9 2.9 24.7 22.4 2.9 2.8 4.1 4.2 3.4 3.8 2.8 2.9
Nomad Foods NOMD.N Buy USD 16.24 20.00 23.2 4,440 2,863 12.8 11.2 11.1 9.5 1.9 1.7 14.2 12.1 1.3 1.2 1.4 1.2 8.7 11.9 0.0 0.0
Pinnacle Foods PF.N Buy USD 58.88 68.00 17.5 9,676 6,954 17.0 15.9 14.3 13.5 3.1 3.0 23.5 19.4 2.2 2.2 3.3 3.0 5.2 5.5 2.0 2.2
Smuckers SJM.N Hold USD 124.01 130.00 7.0 19,348 13,960 14.2 13.2 12.5 11.6 2.8 2.6 17.7 15.6 2.1 1.9 2.1 2.0 5.5 6.3 2.2 2.5
Unilever Plc UNc.AS Buy EUR 45.86 55.00 23.0 177,643 155,886 15.5 14.4 13.3 12.4 2.7 2.7 20.6 18.7 2.4 2.4 6.9 6.4 4.2 5.0 3.1 3.5
Total/Average 791,490 17.3 15.9 14.1 13.1 2.8 2.7 22.4 20.1 2.5 2.4 5.4 5.3 4.3 8.0 2.7 2.9
P/BV
FCF Yield
(%)
Div. Yield
(%)P/SalesEV/EBIT EV/EBITDA EV/Sales P/E
Note: For additional information on all stocks mentioned here please refer to our website at: http://gm.db.com
* indicated Bloomberg consensus
Source: Deutsche Bank estimates, Bloomberg Finance LP
21
Janu
ary 201
8
Beverag
es
Latam C
on
sum
er Mo
nth
ly

Deu
tsche B
ank S
ecurities In
c.Pag
e 43
Figure 100: GLOBAL PACKAGED FOOD—Operating Indicators (LatAm)
16-Jan-18
PACKAGED FOOD 16A 17E 18E 16A 17E 18E 16A 17E 18E 15A 16A 17E 18E 15A 16A 17E 18E 15A 16A 17E 18E 15A 16A 17E 18E 15A 16A 17E 18E
EMERGING MARKETS
Almarai 3,919 3,846 4,024 991 1,110 1,139 25.3 28.9 28.3 2.6 11.5 12.0 2.6 14.4 8.6 9.1 4.1 16.7 16.6 16.4 15.4 10.8 11.0 11.4 10.7 2.8x 3.0x 2.7x 2.6x
AVI 830 991 1,026 170 209 224 20.5 21.1 21.8 NA NA 22.7 6.9 NA NA 15.1 14.0 NA 35.1 33.3 38.1 NA 32.7 29.9 32.4 NA 0.6x 0.5x 0.5x
Britannia Industries 1,250 1,390 1,543 181 196 222 14.5 14.1 14.4 31.0 34.2 8.6 12.9 65.7 14.3 10.7 11.7 67.4 49.4 36.9 32.7 47.6 57.4 40.2 34.6 -0.1x 0.0x 0.0x -0.2x
Grupo Bimbo 13,502 14,440 14,311 1,569 1,554 1,774 11.6 10.8 12.4 6.6 6.6 -1.0 14.2 23.5 -3.1 18.5 42.8 9.0 8.7 10.4 15.1 7.2 6.6 7.7 10.2 2.5x 2.6x 2.5x 1.9x
Cheiljedang 12,549 14,372 16,407 1,185 1,205 1,474 9.4 8.4 9.0 NA 8.6 1.7 22.3 NA 42.1 50.1 6.7 6.2 8.4 11.2 10.4 11.5 7.8 7.0 8.6 4.0x 4.2x 4.6x 3.9x
China Mengniu Dairy 8,098 8,623 9,687 517 791 944 6.4 9.2 9.7 0.2 -20.6 52.8 19.4 -0.9 NA NA 41.2 10.9 -3.5 11.2 14.1 9.2 -1.9 12.4 14.4 0.8x 0.7x 0.3x -0.2x
Dali Foods 2,687 2,950 3,455 682 729 888 25.4 24.7 25.7 28.0 1.2 6.9 21.9 32.5 -10.1 6.0 22.9 46.8 24.3 23.4 25.6 NA 85.1 95.0 NA -1.8x -2.2x -2.4x -2.2x
Gruma 3,652 3,792 3,993 587 598 639 16.1 15.8 16.0 6.1 -2.0 1.8 7.0 -85.1 NA 0.3 12.6 4.5 29.0 24.2 20.8 22.8 22.4 19.9 17.5 1.1x 1.0x 1.4x 1.0x
Indofood CBP 2,592 2,800 3,063 417 442 488 16.1 15.8 15.9 11.7 25.2 6.0 10.6 2.2 20.8 8.6 11.1 20.3 21.8 21.1 21.1 34.7 41.7 40.5 40.9 -1.1x -1.1x -1.2x 0.0x
Mayora Indah 1,380 1,587 1,824 213 234 265 15.4 14.7 14.6 58.7 22.4 9.7 13.5 NA 11.8 19.8 16.5 26.9 24.2 24.0 23.2 18.5 21.6 20.9 21.8 0.9x 0.9x 0.7x 0.0x
Nestle India 1,363 1,569 1,819 272 297 349 19.9 18.9 19.2 -25.2 8.0 9.1 17.4 -10.3 -5.1 6.7 22.0 41.6 40.1 37.4 39.5 36.0 38.5 42.2 56.2 -0.3x -0.5x -0.9x -1.3x
Pioneer Foods 1,402 1,471 1,546 185 110 179 13.2 7.5 11.6 NA 11.0 -40.6 63.1 NA 30.3 -52.3 97.8 17.3 22.8 9.1 17.6 18.8 23.5 10.2 18.1 0.2x 0.4x 0.7x 0.4x
Tiger Brands 2,082 2,352 2,419 318 386 404 15.3 16.4 16.7 NA -11.0 21.2 4.7 NA -10.6 2.4 25.9 23.1 22.1 18.6 22.3 21.7 21.8 24.5 27.9 0.8x 0.4x -0.1x -0.2x
Tingyi 8,372 8,817 9,336 984 1,054 1,144 11.8 12.0 12.3 -10.0 -4.2 7.0 8.6 -36.0 -31.0 48.1 27.5 8.5 6.3 9.5 11.2 5.4 4.9 8.4 9.7 1.4x 0.9x 0.2x 0.2x
Unilever Indonesia 3,012 3,367 3,724 729 828 934 24.2 24.6 25.1 -9.4 18.6 13.5 12.9 -9.6 17.8 13.6 13.3 NA NA NA NA NA NA NA NA 0.1x 0.2x 0.1x 0.0x
Universal Rubina 2,372 2,575 2,773 451 431 484 19.0 16.7 17.5 15.7 -11.0 -4.4 12.3 13.2 -11.4 -14.1 17.2 21.6 17.4 14.5 15.8 20.2 15.2 13.3 15.0 0.1x 0.8x 0.7x 0.3x
Uni-President China 3,160 3,019 3,221 361 375 431 11.4 12.4 13.4 33.8 -6.9 4.0 15.0 NA -31.1 46.1 32.1 7.4 5.1 7.3 8.9 5.9 4.7 7.0 9.3 0.5x 0.1x -0.3x -0.7x
Want Want China 2,968 2,968 3,172 862 724 798 29.1 24.4 25.2 -4.3 0.3 -16.0 10.2 -12.6 1.5 -9.8 13.4 29.9 31.5 25.7 23.9 29.3 32.2 28.3 32.4 -0.2x -0.3x -0.9x -1.4x
Yili 9,063 10,084 11,478 1,067 1,354 1,606 11.8 13.4 14.0 11.0 -0.3 26.8 18.6 9.8 16.7 12.4 20.8 24.0 26.3 26.7 28.6 34.6 47.0 74.5 73.0 -1.0x -1.9x -1.5x -1.5x
Total/Average 72,222 77,961 84,169 9,813 10,547 11,984 13.6 13.5 14.2 4.1 2.6 9.2 15.5 0.0 42.0 50.0 6.7 11.6 11.8 13.8 15.3 10.5 13.6 15.6 13.7
DEVELOPED MARKETS
AB Foods 18,088 19,772 21,600 2,145 2,455 2,701 11.9 12.4 12.5 -16.0 -1.6 14.5 10.0 -35.7 36.7 39.8 -7.1 8.3 12.2 15.6 12.3 13.7 15.9 17.9 17.9 0.1x 0.2x -0.4x -0.4x
Conagra Brands 8,664 7,827 7,824 1,472 1,501 1,513 17.0 19.2 19.3 NA NA 2.0 0.8 NA NA 34.0 -12.5 NA 17.6 22.7 18.1 NA 8.1 10.7 12.1 NA 3.2x 1.8x 2.0x
Danone 24,276 27,867 31,221 4,212 4,969 5,770 17.4 17.8 18.5 -5.0 -7.6 18.0 16.1 -6.5 32.3 17.3 18.7 10.6 13.2 14.4 15.0 11.4 12.1 10.4 9.4 2.0x 2.0x 4.0x 3.5x
Dean Foods 7,710 7,815 7,439 474 349 356 6.1 4.5 4.8 NA 18.4 -26.2 1.8 NA 49.7 -49.3 6.4 -1.5 20.7 11.6 11.0 4.1 10.4 NA NA 2.9x 2.0x 2.5x 2.2x
FamilyMart UNY HD 3,934 7,981 11,918 750 971 1,030 19.1 12.2 8.6 -7.9 NA 29.4 6.1 NA NA NA NA 9.3 7.3 4.6 5.5 NA NA NA NA 0.6x 0.0x 0.0x 0.0x
Flowers Foods 3,927 3,908 3,934 447 432 463 11.4 11.0 11.8 4.8 2.3 -3.4 7.2 6.7 -0.5 -4.8 10.6 16.0 13.4 NA NA 9.0 7.9 NA NA 2.3x 2.4x 2.1x 1.7x
General Mills 16,563 15,620 15,765 3,392 3,438 3,365 20.5 22.0 21.3 -2.8 -0.1 1.4 -2.1 -29.1 39.0 0.1 7.5 19.0 30.1 30.9 33.9 12.6 13.5 14.3 14.2 2.6x 2.3x 2.5x 2.6x
Hershey 7,440 7,550 7,629 2,118 1,860 1,893 28.5 24.6 24.8 -8.1 22.9 -12.2 1.8 -27.0 38.2 -20.9 36.3 59.0 NA NA NA 33.4 40.7 32.5 36.2 1.2x 1.3x 1.5x 1.4x
Kellogg 13,014 12,874 13,011 2,515 2,639 2,728 19.3 20.5 21.0 -7.0 1.7 4.9 3.4 45.2 -23.1 60.7 14.2 36.9 34.4 57.3 56.9 16.6 17.3 18.1 19.8 2.5x 2.8x 2.6x 2.3x
Kraft Heinz 26,487 26,260 26,903 7,778 8,039 8,339 29.4 30.6 31.0 3.3 15.4 3.4 3.7 68.2 35.6 20.8 16.6 6.6 5.9 7.7 8.8 7.8 6.1 6.2 7.1 3.0x 3.5x 3.3x 3.1x
McCormick 4,412 4,805 5,261 766 912 1,106 17.4 19.0 21.0 1.3 6.4 19.1 21.2 -7.0 18.7 6.0 22.0 19.8 22.4 22.4 24.9 17.1 18.7 12.2 10.8 1.8x 1.7x 5.8x 4.4x
Mondelez Int'l 25,355 25,636 26,469 4,651 5,191 5,584 18.3 20.2 21.1 -6.4 9.4 11.6 7.6 -8.6 20.3 13.4 13.0 9.1 11.1 13.0 14.5 5.6 6.7 7.2 7.9 3.2x 3.3x 3.1x 2.9x
Nestle 91,127 91,689 95,592 16,093 16,652 18,509 17.7 18.2 19.4 20.3 1.6 3.5 11.2 -39.2 -6.9 12.3 16.8 13.7 13.4 14.9 17.4 16.6 18.5 18.5 20.6 1.1x 1.0x 1.0x 1.2x
Nomad Foods 2,133 2,192 2,374 359 370 424 16.9 16.9 17.9 NA -2.0 3.0 14.6 NA -4.4 29.1 14.1 8.4 8.2 10.2 10.6 6.6 6.5 6.9 7.4 3.9x 3.5x 3.6x 2.6x
Pinnacle Foods 3,128 3,161 3,150 643 677 702 20.6 21.4 22.3 5.7 20.8 5.3 3.7 -14.8 -1.3 40.9 23.0 12.1 11.3 14.8 16.6 7.1 7.9 8.1 9.7 4.0x 4.4x 3.8x 3.4x
Smuckers 7,811 7,392 7,396 1,686 1,690 1,669 21.6 22.9 22.6 6.2 31.2 0.2 -1.2 NA 73.0 -11.4 14.4 5.7 6.8 8.5 9.5 6.6 5.9 8.2 8.5 4.7x 3.2x 3.1x 3.0x
Unilever Plc 58,315 60,473 64,893 10,521 12,333 13,935 18.0 20.4 21.5 -8.6 2.7 17.2 13.0 -5.1 2.8 20.0 17.3 35.8 33.8 36.3 35.8 27.5 25.4 26.1 25.4 1.3x 1.4x 1.6x 1.4x
Total/Average 340,247 351,021 371,373 62,869 67,621 73,289 18.5 19.3 19.7 0.8 5.0 8.5 9.0 -27.8 33.8 34.4 -1.8 18.6 18.4 20.4 19.5 15.5 15.8 15.5 16.0
Sales (USDm) EBITDA (USDm) EBITDA Margin (%) EBITDA Growth (%) EPS Growth (%) ROE (%) ROIC (%) Net Debt/ EBITDA
Note: For additional information on all stocks mentioned here please refer to our website at: http://gm.db.com
Source: Company reports, Deutsche Bank estimates & Bloomberg Finance LP
21
Janu
ary 201
8
Beverag
es
Latam C
on
sum
er Mo
nth
ly

Pag
e 44
Deu
tsche B
ank S
ecurities In
c.
Figure 101: GLOBAL BEVERAGES—Valuation (LatAm names)
16-Jan-18Listing
Potential
Return EV Market Cap
SOFT DRINKS Ticker Rating Crncy
Share
Price 12M TP (%) (US$ M) (US$ M) 17E 18E 17E 18E 17E 18E 17E 18E 17E 18E 17E 18E 17E 18E 17E 18E
EMERGING MARKETS
Andina AKOb.N Buy USD 29.70 32.00 10.3 5,105 4,686 13.1 11.4 9.1 7.9 1.6 1.5 24.8 20.9 1.4 1.3 3.2 3.0 3.7 5.6 2.5 2.6
Arca Continental AC.MX Hold MXN 136.81 140.00 4.0 18,783 12,804 18.3 14.9 13.6 11.3 2.5 2.2 20.5 21.1 1.7 1.4 2.6 2.6 0.8 4.2 1.7 1.7
Coca-Cola Femsa KOF.N Hold USD 72.91 72.50 2.0 18,720 15,317 13.7 12.2 8.7 8.0 1.7 1.6 20.1 18.9 1.3 1.2 2.3 2.1 8.0 8.0 2.6 2.8
Femsa FMX.N Buy USD 97.50 109.00 13.1 34,778 34,888 16.2 14.1 10.6 9.5 1.4 1.2 31.2 23.9 1.4 1.3 2.6 2.5 8.0 4.3 1.3 1.7
China Foods 0506.HK Buy HKD 4.58 5.00 14.9 1,807 1,638 45.4 13.4 15.5 8.1 0.4 0.7 NM 30.6 0.4 0.7 2.1 2.2 NM 5.7 5.7 1.7
Coca-Cola Hellenic CCH.L Hold GBP 23.36 24.00 4.7 13,044 11,708 17.8 16.3 11.6 10.7 1.7 1.6 22.5 21.2 1.5 1.5 3.2 2.9 3.6 4.4 2.0 2.1
Total/Average 81,040 16.7 14.0 10.9 9.5 1.7 1.5 25.7 22.1 1.4 1.3 2.7 2.5 5.9 5.1 1.9 2.0
DEVELOPED MARKETS
Britvic BVIC.L Hold GBP 7.97 7.00 (8.9) 3,518 2,885 13.6 12.6 10.6 9.9 1.7 1.6 15.7 14.9 1.3 1.3 6.2 5.2 0.6 3.9 3.3 3.5
Coca-Cola Amatil Ltd CCL.AX Hold AUD 8.14 7.80 1.7 5,956 4,818 11.2 12.2 8.0 8.6 1.5 1.5 14.4 15.2 1.2 1.2 3.4 3.3 4.7 3.6 5.9 5.6
Coca-Cola Company KO.N Buy USD 46.53 52.00 15.0 185,824 200,839 18.8 18.9 16.7 16.8 5.3 6.4 24.0 21.6 5.6 6.4 9.2 8.7 3.6 4.4 3.2 3.5
Coca-Cola Enterprises CCE.N Buy USD 38.80 43.00 13.4 25,778 18,968 14.2 13.0 10.8 10.2 1.9 1.9 14.9 13.9 1.4 1.4 2.3 2.1 5.9 8.7 2.5 2.8
Cott Corporation COT.N Buy USD 16.40 16.00 (2.4) 4,329 2,275 23.9 22.9 9.8 9.1 1.1 1.1 85.0 43.7 0.6 0.6 2.7 2.6 9.4 7.7 0.0 0.0
Dr Pepper DPS.N Buy USD 94.91 114.00 22.5 21,872 17,348 15.6 15.0 14.5 14.0 3.3 3.1 21.0 16.7 2.6 2.5 8.4 8.2 4.3 6.6 2.4 2.6
Pepsi PEP.N Buy USD 117.86 133.00 15.5 186,473 168,964 17.2 16.3 14.1 13.3 2.9 2.9 22.4 20.0 2.7 2.6 12.3 14.2 4.5 5.0 2.7 2.9
Total/Average 416,096 17.7 17.3 15.1 14.8 4.0 4.5 23.0 20.4 4.0 4.4 10.0 10.5 4.1 4.9 3.0 3.2
BREWERS
EMERGING MARKETS
Ambev ABEV.N Hold USD 6.75 6.15 (5.0) 99,793 106,000 20.1 17.0 16.5 14.1 6.9 6.4 29.3 24.7 6.9 6.3 8.1 8.3 3.3 5.1 3.9 4.5
CCU CCU.N Hold USD 28.57 25.00 (10.4) 5,371 5,278 14.1 12.5 10.1 9.3 1.9 1.8 25.1 21.7 1.9 1.8 2.7 2.6 1.7 0.5 2.1 2.0
China Resources Beer 0291.HK Hold HKD 32.00 17.50 (44.6) 9,580 11,756 26.2 21.0 15.5 13.2 2.0 1.8 29.5 24.6 2.0 1.9 2.8 2.5 4.5 4.6 0.7 0.8
Tsingtao Brewery Co Ltd-H 0168.HK Sell HKD 47.65 28.20 (39.6) 6,309 8,229 30.4 30.3 15.3 15.1 1.7 1.6 51.1 49.3 2.1 2.0 3.0 2.9 5.7 4.4 1.2 1.2
Total/Average 131,395 21.1 18.0 16.1 13.9 5.9 5.5 30.5 26.1 5.9 5.5 7.1 7.2 4.1 4.8 3.4 3.9
DEVELOPED MARKETS
Carlsberg CARLb.CO Hold DKK 740.40 680.00 (6.7) 23,362 18,556 16.5 15.6 10.5 9.9 2.3 2.2 23.7 22.5 1.9 1.8 2.1 2.0 5.0 5.5 1.4 1.6
Heineken HEIN.AS Buy EUR 87.02 100.00 16.6 78,672 60,659 18.1 16.6 12.2 11.2 2.9 2.7 21.1 20.1 2.3 2.1 3.4 3.1 4.1 5.1 1.7 1.8
AB InBev ABI.BR Hold EUR 94.82 106.00 15.2 401,245 234,229 22.5 20.8 18.2 17.1 7.0 6.8 27.6 23.8 4.1 4.0 3.2 3.1 4.6 5.0 3.4 3.4
Marston's PLC MARS.L Hold GBP 1.16 1.15 4.6 2,918 1,016 12.1 11.2 9.8 9.2 2.1 1.9 9.2 8.5 0.8 0.7 0.7 0.8 1.1 3.1 5.8 6.3
Molson Coors TAP.N Buy USD 84.72 91.00 9.3 29,277 18,346 17.4 16.0 11.9 11.0 2.6 2.5 19.4 16.1 1.7 1.6 1.4 1.3 6.6 7.8 1.9 1.9
Total/Average 332,805 21.1 19.5 16.3 15.2 5.8 5.5 25.7 22.6 3.5 3.4 3.1 3.0 4.6 5.2 2.9 3.0
WINE MAKERS
Concha y Toro VCO.N Buy USD 40.80 48.00 19.7 1,851 1,524 20.0 15.1 14.2 11.4 1.8 1.7 21.8 18.1 1.4 1.4 1.7 1.5 NM 3.6 2.1 1.8
Constellation Brands Inc STZ.N Buy USD 217.76 253.00 16.2 53,112 43,762 19.0 21.6 17.2 19.2 5.7 7.0 23.7 25.5 4.5 5.8 5.1 5.2 2.4 1.8 0.0 0.0
Delegat's Group DGL.NZ Hold NZD 7.80 7.05 (7.5) 738 573 13.3 14.6 11.1 12.2 3.6 3.8 16.4 18.2 2.5 2.8 2.1 2.2 2.9 2.0 2.1 1.8
Treasury Wine Estates TWE.AX Hold AUD 14.95 13.50 (7.4) 9,614 8,644 19.5 22.9 15.7 18.9 3.6 4.8 28.8 34.1 3.5 4.5 2.7 3.3 3.3 1.5 2.3 1.9
Total/Average 54,503 19.3 21.7 16.6 18.7 5.2 6.5 24.0 26.3 4.2 5.5 4.6 4.8 2.9 2.2 0.4 0.3
Div. Yield
(%)EV/EBIT EV/EBITDA EV/Sales P/E P/Sales P/BV
FCF Yield
(%)
Note: For additional information on all stocks mentioned here please refer to our website at: http://gm.db.com
Source: Deutsche Bank estimates, Bloomberg Finance LP
21
Janu
ary 201
8
Beverag
es
Latam C
on
sum
er Mo
nth
ly

Deu
tsche B
ank S
ecurities In
c.Pag
e 45
Figure 102: GLOBAL BEVERAGES—Operating Indicators (LatAm)
16-Jan-18
SOFT DRINKS 16A 17E 18E 16A 17E 18E 15A 16A 17E 18E 15A 16A 17E 18E 15A 16A 17E 18E 15A 16A 17E 18E 15A 16A 17E 18E 15A 16A 17E 18E
EMERGING MARKETS
Andina 2,629 2,969 3,220 460 524 607 16.8 17.5 17.7 18.8 -4.8 -4.8 13.9 15.7 1.5 -0.3 26.4 22.4 10.2 11.0 13.1 14.7 11.2 11.3 12.4 13.9 1.9x 1.8x 1.7x 1.4x
Arca Continental 5,016 7,439 8,554 1,041 1,378 1,641 21.3 20.8 18.5 19.2 1.7 1.5 32.3 19.1 -6.6 1.6 19.8 -5.2 14.9 14.7 14.2 12.3 12.0 10.4 10.5 10.8 1.9x 1.4x 1.6x 1.3x
Coca-Cola Femsa 9,517 11,022 11,479 1,901 2,133 2,249 20.5 20.0 19.3 19.6 -7.7 -3.4 12.2 5.5 -18.6 -16.4 57.1 -14.3 9.7 8.9 13.5 11.6 11.0 10.7 10.1 10.8 1.6x 2.2x 1.8x 1.6x
Femsa 21,394 24,569 26,795 2,945 3,256 3,524 15.0 13.8 13.3 13.2 -4.5 0.2 10.6 8.2 -11.2 1.6 NA -48.2 10.0 10.7 22.5 10.7 12.5 12.4 11.6 12.3 1.3x 1.6x 0.6x 0.4x
China Foods 3,607 4,251 2,777 125 117 228 4.3 3.5 2.8 8.2 61.1 -18.3 -6.3 94.2 NA NA NA -70.9 1.0 9.1 26.1 6.9 4.1 5.1 2.8 8.9 1.5x 0.5x -0.5x -0.2x
Coca-Cola Hellenic 6,880 7,269 7,867 941 1,106 1,169 12.8 13.7 15.2 14.9 -13.3 4.2 17.5 5.8 -20.1 13.6 29.3 21.8 10.0 11.2 13.6 14.4 9.4 10.5 12.4 13.1 1.5x 1.2x 0.9x 0.6x
Total/Average 49,042 57,518 60,691 7,412 8,513 9,418 14.9 15.1 14.8 15.5 -0.8 -1.4 13.5 13.3 -14.7 4.9 23.6 3.8 9.3 10.7 18.3 11.6 10.4 11.0 10.7 11.9
DEVELOPED MARKETS
Britvic 1,932 1,991 2,144 308 310 342 0.2 0.2 0.2 0.2 -0.03 -0.04 0.01 0.10 0.06 -0.07 -0.02 0.15 0.7 0.5 0.4 0.4 0.3 0.2 0.2 0.2 1.6x 2.5x 2.8x 2.6x
Coca-Cola Amatil Ltd 3,830 3,832 6,380 708 714 1,135 18.3 18.5 18.6 17.8 -15.5 1.4 0.8 58.9 20.5 -38.1 52.6 83.2 20.9 20.1 21.8 21.8 12.5 12.2 13.3 12.6 1.4x 1.1x 1.4x 1.6x
Coca-Cola Company 41,854 35,330 30,921 11,745 11,124 11,694 NA 28.1 31.5 37.8 NA NA -5.3 5.1 NA NA -13.3 72.5 NA 33.2 34.1 38.9 NA 44.6 58.4 57.9 2.5x 2.1x 2.2x 2.1x
Coca-Cola Enterprises 10,865 10,965 10,937 1,803 1,945 2,027 NA 16.6 17.7 18.5 NA NA 7.9 4.2 NA NA 32.4 20.2 NA 14.5 15.6 15.6 NA 8.3 8.9 9.5 2.5x 3.4x 3.5x 3.1x
Cott Corporation 3,260 3,835 3,903 373 443 461 NA 11.4 11.6 11.8 NA NA 19.0 3.9 NA NA NA 80.0 NA -3.1 3.4 6.1 NA -21.3 5.6 5.9 2.5x 5.6x 4.5x 4.0x
Dr Pepper 6,440 6,708 6,927 1,483 1,504 1,561 NA 23.0 22.4 22.5 NA NA 1.4 3.8 NA NA -8.6 38.3 NA 38.4 39.4 49.3 NA 18.8 16.5 17.8 2.5x 1.8x 3.0x 2.8x
Pepsi 62,799 63,395 65,510 12,761 13,227 14,187 NA 20.3 20.9 21.7 NA NA 3.7 7.3 NA NA 7.9 12.2 NA 62.9 60.4 65.3 NA 22.7 23.4 24.8 2.5x 1.6x 1.5x 1.5x
Total/Average 130,980 126,056 126,722 29,181 29,268 31,407 12.1 22.0 23.0 24.5 -10.2 0.0 1.7 8.7 0.2 -0.2 1.0 7.0 14.0 44.4 44.2 48.6 8.3 26.6 30.3 29.6
BREWERS
EMERGING MARKETS
Ambev 13,079 14,633 15,555 5,588 6,127 7,008 47.5 42.7 41.9 45.1 -14.2 -16.0 9.6 14.4 -27.4 -3.3 -31.7 61.6 27.4 26.9 18.6 33.2 49.6 46.6 40.1 46.0 -0.5x -0.1x 0.1x 0.1x
CCU 2,306 2,592 2,873 420 496 568 19.1 18.2 19.1 19.8 0.5 -4.0 18.0 14.5 -11.9 -5.1 10.9 19.2 11.6 11.1 11.3 12.2 13.8 14.5 14.1 14.7 -0.1x 0.1x 0.2x 0.2x
China Resources Beer 4,321 4,504 4,888 532 588 683 13.2 12.3 13.1 14.0 -1.8 -9.2 10.6 16.1 NA NA NA 23.0 -16.9 4.5 9.8 10.8 3.5 6.8 8.6 10.5 0.8x 1.1x 0.5x 0.0x
Tsingtao Brewery Co Ltd-H 3,595 3,593 3,787 357 392 392 8.0 9.9 10.9 10.3 -29.5 9.7 9.9 -0.2 -15.6 -42.4 32.4 5.9 10.8 6.4 8.4 8.3 9.9 8.0 12.1 13.5 -3.6x -3.4x -3.9x -4.6x
Total/Average 23,301 25,322 27,102 6,898 7,604 8,651 32.3 29.6 30.0 31.9 -13.1 -9.6 10.7 12.7 -22.5 -9.5 6.2 27.0 15.3 18.0 14.8 23.5 31.5 30.1 27.9 31.8
DEVELOPED MARKETS
Carlsberg 9,304 9,453 10,164 1,884 2,049 2,235 19.7 20.3 21.7 22.0 -16.9 -1.4 8.7 9.1 NA NA 11.4 11.7 -5.9 9.6 9.4 9.2 6.2 5.9 7.6 7.9 2.6x 2.1x 1.6x 1.3x
Heineken 23,002 24,980 28,231 5,577 5,937 6,735 22.7 24.2 23.8 23.9 -8.9 8.0 6.5 13.4 5.0 -18.5 40.5 13.4 14.6 11.5 15.3 14.9 10.0 10.1 10.8 11.0 2.5x 2.3x 2.4x 2.0x
AB InBev 45,517 57,112 58,385 16,755 22,051 23,269 38.6 36.8 38.6 39.9 -9.2 -0.5 31.6 5.5 -10.4 -85.7 NA 20.5 18.0 2.2 11.3 13.3 12.2 7.7 7.5 8.2 2.5x 6.8x 4.9x 4.5x
Marston's PLC 1,265 1,302 1,457 287 275 309 23.1 22.7 21.1 21.2 -1.9 -7.6 -4.2 12.1 NA NA 6.8 4.6 3.0 9.5 10.1 9.5 6.1 7.6 6.8 6.7 6.1x 6.0x 6.2x 5.9x
Molson Coors 10,983 11,062 11,221 2,383 2,450 2,561 NA 21.7 22.1 22.8 NA NA 2.8 4.5 NA NA NA 21.7 NA 8.1 7.8 8.6 NA 5.2 5.2 5.8 NA 4.8x 4.4x 3.8x
Total/Average 90,071 103,910 109,458 26,887 32,762 35,109 31.3 29.9 31.5 32.1 -10.0 1.5 20.0 7.9 0.3 -4.4 9.8 10.9 13.7 6.1 11.7 12.8 10.7 7.8 8.1 8.6
WINE MAKERS
Concha y Toro 974 981 1,051 127 122 153 14.9 13.1 12.4 14.6 -2.1 -11.9 -4.2 25.5 0.9 -6.8 -8.2 24.1 11.1 9.9 7.8 8.6 8.6 7.1 5.8 7.1 2.2x 2.2x 2.8x 2.1x
Constellation Brands Inc 6,548 7,332 7,553 2,046 2,433 2,764 NA 31.2 33.2 36.6 NA NA 18.9 13.6 NA NA 45.3 14.9 NA 16.5 20.3 22.5 NA 8.9 10.5 11.7 NA 3.9x 3.7x 3.4x
Delegat's Group 169 179 188 51 58 59 33.0 30.1 32.3 31.5 -26.3 4.3 13.4 2.7 -32.1 7.5 3.9 7.8 13.1 12.5 12.0 12.5 9.2 8.2 7.9 8.2 2.9x 3.9x 3.4x 3.3x
Treasury Wine Estates 1,660 1,840 3,227 322 427 817 15.7 19.4 23.2 25.3 -3.4 47.3 32.9 91.1 NA NA 49.7 NA 4.3 6.5 8.0 9.7 4.4 6.2 7.7 8.8 0.7x 0.9x 0.6x 1.1x
Total/Average 9,351 10,331 12,018 2,546 3,040 3,793 16.4 27.2 29.4 31.6 -4.2 7.2 19.1 35.3 -17.7 0.2 43.5 13.9 7.5 14.0 16.8 17.7 6.3 8.3 9.5 10.5
ROE (%) ROIC (%)Sales (USDm) EBITDA (USDm) EBITDA Margin (%) EBITDA Growth (%) EPS Growth (%) Net Debt/ EBITDA
Note: For additional information on all stocks mentioned here please refer to our website at: http://gm.db.com
Source: Company reports, Bloomberg Finance LP and Deutsche Bank estimates
21
Janu
ary 201
8
Beverag
es
Latam C
on
sum
er Mo
nth
ly

Pag
e 46
Deu
tsche B
ank S
ecurities In
c.
Figure 103: GLOBAL FOOD RETAIL—Valuation (LatAm names)
16-Jan-18Listing Share
Potential
Return EV Market Cap
FOOD RETAIL Ticker Rating Crncy Price 12M TP (%) (US$ M) (US$ M) 17E 18E 17E 18E 17E 18E 17E 18E 17E 18E 17E 18E 17E 18E 16A 17E 18E
EMERGING MARKETS
Carrefour Brasil CRFB3.SA Buy BRL 14.51 20.50 41.3 9,057 8,893 9.3 9.4 7.7 7.6 0.6 0.5 20.0 18.7 0.6 0.6 2.5 2.3 5.7 2.9 NA 0.0 1.2
CBD PCAR4.SA Buy BRL 75.00 107.00 43.0 5,010 6,156 10.0 9.7 6.6 6.3 0.4 0.3 34.0 27.3 0.4 0.4 2.5 2.3 6.1 7.6 0.0 0.3 0.9
Cencosud CEN.SN Hold CLP 1885.00 2000.00 7.8 12,785 8,842 11.7 11.0 8.8 8.2 0.7 0.6 18.1 17.4 0.5 0.4 1.2 1.2 6.3 10.5 3.3 1.7 1.4
Chedraui CHDRAUIB.MX Hold MXN 40.77 40.00 (1.9) 1,773 2,085 7.6 6.1 5.5 4.5 0.4 0.3 17.8 15.6 0.4 0.4 1.2 1.1 6.0 4.2 0.0 0.0 0.7
Dino DNP.WA Buy PLN 79.75 76.00 (4.7) 2,114 2,293 24.6 19.0 19.0 14.9 1.6 1.3 32.2 24.5 1.5 1.2 7.4 5.7 NM NM NA 0.0 0.0
Exito IMI.CN Buy COP 16820 23400 40.1 8,995 2,623 12.1 11.2 8.1 7.5 0.4 0.4 33.8 20.9 0.1 0.1 0.8 0.8 22.7 27.6 0.3 1.0 1.2
Jeronimo Martins JMT.LS Sell EUR 17.33 14.00 (15.5) 13,088 13,321 17.7 15.9 11.5 10.3 0.7 0.6 24.7 22.7 0.6 0.6 6.1 5.4 0.7 3.5 1.9 3.7 2.0
Massmart MSMJ.J Buy ZAR 133.99 125.00 (4.6) 2,653 2,362 14.0 12.7 9.5 8.7 0.4 0.3 23.5 20.6 0.3 0.3 4.2 3.8 NM 2.1 2.5 2.1 2.4
Othaim 4001.SE Hold SAR 126.80 116.00 (6.7) 1,493 1,521 26.7 22.7 15.1 13.1 0.7 0.6 20.1 17.7 0.7 0.6 3.9 3.4 3.2 3.9 2.2 1.8 2.0
Shoprite SHPJ.J Hold ZAR 220.00 220.00 2.6 10,089 10,107 12.8 14.5 10.1 11.2 0.7 0.8 19.4 19.9 0.7 0.8 4.1 4.0 1.7 1.6 2.9 2.6 2.5
Soriana SORIANAB.MX Hold MXN 40.34 44.00 9.1 4,746 3,852 9.7 8.4 7.1 6.3 0.6 0.5 15.9 13.8 0.5 0.4 1.2 1.2 6.8 7.8 0.0 0.0 1.3
Spar Group SPPJ.J Hold ZAR 192.61 193.00 4.0 3,274 3,022 14.2 14.7 11.3 11.7 0.4 0.4 18.3 19.8 0.4 0.4 4.9 5.3 3.5 4.6 3.4 3.8 3.5
Wal-Mart de Mexico WALMEX.MX Hold MXN 46.90 47.20 6.1 41,931 43,443 17.8 16.0 14.1 12.8 1.4 1.3 24.8 22.6 1.4 1.3 5.2 5.2 2.4 4.1 4.5 5.4 4.5
Total/Average 108,521 15.1 14.0 11.4 10.6 0.9 0.9 23.5 21.2 0.9 0.8 4.2 4.0 3.7 5.1 3.1 3.2 2.8
DEVELOPED MARKETS
Ahold Delhaize AD.AS Hold EUR 18.44 19.50 9.3 31,797 28,071 11.3 10.9 6.4 6.3 0.4 0.4 14.2 12.9 0.4 0.4 1.7 1.7 7.7 8.0 2.9 3.5 3.9
Carrefour CARR.PA Sell EUR 18.00 14.00 (19.4) 19,822 16,821 7.8 8.0 4.5 4.4 0.2 0.2 16.8 19.8 0.2 0.2 1.3 1.3 0.1 0.9 3.0 2.9 2.5
Casino CASP.PA Hold EUR 50.74 52.00 8.5 16,086 6,902 10.5 10.1 6.7 6.5 0.3 0.3 20.3 15.6 0.2 0.1 0.7 0.7 3.0 5.1 6.7 6.0 6.0
Casey's CASY.OQ Buy USD 123.06 120.00 (1.7) 5,870 4,677 18.0 19.9 11.0 11.3 0.7 0.7 26.7 29.9 0.6 0.5 3.7 4.4 0.6 NM 0.8 0.8 0.9
Colruyt COLR.BR Hold EUR 44.00 41.00 (4.4) 6,956 7,737 12.8 12.2 8.5 8.1 0.7 0.6 19.5 18.6 0.7 0.7 3.2 3.1 4.0 3.5 2.6 2.4 2.8
Costco Wholesale COST.OQ Hold USD 191.53 195.00 7.3 83,279 84,029 17.6 18.5 13.2 14.0 0.6 0.6 27.7 27.4 0.6 0.6 6.3 6.5 5.9 3.4 1.1 5.5 1.0
Dia DIDA.MC Hold EUR 4.43 4.70 10.3 4,152 3,323 12.3 11.6 6.7 6.3 0.4 0.4 11.4 11.8 0.3 0.3 5.9 5.0 4.4 6.1 4.0 4.1 4.0
Kroger KR.N Hold USD 28.25 26.00 (6.7) 37,541 25,540 13.2 11.1 8.0 6.4 0.4 0.3 16.3 12.8 0.3 0.2 4.8 3.5 1.7 6.3 1.1 1.3 1.9
Metro B4B.DE Hold EUR 16.44 16.50 4.5 11,336 7,301 8.8 9.5 5.4 5.3 0.3 0.2 11.8 13.2 0.2 0.2 2.1 1.8 12.3 8.4 NA 4.1 4.2
SpartanNash Co SPTN.OQ Hold USD 24.36 24.00 1.2 1,367 915 9.3 8.7 5.9 5.6 0.2 0.2 11.9 12.0 0.1 0.1 1.1 1.0 0.5 7.7 2.1 2.6 2.8
Sprouts Farmers Market SFM.OQ Hold USD 25.75 24.00 (6.8) 3,929 3,545 17.5 15.8 12.3 11.0 0.8 0.7 24.4 18.1 0.7 0.6 6.1 5.1 1.7 3.1 0.0 0.0 0.0
SUPERVALU SVU.N Hold USD 16.24 18.00 10.8 1,918 624 6.9 7.1 4.1 4.0 0.2 0.1 10.2 7.0 0.1 0.0 2.6 1.4 10.1 NM 0.0 0.0 0.0
Target TGT.N Hold USD 74.96 70.00 (3.5) 48,568 41,235 10.6 11.1 7.6 7.4 0.8 0.7 14.7 14.9 0.6 0.5 3.4 3.4 9.3 8.3 2.8 3.2 3.4
Tesco TSCO.L Buy GBP 2.12 2.40 13.3 26,580 23,813 14.1 12.4 7.0 6.7 0.3 0.3 23.3 20.0 0.3 0.3 2.4 2.3 8.7 8.3 0.0 0.0 1.4
Wal-Mart WMT.N Hold USD 100.69 88.00 (9.7) 337,925 302,398 11.3 14.9 7.9 10.2 0.5 0.7 16.2 22.0 0.5 0.6 2.7 3.9 9.8 3.6 2.8 2.9 2.1
Total/Average 556,931 12.4 14.3 8.4 9.7 0.5 0.6 18.2 21.0 0.5 0.5 3.3 3.9 8.1 4.5 2.3 3.1 2.2
EV/EBITDA EV/Sales P/EEV/EBIT P/Sales P/BV
FCF Yield
(%)
Div. Yield
(%)
Note: For additional information on all stocks mentioned here please refer to our website at: http://gm.db.com
Source: Deutsche Bank estimates
21
Janu
ary 201
8
Beverag
es
Latam C
on
sum
er Mo
nth
ly

Deu
tsche B
ank S
ecurities In
c.Pag
e 47
Figure 104: GLOBAL FOOD RETAIL—Operating Indicators (LatAm)
16-Jan-18
FOOD RETAIL 16A 17E 18E 16A 17E 18E 15A 16A 17E 18E 15A 16A 17E 18E 15A 16A 17E 18E 15A 16A 17E 18E 15A 16A 17E 18E 15A 16A 17E 18E
EMERGING MARKETS
Carrefour Brasil 15,719 13,851 13,961 1,067 1,042 965 6.8 6.8 7.5 6.9 2.9 3.6 -2.4 -7.3 NA NA NA -1.4 12.9 16.9 15.5 12.8 13.2 16.4 16.2 13.8 0.7x 0.3x -0.6x -0.7x
CBD 11,889 14,044 15,359 455 766 745 6.0 3.8 5.5 4.9 -36.7 -31.5 68.5 -2.7 -59.3 NA NA 21.8 6.0 -1.7 7.4 8.7 8.6 7.1 10.0 10.3 0.5x 0.5x 0.3x -0.1x
Cencosud 15,500 16,870 18,840 1,412 1,325 1,468 6.8 9.1 7.9 7.8 -0.8 24.2 -6.1 10.8 5.4 40.1 -12.3 7.5 5.6 8.4 6.9 7.0 10.3 13.5 12.3 13.2 4.0x 2.9x 3.0x 2.8x
Chedraui 4,741 4,982 5,187 308 322 344 6.3 6.5 6.5 6.6 -10.8 -1.9 4.5 6.9 -14.6 -4.6 1.3 11.4 7.3 7.6 7.2 7.4 11.5 11.4 10.9 12.1 0.6x 1.1x 0.7x 0.2x
Dino 854 1,179 1,612 71 100 141 8.1 8.3 8.5 8.8 19.2 27.7 41.1 40.5 54.6 18.3 42.9 42.9 25.9 24.9 26.2 26.4 16.5 16.3 17.9 19.1 2.0x 1.8x 1.4x 1.3x
Exito 16,922 19,479 20,846 808 1,082 1,077 5.6 4.8 5.6 5.2 70.1 18.5 33.9 -0.4 -20.3 -93.2 NA 57.9 7.5 0.6 2.6 3.9 6.9 6.9 6.2 6.2 0.7x 1.2x 0.9x 0.5x
Jeronimo Martins 16,176 18,352 21,426 953 1,050 1,227 5.8 5.9 5.7 5.7 -10.9 7.7 10.2 16.8 -8.1 79.1 -29.5 18.5 24.2 39.1 24.1 25.3 19.4 26.0 24.6 24.4 0.3x -0.4x -0.1x -0.2x
Massmart 6,226 6,968 7,164 248 257 272 3.9 4.0 3.7 3.8 -3.8 -3.2 3.6 6.1 -5.4 -0.3 -5.2 9.9 22.3 24.2 19.2 19.8 23.6 24.5 17.6 16.4 0.4x 0.5x 1.1x 1.0x
Othaim 1,912 2,179 2,416 84 99 111 4.6 4.4 4.5 4.6 26.1 13.5 18.1 12.1 7.5 -1.0 22.7 13.5 22.4 19.5 21.0 20.7 13.8 12.2 14.8 16.1 1.0x 0.7x 0.3x -0.1x
Shoprite 9,017 10,792 11,194 633 774 798 NA 7.0 7.2 7.1 NA NA 22.2 3.1 NA NA 17.8 9.2 NA 24.1 22.3 21.0 NA 24.8 22.9 20.1 NA 0.1x 0.1x 0.2x
Soriana 8,007 8,161 8,375 634 665 699 6.8 7.9 8.2 8.3 -11.4 34.9 5.0 5.0 -15.6 -4.5 6.8 12.4 7.7 8.0 8.0 8.7 8.5 9.0 7.9 8.7 -0.7x 2.0x 1.5x 1.1x
Spar Group 6,277 7,302 7,284 214 246 249 3.6 3.4 3.4 3.4 NA 3.5 14.8 1.6 NA 15.4 4.6 -1.2 45.5 41.4 30.7 28.0 37.9 27.7 22.0 21.1 0.9x 0.8x 0.9x 0.7x
Wal-Mart de Mexico 28,509 30,457 32,202 2,685 2,974 3,183 9.2 9.4 9.8 9.9 -11.9 -5.3 10.7 7.0 -27.1 7.5 17.1 -13.2 17.5 20.9 24.6 22.9 18.2 19.8 21.8 23.8 -0.3x -0.3x -0.1x -0.1x
Total/Average 146,069 159,119 170,751 10,103 11,289 11,963 5.4 6.9 7.1 7.0 -1.0 4.3 16.2 5.7 -6.2 20.7 8.5 16.8 10.7 16.6 15.7 15.5 11.4 16.4 16.0 16.2
DEVELOPED MARKETS
Ahold Delhaize 68,956 70,557 74,728 4,136 4,602 5,127 5.9 6.0 6.5 6.9 NA 1.7 11.2 11.4 NA -11.7 46.0 23.3 15.0 7.7 10.3 13.2 17.5 9.2 9.1 10.0 0.5x 0.3x 1.1x 1.3x
Carrefour 84,791 88,958 95,122 4,245 4,103 4,221 5.1 5.0 4.6 4.4 -13.1 -2.2 -3.4 2.9 -35.8 -25.9 -18.6 23.2 10.4 7.4 5.8 6.6 10.4 9.8 7.9 7.3 1.2x 1.2x 1.0x 1.1x
Casino 39,859 42,633 46,418 1,877 2,221 2,445 5.1 4.7 5.2 5.3 -38.6 -27.8 18.3 10.1 NA -75.0 NA NA -1.4 -0.3 1.9 4.4 4.5 1.7 4.7 4.8 2.6x 2.4x 2.2x 2.1x
Casey's 7,122 7,507 8,485 560 509 519 6.2 7.9 6.8 6.1 28.2 16.8 -9.1 2.0 41.7 24.0 -21.8 -9.5 22.6 23.1 15.6 13.7 13.2 14.3 10.5 8.5 1.7x 1.4x 1.7x 2.4x
Colruyt 10,153 10,704 10,826 797 839 838 7.8 7.8 7.8 7.7 -14.8 2.6 5.2 -0.1 -9.4 2.3 6.7 -0.3 19.2 19.0 18.3 16.8 25.8 24.9 24.5 20.8 -0.4x -0.6x -0.7x -0.6x
Costco Wholesale 116,073 126,172 134,273 4,927 5,481 5,946 4.2 4.2 4.3 4.4 11.8 3.7 11.2 8.5 12.7 1.8 9.4 19.2 20.3 20.7 22.5 25.7 24.8 23.0 23.5 25.9 0.0x 0.1x 0.4x 0.1x
Dia 9,933 9,900 10,510 583 574 630 5.4 5.9 5.8 6.0 -19.7 7.7 -1.7 9.9 -21.9 -40.9 -4.1 13.6 86.6 49.3 38.6 35.3 32.8 16.4 16.9 17.0 2.3x 1.7x 1.7x 1.6x
Kroger 109,830 115,337 122,887 5,665 5,887 5,900 4.8 5.2 5.1 4.8 16.6 9.5 3.9 0.2 27.0 16.9 2.2 -5.5 32.5 33.3 30.1 27.1 12.7 13.4 12.1 10.7 2.2x 2.1x 2.3x 2.4x
Metro 40,433 41,876 44,666 1,981 2,041 2,079 4.7 4.9 4.9 4.7 -24.4 0.9 3.0 1.9 NA 98.6 -34.5 49.1 14.9 18.4 10.7 14.0 8.2 9.1 8.7 8.8 2.4x 1.8x 1.7x 1.7x
SpartanNash Co 7,735 8,151 8,379 223 232 237 2.9 2.9 2.9 2.8 -2.4 0.0 4.0 2.2 6.5 10.7 -3.5 -1.1 9.7 10.2 9.3 8.7 6.4 6.9 6.9 6.6 2.1x 1.8x 1.8x NA
Sprouts Farmers 4,046 4,665 5,262 293 319 359 8.3 7.2 6.8 6.8 13.7 -2.2 8.8 12.6 19.7 -3.8 20.3 35.1 17.9 16.6 22.5 30.0 14.6 13.2 14.0 16.6 0.5x 1.3x 1.8x NA
SUPERVALU 17,529 14,971 15,726 771 600 482 4.4 4.4 4.0 3.1 -0.4 -2.3 -22.2 -19.7 22.5 -2.9 -32.7 -22.9 NA NA NA 23.1 16.2 15.2 13.1 11.9 3.3x 3.2x 1.9x 2.6x
Target 73,785 69,496 71,641 7,497 6,995 6,564 8.9 10.2 10.1 9.2 -10.2 16.5 -6.7 -6.2 -2.9 9.8 4.6 -3.0 18.0 21.9 23.8 23.2 11.3 16.2 15.6 14.4 1.6x 1.2x 1.5x 1.5x
Tesco 72,805 71,994 76,611 2,991 3,319 3,835 4.0 4.1 4.6 5.0 -55.9 -15.1 11.0 15.5 NA NA -77.7 NA -52.0 3.3 0.8 7.0 4.7 8.6 4.3 9.5 3.7x 2.3x 1.4x 1.0x
Wal-Mart 478,614 481,317 494,234 33,559 32,844 33,133 7.5 7.0 6.8 6.7 2.2 -7.6 -2.1 0.9 0.5 -9.5 -5.7 2.1 20.9 18.2 17.0 17.5 14.8 13.6 13.2 12.8 1.1x 1.2x 1.2x 1.3x
Total/Average 1,141,664 1,164,237 1,219,767 70,107 70,564 72,316 6.2 6.1 6.1 5.9 -4.8 -2.6 2.0 3.2 -4.8 7.8 -5.1 4.5 14.1 17.1 16.2 17.5 14.0 13.3 12.7 12.9
ROE (%) ROIC (%) Net Debt/ EBITDASales (USDm) EBITDA (USDm) EBITDA Margin (%) EBITDA Growth (%) EPS Growth (%)
Note: For additional information on all stocks mentioned here please refer to our website at: http://gm.db.com
Source: Company reports and Deutsche Bank estimates
21
Janu
ary 201
8
Beverag
es
Latam C
on
sum
er Mo
nth
ly

Pag
e 48
Deu
tsche B
ank S
ecurities In
c.
Figure 105: GLOBAL NON-FOOD RETAIL—Valuation (LatAm names)
16-Jan-18Listing Share
Potential
Return EV Market Cap
NON-FOOD RETAIL Ticker Rating Crncy Price 12M TP (%) (US$ M) (US$ M) 17E 18E 17E 18E 17E 18E 17E 18E 17E 18E 17E 18E 17E 18E 16A 17E 18E
EMERGING MARKETS
B2W BTOW3.SA Hold BRL 18.96 16.50 (13.0) 3,163 2,702 34.3 18.2 16.0 11.4 1.4 1.4 NM NM 1.1 1.1 2.2 2.3 NM NM 0.0 0.0 0.0
CEE Apparel CCCP.WA Buy PLN 305.00 340.00 12.5 2,961 3,561 22.3 15.4 18.3 13.3 2.4 1.9 31.2 20.4 2.3 1.8 6.0 4.9 NM 2.4 1.6 1.1 2.4
Cia Hering HGTX3.SA Hold BRL 24.43 23.00 (1.0) 1,356 1,219 21.7 18.4 16.7 14.4 2.7 2.5 17.4 16.9 2.8 2.6 3.6 3.3 1.1 3.3 6.4 4.8 4.1
Hyundai Dept. Store 069960.KS Hold KRW 107,000 117,000 10.0 2,411 2,352 5.9 5.7 4.4 4.2 1.4 1.3 8.9 8.3 1.3 1.3 0.6 0.6 NM 3.6 0.6 0.7 0.7
Falabella FAL.SN Hold CLP 6,299 7,000 13.4 21,213 25,306 21.2 19.5 16.2 15.1 2.2 2.1 29.6 26.4 1.7 1.6 3.4 3.1 1.0 1.3 1.8 2.3 1.4
Liverpool LIVEPOLC1.MX Buy MXN 131.19 187.50 43.5 9,506 9,341 11.5 9.8 9.6 8.2 1.5 1.3 18.2 14.1 1.4 1.3 2.0 1.8 1.2 2.7 0.5 0.6 0.9
Lojas Americanas LAME4.SA Hold BRL 15.60 16.00 3.0 12,267 7,708 19.7 16.2 14.5 12.2 2.3 2.1 NM 43.1 1.6 1.5 12.7 10.4 2.5 3.1 0.4 0.4 0.2
Lojas Renner LREN3.SA Hold BRL 36.32 34.00 (5.4) 8,047 7,991 21.2 17.5 16.8 14.1 3.5 3.0 32.7 27.3 3.3 2.9 8.0 6.8 1.0 1.5 1.4 1.0 1.3
LPP LPPP.WA Hold PLN 9,860 8,000 (17.1) 4,208 5,302 22.4 18.7 15.4 13.0 2.0 1.7 29.0 24.7 2.1 1.9 5.8 5.1 4.3 4.3 0.7 1.7 2.0
Shinsegae 004170.KS Buy KRW 305,500 290,000 (4.6) 5,515 2,822 17.6 15.6 9.8 9.2 1.5 1.4 14.6 13.3 0.8 0.7 0.9 0.8 0.7 3.4 0.6 0.4 0.5
STAR SRRJ.J Buy ZAR 18.03 29.00 62.7 8,257 5,068 16.7 14.0 14.4 12.0 1.8 1.7 26.5 23.3 1.6 1.5 1.7 1.4 20.1 2.4 NA 1.9 2.1
The Foschini Group TFGJ.J Buy ZAR 181.00 178.00 3.2 3,783 3,299 10.1 11.3 8.9 9.5 1.5 1.5 13.6 16.2 1.2 1.3 3.5 3.0 5.4 NM 4.8 4.9 4.1
Truworths TRUJ.J Buy ZAR 88.16 93.00 11.2 3,279 3,077 9.0 10.0 8.2 9.0 1.8 2.0 12.7 13.6 1.8 1.9 3.4 3.9 8.1 4.9 4.8 5.7 5.3
Woolworths Holdings Ltd WHLJ.J Hold ZAR 59.40 59.00 3.6 6,097 4,651 13.3 12.0 10.3 9.1 1.2 1.0 17.7 15.8 1.0 0.8 3.1 2.7 10.1 3.0 3.3 4.2 4.7
Total/Average 84,399 36.4 28.5 16.6 14.6 4.0 3.6 42.9 41.2 3.5 2.9 8.8 9.5 6.4 4.1 1.9 2.3 2.1
DEVELOPED MARKETS
Best Buy BBY.N Hold USD 72.40 67.00 (5.9) 20,689 22,206 5.2 10.9 3.8 8.1 0.2 0.5 10.3 17.4 0.3 0.5 3.0 5.7 14.9 4.4 1.6 1.6 1.5
Big Lots Inc BIG.N Buy USD 57.86 60.00 3.7 2,407 2,550 9.1 7.9 6.1 5.7 0.4 0.5 13.2 12.6 0.4 0.5 3.5 3.2 10.1 7.9 0.0 0.0 0.0
Dollar General DG.N Buy USD 98.44 97.00 (1.5) 27,627 26,875 12.4 13.6 10.5 11.3 1.2 1.2 17.9 20.2 1.0 1.1 3.9 4.2 4.7 3.8 1.2 0.0 0.0
Dollar Tree Inc. DLTR.OQ Buy USD 112.88 108.00 (4.3) 31,585 26,837 14.8 15.7 10.7 12.1 1.2 1.4 21.9 23.6 1.0 1.2 3.4 4.2 5.6 4.3 0.0 0.0 0.0
Fred's Inc FRED.OQ Hold USD 3.87 5.00 31.0 312 145 NM NM NM NM 0.3 0.1 NM NM 0.2 0.1 1.6 0.7 NM 0.9 1.5 1.8 4.9
Giordano 0709.HK Buy HKD 4.11 4.91 26.9 643 822 7.8 7.3 6.6 6.2 1.0 0.9 13.6 12.8 1.2 1.2 2.6 2.6 8.8 8.3 7.4 7.4 7.9
Home Depot HD.N Buy USD 196.31 227.00 15.8 253,254 232,099 13.6 17.2 12.0 15.3 1.9 2.5 20.3 25.8 1.7 2.3 NM NM 5.0 4.0 0.2 0.2 1.8
J.C. Penney Company JCP.N Hold USD 3.86 3.00 (22.3) 5,025 1,200 17.1 48.1 6.7 7.4 0.5 0.4 NM 30.0 0.2 0.1 1.5 1.0 0.2 5.2 0.0 0.0 0.0
Kohl's KSS.N Hold USD 63.40 59.00 (2.4) 12,662 10,602 9.6 9.1 5.4 5.4 0.6 0.7 11.7 13.9 0.4 0.5 1.4 1.8 17.6 11.4 3.0 4.6 3.9
Lowe's LOW.N Buy USD 100.97 116.00 16.6 95,029 84,752 12.7 14.3 10.3 11.7 1.2 1.4 18.5 21.0 1.0 1.2 10.0 13.1 6.8 6.6 1.4 1.7 1.0
Macy's Inc. M.N Hold USD 25.92 27.00 8.1 12,776 7,941 9.2 6.2 5.9 4.2 0.7 0.5 12.0 6.9 0.5 0.3 2.2 1.6 16.0 17.9 2.4 3.9 6.6
Marks & Spencer MKS.L Hold GBP 3.10 3.30 11.7 9,612 6,941 10.9 10.4 5.9 5.5 0.7 0.6 11.6 11.5 0.5 0.5 1.7 1.6 9.2 8.8 4.7 5.3 5.8
Nordstrom JWN.N Hold USD 50.18 52.00 6.6 9,891 8,449 12.9 10.5 7.2 6.1 0.7 0.7 15.6 15.9 0.6 0.5 8.9 10.2 9.3 6.4 8.9 3.0 3.1
PPR PRTP.PA Hold EUR 403.30 390.00 (1.6) 68,420 62,337 19.5 16.9 16.8 14.8 3.6 3.3 25.8 22.6 3.4 3.1 4.2 3.8 3.2 3.5 2.7 1.7 1.8
SA SA International 0178.HK Buy HKD 3.11 3.84 29.0 941 1,129 19.1 15.0 15.2 12.3 1.0 0.9 26.6 20.0 1.1 1.0 5.1 4.8 3.0 4.9 7.5 5.6 4.8
Tesco PLC TSCO.L Buy GBP 2.12 2.40 13.3 26,580 23,813 14.1 12.4 7.0 6.7 0.3 0.3 23.3 20.0 0.3 0.3 2.4 2.3 8.7 8.3 0.0 0.0 1.4
Total/Average 518,698 15.4 17.5 11.1 12.8 1.9 2.2 22.4 25.7 1.7 2.0 3.4 4.2 7.1 5.8 1.1 0.9 1.7
Div. Yield
(%)P/BV
FCF Yield
(%)EV/EBIT EV/EBITDA EV/Sales P/E P/Sales
Note: For additional information on all stocks mentioned here please refer to our website at: http://gm.db.com
Source: Deutsche Bank estimates, Bloomberg Finance LP
21
Janu
ary 201
8
Beverag
es
Latam C
on
sum
er Mo
nth
ly

Deu
tsche B
ank S
ecurities In
c.Pag
e 49
Figure 106: GLOBAL NON-FOOD RETAIL—Operating Indicators (LatAm)
16-Jan-18
NON-FOOD RETAIL 16A 17E 18E 16A 17E 18E 15A 16A 17E 18E 15A 16A 17E 18E 15A 16A 17E 18E 15A 16A 17E 18E 15A 16A 17E 18E 15A 16A 17E 18E
EMERGING MARKETS
B2W 2,467 2,341 2,385 187 200 287 7.2 7.6 8.6 12.0 -10.7 -4.2 7.0 43.3 80.8 11.2 2.4 -72.5 -14.5 -16.8 -13.2 -3.4 10.5 7.4 5.4 10.0 2.5x 3.5x 2.9x 2.5x
CEE Apparel 808 1,102 1,514 113 146 216 NA 14.0 13.3 14.3 -8.5 31.8 29.4 48.0 -48.4 10.5 4.6 65.7 25.0 26.5 22.6 26.4 19.8 20.2 19.0 24.6 1.2x 1.5x 0.6x NA
Cia Hering 423 499 533 60 82 93 16.5 14.1 16.5 17.4 -53.1 -24.4 38.1 12.7 -37.8 -32.1 40.6 0.5 25.0 16.7 20.8 20.3 24.0 14.5 17.3 18.6 -0.4x -0.9x -0.4x -0.3x
Hyundai Dept. Store 1,578 1,665 1,732 452 514 536 29.4 28.7 30.9 30.9 NA 5.0 13.7 4.2 NA 11.6 16.6 0.6 7.2 7.7 8.2 7.3 9.9 9.1 9.9 9.2 0.0x 0.0x 0.0x 0.0x
Falabella 12,703 13,901 15,388 1,703 1,878 2,119 13.3 13.4 13.5 13.8 -4.2 0.0 10.3 12.8 -2.3 14.2 -12.3 16.1 14.5 15.5 11.8 12.2 9.0 8.2 7.8 8.1 5.0x 5.3x 5.2x NA
Liverpool 5,379 6,433 6,954 860 989 1,101 16.3 16.0 15.4 15.8 -4.2 -8.3 15.1 11.3 -0.5 -5.9 -9.1 25.1 13.8 13.4 11.2 13.2 16.8 16.6 17.4 17.5 0.4x 0.3x 1.1x 0.9x
Lojas Americanas 5,192 5,466 5,687 768 857 998 13.8 14.8 15.7 17.5 -15.9 3.4 11.6 16.4 -45.5 -38.9 -14.6 NA 19.3 11.3 9.0 26.6 21.0 22.5 19.0 15.5 2.0x 2.7x 2.5x 2.1x
Lojas Renner 1,850 2,342 2,633 384 486 564 20.3 20.8 20.8 21.4 -16.4 2.8 26.5 16.1 -13.4 3.4 33.6 16.8 27.8 25.3 26.6 27.0 21.1 20.6 22.0 22.6 1.0x 0.8x 0.7x 0.6x
LPP 1,526 1,854 2,297 125 247 308 14.2 8.2 13.3 13.4 -24.3 -35.0 97.4 24.6 -38.7 -51.7 NA 27.1 19.9 8.8 21.7 21.8 19.1 8.8 24.2 29.4 0.9x 0.3x -0.5x NA
Shinsegae 2,540 3,466 3,884 392 528 596 16.9 15.4 15.2 15.3 NA 2.5 34.6 12.9 NA -44.9 -7.1 14.2 14.3 7.3 6.2 6.4 6.7 4.3 4.9 5.3 0.0x 0.0x 0.0x 0.0x
STAR 3,523 4,137 4,317 393 527 596 NA 11.2 12.7 13.8 NA NA 34.1 13.1 NA NA 34.7 9.2 NA 5.2 6.3 7.8 NA 6.5 7.2 5.7 NA -0.4x 2.0x 1.4x
The Foschini Group 1,615 1,982 2,298 275 324 352 17.3 17.0 16.4 15.3 -5.7 9.6 18.0 8.6 -2.7 -10.7 14.0 -3.1 28.5 24.6 23.0 19.9 15.7 16.3 16.1 15.4 1.9x 1.8x 1.6x 1.3x
Truworths 1,234 1,450 1,441 304 326 324 NA 24.6 22.5 22.5 NA NA 7.2 -0.5 NA NA 3.4 1.6 NA 34.9 29.7 28.7 NA 31.9 26.2 25.4 NA 0.5x 0.4x 0.4x
Woolworths Holdings 4,556 5,212 5,310 597 605 594 13.7 13.1 11.6 11.2 NA -4.1 1.3 -1.9 NA -14.4 2.0 -7.8 39.7 25.6 20.8 18.5 27.5 16.0 15.5 13.2 NA 1.6x 1.4x 1.7x
Total/Average 45,394 51,850 56,373 6,614 7,711 8,685 13.3 14.6 14.9 15.4 -6.5 -1.3 18.3 13.7 0.0 -25.8 2.2 9.3 15.4 13.7 12.6 15.1 13.6 13.0 13.0 13.0
DEVELOPED MARKETS
Best Buy 39,528 39,403 41,264 2,162 2,387 2,541 5.3 5.5 6.1 6.2 15.4 0.4 10.4 6.4 25.9 2.4 31.9 17.0 20.5 19.9 24.9 29.4 34.9 35.1 46.5 54.4 -1.1x -0.7x -1.1x -0.5x
Big Lots Inc 5,191 5,200 5,275 358 368 420 6.6 6.9 7.1 8.0 0.5 4.1 2.8 14.1 -13.7 20.1 20.9 17.3 16.5 20.3 24.4 27.2 15.2 18.1 20.0 24.2 0.0x 0.0x 0.1x 0.1x
Dollar General 20,369 21,987 23,598 2,293 2,443 2,436 11.2 11.3 11.1 10.3 2.0 8.6 6.6 -0.3 9.4 13.3 13.0 0.5 19.3 21.1 23.5 21.7 14.4 15.2 15.8 14.9 1.0x 1.2x 1.2x 1.2x
Dollar Tree Inc. 15,498 20,719 22,303 1,537 2,342 2,619 14.5 9.9 11.3 11.7 7.3 23.4 52.4 11.8 14.6 -19.2 51.8 26.9 43.7 18.2 18.4 19.4 39.0 10.4 10.5 12.1 -0.1x 4.3x 2.3x 1.6x
Fred's Inc 2,151 2,125 2,106 35 -28 -25 -0.4 1.6 -1.3 -1.2 NA NA NA -9.9 NA NA NA -25.4 -1.4 0.8 -5.2 -5.0 -11.2 -2.4 -16.4 -16.7 0.0x 1.3x -4.4x NM
Giordano 663 674 706 88 98 103 12.6 13.3 14.6 14.6 0.8 0.5 11.7 4.8 4.5 1.5 10.9 6.6 16.2 17.0 19.4 20.7 29.9 34.0 39.7 43.3 -1.4x -1.4x -1.4x -1.4x
Home Depot 88,519 94,595 100,734 13,464 15,181 16,542 14.6 15.2 16.0 16.4 12.2 11.2 12.8 9.0 25.4 15.9 18.0 16.8 58.1 89.6 NA NA 26.6 29.9 33.7 37.9 1.3x 1.4x 1.4x NA
J.C. Penney 12,625 12,547 12,518 498 1,004 680 2.6 3.9 8.0 5.4 NA 54.2 NA -32.3 -25.6 -53.3 NA NA -28.4 -20.6 0.9 3.1 -4.7 -2.1 3.8 2.0 12.6x 7.8x 3.9x 5.7x
Kohl's 19,204 18,686 19,087 2,488 2,121 2,360 13.5 13.0 11.4 12.4 -2.2 -3.4 -14.8 11.3 5.0 -6.3 -5.9 9.2 14.5 13.5 12.6 13.1 10.9 10.2 8.0 9.9 1.3x 1.6x 1.7x 1.3x
Lowe's 59,073 65,017 68,405 6,985 7,790 8,090 11.2 11.8 12.0 11.8 11.3 11.3 11.5 3.9 25.3 21.8 20.9 14.1 24.6 34.9 50.1 61.0 14.4 17.2 19.4 20.3 1.7x 1.8x 1.9x 1.9x
Macy's Inc. 27,079 25,778 25,058 3,388 2,937 3,056 14.1 12.5 11.4 12.2 4.5 -14.3 -13.3 4.0 11.8 -16.0 -17.6 17.9 28.0 26.1 22.8 24.4 17.4 14.0 11.7 13.3 1.3x 1.9x 1.9x 1.6x
Marks & Spencer 14,027 13,676 14,410 1,828 1,648 1,697 12.5 13.0 12.1 11.8 -1.5 -6.9 -9.9 2.9 -14.9 -26.7 -72.1 NA 16.5 12.1 3.5 10.0 11.0 11.5 10.5 9.9 1.7x 1.6x 1.5x 1.4x
Nordstrom 14,095 14,499 15,103 1,645 1,451 1,622 14.0 11.7 10.0 10.7 1.4 -10.1 -11.8 11.8 -0.1 -15.2 -0.4 -3.9 31.8 36.1 63.3 61.1 18.4 16.4 14.6 22.1 1.3x 1.3x 1.2x 1.1x
PPR 13,701 17,483 20,150 2,565 3,752 4,463 17.8 18.7 21.5 22.1 -13.6 12.4 46.3 18.9 -47.0 28.8 NA 20.9 5.9 7.4 17.0 17.5 7.0 8.7 13.7 14.9 2.3x 1.9x 1.1x 0.7x
SA SA International 1,004 994 1,035 75 64 77 12.8 7.5 6.4 7.4 -11.3 -49.4 -15.1 20.2 -10.3 -54.3 -15.2 25.6 48.4 22.4 19.6 24.0 NA 93.7 68.4 55.6 -1.0x -1.8x -1.9x -1.1x
Tesco PLC 72,805 71,994 76,611 2,991 3,319 3,835 4.0 4.1 4.6 5.0 -55.9 -15.1 11.0 15.5 NA NA -77.7 NA -52.0 3.3 0.8 7.0 4.7 8.6 4.3 9.5 3.7x 2.3x 1.4x 1.0x
Total/Average 405,531 425,377 448,364 42,401 46,879 50,516 10.0 10.5 11.0 11.3 -6.3 3.1 10.1 7.7 18.8 -6.9 -2.7 10.7 11.9 33.0 17.5 20.9 16.2 18.3 19.8 23.0
Sales (USDm) EBITDA (USDm) EBITDA Margin (%) EBITDA Growth (%) EPS Growth (%) ROE (%) ROIC (%) Net Debt/ EBITDA
Note: For additional information on all stocks mentioned here please refer to our website at: http://gm.db.com
Source: Company reports and Deutsche Bank estimates
21
Janu
ary 201
8
Beverag
es
Latam C
on
sum
er Mo
nth
ly

Pag
e 50
Deu
tsche B
ank S
ecurities In
c.
Figure 107: GLOBAL COSMETICS, HPC—Valuation (LatAm names)
16-Jan-18Listing Share
Potential
Return EV Market Cap
COSMETICS, HPC Ticker Rating Crncy Price 12M TP (%) (US$ M) (US$ M) 17E 18E 17E 18E 17E 18E 17E 18E 17E 18E 17E 18E 17E 18E 17E 18E
EMERGING MARKETS
AmorePacific 090430.KS Hold KRW 305,000 290,000 (4.3) 14,849 16,736 26.9 20.9 19.8 16.1 3.1 2.8 40.8 30.3 3.4 3.1 4.2 3.8 NM 1.1 0.5 0.6
Cosmax 192820.KS Hold KRW 131,000 122,000 (6.0) 1,449 1,236 39.5 24.7 25.8 17.6 1.7 1.4 54.7 31.7 1.5 1.2 5.9 5.1 NM 1.4 0.5 0.9
Dabur India Limited DABU.BO Buy INR 355.90 400.00 13.2 9,092 9,790 35.4 38.2 32.0 34.5 6.3 6.9 39.3 43.0 6.6 7.3 10.0 10.8 1.5 1.9 0.8 0.8
KCM KIMBERA.MX Buy MXN 35.48 41.00 20.4 6,225 5,809 16.2 14.0 13.2 11.7 3.1 2.9 24.6 20.8 2.7 2.5 15.7 16.5 2.5 4.5 4.7 4.9
Kolmar Korea 161890.KS Hold KRW 88000.00 70000.00 (20.0) 1,502 1,744 21.7 18.0 17.2 14.5 2.0 1.6 31.4 26.5 1.9 1.6 5.2 4.4 0.2 1.2 0.4 0.4
Kao 4452.T Hold JPY 7747.00 6800.00 (10.5) 28,690 34,789 15.8 14.4 12.2 10.9 2.1 2.0 25.2 24.2 2.4 2.3 4.1 3.7 3.1 3.5 1.6 1.7
Kose 4922.T Hold JPY 18750.00 14700.00 (20.8) 7,750 9,659 11.7 17.8 10.0 15.4 1.7 2.8 26.3 34.8 2.1 3.1 3.5 5.0 1.3 1.2 1.1 0.8
LGH&H 051900.KS Hold KRW 1,233,000 1,060,000 (13.2) 16,399 16,976 18.3 15.8 16.9 14.6 2.8 2.5 27.1 23.6 2.9 2.7 5.9 5.0 2.2 2.6 0.7 0.8
L'Occitane Int'l 0973.HK Buy HKD 15.02 17.40 17.5 2,438 2,820 13.5 12.9 9.7 8.9 1.7 1.5 19.8 20.8 2.0 1.8 3.0 2.6 5.4 2.7 1.8 1.7
Natura NATU3.SA Hold BRL 33.01 26.50 (16.7) 4,482 4,404 13.1 11.4 10.2 9.0 1.8 1.6 29.5 23.5 1.5 1.4 9.5 7.9 6.7 7.1 1.8 3.0
SA SA Int'l 0178.HK Buy HKD 3.11 3.84 28.3 941 1,129 19.1 15.0 15.2 12.3 1.0 0.9 26.6 20.0 1.1 1.0 5.1 4.8 3.0 4.9 5.6 4.8
Shiseido 4911.T Buy JPY 5752.00 5800.00 1.4 18,719 20,753 30.2 24.3 18.5 15.3 2.1 1.9 60.3 37.6 2.1 1.9 5.3 4.8 NM 1.7 0.5 0.6
Shanghai Jahwa 600315.SS Hold CNY 34.04 30.04 (11.1) 3,628 3,566 41.3 32.9 32.5 25.5 3.7 3.3 60.6 47.6 4.0 3.6 4.5 4.3 NM 2.6 0.5 0.7
Total/Average 129,411 25.5 22.7 16.8 15.3 2.7 2.6 43.8 36.6 3.5 3.4 7.0 6.7 2.7 3.2 1.5 1.6
DEVELOPED MARKETS
Avon AVP.N Hold USD 2.21 2.00 (9.5) 2,155 971 6.2 6.0 4.7 4.5 0.4 0.4 53.2 8.6 0.2 0.2 NM NM 11.1 12.2 0.0 0.0
Beiersdorf BEIG.DE Hold EUR 96.68 95.00 (1.0) 22,976 26,830 17.2 15.6 15.1 13.7 2.7 2.5 28.6 26.4 3.1 3.0 4.1 3.7 3.4 3.8 0.7 0.7
Church & Dwight CHD.N Buy USD 49.25 61.00 23.9 14,521 12,627 18.8 16.8 16.2 14.4 3.9 3.5 25.5 19.7 3.4 3.1 6.2 5.6 5.6 6.3 0.0 0.0
Coty, Inc. COTY.N Buy USD 20.40 23.00 15.2 22,256 15,271 26.2 21.7 19.2 16.1 2.6 2.4 35.6 30.1 1.8 1.7 1.2 1.6 0.4 1.3 2.7 2.4
Estee Lauder EL.N Hold USD 128.66 136.00 6.8 49,808 48,007 18.5 22.9 14.9 18.0 2.9 3.8 24.9 29.9 2.7 3.6 8.1 10.0 4.0 3.6 1.5 1.1
Essity Aktiebolag ESSITYb.ST Hold SEK 235.40 255.00 11.2 28,643 20,565 19.5 15.8 13.6 11.5 2.1 2.0 19.2 17.4 1.6 1.5 4.0 3.6 4.1 4.6 2.6 2.9
Henkel HNKG_p.DE Hold EUR 113.50 120.00 7.4 59,303 60,171 15.0 14.1 12.6 11.9 2.4 2.3 19.5 18.8 2.3 2.3 3.0 2.7 4.6 5.1 1.6 1.7
Kimberly-Clark KMB.N Hold USD 114.26 125.00 13.0 46,701 40,657 14.0 13.8 14.0 13.8 2.6 2.5 18.2 15.7 2.2 2.2 NM NM 5.9 5.8 3.4 3.6
L'Oreal OREP.PA Buy EUR 184.05 195.00 8.0 114,756 127,001 19.9 18.2 15.2 14.0 3.6 3.4 27.8 25.8 4.0 3.8 4.0 3.7 3.5 3.7 1.9 2.0
Nu Skin Enterprises NUS.N Buy USD 68.35 75.00 12.1 3,668 3,726 13.3 12.7 14.6 14.0 1.6 1.5 21.2 16.7 1.6 1.6 5.0 4.6 6.5 6.5 2.1 2.3
Ontex ONTEX.BR Buy EUR 26.88 35.00 32.5 3,622 2,708 12.6 11.4 10.3 9.3 1.2 1.2 15.1 13.7 0.9 0.9 1.7 1.6 5.7 7.3 2.1 2.3
Procter & Gamble PG.N Buy USD 90.22 102.00 16.2 258,225 240,828 17.8 17.3 14.9 14.5 3.9 3.9 22.3 21.0 3.7 3.6 4.3 4.4 2.0 4.7 3.1 3.1
Total/Average 599,363 18.0 17.3 14.7 14.2 3.3 3.3 23.7 22.4 3.3 3.2 4.3 4.4 3.2 4.4 2.4 2.4
EV/EBIT EV/EBITDA P/E P/BV
Div. Yield
(%)EV/Sales P/Sales
FCF Yield
(%)
Note: For additional information on all stocks mentioned here please refer to our website at: http://gm.db.com
Source: Deutsche Bank estimates, Bloomberg Finance LP
21
Janu
ary 201
8
Beverag
es
Latam C
on
sum
er Mo
nth
ly

Deu
tsche B
ank S
ecurities In
c.Pag
e 51
Figure 108: GLOBAL COSMETICS, HPC—Operating Indicators (LatAm)
16-Jan-18
COSMETICS, HPC 16A 17E 18E 16A 17E 18E 15A 16A 17E 18E 15A 16A 17E 18E 15A 16A 17E 18E 15A 16A 17E 18E 15A 16A 17E 18E 15A 16A 17E 18E
EMERGING MARKETS
AmorePacific 4,865 4,535 5,172 887 707 901 19.3 18.2 15.6 17.4 NA 9.1 -20.3 27.4 NA 7.9 -31.2 40.4 18.6 17.7 10.6 13.0 28.4 30.8 18.3 20.4 -0.8x -0.8x -0.6x -0.6x
Cosmax 652 784 992 56 53 80 8.4 8.6 6.7 8.1 NA 41.0 -5.9 51.9 NA 50.8 -32.7 80.0 23.8 22.5 11.0 17.2 19.6 15.9 9.4 13.3 4.3x 2.8x 4.2x 2.7x
Dabur India Limited 1,155 1,166 1,288 223 228 258 16.6 19.3 19.6 20.0 8.5 10.6 2.3 12.8 10.1 11.9 5.2 13.0 35.5 33.3 28.3 27.2 39.2 45.5 45.2 48.5 0.5x 0.4x 0.4x -0.1x
KCM 1,910 2,028 2,133 515 470 519 27.3 27.0 23.2 24.4 -1.4 -7.1 -8.7 10.4 3.1 -5.8 -12.8 15.1 63.4 69.4 61.6 77.2 32.0 30.4 23.7 26.2 1.1x 1.6x 2.0x 1.9x
Kolmar Korea 575 719 895 73 82 101 13.1 12.8 11.5 11.2 NA 18.2 12.2 22.0 NA 13.8 5.7 23.4 22.7 21.6 18.6 18.6 31.2 27.6 21.0 22.0 0.2x 0.4x 0.4x 0.2x
Kao 13,408 13,400 13,873 2,188 2,330 2,517 16.2 16.3 17.4 18.1 NA 11.2 6.5 8.0 NA 48.2 3.8 2.9 14.8 19.2 18.3 16.3 31.7 50.3 47.8 44.7 0.0x -0.8x -1.0x -1.2x
Kose 2,239 2,379 2,682 379 408 493 NA 16.9 17.2 18.4 NA NA 7.6 20.8 NA NA 3.9 29.7 NA 14.3 14.2 16.4 NA 33.0 50.3 48.3 NA -1.7x -1.6x -1.3x
LGH&H 5,251 5,556 6,282 829 916 1,086 14.4 15.8 16.5 17.3 NA 22.4 10.5 18.5 NA 20.4 21.2 19.6 25.1 24.9 24.0 22.9 31.1 30.2 29.7 30.8 0.8x 0.4x 0.3x 0.0x
L'Occitane Int'l 1,419 1,492 1,561 246 266 267 20.0 17.3 17.8 17.1 15.1 -5.7 8.2 0.4 14.6 -10.1 22.9 -8.4 15.2 12.9 15.0 12.1 19.6 17.6 20.9 17.9 -1.1x -1.3x -1.5x -1.2x
Natura 2,268 2,591 2,771 384 443 485 18.9 16.9 17.1 17.5 -32.1 -14.3 15.4 9.5 -50.5 -45.8 62.7 22.4 47.7 28.8 37.1 36.8 24.2 25.1 23.8 26.6 1.3x 1.6x 1.2x 0.9x
SA SA Int'l 1,004 994 1,035 75 64 77 12.8 7.5 6.4 7.4 -11.3 -49.4 -15.1 20.2 -10.3 -54.3 -15.2 25.6 48.4 22.4 19.6 24.0 NA 93.7 68.4 55.6 -1.0x -1.8x -1.9x -1.1x
Shiseido 7,822 8,917 9,598 701 1,002 1,181 9.8 9.0 11.2 12.3 NA 13.7 43.0 17.9 NA 53.8 -82.7 NA 5.9 8.2 1.5 13.5 10.5 10.7 18.1 20.7 0.0x 0.0x 0.0x 0.0x
Shanghai Jahwa 793 929 1,049 56 106 135 13.6 7.1 11.5 12.9 -26.1 -55.3 89.5 27.3 NA -90.8 89.1 30.1 46.4 3.9 7.7 9.2 41.6 9.0 15.0 13.6 -4.4x -6.2x -0.5x -1.0x
Average 34,746 35,644 38,685 6,614 7,077 8,101 17.9 19.0 19.9 20.9 -1.9 9.3 15.8 20.3 -0.4 19.8 11.0 25.2 25.4 25.3 22.4 25.8 29.5 42.0 41.1 40.6
DEVELOPED MARKETS
Avon 5,718 5,750 5,802 506 462 471 11.2 8.9 8.0 8.1 -18.1 -41.2 -8.7 1.9 NA NA -20.0 NA NA NA NA NA NA NA NA 25.3 1.9x 2.4x NA NA
Beiersdorf 7,470 7,905 8,656 1,287 1,401 1,582 16.3 17.2 17.7 18.3 -6.4 6.3 8.9 12.9 4.4 7.1 9.5 15.4 16.9 16.0 15.4 14.8 25.9 26.4 28.1 29.4 -0.6x -0.5x -0.9x -1.4x
Church & Dwight 3,493 3,744 4,102 837 897 982 22.4 24.0 24.0 23.9 3.5 13.5 7.2 9.5 NA NA 9.3 29.0 NA 23.5 24.7 29.8 NA 15.6 14.4 16.4 NA 1.1x 2.2x 1.6x
Coty, Inc. 4,349 7,650 9,293 728 1,053 1,386 15.6 16.7 13.8 14.9 0.2 2.0 44.7 31.6 NA NA NA NA NA 40.7 -7.7 4.8 NA 19.3 7.5 4.9 2.9x 3.2x 6.2x 4.8x
Estee Lauder 11,264 11,826 13,190 2,160 2,341 2,771 6.7 19.2 19.8 21.0 3.5 NA 8.4 18.4 NA NA 13.1 26.4 NA 33.6 32.5 34.8 NA 25.5 23.1 24.8 NA 0.6x 1.0x 0.7x
Essity Aktiebolag 11,827 12,835 14,426 1,609 1,984 2,469 14.4 13.6 15.5 17.1 -6.9 -4.3 23.3 24.5 -4.2 -38.9 NA 36.5 14.8 10.0 20.4 21.8 9.1 6.2 9.5 10.2 -0.2x 2.3x NA NA
Henkel 20,704 22,727 24,344 3,701 4,336 4,718 17.2 17.9 19.1 19.4 -2.4 7.4 17.2 8.8 -1.3 6.5 17.5 10.3 15.3 14.3 14.9 14.0 15.0 13.2 13.3 13.7 -0.1x 0.8x 0.3x -0.2x
Kimberly-Clark 18,202 18,290 18,614 3,344 3,341 3,385 3.7 18.4 18.3 18.2 3.5 NA -0.1 1.3 NA NA 3.0 16.1 NA NA NA NA NA 35.6 35.3 38.4 NA 2.0x 2.0x 2.0x
L'Oreal 28,583 29,327 32,814 6,598 6,967 7,849 21.1 23.1 23.8 23.9 -6.2 11.8 5.6 12.7 -41.8 -6.0 17.9 14.1 15.1 12.9 14.1 14.2 24.8 22.6 23.0 24.6 -0.1x -0.1x -0.4x -0.6x
Nu Skin Enterprises 2,208 2,279 2,343 263 251 258 15.8 11.9 11.0 11.0 -30.9 -35.5 -4.4 2.9 NA NA 12.5 26.7 NA 24.6 25.0 28.5 NA 24.6 26.4 33.2 -0.1x 0.2x NA NA
Ontex 2,205 2,699 2,991 262 323 369 12.0 11.9 12.0 12.3 20.8 16.8 23.2 14.3 NA 12.1 13.6 17.4 12.9 13.0 12.8 12.0 9.9 9.6 9.5 9.3 -0.2x 2.8x NA NA
Procter & Gamble 65,299 65,058 66,955 17,125 17,174 17,751 0.9 26.2 26.4 26.5 3.5 NA 0.3 3.4 NA NA 8.7 5.6 NA 17.6 18.4 20.2 NA 12.6 13.3 14.3 NA 1.4x 1.5x 1.4x
Average 181,321 190,090 203,529 38,418 40,530 43,991 6.1 21.2 21.3 21.6 -0.5 1.5 7.4 9.7 -15.5 0.5 11.7 16.9 3.7 15.3 15.0 16.4 4.6 17.4 17.4 19.2
ROE (%) ROIC (%) Net Debt/ EBITDASales (USDm) EBITDA (USDm) EBITDA Margin (%) EBITDA Growth (%) EPS Growth (%)
Note: For additional information on all stocks mentioned here please refer to our website at: http://gm.db.com
Source: Company reports and Deutsche Bank estimates
21
Janu
ary 201
8
Beverag
es
Latam C
on
sum
er Mo
nth
ly

21 January 2018
Beverages
Latam Consumer Monthly
Historical ValuationMultiplesBelow are the updated valuation charts for each company in our coverage. Thefirst chart in each row is a 10-year EV/EBITDA chart (or less in companies thatcame public less than 10 years ago). The second is a 10-year P/E chart, but incases where P/E ratios are not meaningful, we have included a Price/Book Valuechart (and in some cases, a sum-of-the-parts analysis).
LatAm Food stocks
Figure 109: Brasil Foods - 12-Month Forward EV/EBITDA Figure 110: Brasil Foods -12-Month Forward P/E
0x
2x
4x
6x
8x
10x
12x
14x
16x
18x
20x
Jan
-08
Ma
y-0
8
Se
p-0
8
Jan-0
9
Ma
y-0
9
Se
p-0
9
Jan-1
0
Ma
y-1
0
Se
p-1
0
Jan-1
1
Ma
y-1
1
Se
p-1
1
Jan-1
2
Ma
y-1
2
Se
p-1
2
Jan
-13
Ma
y-1
3
Se
p-1
3
Jan
-14
Ma
y-1
4
Se
p-1
4
Jan
-15
Ma
y-1
5
Se
p-1
5
Jan
-16
Ma
y-1
6
Se
p-1
6
Jan
-17
Ma
y-1
7
Se
p-1
7
Jan
-18
12-Month Forward EV/EBITDA -1 Std Dev Avg +1 Std Dev
0x
10x
20x
30x
40x
50x
60x
70x
80x
90x
100x
Jan
-10
Ma
y-1
0
Se
p-1
0
Jan
-11
Ma
y-1
1
Se
p-1
1
Jan
-12
May-1
2
Se
p-1
2
Jan
-13
Ma
y-1
3
Se
p-1
3
Jan
-14
Ma
y-1
4
Se
p-1
4
Jan
-15
Ma
y-1
5
Se
p-1
5
Jan
-16
Ma
y-1
6
Se
p-1
6
Jan
-17
Ma
y-1
7
Se
p-1
7
Jan
-18
12-Month Forward PE -1 Std Dev Avg +1 Std Dev
Source: Company reports and Deutsche Bank estimates Source: Company reports and Deutsche Bank estimates
Figure 111: Grupo Bimbo - 12-Month Forward EV/EBITDA
Figure 112: Grupo Bimbo -12-Month Forward P/E
0x
2x
4x
6x
8x
10x
12x
14x
16x
18x
Jan
-08
Ma
y-0
8
Se
p-0
8
Jan-0
9
Ma
y-0
9
Se
p-0
9
Jan-1
0
Ma
y-1
0
Se
p-1
0
Jan-1
1
Ma
y-1
1
Se
p-1
1
Jan-1
2
Ma
y-1
2
Se
p-1
2
Jan
-13
Ma
y-1
3
Se
p-1
3
Jan
-14
Ma
y-1
4
Se
p-1
4
Jan
-15
Ma
y-1
5
Se
p-1
5
Jan
-16
Ma
y-1
6
Se
p-1
6
Jan
-17
Ma
y-1
7
Se
p-1
7
Jan
-18
12-Month Forward EV/EBITDA -1 Std Dev Avg +1 Std Dev
0x
10x
20x
30x
40x
50x
60x
70x
Jan
-08
Ma
y-0
8
Se
p-0
8
Jan
-09
Ma
y-0
9
Se
p-0
9
Jan
-10
Ma
y-1
0
Se
p-1
0
Jan
-11
Ma
y-1
1
Se
p-1
1
Jan
-12
Ma
y-1
2
Se
p-1
2
Jan
-13
May-1
3
Sep-1
3
Jan
-14
Ma
y-1
4
Se
p-1
4
Jan
-15
Ma
y-1
5
Se
p-1
5
Jan
-16
Ma
y-1
6
Se
p-1
6
Jan
-17
Ma
y-1
7
Se
p-1
7
Jan
-18
12-Month Forward PE -1 Std Dev Avg +1 Std Dev
Source: Company reports and Deutsche Bank estimates Source: Company reports and Deutsche Bank estimates
Page 52 Deutsche Bank Securities Inc.

21 January 2018
Beverages
Latam Consumer Monthly
Figure 113: Gruma -12-Month Forward EV/EBITDA Figure 114: Gruma - SOTP Analysis
0x
2x
4x
6x
8x
10x
12x
14x
Jan
-08
Ma
y-0
8
Se
p-0
8
Jan-0
9
Ma
y-0
9
Se
p-0
9
Jan-1
0
Ma
y-1
0
Se
p-1
0
Jan-1
1
Ma
y-1
1
Se
p-1
1
Jan-1
2
Ma
y-1
2
Se
p-1
2
Jan
-13
Ma
y-1
3
Se
p-1
3
Jan
-14
Ma
y-1
4
Se
p-1
4
Jan
-15
Ma
y-1
5
Se
p-1
5
Jan
-16
Ma
y-1
6
Se
p-1
6
Jan
-17
Ma
y-1
7
Se
p-1
7
Jan
-18
12-Month Forward EV/EBITDA -1 Std Dev Avg +1 Std Dev
2019E EBITDA
Target
EV/EBITDA 31-Dec-18
Gruma USA 380 13.3 5,070
Gruma Europe 36 10.0 366
GIMSA 208 8.9 1,854
Gruma Venezuela 0
Gruma Centroamerica 30 8.9 270
Other/ Eliminations 33 13.3 437
TOTAL 687 11.6 7,996
Less buy out of minorities -4
Less net debt -619
Equity value 7,373
Number of shares (million) 433
Equity value per share (in pesos) 332
Source: Company reports and Deutsche Bank estimates Source:Company reports and Deutsche Bank estimates
Figure 115: JBS -12-Month Forward EV/EBITDA Figure 116: JBS -12-Month Forward P/BV
2x
4x
6x
8x
10x
12x
14x
16x
18x
Jan
-09
Ma
y-0
9
Se
p-0
9
Jan
-10
Ma
y-1
0
Se
p-1
0
Jan
-11
Ma
y-1
1
Se
p-1
1
Jan
-12
Ma
y-1
2
Se
p-1
2
Jan
-13
Ma
y-1
3
Se
p-1
3
Jan
-14
Ma
y-1
4
Se
p-1
4
Jan
-15
Ma
y-1
5
Se
p-1
5
Jan
-16
Ma
y-1
6
Se
p-1
6
Jan
-17
Ma
y-1
7
Se
p-1
7
Jan
-18
12-Month Forward EV/EBITDA -1 Std Dev Avg +1 Std Dev
0.0x
0.5x
1.0x
1.5x
2.0x
2.5x
Jan
-09
Ma
y-0
9
Se
p-0
9
Jan
-10
Ma
y-1
0
Se
p-1
0
Jan
-11
Ma
y-1
1
Se
p-1
1
Jan
-12
Ma
y-1
2
Se
p-1
2
Jan
-13
Ma
y-1
3
Se
p-1
3
Jan
-14
Ma
y-1
4
Se
p-1
4
Jan
-15
Ma
y-1
5
Se
p-1
5
Jan
-16
Ma
y-1
6
Se
p-1
6
Jan
-17
Ma
y-1
7
Se
p-1
7
Jan
-18
12-Month Forward PBV -1 Std Dev Avg +1 Std Dev
Source: Company reports and Deutsche Bank estimates Source: Company reports and Deutsche Bank estimates
Figure 117: Minerva -12-Month Forward EV/EBITDA
3x
4x
5x
6x
7x
8x
9x
10x
Jan
-09
Ma
y-0
9
Se
p-0
9
Jan
-10
Ma
y-1
0
Se
p-1
0
Jan
-11
Ma
y-1
1
Se
p-1
1
Jan
-12
Ma
y-1
2
Se
p-1
2
Jan
-13
Ma
y-1
3
Se
p-1
3
Jan
-14
Ma
y-1
4
Se
p-1
4
Jan
-15
Ma
y-1
5
Se
p-1
5
Jan
-16
Ma
y-1
6
Se
p-1
6
Jan
-17
Ma
y-1
7
Se
p-1
7
Jan
-18
12-Month Forward EV/EBITDA -1 Std Dev Avg +1 Std Dev
Source: Company reports and Deutsche Bank estimates
Deutsche Bank Securities Inc. Page 53

21 January 2018
Beverages
Latam Consumer Monthly
LatAm Beverage stocks
Figure 118: AmBev - 12-Month Forward EV/EBITDA Figure 119: AmBev - 12-Month Forward P/E
0x
2x
4x
6x
8x
10x
12x
14x
16x
18x
20x
Jan
-08
Ma
y-0
8
Se
p-0
8
Jan-0
9
Ma
y-0
9
Se
p-0
9
Jan-1
0
Ma
y-1
0
Se
p-1
0
Jan-1
1
Ma
y-1
1
Se
p-1
1
Jan-1
2
Ma
y-1
2
Se
p-1
2
Jan
-13
Ma
y-1
3
Se
p-1
3
Jan
-14
Ma
y-1
4
Se
p-1
4
Jan
-15
Ma
y-1
5
Se
p-1
5
Jan
-16
Ma
y-1
6
Se
p-1
6
Jan
-17
Ma
y-1
7
Se
p-1
7
Jan
-18
12-Month Forward EV/EBITDA -1 Std Dev Avg +1 Std Dev
0x
5x
10x
15x
20x
25x
30x
35x
40x
Jan
-08
Ma
y-0
8
Se
p-0
8
Jan
-09
Ma
y-0
9
Se
p-0
9
Jan
-10
Ma
y-1
0
Se
p-1
0
Jan
-11
Ma
y-1
1
Se
p-1
1
Jan
-12
Ma
y-1
2
Se
p-1
2
Jan
-13
May-1
3
Sep-1
3
Jan
-14
Ma
y-1
4
Se
p-1
4
Jan
-15
Ma
y-1
5
Se
p-1
5
Jan
-16
Ma
y-1
6
Se
p-1
6
Jan
-17
Ma
y-1
7
Se
p-1
7
Jan
-18
12-Month Forward PE -1 Std Dev Avg +1 Std Dev
Source: Company reports and Deutsche Bank estimates Source: Company reports and Deutsche Bank estimates
Figure 120: Andina - 12-Month Forward EV/EBITDA Figure 121: Andina - 12-Month Forward P/E
0x
2x
4x
6x
8x
10x
12x
14x
16x
Jan
-08
Ma
y-0
8
Se
p-0
8
Jan-0
9
Ma
y-0
9
Se
p-0
9
Jan-1
0
Ma
y-1
0
Se
p-1
0
Jan-1
1
Ma
y-1
1
Se
p-1
1
Jan-1
2
Ma
y-1
2
Se
p-1
2
Jan
-13
Ma
y-1
3
Se
p-1
3
Jan
-14
Ma
y-1
4
Se
p-1
4
Jan
-15
Ma
y-1
5
Se
p-1
5
Jan
-16
Ma
y-1
6
Se
p-1
6
Jan
-17
Ma
y-1
7
Se
p-1
7
Jan
-18
12-Month Forward EV/EBITDA -1 Std Dev Avg +1 Std Dev
0x
5x
10x
15x
20x
25x
30x
35x
40x
45xJan
-08
Ma
y-0
8
Se
p-0
8
Jan
-09
Ma
y-0
9
Se
p-0
9
Jan
-10
Ma
y-1
0
Se
p-1
0
Jan
-11
Ma
y-1
1
Se
p-1
1
Jan
-12
Ma
y-1
2
Se
p-1
2
Jan
-13
May-1
3
Sep-1
3
Jan
-14
Ma
y-1
4
Se
p-1
4
Jan
-15
Ma
y-1
5
Se
p-1
5
Jan
-16
Ma
y-1
6
Se
p-1
6
Jan
-17
Ma
y-1
7
Se
p-1
7
Jan
-18
12-Month Forward PE -1 Std Dev Avg +1 Std Dev
Source: Company reports and Deutsche Bank estimates Source:Company reports and Deutsche Bank estimates
Figure 122: Arca Continental - 12-Month Forward EV/EBITDA
Figure 123: Arca Continental - 12-Month Forward P/E
0x
2x
4x
6x
8x
10x
12x
14x
16x
Jan
-08
Ma
y-0
8
Se
p-0
8
Jan-0
9
Ma
y-0
9
Se
p-0
9
Jan-1
0
Ma
y-1
0
Se
p-1
0
Jan-1
1
Ma
y-1
1
Se
p-1
1
Jan-1
2
Ma
y-1
2
Se
p-1
2
Jan
-13
Ma
y-1
3
Se
p-1
3
Jan
-14
Ma
y-1
4
Se
p-1
4
Jan
-15
Ma
y-1
5
Se
p-1
5
Jan
-16
Ma
y-1
6
Se
p-1
6
Jan
-17
Ma
y-1
7
Se
p-1
7
Jan
-18
12-Month Forward EV/EBITDA -1 Std Dev Avg +1 Std Dev
0x
5x
10x
15x
20x
25x
30x
35x
Jan
-08
Ma
y-0
8
Se
p-0
8
Jan
-09
Ma
y-0
9
Se
p-0
9
Jan
-10
Ma
y-1
0
Se
p-1
0
Jan
-11
Ma
y-1
1
Se
p-1
1
Jan
-12
Ma
y-1
2
Se
p-1
2
Jan
-13
May-1
3
Sep-1
3
Jan
-14
Ma
y-1
4
Se
p-1
4
Jan
-15
Ma
y-1
5
Se
p-1
5
Jan
-16
Ma
y-1
6
Se
p-1
6
Jan
-17
Ma
y-1
7
Se
p-1
7
Jan
-18
12-Month Forward PE -1 Std Dev Avg +1 Std Dev
Source: Company reports and Deutsche Bank estimates Source: Company reports and Deutsche Bank estimates
Page 54 Deutsche Bank Securities Inc.

21 January 2018
Beverages
Latam Consumer Monthly
Figure 124: CCU - 12-Month Forward EV/EBITDA Figure 125: CCU - 12-Month Forward P/E
3x
4x
5x
6x
7x
8x
9x
10x
11x
12x
13x
Jan
-08
Ma
y-0
8
Se
p-0
8
Jan-0
9
Ma
y-0
9
Se
p-0
9
Jan-1
0
Ma
y-1
0
Se
p-1
0
Jan-1
1
Ma
y-1
1
Se
p-1
1
Jan-1
2
Ma
y-1
2
Se
p-1
2
Jan
-13
Ma
y-1
3
Se
p-1
3
Jan
-14
Ma
y-1
4
Se
p-1
4
Jan
-15
Ma
y-1
5
Se
p-1
5
Jan
-16
Ma
y-1
6
Se
p-1
6
Jan
-17
Ma
y-1
7
Se
p-1
7
Jan
-18
12-Month Forward EV/EBITDA -1 Std Dev Avg +1 Std Dev
0x
5x
10x
15x
20x
25x
30x
35x
Jan
-08
Ma
y-0
8
Se
p-0
8
Jan
-09
Ma
y-0
9
Se
p-0
9
Jan
-10
Ma
y-1
0
Se
p-1
0
Jan
-11
Ma
y-1
1
Se
p-1
1
Jan
-12
Ma
y-1
2
Se
p-1
2
Jan
-13
May-1
3
Sep-1
3
Jan
-14
Ma
y-1
4
Se
p-1
4
Jan
-15
Ma
y-1
5
Se
p-1
5
Jan
-16
Ma
y-1
6
Se
p-1
6
Jan
-17
Ma
y-1
7
Se
p-1
7
Jan
-18
12-Month Forward PE -1 Std Dev Avg +1 Std Dev
Source: Company reports and Deutsche Bank estimates Source: Company reports and Deutsche Bank estimates
Figure 126: Coke Femsa - 12-Month Forward EV/EBITDA Figure 127: Coke Femsa - 12-Month Forward P/E
0x
2x
4x
6x
8x
10x
12x
14x
16x
18x
20x
Jan
-08
Ma
y-0
8
Se
p-0
8
Jan-0
9
Ma
y-0
9
Se
p-0
9
Jan-1
0
Ma
y-1
0
Se
p-1
0
Jan-1
1
Ma
y-1
1
Se
p-1
1
Jan-1
2
Ma
y-1
2
Se
p-1
2
Jan
-13
Ma
y-1
3
Se
p-1
3
Jan
-14
Ma
y-1
4
Se
p-1
4
Jan
-15
Ma
y-1
5
Se
p-1
5
Jan
-16
Ma
y-1
6
Se
p-1
6
Jan
-17
Ma
y-1
7
Se
p-1
7
Jan
-18
12-Month Forward EV/EBITDA -1 Std Dev Avg +1 Std Dev
0x
5x
10x
15x
20x
25x
30x
35x
40x
45x
Jan
-08
Ma
y-0
8
Se
p-0
8
Jan
-09
Ma
y-0
9
Se
p-0
9
Jan
-10
Ma
y-1
0
Se
p-1
0
Jan
-11
Ma
y-1
1
Se
p-1
1
Jan
-12
Ma
y-1
2
Se
p-1
2
Jan
-13
May-1
3
Sep-1
3
Jan
-14
Ma
y-1
4
Se
p-1
4
Jan
-15
Ma
y-1
5
Se
p-1
5
Jan
-16
Ma
y-1
6
Se
p-1
6
Jan
-17
Ma
y-1
7
Se
p-1
7
Jan
-18
12-Month Forward PE -1 Std Dev Avg +1 Std Dev
Source: Company reports and Deutsche Bank estimates Source: Company reports and Deutsche Bank estimates
Figure 128: Concha y Toro -12-Month Forward EV/EBITDA
Figure 129: Concha y Toro -12-Month Forward P/E
0x
5x
10x
15x
20x
25x
Jan
-08
Ma
y-0
8
Se
p-0
8
Jan-0
9
Ma
y-0
9
Se
p-0
9
Jan-1
0
Ma
y-1
0
Se
p-1
0
Jan-1
1
Ma
y-1
1
Se
p-1
1
Jan-1
2
Ma
y-1
2
Se
p-1
2
Jan
-13
Ma
y-1
3
Se
p-1
3
Jan
-14
Ma
y-1
4
Se
p-1
4
Jan
-15
Ma
y-1
5
Se
p-1
5
Jan
-16
Ma
y-1
6
Se
p-1
6
Jan
-17
Ma
y-1
7
Se
p-1
7
Jan
-18
12-Month Forward EV/EBITDA -1 Std Dev Avg +1 Std Dev
0x
5x
10x
15x
20x
25x
30x
35x
40x
45x
Jan
-08
Ma
y-0
8
Se
p-0
8
Jan
-09
Ma
y-0
9
Se
p-0
9
Jan
-10
Ma
y-1
0
Se
p-1
0
Jan
-11
Ma
y-1
1
Se
p-1
1
Jan
-12
Ma
y-1
2
Se
p-1
2
Jan
-13
May-1
3
Sep-1
3
Jan
-14
Ma
y-1
4
Se
p-1
4
Jan
-15
Ma
y-1
5
Se
p-1
5
Jan
-16
Ma
y-1
6
Se
p-1
6
Jan
-17
Ma
y-1
7
Se
p-1
7
Jan
-18
12-Month Forward PE -1 Std Dev Avg +1 Std Dev
Source: Company reports and Deutsche Bank estimates Source: Company reports and Deutsche Bank estimates
Deutsche Bank Securities Inc. Page 55

21 January 2018
Beverages
Latam Consumer Monthly
Figure 130: Femsa - 12-Month Forward EV/EBITDA Figure 131: Femsa - 12-Month Forward P/E
0x
2x
4x
6x
8x
10x
12x
14x
16x
18x
Jan
-08
Ma
y-0
8
Se
p-0
8
Jan-0
9
Ma
y-0
9
Se
p-0
9
Jan-1
0
Ma
y-1
0
Se
p-1
0
Jan-1
1
Ma
y-1
1
Se
p-1
1
Jan-1
2
Ma
y-1
2
Se
p-1
2
Jan
-13
Ma
y-1
3
Se
p-1
3
Jan
-14
Ma
y-1
4
Se
p-1
4
Jan
-15
Ma
y-1
5
Se
p-1
5
Jan
-16
Ma
y-1
6
Se
p-1
6
Jan
-17
Ma
y-1
7
Se
p-1
7
Jan
-18
12-Month Forward EV/EBITDA -1 Std Dev Avg +1 Std Dev
0x
5x
10x
15x
20x
25x
30x
35x
40x
Jan
-08
Ma
y-0
8
Se
p-0
8
Jan
-09
Ma
y-0
9
Se
p-0
9
Jan
-10
Ma
y-1
0
Se
p-1
0
Jan
-11
Ma
y-1
1
Se
p-1
1
Jan
-12
Ma
y-1
2
Se
p-1
2
Jan
-13
May-1
3
Sep-1
3
Jan
-14
Ma
y-1
4
Se
p-1
4
Jan
-15
Ma
y-1
5
Se
p-1
5
Jan
-16
Ma
y-1
6
Se
p-1
6
Jan
-17
Ma
y-1
7
Se
p-1
7
Jan
-18
12-Month Forward PE -1 Std Dev Avg +1 Std Dev
Source: Company reports and Deutsche Bank estimates Source: Company reports and Deutsche Bank estimates
Figure 132: FEMSA - Market Cap minus Sum of theParts (USD millions)
Figure 133: Femsa - SOTP Analysis (USD millions)
($6,000)
($4,000)
($2,000)
$0
$2,000
$4,000
$6,000
Ap
r-10
Au
g-1
0
Nov-1
0
Feb-1
1
May-1
1
Se
p-1
1
Dec-1
1
Mar-
12
Jun
-12
Oct-
12
Jan
-13
Ap
r-13
Jul-1
3
Nov-1
3
Feb-1
4
May-1
4
Au
g-1
4
Dec-1
4
Mar-
15
Jun
-15
Oct-
15
Jan
-16
Ap
r-16
Jul-1
6
Oct-
16
Fe
b-1
7
May-1
7
Au
g-1
7
Dec-1
7
Business Unit Valuation Method
Implied
Multiple
Imputed
Value
%
Ownership
Value
($MM)
Heineken NV Stock Spot price $106 $60,682 8.7% $5,291
Heineken Hold. Stock Spot price $101 $57,496 6.2% $3,563
Other Associates Book Value Multiple 2.0 Various (bet. 20-49%) $2,592
Coca-Cola FEMSA Equity Market Value $15,317 47.2% $7,233
FEMSA Comercio EBITDA Mult. (12-mo. fwd.) 13.3 $16,133 100.0% $16,133
Ancillary units EBITDA Mult. (12-mo. fwd.) 8.0 $406 100.0% $406
Breakup Value $35,218
- Net Debt (excl. KOF) + Contingent Cap Gain Tax (3Q17) ($456)
Net Equity Value $35,675
Current Equity Value $34,888Current Premium/(Discount) to Breakup Value -2%
Implied Sum-of-the-Parts Value per ADS TODAY $99.70Implied Sum-of-the-Parts Value per ADS in 12 months $109.26
Source: Company reports and Deutsche Bank estimates Source: Company reports and Deutsche Bank estimates
Page 56 Deutsche Bank Securities Inc.

21 January 2018
Beverages
Latam Consumer Monthly
LatAm Household & Personal Care stocks
Figure 134: KCM - 12-Month Forward EV/EBITDA Figure 135: KCM - 12-Month Forward P/E
0x
2x
4x
6x
8x
10x
12x
14x
16x
18x
20x
Jan
-08
Ma
y-0
8
Se
p-0
8
Jan-0
9
Ma
y-0
9
Se
p-0
9
Jan-1
0
Ma
y-1
0
Se
p-1
0
Jan-1
1
Ma
y-1
1
Se
p-1
1
Jan-1
2
Ma
y-1
2
Se
p-1
2
Jan
-13
Ma
y-1
3
Se
p-1
3
Jan
-14
Ma
y-1
4
Se
p-1
4
Jan
-15
Ma
y-1
5
Se
p-1
5
Jan
-16
Ma
y-1
6
Se
p-1
6
Jan
-17
Ma
y-1
7
Se
p-1
7
Jan
-18
12-Month Forward EV/EBITDA -1 Std Dev Avg +1 Std Dev
0x
5x
10x
15x
20x
25x
30x
35x
40x
Jan
-08
Ma
y-0
8
Se
p-0
8
Jan
-09
Ma
y-0
9
Se
p-0
9
Jan
-10
Ma
y-1
0
Se
p-1
0
Jan
-11
Ma
y-1
1
Se
p-1
1
Jan
-12
Ma
y-1
2
Se
p-1
2
Jan
-13
May-1
3
Sep-1
3
Jan
-14
Ma
y-1
4
Se
p-1
4
Jan
-15
Ma
y-1
5
Se
p-1
5
Jan
-16
Ma
y-1
6
Se
p-1
6
Jan
-17
Ma
y-1
7
Se
p-1
7
Jan
-18
12-Month Forward PE -1 Std Dev Avg +1 Std Dev
Source: Company reports and Deutsche Bank estimates Source: Company reports and Deutsche Bank estimates
Figure 136: Natura - 12-Month Forward EV/EBITDA Figure 137: Natura - 12-Month Forward P/E
0x
2x
4x
6x
8x
10x
12x
14x
16x
18x
20x
Jan
-13
Ma
y-1
3
Se
p-1
3
Jan
-14
Ma
y-1
4
Se
p-1
4
Jan
-15
Ma
y-1
5
Se
p-1
5
Jan
-16
Ma
y-1
6
Se
p-1
6
Jan
-17
Ma
y-1
7
Se
p-1
7
Jan
-18
12-Month Forward EV/EBITDA -1 Std Dev Avg +1 Std Dev
0x
5x
10x
15x
20x
25x
30x
35x
40x
45xJan
-13
Ma
y-1
3
Se
p-1
3
Jan
-14
Ma
y-1
4
Se
p-1
4
Jan
-15
Ma
y-1
5
Se
p-1
5
Jan
-16
Ma
y-1
6
Se
p-1
6
Jan
-17
Ma
y-1
7
Se
p-1
7
Jan
-18
12-Month Forward PE -1 Std Dev Avg +1 Std Dev
Source:Company reports and Deutsche Bank estimates Source: Company reports and Deutsche Bank estimates
Deutsche Bank Securities Inc. Page 57

21 January 2018
Beverages
Latam Consumer Monthly
LatAm Retail stocks
Figure 138: Arezzo & Co. - 12-Month Forward EV/EBITDA
Figure 139: Arezzo & Co. - 12-Month Forward P/E
0x
5x
10x
15x
20x
25x
30x
Jan
-13
Ma
y-1
3
Se
p-1
3
Jan
-14
Ma
y-1
4
Se
p-1
4
Jan
-15
Ma
y-1
5
Se
p-1
5
Jan
-16
Ma
y-1
6
Se
p-1
6
Jan
-17
Ma
y-1
7
Se
p-1
7
Jan
-18
12-Month Forward EV/EBITDA -1 Std Dev Avg +1 Std Dev
0x
5x
10x
15x
20x
25x
30x
35x
40x
45x
Jan
-13
Ma
y-1
3
Se
p-1
3
Jan
-14
Ma
y-1
4
Se
p-1
4
Jan
-15
Ma
y-1
5
Se
p-1
5
Jan
-16
Ma
y-1
6
Se
p-1
6
Jan
-17
Ma
y-1
7
Se
p-1
7
Jan
-18
12-Month Forward PE -1 Std Dev Avg +1 Std Dev
Source: Company reports and Deutsche Bank estimates Source: Company reports and Deutsche Bank estimates
Figure 140: B2W - 12-Month Forward EV/EBITDA Figure 141: B2W - 12-Month Forward Price/BV
0x
10x
20x
30x
40x
50x
60x
Jan
-13
Ma
y-1
3
Se
p-1
3
Jan
-14
Ma
y-1
4
Se
p-1
4
Jan
-15
Ma
y-1
5
Se
p-1
5
Jan
-16
Ma
y-1
6
Se
p-1
6
Jan
-17
Ma
y-1
7
Se
p-1
7
Jan
-18
12-Month Forward EV/EBITDA -1 Std Dev Avg +1 Std Dev
0.0x
2.0x
4.0x
6.0x
8.0x
10.0x
12.0x
14.0x
16.0xJan
-13
Ma
y-1
3
Se
p-1
3
Jan
-14
Ma
y-1
4
Se
p-1
4
Jan
-15
Ma
y-1
5
Se
p-1
5
Jan
-16
Ma
y-1
6
Se
p-1
6
Jan
-17
Ma
y-1
7
Se
p-1
7
Jan
-18
12-Month Forward PBV -1 Std Dev Avg +1 Std Dev
Source: Company reports and Deutsche Bank estimates Source: Company reports and Deutsche Bank estimates
Figure 142: CBD - 12-Month Forward EV/EBITDA Figure 143: CBD - 12-Month Forward P/E
0x
2x
4x
6x
8x
10x
12x
14x
16x
18x
20x
Jan
-13
Ma
y-1
3
Se
p-1
3
Jan
-14
Ma
y-1
4
Se
p-1
4
Jan
-15
Ma
y-1
5
Se
p-1
5
Jan
-16
Ma
y-1
6
Se
p-1
6
Jan
-17
Ma
y-1
7
Se
p-1
7
Jan
-18
12-Month Forward EV/EBITDA -1 Std Dev Avg +1 Std Dev
0x
20x
40x
60x
80x
100x
120x
Jan
-13
Ma
y-1
3
Se
p-1
3
Jan
-14
Ma
y-1
4
Se
p-1
4
Jan
-15
Ma
y-1
5
Se
p-1
5
Jan
-16
Ma
y-1
6
Se
p-1
6
Jan
-17
Ma
y-1
7
Se
p-1
7
Jan
-18
12-Month Forward PE -1 Std Dev Avg +1 Std Dev
Source: Company reports and Deutsche Bank estimates Source: Company reports and Deutsche Bank estimates
Page 58 Deutsche Bank Securities Inc.

21 January 2018
Beverages
Latam Consumer Monthly
Figure 144: Cencosud - 12-Month Forward EV/EBITDA Figure 145: Cencosud - 12-Month Forward P/E
0x
2x
4x
6x
8x
10x
12x
14x
16x
18x
Jan
-08
Ma
y-0
8
Se
p-0
8
Jan-0
9
Ma
y-0
9
Se
p-0
9
Jan-1
0
Ma
y-1
0
Se
p-1
0
Jan-1
1
Ma
y-1
1
Se
p-1
1
Jan-1
2
Ma
y-1
2
Se
p-1
2
Jan
-13
Ma
y-1
3
Se
p-1
3
Jan
-14
Ma
y-1
4
Se
p-1
4
Jan
-15
Ma
y-1
5
Se
p-1
5
Jan
-16
Ma
y-1
6
Se
p-1
6
Jan
-17
Ma
y-1
7
Se
p-1
7
Jan
-18
12-Month Forward EV/EBITDA -1 Std Dev Avg +1 Std Dev
0x
5x
10x
15x
20x
25x
30x
35x
40x
Jan
-08
Ma
y-0
8
Se
p-0
8
Jan
-09
Ma
y-0
9
Se
p-0
9
Jan
-10
Ma
y-1
0
Se
p-1
0
Jan
-11
Ma
y-1
1
Se
p-1
1
Jan
-12
Ma
y-1
2
Se
p-1
2
Jan
-13
May-1
3
Sep-1
3
Jan
-14
Ma
y-1
4
Se
p-1
4
Jan
-15
Ma
y-1
5
Se
p-1
5
Jan
-16
Ma
y-1
6
Se
p-1
6
Jan
-17
Ma
y-1
7
Se
p-1
7
Jan
-18
12-Month Forward PE -1 Std Dev Avg +1 Std Dev
Source: Company reports and Deutsche Bank estimates Source: Company reports and Deutsche Bank estimates
Figure 146: Chedraui - 12-Month Forward EV/EBITDA Figure 147: Chedraui - 12-Month Forward P/E
0x
2x
4x
6x
8x
10x
12x
14x
Jan
-11
Ma
y-1
1
Se
p-1
1
Jan
-12
Ma
y-1
2
Se
p-1
2
Jan
-13
Ma
y-1
3
Se
p-1
3
Jan
-14
Ma
y-1
4
Se
p-1
4
Jan-1
5
Ma
y-1
5
Se
p-1
5
Jan
-16
Ma
y-1
6
Se
p-1
6
Jan
-17
Ma
y-1
7
Se
p-1
7
Jan
-18
12-Month Forward EV/EBITDA -1 Std Dev Avg +1 Std Dev
0x
5x
10x
15x
20x
25x
30x
35x
Jan
-11
May-1
1
Se
p-1
1
Jan
-12
Ma
y-1
2
Se
p-1
2
Jan
-13
Ma
y-1
3
Se
p-1
3
Jan
-14
Ma
y-1
4
Se
p-1
4
Jan
-15
Ma
y-1
5
Se
p-1
5
Jan
-16
Ma
y-1
6
Se
p-1
6
Jan
-17
Ma
y-1
7
Se
p-1
7
Jan
-18
12-Month Forward PE -1 Std Dev Avg +1 Std Dev
Source: Company reports and Deutsche Bank estimates Source: Company reports and Deutsche Bank estimates
Figure 148: Cia Hering - 12-Month Forward EV/EBITDA Figure 149: Cia Hering - 12-Month Forward P/E
0x
5x
10x
15x
20x
25x
30x
Jan
-13
Ma
y-1
3
Se
p-1
3
Jan
-14
Ma
y-1
4
Se
p-1
4
Jan
-15
Ma
y-1
5
Se
p-1
5
Jan
-16
Ma
y-1
6
Se
p-1
6
Jan
-17
Ma
y-1
7
Se
p-1
7
Jan
-18
12-Month Forward EV/EBITDA -1 Std Dev Avg +1 Std Dev
0x
5x
10x
15x
20x
25x
30x
35x
Jan
-13
Ma
y-1
3
Se
p-1
3
Jan
-14
Ma
y-1
4
Se
p-1
4
Jan
-15
Ma
y-1
5
Se
p-1
5
Jan
-16
Ma
y-1
6
Se
p-1
6
Jan
-17
Ma
y-1
7
Se
p-1
7
Jan
-18
12-Month Forward PE -1 Std Dev Avg +1 Std Dev
Source: Company reports and Deutsche Bank estimates Source: Company reports and Deutsche Bank estimates
Deutsche Bank Securities Inc. Page 59
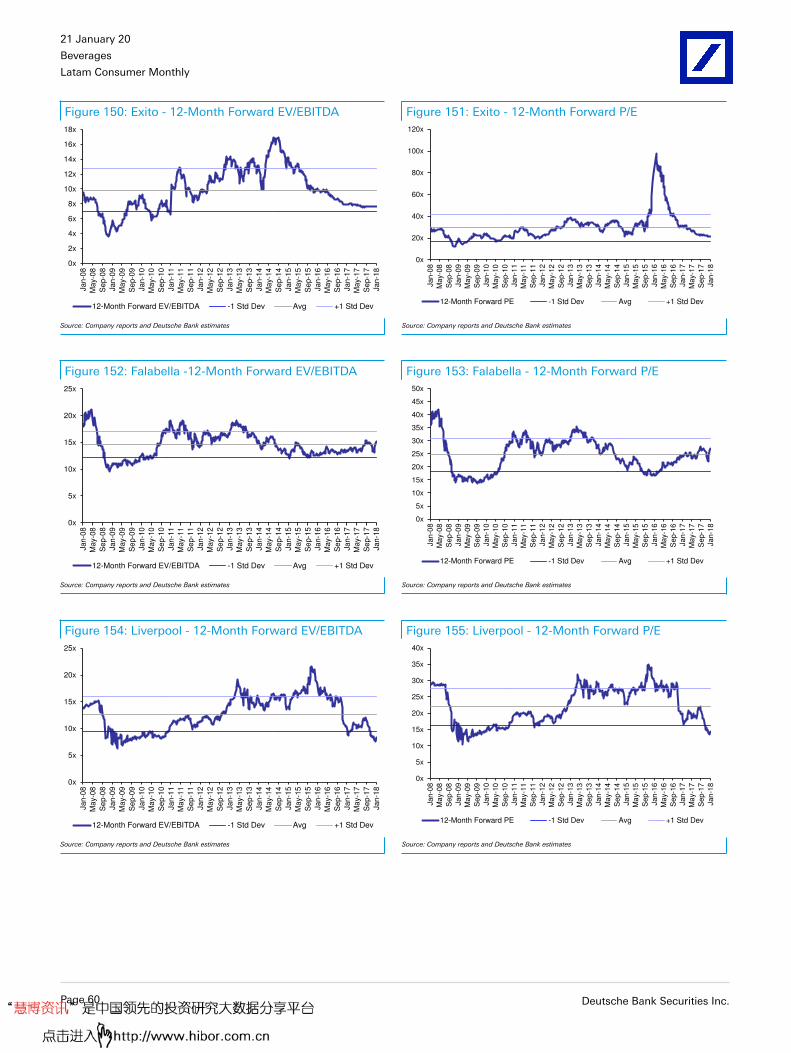
21 January 2018
Beverages
Latam Consumer Monthly
Figure 150: Exito - 12-Month Forward EV/EBITDA Figure 151: Exito - 12-Month Forward P/E
0x
2x
4x
6x
8x
10x
12x
14x
16x
18x
Jan
-08
Ma
y-0
8
Se
p-0
8
Jan-0
9
Ma
y-0
9
Se
p-0
9
Jan-1
0
Ma
y-1
0
Se
p-1
0
Jan-1
1
Ma
y-1
1
Se
p-1
1
Jan-1
2
Ma
y-1
2
Se
p-1
2
Jan
-13
Ma
y-1
3
Se
p-1
3
Jan
-14
Ma
y-1
4
Se
p-1
4
Jan
-15
Ma
y-1
5
Se
p-1
5
Jan
-16
Ma
y-1
6
Se
p-1
6
Jan
-17
Ma
y-1
7
Se
p-1
7
Jan
-18
12-Month Forward EV/EBITDA -1 Std Dev Avg +1 Std Dev
0x
20x
40x
60x
80x
100x
120x
Jan
-08
Ma
y-0
8
Se
p-0
8
Jan
-09
Ma
y-0
9
Se
p-0
9
Jan
-10
Ma
y-1
0
Se
p-1
0
Jan
-11
Ma
y-1
1
Se
p-1
1
Jan
-12
Ma
y-1
2
Se
p-1
2
Jan
-13
May-1
3
Sep-1
3
Jan
-14
Ma
y-1
4
Se
p-1
4
Jan
-15
Ma
y-1
5
Se
p-1
5
Jan
-16
Ma
y-1
6
Se
p-1
6
Jan
-17
Ma
y-1
7
Se
p-1
7
Jan
-18
12-Month Forward PE -1 Std Dev Avg +1 Std Dev
Source: Company reports and Deutsche Bank estimates Source: Company reports and Deutsche Bank estimates
Figure 152: Falabella -12-Month Forward EV/EBITDA Figure 153: Falabella - 12-Month Forward P/E
0x
5x
10x
15x
20x
25x
Jan
-08
Ma
y-0
8
Se
p-0
8
Jan-0
9
Ma
y-0
9
Se
p-0
9
Jan-1
0
Ma
y-1
0
Se
p-1
0
Jan-1
1
Ma
y-1
1
Se
p-1
1
Jan-1
2
Ma
y-1
2
Se
p-1
2
Jan
-13
Ma
y-1
3
Se
p-1
3
Jan
-14
Ma
y-1
4
Se
p-1
4
Jan
-15
Ma
y-1
5
Se
p-1
5
Jan
-16
Ma
y-1
6
Se
p-1
6
Jan
-17
Ma
y-1
7
Se
p-1
7
Jan
-18
12-Month Forward EV/EBITDA -1 Std Dev Avg +1 Std Dev
0x
5x
10x
15x
20x
25x
30x
35x
40x
45x
50x
Jan
-08
Ma
y-0
8
Se
p-0
8
Jan
-09
Ma
y-0
9
Se
p-0
9
Jan
-10
Ma
y-1
0
Se
p-1
0
Jan
-11
Ma
y-1
1
Se
p-1
1
Jan
-12
Ma
y-1
2
Se
p-1
2
Jan
-13
May-1
3
Sep-1
3
Jan
-14
Ma
y-1
4
Se
p-1
4
Jan
-15
Ma
y-1
5
Se
p-1
5
Jan
-16
Ma
y-1
6
Se
p-1
6
Jan
-17
Ma
y-1
7
Se
p-1
7
Jan
-18
12-Month Forward PE -1 Std Dev Avg +1 Std Dev
Source: Company reports and Deutsche Bank estimates Source: Company reports and Deutsche Bank estimates
Figure 154: Liverpool - 12-Month Forward EV/EBITDA Figure 155: Liverpool - 12-Month Forward P/E
0x
5x
10x
15x
20x
25x
Jan
-08
Ma
y-0
8
Se
p-0
8
Jan-0
9
Ma
y-0
9
Se
p-0
9
Jan-1
0
Ma
y-1
0
Se
p-1
0
Jan-1
1
Ma
y-1
1
Se
p-1
1
Jan-1
2
Ma
y-1
2
Se
p-1
2
Jan
-13
Ma
y-1
3
Se
p-1
3
Jan
-14
Ma
y-1
4
Se
p-1
4
Jan
-15
Ma
y-1
5
Se
p-1
5
Jan
-16
Ma
y-1
6
Se
p-1
6
Jan
-17
Ma
y-1
7
Se
p-1
7
Jan
-18
12-Month Forward EV/EBITDA -1 Std Dev Avg +1 Std Dev
0x
5x
10x
15x
20x
25x
30x
35x
40x
Jan
-08
Ma
y-0
8
Se
p-0
8
Jan
-09
Ma
y-0
9
Se
p-0
9
Jan
-10
Ma
y-1
0
Se
p-1
0
Jan
-11
Ma
y-1
1
Se
p-1
1
Jan
-12
Ma
y-1
2
Se
p-1
2
Jan
-13
May-1
3
Sep-1
3
Jan
-14
Ma
y-1
4
Se
p-1
4
Jan
-15
Ma
y-1
5
Se
p-1
5
Jan
-16
Ma
y-1
6
Se
p-1
6
Jan
-17
Ma
y-1
7
Se
p-1
7
Jan
-18
12-Month Forward PE -1 Std Dev Avg +1 Std Dev
Source: Company reports and Deutsche Bank estimates Source: Company reports and Deutsche Bank estimates
Page 60 Deutsche Bank Securities Inc.

21 January 2018
Beverages
Latam Consumer Monthly
Figure 156: Lojas Americanas - 12-Month Forward EV/EBITDA
Figure 157: Lojas Americanas - 12-Month Forward P/E
8x
9x
10x
11x
12x
13x
14x
15x
16x
Jan
-13
Ma
y-1
3
Se
p-1
3
Jan
-14
Ma
y-1
4
Se
p-1
4
Jan
-15
Ma
y-1
5
Se
p-1
5
Jan
-16
Ma
y-1
6
Se
p-1
6
Jan
-17
Ma
y-1
7
Se
p-1
7
Jan
-18
12-Month Forward EV/EBITDA -1 Std Dev Avg +1 Std Dev
0x
20x
40x
60x
80x
100x
120x
De
c-1
1
Ap
r-1
2
Au
g-1
2
De
c-1
2
Ap
r-1
3
Au
g-1
3
De
c-1
3
Ap
r-1
4
Au
g-1
4
De
c-1
4
Ap
r-1
5
Au
g-1
5
De
c-1
5
Ap
r-1
6
Au
g-1
6
De
c-1
6
12-Month Forward PE -1 Std Dev Avg +1 Std Dev
Source: Company reports and Deutsche Bank estimates Source: Company reports and Deutsche Bank estimates
Figure 158: Lojas Renner - 12-Month Forward EV/EBITDA
Figure 159: Lojas Renner - 12-Month Forward P/E
0x
2x
4x
6x
8x
10x
12x
14x
16x
18x
20x
Jan
-13
Ma
y-1
3
Se
p-1
3
Jan
-14
Ma
y-1
4
Se
p-1
4
Jan
-15
Ma
y-1
5
Se
p-1
5
Jan
-16
Ma
y-1
6
Se
p-1
6
Jan
-17
Ma
y-1
7
Se
p-1
7
Jan
-18
12-Month Forward EV/EBITDA -1 Std Dev Avg +1 Std Dev
0x
5x
10x
15x
20x
25x
30x
35x
40x
Jan
-13
Ma
y-1
3
Se
p-1
3
Jan
-14
Ma
y-1
4
Se
p-1
4
Jan
-15
Ma
y-1
5
Se
p-1
5
Jan
-16
Ma
y-1
6
Se
p-1
6
Jan
-17
Ma
y-1
7
Se
p-1
7
Jan
-18
12-Month Forward PE -1 Std Dev Avg +1 Std Dev
Source: Company reports and Deutsche Bank estimates Source: Company reports and Deutsche Bank estimates
Figure 160: Soriana - 12-Month Forward EV/EBITDA Figure 161: Soriana - 12-Month Forward P/E
0x
2x
4x
6x
8x
10x
12x
14x
16x
Jan
-08
Ma
y-0
8
Se
p-0
8
Jan-0
9
Ma
y-0
9
Se
p-0
9
Jan-1
0
Ma
y-1
0
Se
p-1
0
Jan-1
1
Ma
y-1
1
Se
p-1
1
Jan-1
2
Ma
y-1
2
Se
p-1
2
Jan
-13
Ma
y-1
3
Se
p-1
3
Jan
-14
Ma
y-1
4
Se
p-1
4
Jan
-15
Ma
y-1
5
Se
p-1
5
Jan
-16
Ma
y-1
6
Se
p-1
6
Jan
-17
Ma
y-1
7
Se
p-1
7
Jan
-18
12-Month Forward EV/EBITDA -1 Std Dev Avg +1 Std Dev
0x
5x
10x
15x
20x
25x
30x
35x
40x
45x
Jan
-08
Ma
y-0
8
Se
p-0
8
Jan
-09
Ma
y-0
9
Se
p-0
9
Jan
-10
Ma
y-1
0
Se
p-1
0
Jan
-11
Ma
y-1
1
Se
p-1
1
Jan
-12
Ma
y-1
2
Se
p-1
2
Jan
-13
May-1
3
Sep-1
3
Jan
-14
Ma
y-1
4
Se
p-1
4
Jan
-15
Ma
y-1
5
Se
p-1
5
Jan
-16
Ma
y-1
6
Se
p-1
6
Jan
-17
Ma
y-1
7
Se
p-1
7
Jan
-18
12-Month Forward PE -1 Std Dev Avg +1 Std Dev
Source: Company reports and Deutsche Bank estimates Source: Company reports and Deutsche Bank estimates
Deutsche Bank Securities Inc. Page 61

21 January 2018
Beverages
Latam Consumer Monthly
Figure 162: Walmex - 12-Month Forward EV/EBITDA Figure 163: Walmex - 12-Month Forward P/E
0x
2x
4x
6x
8x
10x
12x
14x
16x
18x
Jan
-08
Ma
y-0
8
Se
p-0
8
Jan-0
9
Ma
y-0
9
Se
p-0
9
Jan-1
0
Ma
y-1
0
Se
p-1
0
Jan-1
1
Ma
y-1
1
Se
p-1
1
Jan-1
2
Ma
y-1
2
Se
p-1
2
Jan
-13
Ma
y-1
3
Se
p-1
3
Jan
-14
Ma
y-1
4
Se
p-1
4
Jan
-15
Ma
y-1
5
Se
p-1
5
Jan
-16
Ma
y-1
6
Se
p-1
6
Jan
-17
Ma
y-1
7
Se
p-1
7
Jan
-18
12-Month Forward EV/EBITDA -1 Std Dev Avg +1 Std Dev
0x
5x
10x
15x
20x
25x
30x
35x
Jan
-08
Ma
y-0
8
Se
p-0
8
Jan
-09
Ma
y-0
9
Se
p-0
9
Jan
-10
Ma
y-1
0
Se
p-1
0
Jan
-11
Ma
y-1
1
Se
p-1
1
Jan
-12
Ma
y-1
2
Se
p-1
2
Jan
-13
May-1
3
Sep-1
3
Jan
-14
Ma
y-1
4
Se
p-1
4
Jan
-15
Ma
y-1
5
Se
p-1
5
Jan
-16
Ma
y-1
6
Se
p-1
6
Jan
-17
Ma
y-1
7
Se
p-1
7
Jan
-18
12-Month Forward PE -1 Std Dev Avg +1 Std Dev
Source: Company reports and Deutsche Bank estimates Source: Company reports and Deutsche Bank estimates
Page 62 Deutsche Bank Securities Inc.

21 January 2018
Beverages
Latam Consumer Monthly
Input Cost TrackerBeverage raw materials: world sugar stabilizing near multi-year lows, but not yet for Mexican sugar
In late 2016 standard sugar prices peaked (at $0.23/lb.), and are now settlingaround $0.15/lb, and futures on the #11 contract now call for prices to remainstable over the next 12 months. Thus, some relief is in sight for publicly-tradedbottlers when current hedges expire (but only in countries fully exposed to globalexport prices).
Figure 164: Sugar #11 (US¢/lb) Figure 165: Mexican Sugar (US¢/lb): still trending high
0.00
0.05
0.10
0.15
0.20
0.25
0.30
0.35
De
c-1
0
Jun
-11
De
c-1
1
Jun
-12
De
c-1
2
Jun
-13
De
c-1
3
Jun
-14
De
c-1
4
Jun
-15
De
c-1
5
Jun
-16
De
c-1
6
Jun
-17
De
c-1
7
Jun
-18
De
c-1
8
indicates Futures' Prices
0.00
0.10
0.20
0.30
0.40
0.50
0.60
Jan
-08
Jul-
08
Jan
-09
Jul-
09
Jan
-10
Jul-
10
Jan
-11
Jul-
11
Jan
-12
Jul-1
2
Jan
-13
Jul-1
3
Jan
-14
Jul-1
4
Jan
-15
Jul-
15
Jan
-16
Jul-
16
Jan
-17
Jul-
17
Jan
-18
Standard Refined
Source: Deutsche Bank estimates & Bloomberg Finance LP Source: USDA, Servicio Nacional de Informacion de Mercados (SNIIM)
On the other hand, Mexican sugar spiked in the past few months on the backof uncertainty created by trade negotiations on Mexican sugar imports into theUS. While the negotiations ended amicably and only resulted in a change in themix of sugar to enter the US (more standard and less refined), both grades roseon the expectation of potential increases in demand in the event Mexico wereto retaliate with tariffs on American fructose. That did not happen, so in theoryMexican sugar prices should return to normal in coming months.
Figure 166: LME Aluminium (USD/ton): Markettightening on China supply cuts, supporting prices
Figure 167: PET Bottle Resin (US¢/lb)
0
500
1,000
1,500
2,000
2,500
3,000
3,500
De
c-0
7
Jun
-08
De
c-0
8
Jun
-09
De
c-0
9
Jun
-10
Dec-1
0
Jun
-11
De
c-1
1
Jun
-12
De
c-1
2
Jun
-13
De
c-1
3
Jun
-14
De
c-1
4
Jun
-15
De
c-1
5
Jun
-16
De
c-1
6
Jun
-17
Dec-1
7
Jun
-18
De
c-1
8
indicates DB Forecast
40
50
60
70
80
90
100
110
Dec-0
9
Jun
-10
Dec-1
0
Jun
-11
Dec-1
1
Jun
-12
Dec-1
2
Jun
-13
Dec-1
3
Jun
-14
Dec-1
4
Jun
-15
Dec-1
5
Jun
-16
Dec-1
6
Jun
-17
Dec-1
7
Jun
-18
Dec-1
8
Jun
-19
Dec-1
9
indicates CMAI Forecast
Source: Bloomberg Finance LP, Deutsche Bank Estimates Source: IHS (ex-CMAI)
In 2017, Aluminum prices increased by ~32% on the back of Chinese supply-side reform and relatively robust demand. Recently, DB hiked its price estimates
Deutsche Bank Securities Inc. Page 63

21 January 2018
Beverages
Latam Consumer Monthly
by 9% to USD 2,262/t and 13% to USD 2,300/t for 2018 and 2019, respectively.With Chinese supply-side reforms biting into global supply and relatively robustdemand over the next several years, DB now expects the global Aluminium marketto shift into deficit in 2H17 through to 2019. This is driven by the cuts of illegalcapacity in China and the implementation of heating season cuts from Novemberto March. Near-term, if pot lines shut down during the winter do not begin torestart over late February or early March, this could be the next positive catalystfor aluminium prices.
PET resin prices rose moderately throughout 2016 (while still remaining near theirmulti-year lows), and after a brief pullback returned to a near-3-year peak in 2017(and are expected to remain near the current $0.82 per pound for the next twoyears (with an upward bias given the recent direction of crude oil).
Grain prices generally stable (with only wheat rising); Brazilcattle costs remain stable
US corn prices have remained generally stable in 2017 (with expectations for agradual increase, according to futures prices), but wheat prices spiked as springcrop conditions fell below expectations and have since returned to prior levels.Soybean and SBM also remain stable and near recent lows, especially after theUSDA’s recent forecast of record-high soybean production in 2017.
Figure 168: US Wheat (USD/bushel) Figure 169: US Corn (USD/bushel): 2017 proved greatharvest year, prices to remain stable
0.0
2.0
4.0
6.0
8.0
10.0
12.0
De
c-0
7
Jun
-08
De
c-0
8
Jun
-09
De
c-0
9
Jun
-10
De
c-1
0
Jun
-11
De
c-1
1
Jun
-12
De
c-1
2
Jun
-13
De
c-1
3
Jun
-14
De
c-1
4
Jun
-15
De
c-1
5
Jun
-16
De
c-1
6
Jun
-17
De
c-1
7
Jun
-18
De
c-1
8
US
$/B
ush
el
indicates Futures' Prices
0.0
1.0
2.0
3.0
4.0
5.0
6.0
7.0
8.0
9.0
De
c-0
7
Jun-0
8
De
c-0
8
Jun
-09
De
c-0
9
Jun
-10
De
c-1
0
Jun
-11
De
c-1
1
Jun
-12
De
c-1
2
Jun
-13
De
c-1
3
Jun
-14
De
c-1
4
Jun
-15
De
c-1
5
Jun
-16
De
c-1
6
Jun
-17
De
c-1
7
Jun-1
8
De
c-1
8
US
$/B
ush
el
indicates Futures' Prices
Source: Deutsche Bank estimates & Bloomberg Finance LP Source: Deutsche Bank estimates & Bloomberg Finance LP
Figure 170: US Soybeans (USD/bushel) Figure 171: US Soybean Meal (USD/ton)
0.0
2.0
4.0
6.0
8.0
10.0
12.0
14.0
16.0
18.0
20.0
De
c-0
7
Jun
-08
Dec-0
8
Jun
-09
De
c-0
9
Jun
-10
De
c-1
0
Jun
-11
De
c-1
1
Jun
-12
De
c-1
2
Jun
-13
Dec-1
3
Jun
-14
De
c-1
4
Jun
-15
De
c-1
5
Jun
-16
De
c-1
6
Jun
-17
De
c-1
7
Jun
-18
Dec-1
8
US
$/B
ush
el
indicates Futures'Prices
100
150
200
250
300
350
400
450
500
550
600
De
c-0
7
Ma
y-0
8
Oct-
08
Ma
r-0
9
Aug-0
9
Jan
-10
Jun
-10
No
v-1
0
Ap
r-11
Sep-1
1
Fe
b-1
2
Jul-
12
De
c-1
2
Ma
y-1
3
Oct-
13
Ma
r-1
4
Au
g-1
4
Jan
-15
Jun
-15
No
v-1
5
Ap
r-16
Sep-1
6
Fe
b-1
7
Jul-
17
De
c-1
7
US
$/to
n
Source: Deutsche Bank estimates & Bloomberg Finance LP Source: Bloomberg Finance LP
Page 64 Deutsche Bank Securities Inc.

21 January 2018
Beverages
Latam Consumer Monthly
Because there were no major weather-related problems in 2016 and the cornharvest was again at record levels, we previously thought that soft drink bottlerswho use high-fructose corn syrup (HFCS) as an important part of their sweetenermix (in LatAm, mostly Mexico-based bottlers) might derive benefits in 2017. Butas was the case for the last two years, high capacity utilization at HFCS suppliersenabled them to hold the line on pricing; therefore bottlers did not get any reliefhere. Contracts for 2018 should now be in place, but we don't expect majorchanges in HFCS pricing.
In Brazil, cattle costs rose substantially from mid-2010 to late 2011 as a resultof strong domestic demand and limited cattle availability, but increased cattlesupply in 2012 alleviated input cost inflation for beef packers for at least a year,until the weak BRL and increased competition for market share among the top3 producers (until mid-2015) led to additional cattle cost increases. The upwardtrend began to flatten out after the closure of over 40 beef processing plants in1H15 (and falling local beef demand) restored the supply-demand balance. In the2H16 and 1H17, however, cattle costs began to recede again, driven by highercattle availability . In July 2017, the average cattle price hit a 34-month low butrecovered in subsequent months on the back of decisions by some packers to re-open some plants; as a result the recent recovery should be largely sustained, butwe still expect prices to remain below year-ago levels.
Figure 172: Brazilian Live Cattle Prices (R$/@) Figure 173: Brazil Corn (R$/60-Kg sack)
R$ 0
R$ 20
R$ 40
R$ 60
R$ 80
R$ 100
R$ 120
R$ 140
R$ 160
R$ 180
Jan
-08
Ma
y-0
8
Se
p-0
8
Jan
-09
Ma
y-0
9
Se
p-0
9
Jan
-10
Ma
y-1
0
Se
p-1
0
Jan
-11
Ma
y-1
1
Se
p-1
1
Jan
-12
Ma
y-1
2
Se
p-1
2
Jan
-13
Ma
y-1
3
Se
p-1
3
Jan
-14
Ma
y-1
4
Se
p-1
4
Jan
-15
Ma
y-1
5
Se
p-1
5
Jan
-16
Ma
y-1
6
Se
p-1
6
Jan
-17
Ma
y-1
7
Se
p-1
7
Jan
-18
0
10
20
30
40
50
60
Jan
-08
Jul-
08
Jan
-09
Jul-
09
Jan
-10
Jul-
10
Jan
-11
Jul-
11
Jan
-12
Jul-
12
Jan
-13
Jul-
13
Jan
-14
Jul-
14
Jan
-15
Jul-
15
Jan
-16
Jul-
16
Jan
-17
Jul-
17
Jan
-18
Source: ESALQ/USP Source: Bloomberg Finance LP
Figure 174: Brazil Soybeans (R$/60-Kg sack) Figure 175: Brazil Soybean Meal (R$/ton)
0
10
20
30
40
50
60
70
80
90
100
Jan
-08
Jul-
08
Jan
-09
Jul-
09
Jan
-10
Jul-
10
Jan
-11
Jul-
11
Jan
-12
Jul-
12
Jan
-13
Jul-
13
Jan
-14
Jul-
14
Jan
-15
Jul-
15
Jan
-16
Jul-
16
Jan
-17
Jul-
17
Jan
-18
0.0
200.0
400.0
600.0
800.0
1,000.0
1,200.0
1,400.0
1,600.0
Jan
-08
Jul-
08
Jan
-09
Jul-
09
Jan
-10
Jul-
10
Jan
-11
Jul-
11
Jan
-12
Jul-
12
Jan
-13
Jul-
13
Jan
-14
Jul-
14
Jan
-15
Jul-
15
Jan
-16
Jul-
16
Jan
-17
Jul-
17
Jan
-18
Source: Bloomberg Finance LP Source: Bloomberg Finance LP
Deutsche Bank Securities Inc. Page 65
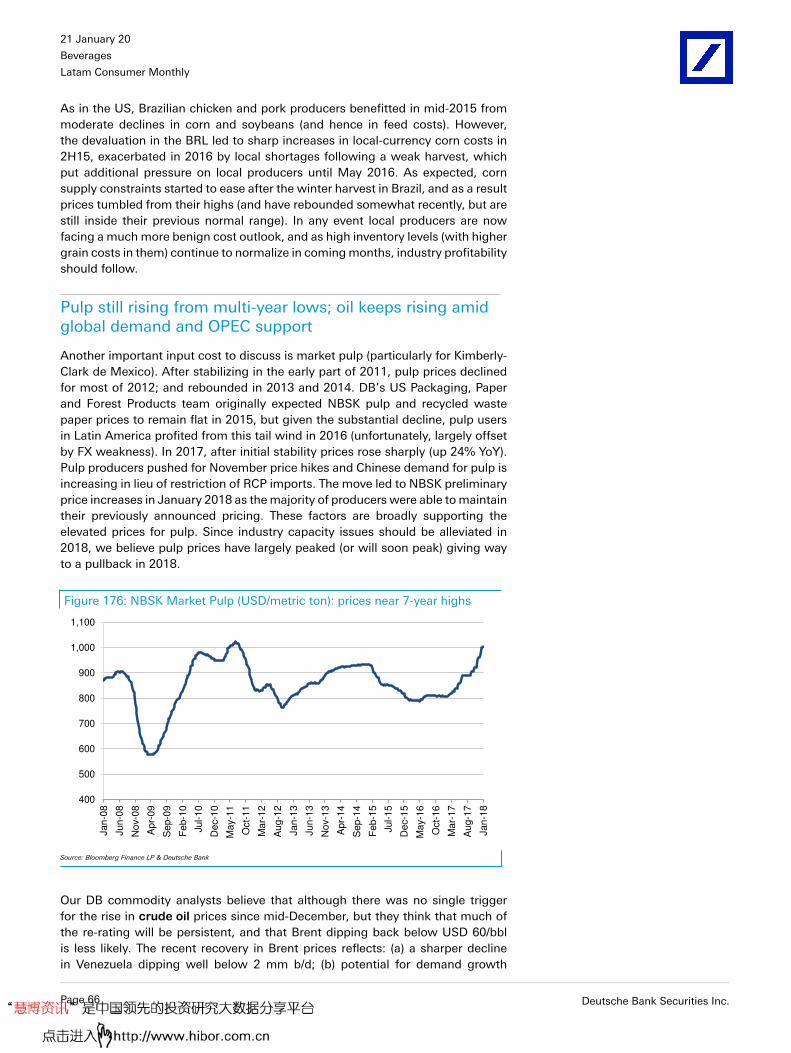
21 January 2018
Beverages
Latam Consumer Monthly
As in the US, Brazilian chicken and pork producers benefitted in mid-2015 frommoderate declines in corn and soybeans (and hence in feed costs). However,the devaluation in the BRL led to sharp increases in local-currency corn costs in2H15, exacerbated in 2016 by local shortages following a weak harvest, whichput additional pressure on local producers until May 2016. As expected, cornsupply constraints started to ease after the winter harvest in Brazil, and as a resultprices tumbled from their highs (and have rebounded somewhat recently, but arestill inside their previous normal range). In any event local producers are nowfacing a much more benign cost outlook, and as high inventory levels (with highergrain costs in them) continue to normalize in coming months, industry profitabilityshould follow.
Pulp still rising from multi-year lows; oil keeps rising amidglobal demand and OPEC support
Another important input cost to discuss is market pulp (particularly for Kimberly-Clark de Mexico). After stabilizing in the early part of 2011, pulp prices declinedfor most of 2012; and rebounded in 2013 and 2014. DB’s US Packaging, Paperand Forest Products team originally expected NBSK pulp and recycled wastepaper prices to remain flat in 2015, but given the substantial decline, pulp usersin Latin America profited from this tail wind in 2016 (unfortunately, largely offsetby FX weakness). In 2017, after initial stability prices rose sharply (up 24% YoY).Pulp producers pushed for November price hikes and Chinese demand for pulp isincreasing in lieu of restriction of RCP imports. The move led to NBSK preliminaryprice increases in January 2018 as the majority of producers were able to maintaintheir previously announced pricing. These factors are broadly supporting theelevated prices for pulp. Since industry capacity issues should be alleviated in2018, we believe pulp prices have largely peaked (or will soon peak) giving wayto a pullback in 2018.
Figure 176: NBSK Market Pulp (USD/metric ton): prices near 7-year highs
400
500
600
700
800
900
1,000
1,100
Jan
-08
Jun
-08
No
v-0
8
Ap
r-09
Se
p-0
9
Fe
b-1
0
Jul-
10
De
c-1
0
May-1
1
Oct-
11
Ma
r-1
2
Aug-1
2
Jan
-13
Jun
-13
No
v-1
3
Ap
r-14
Se
p-1
4
Fe
b-1
5
Jul-
15
De
c-1
5
May-1
6
Oct-
16
Ma
r-1
7
Aug-1
7
Jan
-18
Source: Bloomberg Finance LP & Deutsche Bank
Our DB commodity analysts believe that although there was no single triggerfor the rise in crude oil prices since mid-December, but they think that much ofthe re-rating will be persistent, and that Brent dipping back below USD 60/bblis less likely. The recent recovery in Brent prices reflects: (a) a sharper declinein Venezuela dipping well below 2 mm b/d; (b) potential for demand growth
Page 66 Deutsche Bank Securities Inc.

21 January 2018
Beverages
Latam Consumer Monthly
above +1.3 mm b/d in light of cyclical growth acceleration in the US, Eurozoneand EM and (c) potential for more broad USD weakness in 2018 as structuraldownside risks dominate. Therefore, DB recently raised its medium term Brentforecasts from USD 55/bbl to USD 62/bbl in 2018-19 and USD 65/bbl in 2021-22.WTI forecasts were raised from USD 51/bbl to USD 56/bbl in 2018-19. Whilenow off the early 2016 bottom, the large decline in oil versus pre-2014 levels(>USD100/bbl) should remain a positive for LatAm companies (even if some ofthe benefit is offset by currency devaluation or other macro impacts in mostcountries), particularly those with large distribution networks (i.e., most consumercompanies). In Mexico, the weaker FX in 2H16 led to an upward adjustmentin early 2017, but if recent FX strength (relative to early 2017) continues, local-currency gasoline prices could begin to recede.
Figure 177: Cotton # 2 (USD/lb.) Figure 178: Brent Crude (US$/bbl): prices jumped by18% in 2017 mainly attributed to OPEC supply disciplineand expectation of higher global demand
0
0.2
0.4
0.6
0.8
1
1.2
1.4
1.6
1.8
2
Jan
-12
Ma
y-1
2
Se
p-1
2
Jan
-13
Ma
y-1
3
Se
p-1
3
Jan
-14
Ma
y-1
4
Se
p-1
4
Jan
-15
Ma
y-1
5
Se
p-1
5
Jan
-16
Ma
y-1
6
Se
p-1
6
Jan
-17
Ma
y-1
7
Se
p-1
7
Jan
-18
0
20
40
60
80
100
120
140
160
De
c-0
7
Jun
-08
De
c-0
8
Jun
-09
Dec-0
9
Jun
-10
De
c-1
0
Jun
-11
Dec-1
1
Jun
-12
Dec-1
2
Jun
-13
De
c-1
3
Jun
-14
Dec-1
4
Jun
-15
De
c-1
5
Jun
-16
De
c-1
6
Jun
-17
Dec-1
7
Jun
-18
De
c-1
8
indicates DB Forecast
Source: Bloomberg Finance LP Source: Bloomberg Finance LP, Deutsche Bank Estimates
Deutsche Bank Securities Inc. Page 67

21 January 2018
Beverages
Latam Consumer Monthly
Brazil Protein UpdateThe negative impact of the Carne Fraca scandal that broke in late March continuesto reverse. December 2017, SECEX data showed again a robust beef exportvolume growth of 24% yoy (albeit on an easy comparison of -16% in December2016) while Poultry and Pork volume declined by 9.5% and 2.0% yoy, respectively(cycling -9.8% and -9.2% last year). The decline in Pork export volume was partlyaffected by Russian ban on Brazil meat imports. Pork, Beef and Poultry showedpositive pricing trend for December. Pork prices grew by 2.2% yoy (after declineof 7.8% last month) and Beef prices increased by 2.5% (after decline of 3.8%last month). Poultry prices remain strong with 3.5% yoy growth in December. Forthe full year 2017, Beef export volumes grew 12% yoy. Poultry volume growthremained flat but Pork declined by 6.0% yoy (albeit on an tougher comparisonof 33% growth in 2016). On the pricing side, Beef, Pork and Poultry witnessedaverage pricing growth of 3.5%, 16% and 9% yoy in USD terms, respectively, aftertwo consecutive years of decline in all three categories.
Figure 179: Brazilian Beef Exports
-20%
-15%
-10%
-5%
0%
5%
10%
15%
20%
De
c-1
4
Ma
r-1
5
Jun
-15
Se
p-1
5
De
c-1
5
Ma
r-1
6
Jun
-16
Se
p-1
6
De
c-1
6
Ma
r-1
7
Jun
-17
Se
p-1
7
De
c-1
7
YoY Price Change
$0
$1,000
$2,000
$3,000
$4,000
$5,000
$6,000
0
20
40
60
80
100
120
140
160
06 07 08 09 10 11 12 13 14 15 16 17
'000 tons
Tons (LHS) Price/Ton (RHS)
-40%
-20%
0%
20%
40%
60%
De
c-1
4
Ma
r-1
5
Jun
-15
Se
p-1
5
De
c-1
5
Ma
r-1
6
Jun
-16
Se
p-1
6
De
c-1
6
Ma
r-1
7
Jun
-17
Se
p-1
7
De
c-1
7
YoY Volume Growth
Source:SECEX/MDIC
Figure 180: Brazilian Poultry Exports
-25%
-15%
-5%
5%
15%
25%
De
c-1
4
Ma
r-1
5
Jun
-15
Se
p-1
5
De
c-1
5
Ma
r-1
6
Jun
-16
Se
p-1
6
De
c-1
6
Ma
r-1
7
Jun
-17
Se
p-1
7
De
c-1
7
YoY Price Change
$0
$500
$1,000
$1,500
$2,000
$2,500
0
50
100
150
200
250
300
350
400
450
06 07 08 09 10 11 12 13 14 15 16 17
'000 tons
Tons (LHS) Price/Ton (RHS)
-25%
-15%
-5%
5%
15%
25%
35%
De
c-1
4
Ma
r-1
5
Jun
-15
Se
p-1
5
De
c-1
5
Ma
r-1
6
Jun
-16
Se
p-1
6
De
c-1
6
Ma
r-1
7
Jun
-17
Se
p-1
7
De
c-1
7
YoY Volume Growth
Source: SECEX/MDIC
Figure 181: Brazilian Pork Exports
-40%
-20%
0%
20%
40%
60%
De
c-1
4
Ma
r-1
5
Jun
-15
Se
p-1
5
De
c-1
5
Ma
r-1
6
Jun
-16
Se
p-1
6
De
c-1
6
Ma
r-1
7
Jun
-17
Se
p-1
7
De
c-1
7
YoY Volume Growth
-45%
-25%
-5%
15%
35%
55%
De
c-1
4
Ma
r-1
5
Jun
-15
Se
p-1
5
De
c-1
5
Ma
r-1
6
Jun
-16
Se
p-1
6
De
c-1
6
Ma
r-1
7
Jun
-17
Se
p-1
7
De
c-1
7
YoY Price Change
$0
$750
$1,500
$2,250
$3,000
$3,750
$4,500
0
10
20
30
40
50
60
70
06 07 08 09 10 11 12 13 14 15 16 17
'000 tons
Tons (LHS) Price/Ton (RHS)
Source: SECEX/MDIC
Page 68 Deutsche Bank Securities Inc.

21 January 2018
Beverages
Latam Consumer Monthly
Update on the Consumer(BR, MX, CL, CO)Brazil: recovery continues to proceed, but political risksremain
The Brazilian recovery remains on track. A sharp drop in inflation has allowedthe central bank to ease monetary policy, driving a consumption-led recovery.However the fiscal imbalance remains a serious risk and the timing of economicreforms remains uncertain amid political turmoil. Despite lower than expectedGDP growth in 3Q17, DB economists raised the 2017 GDP growth forecast to1.1% from 0.7%, but for 2018 it remains unchanged at 2.6%. However, the outlookfor 2018 could change depending on how the presidential election plays out.
Figure 182: Brazil—Retail Sales by Category: retail salesvolume grew by 5.9% YoY led by a 15.6% YoY surge indurables in November
Figure 183: Brazil—Consumer confidence strengtheningon the back of economic recovery
-25.0
-20.0
-15.0
-10.0
-5.0
0.0
5.0
10.0
15.0
20.0
25.0
No
v-1
2
Ma
r-1
3
Jul-
13
Nov-1
3
Ma
r-1
4
Jul-
14
No
v-1
4
Ma
r-1
5
Jul-
15
No
v-1
5
Ma
r-1
6
Jul-
16
Nov-1
6
Ma
r-1
7
Jul-
17
No
v-1
7
(%)
Food Apparel Furniture & Electronics Pharm. & HPC
-40.0%
-30.0%
-20.0%
-10.0%
0.0%
10.0%
20.0%
30.0%
40.0%
0.0
20.0
40.0
60.0
80.0
100.0
120.0
140.0D
ec-1
2
Ma
r-1
3
Jun
-13
Se
p-1
3
Dec-1
3
Ma
r-1
4
Jun
-14
Se
p-1
4
Dec-1
4
Ma
r-1
5
Jun
-15
Sep-1
5
Dec-1
5
Ma
r-1
6
Jun
-16
Sep-1
6
De
c-1
6
Ma
r-1
7
Jun
-17
Sep-1
7
De
c-1
7
YoY Change (RHS) Brazil Consumer Confidence Index
Source: IBGE Source: Fundaçao Getulio Vargas
Figure 184: Brazil—Unemployment rate declining butstill high
Figure 185: Brazil Inflation—deflationary pressure onFood & Beverage continued; (DB expects IPCA to rise3.3% in 2018)
6.5
13.6
12.0
4.0
6.0
8.0
10.0
12.0
14.0
16.0
Nov-1
2
Fe
b-1
3
Apr-
13
Jul-
13
Se
p-1
3
Dec-1
3
Fe
b-1
4
Ma
y-1
4
Jul-
14
Oct-
14
Dec-1
4
Ma
r-1
5
Ma
y-1
5
Jul-
15
Oct-
15
Dec-1
5
Ma
r-1
6
Ma
y-1
6
Au
g-1
6
Oct-
16
Jan
-17
Ma
r-1
7
Jun
-17
Au
g-1
7
No
v-1
7
Brazil PNAD unemployment Rate (%)
-4%
-2%
0%
2%
4%
6%
8%
10%
12%
14%
16%
No
v-0
7
Ap
r-08
Se
p-0
8
Fe
b-0
9
Jul-
09
De
c-0
9
Ma
y-1
0
Oct-
10
Ma
r-1
1
Au
g-1
1
Jan
-12
Jun
-12
No
v-1
2
Ap
r-13
Se
p-1
3
Fe
b-1
4
Jul-
14
De
c-1
4
Ma
y-1
5
Oct-
15
Ma
r-1
6
Au
g-1
6
Jan
-17
Jun
-17
No
v-1
7
IPCA IPCA - Food Beverage
Source: IBGE, Bloomberg Finance LP Source: Banco Central do Brasil, IBGE
Deutsche Bank Securities Inc. Page 69

21 January 2018
Beverages
Latam Consumer Monthly
Figure 186: Brazil—YoY % Change in Real Wages nowfirmly positive
Figure 187: Brazil—Credit Default Rates
96
98
100
102
104
106
108
-10.0%
-7.5%
-5.0%
-2.5%
0.0%
2.5%
5.0%
7.5%
10.0%
Nov-1
2
Feb-1
3
Ma
y-1
3
Au
g-1
3
Nov-1
3
Feb-1
4
Ma
y-1
4
Au
g-1
4
Nov-1
4
Feb-1
5
Ma
y-1
5
Au
g-1
5
Nov-1
5
Feb-1
6
May-1
6
Au
g-1
6
Nov-1
6
Feb-1
7
May-1
7
Au
g-1
7
Nov-1
7
YoY Change (LHS)
Index (RHS)
0%
1%
2%
3%
4%
5%
6%
7%
8%
9%
10%
No
v-1
1
Fe
b-1
2
May-1
2
Au
g-1
2
No
v-1
2
Fe
b-1
3
May-1
3
Au
g-1
3
No
v-1
3
Fe
b-1
4
May-1
4
Au
g-1
4
No
v-1
4
Fe
b-1
5
Ma
y-1
5
Au
g-1
5
No
v-1
5
Fe
b-1
6
May-1
6
Au
g-1
6
No
v-1
6
Fe
b-1
7
May-1
7
Au
g-1
7
No
v-1
7
Corporates Individuals System
Source: IBGE (PNAD Continua – Mensal) Source: Banco Central do Brasil
Figure 188: Brazil—Loan Spreads (credit continues torecover but very slowly)
Figure 189: Brazil—Personal Loans (Interest Rate vsMaturity): interest rates remain quite high despite recentmonetary easing
0%
10%
20%
30%
40%
50%
60%
70%
Nov-1
1
Fe
b-1
2
Ma
y-1
2
Aug-1
2
No
v-1
2
Fe
b-1
3
Ma
y-1
3
Aug-1
3
No
v-1
3
Fe
b-1
4
Ma
y-1
4
Aug-1
4
No
v-1
4
Fe
b-1
5
Ma
y-1
5
Aug-1
5
No
v-1
5
Fe
b-1
6
Ma
y-1
6
Aug-1
6
Nov-1
6
Fe
b-1
7
Ma
y-1
7
Aug-1
7
No
v-1
7
Corporates Individuals System
0
10
20
30
40
50
60
30%
35%
40%
45%
50%
55%
60%
65%
70%
75%
80%
No
v-1
1
Fe
b-1
2
Ma
y-1
2
Aug-1
2
No
v-1
2
Fe
b-1
3
Ma
y-1
3
Aug-1
3
No
v-1
3
Fe
b-1
4
Ma
y-1
4
Aug-1
4
No
v-1
4
Fe
b-1
5
Ma
y-1
5
Aug-1
5
No
v-1
5
Fe
b-1
6
Ma
y-1
6
Aug-1
6
No
v-1
6
Fe
b-1
7
Ma
y-1
7
Aug-1
7
No
v-1
7
Interest Rate Maturity (days)
Source: Banco Central do Brasil Source: Banco Central do Brasil; Note - 2012 data on maturities was restated by BCB.
Page 70 Deutsche Bank Securities Inc.

21 January 2018
Beverages
Latam Consumer Monthly
Mexico: some positive signs, but NAFTA and the 2018election remain risks
The vulnerabilities to the Mexican consumer that we have been highlighting inrecent months are still there, but there are some positive signs that the worst isover. With the initial shock of the weak peso now in the base of prices, inflation isnow under control (albeit still high, as evidenced by mid-single digit retail compsales growth). Our economists continue to see downside risks to growth (it isunlikely that investment will recover until after the mid-2018 election), but thedissipation of some of the NAFTA noise and/or increased clarity on the electionfront could aid in the recovery of durable goods consumption.
Figure 190: Mexico—ANTAD SSS (same-stores-salesrebound to 5.4% in November) while the accumulatedSSS growth stood at 4.5%
Figure 191: Mexico—Consumer Confidence recoveryresumed
-6.0
-4.0
-2.0
0.0
2.0
4.0
6.0
8.0
10.0
12.0
14.0
16.0
Nov-1
1
Fe
b-1
2
Ma
y-1
2
Au
g-1
2
Nov-1
2
Fe
b-1
3
Ma
y-1
3
Aug-1
3
No
v-1
3
Fe
b-1
4
Ma
y-1
4
Aug-1
4
Nov-1
4
Fe
b-1
5
Ma
y-1
5
Au
g-1
5
Nov-1
5
Fe
b-1
6
Ma
y-1
6
Aug-1
6
No
v-1
6
Fe
b-1
7
Ma
y-1
7
Aug-1
7
Nov-1
7
(%)
-30.0%
-25.0%
-20.0%
-15.0%
-10.0%
-5.0%
0.0%
5.0%
10.0%
65
70
75
80
85
90
95
100
105
No
v-1
2
Fe
b-1
3
Ma
y-1
3
Au
g-1
3
No
v-1
3
Fe
b-1
4
Ma
y-1
4
Au
g-1
4
No
v-1
4
Fe
b-1
5
Ma
y-1
5
Au
g-1
5
No
v-1
5
Fe
b-1
6
Ma
y-1
6
Au
g-1
6
No
v-1
6
Fe
b-1
7
Ma
y-1
7
Au
g-1
7
No
v-1
7
YoY Change (RHS) Mexico consumer confidence Index
Source: ANTAD Source: INEG, Banco de México, Bloomberg Finance LP
Figure 192: Mexico - Remittances YoY % Change (inPesos, using average FX)
Figure 193: Mexico—Remittances YoY % Change (inUSD)
-40%
-30%
-20%
-10%
0%
10%
20%
30%
40%
50%
No
v-0
7
May-0
8
No
v-0
8
Ma
y-0
9
No
v-0
9
May-1
0
No
v-1
0
May-1
1
No
v-1
1
Ma
y-1
2
No
v-1
2
May-1
3
No
v-1
3
Ma
y-1
4
No
v-1
4
Ma
y-1
5
No
v-1
5
May-1
6
No
v-1
6
Ma
y-1
7
No
v-1
7
-40%
-30%
-20%
-10%
0%
10%
20%
30%
No
v-0
7
Ma
y-0
8
No
v-0
8
Ma
y-0
9
No
v-0
9
Ma
y-1
0
No
v-1
0
Ma
y-1
1
No
v-1
1
Ma
y-1
2
No
v-1
2
Ma
y-1
3
No
v-1
3
Ma
y-1
4
No
v-1
4
Ma
y-1
5
No
v-1
5
Ma
y-1
6
No
v-1
6
Ma
y-1
7
No
v-1
7
Source: Banco de México Source: Banco de México
Deutsche Bank Securities Inc. Page 71

21 January 2018
Beverages
Latam Consumer Monthly
Figure 194: Mexico—Unemployment Rate Figure 195: Mexico—Inflation, DB expects that inflationwill decline over the year, allowing Banxico to begineasing in 3Q18. Currently, INPC is near 17 years high.
2.0%
2.5%
3.0%
3.5%
4.0%
4.5%
5.0%
5.5%
6.0%
6.5%
No
v-1
1
Feb
-12
Ma
y-1
2
Au
g-1
2
No
v-1
2
Fe
b-1
3
Ma
y-1
3
Aug-1
3
No
v-1
3
Feb
-14
Ma
y-1
4
Au
g-1
4
No
v-1
4
Fe
b-1
5
Ma
y-1
5
Aug-1
5
No
v-1
5
Fe
b-1
6
Ma
y-1
6
Au
g-1
6
No
v-1
6
Feb
-17
Ma
y-1
7
Au
g-1
7
No
v-1
7
1%
3%
5%
7%
9%
11%
13%
De
c-1
0
Ma
r-1
1
Jun
-11
Se
p-1
1
De
c-1
1
Ma
r-1
2
Jun-1
2
Se
p-1
2
De
c-1
2
Ma
r-1
3
Jun
-13
Se
p-1
3
De
c-1
3
Ma
r-1
4
Jun-1
4
Se
p-1
4
De
c-1
4
Ma
r-1
5
Jun-1
5
Se
p-1
5
De
c-1
5
Ma
r-1
6
Jun-1
6
Se
p-1
6
De
c-1
6
Ma
r-1
7
Jun-1
7
Se
p-1
7
De
c-1
7
INPC INPC - Food, Beverage & Tabacco
Source: NEGI Source: INEGI
Figure 196: Mexico—YoY % Change in Consumer Credit Figure 197: Mexico—% of Consumer NPLs
-10%
-5%
0%
5%
10%
15%
20%
25%
30%
No
v-1
1
Fe
b-1
2
Ma
y-1
2
Au
g-1
2
No
v-1
2
Fe
b-1
3
Ma
y-1
3
Au
g-1
3
No
v-1
3
Fe
b-1
4
Ma
y-1
4
Au
g-1
4
No
v-1
4
Fe
b-1
5
Ma
y-1
5
Au
g-1
5
No
v-1
5
Fe
b-1
6
Ma
y-1
6
Au
g-1
6
No
v-1
6
Fe
b-1
7
Ma
y-1
7
Au
g-1
7
No
v-1
7
1.0%
2.0%
3.0%
4.0%
5.0%
6.0%
7.0%
No
v-1
1
Fe
b-1
2
Ma
y-1
2
Au
g-1
2
No
v-1
2
Feb
-13
Ma
y-1
3
Au
g-1
3
No
v-1
3
Fe
b-1
4
Ma
y-1
4
Aug-1
4
No
v-1
4
Fe
b-1
5
Ma
y-1
5
Au
g-1
5
No
v-1
5
Fe
b-1
6
Ma
y-1
6
Au
g-1
6
No
v-1
6
Fe
b-1
7
Ma
y-1
7
Au
g-1
7
No
v-1
7
Credit card Durable goods Other Total Consumer loans
Source: Banco de México Source: Banco de México
Page 72 Deutsche Bank Securities Inc.

21 January 2018
Beverages
Latam Consumer Monthly
Chile: recovery to pick up despite pause in easing cycle, asthe political outlook is brighter post-election
Our Chile economist’s 2017 outlook for Chile’s economy did not materially changein the aftermath of the 2016 US election. But following growth of 1.6% in 2016and 2017, he expects GDP growth to accelerate to 3.4% in 2018 after an easingcycle.
An early sign of the incipient consumer recovery: durable-goods retail sales havecontinued showing positive growth (with 17.8%yoy growth in November), whilenon-durable goods retail sales growth remains modest (but also rising) at 2.6%yoy. The combined effect was that retail sales grew 5.6% yoy, near peak of 2017(Mar '17: 6.0%). Labor market data shows that unemployment is staying at 6.5%(lower than the peak of May/Jun '17 of c.7.0%), and consumer confidence is stillrising(+8.0% yoy). Thus we continue to feel more optimistic about the Chileanconsumer.
Figure 198: Chile—Retail Durable vs. Non-Durable SalesGrowth Rate
Figure 199: Chile—Consumer Confidence (YoY change)
-5%
0%
5%
10%
15%
20%
25%
Fe
b-1
5M
ar-
15
Ap
r-15
Ma
y-1
5Jun
-15
Jul-
15
Au
g-1
5S
ep-1
5O
ct-
15
Nov-1
5D
ec-1
5Jan
-16
Fe
b-1
6M
ar-
16
Ap
r-16
Ma
y-1
6Jun
-16
Jul-
16
Au
g-1
6S
ep-1
6O
ct-
16
Nov-1
6D
ec-1
6Jan
-17
Fe
b-1
7M
ar-
17
Ap
r-17
Ma
y-1
7Jun
-17
Jul-
17
Au
g-1
7S
ep-1
7O
ct-
17
Nov-1
7
Durable Goods Non Durable Goods
-50.0%
-40.0%
-30.0%
-20.0%
-10.0%
0.0%
10.0%
20.0%
30.0%
40.0%
50.0%
60.0%
0
20
40
60
80
100
120
140
160N
ov-0
7
Ma
r-0
8
Jul-
08
No
v-0
8
Ma
r-0
9
Jul-
09
No
v-0
9
Ma
r-1
0
Jul-
10
No
v-1
0
Ma
r-1
1
Jul-
11
No
v-1
1
Ma
r-1
2
Jul-
12
No
v-1
2
Ma
r-1
3
Jul-
13
No
v-1
3
Ma
r-1
4
Jul-
14
No
v-1
4
Ma
r-1
5
Jul-
15
No
v-1
5
Ma
r-1
6
Jul-
16
No
v-1
6
Ma
r-1
7
Jul-
17
No
v-1
7
YoY % Change - RHS Chile - Consumer Confidence Index
Source: Instituto Nacional de Estadísticas Source: UDD – IPECO
Figure 200: Chile—Unemployment Rate Figure 201: Chile—Inflation rate, one-offs like areduction of electricity prices and a decline of somevegetable prices were an important drag on inflation
7.1%
6.5%
5.0%
5.5%
6.0%
6.5%
7.0%
7.5%
No
v-1
1
Fe
b-1
2
Ma
y-1
2
Au
g-1
2
No
v-1
2
Fe
b-1
3
Ma
y-1
3
Au
g-1
3
No
v-1
3
Fe
b-1
4
Ma
y-1
4
Au
g-1
4
No
v-1
4
Fe
b-1
5
Ma
y-1
5
Au
g-1
5
No
v-1
5
Fe
b-1
6
Ma
y-1
6
Au
g-1
6
No
v-1
6
Fe
b-1
7
Ma
y-1
7
Au
g-1
7
No
v-1
7
0%
1%
2%
3%
4%
5%
6%
7%
Nov-1
0
Fe
b-1
1
Ma
y-1
1
Au
g-1
1
No
v-1
1
Fe
b-1
2
Ma
y-1
2
Au
g-1
2
Nov-1
2
Fe
b-1
3
Ma
y-1
3
Au
g-1
3
Nov-1
3
Fe
b-1
4
Ma
y-1
4
Au
g-1
4
No
v-1
4
Fe
b-1
5
Ma
y-1
5
Au
g-1
5
Nov-1
5
Fe
b-1
6
Ma
y-1
6
Au
g-1
6
Nov-1
6
Fe
b-1
7
Ma
y-1
7
Au
g-1
7
No
v-1
7
Source: Instituto Nacional de Estadísticas Source: Instituto Nacional de Estadísticas
Deutsche Bank Securities Inc. Page 73

21 January 2018
Beverages
Latam Consumer Monthly
Figure 202: Chile—YoY % Change in Consumer Credit Figure 203: Chile—Provisions / Total Loans
0%
5%
10%
15%
20%
25%
No
v-1
1
Fe
b-1
2
Ma
y-1
2
Au
g-1
2
No
v-1
2
Fe
b-1
3
Ma
y-1
3
Au
g-1
3
No
v-1
3
Fe
b-1
4
Ma
y-1
4
Au
g-1
4
No
v-1
4
Fe
b-1
5
Ma
y-1
5
Au
g-1
5
No
v-1
5
Fe
b-1
6
Ma
y-1
6
Au
g-1
6
No
v-1
6
Fe
b-1
7
Ma
y-1
7
Au
g-1
7
No
v-1
7
5.5%
5.7%
5.9%
6.1%
6.3%
6.5%
6.7%
No
v-1
2
Fe
b-1
3
Ma
y-1
3
Au
g-1
3
No
v-1
3
Fe
b-1
4
Ma
y-1
4
Au
g-1
4
No
v-1
4
Fe
b-1
5
Ma
y-1
5
Au
g-1
5
No
v-1
5
Fe
b-1
6
Ma
y-1
6
Au
g-1
6
No
v-1
6
Fe
b-1
7
Ma
y-1
7
Au
g-1
7
No
v-1
7
Source: SBIF Source: SBIF
Colombia: with oil rising, looks like the worst is over
According to our economics "Electoral uncertainty is likely to weigh on economicgrowth, business sentiment and asset prices. However, higher oil prices andthe reactivation of funding for infrastructure concessions would underpin a mildrecovery." He now expects 1.6% GDP growth in 2017 and 2.6% in 2018. Withconsumer confidence still in negative territory, we expect the recovery to comeat the back end.
Figure 204: Colombia—Retail Sales by Category Figure 205: Colombia—Unemployment Rate
-10%
-5%
0%
5%
10%
15%
20%
25%
30%
Oct-
07
Fe
b-0
8
Ju
n-0
8
Oct-
08
Fe
b-0
9
Ju
n-0
9
Oct-
09
Fe
b-1
0
Ju
n-1
0
Oct-
10
Fe
b-1
1
Ju
n-1
1
Oct-
11
Fe
b-1
2
Ju
n-1
2
Oct-
12
Fe
b-1
3
Ju
n-1
3
Oct-
13
Fe
b-1
4
Ju
n-1
4
Oct-
14
Fe
b-1
5
Ju
n-1
5
Oct-
15
Fe
b-1
6
Ju
n-1
6
Oct-
16
Fe
b-1
7
Ju
n-1
7
Oct-
17
Total Retail Food & Bev (non-Alcoholic) Apparel
11.7%
8.4%
6%
7%
8%
9%
10%
11%
12%
13%
14%
No
v-1
1
Fe
b-1
2
Ma
y-1
2
Au
g-1
2
No
v-1
2
Fe
b-1
3
Ma
y-1
3
Au
g-1
3
No
v-1
3
Fe
b-1
4
Ma
y-1
4
Au
g-1
4
No
v-1
4
Fe
b-1
5
Ma
y-1
5
Au
g-1
5
No
v-1
5
Fe
b-1
6
Ma
y-1
6
Au
g-1
6
No
v-1
6
Fe
b-1
7
Ma
y-1
7
Au
g-1
7
No
v-1
7Source: DANE - MMCM Source: DANE - Encuesta Continua de Hogares, Gran Encuesta Integrada de Hogares
Page 74 Deutsche Bank Securities Inc.

21 January 2018
Beverages
Latam Consumer Monthly
Figure 206: Colombia—Inflation (DBe: 3.8% by end-2017& 3.2% in 2018)
Figure 207: Colombia—Consumer Confidence, still innegative territory
9.0%
3.40%
4.09%
0.0%
1.0%
2.0%
3.0%
4.0%
5.0%
6.0%
7.0%
8.0%
9.0%
10.0%
De
c-1
3
Ma
r-1
4
Ju
n-1
4
Se
p-1
4
De
c-1
4
Ma
r-1
5
Ju
n-1
5
Se
p-1
5
De
c-1
5
Ma
r-1
6
Ju
n-1
6
Se
p-1
6
De
c-1
6
Ma
r-1
7
Ju
n-1
7
Sep-1
7
De
c-1
7 -40%
-30%
-20%
-10%
0%
10%
20%
30%
40%
Nov-0
7
Ma
y-0
8
Nov-0
8
Ma
y-0
9
Nov-0
9
Ma
y-1
0
Nov-1
0
Ma
y-1
1
Nov-1
1
Ma
y-1
2
Nov-1
2
Ma
y-1
3
Nov-1
3
Ma
y-1
4
Nov-1
4
Ma
y-1
5
Nov-1
5
Ma
y-1
6
Nov-1
6
Ma
y-1
7
Nov-1
7
Source: DANE Source: FEDESARROLLO - Centro de investigación Económica y Social
Figure 208: Colombia—Remittances from workers(millions of USD)
Figure 209: Colombia—Remittances YoY % Change (inUSD)
600
700
800
900
1,000
1,100
1,200
1,300
1,400
1,500
2Q
201
0
3Q
201
0
4Q
201
0
1Q
201
1
2Q
201
1
3Q
201
1
4Q
201
1
1Q
201
2
2Q
201
2
3Q
201
2
4Q
201
2
1Q
201
3
2Q
201
3
3Q
201
3
4Q
201
3
1Q
201
4
2Q
201
4
3Q
201
4
4Q
201
4
1Q
201
5
2Q
201
5
3Q
201
5
4Q
201
5
1Q
201
6
2Q
201
6
3Q
201
6
4Q
201
6
1Q
201
7
2Q
201
7
3Q
201
7
19.9%
-30%
-20%
-10%
0%
10%
20%
30%
40%
2Q
201
0
3Q
201
0
4Q
201
0
1Q
201
1
2Q
201
1
3Q
201
1
4Q
201
1
1Q
201
2
2Q
201
2
3Q
201
2
4Q
201
2
1Q
201
3
2Q
201
3
3Q
201
3
4Q
201
3
1Q
201
4
2Q
201
4
3Q
201
4
4Q
201
4
1Q
201
5
2Q
201
5
3Q
201
5
4Q
201
5
1Q
201
6
2Q
201
6
3Q
201
6
4Q
201
6
1Q
201
7
2Q
201
7
3Q
201
7
Source: Banco Central de Colombia Source: Banco Central de Colombia
Figure 210: Colombia—% of NPLs & Credit Growth
-30%
-20%
-10%
0%
10%
20%
30%
40%
50%
60%
Oct-
10
Fe
b-1
1
Jun
-11
Oct-
11
Fe
b-1
2
Jun
-12
Oct-
12
Fe
b-1
3
Jun
-13
Oct-
13
Fe
b-1
4
Jun
-14
Oct-
14
Fe
b-1
5
Jun
-15
Oct-
15
Fe
b-1
6
Jun
-16
Oct-
16
Fe
b-1
7
Jun
-17
Oct-
17
NPL YoY Credit Growth YoY
Source: Superintendencia Financiera de Colombia
Deutsche Bank Securities Inc. Page 75

21 January 2018
Beverages
Latam Consumer Monthly
Valuation and Risks
Our price targets are mostly derived using a bottom-up Gordon growth model tofigure out the fair EV/EBITDA or P/E multiple (in some cases we use the averageof the two), but we also use sum-of-the-parts and DCF analyses.
In our view, the main risks attached to Latin American consumer companiesare macroeconomic in nature. While many of the companies we cover enjoysignificant economies of scale and are relatively resilient to economic swings, noconsumer company in the region would be immune to a substantial deteriorationin local consumer demand, which could come from a deterioration of the globaleconomy or from internal factors (such as high interest rates or declines inreal wages or disposable income) not directly related to developments in thedeveloped world.
Beverage companies, as manufacturers, may be impacted by any substantialweakening of the local currency, as most have roughly 30-40% of their rawmaterial costs denominated in US dollars. Conversely, exporters can be negativelyaffected by significant strength in their local currency. Food and wine companiesare exposed to swings in agricultural commodity prices.
Finally, because Latin American governments tend to tax consumption more thandeveloped countries, sector results could be affected by any adverse changes inthe local tax system, including, but not limited to, increases in the overall VATrate or excise taxes.
Page 76 Deutsche Bank Securities Inc.

21 January 2018
Beverages
Latam Consumer Monthly
Appendix 1
Important Disclosures
*Other information available upon request
*Prices are current as of the end of the previous trading session unless otherwise indicated and are sourced fromlocal exchanges via Reuters, Bloomberg and other vendors . Other information is sourced from Deutsche Bank, subjectcompanies, and other sources. For disclosures pertaining to recommendations or estimates made on securities other thanthe primary subject of this research, please see the most recently published company report or visit our global disclosurelook-up page on our website at http://gm.db.com/ger/disclosure/DisclosureDirectory.eqsr. Aside from within this report,important conflict disclosures can also be found at https://gm.db.com/equities under the "Disclosures Lookup" and "Legal"tabs. Investors are strongly encouraged to review this information before investing.
Analyst Certification
The views expressed in this report accurately reflect the personal views of the undersigned lead analyst about the subjectissuers and the securities of those issuers. In addition, the undersigned lead analyst has not and will not receive anycompensation for providing a specific recommendation or view in this report. Jose Yordan, Marcel Moraes
Equity Rating Key Equity rating dispersion and banking relationships
Buy: Based on a current 12- month view of total share-holderreturn (TSR = percentage change in share price from currentprice to projected target price plus pro-jected dividend yield ) ,we recommend that investors buy the stock.Sell: Based on a current 12-month view of total share-holderreturn, we recommend that investors sell the stock.Hold: We take a neutral view on the stock 12-months out and,based on this time horizon, do not recommend either a Buyor Sell.
Newly issued research recommendations and target pricessupersede previously published research.
Deutsche Bank Securities Inc. Page 77

21 January 2018
Beverages
Latam Consumer Monthly
Additional Information
The information and opinions in this report were prepared by Deutsche Bank AG or one of its affiliates (collectively"Deutsche Bank"). Though the information herein is believed to be reliable and has been obtained from public sourcesbelieved to be reliable, Deutsche Bank makes no representation as to its accuracy or completeness. Hyperlinks to third-party websites in this report are provided for reader convenience only. Deutsche Bank neither endorses the content noris responsible for the accuracy or security controls of those websites.??If you use the services of Deutsche Bank in connection with a purchase or sale of a security that is discussed in this report,or is included or discussed in another communication (oral or written) from a Deutsche Bank analyst, Deutsche Bank mayact as principal for its own account or as agent for another person.??Deutsche Bank may consider this report in deciding to trade as principal. It may also engage in transactions, for itsown account or with customers, in a manner inconsistent with the views taken in this research report. Others withinDeutsche Bank, including strategists, sales staff and other analysts, may take views that are inconsistent with those takenin this research report. Deutsche Bank issues a variety of research products, including fundamental analysis, equity-linkedanalysis, quantitative analysis and trade ideas. Recommendations contained in one type of communication may differfrom recommendations contained in others, whether as a result of differing time horizons, methodologies, perspectivesor otherwise. Deutsche Bank and/or its affiliates may also be holding debt or equity securities of the issuers it writeson. Analysts are paid in part based on the profitability of Deutsche Bank AG and its affiliates, which includes investmentbanking, trading and principal trading revenues.??Opinions, estimates and projections constitute the current judgment of the author as of the date of this report. They donot necessarily reflect the opinions of Deutsche Bank and are subject to change without notice. Deutsche Bank providesliquidity for buyers and sellers of securities issued by the companies it covers. Deutsche Bank research analysts sometimeshave shorter-term trade ideas that may be inconsistent with Deutsche Bank's existing longer-term ratings. Trade ideasfor equities can be found at the SOLAR link at http://gm.db.com. A SOLAR idea represents a high-conviction belief by ananalyst that a stock will outperform or underperform the market and/or a specified sector over a time frame of no less thantwo weeks and no more than six months. In addition to SOLAR ideas, analysts may occasionally discuss with our clients,and with Deutsche Bank salespersons and traders, trading strategies or ideas that reference catalysts or events that mayhave a near-term or medium-term impact on the market price of the securities discussed in this report, which impactmay be directionally counter to the analysts' current 12-month view of total return or investment return as describedherein. Deutsche Bank has no obligation to update, modify or amend this report or to otherwise notify a recipient thereofif an opinion, forecast or estimate changes or becomes inaccurate. Coverage and the frequency of changes in marketconditions and in both general and company-specific economic prospects make it difficult to update research at definedintervals. Updates are at the sole discretion of the coverage analyst or of the Research Department Management, and themajority of reports are published at irregular intervals. This report is provided for informational purposes only and doesnot take into account the particular investment objectives, financial situations, or needs of individual clients. It is not anoffer or a solicitation of an offer to buy or sell any financial instruments or to participate in any particular trading strategy.Target prices are inherently imprecise and a product of the analyst ’ s judgment. The financial instruments discussedin this report may not be suitable for all investors, and investors must make their own informed investment decisions.Prices and availability of financial instruments are subject to change without notice, and investment transactions can leadto losses as a result of price fluctuations and other factors. If a financial instrument is denominated in a currency otherthan an investor's currency, a change in exchange rates may adversely affect the investment. Past performance is notnecessarily indicative of future results. Performance calculations exclude transaction costs, unless otherwise indicated.Unless otherwise indicated, prices are current as of the end of the previous trading session and are sourced from localexchanges via Reuters, Bloomberg and other vendors. Data is also sourced from Deutsche Bank, subject companies, andother parties.??The Deutsche Bank Research Department is independent of other business divisions of the Bank. Details regardingorganizational arrangements and information barriers we have established to prevent and avoid conflicts of interest withrespect to our research are available on our website under Disclaimer, found on the Legal tab.??
Page 78 Deutsche Bank Securities Inc.

21 January 2018
Beverages
Latam Consumer Monthly
Macroeconomic fluctuations often account for most of the risks associated with exposures to instruments that promiseto pay fixed or variable interest rates. For an investor who is long fixed-rate instruments (thus receiving these cashflows), increases in interest rates naturally lift the discount factors applied to the expected cash flows and thuscause a loss. The longer the maturity of a certain cash flow and the higher the move in the discount factor, thehigher will be the loss. Upside surprises in inflation, fiscal funding needs, and FX depreciation rates are among themost common adverse macroeconomic shocks to receivers. But counterparty exposure, issuer creditworthiness, clientsegmentation, regulation (including changes in assets holding limits for different types of investors), changes in taxpolicies, currency convertibility (which may constrain currency conversion, repatriation of profits and/or liquidation ofpositions), and settlement issues related to local clearing houses are also important risk factors. The sensitivity of fixed-income instruments to macroeconomic shocks may be mitigated by indexing the contracted cash flows to inflation, toFX depreciation, or to specified interest rates – these are common in emerging markets. The index fixings may – byconstruction – lag or mis-measure the actual move in the underlying variables they are intended to track. The choice ofthe proper fixing (or metric) is particularly important in swaps markets, where floating coupon rates (i.e., coupons indexedto a typically short-dated interest rate reference index) are exchanged for fixed coupons. Funding in a currency that differsfrom the currency in which coupons are denominated carries FX risk. Options on swaps (swaptions) the risks typical tooptions in addition to the risks related to rates movements.??Derivative transactions involve numerous risks including market, counterparty default and illiquidity risk. Theappropriateness of these products for use by investors depends on the investors' own circumstances, including theirtax position, their regulatory environment and the nature of their other assets and liabilities; as such, investors shouldtake expert legal and financial advice before entering into any transaction similar to or inspired by the contents of thispublication. The risk of loss in futures trading and options, foreign or domestic, can be substantial. As a result of thehigh degree of leverage obtainable in futures and options trading, losses may be incurred that are greater than theamount of funds initially deposited – up to theoretically unlimited losses. Trading in options involves risk and is notsuitable for all investors. Prior to buying or selling an option, investors must review the "Characteristics and Risks ofStandardized Options”, at http://www.optionsclearing.com/about/publications/character-risks.jsp. If you are unable toaccess the website, please contact your Deutsche Bank representative for a copy of this important document.??Participants in foreign exchange transactions may incur risks arising from several factors, including: (i) exchange rates canbe volatile and are subject to large fluctuations; (ii) the value of currencies may be affected by numerous market factors,including world and national economic, political and regulatory events, events in equity and debt markets and changes ininterest rates; and (iii) currencies may be subject to devaluation or government-imposed exchange controls, which couldaffect the value of the currency. Investors in securities such as ADRs, whose values are affected by the currency of anunderlying security, effectively assume currency risk.??Deutsche Bank is not acting as a financial adviser, consultant or fiduciary to you or any of your agents with respect toany information provided in this report. Deutsche Bank does not provide investment, legal, tax or accounting advice, andis not acting as an impartial adviser. Information contained herein is being provided on the basis that the recipient willmake an independent assessment of the merits of any investment decision, and is not meant for retirement accounts orfor any specific person or account type. The information we provide is directed only to persons we believe to be financiallysophisticated, who are capable of evaluating investment risks independently, both in general and with regard to particulartransactions and investment strategies, and who understand that Deutsche Bank has financial interests in the offering ofits products and services. If this is not the case, or if you or your agent are an IRA or other retail investor receiving thisdirectly from us, we ask that you inform us immediately.
Unless governing law provides otherwise, all transactions should be executed through the Deutsche Bank entity in theinvestor's home jurisdiction. Aside from within this report, important risk and conflict disclosures can also be found athttps://gm.db.com on each company ’ s research page and under the "Disclosures Lookup" and "Legal" tabs. Investorsare strongly encouraged to review this information before investing.
United States: Approved and/or distributed by Deutsche Bank Securities Incorporated, a member of FINRA, NFA and SIPC.Analysts located outside of the United States are employed by non-US affiliates that are not subject to FINRA regulations,including those regarding contacts with issuer companies.??
Deutsche Bank Securities Inc. Page 79

21 January 2018
Beverages
Latam Consumer Monthly
Germany: Approved and/or distributed by Deutsche Bank AG, a joint stock corporation with limited liability incorporatedin the Federal Republic of Germany with its principal office in Frankfurt am Main. Deutsche Bank AG is authorized underGerman Banking Law and is subject to supervision by the European Central Bank and by BaFin, Germany ’ s FederalFinancial Supervisory Authority.??United Kingdom: Approved and/or distributed by Deutsche Bank AG acting through its London Branch at WinchesterHouse, 1 Great Winchester Street, London EC2N 2DB. Deutsche Bank AG in the United Kingdom is authorised by thePrudential Regulation Authority and is subject to limited regulation by the Prudential Regulation Authority and FinancialConduct Authority. Details about the extent of our authorisation and regulation are available on request.??Hong Kong: Distributed by Deutsche Bank AG, Hong Kong Branch or Deutsche Securities Asia Limited (save that anyresearch relating to futures contracts within the meaning of the Hong Kong Securities and Futures Ordinance Cap. 571shall be distributed solely by Deutsche Securities Asia Limited). The provisions set out above in the "Additional Information"section shall apply to the fullest extent permissible by local laws and regulations, including without limitation the Code ofConduct for Persons Licensed or Registered with the Securities and Futures Commission. .??India: Prepared by Deutsche Equities India Private Limited (DEIPL) having CIN: U65990MH2002PTC137431 and registeredoffice at 14th Floor, The Capital, C-70, G Block, Bandra Kurla Complex Mumbai (India) 400051. Tel: + 91 22 71804444. It is registered by the Securities and Exchange Board of India (SEBI) as a Stock broker bearing registrationnos.: NSE (Capital Market Segment) - INB231196834, NSE (F&O Segment) INF231196834, NSE (Currency DerivativesSegment) INE231196834, BSE (Capital Market Segment) INB011196830; Merchant Banker bearing SEBI Registrationno.: INM000010833 and Research Analyst bearing SEBI Registration no.: INH000001741. DEIPL may have receivedadministrative warnings from the SEBI for breaches of Indian regulations. The transmission of research through DEIPLis Deutsche Bank's determination and will not make a recipient a client of DEIPL. Deutsche Bank and/or its affiliate(s)may have debt holdings or positions in the subject company. With regard to information on associates, please refer to the“Shareholdings” section in the Annual Report at: https://www.db.com/ir/en/annual-reports.htm.??Japan: Approved and/or distributed by Deutsche Securities Inc.(DSI). Registration number - Registered as a financialinstruments dealer by the Head of the Kanto Local Finance Bureau (Kinsho) No. 117. Member of associations: JSDA, TypeII Financial Instruments Firms Association and The Financial Futures Association of Japan. Commissions and risks involvedin stock transactions - for stock transactions, we charge stock commissions and consumption tax by multiplying thetransaction amount by the commission rate agreed with each customer. Stock transactions can lead to losses as a resultof share price fluctuations and other factors. Transactions in foreign stocks can lead to additional losses stemming fromforeign exchange fluctuations. We may also charge commissions and fees for certain categories of investment advice,products and services. Recommended investment strategies, products and services carry the risk of losses to principaland other losses as a result of changes in market and/or economic trends, and/or fluctuations in market value. Beforedeciding on the purchase of financial products and/or services, customers should carefully read the relevant disclosures,prospectuses and other documentation. "Moody's", "Standard & Poor's", and "Fitch" mentioned in this report are notregistered credit rating agencies in Japan unless Japan or "Nippon" is specifically designated in the name of the entity.Reports on Japanese listed companies not written by analysts of DSI are written by Deutsche Bank Group's analysts withthe coverage companies specified by DSI. Some of the foreign securities stated on this report are not disclosed accordingto the Financial Instruments and Exchange Law of Japan. Target prices set by Deutsche Bank's equity analysts are basedon a 12-month forecast period..??Korea: Distributed by Deutsche Securities Korea Co.??South Africa: Deutsche Bank AG Johannesburg is incorporated in the Federal Republic of Germany (Branch RegisterNumber in South Africa: 1998/003298/10).??Singapore: This report is issued by Deutsche Bank AG, Singapore Branch or Deutsche Securities Asia Limited, SingaporeBranch (One Raffles Quay #18-00 South Tower Singapore 048583, +65 6423 8001), which may be contacted in respectof any matters arising from, or in connection with, this report. Where this report is issued or promulgated by DeutscheBank in Singapore to a person who is not an accredited investor, expert investor or institutional investor (as defined in theapplicable Singapore laws and regulations), they accept legal responsibility to such person for its contents.??
Page 80 Deutsche Bank Securities Inc.

21 January 2018
Beverages
Latam Consumer Monthly
Taiwan: Information on securities/investments that trade in Taiwan is for your reference only. Readers shouldindependently evaluate investment risks and are solely responsible for their investment decisions. Deutsche Bank researchmay not be distributed to the Taiwan public media or quoted or used by the Taiwan public media without written consent.Information on securities/instruments that do not trade in Taiwan is for informational purposes only and is not to beconstrued as a recommendation to trade in such securities/instruments. Deutsche Securities Asia Limited, Taipei Branchmay not execute transactions for clients in these securities/instruments.??Qatar: Deutsche Bank AG in the Qatar Financial Centre (registered no. 00032) is regulated by the Qatar Financial CentreRegulatory Authority. Deutsche Bank AG - QFC Branch may undertake only the financial services activities that fall withinthe scope of its existing QFCRA license. Its principal place of business in the QFC: Qatar Financial Centre, Tower, WestBay, Level 5, PO Box 14928, Doha, Qatar. This information has been distributed by Deutsche Bank AG. Related financialproducts or services are only available only to Business Customers, as defined by the Qatar Financial Centre RegulatoryAuthority.??Russia: The information, interpretation and opinions submitted herein are not in the context of, and do not constitute, anyappraisal or evaluation activity requiring a license in the Russian Federation.
Kingdom of Saudi Arabia: Deutsche Securities Saudi Arabia LLC Company (registered no. 07073-37) is regulated by theCapital Market Authority. Deutsche Securities Saudi Arabia may undertake only the financial services activities that fallwithin the scope of its existing CMA license. Its principal place of business in Saudi Arabia: King Fahad Road, Al OlayaDistrict, P.O. Box 301809, Faisaliah Tower - 17th Floor, 11372 Riyadh, Saudi Arabia.??United Arab Emirates: Deutsche Bank AG in the Dubai International Financial Centre (registered no. 00045) is regulatedby the Dubai Financial Services Authority. Deutsche Bank AG - DIFC Branch may undertake only the financial servicesactivities that fall within the scope of its existing DFSA license. Its principal place of business in the DIFC: DubaiInternational Financial Centre, The Gate Village, Building 5, PO Box 504902, Dubai, U.A.E. This information has beendistributed by Deutsche Bank AG. Related financial products or services are available only to Professional Clients, asdefined by the Dubai Financial Services Authority.??Australia and New Zealand: This research is intended only for "wholesale clients" within the meaning of theAustralian Corporations Act and New Zealand Financial Advisors Act, respectively. Please refer to Australia-specificresearch disclosures and related information at https://australia.db.com/australia/content/research-information.htmlWhere research refers to any particular financial product recipients of the research should consider any product disclosurestatement, prospectus or other applicable disclosure document before making any decision about whether to acquirethe product.??Additional information relative to securities, other financial products or issuers discussed in this report is available uponrequest. This report may not be reproduced, distributed or published without Deutsche Bank's prior written consent.Copyright © 2018 Deutsche Bank AG
Deutsche Bank Securities Inc. Page 81

David Folkerts-LandauGroup Chief Economist and Global Head of Research
Raj HindochaGlobal Chief Operating Officer
Research
Michael SpencerHead of APAC Research
Global Head of Economics
Steve PollardHead of Americas Research
Global Head of Equity Research
Anthony KlarmanGlobal Head ofDebt Research
Paul ReynoldsHead of EMEA
Equity Research
Dave ClarkHead of APAC
Equity Research
Pam FinelliGlobal Head of
Equity Derivatives Research
Andreas NeubauerHead of Research - Germany
Spyros MesomerisGlobal Head of Quantitative
and QIS Research
International Production Locations
Deutsche Bank AGDeutsche Bank PlaceLevel 16Corner of Hunter & Phillip StreetsSydney, NSW 2000AustraliaTel: (61) 2 8258 1234
Deutsche Bank AGMainzer Landstrasse 11-1760329 Frankfurt am MainGermanyTel: (49) 69 910 00
Deutsche Bank AGFiliale HongkongInternational Commerce Centre,1 Austin Road West,Kowloon,Hong KongTel: (852) 2203 8888
Deutsche Securities Inc.2-11-1 NagatachoSanno Park TowerChiyoda-ku, Tokyo 100-6171JapanTel: (81) 3 5156 6770
Deutsche Bank AG London1 Great Winchester StreetLondon EC2N 2EQUnited KingdomTel: (44) 20 7545 8000
Deutsche Bank Securities Inc.60 Wall StreetNew York, NY 10005United States of AmericaTel: (1) 212 250 2500