
204 JOURNAL OF METEOROLOGY Vol.28 No.279 May / June … · and TORRO Hailstorm Division. 10...
22
204 INTERNATIONAL EDITORIAL ADVISORY BOARD JOURNAL OF METEOROLOGY Vol.28 No.279 May / June 2003 Dr. NICHOLAS L. BETTS Department of Geography, The Queen’s University of Belfast, Belfast, BT7 1NN, U.K. Prof. TIMOTHY P. BURT School of Geography, Science Labs., University of Durham, Durham, DH1 3LE, U.K. ROBERT A. CROWDER, formerly Lincoln College, University College of Agriculture, Canterbury, N.Z. 73 Ashgrove Terrace, Speydon, Christchurch, New Zealand Prof. JEAN DESSENS Centre de Recherches Atmosphériques, Université Paul Sabatier, Campistrous, 65300 Lannemezan, France Prof. DEREK ELSOM Director of TORRO, Geography Department, Oxford Brookes University, Oxford, OX3 0BP, U.K. (01865) 483750, (01865) 483761 [email protected] Prof. GREGORY FORBES, formerly Professor of Meteorology, Penn State University, Pennsylvania ,USA 50 Settlers Court, Marietta, Georgia 30067-4232, USA Dr. TERENCE MEADEN, formerly Professor of Physics, Dalhousie University, Halifax, N. S., Canada TORRO Tornado Division, TORRO Publications Division, Director of TORRO 1974-1994. QED House, Frome Road, Bradford-on-Avon, Wiltshire, BA15 1LD . Tel: (0870) 7701023 Dr. ALLEN H. PERRY Department of Geography, University College of Swansea, Singleton Park, Swansea, SA2 8PP, U.K Prof. RICHARD E. PETERSON, Professor of Atmospheric Science, Texas Tech University, Lubbock, Texas 74909, USA. Prof. JOHN T. SNOW University of Oklahoma, Sarkey Energy Center, 100 East Boyd Street, Norman, Oklahoma, 73019-0828, U.S.A. Dr. JOHN TYRRELL Department of Geography, University College Cork, Cork, Ireland. Tel: 00.353.21.902326 [email protected] Dr. DENNIS A. WHEELER Geography Department, Sunderland University, Chester Road, Sunderland, SR1 3SD, U.K. ROBERT DOE, Editor of the Journal of Meteorology, [email protected] TORRO Coastal Impacts Division, Department of Geography, University of Portsmouth, Portsmouth, Hampshire, PO1 3HE (07816) 573267 PETER VAN DOORN TORRO Ball Lightning Division, 32 Franklin Road, Shoreham-by-Sea, Sussex, BN43 6 YD. Tel: (01273) 888704. [email protected] ANTHONY GILBERT TORRO Tornado Site Investigation Division, 51 Darwin Way, Gosport, Hampshire, PO13 8AF Tel: (023) 9250255 / (07788) 990114 [email protected] STEPHEN ROBERTS TORRO Windstorm Division, Weathernet Ltd., Kingsland House, 21 Hinton Road, Bournemouth, BH1 2DE Tel: (01202) 293868. [email protected] ALAN C. ROGERS TORRO Administration Cherry Tree Cottage, Meshaw, S. Molton, Devon, EX36 4ND (01769) 55031 [email protected] MICHAEL W. ROWE TORRO Tornado Division, 21 Bankview, Buckland Park, Lymington, Hampshire, SO41 8YG. Tel: (01590) 678121 JONATHAN D.C. WEBB TORRO Thunderstorm Division (incorporating Thunderstorm Census Organisation, founded 1924) and TORRO Hailstorm Division. 10 Seacourt Road, Botley, Oxford OX2 9LD, U.K. Tel: (01865) 790611 [email protected] RICHARD J. WILD TORRO Heavy Snowfalls and Blizzards Division. Weathernet Ltd., Kingsland House, 21 Hinton Road, Bournemouth, BH1 2DE (01202) 771407. [email protected] JOHN WILSON BOOK REVIEW EDITOR PETER R. ROGERS, 15 Knole Road, Sevenoaks, Kent, TN13 3XH. Tel: (01732) 456911 PICTURE EDITOR MARK HUMPAGE, PO BOX 5161, Bournemouth, Dorset, BH10 4WJ. Tel: (07710) 486350 JOURNAL OF METEOROLOGY "An international magazine for everyone interested in weather and climate, and in their influence on the human and physical environment." Editor: Robert K. Doe Vol. 28, no. 279 May / June 2003 161 TELECONNECTION BETWEEN GLOBAL CLIMATIC EVENTS, ATMOSPHERIC CIRCULATION CHANGE AND STREAM FLOW OVER THE RIVER NILE By H. M. HASANEAN Faculty of Science, Dept. of Astronomy and Meteorology, Cairo University, Giza, Egypt. E-mail: [email protected] Abstract: An overview is presented of the principal features of the El Nino Southern Oscillation (ENSO), Tropical Atlantic sea surface temperature and North Atlantic Oscillation (NAO), which are teleconnections in terms of stream flow over the River Nile. Atmospheric circulation changes associated with wet and dry in the flood season (from July to October) are described using the NCEP/NCAR Reanalysis data from July to October, especially in El Nino and La Nina years. The natural stream flow over the River Nile depends mainly on Sahelian rainfall. Inverse relationships are found between 3-months seasonal cycle stream flow and ENSO over the River Nile. Tropical Atlantic sea surface temperature have similar response to ENSO influence on stream flow over the Nile, which indicates inverse relationships with stream flow. The influence of North Atlantic Oscillation (NAO) is much weaker on stream flow over the River Nile. Unlike other seasons, the spring season of stream flow indicates positive relationships with ENSO and Tropical Atlantic sea surface temperatures. The duration of the rainfall amount depends upon both location of the inter-tropical convergence zone (ITCZ) and the meridional sea surface temperature (SST) gradient in the tropical Atlantic. Tropical Easterly jet stream was weakened in El Nino year and enhanced in La Nina year accompanying with the dry and wet condition respectively. During La Nina year, easterly wind is strong not only over North Africa but also over tropical Atlantic Ocean. The oscillation and strength of Asiatic monsoon low pressure and subtropical high pressure play an important role in rainfall over the Nile River. INTRODUCTION The Nile flood, predominantly from the Ethiopian Highlands of the Blue Nile, accounts for over 75% of the annual flow. The Nile flood occurs in the four months July to October. Regional precipitation has increased over most land areas, with the exception of tropical North Africa and parts of Southern Africa, Amazonian and western South America (Mark, et al. 2001). Natural factors, which include changes in precipitation regimes particularly over the headwaters of the Blue and/or White Niles, changes in evaporation, and changes in vegetation in the catchments, affect runoff. Such changes however, may also be anthropogenic in origin with precipitation being affected by, for example, human-induced (Nicholson, 1988). Additional anthropogenic factors affecting the total natural stream flow include the extraction of water for domestic, agricultural, industrial, or power generation purposes. On the global scale, decadal to century-scale variability and change in the climatic system are determined by nature e.g. solar cycle, and anthropogenic factors e.g. greenhouse gases and aerosols (IPCC 1990, and 1996). TORRO DIRECTORS ASSOCIATED WITH THE JOURNAL OF METEOROLOGY TORRO Weather and Health Division. 38 Stuart Close, Arnold, Notts, NG5 8AE [email protected]
Transcript of 204 JOURNAL OF METEOROLOGY Vol.28 No.279 May / June … · and TORRO Hailstorm Division. 10...

204
INTERNATIONAL EDITORIAL ADVISORY BOARD
JOURNAL OF METEOROLOGY Vol.28 No.279 May / June 2003
Dr. NICHOLAS L. BETTSDepartment of Geography, The Queen’s University of Belfast, Belfast, BT7 1NN, U.K.
Prof. TIMOTHY P. BURTSchool of Geography, Science Labs., University of Durham, Durham, DH1 3LE, U.K.
ROBERT A. CROWDER, formerly Lincoln College, University College of Agriculture, Canterbury, N.Z.73 Ashgrove Terrace, Speydon, Christchurch, New Zealand
Prof. JEAN DESSENSCentre de Recherches Atmosphériques, Université Paul Sabatier, Campistrous, 65300 Lannemezan, France
Prof. DEREK ELSOMDirector of TORRO, Geography Department, Oxford Brookes University, Oxford, OX3 0BP, U.K.
(01865) 483750, (01865) 483761 [email protected]. GREGORY FORBES, formerly Professor of Meteorology, Penn State University, Pennsylvania ,USA
50 Settlers Court, Marietta, Georgia 30067-4232, USADr. TERENCE MEADEN, formerly Professor of Physics, Dalhousie University, Halifax, N. S., Canada
TORRO Tornado Division, TORRO Publications Division, Director of TORRO 1974-1994. QED House, Frome Road, Bradford-on-Avon, Wiltshire, BA15 1LD . Tel: (0870) 7701023Dr. ALLEN H. PERRY
Department of Geography, University College of Swansea, Singleton Park, Swansea, SA2 8PP, U.KProf. RICHARD E. PETERSON,
Professor of Atmospheric Science, Texas Tech University, Lubbock, Texas 74909, USA.Prof. JOHN T. SNOW
University of Oklahoma, Sarkey Energy Center, 100 East Boyd Street, Norman, Oklahoma, 73019-0828,U.S.A.
Dr. JOHN TYRRELLDepartment of Geography, University College Cork, Cork, Ireland. Tel: 00.353.21.902326 [email protected]
Dr. DENNIS A. WHEELERGeography Department, Sunderland University, Chester Road, Sunderland, SR1 3SD, U.K.
ROBERT DOE, Editor of the Journal of Meteorology, [email protected] Coastal Impacts Division, Department of Geography, University of Portsmouth, Portsmouth,Hampshire, PO1 3HE (07816) 573267
PETER VAN DOORNTORRO Ball Lightning Division, 32 Franklin Road, Shoreham-by-Sea, Sussex, BN43 6 YD.Tel: (01273) 888704. [email protected]
ANTHONY GILBERTTORRO Tornado Site Investigation Division, 51 Darwin Way, Gosport, Hampshire, PO13 8AFTel: (023) 9250255 / (07788) 990114 [email protected]
STEPHEN ROBERTSTORRO Windstorm Division, Weathernet Ltd., Kingsland House, 21 Hinton Road, Bournemouth,BH1 2DE Tel: (01202) 293868. [email protected]
ALAN C. ROGERS TORRO AdministrationCherry Tree Cottage, Meshaw, S. Molton, Devon, EX36 4ND (01769) 55031 [email protected]
MICHAEL W. ROWETORRO Tornado Division, 21 Bankview, Buckland Park, Lymington, Hampshire, SO41 8YG.Tel: (01590) 678121
JONATHAN D.C. WEBBTORRO Thunderstorm Division (incorporating Thunderstorm Census Organisation, founded 1924)and TORRO Hailstorm Division. 10 Seacourt Road, Botley, Oxford OX2 9LD, U.K. Tel: (01865) [email protected]
RICHARD J. WILDTORRO Heavy Snowfalls and Blizzards Division. Weathernet Ltd., Kingsland House, 21 Hinton Road,Bournemouth, BH1 2DE (01202) 771407. [email protected]
JOHN WILSON
BOOK REVIEW EDITORPETER R. ROGERS, 15 Knole Road, Sevenoaks, Kent, TN13 3XH. Tel: (01732) 456911
PICTURE EDITORMARK HUMPAGE, PO BOX 5161, Bournemouth, Dorset, BH10 4WJ. Tel: (07710) 486350
JOURNAL OF METEOROLOGY"An international magazine for everyone interested in weather and climate, and
in their influence on the human and physical environment."
Editor: Robert K. Doe Vol. 28, no. 279 May / June 2003
161
TELECONNECTION BETWEEN GLOBAL CLIMATIC EVENTS,ATMOSPHERIC CIRCULATION CHANGE
AND STREAM FLOW OVER THE RIVER NILE
By H. M. HASANEAN Faculty of Science, Dept. of Astronomy and Meteorology, Cairo University, Giza, Egypt.
E-mail: [email protected]
Abstract: An overview is presented of the principal features of the El Nino Southern Oscillation(ENSO), Tropical Atlantic sea surface temperature and North Atlantic Oscillation (NAO), which areteleconnections in terms of stream flow over the River Nile. Atmospheric circulation changes associatedwith wet and dry in the flood season (from July to October) are described using the NCEP/NCARReanalysis data from July to October, especially in El Nino and La Nina years. The natural streamflow over the River Nile depends mainly on Sahelian rainfall. Inverse relationships are found between3-months seasonal cycle stream flow and ENSO over the River Nile. Tropical Atlantic sea surfacetemperature have similar response to ENSO influence on stream flow over the Nile, which indicatesinverse relationships with stream flow. The influence of North Atlantic Oscillation (NAO) is muchweaker on stream flow over the River Nile. Unlike other seasons, the spring season of stream flowindicates positive relationships with ENSO and Tropical Atlantic sea surface temperatures. Theduration of the rainfall amount depends upon both location of the inter-tropical convergence zone(ITCZ) and the meridional sea surface temperature (SST) gradient in the tropical Atlantic. TropicalEasterly jet stream was weakened in El Nino year and enhanced in La Nina year accompanying withthe dry and wet condition respectively. During La Nina year, easterly wind is strong not only overNorth Africa but also over tropical Atlantic Ocean. The oscillation and strength of Asiatic monsoonlow pressure and subtropical high pressure play an important role in rainfall over the Nile River.
INTRODUCTIONThe Nile flood, predominantly from the Ethiopian Highlands of the Blue Nile,
accounts for over 75% of the annual flow. The Nile flood occurs in the four months Julyto October. Regional precipitation has increased over most land areas, with the exceptionof tropical North Africa and parts of Southern Africa, Amazonian and western SouthAmerica (Mark, et al. 2001). Natural factors, which include changes in precipitationregimes particularly over the headwaters of the Blue and/or White Niles, changes inevaporation, and changes in vegetation in the catchments, affect runoff. Such changeshowever, may also be anthropogenic in origin with precipitation being affected by, forexample, human-induced (Nicholson, 1988). Additional anthropogenic factors affectingthe total natural stream flow include the extraction of water for domestic, agricultural,industrial, or power generation purposes. On the global scale, decadal to century-scalevariability and change in the climatic system are determined by nature e.g. solar cycle,and anthropogenic factors e.g. greenhouse gases and aerosols (IPCC 1990, and 1996).
TORRO DIRECTORS ASSOCIATED WITH THE JOURNAL OF METEOROLOGY
TORRO Weather and Health Division. 38 Stuart Close, Arnold, Notts, NG5 8AE [email protected]

203
Research papers, letters, books and reports for review, news items, conference informationand other communications on all aspects of meteorology are to be addressed to the Editor.
Whenever possible authors should send their contributions by post on a floppy disk, or bye-mail to [email protected]. A paper copy sent by post is also requested.This speeds up processing and correspondence, and allows for efficient minor editing and agreedmajor editing.
Contributions should be prepared with 1.5 or double line spacing and broad margins. Everypaper must commence with a short abstract summarising its significant and original content.Authors must consult recent issues of the journal as a guide to the layout of papers. Line drawingsmay be prepared up to 50 to 100% oversize, with a quality that is good enough for directreproduction. They should be drawn with a black pen on good quality paper with letteringsymbols that will be legible after reduction. All figures require numbered captions and thecaptions are to be collected in sequence at the end of the paper. Each table should be numberedand bear a title. References should be referred to in the text by the author's name and year ofpublication, e.g. Browning (1995).
Responsibility for opinions expressed in signed articles rests with their authors who shouldobtain copyright permission where necessary. Please note that page charges may have to beimposed for some articles containing special artwork, complex equations, or numerousphotographs or diagrams.
Note that for universal citation purposes the recommended abbreviation of the journal'stitle is J. Meteorology, U.K.Corrections will be published at the discretion of the Editorial Board and should be brought tothe attention of the Editor in the first instance.
Institutional subscription rates for 2003: Volume 28, including surface post, UK £90.00;rest of world £100.00; including airmail £110.00. For personal subscriptions from individualsthe reduced prices are UK £35.00; rest of world £40.00; airmail £45.00.
Back issues may be purchased singly or as complete volumes. Single issues pro rata. Someissues are out of print in which case magazines will be constructed using double-sidedphotocopied sheets.
Published by Robert K. Doe / Artetech Publishing Company, Tel: +44 (0) 7816 573267Printed by Ashley Press, Creekmoor Trading Estate, Poole, Dorset. Tel: 01202 695656
(c) Artetech Publishing Company ISSN 0307-5966
THE JOURNAL OF METEOROLOGY
Published in association with The Tornado and Storm Research Organisationa privately supported research body, serving the international public interest
Edited by R.K. Doe, Editorial Office, PO Box 5161,Bournemouth, Dorset, BH10 4WJ, United Kingdom.
Telephone: (07816) 573267; international +44 7816 573267 (Office hours only)
[email protected] http://www.journalofmeteorology.com
JOURNAL OF METEOROLOGY Vol.28 No.279 May / June 2003162 JOURNAL OF METEOROLOGY Vol.28 No.279 May / June 2003
Although ENSO has been shown to be one of the primary dominants of inter-annual variability of rainfall in the low-latitude, its influence on Africa remainscontroversial. Links between ENSO and large-scale precipitation patterns have beenexamined since the earliest studies of this phenomenon. Indeed, the pioneering studiesby Walker (1923, 1924, 1928), which first documented ENSO on a global scale, weremotivated by attempts to understand and predict variations in Indian monsoon rainfalland then were expanded to studies of precipitation around the globe. The possiblerelationships might exist between a climatic event, termed El-Nino Southern Oscillation(ENSO) phenomenon, and other climatic anomalies worldwide (Ropelewski and Halpert,1987). Ropelewski and Halpert (1987) indicated that oscillations in the state of theocean-atmosphere system in the Pacific region (ENSO) are related to inter-annualfluctuation of rainfall and river flow in several regions of the world. Ogallo (1985)illustrated the negative relationships between rainfall over many parts of Eastern Africaand ENSO event. However, the relationship between ENSO and rainfall over that portionof the Ethiopian Plateau, which contribute to River Nile inflows has not been thoroughlyinvestigated. Eltahir (1996) and Wang and Eltahir (1998) found significant relationshipbetween stream flow over the Nile and El Nino and Southern Oscillation.
The North Atlantic Oscillation (NAO) is most pronounced in winter butdetectable as a characteristic pattern in all months. The winter NAO pattern contributesthe largest fraction of the Northern Hemisphere temperature variability of any mid-latitude or tropical mode of fluctuation. NAO fluctuations are found in the patterns ofprecipitation in between Mediterranean Eurasia/Africa and the eastern United States aswell as storminess over the ocean and adjacent land areas.
Many researchers investigated relationship between Sahelian rainfall andAtlantic Ocean sea surface temperature. Lough (1986) and Ropelewski and Halpert(1987) found that inter-annual variations in Sahelian rainfall have been linked to AtlanticOcean sea surface temperature anomaly pattern. Sahelian Region extended from 12.5oNto 20oN and from the Atlantic to the Red sea (Folland et al. 1991). The deficient precipitationin the Sahel tends to be associated with anomalous cold SST in the south Atlantic(Hastenrath, 1990). Tropical Atlantic SSTs and the latitudinal position of the inter-tropical convergence zone (ITCZ) are connected with Sahelian rainfall variability (Tourreand Lamb 1997, Ward, 1998). Sea surface temperature anomalies in the tropical Atlanticcan lead to shifts in climatic patterns over Africa. Also, it has a significant impact on theposition and intensity of the ITCZ, which in turn influence the rainfall over the Sahel inAfrica (WCRP, 1997).
The aim of this research is to study the association between global climaticevents (ENSO, Atlantic ENSO, and NAO), atmospheric circulation changes and streamflow over Nile River). Data and methodology are presented and an attempt is made toexamine the relationships between mean natural stream flow for three irrigation stationson the River Nile and global climatic events. While relationship between type ofatmospheric circulation and the prevalence of rainfall during El Nino and La Nina yearis shown.

163202 JOURNAL OF METEOROLOGY Vol.28 No.279 May / June 2003 JOURNAL OF METEOROLOGY Vol.28 No.279 May / June 2003
Warmest: 7°C Penzance, CornwallCoolest: 2.4°C Darvel, StrathclydeWettest: 286mm Sconser, HighlandDriest: 39.5mm Neston, CheshireDullest: 33.3hrs Edinburgh, Mid Lothian
Hottest: 18.3°C Aboyne, Aberdeenshire 26th
Coldest: -18.3°C Aviemore, Highland 7th
Most Rain: 50.7mm Sconser, Highland 24th
Most Sun: 8 hrs Wokingham, Berks. 31st
Windiest: 73mph Llsfaen, Clwyd. Down 16th
Sunniest: 121.6 hrs Weymouth, Dorset
BRITISH WEATHER EXTREMES: JANUARY 2003
© WeatherNet Ltd. / D. Bowker Extremes data supplied from 60 private UK weather stations
www.weathernet.co.uk
DATA AND METHODOLOGYThere are two primary sources of the main Nile River channels, the Blue Nile
and the White Nile. Combining with these sources to augment the Nile's flows are threeother major tributaries: Bahr El Ghazal, River Sobat and River Atbara. The annual yield ofthe Blue Nile at Khartoum is around 54-milliard m3 per year. The total amount of waterprovided by the White Nile at Malakal is on the average 29-milliard m3 per year, distributionis relatively uniform throughout the year. The average amount of water arriving to Aswanis estimated to be of 84-milliard m3 per year.
Monthly mean stream flow observations at three hydrological stations situatedin the Nile were used: Aswan (20.9o N, 32.9o E) from 1950 to 1996, Khartoum (24.0o N 32.9oE)and Malakal (9.5o N, 31.6oE) from 1950 to 1996. The stream flow data set for the Nile hasbeen supplied by the Ministry of Water Resources of Egypt. Monthly data of NorthAtlantic Oscillation index, and global sea surface temperature (SST) anomalies (Nino3,Tropical Atlantic Ocean) during the period from 1950 to 1996 were obtained from NationalCenter for Atmospheric Research (NCAR). The strength of the NAO phases are measuredthrough an index, defined as the difference between the normalised pressure anomaly, atGibraltar, and that at Reykjavik (Iceland). This index has been computed by Jones et al.(1997). The Nino3 index which covers the area between 5oN-5oS latitude and 150oW-90oWlongitude is often used an index of SST anomalies associated with ENSO cycle (WMO,1996). Therefore Nino3 is used here to investigate the relationship between ENSO andstream flow over Nile River. Tropical Atlantic sea surface temperatures, which lies between10oS, to 10oN latitude and from 0 to 360 degree longitude may affect stream flow over theRiver Nile.
The NCEP/NCAR Reanalysis data of mean geopotential height, vector wind at1000 hPa, zonal wind at 150 hPa, and surface outgoing longwave radiation from July toOctober were obtained from Climate Diagnostics Center (NOAA, Boulder, Co.). A largepart of the results presented here are based on classical correlation analysis, whichconsiders the "similarity" between the variability of two variables (Mood et al., 1974). Inthis case the variables are the 12 month life cycle of ENSO, Tropical Atlantic SSTs, NAOand stream flow over Nile River. Running mean for 3-months of stream flow over NileRiver are computed.
STREAM FLOW AND GLOBAL CLIMATIC EVENTSAlthough correlation coefficient is simple by definition, it can indicate a physical
relationship between two or more variables. Thus, the so-called correlation matrices arethe base for a "factor analysis" which has wider meaning than the "principal componentanalysis". Both of which have been applied frequently during the last few decades,Maheras (1985), Ehrendorfer (1987), Pandzic (1988), and Pandzic and Trinic (1998). Theirapplication is also significant in data assimilation techniques e.g. for data control or their"objective analysis" (Daley, 1991). Even in testing deterministic models, correlationcoefficients can play a significant role (Carrol, 1995). Taking all this into consideration,the use of correlation indices in the study of meteorological and hydrological phenomenamakes sense, especially if a field to field relationship is considered, as in this study.
BRITISH WEATHER SUMMARY: JANUARY 2003
This was a lively month of contrasts. In the mean, temperatures were not farfrom a degree above normal, rainfall generally above normal in the north and east andbelow in the south and west - and sunshine mostly well above normal, registering over100 hours in some southern coastal regions, including a reported British January recordof 121.6 hours at Weymouth.
The very wet weather that affected many areas in the closing days of 2002continued for a couple of days into 2003 over central and southern regions, as vigorousdepressions raced eastwards across the south; there was a good deal of flooding.Colder, drier weather in the north pushed south across the whole country by the 4th, andthe floods slowly subsided under often sunny skies. There were snow showers, especially- at first - in the north. As high pressure settled over Scotland on the 6th and 7th, somevalleys here experienced persistent severe frost; at Aviemore on the 7th, the temperatureonly rose from -18C to -9C. Areas of snow moved southwest across some eastern andsoutheastern counties on the 7th and 8th, and over ten centimetres accumulated in partsof south Essex.
The anticyclone slipped southwards in the second week of the month, andmuch milder air spread from the northwest to all areas by the 13th. It became generallycloudier and windier with some rain, although it was the 18th before the southeast hadmuch rain. A deep area of low pressure crossed the country from the west between the20th and 22nd; heavy rain affected various areas, but there were also clearer zones withsome overnight frost and fog - and sunshine. A strong rise of pressure around the 23rd
(nearly 60 millibars in 48 hours in the south) led to the sunshine and overnight frostbecoming briefly, more widespread - then it became exceptionally mild on west tonorthwesterly winds. 18.3C was recorded at Aboyne (Aberdeenshire) on the 26th,equalling the British record for January, and 17C in parts of southeast England on the27th. Strong northwest to northerly winds then brought much colder, very wintry weather,with a notable blizzard from the Wash to northwest London on the 30th.
164 201JOURNAL OF METEOROLOGY Vol.28 No.279 May / June 2003 JOURNAL OF METEOROLOGY Vol.28 No.279 May / June 2003
STREAM FLOW AND ENSOThe influence of ENSO on Africa precipitation has been well documented in a
number of studies over the past two decades, see for example Nicholson and Entekhabi(1986), Ropelewski and Halpert (1987, 1989), Lamb and Peppler (1991), Mason andLindesay (1993) and Diaz et al. (2001). Both El Nino and La Nina events are a normalpart of the behaviour of SSTs in the tropical Pacific where the main variations occurthrough atmosphere-ocean interactions on inter-annual time-scales (Philander, 1990).However, the basin-scale phenomenon is linked to global atmospheric circulation andassociated weather anomalies.
The temporal and spatial structure of the ENSO teleconnections is nowillustrated using time series of three hydraulic stations over Nile River. Figure 1 highlightsthe seasonal changes for three stations that have strong but opposite correlation withENSO SSTs. In the top panel of Figure 1, 3-month running seasonal correlations withENSO index are shown for the Aswan station. The Figure shows maximum negativecorrelation, indicating greater stream flow than normal during El Nino (warm phase) inlate summer (July - October), but an opposite and weak effect during the late spring(March - June). The correlations are plotted together with the total seasonal streamflow to show the seasonal character of stream flow for each station. For the Khartoumstation, Figure 1b, ENSO has the same effect compared with Aswan station. Malakalstation, Figure 1c, is another area, where ENSO indicates positive correlation withstream flow during the spring and early summer (May - August), and negative correlationduring seasons from September to April.
It is noticed that the years when the southern oscillation (SO) is negative (ElNino phenomenon) there is rainfall shortage in the Sahel and vice-versa (Nicholsonand Kim, 1997). Changes in atmospheric circulation accompanying El Nino inducechanges in cloud cover and evaporation which, in turn, increase the net heat fluxentering remote Ocean (Klein et al. 1998). Also, in the tropical North Atlantic, a weakeningof the trade winds during El Nino reduces surface evaporation and increases sea surfacetemperatures (SSTs).
TROPICAL ATLANTIC SEA SURFACE TEMPERATURE AND STREAM FLOWA phenomenon similar to but weaker than the Pacific El Nino also occurs in
the Atlantic (Latif and Grotzner, 2000). During a warm phase, trade winds in the equatorialwestern Atlantic are weak and SST is high in the equatorial eastern Atlantic. Theconverse occurs during a cold phase. This phenomenon is called the Atlantic zonalequatorial mode (or the Atlantic El Nino). Although sea surface temperature anomaliesin the Tropical Atlantic are weaker than those associated with ENSO, they can lead toshifts in climatic patterns over Africa and Americas that can have major and sometimesdisastrous environmental and socio-economic impacts (WCRP, 1997 and Marshall etal. 2001).
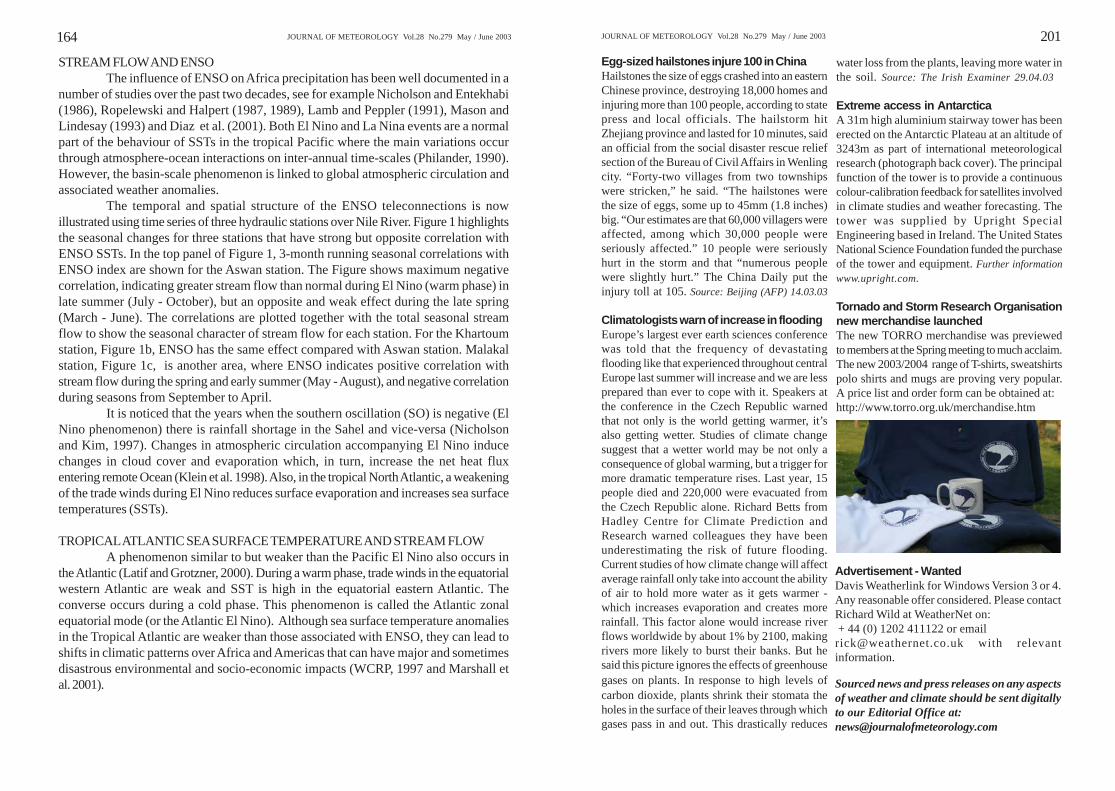
Egg-sized hailstones injure 100 in ChinaHailstones the size of eggs crashed into an easternChinese province, destroying 18,000 homes andinjuring more than 100 people, according to statepress and local officials. The hailstorm hitZhejiang province and lasted for 10 minutes, saidan official from the social disaster rescue reliefsection of the Bureau of Civil Affairs in Wenlingcity. “Forty-two villages from two townshipswere stricken,” he said. “The hailstones werethe size of eggs, some up to 45mm (1.8 inches)big. “Our estimates are that 60,000 villagers wereaffected, among which 30,000 people wereseriously affected.” 10 people were seriouslyhurt in the storm and that “numerous peoplewere slightly hurt.” The China Daily put theinjury toll at 105. Source: Beijing (AFP) 14.03.03
Climatologists warn of increase in floodingEurope’s largest ever earth sciences conferencewas told that the frequency of devastatingflooding like that experienced throughout centralEurope last summer will increase and we are lessprepared than ever to cope with it. Speakers atthe conference in the Czech Republic warnedthat not only is the world getting warmer, it’salso getting wetter. Studies of climate changesuggest that a wetter world may be not only aconsequence of global warming, but a trigger formore dramatic temperature rises. Last year, 15people died and 220,000 were evacuated fromthe Czech Republic alone. Richard Betts fromHadley Centre for Climate Prediction andResearch warned colleagues they have beenunderestimating the risk of future flooding.Current studies of how climate change will affectaverage rainfall only take into account the abilityof air to hold more water as it gets warmer -which increases evaporation and creates morerainfall. This factor alone would increase riverflows worldwide by about 1% by 2100, makingrivers more likely to burst their banks. But hesaid this picture ignores the effects of greenhousegases on plants. In response to high levels ofcarbon dioxide, plants shrink their stomata theholes in the surface of their leaves through whichgases pass in and out. This drastically reduces
water loss from the plants, leaving more water inthe soil. Source: The Irish Examiner 29.04.03
Extreme access in AntarcticaA 31m high aluminium stairway tower has beenerected on the Antarctic Plateau at an altitude of3243m as part of international meteorologicalresearch (photograph back cover). The principalfunction of the tower is to provide a continuouscolour-calibration feedback for satellites involvedin climate studies and weather forecasting. Thetower was supplied by Upright SpecialEngineering based in Ireland. The United StatesNational Science Foundation funded the purchaseof the tower and equipment. Further informationwww.upright.com.
Tornado and Storm Research Organisationnew merchandise launchedThe new TORRO merchandise was previewedto members at the Spring meeting to much acclaim.The new 2003/2004 range of T-shirts, sweatshirtspolo shirts and mugs are proving very popular.A price list and order form can be obtained at:http://www.torro.org.uk/merchandise.htm
Sourced news and press releases on any aspectsof weather and climate should be sent digitallyto our Editorial Office at:[email protected]
Advertisement - WantedDavis Weatherlink for Windows Version 3 or 4.Any reasonable offer considered. Please contactRichard Wild at WeatherNet on: + 44 (0) 1202 411122 or [email protected] with relevantinformation.

165200 JOURNAL OF METEOROLOGY Vol.28 No.279 May / June 2003 JOURNAL OF METEOROLOGY Vol.28 No.279 May / June 2003
Figure 1. Temporal evolution of correlation between the indicated seasonal stream flow with thecorresponding seasonal ENSO. Bars denote seasonal mean stream flow (left hand scale).
(a) Aswan Station
(b) Khartoum Station
(c) Malakal Station
The heavy snow caused hazardous conditions across many parts of Scotland with thecounty of Tayside being the worst affected.
Ball Lightning Summary 2002 published: VAN DOORN, P (2003) TORRO Ball Lightning Division
Report for 2002. J. Meteorology, UK vol.28 no.278 pp135-137
TORRO was formed in 1974 and undertakes research on tornadoes and other whirlwinds (such aswaterspouts and land devils), thunderstorms, hailstorms, lightning impacts, ball lighting, heavysnowfalls & blizzards, wind storms and coastal storm impacts as well as weather-health relationships.TORRO also issues severe thunderstorm and tornado advisories for the British Isles. Further detailsof TORRO's activities can be found on the Internet at: http://www.torro.org.uk. Additional copies ofthe TORRO Annual Review 2002 (and copies of previous years) are available at £2.00 includingpostage (cheque made payable to TORRO) from Professor Derek M Elsom, TORRO, GeographyDepartment, Oxford Brookes University, Headington, Oxford, OX3 0BP. Telephone 01865-483761.
Fax 01865-483937. E-mail: [email protected]
Fifty Arctic lakes show effects of climatewarmingDramatic clues to North American climate changehave been discovered by a team of Queen’sUniversity scientists in the bottom of 50 Arcticlakes. Using innovative techniques that enablethem to collect historic evidence from fossilisedalgae in lake bottom sediment, the researchershave found signs of marked environmentalchanges in a variety of lakes of different depthsand composition, within a 750-km regionbordering the northern tree line. The changes area signal of things to come in the rest of NorthAmerica, say the Queen’s paleolimnologists.“We’re seeing a significant, regional change inthe ecology of these lakes over the past twocenturies that is consistent with warmerconditions,” says Dr. John Smol, CanadaResearch Chair in Environmental Change and co-head of the university’s PaleoecologicalEnvironmental Assessment and ResearchLaboratory (PEARL). Dr. Smol conducted thestudy with Dr. Kathleen Rühland and studentAlisha Priesnitz of Queen’s Biology Department.The Queen’s study will be published in theinternational journal Arctic, Antarctic, and AlpineResearch. Source:Terradaily 14.04.03
NEWSGlobal Warming Could Trigger Cascade ofClimatic ChangesGlobal warming and the partial melting of polarice sheets can dramatically affect not only sealevels but also Earth’s climate, in ways that maybe complex, rapid and difficult to adjust to. Sealevel and climatic changes in Earth’s distant past,near the end of the last Ice Age about 14,600years ago, offer significant clues to somephenomena that Earth may experience in the nearfuture, possibly in coming decades or centuries.The research was done by scientists at theUniversity of Victoria, Oregon State University,and the University of Toronto. It revealed changesin global temperature, sea level and ocean currentsthat can occur with surprising rapidity. “Withthe advent of global warming, we’re trying toidentify the climatic surprises that may be instore for us, the events that we really aren’texpecting,” said Peter Clark, a professor ofgeosciences at OSU and a co-author of the study.“The more we look at this, the more it appearsthere have been large and abrupt changes inclimate and sea level that are interconnected. Ifthese changes were to happen in the future, theycould cause huge societal disruptions.”Source: Terrawire 17.03.03

166 199JOURNAL OF METEOROLOGY Vol.28 No.279 May / June 2003 JOURNAL OF METEOROLOGY Vol.28 No.279 May / June 2003
Figure 2 illustrates the temporal behaviour of the Tropical Atlantic SSTs-stream flow correlation in the three stations (Aswan, Khartoum and Malakal) over theRiver Nile. In the case of Aswan station, Figure 2a, negative correlations peak appearfrom July to February months, but an opposite and strong effect is evident during thespring months (April-May). The influence of Tropical Atlantic SSTs on Khartoumstation, Figure 2b, has the same effect on Aswan station. In the Malakal station, Figure2c, peak (negative) correlations occur in the winter months (from about November toFebruary) but an opposite correlation during summer season (from about May to August)is found.
Many researchers found strong relationship between Sahelian rainfall andAtlantic Ocean sea surface temperature such as Lough (1986), Ropelewski and Halpert(1987) and Hastenrath (1990). Tropical Atlantic SSTs are connected to out-of-phaserainfall anomalies in the Sahel region (Ward, 1998). Sahelian rainfall variability is closelylinked to the meridional sea surface temperature SST gradient in the tropical Atlantic,and the latitudinal position of the inter-tropical convergence zone (ITCZ) (Tourre andLamb, 1997). The Atlantic Ocean SST fluctuations correspond to those of the northernand southern hemisphere oceans as a whole. The northern Indian Ocean tends to warmup roughly in phase with the Southern Hemisphere. There is a general correspondencewith the rainfall fluctuations in the Sahel with wet (dry) periods in Sahel associated withnegative (positive) anomalies in differential (SH-NH) ocean SST.
NORTH ATLANTIC OSCILLATION (NAO) AND STREAM FLOWThe North Atlantic Oscillation (NAO) is the alternation of atmospheric mass
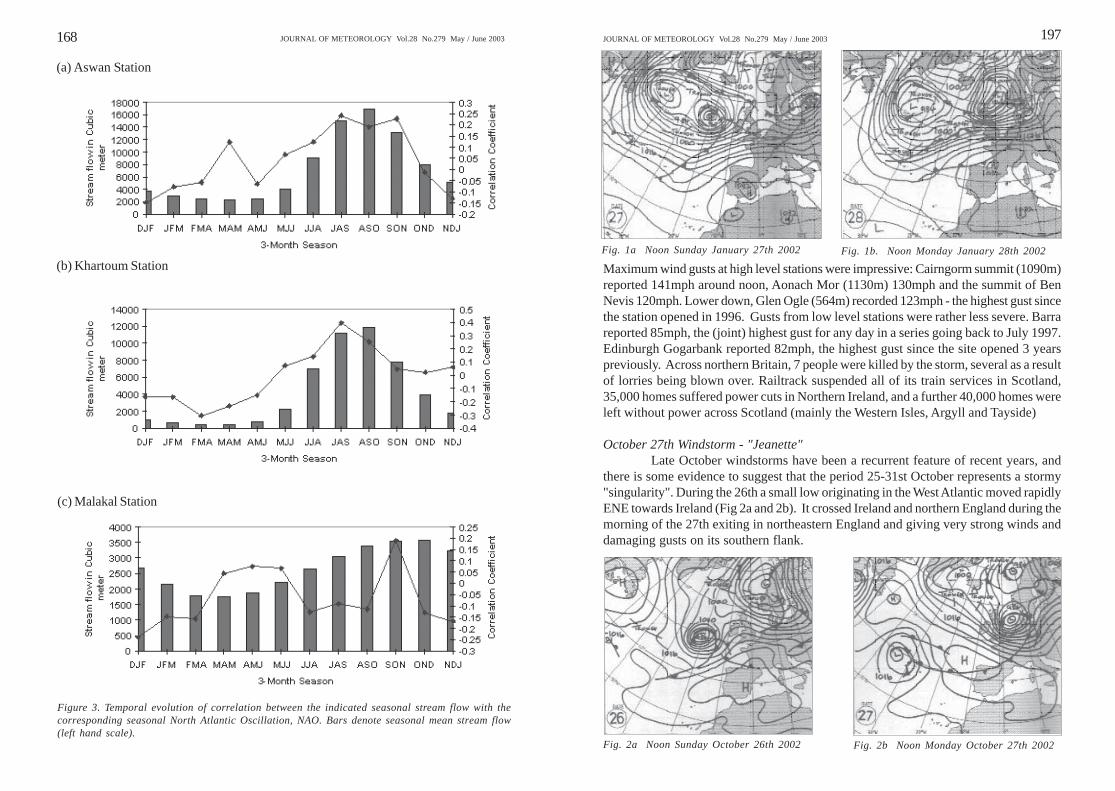
between the subtropical and sub-polar regions of North Atlantic Ocean. NAO ischaracterised by variations on monthly and seasonally time-scale in the regional sealevel pressure gradient, the mid-latitude westerlies, sea surface temperatures and theclimate of adjacent land area. Figure 3 presents the results of the correlation analysisbetween NAO and stream flow for Aswan, Khartoum and Malakal stations. The mainfeature of Figure 3 is that the effect of NAO on stream flow over the River Nile wasweak with an exception at two months in Khartoum station, March with negative signcorrelation and August with positive sign correlation. In general, during the floodseason (from about June to October) positive correlation was indicated at all stationsapproximately. Also, the NAO has different influence than the ENSO and TropicalAtlantic SSTs on stream flow over the Nile. The link between stream flow over NileRiver and North Atlantic Oscillation (NAO) is weak. These results are consistent withthat of the previous studies of Mark et al., (2001), WCRP, (1997), and Ward (1998). TheNAO is not an important modulator of global precipitation, but it does explain 8% ofannual (more in winter) variability not spatially averaged northern mid-latitudeprecipitation.
NAO also generates a component of climate variability over the northern rimof the continent. The known change in the north-south inter-hemispheric gradient ofsea surface temperature (SST) has accompanied climate fluctuation not just in theSahel, but also through much of the tropics (Ward, 1998).
HEAVY SNOWFALLS DIVISION SUMMARY FORTHE UNITED KINGDOM 2002
By RICHARD WILDTORRO (Director of Blizzards and Heavy Snowfalls Division)
The year 2002 had virtually no heavy snowfalls, in fact only a total of threeheavy snowfall days occurred during the entire year with no heavy snow occurringacross Wales and/or the southern parts of the United Kingdom.25th January
Rain across Ireland (due to a warm front) spread eastwards across the UnitedKingdom turning to snow in many parts of Scotland and Northern England by theafternoon. Some of the snow was heavy and continuous, with some places across Scotlandseeing falls between 10-15cm. This amount of snow caused severe disruption to severalmajor routes. The worst affected area was Inverness, where high winds compounded theproblem, with several drivers stuck in snowdrifts.23rd February
Troughs and an occluded front (associated with a polar low) caused the worstheavy snowfall of 2002 to many parts of Scotland, Northern Ireland and Northern England.There were widespread wintry showers across these areas, which at times merged to givea longer spell of snow in places, especially across Northern Scotland. During the day,these sleet and snow showers pushed southwards across other parts of the UnitedKingdom, but the snowfalls were not as significant as in Scotland and Northern England.The heavy snow was also associated with high winds. The snow and the wind broughtchaos across the roads across northern districts of the United Kingdom as blizzardscaused treacherous conditions with many accidents. Snow drifts up to 6m in height,blocked many routes, especially across the higher routes of Scotland. Hundreds ofhomes also lost power supplies, while emergency services advised people to stay athome. The heavy snow caused a driver to be killed and his passenger to be injured whentheir car slid off the A19 in Peterlee, County Durham and hit a lamppost. In Scotland,police rescued 16 people, including a child, when they were trapped in their cars aftersnowplough crews were unable to reach them on the A9 Wick-to-Inverness road. By0400 GMT, 12cm of snow lay at Eskdalemuir, Dumfries and Galloway, while at Wishaw,Strathclyde the snow depth at 0900 GMT was 7cm. Between 1000-1100 GMT, 5cm ofsnow fell at Aviemore, Inverness-shire with 19cm of snow lying there by the end of theevening. Other snow lying measurements that day included 17cm at Kyle, Sutherland,8cm at Stornoway, Western Isles and 10cm at Saughall, Ayrshire. Middleton, Derbyshirehad 14cm of snow lying by the end of the day (the largest snowfall there since February1994). Snowdrifts of 1m will still visible at Middleton, Derbyshire by the end of February.10th March
The final heavy snowfall day of 2002 saw heavy snow fall across the hills ofNorthern England and Scotland, due to a warm front which pushed in from Ireland duringthe early morning. An avalanche on Beinn Dearg, near Ullapool, Highland killed two men.11cm of snow fell at Ardtalnaig, Perthshire but soon melted, while Carnbo, Kinross-shirerecorded a snowfall of 13cm by the end of the morning.

167198 JOURNAL OF METEOROLOGY Vol.28 No.279 May / June 2003 JOURNAL OF METEOROLOGY Vol.28 No.279 May / June 2003
Figure 2. Temporal evolution of correlation between the indicated seasonal stream flow with thecorresponding seasonal Tropical Atlantic sea surface temperature. Bars denote seasonal mean streamflow, (left hand scale).
(a) Aswan Station
(b) Khartoum Station
(c) Malakal Station
Fig. 3 Timing of the path of the depression associated with the Jeanette windstorm.
By evening, the low was over southern Sweden, leaving the UK in moderatingWNW winds to the north of a high (1035) over Biscay (Fig. 3). At the very exposedNeedles lighthouse on the Isle of Wight, a gust of 102 mph was recorded around 0500GMT. 96 mph was recorded at the (also very exposed) station at Mumbles Head (south-west Wales). Many stations over England and Wales experienced their strongest gustspeeds since the 29th / 30th October 2000 windstorm and some stations in East Angliaexperienced their highest gusts since the Burns day storm of 25th January 1990. 7people were killed as a direct result of the storm in the UK and at least a further 23 acrossnorthern Europe. Most deaths were the result of falling trees. Property damage in theUK was worst in Wales, the Midlands and East Anglia. 300,000 homes were left withoutpower, and electricity companies were criticised, as many homes remained withoutpower even a week later! A replica inflatable army tank and a 25ft inflatable RonaldMcDonald both broke free from their moorings and were being eagerly sought by theirowners!
The storm also caused considerable disruption to transport. In Scotland, aferry carrying 80 passengers was stranded for 80 hours after it failed to land at Lerwickin the Shetland Isles and at Heathrow Airport, over 60 flights were cancelled. Insuredloses across northern Europe were estimated at £500M with the most severe losses inGermany and the Netherlands and further substantial losses in the UK (£50M), France,Austria, Poland Czechoslovakia. Economic losses were estimated at £1Billion.
168 197JOURNAL OF METEOROLOGY Vol.28 No.279 May / June 2003 JOURNAL OF METEOROLOGY Vol.28 No.279 May / June 2003
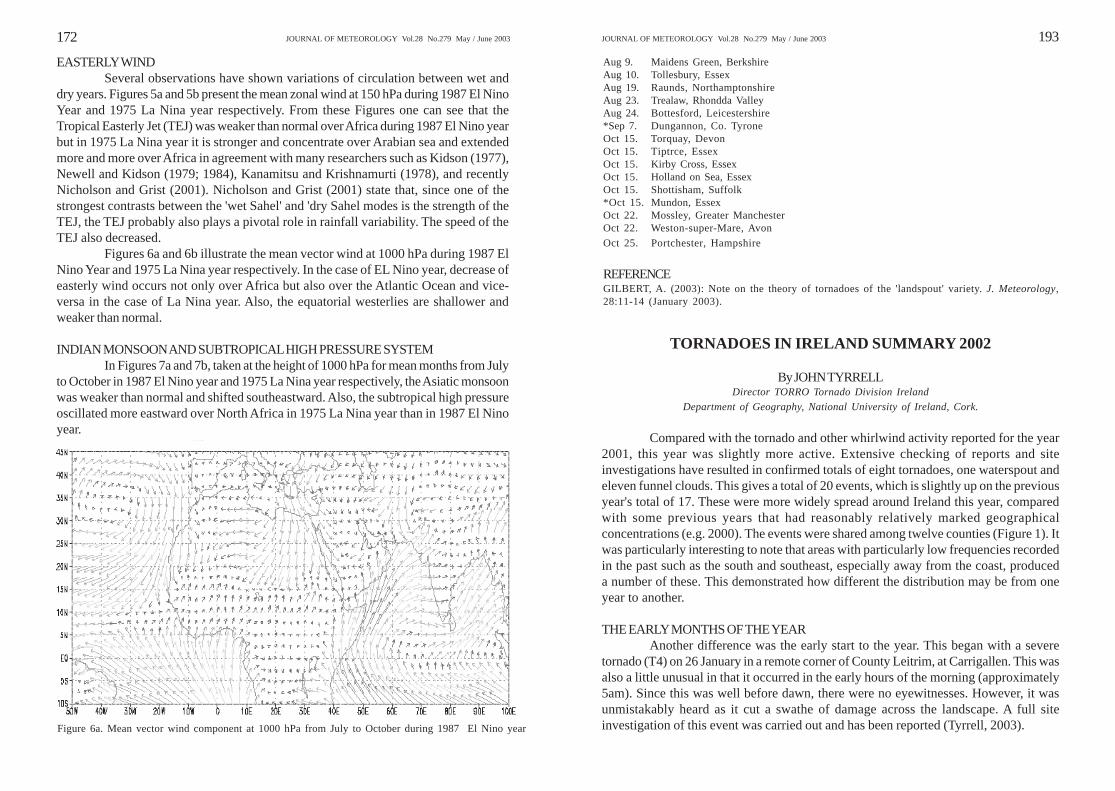
Figure 3. Temporal evolution of correlation between the indicated seasonal stream flow with thecorresponding seasonal North Atlantic Oscillation, NAO. Bars denote seasonal mean stream flow(left hand scale).
(a) Aswan Station
(b) Khartoum Station
(c) Malakal Station
Fig. 1a Noon Sunday January 27th 2002 Fig. 1b. Noon Monday January 28th 2002
Maximum wind gusts at high level stations were impressive: Cairngorm summit (1090m)reported 141mph around noon, Aonach Mor (1130m) 130mph and the summit of BenNevis 120mph. Lower down, Glen Ogle (564m) recorded 123mph - the highest gust sincethe station opened in 1996. Gusts from low level stations were rather less severe. Barrareported 85mph, the (joint) highest gust for any day in a series going back to July 1997.Edinburgh Gogarbank reported 82mph, the highest gust since the site opened 3 yearspreviously. Across northern Britain, 7 people were killed by the storm, several as a resultof lorries being blown over. Railtrack suspended all of its train services in Scotland,35,000 homes suffered power cuts in Northern Ireland, and a further 40,000 homes wereleft without power across Scotland (mainly the Western Isles, Argyll and Tayside)
October 27th Windstorm - "Jeanette"Late October windstorms have been a recurrent feature of recent years, and
there is some evidence to suggest that the period 25-31st October represents a stormy"singularity". During the 26th a small low originating in the West Atlantic moved rapidlyENE towards Ireland (Fig 2a and 2b). It crossed Ireland and northern England during themorning of the 27th exiting in northeastern England and giving very strong winds anddamaging gusts on its southern flank.
Fig. 2a Noon Sunday October 26th 2002 Fig. 2b Noon Monday October 27th 2002

169196 JOURNAL OF METEOROLOGY Vol.28 No.279 May / June 2003 JOURNAL OF METEOROLOGY Vol.28 No.279 May / June 2003
Nevertheless these observations do not explain the cause of the variations inthe global transfer of the planetary circulation system. But they prove that it is importantto search for climatic fluctuations as forming an integral part of the planetary scalesystems. NAO has more effect on Western African than Sahelian region (Tourre andLamb, 1997). A major transition of NAO between decadal periods of extreme states (lowto high) in the early 1970's coincided with shifts in rainfall patterns in Western Africa(WCRP, 1997).
ATMOSPHERIC CIRCULATION CHANGESChanges or fluctuations in atmospheric and oceanic circulation are important
elements of climate. Such circulation changes are the main cause of variations in climateelements on a regional scale, sometimes mediated by parallel changes in the land surface,(IPCC 1990, 1996). ENSO and NAO are such examples. Changes in atmospheric circulationpatterns are considered as an indicator of possible climate change. Obviously, a closerelationship exists between type of atmospheric circulation and the prevalence of rainfall.There is observational evidence that the frequency of certain European circulationpatterns has changed during the last 30 years (Zwart, 1992; 1993). General CirculationModels indicate changes in the Northern Hemisphere Storm tracks, Hall et al. (1994).Circulation change and its effect on variability of stream flow, especially during El Ninoand La Nina years are described. The year 1987 is well recognised as one of the peakperiods of the well known Sahelian drought as well as the remarkable low Nile Riverfloods. Also, the year 1975, La Nina year, which indicates wet in Sahel region and highNile River floods. It is suggested that the change in Hadley and Walker circulation typesplays an important role in Africa rainfall, but this requires further examination.
INTER-TROPICAL CONVERGENCE ZONE (ITCZ)Tropical African precipitation is largely controlled by the north-south oscillation
of the Inter-Tropical Convergence Zone (ITCZ). The ITCZ moves with the seasons,following the sun. The north-south movement of the ITCZ is the most important featureof the tropical climate system since it largely controls the spatial and seasonal distributionof the rainfall (Farmer and Wigley, 1985). When the ITCZ climbs up to 20oN, whether theexcess is global for the continent (if the progress is slow) or the situation is almostnormal (if the progress is moderate, i.e. five months on the way there, and three monthson return). It could happen that the ITCZ does not exceed the southern regions of thecontinent. In such condition there is excess in the south and deficit in the north. Theopposite occurs when the ITCZ advances rapidly northwards and stays for a long timein that position. The surface outgoing longwave radiation apart from being used as acomponent of the radiation balance, has proved to be useful for studies of the large-scale circulation over the tropics, e.g., Heddinghaus and Krueger (1981), Nitta and Yamada(1989), and Abdel Wahab and Hasanean (1999). This is because the tropics are largelymodulated by cloudiness.
On the following day a funnel cloud was observed during a storm chase acrossthe southern provinces of Ireland. A paper on this event has been submitted to theJournal for future publication. No other reports of this event were received. Thus itwould have been a 'lost' event had not the chase been carried out. Late in the morning ofthe following day, 25 October, in the east of Ireland, a small tornado (T0) did minordamage in Co. Wicklow. Again, a site investigation was carried out. But the major eventof the year occurred later that day when during the afternoon a tornado occurred in Co.Longford that did considerable structural and tree damage. This was a T4 event and wasthe most intense of the year. It was triggered in a surface trough behind a cold front withvery strong upper winds. Again, a full site investigation was carried out very soonafterwards. This survey identified and mapped a track of 2.4km. During these three daysa complex low crossed Ireland and brought stormy weather within 24 hours after thetornadoes had occurred. This meant that considerable care was necessary to distinguishbetween damage due to the storm event and the tornadoes.
For 25 October an experimental severe thunderstorm watch had been issued byTORRO that covered southern and central Eire. Both Co. Longford and Co. Wicklow arelocated within the region that was subject to the watch. Although the main threatidentified was severe thunderstorms, the tornado threat was identified as a possibility.The success of this experimental watch is a promising development that will, hopefully,be developed further in the year ahead.
REFERENCESTYRRELL, J.G. (2002). Tornadoes in Ireland during the year 2001. J.Meteorology, UK vol. 27 no.269TYRRELL, J.G. (2002). Site Investigation of a multiple tornado event in Co. Westmeath,Ireland.J.Meteorology, U.K. vol. 27, no.270, pp. 210-218.
WINDSTORM DIVISION SUMMARY FORTHE BRITISH ISLES 2002
By STEPHEN K ROBERTSDirector TORRO Windstorms Division
OVERVIEW2002 saw just 2 major wind storm events affect the UK. The first, occurred on
28th January, and swept across central and southern Scotland, Northern Ireland andnorth eastern England. The second event occurred on the 27th October when an intensedepression sped east northeastward across the British Isles.
January 28th WindstormJanuary is the windiest month of the year on average for the UK, and noted for
the severity of its windstorms. (44% of all major windstorms to occur in recent decadeshave occurred during January). On the 28th, a deep but filling low (964mb) movednortheast just to the north of Scotland before passing over the Northern Isles (Fig.1aand 1b). Westerly gales or severe gales blasted northern Britain during the morning, asthe low passed through. There followed a dramatic rise in pressure of 20mb in just a fewhours during the afternoon.
170 195JOURNAL OF METEOROLOGY Vol.28 No.279 May / June 2003 JOURNAL OF METEOROLOGY Vol.28 No.279 May / June 2003
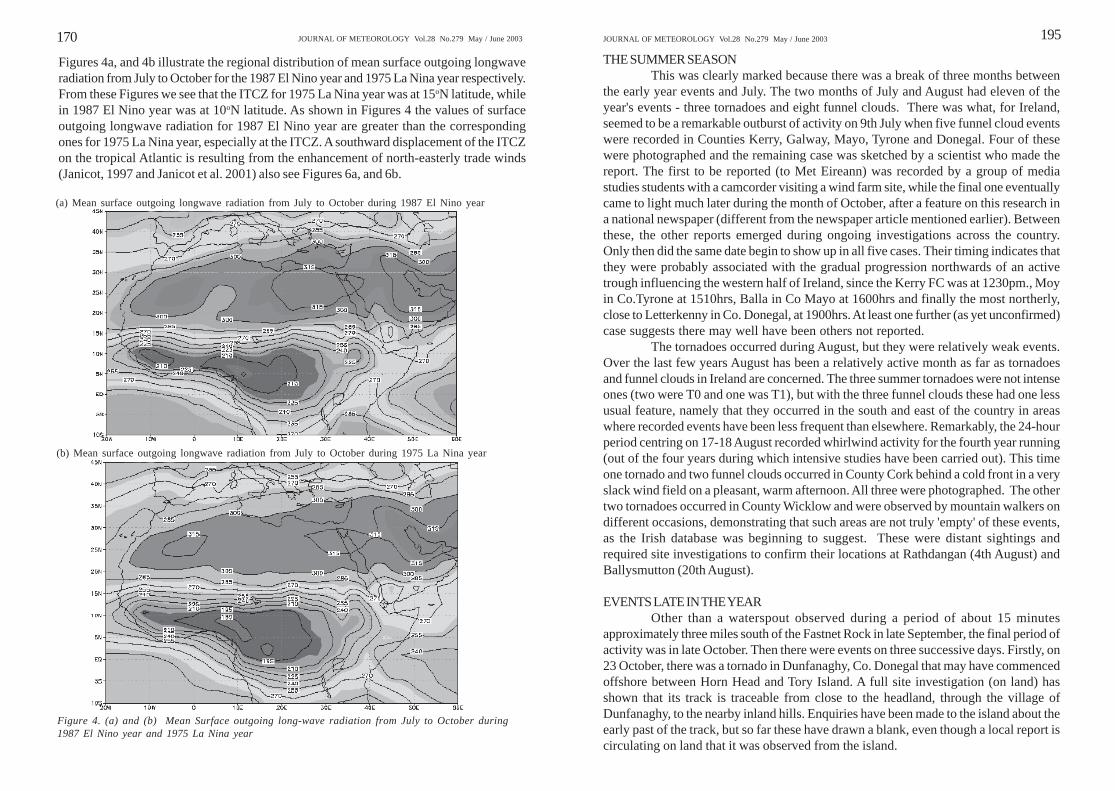
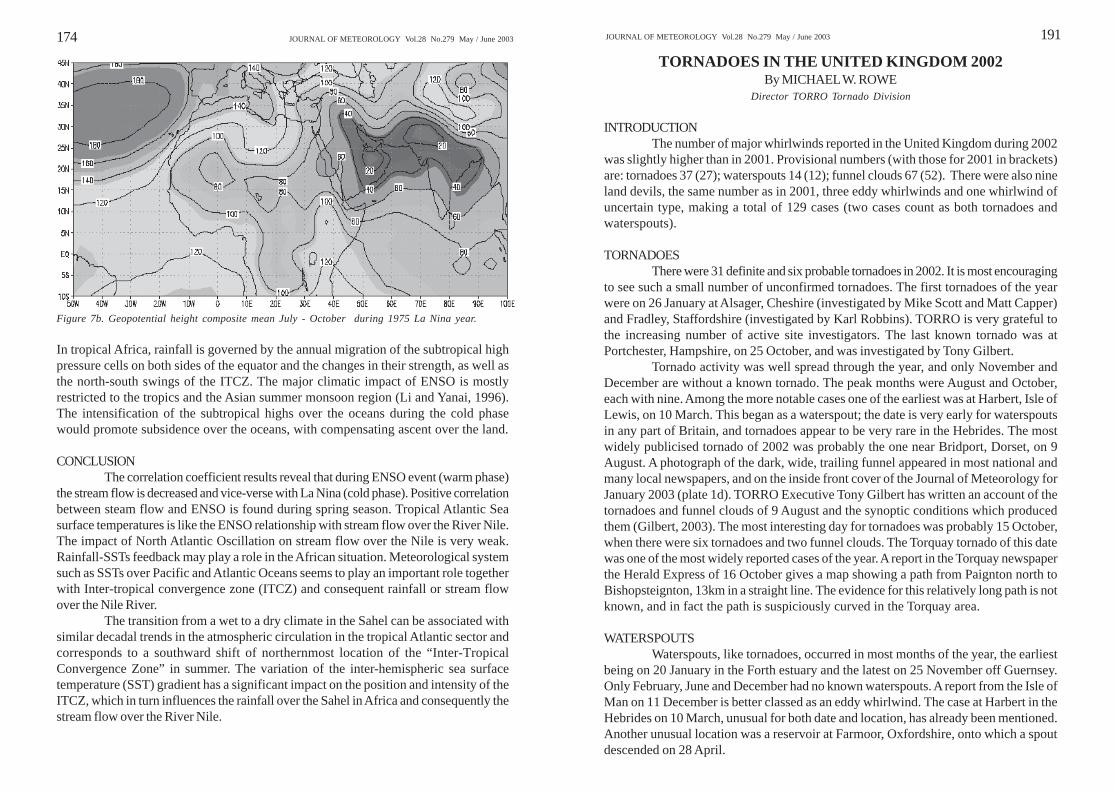
Figures 4a, and 4b illustrate the regional distribution of mean surface outgoing longwaveradiation from July to October for the 1987 El Nino year and 1975 La Nina year respectively.From these Figures we see that the ITCZ for 1975 La Nina year was at 15oN latitude, whilein 1987 El Nino year was at 10oN latitude. As shown in Figures 4 the values of surfaceoutgoing longwave radiation for 1987 El Nino year are greater than the correspondingones for 1975 La Nina year, especially at the ITCZ. A southward displacement of the ITCZon the tropical Atlantic is resulting from the enhancement of north-easterly trade winds(Janicot, 1997 and Janicot et al. 2001) also see Figures 6a, and 6b.
Figure 4. (a) and (b) Mean Surface outgoing long-wave radiation from July to October during1987 El Nino year and 1975 La Nina year
(a) Mean surface outgoing longwave radiation from July to October during 1987 El Nino year
(b) Mean surface outgoing longwave radiation from July to October during 1975 La Nina year
THE SUMMER SEASONThis was clearly marked because there was a break of three months between
the early year events and July. The two months of July and August had eleven of theyear's events - three tornadoes and eight funnel clouds. There was what, for Ireland,seemed to be a remarkable outburst of activity on 9th July when five funnel cloud eventswere recorded in Counties Kerry, Galway, Mayo, Tyrone and Donegal. Four of thesewere photographed and the remaining case was sketched by a scientist who made thereport. The first to be reported (to Met Eireann) was recorded by a group of mediastudies students with a camcorder visiting a wind farm site, while the final one eventuallycame to light much later during the month of October, after a feature on this research ina national newspaper (different from the newspaper article mentioned earlier). Betweenthese, the other reports emerged during ongoing investigations across the country.Only then did the same date begin to show up in all five cases. Their timing indicates thatthey were probably associated with the gradual progression northwards of an activetrough influencing the western half of Ireland, since the Kerry FC was at 1230pm., Moyin Co.Tyrone at 1510hrs, Balla in Co Mayo at 1600hrs and finally the most northerly,close to Letterkenny in Co. Donegal, at 1900hrs. At least one further (as yet unconfirmed)case suggests there may well have been others not reported.
The tornadoes occurred during August, but they were relatively weak events.Over the last few years August has been a relatively active month as far as tornadoesand funnel clouds in Ireland are concerned. The three summer tornadoes were not intenseones (two were T0 and one was T1), but with the three funnel clouds these had one lessusual feature, namely that they occurred in the south and east of the country in areaswhere recorded events have been less frequent than elsewhere. Remarkably, the 24-hourperiod centring on 17-18 August recorded whirlwind activity for the fourth year running(out of the four years during which intensive studies have been carried out). This timeone tornado and two funnel clouds occurred in County Cork behind a cold front in a veryslack wind field on a pleasant, warm afternoon. All three were photographed. The othertwo tornadoes occurred in County Wicklow and were observed by mountain walkers ondifferent occasions, demonstrating that such areas are not truly 'empty' of these events,as the Irish database was beginning to suggest. These were distant sightings andrequired site investigations to confirm their locations at Rathdangan (4th August) andBallysmutton (20th August).
EVENTS LATE IN THE YEAROther than a waterspout observed during a period of about 15 minutes
approximately three miles south of the Fastnet Rock in late September, the final period ofactivity was in late October. Then there were events on three successive days. Firstly, on23 October, there was a tornado in Dunfanaghy, Co. Donegal that may have commencedoffshore between Horn Head and Tory Island. A full site investigation (on land) hasshown that its track is traceable from close to the headland, through the village ofDunfanaghy, to the nearby inland hills. Enquiries have been made to the island about theearly past of the track, but so far these have drawn a blank, even though a local report iscirculating on land that it was observed from the island.

171194 JOURNAL OF METEOROLOGY Vol.28 No.279 May / June 2003JOURNAL OF METEOROLOGY Vol.28 No.279 May / June 2003
According to Hastenrath (1990), displacement of the ITCZ is a dominant factor for Saheldrought, on both the inter-annual and decadal time scales. Tourre and Lamb (1997) havefound Sahelian rainfall variability is closely linked to the latitudinal position of the ITCZ.Also, they found that the latitude of the ITCZ depends upon both local condition andremote forcing.
Figure 5(a) and (b) Mean zonal wind component at 150 hPa from July to October during 1987 ElNino year and 1975 La Nina year
.
(a) Mean zonal wind component at 150 hPa from July to October during 1987 El Nino year
(b) Mean zonal wind component at 150 hPa from July to October during 1975 La Nina year
Interestingly, this occurred some considerable distance away from main belt ofthunderstorms that were crossing the southern counties of Ireland. These producedlightning damage, but no whirlwind phenomena were reported. An active portion of acold front produced the thunderstorms, but the tornado was close to a triple point muchfurther to the north.
The second tornado did not occur until March. A classic col structure betweentwo anticyclones, one to the north and the other to the south of Ireland, contained atrough which produced the tornado. There was also a particularly strong upper level jetat the time, evident in the Hillsborough upper air sounding. The tornado occurred nearGarvahy in County Tyrone. This was a smaller event in terms of its intensity (T1). Sinceit occurred in the mid-afternoon and included a hotel, shop, parked cars and a number ofhomes in its damage path, it was well witnessed. Had it been of similar intensity to theCarrigallen tornado, the consequences could have been very serious. A thorough siteinvestigation was completed and showed that the damage path was considerably longer(7km) than what was extensively reported in the regional media.
Another early year event was a waterspout off the County Cork coast. Thiswas traced several months afterwards as a result of a feature on this research and anappeal for information in a local newspaper. However, a number of months had passedbetween the time when the event occurred and the subsequent report. As a result, nospecific date could be identified, only the time of year.
Fig 1. The distribution of tornadoes, waterspouts and funnel clouds across Ireland for 2002
172 193JOURNAL OF METEOROLOGY Vol.28 No.279 May / June 2003 JOURNAL OF METEOROLOGY Vol.28 No.279 May / June 2003
EASTERLY WINDSeveral observations have shown variations of circulation between wet and
dry years. Figures 5a and 5b present the mean zonal wind at 150 hPa during 1987 El NinoYear and 1975 La Nina year respectively. From these Figures one can see that theTropical Easterly Jet (TEJ) was weaker than normal over Africa during 1987 El Nino yearbut in 1975 La Nina year it is stronger and concentrate over Arabian sea and extendedmore and more over Africa in agreement with many researchers such as Kidson (1977),Newell and Kidson (1979; 1984), Kanamitsu and Krishnamurti (1978), and recentlyNicholson and Grist (2001). Nicholson and Grist (2001) state that, since one of thestrongest contrasts between the 'wet Sahel' and 'dry Sahel modes is the strength of theTEJ, the TEJ probably also plays a pivotal role in rainfall variability. The speed of theTEJ also decreased.
Figures 6a and 6b illustrate the mean vector wind at 1000 hPa during 1987 ElNino Year and 1975 La Nina year respectively. In the case of EL Nino year, decrease ofeasterly wind occurs not only over Africa but also over the Atlantic Ocean and vice-versa in the case of La Nina year. Also, the equatorial westerlies are shallower andweaker than normal.
INDIAN MONSOON AND SUBTROPICAL HIGH PRESSURE SYSTEMIn Figures 7a and 7b, taken at the height of 1000 hPa for mean months from July
to October in 1987 El Nino year and 1975 La Nina year respectively, the Asiatic monsoonwas weaker than normal and shifted southeastward. Also, the subtropical high pressureoscillated more eastward over North Africa in 1975 La Nina year than in 1987 El Ninoyear.
Figure 6a. Mean vector wind component at 1000 hPa from July to October during 1987 El Nino year
Aug 9. Maidens Green, BerkshireAug 10. Tollesbury, EssexAug 19. Raunds, NorthamptonshireAug 23. Trealaw, Rhondda ValleyAug 24. Bottesford, Leicestershire*Sep 7. Dungannon, Co. TyroneOct 15. Torquay, DevonOct 15. Tiptrce, EssexOct 15. Kirby Cross, EssexOct 15. Holland on Sea, EssexOct 15. Shottisham, Suffolk*Oct 15. Mundon, EssexOct 22. Mossley, Greater ManchesterOct 22. Weston-super-Mare, Avon
Oct 25. Portchester, Hampshire
REFERENCEGILBERT, A. (2003): Note on the theory of tornadoes of the 'landspout' variety. J. Meteorology,28:11-14 (January 2003).
TORNADOES IN IRELAND SUMMARY 2002
By JOHN TYRRELLDirector TORRO Tornado Division Ireland
Department of Geography, National University of Ireland, Cork.
Compared with the tornado and other whirlwind activity reported for the year2001, this year was slightly more active. Extensive checking of reports and siteinvestigations have resulted in confirmed totals of eight tornadoes, one waterspout andeleven funnel clouds. This gives a total of 20 events, which is slightly up on the previousyear's total of 17. These were more widely spread around Ireland this year, comparedwith some previous years that had reasonably relatively marked geographicalconcentrations (e.g. 2000). The events were shared among twelve counties (Figure 1). Itwas particularly interesting to note that areas with particularly low frequencies recordedin the past such as the south and southeast, especially away from the coast, produceda number of these. This demonstrated how different the distribution may be from oneyear to another.
THE EARLY MONTHS OF THE YEARAnother difference was the early start to the year. This began with a severe
tornado (T4) on 26 January in a remote corner of County Leitrim, at Carrigallen. This wasalso a little unusual in that it occurred in the early hours of the morning (approximately5am). Since this was well before dawn, there were no eyewitnesses. However, it wasunmistakably heard as it cut a swathe of damage across the landscape. A full siteinvestigation of this event was carried out and has been reported (Tyrrell, 2003).

173192 JOURNAL OF METEOROLOGY Vol.28 No.279 May / June 2003 JOURNAL OF METEOROLOGY Vol.28 No.279 May / June 2003
Figure 6b. Mean vector wind component at 1000 hPa from July to October during 1975 La Nina year
Figure 7a. Geopotential height composite mean July - October during 1987 El Nino year.
There were several multiple waterspout sightings, the most spectacular being of six insuccession near Tenby in south-west Wales on 9 September. Witness Dave Robertswas only 400 yards from the first of the "very spectacular pure white columns" when itformed.
FUNNEL CLOUDSThere were 50 definite funnels and 17 probables, ranging in date from 17 April
(Reading University) to 14 November (Portsmouth). May, as usual, was a fairly activemonth, with eight reports, but unusually there was only one in June. The peak monthswere July (15) and August (28). The total of eight in October was high for that month.Spectacular photographs of a funnel near Shepton Mallet, Somerset, on 2 August,appeared in many newspapers.
LAND DEVILSThe land devil season is always relatively restricted and this year was no
exception. The earliest and latest dates were 19 June (Havenstreet, Isle of Wight) and 24August (Odiham, Hampshire and Calthorpe, Norfolk) On 20 June a land devil liftedchairs, ladies' hats and a yellow gazebo at Royal Ascot, watched by the Queen!
REMARKABLE SHOWERSMaggots were reported to have fallen with rain at Porthtowan, Cornwall, on 27
January (COL, January 2002, page 5), but no evidence is given that they did not arriveby more normal means.
UK TORNADOES OF 2002 (*indicates probable tornadoes)
Jan 26. Alsager, CheshireJan 26. Fradley, Staffordshire*Feb 26. Church Enstone, OxfordshireMar 10. Harbert, Western IslesMar 21. Galvaghay, Co. Tyrone.*Apr 26. Hazlemere, BuckinghamshireApr 28. Ryhall/Stamford, LincolnshireMay 2. Thurrock, EssexMay 2. Caldicott, GwentMay 26. Haywards Heath, West SussexMay 26. South LincolnshireJun 14. Horsforth, Leeds, West YorkshireJun 14. Middlesbrough, ClevelandJul 2. Pickering, North Yorkshire*Jul 20. Brightlingsea, EssexJul 28. Ixworth, SuffolkJul 30. Northallerton, North Yorkshire*Jul 30 Leatherhead, SurreyAug 3. Warndon, Hereford and WorcesterAug 4. near Worcester, Hereford and WorcesterAug 5. Orsett, EssexAug 9. West Bexington, Dorset
174 191JOURNAL OF METEOROLOGY Vol.28 No.279 May / June 2003 JOURNAL OF METEOROLOGY Vol.28 No.279 May / June 2003
In tropical Africa, rainfall is governed by the annual migration of the subtropical highpressure cells on both sides of the equator and the changes in their strength, as well asthe north-south swings of the ITCZ. The major climatic impact of ENSO is mostlyrestricted to the tropics and the Asian summer monsoon region (Li and Yanai, 1996).The intensification of the subtropical highs over the oceans during the cold phasewould promote subsidence over the oceans, with compensating ascent over the land.
CONCLUSIONThe correlation coefficient results reveal that during ENSO event (warm phase)
the stream flow is decreased and vice-verse with La Nina (cold phase). Positive correlationbetween steam flow and ENSO is found during spring season. Tropical Atlantic Seasurface temperatures is like the ENSO relationship with stream flow over the River Nile.The impact of North Atlantic Oscillation on stream flow over the Nile is very weak.Rainfall-SSTs feedback may play a role in the African situation. Meteorological systemsuch as SSTs over Pacific and Atlantic Oceans seems to play an important role togetherwith Inter-tropical convergence zone (ITCZ) and consequent rainfall or stream flowover the Nile River.
The transition from a wet to a dry climate in the Sahel can be associated withsimilar decadal trends in the atmospheric circulation in the tropical Atlantic sector andcorresponds to a southward shift of northernmost location of the “Inter-TropicalConvergence Zone” in summer. The variation of the inter-hemispheric sea surfacetemperature (SST) gradient has a significant impact on the position and intensity of theITCZ, which in turn influences the rainfall over the Sahel in Africa and consequently thestream flow over the River Nile.
Figure 7b. Geopotential height composite mean July - October during 1975 La Nina year.
TORNADOES IN THE UNITED KINGDOM 2002By MICHAEL W. ROWE
Director TORRO Tornado Division
INTRODUCTIONThe number of major whirlwinds reported in the United Kingdom during 2002
was slightly higher than in 2001. Provisional numbers (with those for 2001 in brackets)are: tornadoes 37 (27); waterspouts 14 (12); funnel clouds 67 (52). There were also nineland devils, the same number as in 2001, three eddy whirlwinds and one whirlwind ofuncertain type, making a total of 129 cases (two cases count as both tornadoes andwaterspouts).
TORNADOESThere were 31 definite and six probable tornadoes in 2002. It is most encouraging
to see such a small number of unconfirmed tornadoes. The first tornadoes of the yearwere on 26 January at Alsager, Cheshire (investigated by Mike Scott and Matt Capper)and Fradley, Staffordshire (investigated by Karl Robbins). TORRO is very grateful tothe increasing number of active site investigators. The last known tornado was atPortchester, Hampshire, on 25 October, and was investigated by Tony Gilbert.
Tornado activity was well spread through the year, and only November andDecember are without a known tornado. The peak months were August and October,each with nine. Among the more notable cases one of the earliest was at Harbert, Isle ofLewis, on 10 March. This began as a waterspout; the date is very early for waterspoutsin any part of Britain, and tornadoes appear to be very rare in the Hebrides. The mostwidely publicised tornado of 2002 was probably the one near Bridport, Dorset, on 9August. A photograph of the dark, wide, trailing funnel appeared in most national andmany local newspapers, and on the inside front cover of the Journal of Meteorology forJanuary 2003 (plate 1d). TORRO Executive Tony Gilbert has written an account of thetornadoes and funnel clouds of 9 August and the synoptic conditions which producedthem (Gilbert, 2003). The most interesting day for tornadoes was probably 15 October,when there were six tornadoes and two funnel clouds. The Torquay tornado of this datewas one of the most widely reported cases of the year. A report in the Torquay newspaperthe Herald Express of 16 October gives a map showing a path from Paignton north toBishopsteignton, 13km in a straight line. The evidence for this relatively long path is notknown, and in fact the path is suspiciously curved in the Torquay area.
WATERSPOUTSWaterspouts, like tornadoes, occurred in most months of the year, the earliest
being on 20 January in the Forth estuary and the latest on 25 November off Guernsey.Only February, June and December had no known waterspouts. A report from the Isle ofMan on 11 December is better classed as an eddy whirlwind. The case at Harbert in theHebrides on 10 March, unusual for both date and location, has already been mentioned.Another unusual location was a reservoir at Farmoor, Oxfordshire, onto which a spoutdescended on 28 April.

175190 JOURNAL OF METEOROLOGY Vol.28 No.279 May / June 2003JOURNAL OF METEOROLOGY Vol.28 No.279 May / June 2003
When a warm surface temperature anomaly occurs to the north of the equator, the ITCZis shifted north of its normal position and atmospheric convection activity accordinglyfollows the ITCZ northward, causing unusually high rainfall in Sahel region. The oppositehappens when the SST condition is reversed.
Weakened trade winds, the southward displacement of the ITCZ and enhancedequatorial convection are features common to both the Atlantic and the Pacific regionsduring an El Nino (warm SST anomaly). The strength and oscillation of the Asia monsoonand sub-tropical high pressure affect rainfall over the River Nile during El Nino and LaNina years.
ACKNOWLEDGEMENTThe author is very grateful to the Ministry of Water Resources of Egypt, for providing the data ofstream flow over Nile River, to National Center for Atmospheric Research (NCAR) for providingSSTs data, to Climate Diagnostics Center (NOAA, Boulder, CO) for providing the NCEP/NCARReanalysis data. The author would like to express his gratitude to the referees for their constructivecomments and suggestions. At last but not least, very grateful to my colleagues in the Astronomy and
Meteorology Department, Cairo University for helpful advice.
REFERENCES:ABDEL WAHA, M, H.M. HASANEAN, 1999: Contrasting features of two tropical summers fromsatellite observations. Atmospheric Research, 50, 105-117.CARROL, E.B., 1995: Practical subjective application of the omega equation and Sutcliffe developmenttheory. Meteorol. Appl., 2, 71-81.DALEY, R., 1991: Atmospheric data analysis. Cambridge: Cambridge University Press, 457pp.DIAZ, H.F., M.P. HOERLING AND EISCHELD, J.K., 2001: ENSO variability, teleconnections andclimate change. Int. J. Climatol., 21, 1845-1862.EHRENDORFER, M., 1987: A regionalisation of Austria's precipitation climate using principalcomponent analysis. J. of Climate, 7, 71-81.ELTAHIR, A.B.E., 1996: El Nino and natural variability in the flow of the Nile River. Water ResourcesResearch. Vol. 32, No.1, 131-137.FARMER, G., WIGLEY, T.M.L., 1985: Climatic trends for tropical Africa. A research Unit, School ofEnvironmental sciences, University of East Anglia, Norwich. NR4 7TJ, UK.FOLLAND, C., OWEN, J., WARD, N. M., AND COLMAN, A., 1991: Prediction of seasonal rainfallin the sahel region using empirical and dynamical methods. J. of Forecasting, Vol. 10, 21-56.HALL, N.M.J. HOSKINS, B.J., VALDES, P.J., AND SENIOR, C.A., 1994: Storm tracks in highresolution GCM with doubled carbon dioxide. Q.J.R. Meteorol. Soc. 120, 1209-1230.HASTENRATH, S., 1990: Diagnosis of African drought. WMO/TD No. 363.HEDDINGHAUS, T.R., KRUEGER, A.F., 1981: Annual and inter-annual variations in outgoing longwaveradiation over tropics. Mon. Wea. Rev., 109, 1208-1218.
IPCC, 1990: Climate Change. The IPCC Scientific Assessment. J.T. Houghton, G.J. Jenkins and J.J.Ephraums (eds), Cambridge University Press, Cambridge, UK, 365pp.IPCC, 1996: CLIMATE CHANGE 1995. THE SCIENCE OF CLIMATE CHANGE. Contribution ofWorking Group I to the Second IPCC Assessment Report of the IPCC [Houghton, J.T, L.G MeriaFilho, B.A. Callander , N. Harris, A. Kattenberg, and K. Maskell (eds)]. Cambridge University Press,Cambridge, UK and New York, NY, USA, 572pp.JANICOT, S., 1997: Impact of warm ENSO events on atmospheric circulation and convection overthe tropical Atlantic and West Africa. Ann. Geophysicae 15, 471-475JANICOT, S.S. TRZASKA, I. POCCARD, 2001: Summer Sahel-ENSO teleconnection and decadaltime scale SST variations. Climate Dyn., 18, 303-320.
November 16thThis was the first of consecutive thundery weekends along the coast of Dorset
and Hampshire as onshore winds carried vigorous convective activity off the EnglishChannel, around low pressure just to the south-west and west respectively. In Swanage(Dorset) it was reported that a snowplough had to clear hailstones from the StudlandRoad.November 23rd
In the morning there were reports of large hail, about small marble size, inSouthampton, and at Thornford (Dorset).November 24th
The New Forest area was hit by a lively thunderstorm around daybreak (Fig 1),the culmination of a particularly thundery November in the area (six thunder days wereobserved by TORRO's Mike Rowe at Lymington). The hailfall affected Christchurch,Hinton Admiral and Brockenhurst, covering roads in up to 13cm of ice. The hailstonesranged from pea to marble size.
Fig 1. Infrared satellite image, 24th November 2002, large thunderstorm anvils spreading off thewarm English Channel into Central Southern England, where an intense hailstorm affected the NewForest area. (Courtesy of University of Strasbourg).
REFERENCESELSOM, D.M. and WEBB, J.D.C (1993) Destructive hailstorms in Essex on 26 May 1985. Weather48, pp 166-173

176 189JOURNAL OF METEOROLOGY Vol.28 No.279 May / June 2003 JOURNAL OF METEOROLOGY Vol.28 No.279 May / June 2003
KANAMITSU, M., AND KRISNAMURTI, T. N., 1978: Northern summer tropical circulationsduring drought and normal rainfall months. Mon. Wea. Rev., 106, 331-347.KLEIN S. A., SODEN, B.J., AND LAU, N.C., 1998: Remote sea surface temperature variation duringENSO evidence for tropical atmospheric bridge. J. of Climate, Vol. 12, No. 4, 917-932.KIDSON, J.W., 1977: African rainfall and its relation to the upper air circulation. Quart. J. Roy.Meteor. Soc., 103, 441-456.LATIF M., AND A. GROTZNER, 2000: The equatorial Atlantic Oscillation and its response toENSO. Clim. Dyn., 16,213-218.LAVAL, K., PICON, L., 1986: Effect of a change of the surface albedo of the Sahel on climate. J.Atmos. Sci., 43, 2418-2429.LI, C., AND M., YANAI, (1996): The onset and interannual variability of the Asian summermonsoon in relation to land-sea thermal contrast. J. Climate, 9, 358-375.LOUGH, J. M., 1986: Tropical Atlantic sea surface temperature and rainfall variations inSubsaharan Africa. Mon. Wea. Rev., 114, 561-570.MAHERAS, P. 1985: A factorial analysis of Mediterranean precipitation. Arch. Met. Geoph. Biocl.Ser, B36, 1-14.MARK, . M., TODD, M. HULME AND P. JONES, 2001: Precipitation measurements and trends inthe twentieth century. Int. J. Climatol., 21, 1899-1922.MARSHALL, J, Y. KUSHNIR, D. BATTISTI, P. CHANG, A. CZAJA, R. DICKSON, J. HURREL, M.MCCARTNEY, R. SARAVANAN, AND M. VISBECK, 2001: North Atlantic climate variability:Phenomena, Impacts and Mechanisms. Int. J. Climatol. 21, 1863-1898.MASON, SJ, JA, LINDESAY, 1993: A note on the modulation of Southern Oscillation -southernAfrica rainfall associations with the Quasi-Biennial Oscillation. J. of Geophysics Research 98, 8847-8850.MOOD, A. M., GRAYBILL, F. A., BOES, D. C., 1974: Introduction to the theory of statistics. London:McGraw-Hill, 564pp.NEWELL, R.E., KIDSON, J.W., 1979: The tropospheric circulation over Africa. Sahara Dust, ScopeRep. 14, C. Morales, Ed., Wiley and Sons, 133-170.NEWELL, R.E., KIDSON, J.W., 1984: African mean wind changes in Sahelian wet and dry periods.J. Clim. 4, 1-7.NICHOLSON, S.E.,1988: Land surface-atmosphere interaction: Physical processes and surfacechanges And their impact. Progress in physical Geography, 12, 36-65.NICHOLSON, S.E., D., ENTEKHABI, 1986: The quasi-periodic behavior of rainfall variability inAfrica and its relationship to the Southern Oscillation. Archiv für Meteorologie, Geophysik undBioclimaologie, A34, 311-348.NICHOLSON, S.E., AND J. KIM, 1997: The relationship of the El Nino-Southern Oscillation toAfrican rainfall. Int. J. Climatol., 17, 117-135.NICHOLSON, S.E., AND GRIST, J. P., 2001: A conceptual model for understanding rainfall variabilityin the West African Sahel on interannual and interdecadal timescales. Int. J. Climatol. 21, 1733-1757.NITTA, T., AND S. YAMADA, 1989: Recent warming of tropical SST and its relationship to the
Northern Hemisphere circulation. J. Meteo. Soc. Japan, 67, 375-382.OGALLO, L., 1985: Impacts of the 1982-1983 ENSO Event on Eastern and Southern Africa.Workshop on the societal impacts associated with the 1982-1983 Worldwide Climate Anomalies,
Lugano, Switzerland.PANDZIC, K., 1988: Principal component analysis of precipitation in the Adriatic-Pannonianarea of Yugoslavia. J. of Climate, 8, 357-370.PANDZIC, K., AND TRNINIC, D., 1998: The relationship between the Sava River Basin Annualprecipitation, its discharge and the large-scale atmospheric circulation., Theo. and Appl. Climatology,61, 69-76.PHILANDER, S.G.H., 1990: El Nino, La Nina, and the Southern Oscillation. Academic Press,293pp.Ropelewski CF, Halpert MS, 1987: Global and regional scale precipitations associated with El NinoSouthern Oscillation. Mon. Wea. Rev., 115, 985-996.
At Stony Stratford the hail was small marble size (13 to 18mm across), large enough tohurt on impact. At Two Mile Ash the hail, up to 14mm across, partly covered the ground,knocking petals off garden rose bushes. Meanwhile, the second severe hailstorm within10 days struck the small county of Rutland. At the village of Wymondham hail, describedas golf ball size, broke windows. Western parts of the Nottingham area were also affectedby severe hail in the evening storms. In Cinderhill, Bullwell and Hucknall, hailstones atleast 20mm across (described as "golf balls" in Bulwell) holed conservatory and carportroofs.July 30th
A violent wind-driven hailstorm affected a swath of North Yorkshire between1500 and 1530 GMT. A few miles south of Northallerton hailstones were described asgolf ball size and stripped much greenery off trees and dented caravan roofing. Atnearby Carlton Miniot the severe hail squall flattened many field crops. At the village ofSkipton-on-Swale the hail was piled up to 20cm deep. All fruit on apple and pear treeswas covered in brown bruise marks. Large tree branches were also broken off.August 3rd - 4th
A slack area of low pressure covered southern England. Thundery showersbecame increasingly widespread across central and southern England on 3rd with hail inparts of the West Midlands. "Extremely large" hail accompanied a squally thunderyshower in the Stoke-on-Trent area in the late afternoon. At Halesowen there was a briefburst of near golf ball sized hail in the early evening. At Market Overton (Rutland) abowls match was abandoned after a thunderstorm on 4th, during which hail completelycovered the green!August 15th
A cold front pushed slowly and erratically into hot air across eastern England.An area of severe thunderstorms affected East Anglia (where several places had reached29C) for several hours in the evening with reports of marble sized hail at Felthorpe, andhail pea sized or larger at Dereham and Melton Constable (Norfolk).September 8th
A filling depression was drifting very slowly southwards from Scotland intoEngland while an associated 500mb trough covered the British Isles. During athunderstorm at St Andrews, Fife, hailstones up to 10mm across were observed byTORRO's Richard Wylde.October 25th
A strong west-south-westerly "returning polar maritime" airstream broughtquite widespread squally, thundery showers and hail. At St Cleer and Redgate, nearLiskeard (Cornwall), schoolchildren at a school function had to run for cover just afterlunch when hailstones of 50 pence piece size (30mm x 10mm) fell. The hailstones wereclear, but shaped like broken glass with sharp, jagged edges. Thumbnail size waswitnessed by TORRO's Tony Gilbert at Portchester (Hants) in mid afternoon, and, abouttwo hours later large hail fell in parts of London. TORRO observer Penny Coleman noted10mm diameter hail at Manor Park, East London, while there were reports of hail about30mm across ("the size of tomatoes") at nearby East Ham and in Camden (North London).Further north, heavy hailstorms covered the ground in parts of Nottingham and Carlisle.

177188 JOURNAL OF METEOROLOGY Vol.28 No.279 May / June 2003 JOURNAL OF METEOROLOGY Vol.28 No.279 May / June 2003
ROPELEWSKI CF, HALPERT MS, 1989: Precipitations pattern associated with the high index phaseof the Southern Oscillation. J. Clim., 2, 268-284.TOURRE, I, AND LAMB, P. J., 1997: A research programme on climate variability and predictabilityfor the 21st century, No.101, WMO/TD NO.853, ICPO NO.10.WALKER, G. T., 1923: Correlation in seasonal variations of weather VIII: A preliminary study ofworld weather. Mon. Indian Meteor. Dept., 24, 75-131.WALKER, G. T., 1924: Correlation in seasonal variations of weather IX: A further study of worldweather. Mon. Indian Meteor. Dept., 24, 275-332.WALKER, G. T., 1928: World weather III . Mem Roy. Meteor. Soc. 2, 97-106.WANG, C., 2002: Atlantic climate variability and its associated atmospheric circulation cells. J.Climate,15, 1516-1536.WANG, G. AND ELTAHIR, ELFATIH A. B., (1998): Use of ENSO information in medium and longrange forecasting of the Nile floods. J. Climate, Vol. 12, No. 6, 1726-1737.WARD, M. N., 1998: Diagnosis and short-lead time prediction of summer rainfall in tropicalNorth Africa at interannual and multidecadal timescales. J. Climate, Vol. 12, No. 6, 3167-3191.WCRP, August, 1997: A research programme on climate variability and predictability for the 21stcentury, NO.101, WMO/TD NO.853, ICPO NO.10.ZWART, B., 1992: Het klimaat verandert. Meteorologgica, 1, 8-10.ZWART, B., 1993: Het klimaat verandert. Zenit, February, 90-94.
JOURNAL OF METEOROLOGY Vol. 28, no. 279 May/June 2003
TORRO ANNUAL REVIEW 2002
THUNDERSTORM SUMMARY FOR THE BRITISH ISLES 2002By JONATHAN WEBB
Director TORRO Thunderstorm and Hailstorm Division
OVERVIEWThunder day totals in 2002 (Table 1) were below average in many areas, but
above normal in much of East Anglia and parts of south-east England, near some coastsin the north-west of the British Isles, and along the English Channel coast adjacent tothe Isle of Wight. Coulsdon (Surrey) experienced thunder on 24 days. However, atVelindre (Powys) the annual total (5 days) was the lowest since 1991 (4 days) and thesecond lowest since the 1970s. At Carlton-in-Cleveland (North Yorkshire) a total of 7thunder days was the equal fewest (with 1989) in annual records back to 1983.Features of the year reflected in the distribution of storm days included:1. The very disturbed, "westerly" spell in late January and February when thunderyshowers especially affected north-westernmost areas in vigorous polar maritimeairstreams. Stornoway had four storm days in February, Broadford (Skye) had six thunderdays by 9th March and at Straide, north-west Ireland, seven of the 12 annual thunderdays had occurred by 7th March.2. The absence of June thunder across a large area of south-west England, central southEngland, Wales and the Midlands. Apart from in the East Midlands there was also asignificant deficit of thunder in these areas in July.
June 2ndAs a cold front engaged a very warm southerly airflow, a large area of
thunderstorms broke out across northern England during the evening. The first reportsof hail were around Chester, followed by observations of marble sized chunks of ice atLoveclough and Haslingden (Lancs). TORRO member Matt Hugo observed hailstonesof up to 32mm across in north Rossendale (Lancs).June 10th
Pressure was low west of Scotland with the British Isles in a rather cool,unstable west to south-westerly airstream. Typically in such summer situations,"downwind" East Anglia experienced both the highest temperatures (19C at Marhamand Coningsby) and the most vigorous shower activity. Marble sized hail fell at Marham(Norfolk) and large hail fell in the Higham and Brooms Barn areas of Suffolk, shreddingsugar beet leaves at the latter location.July 3rd
Hail damaged plants at Brampton (Cumbria) during a showery day in an unstablenorth-westerly airstream.July 20th
A very slack surface area of low pressure drifted east-south-east across Englandand Wales. The 500mb chart showed a marked upper trough covering the British Isles;however daytime heating lifted surface temperatures to average July values (e.g. 21C inthe Midlands and East Anglia).Thunderstorms occurred quite widely across the EastMidlands, Yorkshire and East Anglia, accompanied by several fierce hailstorms. At thevillage of Whissendine, Rutland, hail up to 23mm diameter covered much of the grassareas between 1130 and 1200 GMT. The hailstones were described as like marbles or"slightly squashed redcurrants" and hurt on impact. Large runner beans and wintergreens had all their leaves holed "as if eaten". At Santon Downham, Norfolk, hail up to25mm across fell in the late afternoon accompanied by a strong squall; hail of smallmarble size was also reported just to the west on the south Lincolnshire border.To the north-west of Chelmsford, Essex, marble sized hail destroyed up to 80% ofoilseed rape, peas and wheat crops in the most intense hailstorm to hit this area sincethe great storm of 26th May 1985 (see Elsom and Webb 1993).July 28th-30th
The year's hottest spell was also associated with the most outstanding outbreakof thunderstorms in 2002 (for background see the Annual Thunderstorm summary)July 28th
The two week thundery spell began with a severe thunderstorm outbreakacross west Suffolk. Large hail fell on a SSW-NNE swath from Chedburgh (hail 10mmacross) to Hundon ("hail almost golf ball size") and on to Stansfield, where car paintworkwas chipped by the hail.July 29th
During one of the early thunderstorms that late afternoon, observer Nick Vergeobserved scattered disc shaped hail 15 to 20mm across at Maidensgrove, southOxfordshire.TORRO observers Ray Peverall and Simon Culling both witnessed largehail in the great Milton Keynes thunderstorm which raged for much of the evening.

178 187JOURNAL OF METEOROLOGY Vol.28 No.279 May / June 2003 JOURNAL OF METEOROLOGY Vol.28 No.279 May / June 2003
March 9th.Hail 10-11mm diameter fell at Coulsdon (Surrey), the third time in 5 weeks hail
reaching this size had fallen at the station.April 18th
Predominantly dry, anticyclonic weather in the first in the first three and a halfweeks of April was interrupted as a cold front crossed England and Wales overnight17th/18th, followed by a slack, unstable westerly airflow underneath a trough evident at500mb. Thundery showers were widespread across central and southern England.Hailstones up to 10mm across were observed around Pinner (West London), Windlesham(Kent), Lewknor (Oxon) and Derby. At Pinner hail covered the ground thickly, as it didalso at Storrington (West Sussex). At Ware, Hertfordshire, hail, described as of large peato small marble size, stripped small leaves from trees and new growth off shrubs.April 26th, 28th
Thunder broke out suddenly as a fast-moving "double" cold front crossed thesouth Midlands and south-east England in the early afternoon of the 26th. AtMaidensgrove and Assendon, near Henley in Oxfordshire, intense hail 5 to 10mm acrossstripped many leaves and damaged delphiniums. During the evening of the 26th theunstable polar air in the wake of the front brought thunder and hail to north-west England,with observers at Wigan (Greater Manchester) and Chorley (Lancs) reporting hail around10mm diameter; at the former location the ground was completely covered. North-westEngland also experienced some fierce hail during thundery showers on the evening ofthe 28th in a strong westerly airflow of polar origin just south of a deep depression overnorthern Scotland. At Worsley, Manchester, hail carpeted the ground, and blossom,catkins and leaves were brought down off trees; an unconfirmed report from Oldhamreferred to "golf ball hail". There were reports of marble sized hail in Stoke-on-Trent,while at Cosby, near Leicester, pea sized hail covered the ground.May 1st-2nd.
A slow-moving upper trough extended south over the British Isles and westernEurope and, as the old surface depression near north-east Scotland filled and driftedaway north-east, north-north-westerly winds fell light. On 1st pea sized hail briefly coveredthe ground at Earl Shilton (Leics). On 2nd several heavy hailstorms were reported. AtPoxwell (Dorset) the ground was covered 10cm deep, and a white cover was also reportedat Shaftesbury. At Longfield (Kent) foliage on plants and trees was damaged.The most remarkable storm on the 2nd occurred at Wishaw, North Lanarkshire. Somehailstones of 40 to 45mm diameter were observed. Although generally of the soft variety(which splattered on impact), a few individual stones bounced several feet.May 26th-27th
An area of low pressure swung north across southern England on the 26th andlater became slow moving across western Scotland as it filled on the 27th. Thunder wasmoderately widespread across the south and Midlands on 26th. Pea sized hail knockednew buds off runner beans at Early near Reading (Berks). Hailstones were observed at10mm across at Cinderford (Glos), and 9 to 12mm at Wymeswold (Leics) where they weredescribed as painful on impact. At Cropwell Bishop (Notts) hail covered the ground.On the 27th there was an accumulation of "quite large" hail in central Belfast.

179186 JOURNAL OF METEOROLOGY Vol.28 No.279 May / June 2003 JOURNAL OF METEOROLOGY Vol.28 No.279 May / June 2003
3. The notable thundery period from 28th July to 10th August, coinciding this year withthe classic "height of the European summer monsoon". The latter has been associatedwith the peak annual incidence of cyclonic weather types over the British Isles (Kelly,Jones and Briffa 1997, ref H Lamb's classification). The activity in this spell in 2002predominantly, but not exclusively, affected eastern areas.4. A very cyclonic, "southerly" November was associated with a high incidence of lateautumn thunder near the coasts of central southern England, e.g. 6 thunder days occurredat Lymington, Hampshire.
WIDESPREAD THUNDERSTORM OUTBREAKS IN 2002The identification of days of days of widespread thundery activity has again
been based on the geographical "spread" of stations used in Bob Prichard's 1946-1985survey (J. Meteorology 12, pp 83-86), the automation of various synoptic stations beingcompensated for by the use of more reports from voluntary observers. Thunder couldbe described as widespread on 11 days in 2002 (May 3rd, 17th and 26th; June 2nd; July20th, 29th and 30th; August 3rd, 7th and 18th; and October 25th), below the 1946-1995average of 15 days. Only 17th May (in the south-west) and 29th-30th July (central andeast Britain) were occasions of large storm systems with very extensive overhead electricalactivity. On the other days noted above activity was essentially "showery", thoughslow moving cumulonimbus systems gave some lengthy "action" at a local level.
REPORTED INCIDENCE OF OVERHEAD STORMS AND LIGHTNING DAMAGE IN2002(overhead thunder is defined as electrical activity reported by an observer to be at a distance of 5km
or less, or "close")
Overhead thunder was reported on 15 days at Ware, Hertfordshire, and on 12days at Loughton, Essex. Significant lightning incidents (e.g people directly or indirectlystruck, houses and other buildings struck, trees struck and damaged, strikes causing anelectricity supply cut over a large area) reported to TORRO in 2002 are summarised inTable 2. The total reports were noticeably fewer than in 2001 and only just over half thetotal for 1999, the most thundery recent year in respect of the number of widespreadsevere events. 2002 would have been a very "quiet" year had it not been for the two-week thundery spell from 28th July to 10th August during which nearly half (78) of theknown lightning incidents for the year were logged. Sadly, these included the firstlightning fatality since 1999 following an incident in a Leicester park on 3rd August.
Counties reporting the highest number of incidents in 2002 were:Buckinghamshire with 17 incidents (all on 29th July!); Norfolk and Suffolk with 11 each,Devon (6 on 17th May) and London with 10 each, and Essex with 9. The five Easterncounties of Essex, Cambridgeshire, Suffolk, Norfolk and Lincolnshire had a total of 45incidents reported. Of the 166 reported lightning incidents in 2002, 61 were in July ofwhich 55 occurred on the 29th-30th July, the most outstanding thunderstorm episodeduring the year.
Thunder and hail were quite widespread in squally showers across southern England.Hail of 5 to 10mm diameter was observed in several locations such as Swindon (Wilts),Sutton Scotney (Hants/Berks border), Peckham and Telegraph Hill in South London,and Coulsdon (Surrey) where the hail lay up to 3cm deep. There was an unconfirmedreport of marble sized hail from the Hounslow area of West London. Hail up to 10mmacross also fell at Llansadwrn (Anglesey).February 26th-27th
As on the 5th an airstream originating over Greenland arrived on a very longsea track, but this time on strong westerly winds south of a belt of low pressure extendingfrom south-east Greenland across Scotland to south Sweden.A particularly dramatic cumulonimbus system crossed north-west England in the lateafternoon of the 26th. Pea sized hail covered the ground at Heswall (Merseyside). Quitefrequent and vivid lightning, fierce squalls, hail up to 15mm across (marble size) and afinale of heavy snow were observed at Standish, near Wigan (Greater Manchester) andat Rawtenstall, Rossendale (Lancs). Other western locations to report large hail on the26th were Lisburn, Antrim (Northern Ireland) and (in the morning) Raglan(Monmouthshire) where hail 12mm diameter fell. On the 27th there were reports of hailaround 10mm across from Llandaff in Cardiff and the Bideford area of Devon wherefields were covered. Coulsdon (Surrey) experienced a second violent hailstorm of themonth in the afternoon. The hail, up to 13mm across, lay on the ground for over 18hours. Hail averaging 11mm diameter fell at Benfleet (Essex).

180 185JOURNAL OF METEOROLOGY Vol.28 No.279 May / June 2003 JOURNAL OF METEOROLOGY Vol.28 No.279 May / June 2003
SEVERE THUNDERSTORMS IN 2002May 17th
At 0000 GMT a southeasterly airstream covered most of the British Isles (28.5Cwas recorded in Jersey on the 16th), while a trailing cold front was virtually stationaryacross western Ireland but further south, was pushing slowly eastwards across Biscayand Iberia. As the front undercut hot air over western France a large area of severethunderstorms developed, and drifted northwest across southwest England and SouthWales over the following 12 hours. Individual observers in Devon and South Walesexperienced around six hours of activity, with lightning damage at several places in theformer county, and severe flash flooding in West Glamorgan and Carmarthenshire.June 2nd/3rd
The year's second brief incursion of very warm southerlies and an ensuingcold front brought some heavy thunderstorms to Northern England on the evening of2nd, with widespread disruption to electricity supplies and TV reception in the north-east. A wave on the front brought another lively outbreak of storms to Norfolk in theearly hours of the 3rd.
She remained in intensive care on life-support for three days and needed ten daysrecovering in hospital. Another of the surfers said "everything went black. I felt anintense pain in my head like being hit with a sledgehammer, and an almighty bee sting".The lightning apparently first struck a tree on the cliff, splitting it in two, and the electricaldischarge then passed into the sea. The 21-year-old surfer who suffered the worst wasankle deep in the water when lightning struck while the other three affected by theelectrical discharge were in deeper water.
Acknowledgements: The authors wish to thank TORRO members and others for forwarding reports,including press clippings. Their willingness to investigate incidents, sometimes conducting interviews,
is much appreciated.
REFERENCEELSOM, D.M. (2001): Deaths and injuries caused by lightning in the United Kingdom: analyses of twodatabases. Atmospheric Research, 56, pp.325-334.
HAILSTORM DIVISION SUMMARY FORTHE BRITISH ISLES 2002
By JONATHAN WEBBDirector TORRO Thunderstorm and Hailstorm Division
Potentially damaging hail (TORRO intensity H1 or greater) was reported on 20 days in2002 (Table 1).February 5th
There was a large, deep, complex area of low pressure to the west and north ofthe British Isles. A strong south-westerly airstream behind a waving cold front blewreturning maritime polar air, originating around Greenland but with a very long "fetch",across Ireland, England and Wales.
Lightning over Ware, Hertfordshire, on the late evening of 7th August 2002 (courtesy of MichaelSkinner)
184 181JOURNAL OF METEOROLOGY Vol.28 No.279 May / June 2003 JOURNAL OF METEOROLOGY Vol.28 No.279 May / June 2003
July 20thWidespread thunder affected the East of England as a shallow depression
drifted east across England and Wales. There was lightning damage to buildings in theMidlands, flash flooding in the Nottingham and Hull areas, several severe hailstorms(see 2002 hailstorm summary) and tornado damage at Brightlingsea, Essex.July 28th-31st
Hot air shifted northwards into the British Isles on the 27th as pressure builtover Eastern Europe. Temperatures reached 30C in the London area on the 28th when asmall, but severe outbreak of thunderstorms (see hailstorm summary) affected EastAnglia. Meanwhile a cold front, which had been encroaching from the northwest, slowedand became trailing across the England/Scotland border and the Irish Sea by 0000 on29th. During the next 48 hours it eventually returned north into Scotland and pivotedforward again into southwest Britain, as an area of low pressure developed over centraland eastern England. Further details of the rather complex background to the variousareas of storms during this period are discussed in the monthly thunderstorm report(Prichard 2003).
The main series of severe thunderstorm outbreaks began over the east andsoutheast Midlands late on the afternoon of the 29th (Fig 1) following peak temperaturesof over 32°C in West London. Three TORRO observers (Ray Peverall, Simon Cullingand Chris Scoggins) witnessed the ferocious storm that affected the Milton Keynesarea in the evening; at its height there were 12 to 20 lightning discharges per minute.Fifteen houses in the district were struck and set alight in separate lightning incidents.At least two of these houses, in New Bradwell and in Great Linford suffered extensivedestruction of their roof space. In one road in Wolverton, not only was a house struckand fired, but all 45 properties were left with flooded gardens. There was extensivedisruption to traffic lights and electric lifts in the town.
Fig.1. Infra-red satellite image for 1533 GMT, 29th July 2002. The first large cumulonimbus systemerupts over the East Midlands and the severest thunderstorm outbreak of 2002 is underway (courtesyof University of Strasbourg).
July 29thWigston, Leicester (Leicestershire). 1830. Lightning struck a house which had
the patio and front door open. "Suddenly this red ball...with sparks coming from it, camein and went through the house". A charger for an electric wheelchair came on as did abattery-operated electrical game, and a bouncy ball with a flashing spark inside lit up.The red ball disappeared in a couple of seconds leaving a slight burning smell. An 11-year old girl was left with a faint red mark on her head. She "felt as if someone hadpinched her really hard on the forehead (she felt a slight burn) and then on the leg ... likesomeone had set my leg on fire". She had two metal clips in her hair.July 31st
Hungerford (Berkshire). At 0712 GMT there was huge discharge, "a blindingblue glare and with it a tremendous bang", witnessed first-hand by TORRO observerJohn Weevers. He felt the discharge in his chest. Doors and windows in the house wereblown open and items fell from shelves. The sky dish/receiver, digi-box and television inthe house were destroyed. Nearby houses also experienced damage to electricalequipment.August 3rd (1)
Leicester (Leicestershire). A 23-year-old man was struck an killed by lightningas he and two male friends (23- and 30-years-of-age) sheltered from torrential rain (withthunder "a long way off") under a tree in Aylestone Recreation ground where they wereparticipating in football training. The two friends were injured. One described how "myleg was totally shot....completely white, the kneecap was blue" and the other sufferedan injury to his groin. Both were treated in Leicester Royal Infirmary.August 3rd (2)
Canterbury (Kent). A man holding an umbrella was struck by lightning whenhelping to set up a fun day and fete at Parkside Primary School. He was not knocked offhis feet but his right arm went "completely numb" and he had "no feeling there for twodays". He was left with a burn mark on his wrist.August 7th
Woolwich (London). At 1848 GMT, lightning struck a house in Lamport Close,shattering a window and starting a roof fire. A 27-year-old mother was "knockedsideways" and her nine-year-old son suffered cuts to his head from flying windowglass. A television, video and games' console were damaged.August 18th
Boston (Lincolnshire). When lightning struck a house, the owner (genderunknown), who was holding kitchen taps at the time, was knocked unconscious and astereo system was burned out.November 23rd
Hawkes Point-Porth Kidney Sands, Carbis Bay, near St.Ives (Cornwall). Atabout 1600 GMT, a group of surfers were struck by lightning and four were knockeddown. Two of these were knocked unconscious and seriously hurt and were airlifted byhelicopter to Treliske Hospital, Truro. One of these, a 21-year-old woman suffered cardiacarrest and required heart and lung resuscitation at the scene from an off-duty doctorand a motorcycle paramedic (who used a defribrillator).

182 183JOURNAL OF METEOROLOGY Vol.28 No.279 May / June 2003 JOURNAL OF METEOROLOGY Vol.28 No.279 May / June 2003
Later that evening and into the early hours of 30th storms also left a trail oflightning damage across the north-east Midlands and Lincolnshire with 10,000 homesin Leicestershire losing power. Several buildings were damaged by lightning in theHumber area, where lightning intensities reached a peak rate of 12 to 15 discharges perminute. Further severe storms occurred later on 30th; from Kent and London northwardsacross East Anglia (where activity continued for over 12 hours around the Wash), andalso in the east and north Midlands, northern England and south and east Scotland.114mm of rain fell at Penistone (South Yorkshire), 109mm at Heckmonwicke (WestYorkshire) and 103mm at Charnwood Forest (Leicestershire). At Harrogate (North Yorks),TORRO's Roger Bickerton recorded 90mm of which 36mm fell in an hour. There wassevere flash flooding in numerous localities, including parts of Northamptonshire,Leicestershire, south-west Essex, west Norfolk (83mm at RAF Marham), Lincolnshire(73mm at RAF Waddington), north Derbyshire (Glossop), Yorkshire, southern Scotland(where there were many landslip incidents) and central Scotland (especially central andeastern areas of Glasgow).
Lightning caused widespread and prolonged power failures in Suffolk,Cambridgeshire and (for the second successive night) Lincolnshire, while at least fivebuildings were struck in West Suffolk. In Scotland, 50,000 homes in the Edinburgh arealost power in the storms. During the period between 1200 GMT on 28th and 1200 GMTon 31st July thunder was heard during 16 standard hours at Bury St Edmunds (Suffolk)and during 12 hours at Nettleham (Lincoln).August 7th
A cold front pushed very slowly southeast into a residue of very warm, stagnantair across England and Wales. Numerous slow-moving thunderstorms were associatedwith lengthy periods of electrical activity and flash flooding. 71.5 mm fell at Hampstead,London (60mm in one hour) and numerous London underground stations were forcedto close by flooding. During storms on the Northamptonshire/Buckinghamshire border,63mm fell in two hours at Silverstone and 60mm in one hour at Olney. Ball lightningincidents were reported at Hertford and at Addlestone (Surrey).September 7th-9th
During a short unsettled spell in an otherwise anticyclonic month, torrentialthundery downpours caused severe local flooding around Inverness on the 7th, whileflash flooding affected Swanage (Dorset) early on the 9th when 88mm of rain fell before0900 GMT.
Further details of each month's storms and their synoptic background are published in The Journal ofMeteorology, UK. New thunderstorm observers are always welcome. Further details and either monthlyor individual storm report forms are available from the author.
REFERENCESKELLY, P. M, JONES, P and BRIFFA, K (1997) Classifying the winds and Weather; in M Hulme andE Barrow Climates of the British Isles, present, past and future, published by Routledge.PRICHARD, R. J (2003) TORRO Thunderstorm report July 2002, J of Meteorology 28, pp 69-72PRICHARD, R. J (2003) TORRO Thunderstorm report August 2003, J of Meteorology 28, pp 72-74
LIGHTNING STRIKES TO PEOPLEIN THE BRITISH ISLES 2002
By DEREK ELSOM * and JONATHAN WEBB***Director of TORRO ** Director TORRO Thunderstorm and Hailstorm Division
INTRODUCTIONReports were received of people being struck directly or indirectly by lightning
in the British Isles on nine days during 2002. A total of 18 people (11 male, 6 female, 1gender unknown) were struck in 11 separate incidents. A 23-year-old man died whilstsheltering under a tree with two friends in Leicester on 3rd August. His death was thefirst to have occurred from lightning in the British Isles since two women were killed inHyde Park, London, on 22nd September 1999 (Elsom, 2001). A lightning incident involvingfour surfers near St Ives, Cornwall, on 23rd November received widespread nationalmedia attention. A 21-year-old female surfer required resuscitation and spent 10 days inhospital recovering. Six of the lightning incidents during 2002 involved people indoorsreceiving electrical shocks when lightning struck the building they were in and, in twocases, when they were using a land-line telephone. One indoor incident in Leicester on29th July may have involved ball lightning. Overall, there were far fewer known lightningincidents affecting people compared with the previous two years. Generally, there werefewer days during the year with overhead thunder being reported and fewer widespreadthunderstorm events. The EA Technology Location System recorded around 207,000ground strikes in 2002 for the UK compared with 403,000 in 2001 and 310,000 in 2000 (DonEaton, pers comm).
INDIVIDUAL INCIDENTSMay 17th
South Molton (Devon). A lady using the telephone at about 1000 GMT reportedhow a "blinding flash of lightning pulled the phone out of her hands". The telephone"landed across the room"... and her hand became "claw shaped with a spasm".June 2nd
New Ross (County Wexford, Ireland). Lightning struck three men, including afather and his son, who were taking part in the district angling club's three-day event.They were thrown on to rocks. They were all briefly hospitalised.June 10th (1)
Risby, Bury St Edmunds (Suffolk). At 1555 GMT, lightning struck Cherry TreesSchool in the Chase. The areas affected were the main hall, kitchen and office buildings.A heater in an upstairs office caught fire, setting fire to floorboards, curtains and a wall.Computers and modems were wrecked. Fire systems were burnt out. One female teacherwas struck by lightning as she led children out, but she was not seriously hurt.June 10th (2)
Ixworth (Suffolk). Lightning struck a building leaving a hole in the roof anddamaging electrical cables. A councillor inside received an electrical shock via thetelephone he was using and he was thrown across the room.