2021-22 Charge
25
Budget Planning Council 2021-22 Charge Co-chaired by the Executive Vice President and Provost (EVPP) and the Vice President for Finance and Administration (VPFA), the Budget Planning Council is an advisory body that is a key component of the established governance mechanisms of Ohio University. The Budget Planning Council is charged with serving an advisory role to the President regarding current and multi-year budget issues, and long-term financial policies. The co-chairs communicate the Budget Planning Council's advisory recommendations to the president. The duties and responsibilities of the Budget Planning Council include the following: • Serve as representatives of the entire University community while communicating to and providing feedback from their respective constituent groups. • Providing input to the President about the general assumptions and principles leading to the construction of the University budget. • Provide input on institutional budget policy and financial planning issues that impact the long-term health of the institution. Membership Executive Vice President and Provost (EVPP) – co-chair Senior Vice President for Finance and Administration (VPFA) co-chair Two Deans (staggered two-year terms) Two Department Chairs / School Directors (staggered two-year terms) Two at-large Faculty (staggered two-year terms) Faculty Senate Chair or Representative (while in position) Faculty Senate Vice Chair (while in position) Faculty Senate Finance and Facilities Chair (while in position) Administrative Senate Chair or Representative (two -year term) President’s Council Representative (two -year term) Undergraduate Student Senate President or Representative (one-year term) Graduate Student Senate President or Representative (one-year term) Both Student Trustees
Transcript of 2021-22 Charge

Budget Planning Council 2021-22 Charge
Co-chaired by the Executive Vice President and Provost (EVPP) and the Vice President for Finance and Administration (VPFA), the Budget Planning Council is an advisory body that is a key component of the established governance mechanisms of Ohio University.
The Budget Planning Council is charged with serving an advisory role to the President regarding current and multi-year budget issues, and long-term financial policies. The co-chairs communicate the Budget Planning Council's advisory recommendations to the president.
The duties and responsibilities of the Budget Planning Council include the following:
• Serve as representatives of the entire University community while communicating toand providing feedback from their respective constituent groups.
• Providing input to the President about the general assumptions and principles leading tothe construction of the University budget.
• Provide input on institutional budget policy and financial planning issues that impact thelong-term health of the institution.
Membership
Executive Vice President and Provost (EVPP) – co-chair Senior Vice President for Finance and Administration (VPFA) co-chair Two Deans (staggered two-year terms) Two Department Chairs / School Directors (staggered two-year terms) Two at-large Faculty (staggered two-year terms) Faculty Senate Chair or Representative (while in position) Faculty Senate Vice Chair (while in position) Faculty Senate Finance and Facilities Chair (while in position) Administrative Senate Chair or Representative (two -year term) President’s Council Representative (two -year term) Undergraduate Student Senate President or Representative (one-year term) Graduate Student Senate President or Representative (one-year term) Both Student Trustees

Budget Originating Review and Internal Internal Final Element Area Input Recommnedation Approval Approval
RatesUndergraduate Tuition Rates PC BPC & DC & SEM EBGHousing Rates Housing BPC & DC & SEM EBGDining Rates Culinary BPC & DC & SEM EBGRegional Campus Rates Reginoal Campuses BPC & DC EBG => President Trustee Fee ResolutionsHCOM Tuition Rates HCOM BPC EBGGraduate Tuition Rates Program College EVPPUG eLearning Rates Program College EVPPCourse Fees Colleges Student Fee Committee EVPP
Revenue ProjectionUG Enrollment Projection SEM BPC & DC EBGScholarship Plan Enrollment Mgt BPC & DC & SEM EBGUG Tuition Revenue Projection BPA BPC & DC EBGState Subsidy Projection BPA BPC & DC EBGGraduate Program Revenue Projection Program College SEM EVPPUG Elearning Revenue Projection Program College SEM EVPP
=> President Trustee Budget ResolutionExpenditure ProjectionCollege Budgets Colleges EVPP EBGPresident and VP Budgets Admin Units President or VP EBG
Health Benefits Plan and Budget BAC BPC & DC & TCC EBGOther Benefits BAC BPC & DC & TCC EBGSalary Raise Assumption PC BPC & DC & TCC EBG
Captial Plan ADC BPC & DC CFPCDeferrend Maintenance Expenditures ADC CFPC => President Trustee ResolutionsCaptial Project Expenditure ADC CFPC
Key Acronym Faculty ParticipationArchitecture Design & Construction ADCBenefits Advisory Committee BAC YesBudget Planning Council BPC YesCapital Funding & Priorities Committee CFPC YesDean's Council DCExecutive Budget Group EBGExecutive Vice President & Provost EVPPPresident's Council PCStrategic Enrollment Management Advisory Group SEM YesTotal Compensation Committee TCC Yes
= discussed in BPC
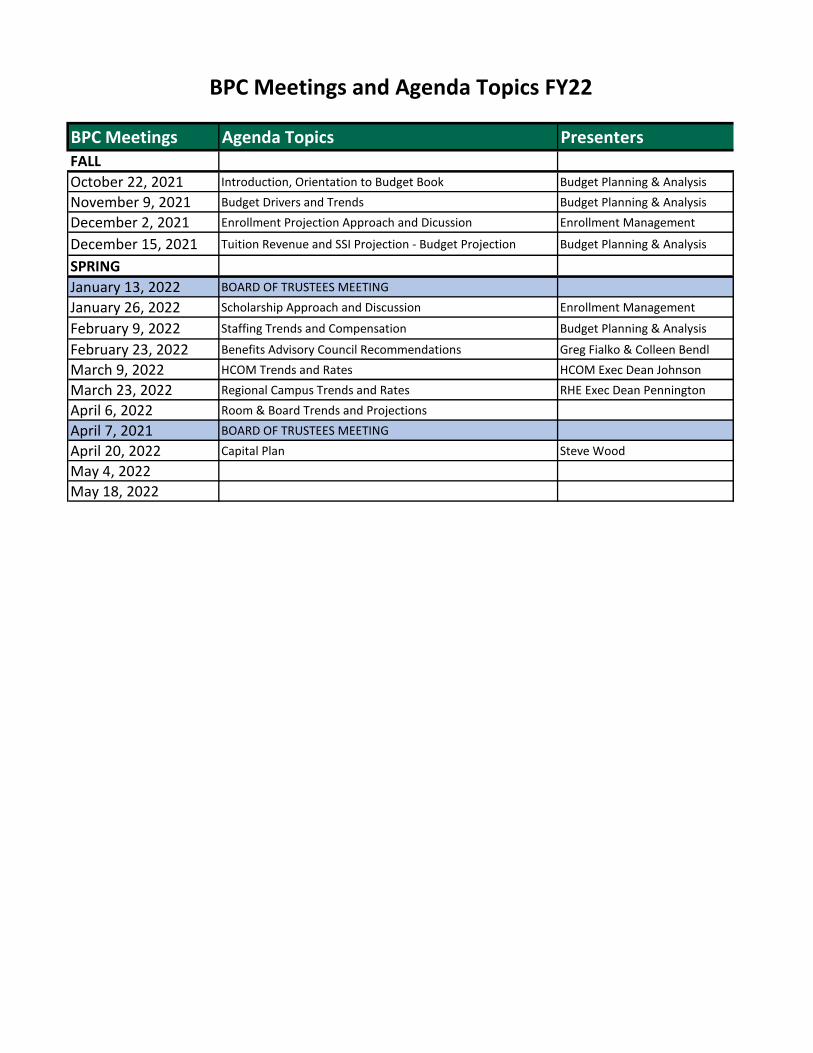
BPC Meetings Agenda Topics PresentersFALL
October 22, 2021 Introduction, Orientation to Budget Book Budget Planning & Analysis
November 9, 2021 Budget Drivers and Trends Budget Planning & Analysis
December 2, 2021 Enrollment Projection Approach and Dicussion Enrollment Management
December 15, 2021 Tuition Revenue and SSI Projection - Budget Projection Budget Planning & Analysis
SPRING
January 13, 2022 BOARD OF TRUSTEES MEETING
January 26, 2022 Scholarship Approach and Discussion Enrollment Management
February 9, 2022 Staffing Trends and Compensation Budget Planning & Analysis
February 23, 2022 Benefits Advisory Council Recommendations Greg Fialko & Colleen Bendl
March 9, 2022 HCOM Trends and Rates HCOM Exec Dean Johnson
March 23, 2022 Regional Campus Trends and Rates RHE Exec Dean Pennington
April 6, 2022 Room & Board Trends and Projections
April 7, 2021 BOARD OF TRUSTEES MEETING
April 20, 2022 Capital Plan Steve Wood
May 4, 2022
May 18, 2022
BPC Meetings and Agenda Topics FY22
Budget 1010: Introduction to University Budgeting
Budget Planning Council
October 22, 2021
1
2
https://www.ohio.edu/finance/budget/budget-book

Four Major University Budget Areas
Athens Budget(Colleges &
Central Admin)
Athens Main Campus and E-Campus Enrollments (Graduate and Undergraduate)• Instructional and Non-Resident Fees• State Subsidy• Restricted Funds (Grants and Gifts)
Regional Campuses
College of Osteopathic
Medicine (HCOM)
Auxiliaries (Athletics, Culinary, Housing & Others)
Athens Students (Primarily Freshmen and Sophomores)• Athletics, Parking & Transportation, Printing• Culinary (Primarily Freshmen and Sophomores)• Housing & Residence Life (Primarily Freshmen and Sophomores)
Different Missions – Separate Funding Sources – Separate But Interrelated Budgets
Regional Enrollments (Primarily Associate Degree and Bachelor Completion)• Instructional Fees and Non-Resident Fees• State Subsidy • Restricted Funds (Grants and Gifts)
Medical Student Enrollments • Instructional Fees and Non-Resident Fees• State Subsidy (Separate allocation formula) • Restricted Funds (Grants and Gifts)
3
Some Aspects of Regional Campus activity are merging with Athens under OneOHIO
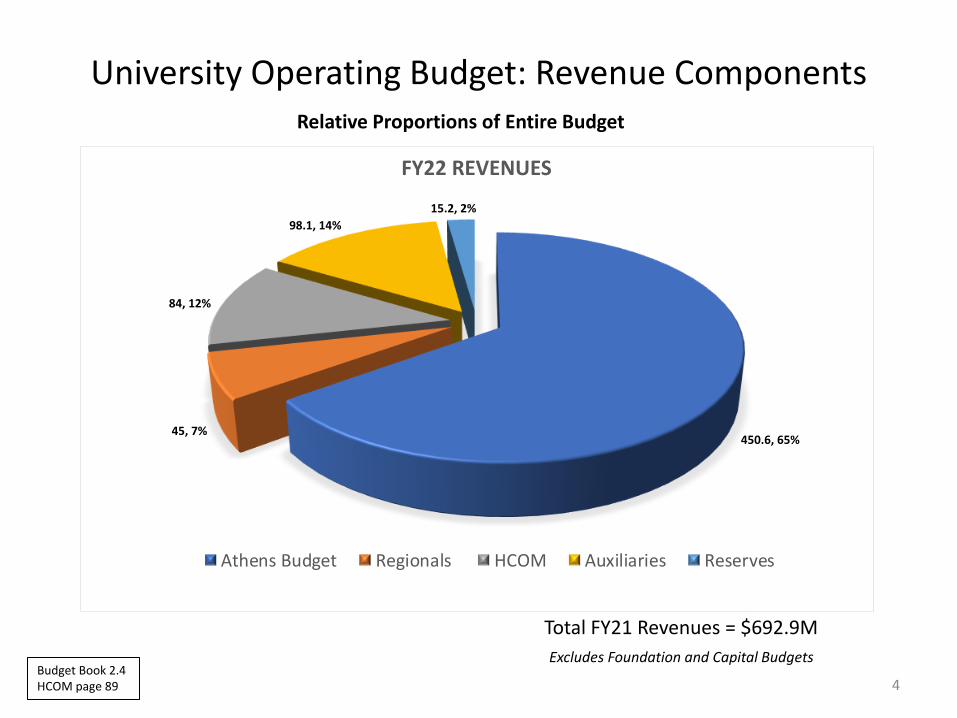
University Operating Budget: Revenue ComponentsRelative Proportions of Entire Budget
Total FY20 Revenues = $758.9MTotal FY21 Revenues = $692.9M
Excludes Foundation and Capital Budgets
4Budget Book 2.4HCOM page 89
450.6, 65%45, 7%
84, 12%
98.1, 14%
15.2, 2%
FY22 REVENUES
Athens Budget Regionals HCOM Auxiliaries Reserves

Major Revenue Sources
Student Enrollment Drives Over 77% of the Budget5
All Units– Athens, Regional, Auxiliaries and HCOM
Budget Book 2.5
56, 8%
55.4, 8%
46.8, 7%
347.5, 50%
187.3, 27%
Internal/External Sales Private Support Grants / F&A Tuition, Fees, Room & Board State Appropriation

Breakdown of Net Tuition and FeesAll Academic Areas– Athens, Regional and HCOM
We are primarily an Undergraduate InstitutionThese are net numbers so financial aid and graduate waivers are taken out
6Budget Book 2.5.2
UG Tuition, Room & Board: 72% of Tuition & Fees
173.3, 50%
96.5, 28%
77.6, 22%
Undergraduate Graduate Room & Board

State Subsidy (SSI) Components
ODHE uses a performance-based funding model for non-medical subsidy. Our support is based on course completions (passing) and degree completions. Over half of our funding is associated with degrees (the 51% plus almost 60% of the Doctoral SSI) which means there is a delay between academic activity and the resulting funding.
7Budget Book 4.1
Completions, 30%
Degrees, 51%
Doctoral, 6%
HCOM, 13%

Delayed Effect of Enrollment on SSIOHIO Relative Shares Compared to all Universities
8
The use of degree completion as a major factor in SSI funding means that changes in our undergraduate enrollments take four years to affect large portion of our funding.Here you can see the projection of enrollment declining (black line) being roughly mirrored with a decline in course completion SSI (blue line) while the degree completion SSI does not decline until later.
Budget Book 4.1
Subsidy Rates for Completions
9
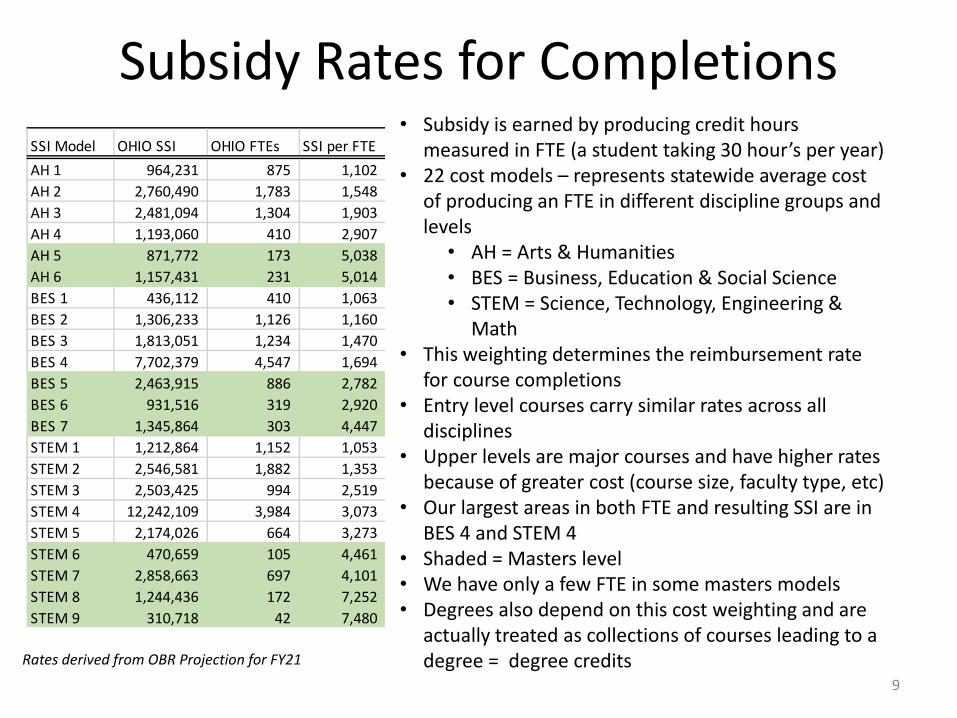
• Subsidy is earned by producing credit hours measured in FTE (a student taking 30 hour’s per year)
• 22 cost models – represents statewide average cost of producing an FTE in different discipline groups and levels
• AH = Arts & Humanities• BES = Business, Education & Social Science• STEM = Science, Technology, Engineering &
Math• This weighting determines the reimbursement rate
for course completions • Entry level courses carry similar rates across all
disciplines• Upper levels are major courses and have higher rates
because of greater cost (course size, faculty type, etc)• Our largest areas in both FTE and resulting SSI are in
BES 4 and STEM 4• Shaded = Masters level • We have only a few FTE in some masters models• Degrees also depend on this cost weighting and are
actually treated as collections of courses leading to a degree = degree creditsRates derived from OBR Projection for FY21
SSI Model OHIO SSI OHIO FTEs SSI per FTE
AH 1 964,231 875 1,102
AH 2 2,760,490 1,783 1,548
AH 3 2,481,094 1,304 1,903
AH 4 1,193,060 410 2,907
AH 5 871,772 173 5,038
AH 6 1,157,431 231 5,014
BES 1 436,112 410 1,063
BES 2 1,306,233 1,126 1,160
BES 3 1,813,051 1,234 1,470
BES 4 7,702,379 4,547 1,694
BES 5 2,463,915 886 2,782
BES 6 931,516 319 2,920
BES 7 1,345,864 303 4,447
STEM 1 1,212,864 1,152 1,053
STEM 2 2,546,581 1,882 1,353
STEM 3 2,503,425 994 2,519
STEM 4 12,242,109 3,984 3,073
STEM 5 2,174,026 664 3,273
STEM 6 470,659 105 4,461
STEM 7 2,858,663 697 4,101
STEM 8 1,244,436 172 7,252
STEM 9 310,718 42 7,480

Restricted Grant FundsMust Be Used For Specific Purposes of the Grant
41.1M total includes facilities and administrative cost recovery ($9.1M)
10
Private Contracts are primarily related to the Heritage Foundation Grant
Budget Book 2.5.3
21.1, 53%
0.8, 2%
7, 18%
10.7, 27%
Federal Local State Private Contracts
Graduate Tuition & Fees - Net
Direct Expenses
11
UG eLearning Tuition
Graduate SSI
Undergrad SSI (including eLearning)
Undergrad Tuition - Net
(Resident + Non Res)
Course FeesExternal SalesIndirect Cost
Grant RevenueGift/Endowment
Total Revenue
Net
College Forecast Allocation Model
Capital Cost -Depreciation
Transfer In/Out
Central Costs
To/From ReservesQuasi Endowment
Plant Funds
HCOM, Aux, RHE
Unit Net Revenue Spending Authorization
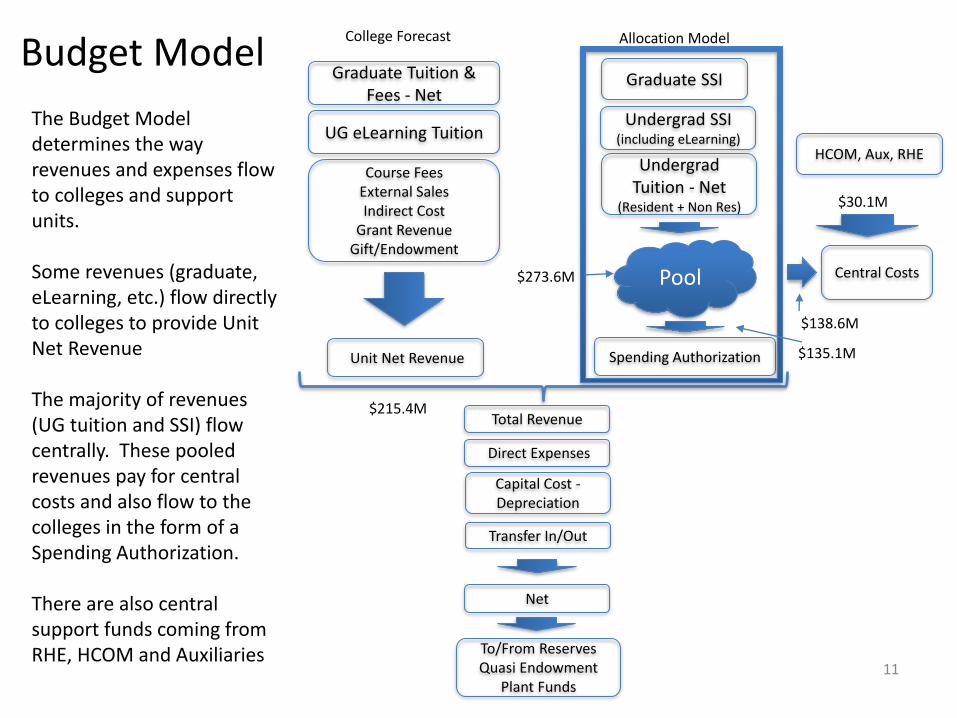
Budget Model
Pool
$215.4M
$135.1M
The Budget Model determines the way revenues and expenses flow to colleges and support units.
Some revenues (graduate, eLearning, etc.) flow directly to colleges to provide Unit Net Revenue
The majority of revenues (UG tuition and SSI) flow centrally. These pooled revenues pay for central costs and also flow to the colleges in the form of a Spending Authorization.
There are also central support funds coming from RHE, HCOM and Auxiliaries
$273.6M
$138.6M
$30.1M

Academic Spending Authorizations
12
Total = $135.1M
Budget Book 2.5.6.1
Health Sciences & Professions is not listed because its Direct Revenue more than covers its entire budget
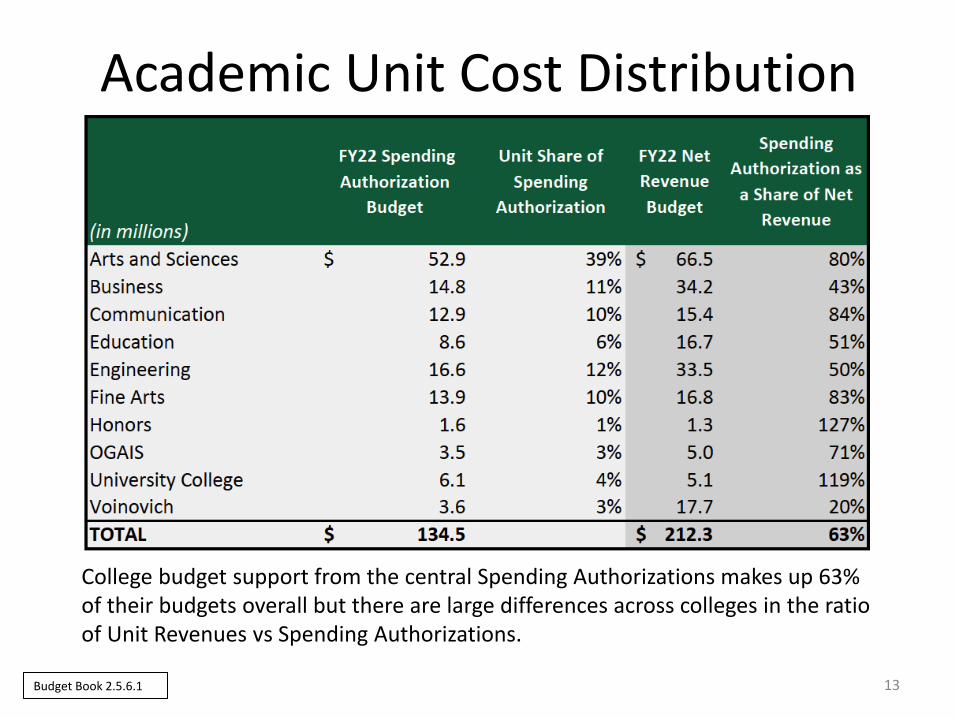
Academic Unit Cost Distribution
13
College budget support from the central Spending Authorizations makes up 63% of their budgets overall but there are large differences across colleges in the ratio of Unit Revenues vs Spending Authorizations.
Budget Book 2.5.6.1

Revenue Summary
HCOMIncluded
14
How Things Appear in the Budget
Some grants, sales and endowment directly support
admin areas
Market Value of
Investments
Support from the
Endowment
Scholarships supported by Housing and Dining and
Athletic Scholarships ($9M)
State Capital Funds
SII and UG tuition revenues are held centrally to support Spending Authorizations for central units and
the rest is distributed to other areas on line 16
$336.2M of UG Tuition and SSI are held centrally. This funds Spending Authorizations for central units and the rest (-156.1) goes to
the other areas as shown here.
Budget Book 2.4
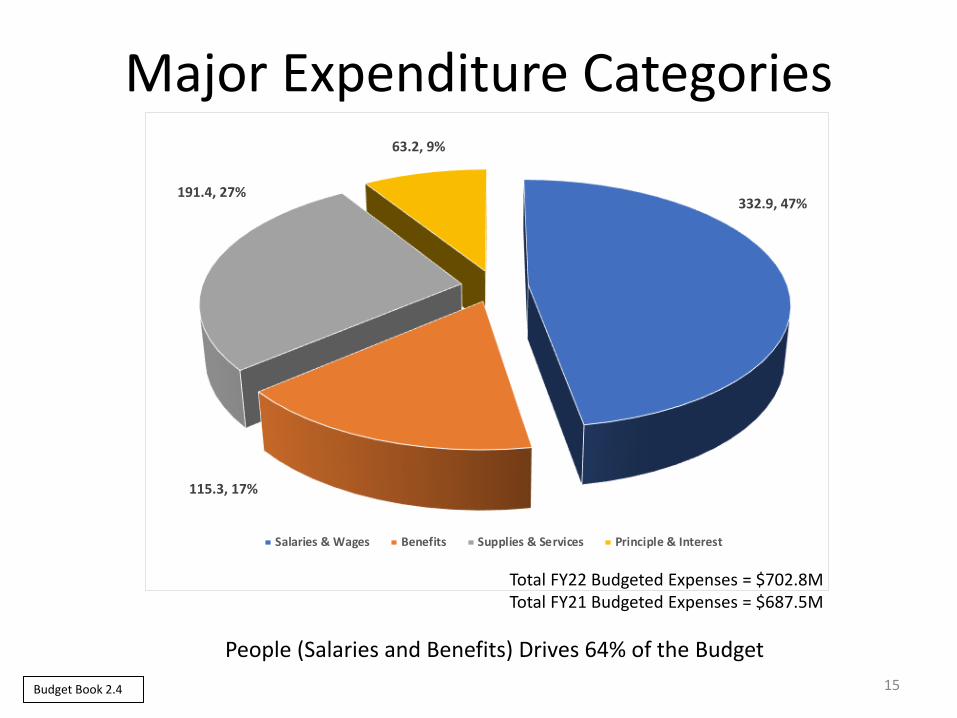
332.9, 47%
115.3, 17%
191.4, 27%
63.2, 9%
Salaries & Wages Benefits Supplies & Services Principle & Interest
Major Expenditure Categories
People (Salaries and Benefits) Drives 64% of the Budget
15Budget Book 2.4
Total FY22 Budgeted Expenses = $702.8MTotal FY21 Budgeted Expenses = $687.5M
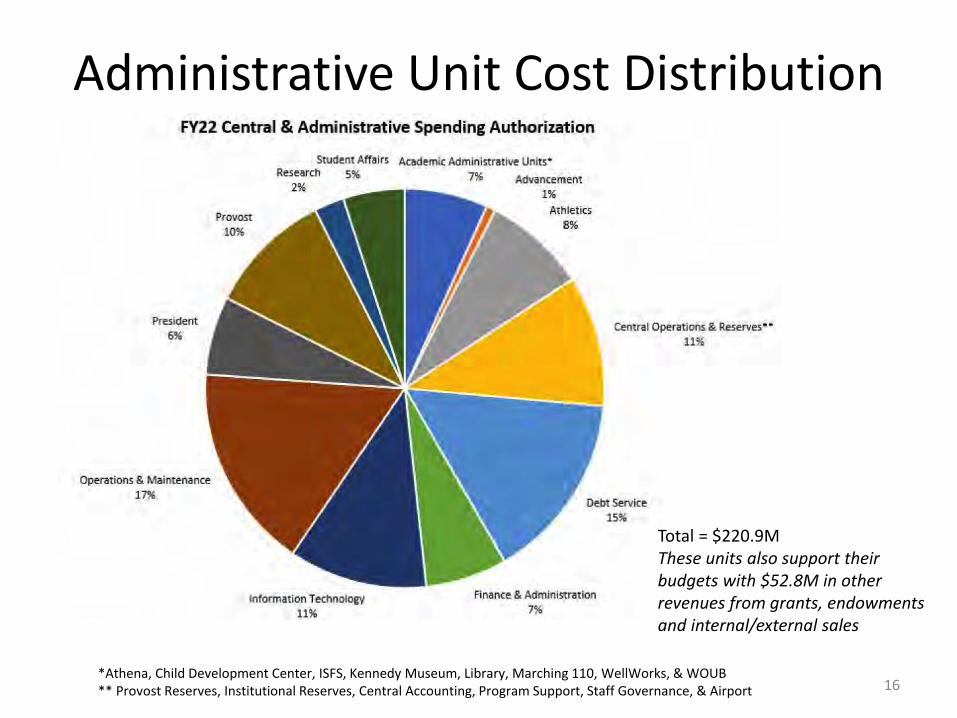
Administrative Unit Cost Distribution
16*Athena, Child Development Center, ISFS, Kennedy Museum, Library, Marching 110, WellWorks, & WOUB ** Provost Reserves, Institutional Reserves, Central Accounting, Program Support, Staff Governance, & Airport
Total = $220.9MThese units also support their budgets with $52.8M in other revenues from grants, endowments and internal/external sales

Academic Unit Direct Expenses
17
Total = $333.7M
Budget Book College Budgets 11.2.1 – 11.2.13
20.6%
10.6%
4.7%
5.2%
10.2%5.5%
11.5%
0.5…1.6%
1.6%
6.0%
21.9%
Arts and Sciences, $68.8M
Business, $35.4M
Communication, $15.8M
Education, $17.4M
Engineering, $34M
Fine Arts, $18.4M
Health Sciences, $38.5M
Honors, $1.8M
OGAIS, $5.2M
University College, $5.5M
Voinovich, $19.9M
HCOM, $73M

Expenses
18
Here is where you see the flow of funds from RHE and Auxiliaries to cover central costs. Under the colleges the
funds are coming from HCOM but also from Health Sciences and Professions which currently funds all of its budget from its unit revenue (in large part from the RN-to-BSN program)
and has additional funds that come centrally.
Capital Cost Allocation is the methodology utilized to allocate some of the central debt service charges to colleges and auxiliaries. Some debt is is charged directly to units like HCOM
How Things Appear in the Budget
Budget Book 2.4

FY22 Strategic Opportunity Reserve (SOR)
Infrastructure – deferred maintenance, OIT systems, financial systemsCommunity & Economic Development – Primarily Tech Growth match Student Success – endowed scholarship match program and Bobcat Student Orientation supportAcademic & Research Investments – currently bridging enrollment shiftsPresidential Priorities and Strategic Pathways - various pathways including Honors program expansion, Upward Bound, Enrollment Management, Graduate student health care offset, etc.
19
4.5
3.1
3.9
0.3
0.0
0.5
1.0
1.5
2.0
2.5
3.0
3.5
4.0
4.5
5.0
Investment Income SSI - 2% holdback Tuit ion - 2% holdback Fund Balance
Sources
1.1
1.5
1.9
3.1
2.2
0.0
0.5
1.0
1.5
2.0
2.5
3.0
3.5
Infrastructure Comm & EconDev
Student Success Acad/Research StrategicPathways
Uses
Infrastructure
Comm & Econ Dev
Student Success
Acad/Research
Strategic Pathways
Beginning Balance 32.4
Sources 11.8
Uses (9.8)
Ending Balance 34.4

20
Transfers and Net Results
18 Funding Transfers – movement of funds between areas. Nets to zero. Mostly funds come from reserves and auxiliaries and going into college and admin units30 Results of Operations – What is left after you take Revenues and Transfers (reverse the sign) minus Expenses. A negative number means the area is in deficit, positive is a surplus. The operating gap for FY22 is 9.8M31 Transfer To (From) Plant Funds –budgeted funds moved to Non-Operating to pay for capital improvements – most of this is projects to upgrade dining halls and dorms 32 Transfer To (From) Quasi Endowments – setting aside funds into an endowment to generate interest that then will be spent –Somovert royalties36 Total Transfer To (From) Reserve – these are uses of accumulated reserves to balance the budget – 29.6M in FY22. This includes auxiliary use of reserves for capital projects, COVID related expenses paid from CARES funding accumulated in FY21 but not beingspent until FY22 (14.9M), surpluses in some central/admin areas and 12.8M from reserves to bridge reductions in academic units.37 Adjusted Net Results – balance between revenue and expense after transfers – should be balanced (0)
Budget Book 2.4
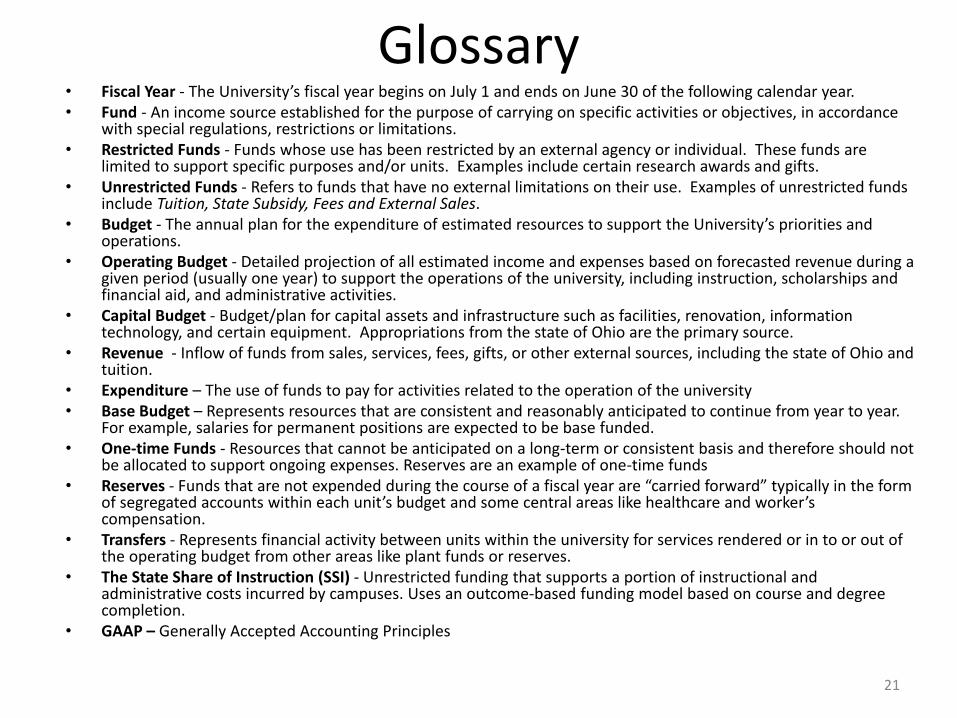
Glossary• Fiscal Year - The University’s fiscal year begins on July 1 and ends on June 30 of the following calendar year.• Fund - An income source established for the purpose of carrying on specific activities or objectives, in accordance
with special regulations, restrictions or limitations.• Restricted Funds - Funds whose use has been restricted by an external agency or individual. These funds are
limited to support specific purposes and/or units. Examples include certain research awards and gifts.• Unrestricted Funds - Refers to funds that have no external limitations on their use. Examples of unrestricted funds
include Tuition, State Subsidy, Fees and External Sales.• Budget - The annual plan for the expenditure of estimated resources to support the University’s priorities and
operations.• Operating Budget - Detailed projection of all estimated income and expenses based on forecasted revenue during a
given period (usually one year) to support the operations of the university, including instruction, scholarships and financial aid, and administrative activities.
• Capital Budget - Budget/plan for capital assets and infrastructure such as facilities, renovation, information technology, and certain equipment. Appropriations from the state of Ohio are the primary source.
• Revenue - Inflow of funds from sales, services, fees, gifts, or other external sources, including the state of Ohio and tuition.
• Expenditure – The use of funds to pay for activities related to the operation of the university• Base Budget – Represents resources that are consistent and reasonably anticipated to continue from year to year.
For example, salaries for permanent positions are expected to be base funded.• One-time Funds - Resources that cannot be anticipated on a long-term or consistent basis and therefore should not
be allocated to support ongoing expenses. Reserves are an example of one-time funds• Reserves - Funds that are not expended during the course of a fiscal year are “carried forward” typically in the form
of segregated accounts within each unit’s budget and some central areas like healthcare and worker’s compensation.
• Transfers - Represents financial activity between units within the university for services rendered or in to or out of the operating budget from other areas like plant funds or reserves.
• The State Share of Instruction (SSI) - Unrestricted funding that supports a portion of instructional and administrative costs incurred by campuses. Uses an outcome‐based funding model based on course and degree completion.
• GAAP – Generally Accepted Accounting Principles
21
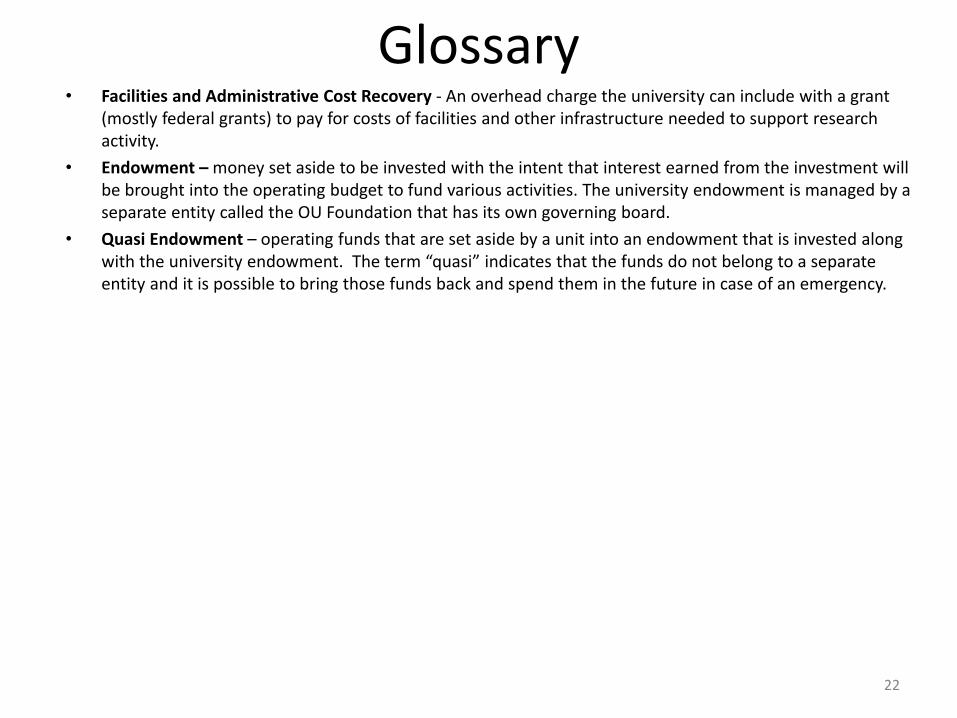
Glossary• Facilities and Administrative Cost Recovery - An overhead charge the university can include with a grant
(mostly federal grants) to pay for costs of facilities and other infrastructure needed to support research activity.
• Endowment – money set aside to be invested with the intent that interest earned from the investment will be brought into the operating budget to fund various activities. The university endowment is managed by a separate entity called the OU Foundation that has its own governing board.
• Quasi Endowment – operating funds that are set aside by a unit into an endowment that is invested along with the university endowment. The term “quasi” indicates that the funds do not belong to a separate entity and it is possible to bring those funds back and spend them in the future in case of an emergency.
22