2018: Issue 632, Week: 21st - 24th May WISEM NEY
20
WISE M NEY 2018: Issue 632, Week: 21st - 24th May A Weekly Update from SMC (For private circulation only) MAY THE FESTIVAL OF RAMADAN BRING CHEER AND PROSPERITY TO YOUR LIFE Brand smc 456
Transcript of 2018: Issue 632, Week: 21st - 24th May WISEM NEY

WISE M NEY2018: Issue 632, Week: 21st - 24th May
A Weekly Update from SMC(For private circulation only)
MAY THE FESTIVAL OF RAMADANBRING CHEER AND PROSPERITYTO YOUR LIFE
Bra
nd s
mc
456

FOR ALL YOUR INVESTMENT NEEDS
EQUITIES & DERIVATIVES
COMMODITY & CURRENCY
REAL ESTATE ADVISORY
WEALTH MANAGEMENT
LIFE & GENERAL INSURANCE
CLEARING SERVICES
INVESTMENT BANKING
IPOs & MUTUAL FUNDS
MORTGAGE ADVISORY
NRI & FPI SERVICES
INSTITUTIONAL BROKING
NBFC FINANCING
1800 11 0909
2,500+2,500+2,500+
500+ 500+ 500+
2,950+2,950+2,950+
D E L H I | M U M B A I | K O L K A T A | A H M E D A B A D | C H E N N A I | B E N G A L U R U | D U B A I
Follow us on
www.smctradeonline.com
[email protected],00,000+18,00,000+18,00,000+
triverse
SMC Global Securities Ltd., CIN No.: L74899DL1994PLC063609 | SMC Comtrade Ltd., CIN : U67120DL1997PLC188881
REGISTERED OFFICE: 11/6-B, Shanti Chamber, Pusa Road, New Delhi - 110005, Tel +91-11-30111000 | For any complaints email- [email protected]
website: www.smctradeonline.com
Insurance is the subject matter of solicitation • All insurance products sold through SMC Insurance Brokers Pvt. Ltd. • Investment Banking Services provided by SMC Capitals Ltd. • Equity PMS and Wealth management services provided by SMC
Investments & Advisors Ltd. • IPOs and Mutual Funds distribution services are provided by SMC Global Securities Ltd. • Financing Services provided by Moneywise Financial Services Pvt Ltd. • Commodity broking services provided by SMC
Comtrade Ltd. • Real Estate Advisory services are offered through SMC Real Estate Advisors Pvt. Ltd.

From The Desk Of Editor
(Saurabh Jain)
SMC Global Securities Ltd. (hereinafter referred to as “SMC”) is a registered Member of National Stock Exchange of India Limited, Bombay Stock Exchange Limited and its associate is member of MCX stock Exchange Limited. It is also registered as a Depository Participant with CDSL and NSDL. Its associates merchant banker and Portfolio Manager are registered with SEBI and NBFC registered with RBI. It also has registration with AMFI as a Mutual Fund Distributor.
SMC is a SEBI registered Research Analyst having registration number INH100001849. SMC or its associates has not been debarred/ suspended by SEBI or any other regulatory authority for accessing /dealing in securities market.
SMC or its associates including its relatives/analyst do not hold any financial interest/beneficial ownership of more than 1% in the company covered by Analyst. SMC or its associates and relatives does not have any material conflict of interest. SMC or its associates/analyst has not received any compensation from the company covered by Analyst during the past twelve months. The subject company has not been a client of SMC during the past twelve months. SMC or its associates has not received any compensation or other benefits from the company covered by analyst or third party in connection with the research report. The Analyst has not served as an officer, director or employee of company covered by Analyst and SMC has not been engaged in market making activity of the company covered by Analyst.
The views expressed are based solely on information available publicly available/internal data/ other reliable sources believed to be true.
SMC does not represent/ provide any warranty express or implied to the accuracy, contents or views expressed herein and investors are advised to independently evaluate the market conditions/risks involved before making any investment decision.
lobal stock markets closed in negative in the week gone by as investors took off
Gsome money on concerns beginning from higher oil prices, to strengthening of 10
year treasury yield in U.S. and trade tensions between the two major nations i.e.
U.S. and China. US Fed will release minutes from its May 2018 policy meeting on
Wednesday, 23 May 2018. The Federal Reserve left its target range for the federal funds
rate steady at 1.5-1.75 percent during its May 2018 meeting, in line with market
expectations. Meanwhile, inflation in Japanese economy slowed for the second month in
April coming at 1.7 percent struggling to hit central bank’s desired level of 2 percent. The
rise in oil prices to the levels not seen in more than three years, however, may result in
higher inflation globally. Japanese economy shrank for the first time in two years in the first
quarter ending March 2018 at an annualised rate of 0.6 percent due to fall in capital
investment and flat private consumption.
Back at home, Industrial production for the month of March came in at 4.4 percent
compared to a year ago, slowest in last five months. Political uncertainty in Karnataka,
higher crude prices and sustained selling by foreign institutional investors in Indian equities
kept pressure on the markets. FMCG companies’ stocks were the favourite among the
investors as major companies including Hindustan Unilever, Britannia, Jyothy Laboratories,
etc. posted good set of numbers with buoyancy in volume growth. Metal companies
especially steel companies posted good set of numbers with Tata Steel and JSW Steel
announcing to expand production to record owing to high prices as result of lower exports
from China and anticipated surge in domestic consumption because of expected spending
from government on infrastructure. Next batch of January to March 2018 quarterly
earnings, trend in global markets, investment by foreign portfolio investors (FPIs) and
domestic institutional investors (DIIs) will dictate trend on the bourses next week. Also the
movement of rupee against the dollar and crude oil prices will be closely watched.
On the commodity market front, Crude prices caught the attention of the entire world once
again. Crude prices have been rising considerably...Brent is just few cents shy away from
$80 mark whereas WTI is hovering near $72. Bullion counter has already witnessed a sharp
fall, may trade in narrow range this week. Gold can face resistance near 31400 levels and
dip lower towards 30600 levels. Crude oil prices can continue to move higher and can test
key level of 5000 while it has key support near 4700. In base metal counter, Nickel may
witness further recovery on expected supply deficit while trade negotiations between US
and China will keep investors jittery. In agri complex, cotton counter is looking better on
improved trading activities. CPI and GDP of UK, FOMC Meeting Minutes, Fed's Powell Joins
Riksbank's 350th Anniversary Conference and Durable Goods Orders, etc are few data and
events scheduled this week, which may be strong triggers for commodities.
Contents
Equity 4-7
Derivatives 8-9
Commodity 10-13
Currency 14
IPO 15
FD Monitor 16
Mutual Fund 17-18
SMC GLOBAL SECURITIES LTD.
REGISTERED OFFICES:
11 / 6B, Shanti Chamber, Pusa Road, New Delhi 110005.
Tel: 91-11-30111000, Fax: 91-11-25754365
MUMBAI OFFICE:
Lotus Corporate Park, A Wing 401 / 402 , 4th Floor ,
Graham Firth Steel Compound, Off Western Express Highway,
Jay Coach Signal, Goreagon (East) Mumbai - 400063
Tel: 91-22-67341600, Fax: 91-22-67341697
KOLKATA OFFICE:
18, Rabindra Sarani, Poddar Court, Gate No-4,5th Floor, Kolkata-700001
Tel.: 033 6612 7000/033 4058 7000, Fax: 033 6612 7004/033 4058 7004
AHMEDABAD OFFICE :
10/A, 4th Floor, Kalapurnam Building, Near Municipal Market,
C G Road, Ahmedabad-380009, Gujarat
Tel : 91-79-26424801 - 05, 40049801 - 03
CHENNAI OFFICE:
Salzburg Square, Flat No.1, III rd Floor, Door No.107, Harrington Road,
Chetpet, Chennai - 600031.
Tel: 044-39109100, Fax -044- 39109111
SECUNDERABAD OFFICE:
315, 4th Floor Above CMR Exclusive, BhuvanaTower,
S D Road, Secunderabad, Telangana-500003
Tel : 040-30031007/8/9
DUBAI OFFICE:
2404, 1 Lake Plaza Tower, Cluster T, Jumeriah Lake Towers,
PO Box 117210, Dubai, UAE
Tel: 97145139780 Fax : 97145139781
Email ID : [email protected]
Printed and Published on behalf of
Mr. Saurabh Jain @ Publication Address
11/6B, Shanti Chamber, Pusa Road, New Delhi-110005
Website: www.smcindiaonline.com
Investor Grievance : [email protected]
Printed at: S&S MARKETING
102, Mahavirji Complex LSC-3, Rishabh Vihar, New Delhi - 110092 (India)
Ph.: +91-11- 43035012, 43035014, Email: [email protected]

NEWS
NOTES:1) These levels should not be confused with the daily trend sheet, which is sent every morning by e-mail in the name
of "Morning Mantra ".2) Sometimes you will find the stop loss to be too far but if we change the stop loss once, we will find more strength
coming into the stock. At the moment, the stop loss will be far as we are seeing the graphs on weekly basis and taking a long-term view and not a short-term view.
TREND SHEET
4
Closing as on 18-05-2018
Stocks *Closing Trend Date Rate SUPPORT RESISTANCE Closing
Price Trend Trend S/l
Changed Changed
S&P BSE SENSEX 34848 UP 27.04.18 34970 33700 33050
NIFTY50 10596 UP 27.04.18 10692 10300 10100
NIFTY IT 13459 UP 21.07.17 10712 12300 11800
NIFTY BANK 25876 UP 04.05.18 25645 24800 24400
ACC 1374 DOWN 02.02.18 1680 1590 1620
BHARTIAIRTEL 361 DOWN 25.01.18 453 430 440
BPCL 386 DOWN 16.02.18 466 410 425
CIPLA 533 UP 20.04.18 589 565 550
SBIN 239 DOWN 16.02.18 272 265 275
HINDALCO 232 DOWN 27.04.18 235 250 255
ICICI BANK* 286 DOWN 01.03.18 305 - 315
INFOSYS 1183 UP 13.04.17 1010 1100 1080
ITC* 282 DOWN 09.03.18 259 - 285
L&T 1316 UP 13.01.17 959 1310 1270
MARUTI* 8511 UP 06.04.18 9206 - 8550
NTPC 167 DOWN 02.02.18 165 172 175
ONGC 185 DOWN 09.03.18 180 190 195
RELIANCE 934 UP 23.06.17 718 920 880
TATASTEEL 591 DOWN 09.03.18 607 620 650
FORTHCOMING EVENTS
EQUITY
Ex-Date Company Purpose
21-May-18 GM Breweries Bonus 1:4
22-May-18 Raymond Dividend- Rs 3 Per Share
23-May-18 GHCL Dividend- Rs 5 Per Share
24-May-18 DCB Bank Dividend- Re 0.75 Per Share
31-May-18 Oberoi Realty Dividend- Rs 2 Per Share
Meeting Date Company Purpose
21-May-18 Colgate-Palm. Quarterly Results
22-May-18 Bata India Quarterly Results,Dividend
22-May-18 Dr Reddy's Labs Dividend,Accounts
22-May-18 St Bk of India Quarterly Results,Dividend
23-May-18 Grasim Inds Accounts,Dividend
23-May-18 Tata Motors Accounts,Quarterly Results
23-May-18 Godrej Inds. Accounts,Dividend,Quarterly Results
23-May-18 Indraprastha Gas Quarterly Results,Dividend
23-May-18 Tata Motors-DVR Accounts,Quarterly Results
24-May-18 GAIL (India) Quarterly Results,Final Dividend
25-May-18 Sun Pharma.Inds. Accounts,Dividend,Quarterly Results
25-May-18 Tech Mahindra Quarterly Results,Dividend
28-May-18 Larsen & Toubro Dividend
28-May-18 Oil India Dividend
28-May-18 NTPC Dividend
29-May-18 M & M Dividend,AGM,Accounts
29-May-18 B H E L Quarterly Results
29-May-18 Coal India Accounts
30-May-18 Berger Paints Quarterly Results,Dividend
30-May-18 S A I L Accounts
DOMESTIC NEWSEconomy• India's trade deficit slightly widened to $13.72 billion in April from
$13.25 billion a year ago. Merchandise exports for April rose 5.2 per cent from a year ago to $25.9 billion.
• Petrol price in the national capital touched Rs 74.95 per litre, a fresh high, since it hit Rs 76.06 a litre in September 2013.
Textile• Himatsingka Seide announced that Himatsingka America Inc., the
wholly owned step down subsidiary of Himatsingka Seide, has acquired the home portfolio of Global Brands Group Holding . The acquired home portfolio includes the exclusive license rights to the famous and iconic Tommy Hilfiger brand, the Copper Fit brand and other brands. This brand portfolio is estimated to contribute Annual Revenues of approximately USD 60 - 65 million to the Group.
Telecom• Bharti Airtel and Amazon India announced a strategic partnership with
an aim to jointly drive smart phone adoption across the country. As part of the partnership, a total cashback of Rs 2600 will be available on over 65 Amazon.in exclusive 4G smartphones from popular device brands including Samsung, OnePlus, Xiaomi, Honour, LG, Lenovo and Moto amongst others.
Automobile• TVS Motor is planning to invest around Rs 6-7 billion in 2018-19. The
proposed capex will be towards product development and on new technologies. The company said its current capacity of 4.8 million units, for two-wheelers, would be sufficient to take care of next one year's growth.
Power• Tata Power Co. is working to revive its troubled 4,000 megawatts (MW)
Mundra power plant, dropping previous plans to sell it for a token Re1.Auto Ancillaries• Precision Camshafts announced that that PCL (International) Holding
B.V., Netherlands, a Wholly Owned Subsidiary of Precision Camshafts has acquired 51% Equity Shareholding in EMOSS Mobile Systems B.V., Netherlands for cash consideration of Euro 7.358 million (approx. Rs 58 crore).
FMCG• Britannia Industries has launched its first export-oriented
manufacturing facility at Mundra. The cream biscuits, short dough biscuits and rusks manufactured at the Gujarat plant will be exported to international markets such as North America, the UK, African countries, Singapore, Australia, New Zealand and Malaysia.
Miscellaneous• Infosys has set up India Trade Connect, a blockchain-based trade
network in India, in partnership with seven lenders, including Axis Bank, ICICI Bank, IndusInd Bank and RBL Bank.
Realty/ Construction• Larsen & Toubro (L&T) said L&T Construction has won orders worth Rs
1,504 crore in the domestic market.
INTERNATIONAL NEWS• US jobless claims rose to 222,000, an increase of 11,000 from the
previous week's unrevised level of 211,000. Economists had expected jobless claims to inch up to 215,000. Meanwhile, the less volatile four-week moving average dipped to 213,250, a decrease of 2,750 from the previous week's unrevised average of 216,000.
• US industrial production climbed by 0.7 percent in April, matching the upwardly revised increase in March. Economists had expected industrial production to rise by 0.6 percent compared to the 0.5 percent growth originally reported for the previous month.
• US housing starts plunged by 3.7 percent to an annual rate of 1.287 million in April after jumping by 3.6 percent to an upwardly revised 1.336 million in March. Economists had expected housing starts to drop to an annual rate of 1.310 million from the 1.319 million originally reported for the previous month.
• Eurozone trade surplus increased in March from a month earlier, as exports grew faster than imports. The seasonally adjusted trade surplus rose to EUR 21.2 billion in March from EUR 20.9 billion in February. Month-on-month, both exports and imports climbed by 0.8 percent and 0.7 percent, respectively in March.
• Eurozone current account surplus fell to a seasonally adjusted EUR 32.0 billion in March from EUR 36.8 billion in February. Moreover, this was the smallest trade surplus since June last year, when it was EUR 24.5 billion.
*Maruti has broken the support of 8700 *Icici Bank has broken the resistance of 305 *ITC has broken the resistance of 280

BSE SENSEX TOP GAINERS & LOSERS (% Change) NSE NIFTY TOP GAINERS & LOSERS (% Change)
SECTORAL INDICES (% Change)
SMC Trend
FMCGHealthcare
Auto BankRealty
Cap GoodsCons Durable
Oil & GasPower
ITMetal
Down SidewaysUp
GLOBAL INDICES (% Change)
INDIAN INDICES (% Change)
SMC Trend
Nifty Sensex BSE Midcap BSE Smallcap Nifty Junior S&P CNX 500
SMC Trend
FTSE 100CAC 40
NasdaqDow jonesS&P 500
NikkeiStrait times
Hang SengShanghai
FII/FPI & DII TRADING ACTIVITY (In Rs. Crores)
5
EQUITY
FII / FPI Activity DII trading activity
-325.44
717.99
-518.47
-699.22
-830.94
1163.35
687.23
531.33
229.06
428.92
-1000.00
-500.00
0.00
500.00
1000.00
1500.00
Friday Monday Tuesday Wednesday Thursday
-1.15-1.09
-1.29
-1.16
-0.93
-1.19
-1.40
-1.20
-1.00
-0.80
-0.60
-0.40
-0.20
0.00
Nifty Sensex BSE Midcap BSE Smallcap Nifty Next 50 S&P CNX 500 -1.89
-1.74
-1.05
-1.44
0.26
-0.58
0.36
-0.76
-1.63
-0.72
-0.06
Auto Index Bankex Cap Goods Index Cons Durable Index
FMCG Index Healthcare Index IT Index Metal Index Oil & Gas Index Power Index Realty Index
-0.28
-0.47
-0.28
0.35
-0.94
-0.58
-0.28
0.82
1.44
-1.50
-1.00
-0.50
0.00
0.50
1.00
1.50
2.00
Nasdaq Comp. Dow Jones S&P 500 Nikkei Strait Times Hang Seng Shanghai Comp. FTSE 100 CAC 40
11.01
4.37 4.19
3.19
2.09
-4.99 -4.91 -4.81 -4.81-4.44
-6.00
-4.00
-2.00
0.00
2.00
4.00
6.00
8.00
10.00
12.00
Bajaj Fin. Hind. Unilever Bajaj Finserv Power Grid Corpn
Wipro Indiabulls Hous. Bharti Airtel ICICI Bank Tata Motors Reliance Inds.
4.18
2.99
2.041.75 1.56
-4.96 -4.93 -4.89 -4.72-4.39
-6.00
-4.00
-2.00
0.00
2.00
4.00
6.00
Hind. Unilever Power Grid Corpn
Wipro Sun Pharma.Inds.
Asian Paints Bharti Airtel Tata Motors-DVR
ICICI Bank Tata Motors Reliance Inds.

Beat the street - Fundamental Analysis
Source: Company Website Reuters CapitalineAbove calls are recommended with a time horizon of 8 to 10 months.
6
EQUITY
Investment Rationale• ITD Cementation India Limited is a leading
construction company in India operating for over eight decades with proven expertise and an excellent track record of delivering integrated services in design, engineering, procurement and construction across multiple lines of business.
• Order book as end of March 31, 2018 stood at Rs 9090.4 crore up from Rs 6602.9 crore as end of March 31, 2017 and Rs 7513.2 crore as end of Dec 2017. Of the order book 69% is PSU's, 24% is government contracts and 7% is private.
• Capex incurred in CY2017 was about Rs 70-80 crore and the company will do similar amount for CY2018. The company has spent a capex of Rs 30 crore in quarter ended Mar 31, 2018.
• The management of the company sees strong business opportunity in India. So, the focus of the company going forward is on segments where the company has strength & capabilities – Marine, MRTS & specialized projects; newer segments where parent has experience & expertise – airport, MRTS, HAM selective road projects under Bharatmala, Sagarmala , high speed bullet train projects as well as bidding for larger & complex projects in collaboration with international majors. The Sagarmala’s estimated investment is of Rs.8 lakh crore, while Bharatmala’s estimated investment is of Rs.10 lakh crore to improve its transport infrastructure continue to receive focus.
• The company’s client base is a healthy mix of government organisations, port authorities, public sector undertakings, large private sector companies, state boards, amongst others. This helps insulate from the risks involved in engaging heavily with clients in a limited category.
• Geographic spread includes Bangladesh,
Cambodia, Laos, Indonesia, Myanmar, Philippines, Madagascar and Taiwan other than India providing ITD Cement with international exposure.
• Net profit of the company rose 86% to Rs 654.73 crore in the quarter ended March 2018 as against Rs 15.26 crore during the previous quarter ended March 2017. Sales went up by 25.1% to Rs 28.38 crore in the quarter ended March 2018 as against Rs 523.44 crore during the previous quarter ended March 2017.
Risk• Infrastructure project are usually subject to
bidding. Price competitiveness determines the allocation of projects. If the Company is unable to bid for, and win projects, it could fail to increase or maintain its order book.
ValuationWith a business model, pillared on a diversified strategic approach, it had developed a strong core of capabilities that enable to drive efficiencies and excellence for clients across projects. Thus, it is expected that the stock will see a price target of Rs.185 in 8 to 10 months time frame on a current P/E of 25.02x and FY Dec-18 (E) earnings of Rs.7.42.
Investment Rationale• ONGC Limited is engaged in the exploration,
development and production of crude oil and natural gas.
• It has drilled 503 wells in FY 18, which is the highest number of wells drilled in last 27 years.Among the 503 wells, 119 exploratory and 384 development wells were drilled. During FY’18, ONGC’s planned capex outlay on drilling activities was Rs 16,038 crore with a target to drill 496 wells including 110 exploratory and 386 development wells. However, the company has drilled 503 wells at a cost of approx Rs 14,200 crore which is 11.5% lower than the budget outlay.
• For FY19, it has set a capex outlay of Rs 17,615 crore on drilling activities. It has set an ambitious target to drill 535 wells, of which 24 are deep-water development wells as part of Cluster-2 development of KG-DWN-98/2 project, off the East-Coast of India.
• During FY19, it would begin producing oil from the Ratna and R-Series oilfield in Mumbai offshore, which it won back after the government cancelled award to Essar Oil. Production form the fields is targeted to start in 2019 with an output of 10,000 barrels per day initially. CCEA had decided to return the fields to its original licensee after contract with Essar could not be concluded even after 20 years.
• Recently, ONGC Videsh-led Indian consortium has been awarded 10% stake in Lower Zakum Concession, Offshore Abu Dhabi. The concession award by the Supreme Petroleum Council (SPC), on behalf of the Abu Dhabi government, to the Abu Dhabi National Oil Company (ADNOC) and the Indian Consortium. The Indian consortium would contribute a sign-up bonus of $600 million to enter the concession for a 10% stake. The concession has a term of 40 years with an effective date of 9 March 2018.
• The current production in the said field is about 400,000 barrels of oil per day (bopd) and Indian consortium annual share shall be about 2 MMT. The field profile is to set to achieve plateau target of 450,000 bopd by 2025. It would marks entry of ONGC Videsh in highly prospective UAE region and is consistent with its stated strategic objective of adding high quality producing assets to its existing E&P portfolio.
Risk• Trajectory of global crude prices• Demand and SupplyValuation:The company has achieved good performance during Q3FY18 and management expects demand for crude oil would continue to rise from the strong consumption growth in petroleum products and prices are expected to firm up sharply. It is expected exploring and other activities would get benefit from free pricing, strong demand and stabilising capacity additions, thus we expect the stock to see a price target of Rs 261 in 8 to 10 months time frame on a target expected P/E of 11x and FY19 (E) earnings of Rs.23.75.
Face Value (Rs.) 5.00
52 Week High/Low 212.90/155.30
M.Cap (Rs. in Cr.) 237479.02
EPS (Rs.) 15.66
P/E Ratio (times) 11.82
P/B Ratio (times) 1.07
Dividend Yield (%) 3.95
Stock Exchange BSE
% OF SHARE HOLDING
VALUE PARAMETERS
ACTUAL ESTIMATE
FY Mar-17 FY Mar-18 FY Mar-19
Revenue 142,149.00 160,249.40 178,416.60
Ebitda 41,852.50 59,206.00 68,938.40
Ebit 24,417.10 33,580.10 41,511.70
Pre-tax Profit 30,449.10 39,557.10 48,289.70
Net Income 19,906.90 25,434.60 30,978.00
EPS 15.51 19.62 24.36
BVPS 169.20 183.31 197.22
RoE 9.80 10.85 12.67
ONGC LIMITED CMP: 185.05 Upside:41%Target Price:261.00
Face Value (Rs.) 1.00
52 Week High/Low 234.90/146.55
M.Cap (Rs. in Cr.) 2698.78
EPS (Rs.) 6.28
P/E Ratio (times) 25.02
P/B Ratio (times) 2.83
Dividend Yield (%) 0.23
Stock Exchange BSE
% OF SHARE HOLDING
VALUE PARAMETERS
ACTUAL ESTIMATE
FY Mar-17 FY Mar-18 FY Mar-19
Revenue 20,605.00 26,888.00 35,259.00
Ebitda 2,715.00 3,106.00 3,925.00
Ebit 2,137.00 2,414.00 3,193.00
Pre-Tax Profit 1,476.00 1,868.00 2,657.00
Net Income 729.26 1,271.00 1,831.00
EPS 4.69 7.42 10.67
BVPS 39.78 62.40 74.51
RoE 16.23 13.30 16.21
P/E Chart
ITD CEMENTATION INDIA LIMITED CMP: 157.10 Upside:18%Target Price: 185.00
P/E Chart
` in cr
` in cr
Foreign
Institutions
Non Promoter Corporate Holding
Promoters
Public & Others
5.4713.25 0 0
67.72
13.56
Foreign
Institutions
Non Promoter Corporate Holding
Promoters
Public & Others
Govt. Holding
0.00
50.00
100.00
150.00
200.00
250.00
300.00
350.00
18-M
ay-1
5
10-J
un-1
5
3-Ju
l-15
28-J
ul-1
5
20-A
ug-1
5
14-S
ep-1
5
12-O
ct-1
5
5-N
ov-1
5
2-D
ec-1
5
28-D
ec-1
5
20-J
an-1
6
15-F
eb-1
6
10-M
ar-1
6
6-Ap
r-16
4-M
ay-1
6
27-M
ay-1
6
21-J
un-1
6
15-J
ul-1
6
9-Au
g-16
2-Se
p-16
29-S
ep-1
6
26-O
ct-1
6
21-N
ov-1
6
14-D
ec-1
6
6-Ja
n-17
1-Fe
b-17
27-F
eb-1
7
23-M
ar-1
7
19-A
pr-1
7
15-M
ay-1
7
7-Ju
n-17
3-Ju
l-17
26-J
ul-1
7
21-A
ug-1
7
14-S
ep-1
7
10-O
ct-1
7
3-N
ov-1
7
28-N
ov-1
7
21-D
ec-1
7
17-J
an-1
8
12-F
eb-1
8
9-M
ar-1
8
5-Ap
r-18
30-A
pr-1
8
9 11 13 15 Close Price
3.54
29.25
3.26
46.64
17.31
-50.00
0.00
50.00
100.00
150.00
200.00
250.00
300.00
350.00
400.00
450.00
500.00
18
-May
-15
22
-Ju
n-1
5
27
-Ju
l-1
5
31
-Au
g-1
5
8-O
ct-1
5
16
-No
v-1
5
22
-De
c-1
5
28
-Jan
-16
3-M
ar-1
6
12
-Ap
r-1
6
20
-May
-16
24
-Ju
n-1
6
1-A
ug
-16
7-S
ep
-16
17
-Oct
-16
22
-No
v-1
6
27
-De
c-1
6
1-F
eb
-17
9-M
ar-1
7
18
-Ap
r-1
7
24
-May
-17
29
-Ju
n-1
7
3-A
ug
-17
11
-Se
p-1
7
17
-Oct
-17
22
-No
v-1
7
29
-De
c-1
7
5-F
eb
-18
14
-Mar
-18
20
-Ap
r-1
8
21 37 53 69 Close Price

Charts by Spider Software India Ltd
EQUITY
Above calls are recommended with a time horizon of 1-2 months
Disclaimer : The analyst and its affiliates companies make no representation or warranty in relation to the accuracy, completeness or reliability of the information contained in its research. The analysis contained in the analyst research is based on numerous assumptions. Different assumptions could result in materially different results.The analyst not any of its affiliated companies not any of their, members, directors, employees or agents accepts any liability for any loss or damage arising out of the use of all or any part of the analysis research.
SOURCE: CAPITAL LINE
The stock closed at Rs 262 on 18th May, 2018. It made a 52-week low at Rs 190 on
23rd March 2018 and a 52-week high of Rs. 347 on 01st December 2017. The 200
days Exponential Moving Average (EMA) of the stock on the daily chart is
currently at Rs 243.74
After forming the double bottom formation on weekly chart at 190 levels, the
stock bounced back sharply and regained momentum above its short and long
term moving averages. Additionally, the stock has also given neckline breakout
above the inverted head and shoulder pattern which is visible on weekly
interval. The hefty volumes with rise in prices suggest that bulls are taking
control over the stock and we may witness more upside in prices in coming
sessions as well. Therefore, one can buy the stock in the range of 260-265 levels
for the upside target of 295-298 levels with SL below 240.
The stock closed at Rs 1565 on 18th May, 2018. It made a 52-week low at Rs 1273
on 31st August 2017 and a 52-week high of Rs. 1709.75 on 18th December 2017.
The 200 days Exponential Moving Average (EMA) of the stock on the daily chart is
currently at Rs 1440.84.
After testing 1700 levels in recent past, the stock witnessed profit booking at
higher levels and retraced back towards its 200 days exponential moving
average on daily interval. Since then consolidation has been seen in prices as
stock was swinging in range of 1320-1465 for more than twelve weeks. This week
we have observed fresh consolidation breakout above the ascending triangle
formation on weekly charts along with marginally higher volumes. Therefore,
one can buy the stock in the range of 1550-1570 levels for the upside target of
1775-1780 levels with SL below 1420.
AIA Engineering Limited (AIAENG)
7
ADF Foods Limited (ADFFOODS)
DERIVATIVES
CHANGE IN NIFTY OPTION OI (IN QTY)
WEEKLY VIEW OF THE MARKET
NIFTY OPTION OI CONCENTRATION (IN QTY)
CHANGE IN BANKNIFTY OPTION OI (IN QTY) (MONTHLY)BANKNIFTY OPTION OI CONCENTRATION (IN QY) (MONTHLY)
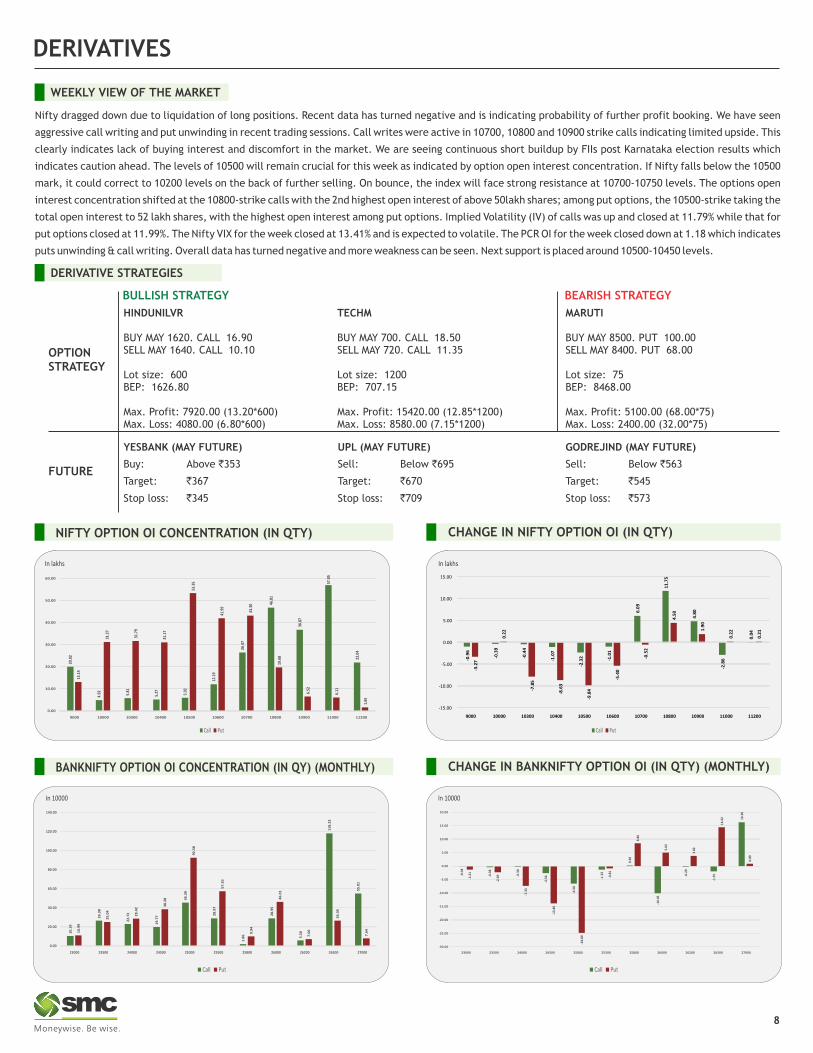
Nifty dragged down due to liquidation of long positions. Recent data has turned negative and is indicating probability of further profit booking. We have seen
aggressive call writing and put unwinding in recent trading sessions. Call writes were active in 10700, 10800 and 10900 strike calls indicating limited upside. This
clearly indicates lack of buying interest and discomfort in the market. We are seeing continuous short buildup by FIIs post Karnataka election results which
indicates caution ahead. The levels of 10500 will remain crucial for this week as indicated by option open interest concentration. If Nifty falls below the 10500
mark, it could correct to 10200 levels on the back of further selling. On bounce, the index will face strong resistance at 10700-10750 levels. The options open
interest concentration shifted at the 10800-strike calls with the 2nd highest open interest of above 50lakh shares; among put options, the 10500-strike taking the
total open interest to 52 lakh shares, with the highest open interest among put options. Implied Volatility (IV) of calls was up and closed at 11.79% while that for
put options closed at 11.99%. The Nifty VIX for the week closed at 13.41% and is expected to volatile. The PCR OI for the week closed down at 1.18 which indicates
puts unwinding & call writing. Overall data has turned negative and more weakness can be seen. Next support is placed around 10500-10450 levels.
In lakhs
In 10000 In 10000
YESBANK (MAY FUTURE)
Buy: Above `353
Target: `367
Stop loss: `345
MARUTI
BUY MAY 8500. PUT 100.00SELL MAY 8400. PUT 68.00
Lot size: 75BEP: 8468.00
Max. Profit: 5100.00 (68.00*75)Max. Loss: 2400.00 (32.00*75)
OPTIONSTRATEGY
FUTURE
TECHM
BUY MAY 700. CALL 18.50SELL MAY 720. CALL 11.35
Lot size: 1200BEP: 707.15
Max. Profit: 15420.00 (12.85*1200)Max. Loss: 8580.00 (7.15*1200)
DERIVATIVE STRATEGIES
UPL (MAY FUTURE)
Sell: Below `695
Target: `670
Stop loss: `709
BULLISH STRATEGY BEARISH STRATEGY
HINDUNILVR
BUY MAY 1620. CALL 16.90SELL MAY 1640. CALL 10.10
Lot size: 600BEP: 1626.80
Max. Profit: 7920.00 (13.20*600)Max. Loss: 4080.00 (6.80*600)
GODREJIND (MAY FUTURE)
Sell: Below `563
Target: `545
Stop loss: `573
8
Call Put Call Put
Call Put Call Put
20.0
2
4.92 5.
81
5.27 5.92
12.1
9
26.4
7
46.8
1
36.8
7
57.0
5
22.0
4
13.1
4
31.2
7
31.7
9
31.1
7
53.3
5
41.9
9
43.3
0
19.6
8
6.52
6.11
1.65
0.00
10.00
20.00
30.00
40.00
50.00
60.00
9000 10000 10300 10400 10500 10600 10700 10800 10900 11000 11200
-0.9
6
-0.3
9
-0.4
4
-1.0
7
-2.3
2 -1.0
1
6.0
9
11
.75
4.8
0
-2.8
6
0.0
4
-3.2
7
0.2
2
-7.8
5
-8.6
3
-9.8
4
-5.4
0
-0.5
2
4.5
0
1.9
0
0.2
2
0.2
1
-15.00
-10.00
-5.00
0.00
5.00
10.00
15.00
9000 10000 10300 10400 10500 10600 10700 10800 10900 11000 11200
10
.19
26
.38
22
.72
19
.77
45
.39
28
.97
1.8
6
28
.95
5.5
0
11
8.2
3
55
.01
10
.99
25
.04
28
.42
38
.28
92
.58
57
.50
9.9
4
46
.01
7.0
6
26
.35
7.6
4
0.00
20.00
40.00
60.00
80.00
100.00
120.00
140.00
23000 23500 24000 24500 25000 25500 25800 26000 26200 26500 27000
-0.0
4
-0.3
8
-0.3
0
-2.5
6
-6.5
0
-1.2
2
0.30
-10.
05
-0.2
9
-1.9
1
16.3
6
-1.2
1
-2.2
9
-7.3
3
-13.
86
-24.
80
-0.8
1
8.46
5.02
3.82
14.4
2
0.89
-30.00
-25.00
-20.00
-15.00
-10.00
-5.00
0.00
5.00
10.00
15.00
20.00
23000 23500 24000 24500 25000 25500 25800 26000 26200 26500 27000
In lakhs
DERIVATIVES
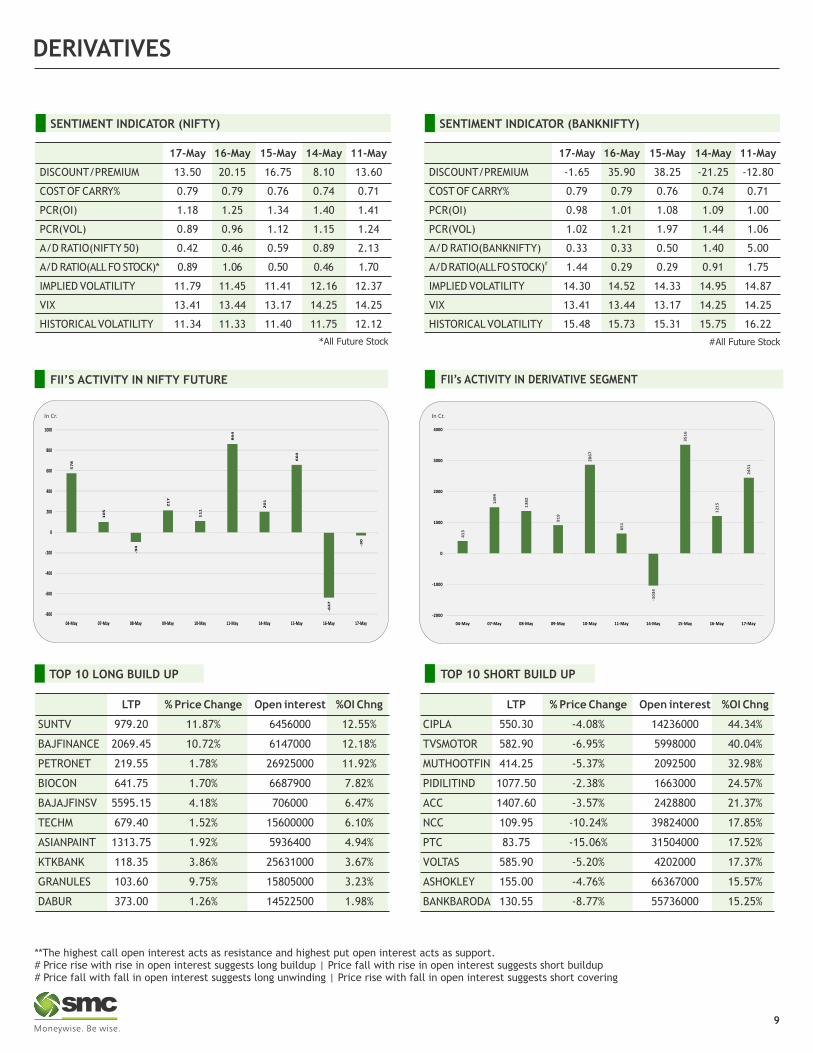
FII’s ACTIVITY IN DERIVATIVE SEGMENT
SENTIMENT INDICATOR (NIFTY)
17-May 16-May 15-May 14-May 11-May
DISCOUNT/PREMIUM 13.50 20.15 16.75 8.10 13.60
COST OF CARRY% 0.79 0.79 0.76 0.74 0.71
PCR(OI) 1.18 1.25 1.34 1.40 1.41
PCR(VOL) 0.89 0.96 1.12 1.15 1.24
A/D RATIO(NIFTY 50) 0.42 0.46 0.59 0.89 2.13
A/D RATIO(ALL FO STOCK)* 0.89 1.06 0.50 0.46 1.70
IMPLIED VOLATILITY 11.79 11.45 11.41 12.16 12.37
VIX 13.41 13.44 13.17 14.25 14.25
HISTORICAL VOLATILITY 11.34 11.33 11.40 11.75 12.12
*All Future Stock
SENTIMENT INDICATOR (BANKNIFTY)
FII’S ACTIVITY IN NIFTY FUTURE
**The highest call open interest acts as resistance and highest put open interest acts as support.# Price rise with rise in open interest suggests long buildup | Price fall with rise in open interest suggests short buildup # Price fall with fall in open interest suggests long unwinding | Price rise with fall in open interest suggests short covering
#All Future Stock
17-May 16-May 15-May 14-May 11-May
DISCOUNT/PREMIUM -1.65 35.90 38.25 -21.25 -12.80
COST OF CARRY% 0.79 0.79 0.76 0.74 0.71
PCR(OI) 0.98 1.01 1.08 1.09 1.00
PCR(VOL) 1.02 1.21 1.97 1.44 1.06
A/D RATIO(BANKNIFTY) 0.33 0.33 0.50 1.40 5.00#A/D RATIO(ALL FO STOCK) 1.44 0.29 0.29 0.91 1.75
IMPLIED VOLATILITY 14.30 14.52 14.33 14.95 14.87
VIX 13.41 13.44 13.17 14.25 14.25
HISTORICAL VOLATILITY 15.48 15.73 15.31 15.75 16.22
9
In Cr. In Cr.
TOP 10 SHORT BUILD UPTOP 10 LONG BUILD UP
LTP % Price Change Open interest %OI Chng
SUNTV 979.20 11.87% 6456000 12.55%
BAJFINANCE 2069.45 10.72% 6147000 12.18%
PETRONET 219.55 1.78% 26925000 11.92%
BIOCON 641.75 1.70% 6687900 7.82%
BAJAJFINSV 5595.15 4.18% 706000 6.47%
TECHM 679.40 1.52% 15600000 6.10%
ASIANPAINT 1313.75 1.92% 5936400 4.94%
KTKBANK 118.35 3.86% 25631000 3.67%
GRANULES 103.60 9.75% 15805000 3.23%
DABUR 373.00 1.26% 14522500 1.98%
LTP % Price Change Open interest %OI Chng
CIPLA 550.30 -4.08% 14236000 44.34%
TVSMOTOR 582.90 -6.95% 5998000 40.04%
MUTHOOTFIN 414.25 -5.37% 2092500 32.98%
PIDILITIND 1077.50 -2.38% 1663000 24.57%
ACC 1407.60 -3.57% 2428800 21.37%
NCC 109.95 -10.24% 39824000 17.85%
PTC 83.75 -15.06% 31504000 17.52%
VOLTAS 585.90 -5.20% 4202000 17.37%
ASHOKLEY 155.00 -4.76% 66367000 15.57%
BANKBARODA 130.55 -8.77% 55736000 15.25%
57
8
10
5
-94
21
7
11
1
86
4
20
1
66
0
-63
7
-30
-800
-600
-400
-200
0
200
400
600
800
1000
04-May 07-May 08-May 09-May 10-May 11-May 14-May 15-May 16-May 17-May
41
3
14
99
13
82
91
9
28
67
65
1
-10
34
35
16
12
15
24
51
-2000
-1000
0
1000
2000
3000
4000
04-May 07-May 08-May 09-May 10-May 11-May 14-May 15-May 16-May 17-May

10
SPICES
Soybean futures (June) is expected to remain stable & consolidate in the range of 3740-3850 levels. Looking at the dwindling inventories the downside in soybean is expected to be limited and if soybean meal demand remains around current pace than there is higher possibility that the counter will continue to trade with an upside bias. Recently, a balance sheet was drawn by the Soybean Processors Association of India (SOPA), which cited that the total availability of soybean during the season 2017-18 (Oct-Sept) was estimated at 96.50 lakh tones, while disposal was estimated at 95.50 lakh tons (retained for sowing 12 lakh tons, 1.50 lakh tons as direct consumption, 2 lakh tons in export and rest 80 lakh tons used from crushing), leaving ending stock at only 1 lakh ton. Refined soy oil futures (June) is likely to trade with a downside bias & remain below 780 levels, while CPO futures (June) might witness profit booking from higher levels facing resistance near 668 levels. The recent edible oil import figures show that during last month 13.86 lakh tonnes of vegetable oils were imported and was reported to be the highest so far during the current oil year (November 2017-October 2018 period). This depicts that the supply side will be comfortable and likely to exert downside pressure on edible oil prices. Mustard seed futures (June) will possibly trade sideways to up in the range of 3850-4050 levels. At the spot markets, the stockists are in wait and watch mode as they want to procure this oilseed at the lower levels, while crushers demand is getting better due to rising demand for mustard oil.
OIL AND OILSEEDS
OTHER COMMODITIES
Chana futures (June) is likely to take support near 3580 levels & the downside may remain capped. In recent times, the government has tightened norms for the import of pulses to ensure the arrest of fall in prices & in the latest move has introduced a quota system only for millers and refiners for the import of tur, moong and urad. These measures are likely to give positive cues to the chana prices. Cotton futures (May) would continue to face resistance near 21000 levels, while on the contrary the downside may remain capped near the support of 20350 levels. The market participants are closely watching many factors from rupee to movement of cotton prices on the international market. The fundamentals are giving a mixed picture because on one side, rupee is hovering near its yearly low against the dollar and giving a hope to the Indian exports a prospect of higher exports, while on the contrary the uptrend of international cotton prices has paused as the weather conditions in Texas are in favour of the crop. In the domestic market, the main buyers of cotton at present are medium-small mills, while big mills are mostly sidelined as they have procured sufficient stocks to meet their demand. Mentha oil futures (June) is likely to witness a downside momentum & can even test 1120-1100 levels. In days to come, the counter will face a selling pressure as the arrivals from the new crop are expected to gain pace on the spot markets of Sambhal & Barabanki. For this year, the output of mentha oil is estimated at 40,000-42,000 tons, up nearly 35% on year.
Bullion counter may continue to witness selling pressure as surge in greenback
and rising US yields is keeping prices under pressure but short covering can be
seen lower levels. Investors will focus their attention towards fed Chair Powell
speech and FOMC meeting minutes of last meeting in this week. Meanwhile
geopolitical tensions such as Iran sanctions and between US and North Korea
can cap the downside to some extent. Sharp depreciation in local currency
rupee has curtailed the fall on domestic bourses to larger extent as it has
depreciated by nearly 6% so far in 2018. This week expected decrease in US
PMI and durable goods order data can cap the downside. Gold can face
resistance near 31400 levels and dip lower towards 30600 levels. While silver
can take support near 39500 levels and can face resistance near 40500 levels.
US 10 year treasury yields extended their climb last week above 3.10% as
higher growth and inflation expectations, along with concerns of a more
aggressive Federal Reserve weighed on appetite for U.S. government bonds.
Sharp fall in euro amid political uncertainty in Italy is also pushing the
greenback higher. U.S. President Donald Trump acknowledged that it was
unclear, if his summit with North Korea would go ahead after Pyongyang
threatened to pull out of the unprecedented meeting. St. Louis Federal
Reserve Bank President James Bullard believes that Fed's policy rate is "pretty
close" to neutral, and that further rate hikes would act to slow economic
growth and push downward on inflation.
BULLIONS
Crude oil price may continue its steady upside on supply concerns after US imposed fresh sanctions on Iran coupled with drop in the US stockpiles. However, profit booking cannot be denied at higher levels on increasing US production and on lower demand estimates by IEA. The International Energy Agency cut forecasts for global oil demand growth in 2018 as the highest prices in three years put a brake on consumption. OPEC and its allies have finally succeeded in their 16-month campaign to clear a global oil glut, with inventories falling below their five-year average for the first time since 2014. Besides lowering its demand outlook, stronger prices also prompted the IEA to increase estimates for supply from OPEC’s rivals, particularly the U.S. Production outside the Organization of Petroleum Exporting Countries will grow by 1.87 million barrels a day this year, or 85,000 a day more than previously thought. Crude oil prices can continue to move higher and can test key level of 5000 while it has key support near 4700. Natural gas can continue to show recovery on weather related demand as it can test 198 while it has key support near 185 levels. U.S. natural gas jumped to three-month high on prospects that warm weather expected for the next few weeks will boost air conditioning demand enough to limit the amount of gas available to go into storage. EIA reported that working gas in storage was 1,538 Bcf on May 11, 2018, which represents a net increase of 106 Bcf from the penultimate week and the expectations were for a 105 Bcf build.
ENERGY COMPLEX
In base metal counter, Nickel may witness further recovery on expected supply deficit while trade negotiations between US and China will keep investors jittery. Copper can face resistance near 467 and can slip lower towards 455. China's refined copper output in April jumped 12.3 percent compared to same period last year to 778,000 tonnes. Japanese copper miners JX Nippon Mining & Metals and Sumitomo Metal Mining plan to increase output from their mines in Chile this year, but are facing challenges in bringing them to full capacity and meeting profit targets Zinc may trade sideways as it can take support near 204-206 levels and can face resistance near 215 levels. Chinese steel and iron ore recovered to an eight-week high as the outlook for steel demand remained upbeat. With construction activity in China in full swing, steel inventories have continuously fallen since March and production by Chinese mills jumped in April to the highest daily average in four years. Nickel prices can take support near 970 and can recover towards 1040. According to the International Nickel Study Group, “The global nickel market deficit widened to 15,700 tonnes in March from a revised deficit of 6,600 tonnes in the previous month”. Lead may continue to show recovery as it can take support near 158 and recover towards 166. Aluminium can trade on mixed path as it can take support near 148 and resistance near 160 in MCX. On-warrant aluminium stocks in warehouses certified by the London Metal Exchange inventories that are not earmarked for delivery surged by 153,075 tonnes last week.
A consolidation can be seen in turmeric futures (June) as it may trade in the
range of 7000-7600 levels. There is a still selling pressure over the counter and
also the buying has slowed down due to the inflow of inferior quality produce
and slack upcountry demand. In Nizamabad, the arrival of turmeric has
decreased and in other markets also, arrivals are declining, but due to the
extremely hot weather, very few buyers are now active in the markets. Such a
phenomenon can be seen for the next fortnight. This year, the demand has
also risen on the exports front and also from the ayurvedic medicine and
cosmetic industries. At present, good quality and dried turmeric is being seen
in the markets and in the coming days, in view of the uptrend, traders and
stockiest can be seen active for stocking. Jeera futures (June) is likely to face
resistance near 16300 levels & the upside may remain capped. The market
participants are cautious and they expect a correction in near term as the new
crop in Syria and Turkey will start from June to July, which may exert a
downside pressure over the counter. In news, the Spices Board of India has
tightened the norms for mandatory sampling and testing of jeera. Coriander
futures (June) will possibly witness a strong upside towards 5000-5050 levels,
as soon as it surpasses the resistance near 4920 levels. At the spot markets,
the traders are actively buying the dry coriander for sowing, so that they can
provide good seeds to the farmers, before the onset of monsoon.
BASE METALS
11
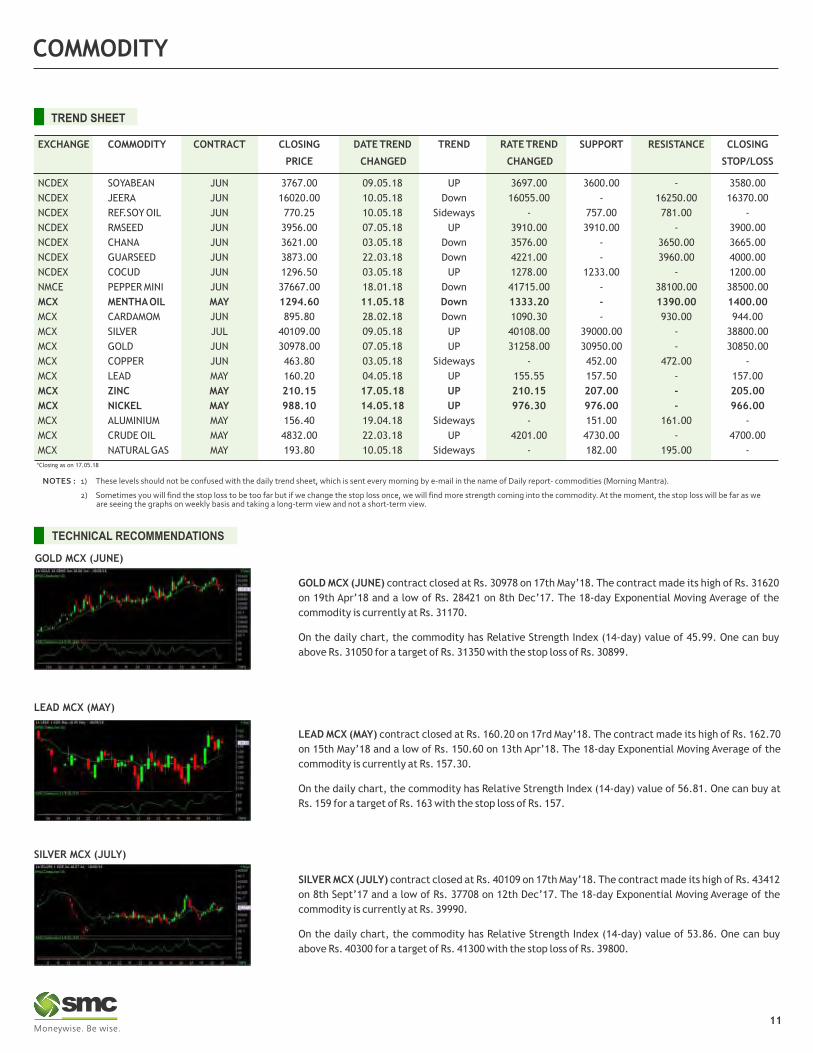
TECHNICAL RECOMMENDATIONS
GOLD MCX (JUNE) contract closed at Rs. 30978 on 17th May’18. The contract made its high of Rs. 31620
on 19th Apr’18 and a low of Rs. 28421 on 8th Dec’17. The 18-day Exponential Moving Average of the
commodity is currently at Rs. 31170.
On the daily chart, the commodity has Relative Strength Index (14-day) value of 45.99. One can buy
above Rs. 31050 for a target of Rs. 31350 with the stop loss of Rs. 30899.
LEAD MCX (MAY) contract closed at Rs. 160.20 on 17rd May’18. The contract made its high of Rs. 162.70
on 15th May’18 and a low of Rs. 150.60 on 13th Apr’18. The 18-day Exponential Moving Average of the
commodity is currently at Rs. 157.30.
On the daily chart, the commodity has Relative Strength Index (14-day) value of 56.81. One can buy at
Rs. 159 for a target of Rs. 163 with the stop loss of Rs. 157.
SILVER MCX (JULY) contract closed at Rs. 40109 on 17th May’18. The contract made its high of Rs. 43412
on 8th Sept’17 and a low of Rs. 37708 on 12th Dec’17. The 18-day Exponential Moving Average of the
commodity is currently at Rs. 39990.
On the daily chart, the commodity has Relative Strength Index (14-day) value of 53.86. One can buy
above Rs. 40300 for a target of Rs. 41300 with the stop loss of Rs. 39800.
GOLD MCX (JUNE)
LEAD MCX (MAY)
SILVER MCX (JULY)
TREND SHEET
*Closing as on 17.05.18
EXCHANGE COMMODITY CONTRACT CLOSING DATE TREND TREND RATE TREND SUPPORT RESISTANCE CLOSING
PRICE CHANGED CHANGED STOP/LOSS
NCDEX SOYABEAN JUN 3767.00 09.05.18 UP 3697.00 3600.00 - 3580.00
NCDEX JEERA JUN 16020.00 10.05.18 Down 16055.00 - 16250.00 16370.00
NCDEX REF.SOY OIL JUN 770.25 10.05.18 Sideways - 757.00 781.00 -
NCDEX RMSEED JUN 3956.00 07.05.18 UP 3910.00 3910.00 - 3900.00
NCDEX CHANA JUN 3621.00 03.05.18 Down 3576.00 - 3650.00 3665.00
NCDEX GUARSEED JUN 3873.00 22.03.18 Down 4221.00 - 3960.00 4000.00
NCDEX COCUD JUN 1296.50 03.05.18 UP 1278.00 1233.00 - 1200.00
NMCE PEPPER MINI JUN 37667.00 18.01.18 Down 41715.00 - 38100.00 38500.00
MCX MENTHA OIL MAY 1294.60 11.05.18 Down 1333.20 - 1390.00 1400.00
MCX CARDAMOM JUN 895.80 28.02.18 Down 1090.30 - 930.00 944.00
MCX SILVER JUL 40109.00 09.05.18 UP 40108.00 39000.00 - 38800.00
MCX GOLD JUN 30978.00 07.05.18 UP 31258.00 30950.00 - 30850.00
MCX COPPER JUN 463.80 03.05.18 Sideways - 452.00 472.00 -
MCX LEAD MAY 160.20 04.05.18 UP 155.55 157.50 - 157.00
MCX ZINC MAY 210.15 17.05.18 UP 210.15 207.00 - 205.00
MCX NICKEL MAY 988.10 14.05.18 UP 976.30 976.00 - 966.00
MCX ALUMINIUM MAY 156.40 19.04.18 Sideways - 151.00 161.00 -
MCX CRUDE OIL MAY 4832.00 22.03.18 UP 4201.00 4730.00 - 4700.00
MCX NATURAL GAS MAY 193.80 10.05.18 Sideways - 182.00 195.00 -
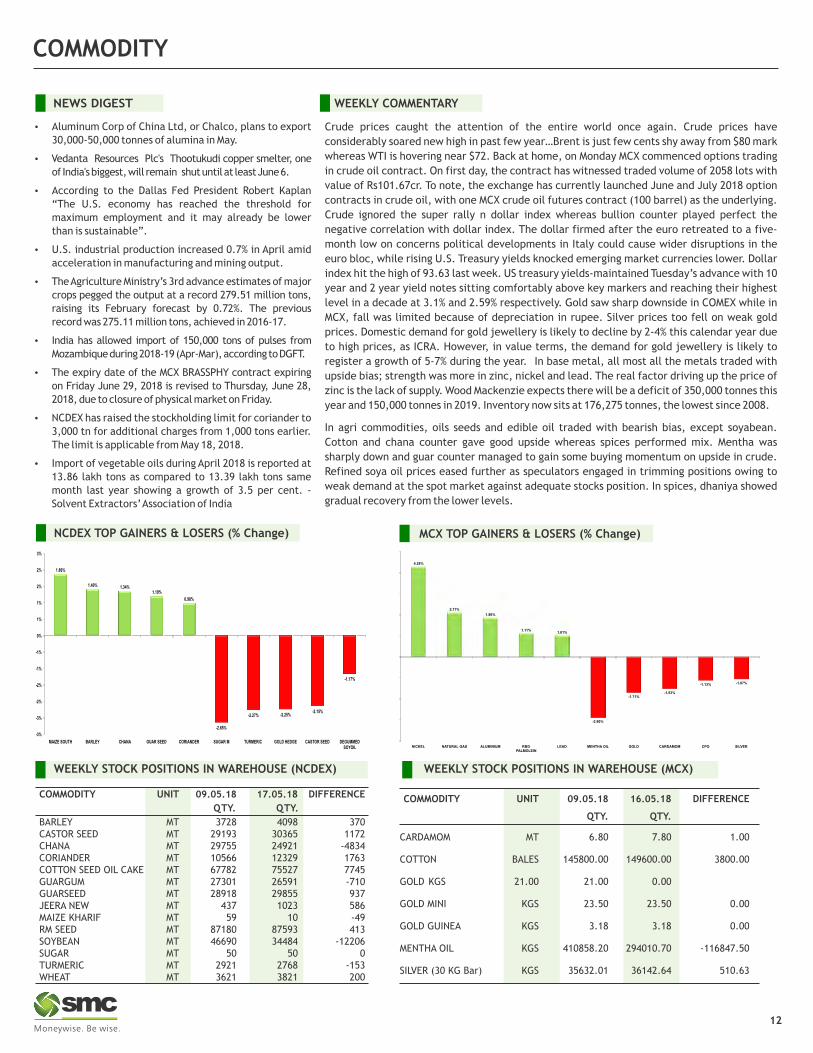
NEWS DIGEST
Crude prices caught the attention of the entire world once again. Crude prices have
considerably soared new high in past few year…Brent is just few cents shy away from $80 mark
whereas WTI is hovering near $72. Back at home, on Monday MCX commenced options trading
in crude oil contract. On first day, the contract has witnessed traded volume of 2058 lots with
value of Rs101.67cr. To note, the exchange has currently launched June and July 2018 option
contracts in crude oil, with one MCX crude oil futures contract (100 barrel) as the underlying.
Crude ignored the super rally n dollar index whereas bullion counter played perfect the
negative correlation with dollar index. The dollar firmed after the euro retreated to a five-
month low on concerns political developments in Italy could cause wider disruptions in the
euro bloc, while rising U.S. Treasury yields knocked emerging market currencies lower. Dollar
index hit the high of 93.63 last week. US treasury yields-maintained Tuesday’s advance with 10
year and 2 year yield notes sitting comfortably above key markers and reaching their highest
level in a decade at 3.1% and 2.59% respectively. Gold saw sharp downside in COMEX while in
MCX, fall was limited because of depreciation in rupee. Silver prices too fell on weak gold
prices. Domestic demand for gold jewellery is likely to decline by 2-4% this calendar year due
to high prices, as ICRA. However, in value terms, the demand for gold jewellery is likely to
register a growth of 5-7% during the year. In base metal, all most all the metals traded with
upside bias; strength was more in zinc, nickel and lead. The real factor driving up the price of
zinc is the lack of supply. Wood Mackenzie expects there will be a deficit of 350,000 tonnes this
year and 150,000 tonnes in 2019. Inventory now sits at 176,275 tonnes, the lowest since 2008.
In agri commodities, oils seeds and edible oil traded with bearish bias, except soyabean.
Cotton and chana counter gave good upside whereas spices performed mix. Mentha was
sharply down and guar counter managed to gain some buying momentum on upside in crude.
Refined soya oil prices eased further as speculators engaged in trimming positions owing to
weak demand at the spot market against adequate stocks position. In spices, dhaniya showed
gradual recovery from the lower levels.
WEEKLY COMMENTARY
NCDEX TOP GAINERS & LOSERS (% Change) MCX TOP GAINERS & LOSERS (% Change)
12
COMMODITY UNIT 09.05.18 16.05.18 DIFFERENCE
QTY. QTY.
CARDAMOM MT 6.80 7.80 1.00
COTTON BALES 145800.00 149600.00 3800.00
GOLD KGS 21.00 21.00 0.00
GOLD MINI KGS 23.50 23.50 0.00
GOLD GUINEA KGS 3.18 3.18 0.00
MENTHA OIL KGS 410858.20 294010.70 -116847.50
SILVER (30 KG Bar) KGS 35632.01 36142.64 510.63
WEEKLY STOCK POSITIONS IN WAREHOUSE (MCX)
COMMODITY UNIT 09.05.18 17.05.18 DIFFERENCE
QTY. QTY.
BARLEY MT 3728 4098 370CASTOR SEED MT 29193 30365 1172CHANA MT 29755 24921 -4834CORIANDER MT 10566 12329 1763COTTON SEED OIL CAKE MT 67782 75527 7745GUARGUM MT 27301 26591 -710GUARSEED MT 28918 29855 937JEERA NEW MT 437 1023 586MAIZE KHARIF MT 59 10 -49RM SEED MT 87180 87593 413SOYBEAN MT 46690 34484 -12206SUGAR MT 50 50 0TURMERIC MT 2921 2768 -153WHEAT MT 3621 3821 200
WEEKLY STOCK POSITIONS IN WAREHOUSE (NCDEX)
Aluminum Corp of China Ltd, or Chalco, plans to export
30,000-50,000 tonnes of alumina in May.
V edanta Resources Plc's Thootukudi copper smelter, one
of India's biggest, will remain shut until at least June 6.
According to the Dallas Fed President Robert Kaplan
“The U.S. economy has reached the threshold for
maximum employment and it may already be lower
than is sustainable”.
U.S. industrial production increased 0.7% in April amid
acceleration in manufacturing and mining output.
T he Agriculture Ministry’s 3rd advance estimates of major
crops pegged the output at a record 279.51 million tons,
raising its February forecast by 0.72%. The previous
record was 275.11 million tons, achieved in 2016-17.
India has allowed import of 150,000 tons of pulses from
Mozambique during 2018-19 (Apr-Mar), according to DGFT.
T he expiry date of the MCX BRASSPHY contract expiring
on Friday June 29, 2018 is revised to Thursday, June 28,
2018, due to closure of physical market on Friday.
NCDEX has raised the stockholding limit for coriander to
3,000 tn for additional charges from 1,000 tons earlier.
The limit is applicable from May 18, 2018.
Import of vegetable oils during April 2018 is reported at
13.86 lakh tons as compared to 13.39 lakh tons same
month last year showing a growth of 3.5 per cent. -
Solvent Extractors’ Association of India
1.86%
1.40% 1.34%1.19%
0.98%
-3%
-3%
-2%
-2%
-1%
-1%
0%
1%
1%
2%
2%
3%
MAIZE SOUTH BARLEY CHANA GUAR SEED CORIANDER SUGAR M TURMERIC GOLD HEDGE CASTOR SEED DEGUMMED SOYOIL
-2.65%
-2.27% -2.25%-2.15%
-1.17%
4.28%
2.11%
1.86%
1.11%1.01%
-2.90%
-1.71%-1.53%
-1.13% -1.07%
NICKEL NATURAL GAS ALUMINIUMPALMOLEIN
LEAD MENTHA OIL GOLD CARDAMOM CPO SILVER

COMMODITY
PRICES OF METALS IN LME/ COMEX/ NYMEX (in US $)
WEEKLY STOCK POSITIONS IN LME (IN TONNES)
INTERNATIONAL COMMODITY PRICES
SPOT PRICES (% change) 3rd Advance Estimates of 2017-18: Foodgrain Production on uncharted territory
13
COMMODITY EXCHANGE CONTRACT UNIT 11.05.18 17.05.18 CHANGE(%)
Soybean CBOT JULY Dollars Per Bushel 9.95 9.95 0.03
Soy oil CBOT JULY Cents per Pound 31.17 30.94 -0.74
CPO* BMD AUG MYR per MT 2416.00 2432.00 0.66
Cotton ICE JULY Cents per Pound 84.62 85.03 0.48
COMMODITY EXCHANGE CONTRACT 11.05.18 17.05.18 CHANGE%
ALUMINIUM LME CASH 2273.50 2280.00 0.29
COPPER LME CASH 6869.00 6838.00 -0.45
LEAD LME CASH 2332.00 2325.00 -0.30
NICKEL LME CASH 13910.00 14580.00 4.82
ZINC LME CASH 3080.00 3053.00 -0.88
GOLD COMEX JUNE 1320.70 1289.40 -2.37
SILVER COMEX JULY 16.75 16.48 -1.62
LIGHT CRUDE OIL NYMEX JUNE 70.68 71.57 1.26
NATURAL GAS NYMEX JUNE 2.81 2.86 1.89
COMMODITY STOCK POSITION STOCK POSITION DIFFERENCE
10.05.18 17.05.18
ALUMINIUM 1276450 1243175 -33275
COPPER 293025 290825 -2200
NICKEL 313446 307668 -5778
LEAD 132050 131825 -225
ZINC 235350 232450 -2900
As per the 3rd Advance Estimates of production of major crops for 2017-18,
released by the Department of Agriculture, Cooperation and Farmers Welfare on
Wednesday, 16th May, 2018, the total foodgrains production in the country is
estimated at 279.51 million tonnes which is higher by 4.40 million tonnes than the
previous record production of foodgrain of 275.11 million tonnes achieved during
2016-17. The current year’s production is also higher by 19.33 million tonnes than
the previous five years’ (2012-13 to 2016-17) average production of foodgrains.
Total production of Rice during 2017-18 is estimated at record 111.52 million
tonnes. Production of rice has increased by 1.82 million tonnes than the
production of 109.70 million tonnes during 2016-17. It is also higher by 5.22 million
tonnes than the last five years’ average production of 106.29 million tonnes.
Production of Wheat during 2017-18 is estimated at record 98.61 million tonnes is higher
by 0.10 million tonnes as compared to wheat production of 98.51 million tonnes
achieved during 2016-17. Further, the production of wheat during 2017-18 is higher by
5.28 million tonnes than the average wheat production of the last five years.
Production of Coarse Cereals during 2017-18 is estimated at record 44.87 million
tonnes is higher by 1.10 million tonnes as compared to their production of 43.77
million tonnes achieved during 2016-17.
Total Pulses production during 2017-18 is estimated at record 24.51 million tonnes
which is higher by 1.37 million tonnes than the previous year’s production of 23.13
million tonnes. The higher minimum support price (MSP) offered by the
government encouraged farmers to increase acreage of pulses. Total Oilseeds
production in the country during 2017-18 is estimated at 30.64 million tonnes
which is lower by 0.64 million tonnes than the production of 31.28 million tonnes
during 2016-17. Production of Cotton during 2017-18 estimated at 34.86 million
bales (of 170 kg each) is higher by 2.28 million bales than the previous year’s
production of 32.58 million bales.
Buoyed by the forecast of a normal monsoon in 2018, the agriculture ministry has
targeted a record 283.7 million tonnes of foodgrain production in 2018-19.
Although the bumper production spells good for farmers, government and for
better economic growth, but not always a guarantee for cheering farmers.
Adequate supply of agriculture produce keep food inflation under check, but it
also weigh on prices to slide below the production cost that increase the misery of
farmers. The government has also to be face a daunting task of ensuring farmers a
fair and remunerative price for their produce.
Recently due to bumper production estimates of chana due to higher acreage
driven by higher MSP, the mandi prices of chana nosedived below production costs
and MSP of Rs 4400. The lack of procurement processes and infrastructure are
forcing farmers to distress sell their produce in the open market.
*Closing as on 14.05.18
-6.27
-3.08
-2.43
-2.13
-1.04
-1.01
-0.98
-0.82
0.51
0.24
0.14
0.11
0.16
0.18
0.64
0.69
GUR (MUZAFFARNGR.)
SUGAR (KOLKATA)
TURMERIC (NIZAMABAD)
COTTON SEED OIL CAKE (AKOLA)
COTTON (KADI)
SOYABEAN (INDORE)
RAW JUTE (KOLKATA)
CRUDE PALM OIL (KANDLA)
WHEAT (DELHI)
PEPPER MALABAR GAR (KOCHI)
JEERA (UNJHA)
GUAR GUM (JODHPUR)
CORIANDER (KOTA)
BARLEY (JAIPUR)
MUSTARD (JAIPUR)
GUAR SEED (JODHPUR)
Food grain prodution in india
218.11
234.47
244.49
259.29 257.13265.04
252.02 251.57
275.11279.51
50
100
150
200
250
300
2008 -09 2009 -10 2010 -11 2011 -12 2012 -13 2013 -14 2014 -15 2015 -16 2016 -17 2017 -18(est.)
Source : MOA
CURRENCY
Currency Table
Currency Pair Open High Low Close
USD/INR 67.35 68.29 67.31 67.77
EUR/INR 80.64 81.23 79.90 79.98
GBP/INR 91.54 92.35 91.35 91.46
JPY/INR 61.66 62.12 61.21 61.29
News Flows of last week
EUR/INR (MAY) contract closed at 79.89 on 17th May’ 18. The contract made its high of 81.23 on 15th May’18 and a low of 79.90 on 17th May’18 (Weekly Basis). The 14-day Exponential Moving Average of the EUR/INR is currently at 80.55.
On the daily chart, EUR/INR has Relative Strength Index (14-day) value of 43.01.One can sell below 80.10 for a target of 79.10 with the stop loss of 80.60.
(* NSE Currency future, Source: Reliable, Open: Monday 9.00 AM IST, Close: Thursday (5.00 PM IST)
15th May U.S. Retail Sales rise 0.3% in April
16th May Euro Zone April inflation slowdown confirmed
16th May U.S. industrial production rose in April
17th May Japan core machinery orders fall in March, capex recovery seen intact
18th May U.S. Jobless claims rose by 11,000 in Latest Week
18th May Japan’s inflation slows for a second month
Market Stance
Once again rupee continued its journey towards south and plunged sharply
against the dollar in the week gone by to test 16 month low as emerging
market currencies witnessed selloff on the back of firm dollar overseas. The
dollar hovered near a five-month high against a group of major currencies as a
surge in the benchmark 10-year Treasury yield above 3 per cent reignited a
rally that had lost steam last week. The dollar has gained since mid-April as
easing tensions in the Korean Peninsula and moves by China and the United
States to avoid a full-blown trade war allowed investors to focus on the yield
advantage the United States enjoys over other countries. The advance stalled
last week after weaker-than-expected April US inflation data, but regained
traction overnight as strong US consumer spending numbers sent long-term
Treasury yields surging to a seven-year peak of 3.095 per cent .
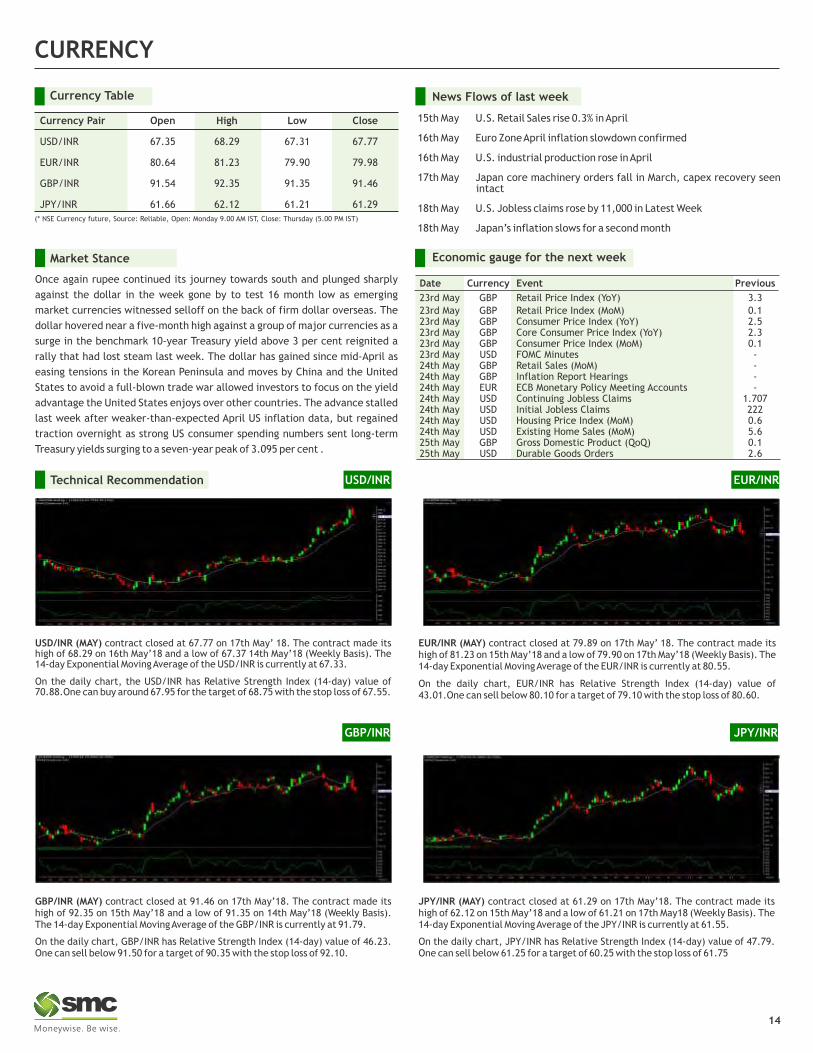
USD/INR (MAY) contract closed at 67.77 on 17th May’ 18. The contract made its high of 68.29 on 16th May’18 and a low of 67.37 14th May’18 (Weekly Basis). The 14-day Exponential Moving Average of the USD/INR is currently at 67.33.
On the daily chart, the USD/INR has Relative Strength Index (14-day) value of 70.88.One can buy around 67.95 for the target of 68.75 with the stop loss of 67.55.
GBP/INR (MAY) contract closed at 91.46 on 17th May’18. The contract made its high of 92.35 on 15th May’18 and a low of 91.35 on 14th May’18 (Weekly Basis). The 14-day Exponential Moving Average of the GBP/INR is currently at 91.79.
On the daily chart, GBP/INR has Relative Strength Index (14-day) value of 46.23. One can sell below 91.50 for a target of 90.35 with the stop loss of 92.10.
JPY/INR (MAY) contract closed at 61.29 on 17th May’18. The contract made its high of 62.12 on 15th May’18 and a low of 61.21 on 17th May18 (Weekly Basis). The 14-day Exponential Moving Average of the JPY/INR is currently at 61.55.
On the daily chart, JPY/INR has Relative Strength Index (14-day) value of 47.79. One can sell below 61.25 for a target of 60.25 with the stop loss of 61.75
USD/INRTechnical Recommendation
Economic gauge for the next week
Date Currency Event Previous
23rd May GBP Retail Price Index (YoY) 3.3
23rd May GBP Retail Price Index (MoM) 0.123rd May GBP Consumer Price Index (YoY) 2.523rd May GBP Core Consumer Price Index (YoY) 2.323rd May GBP Consumer Price Index (MoM) 0.123rd May USD FOMC Minutes -24th May GBP Retail Sales (MoM) -24th May GBP Inflation Report Hearings -24th May EUR ECB Monetary Policy Meeting Accounts -24th May USD Continuing Jobless Claims 1.70724th May USD Initial Jobless Claims 22224th May USD Housing Price Index (MoM) 0.624th May USD Existing Home Sales (MoM) 5.625th May GBP Gross Domestic Product (QoQ) 0.125th May USD Durable Goods Orders 2.6
GBP/INR JPY/INR
14
EUR/INR

IPO
IPO NEWS
Montecarlo files Rs 550-cr IPO papers with Sebi
Construction company Montecarlo Ltd has filed draft papers with capital markets regulator Sebi to raise an estimated Rs 550 crore through an initial public offer. The IPO comprises fresh issuance of shares worth Rs 450 crore besides an offer for sale of up to 30 lakh equity stocks by existing shareholder Kanubhai M Patel Trust, as per the draft papers. According to merchant banking sources, the initial public offer (IPO) is expected to fetch Rs 550 crore. Proceeds of the issue will be utilised towards investment in the company's projects, to meet working capital requirements and for other general corporate purposes. Edelweiss Financial Services, Axis Capital and IDFC Bank will manage the company's public issue. The Ahmedabad-based firm has more than two decades of execution experience having completed 67 EPC (engineering, procurement, construction) projects. As of December 31, 2017, they have an order book of Rs 5,300 crore. Subsequent to December 2017, the firm has been awarded 11 new infrastructure construction and development projects.
Fine Organic gets Sebi’s nod for IPO
Fine Organic Industries has received capital markets regulator Sebi’s approval to float initial public offerings. Fine Organic had filed IPO papers in February and had obtained Sebi’s “observations” on 11 May. Going by the draft papers, Fine Organic’s IPO will see sale of up to 76,64,994 equity shares by the existing shareholders. Established in 1970, the Mumbai-based firm is a leading producer of speciality additives for foods, plastics, rubbers, paints, inks, cosmetics, coatings, textile auxiliaries, lubes and several other speciality applications. JM Financial and Edelweiss Financial Service will manage the company’s public issue.
Devi Seafoods gets Sebi’s nod for IPO
Devi Seafoods has received capital markets regulator Sebi’s approval to float initial public offerings. Devi Seafoods had filed IPO papers in March, and has obtained Sebi’s “observations” on 11 May. Devi Seafoods’ IPO will see sale of shares by the company’s promoters P Brahmanandam, P Suryavathi, P Rama Devi and N Naveena, preliminary papers filed with Sebi showed. The public offer is expected to fetch Rs900 crore, according to merchant banking sources. Axis Capital, ICICI Securities and Kotak Mahindra Capital Company will manage the company’s public issue.
PN Gadgil and Sons confirms IPO listing; files fresh DRHP with SEBI
City based jeweler, PN Gadgil and Sons, has filed a draft red herring prospectus with SEBI. The DRHP says that PNG & Sons promoted by Govind Viswanath Gadgil and Renu Govind Gadgil, would be driving a book-building exercise for issue of shares in the face value of Rs 10 each, and aggregating to a total of Rs 5000 million. The other details such as the date of the IPO, and price-bands are yet to be finalized. The proceeds from the issue will be utilized to finance establishment of new stores and repayment of "certain indebtedness". The company also believes that the issue will help it enhance its visibility and its brand image among existing and potential customers. From the proceeds of Rs 5000 million, Rs 2557.40 million would be used to finance proposed new stores. Under its store expansion plan, the group has envisaged 15 new retail stores at 15 locations in Maharashtra and/or adjoining states. "We further intend to expand our footprint by increasing our store count to 29 by end of FY2019 and 40 by end of FY2020" reads the DRHP.
Orient Electric lists at Rs 135 post demerger with Orient Paper
Shares of Orient Electric were listed at Rs 135 on the NSE following its demerger with Orient Paper. At the listing price, it went on to Rs 142-levels and then settled around its listing levels. The listing follows the demerger of the company from Orient Paper & Industries Limited last year. As per the scheme of arrangement between Orient Paper & Industries Limited and Orient Electric Limited and their respective shareholders and creditors, the Consumer Electric Business of Orient Paper & Industries Ltd was transferred to Orient Electric. Orient Electric Limited issued to the shareholders of Orient Paper & Industries Limited, one equity share of Re. 1/- each of Orient Electric Limited for every share of Re 1/- each held in Orient Paper & Industries Limited, as on the record date of 12th January 2018. The issued, subscribed and paid-up equity capital of the company post arrangement is Rs. 21.22 crore, the company said in a statement.
*Closing price as on 17-05-2018
Company Sector M.Cap (In Rs Cr.) Issue Size (in Rs Cr.) List Date Issue Price List Price Last Price %Gain/Loss (from Issue price)*
Lemon Tree Hotels ltd Hotel 5119.55 1038.00 43199.00 56.00 61.60 65.10 16.25
ICICI Securities Ltd Broking House 12871.16 4016.00 43194.00 520.00 431.10 399.55 -23.16
Mishra Dhatu Nigam Ltd Metal 2757.64 439.00 43194.00 90.00 87.00 147.20 63.56
Karda Construction Ltd Construction 220.72 78.00 43192.00 180.00 136.00 179.45 -0.31
Sandhar Technologies Ltd Auto Industry 2498.52 513.00 43192.00 332.00 345.00 415.1 25.03
Hindustan Aeronautics Ltd Defence 34754.56 4229.00 43187.00 1240.00 1169.00 1039.35 -16.18
Bandhan Bank Ltd Bank 57618.44 4473.00 43186.00 375.00 485.00 483.05 28.81
Bharat Dynamics Ltd Defence 6954.61 961.00 43182.00 428.00 360.00 379.45 -11.34
H.G. Infra Engineering Ltd Infrastructure 2148.04 4229.00 43168.00 270.00 270.00 329.60 22.07
Aster DM Healthcare Health Care 9480.59 981.00 43157.00 190.00 182.10 187.65 -1.24
Galaxy Surfactants Ltd FMCG 5124.98 937.00 43139.00 1480.00 1520.00 1445.50 -2.33
Amber Enterprises India Consumer Durables 3626.10 600.00 43130.00 859.00 1180.00 1153.10 34.24
Newgen Software Technologies Software 1821.94 424.00 43129.00 245.00 253.00 263.15 7.41
Apollo Micro Systems Ltd Defense 425.87 156.00 43122.00 275.00 478.00 205.10 -25.42
Astron Paper & Board Mill paper 552.19 70.00 43097.00 50.00 120.00 118.75 137.50
Future Supply Chain Solutions Logistics 2677.56 650.00 43087.00 664.00 674.00 668.45 0.67
Shalby Ltd Hopsital 2105.11 504.00 43084.00 248.00 237.00 194.90 -21.41
HDFC Standard Life Insurance Insurance 99499.17 8695.00 43056.00 290.00 311.00 494.55 70.53
Khadim India Ltd Footwear 1451.14 544.00 43053.00 750.00 727.00 807.75 7.70
New India Assurance Co. Ltd. Insurance 55830.12 9600.00 43052.00 800.00 748.90 677.55 -15.31
Mahindra Logistics Ltd Logistics 3841.66 830.00 43049.00 429.00 432.00 540.00 25.87
Reliance Nippon Life Life Insurance 14507.46 1542.00 43045.00 252.00 294.00 237.05 -5.93
IPO TRACKER
15

FIXED DEPOSIT MONITOR
* Interest Rate may be revised by company from time to time. Please confirm Interest rates before submitting the application.
* For Application of Rs.50 Lac & above, Contact to Head Office.
* Email us at [email protected]
FIXED DEPOSIT COMPANIES
PERIOD ADDITIONAL RATE OF INTEREST (%) MIN.
INVESTMENTS.NO (NBFC COMPANY -NAME)
12M 18M 24M 36M 45M 48M 60M 84M
1 BAJAJ FINANCE LTD.(UPTO RS. 5 CR.) 7.85 7.85 8.15 8.35 - 8.35 8.35 - 25000/-
2 DEWAN HOUSING FINANCE CORPORATION LTD 13M=7.75% 14M=7.75% 18M=7.80% 13M=50000; 40M=7.95%
14M=10000;
40M=2000
3 DEWAN HOUSING FINANCE CORPORATION LTD (AASHRAY) 7.70 - 7.80 7.90 - 8.05 8.05 8.00 10,000/-
4 GRUH FINANCE LTD. 7.00 13M=7.00 7.25 7.50 - 7.25 7.00 7.00 96-120M=7.00%; 0.25% FOR FEMALE, 1000/-
SENIOR CITIZEN & TRUST
5 HDFC PREMIUM DEPOSIT FOR INDIVIUAL (UPTO RS. 2 CR.) 15M=7.50 22M= 7.50 30M=7.45 44M= 7.50 0.25% FOR SENIOR CITIZEN UPTO RS. 2 CR
- -6 HDFC SPECIAL DEPOSIT FOR INDIVIDUAL & TRUST 33M=7. 55 66M= 7.55 - - 0.25% FOR SENIOR CITIZEN UPTO RS. 2 CR
(UPTO RS. 5 CR.)
- -7 HDFC PREMIUM DEPOSIT FOR TRUST & INSTITUTION 15M=7. 50 30M= 7.45 - - -
(UPTO RS. 5 CR.)
8 HDFC LTD FOR INDIVIDUAL & TRUST (UPTO RS.3 CR.) 7.40 - 7.35 7.35 - 7.35 7.35 - 0.25% FOR SENIOR CITIZEN UPTO RS. 1 CR.
9 HUDCO LTD.(IND & HUF) 7.25 - 7.25 7.25 - 7.00 7.00 - 0.25% FOR SR. CITIZEN 10000/-
10 HUDCO LTD.(TRUST/CO/INSTITUTION) 7.00 - 7.00 7.00 - 6.75 6.75 - - 10000/-
11 KTDFC (Kerela Transport) 8.25 - 8.25 8.25 - 8.00 8.00 - 0.25% EXTRA FOR SR. CITIZEN, 10000/-
12 LIC HOUSING FINANCE LTD. (UPTO RS. 5 CR.) 7.30 7.35 7.40 7.45 - - 7.45 - 0.25% FOR SENIOR CITIZEN IF APP ABOVE 10000/-
Rs. 50,000/- & 0.10% IF APP UPTO Rs. 50,000/-
13 M&M FINANCIAL SERVICES LTD (FOR BELOW RS. 1 CRORE) 7.70 7.75 7.90 8.05 - 8.05 8.05 - 0.25% FOR SENIOR CITIZEN 10000/-
15 PNB HOUSING FINANCE LTD. (UPTO RS. 5 CR.) 7.50 - 7.60 7.90 - 7.90 8.00 8.00 0.25% EXTRA FOR SR. CITIZEN UPTO RS.1 CRORE
16 PNB HOUSING FINANCE LTD. (UPTO RS. 5 CR.) 15M=7.7 0 22M=7 .70 4 4M= 8.00 0.25% FOR SENIOR CITIZEN 30M=7.70
17 SHRIRAM TRANSPORT FINANCE-UNNATI SCHEME 7.65 - 7.65 8.00 - 8.00 8.25 - 0.25% FOR SENIOR CITIZEN 5000/-
18 SHRIRAM CITY UNION SCHEME 7.65 - 7.65 8.00 - 8.00 8.25 - 0.25% FOR SENIOR CITIZEN 5000/-
(FOR TRUST ONLY) (FOR WOMEN ONLY)
20000/- BUT
40000/-
IN MONTHLY
0.35% EXTRA FOR SR. CITIZEN OR 0.25% EXTRA
FOR EXISTING CUSTOMER (2 MONTH GAP IN
FIRST & SECOND DEPOSIT) & 0.25% EXTRA IN
RENEWAL UPTO RS.5 CR.
0.40% EXTRA FOR SR CITIZEN,WIDOW, EXISTING
DHFL HOME BORROWERS & DHFL MORTGAGE &
SME LOAN CUSTOMERS, 0.15% EXTRA FOR
RENEWAL BUT APP SHOULD REACH IN COMPANY
BEFORE DUE DATE.
20000/-
(Rs.)
16

INDUSTRY & FUND UPDATE
Sundaram Mutual Fund seeks SEBI nod for services fund
Sundaram Mutual Fund has sought the Securities and Exchange Board of India's approval for launching Sundaram Services Fund, according to the information on the regulator's website. The open-ended equity scheme will invest at least 80 percent of its corpus corpus in equity and equity-related instruments of services sector and rest up to 20 percent in fixed income and money market instruments.
HSBC MF appoints fund managers for 2 open-ended equity schemes
HSBC Mutual Fund has appointed Neelotpal Sahai and Gautam Bhupal as fund managers for two open-ended equity schemes, the fund house said in an addendum. Sahai will manage HSBC Small Cap Equity Fund, while Bhupal will oversee HSBC Infrastructure Equity Fund, with effect from May 18, HSBC Mutual Fund said. Earlier, Dhiraj Sachdev managed both schemes.
Principal MF to rename asset allocation fund as retirement savings fund from June 11
Principal Mutual Fund will rename Principal Asset Allocation Fund as Principal Retirement Savings Fund with effect from June 11, the fund house said in an addendum. Subsequently, the fund house will revise the benchmark and asset allocation of 3 plans under the scheme -- conservative, moderate and aggressive. The scheme will have a lock-in period of five years, or till the retirement age of 60 years, from the date on which the units are allotted. The revision comes in the wake of guidelines released by the Securities and Exchange Board of India (SEBI) on October 6. The new norms require fund houses to segregate existing and future schemes into five broad categories and 36 sub-categories for ease of investing.
Principal Mutual Fund has changed the fundamental attributes of Principal Balanced Fund
Principal Mutual Fund has changed the fundamental attributes of Principal Balanced Fund effective from Jun 11. Among the changes announced, the fund name has been changed to Principal Hybrid Equity Fund. The fund is categorised as an open ended hybrid scheme investing predominantly in equity and equity related instruments.
Escorts Asset Management renamed as Quant Money Managers
Escorts Asset Management Ltd has been renamed as Quant Money Managers Ltd with effect from February 28. Subsequently, the name of the trustee company has been changed to Quant Capital Trustee Ltd from Escorts Investment Trust Ltd, effective April 13. Quant Money Managers Ltd is the investment manager to Escort Mutual Fund. Gaurav Balre and Shamil Mehra have been appointed as debt, and international equities fund managers, respectively, for all its schemes, effective Feb 1. Pushpa Rai has resigned as equity fund manager with effect from Feb 1. Drishti Shah has been appointed a compliance officer and company secretary of the asset management company, effective April 28. Shah has replaced Ranjit Kumar Gupta, who resigned with effect from April 27, according to the addendum.
Axis Mutual Fund has revised the exit load of Axis Multicap Fund
Axis Mutual Fund has revised the exit load of Axis Multicap Fund effective from May 18. Accordingly, no exit load will be charged on the first 10% of the invested amount in case of redemption or switch out within 12 months from the date of allotment. Any redemption above 10% limit within 12 months of allotment will be liable to 1% exit load.
17
NEW FUND OFFER
Scheme Name SBI Long Term Advantage Fund - Series VI - Regular Plan (G)
Fund Type Close-Ended
Fund Class Growth
Opens on 11-Apr-2018
Closes on 10-Jul-2018
Investment Objective to generate capital appreciation over a period of ten years by investing predominantly in equity and equityrelated instruments of companies along with income tax benefit.
Min. Investment Rs.500/-
Fund Manager Anup Upadhyay
MUTUAL FUND Performance Charts
Scheme Name Reliance Fixed Horizon Fund - XXXVII - Series 8 (90D) (G)
Fund Type Close-Ended
Fund Class Growth
Opens on 21-May-2018
Closes on 23-May-2018
Investment Objective to seek to generate returns and growth of capital by investing in a diversified portfolio.
Min. Investment Rs.5000/-
Fund Manager Amit Tripathi
Scheme Name Sundaram Long Term Tax Advantage Fund - Series - IV - Regular Plan (G)
Fund Type Close-Ended
Fund Class Growth
Opens on 27-Mar-2018
Closes on 27-Jun-2018
Investment Objective To generate capital appreciation over a period of ten years by investing predominantly in equity and equity-related instruments of companies along with income tax benefit.
Min. Investment Rs.5000/-
Fund Manager S Krishnakumar / Dwijendra Srivastava

Note: Indicative corpus are including Growth & Dividend option . The above mentioned data is on the basis of 17/05/2018Beta, Sharpe and Standard Deviation are calculated on the basis of period: 1 year, frequency: Weekly Friday, RF: 7%
MUTUAL FUND Performance Charts
Returns (%) Risk Market Cap (%)
Scheme Name NAV Launch QAAUM 3M 6M 1Y 3Y Since Std.Dev Beta Jenson LARGE MID SMALL DEBT &
(`) Date (` Cr.) Launch CAP CAP CAP OTHER
IDFC Tax Advantage (ELSS) Fund - Reg - G 58.90 26-Dec-2008 1054.14 1.55 5.65 18.99 13.57 20.77 1.58 0.82 0.15 43.74 22.34 27.53 6.38
Axis Long Term Equity Fund - G 43.07 29-Dec-2009 16115.50 6.41 8.05 18.74 11.83 19.02 1.48 0.83 0.07 65.53 25.14 4.75 4.58
Aditya Birla Sun Life Tax Relief 96 - G 31.70 06-Mar-2008 5003.50 2.46 3.66 17.45 13.94 11.97 1.45 0.77 0.11 39.59 42.73 14.43 3.24
Aditya Birla Sun Life Tax Plan - G 39.67 03-Oct-2006 685.59 2.45 3.52 17.16 13.49 12.58 1.44 0.76 0.10 41.89 42.78 14.54 0.79
Invesco India Tax Plan - G 49.93 29-Dec-2006 505.21 3.72 4.74 16.36 12.75 15.16 1.43 0.89 0.06 76.18 14.28 8.11 1.43
Motilal Oswal Long Term Equity F-R-G 18.13 21-Jan-2015 848.80 2.08 6.78 14.26 19.45 19.61 1.51 0.76 0.21 69.57 20.18 8.32 1.94
IDBI Equity Advantage Fund - Reg - G 27.20 10-Sep-2013 665.02 3.66 3.46 13.00 9.94 23.81 1.57 0.73 0.05 45.46 47.27 6.34 0.93
TAX Fund Due to their inherent long term nature, the following 3 categories have been sorted on the basis of 1 year returns
Returns (%) Risk Market Cap (%)
Scheme Name NAV Launch QAAUM 3M 6M 1Y 3Y Since Std.Dev Beta Jenson LARGE MID SMALL DEBT &
(`) Date (` Cr.) Launch CAP CAP CAP OTHER
HDFC Small Cap Fund - G 46.16 03-Apr-2008 2576.70 0.71 9.58 24.82 21.82 16.31 1.73 0.74 0.28 2.89 12.94 67.46 16.71
SBI Focused Equity Fund - G 136.40 17-Sep-2004 2396.73 2.73 6.70 22.18 14.94 21.06 1.61 0.71 0.10 38.37 18.92 33.38 9.34
Axis Midcap Fund - G 34.95 18-Feb-2011 1305.10 6.58 6.82 20.02 11.46 18.85 1.67 0.67 0.10 23.03 60.47 5.83 10.68
Invesco India Contra Fund - G 47.51 11-Apr-2007 1074.03 2.41 6.19 19.91 16.11 15.06 1.61 0.92 0.13 66.87 13.72 14.65 4.76
Axis Bluechip Fund - G 26.39 05-Jan-2010 1891.48 6.55 7.41 19.74 11.40 12.30 1.40 0.84 0.03 82.18 4.74 N.A. 13.07
Axis Focused 25 Fund - G 27.23 29-Jun-2012 2959.08 7.17 8.06 19.22 15.90 18.56 1.60 0.86 0.14 60.49 27.94 1.00 10.58
Invesco India G Opportunities Fund - G 33.23 09-Aug-2007 319.74 3.70 4.66 18.55 12.87 11.79 1.41 0.88 0.10 60.78 30.89 4.27 4.06
EQUITY (Diversified) Due to their inherent long term nature, the following 3 categories have been sorted on the basis of 1 year returns
Annualised
Returns (%) RiskAverage Yield till
Scheme Name NAV Launch QAAUM Since Std. Sharpe
1W 2W 1M 6M 1Y 3YMaturity (Years) Maturity
(`) Date (`Cr.) Launch Dev.
BOI AXA Credit Risk Fund - Reg - G 13.40 27-Feb-2015 1472.00 -13.04 3.02 -1.09 6.87 8.08 9.72 9.51 8.01 0.30 2.37 11.26
Franklin India Income Oppt Fund - G 20.59 11-Dec-2009 3336.04 -19.22 -9.79 -8.14 4.53 6.89 8.24 8.94 7.11 0.23 2.56 10.47
Invesco India Ultra Short Term Fund - G 1784.51 30-Dec-2010 1207.76 1.42 3.10 3.61 5.91 6.60 8.02 8.16 3.44 0.10 N.A. 7.98
Franklin India Corporate Bond Oppt F - G 18.00 07-Dec-2011 6666.08 -19.91 -10.00 -7.75 4.37 6.59 8.21 9.54 7.59 0.18 2.79 10.54
Kotak Corporate Bond Fund - Std - G 2294.10 21-Sep-2007 1245.99 0.26 2.00 2.34 5.52 6.47 7.87 8.10 6.23 0.07 0.49 7.44
Franklin India Dynamic Accrual Fund - G 61.08 05-Mar-1997 3085.18 -21.37 -10.86 -9.44 3.79 6.43 8.86 8.90 8.41 0.19 2.82 10.64
Aditya Birla Sun Life Corp Bond F - R - G 12.90 17-Apr-2015 5474.38 -16.12 -7.62 -7.33 3.96 6.25 8.63 8.59 12.02 0.11 2.06 10.35
INCOME FUND
Returns (%) Risk Average Yield tillScheme Name NAV Launch QAAUM Since Std. Sharpe
1W 2W 1M 6M 1Y 3YMaturity (Years) Maturity
(`) Date (`Cr.) Launch Dev.
Franklin India STIP - G 3661.20 31-Jan-2002 9525.83 -19.81 -9.97 -7.87 4.40 6.87 8.15 8.29 7.54 0.22 2.26 10.72
L&T Low Duration Fund - Reg - G 18.70 04-Dec-2010 1220.33 -7.80 -3.17 -2.63 4.36 6.34 8.58 8.76 6.71 0.16 1.23 8.82
HDFC Short Term Debt Fund - G 19.16 25-Jun-2010 9897.52 -13.32 -6.58 -5.59 3.96 5.66 7.63 8.58 6.30 0.00 1.42 8.04
Aditya Birla Sun Life Medium Term Plan-R-G 21.90 25-Mar-2009 11559.00 -17.30 -8.70 -8.42 3.45 5.85 8.43 8.94 12.68 0.05 2.23 9.91
Kotak Income Opportunities Fund - R - G 19.05 11-May-2010 5099.79 -15.61 -7.64 -7.13 3.44 5.24 8.14 8.37 10.06 0.05 2.02 9.30
Aditya Birla Sun Life Short Term F - DAP 20.38 06-Mar-2009 18691.80 -13.80 -6.49 -7.27 3.35 5.48 7.97 8.04 9.85 0.03 1.90 8.17
Sundaram S T D F - Reg - Appreciation 29.71 05-Sep-2002 990.35 -7.76 -2.96 -5.32 3.33 4.94 6.96 7.18 8.74 -0.07 1.55 7.84
SHORT Due to their inherent short term nature, Short term funds have been sorted on the basis of 6month returns
Annualised
Returns (%) Risk Market Cap (%)
Scheme Name NAV Launch QAAUM 3M 6M 1Y 3Y Since Std.Dev Jenson LARGE MID SMALL DEBT &
(`) Date (` Cr.) Launch CAP CAP CAP OTHER
Principal Balanced Fund - G 75.42 14-Jan-2000 1026.52 0.54 0.45 14.20 14.57 11.64 1.26 0.14 45.34 10.22 10.25 34.19
SBI Equity Hybrid Fund - G 126.08 09-Oct-1995 20975.10 1.10 0.61 12.07 9.71 16.03 1.09 0.02 43.83 13.76 6.10 36.31
HDFC Childrens Gift F - Investment Plan 115.67 02-Mar-2001 2116.58 0.62 1.30 10.54 11.51 17.05 1.10 0.07 39.54 14.76 16.30 29.40
Reliance Equity Hybrid Fund - G 54.71 08-Jun-2005 12142.00 0.31 0.37 10.54 11.56 14.03 1.15 0.04 57.66 9.24 3.28 29.82
Sundaram Equity Hybrid Fund - Reg - G 85.40 23-Jun-2000 864.97 2.89 4.75 9.33 9.85 12.63 0.98 0.05 57.28 14.24 1.78 26.70
Mirae Asset Hybrid - Equity Fund - R - G 13.50 29-Jul-2015 1089.76 -0.25 -0.14 8.61 N.A. 11.31 1.17 0.03 63.35 9.25 1.63 25.77
HDFC Balanced Fund - G 148.33 11-Sep-2000 19997.20 -0.47 0.27 8.60 11.44 16.47 1.07 0.06 46.13 13.25 7.42 33.20
BALANCED
18

SMC Eastern Zenith 2018 - Training and Awards Ceremony held in association with CDSL, MCX andICICI Prudential on 12th May 2018 at Kolkata.

NSE INB/INF/INE 230771431, BSE INB/INF/INE 011343937, MCX- SX INB/INF 260771432 INE 260771431, USEL INE 271343936, CDSL IN-DP-CDSL-583-2010, NSDL IN-DP-NSDL-333-2010 (SMC Global Securities Ltd.) NCDEX: NCDEX/TCM/CORP/0131, MCX: MCX/TCM/CORP/0385, MCX MEMBER ID: 8200, NMCE: NMCE/TCM/CORP/0215, ICEX: ICEX/TCM/CORP/009, ACE: ACEL/CM/CORP/0267, UCX: 210001 (SMC Comtrade Ltd.), PMS INP000003435 (SMC Investments and Advisors Ltd.), IRDAI Regi: No: DB 272/04 License No. 289 (SMC Insurance Brokers Pvt. Ltd.) Valid upto 27/01/2020
Investment in securities & commodities market are subject to market risk • Insurance is the subject matter of solicitation • All insurance products sold through SMC Insurance Brokers Pvt. Ltd. • Investment Banking Services provided by SMC Capitals Ltd. • Equity PMS and Wealth management services provided by SMC Investments & Advisors Ltd. • IPOs and Mutual Funds distribution services are provided by SMC Global Securities Ltd. • Financing Services provided by Moneywise Financial Services Pvt Ltd. • Commodity broking services provided by SMC Comtrade Ltd. • Real Estate Advisory services are offered through SMC Real Estate Advisors Pvt. Ltd. • Award Source: NSE Award 2017, Assocham Excellence Award 2017, Elets digital Banking & Payments 2017, Skoch- BSE Market Leadership Awards 2016
DEMAT &TRADING A/C
GET A
Top 6 reasons to avail this exciting offer:
1 Zero* account opening fee
2 Trade in Shares, Commodities & Currency
3 Invest in Mutual Funds online
4 Real-Time stock update
5 Seamless trading across multiple devices
6 Dedicated customer support
Equity I Commodity I Currency I IPOs I Mutual Funds I Bonds I Life & General Insurance I Real Estate Advisory I
Financing I Wealth Management I Investment Banking I NRI & FPI Services I Institutional Broking I Research
D e l h i | M u m b a i | K o l k a t a | A h m e d a b a d | C h e n n a i | D u b a i
VISIT: SMCTRADEONLINE.COM
LIMITED PERIOD
OFFER
BEST PERFORMINGRETAIL BROKER
(NORTHERN REGION)
2017BEST ONLINE
TRADING SERVICESBROKER OF THE YEAR
2017BEST ROBO ADVISORY
FOR FINANCIAL SERVICESOF THE YEAR
2017BEST COMMODITY
BROKER OF THE YEAR
2017
S OCH
Awarded by:
Investors' Protection Fund
ACHIEVINGMARKET LEADERSHIP
(ORDER OF MERIT)
2016
*