
A Weekly Update from SMC WISEM NEY · DEMAT & TRADING A/C GET A Top 6 reasons to avail this...
20
WISE M NEY A Weekly Update from SMC (For private circulation only) 2019: Issue 667, Week: 21st – 25th January 70 YEARS, 1.3 BILLION PEOPLE 1 NATION Brand smc 451
Transcript of A Weekly Update from SMC WISEM NEY · DEMAT & TRADING A/C GET A Top 6 reasons to avail this...

WISE M NEYA Weekly Update from SMC
(For private circulation only)2019: Issue 667, Week: 21st – 25th January
70 YEARS, 1.3 BILLION PEOPLE1 NATION
Bra
nd s
mc
451

SEBI Reg. No. INZ000199438, Member: BSE (470), NSE (07714) & MSEI (1002), DP SEBI Regn. No. CDSL/NSDL-IN-DP-130-2015, Mutual Funds Distributor ARN No. 29345. SMC Comtrade Ltd. SEBI Regn. No. INZ000035839, Member: NCDEX (00021), MCX (8200) & ICEX (1010). SMC Investments and Advisors Limited, SEBI PMS Regn. No. INP000003435. SMC Insurance Brokers Pvt. Ltd. IRDAI Regn. No: DB 272/04 License No. 289 Valid upto 27/01/2020.
DEMAT &TRADING A/C
GET A
Top 6 reasons to avail this exciting offer:
1 Zero* account opening fee
2 Trade in Shares, Commodities & Currency
3 Invest in Mutual Funds online
4 Real-Time stock update
5 Seamless trading across multiple devices
6 Dedicated customer support
Equity I Commodity I Currency I IPOs I Mutual Funds I Bonds I Life & General Insurance I Real Estate Advisory I
Financing I Wealth Management I Investment Banking I NRI & FPI Services I Institutional Broking I Research
D e l h i | M u m b a i | K o l k a t a | A h m e d a b a d | C h e n n a i | D u b a i
VISIT: SMCTRADEONLINE.COM
LIMITED PERIOD
OFFER
*
BEST PERFORMINGRETAIL BROKER
(NORTHERN REGION)
2017BEST ONLINE
TRADING SERVICESBROKER OF THE YEAR
2017BEST
FINANCIAL SERVICESPROVIDER
2018 2018CORPORATE
BROKERAGE HOUSE OFTHE YEAR
2018THE COMPANYOF THE YEAR
FINANCIAL SERVICES
2018REGIONAL RETAIL
MEMBER OF THE YEAR(NORTH)
Disclaimer: Investments in securities market are subject to market risks, read all the related documents carefully before investing. • PMS is not offered in commodity derivative segment. • Insurance is the subject matter of solicitation. • All insurance products sold through SMC Insurance Brokers Pvt. Ltd. • Investment Banking Services provided by SMC Capitals Ltd. • Equity PMS and Wealth management services provided by SMC Investments & Advisors Ltd. • IPOs and Mutual Funds distribution service is provided by SMC Global Securities Ltd. • Financing Services provided by moneywise Financial Services Pvt Ltd. • Commodity broking services provided by SMC Comtrade Ltd. • Real Estate Advisory services are offered through SMC Real Estate Advisors Pvt. Ltd. • Award Sources: Best Performer in Account Growth Rate (Rising DPs) 1st Position – NSDL Star Performer Awards 2018. Regional Retail Member of the Year (North) Award 2018 – NSE. Company of the Year (Financial Services) Award 2018 – Zee Business. Best Financial Services Provider 2018 – Assocham Excellence Awards. MCX Award Corporate Brokerage House of the Year - 2018. National Stock Exchange (NSE) Awards Best Performing Retail Broker (Northern region)- 2017. Assocham Excellence Awards Best Online Trading Services Broker of the year- 2017.
BEST PERFORMER INACCOUNT GROWTH RATE
ST(RISING DPs) -1 POSITION
2018
From The Desk Of Editor
(Saurabh Jain)
SMC Global Securities Ltd. (hereinafter referred to as “SMC”) is a registered Member of National Stock Exchange of India Limited, Bombay Stock Exchange Limited and its associate is member of MCX stock Exchange Limited. It is also registered as a Depository Participant with CDSL and NSDL. Its associates merchant banker and Portfolio Manager are registered with SEBI and NBFC registered with RBI. It also has registration with AMFI as a Mutual Fund Distributor.
SMC is a SEBI registered Research Analyst having registration number INH100001849. SMC or its associates has not been debarred/ suspended by SEBI or any other regulatory authority for accessing /dealing in securities market.
SMC or its associates including its relatives/analyst do not hold any financial interest/beneficial ownership of more than 1% in the company covered by Analyst. SMC or its associates and relatives does not have any material conflict of interest. SMC or its associates/analyst has not received any compensation from the company covered by Analyst during the past twelve months. The subject company has not been a client of SMC during the past twelve months. SMC or its associates has not received any compensation or other benefits from the company covered by analyst or third party in connection with the research report. The Analyst has not served as an officer, director or employee of company covered by Analyst and SMC has not been engaged in market making activity of the company covered by Analyst.
The views expressed are based solely on information available publicly available/internal data/ other reliable sources believed to be true.
SMC does not represent/ provide any warranty express or implied to the accuracy, contents or views expressed herein and investors are advised to independently evaluate the market conditions/risks involved before making any investment decision.
lobal markets witnessed sustained buying amid optimism for progress in U.S.-
GChina trade talks. Rising optimism too reflected on the crude prices that slowly
but steadily staged a comeback from the lows. Beige book report out of U.S.
showed that while economy continues to grow at a modest pace but the optimism is waning
among U.S. businesses on concerns over shutdown, trade disputes and volatile stock
market. Inflation in Japan slowed again in the month of December highlighting the
difficulty of reaching the central bank’s 2 per cent price goal as a result of lower energy
costs. Central Bank of China pumped nearly $83 billion into the financial systems in order to
address funding shortage ahead of the Chinese New Year and to let banks to lend money to
companies at cheaper rates. U.K. parliament rejected Theresa May’s Brexit deal just when
it is due to leave the EU in 10 weeks. Euro-area strongest economy, Germany, avoided a
recession in the last quarter of 2018 and it saw slight increase in GDP.
Back at home, Industrial activity dipped to seventeen month low to 0.5 per cent for the
month of November 2018. Inflation too both at consumer and wholesale level came at a low
level of 2.19 per cent and 3.8 per cent respectively reflecting fall in crude prices and
pressure at factory gate prices. Going next week, economic data out of China and U.S.,
corporate earnings, trend in global markets, investment by foreign portfolio investors
(FPIs) and domestic institutional investors (DIIs) would determine the trend in global
markets. Also the market will closely watch guidance and management commentary of the
companies that are coming out with their results.
On the commodity market front, bullion counter upside momentum is likely to continue
further as Brexit concerns along with China slowdown concerns will keep prices on upbeat
note. Britain is due to leave the EU on March 29 but investors now anticipate an extension of
that deadline. Furthermore rate hike pause by FED and partial US government shutdown
are also assisting the prices. Gold can test the level of 32800 taking support near 31900
while silver can move further northwards and can test 40000 levels. Crude oil prices are
expected to remain on buoyant path and can test 3850 in MCX. OPEC expects 2019 global oil
demand growth to slow to 1.29 million bpd from 1.5 million in 2018. In base metal counter,
prices can extend its recovery on China stimulus measures and growing optimism regarding
US and China trade deal. Natural gas can remain buoyant as the 8-14 days weather outlook
shows mostly the cooler temperature levels across the entire region whereas the eastern
counties are expected to have lower to normal temperature levels being at levels of 30%-
60% below normal temperature levels. China GDP, retail sales and industrial production
along with US existing home sales, core durable goods order and new home sales data.etc
are some data and events scheduled this week.
Contents
Equity 4-7
Derivatives 8-9
Commodity 10-13
Currency 14
IPO 15
FD Monitor 16
Mutual Fund 17-18
SMC GLOBAL SECURITIES LTD.
REGISTERED OFFICES:
11 / 6B, Shanti Chamber, Pusa Road, New Delhi 110005.
Tel: 91-11-30111000, Fax: 91-11-25754365
MUMBAI OFFICE:
Lotus Corporate Park, A Wing 401 / 402 , 4th Floor ,
Graham Firth Steel Compound, Off Western Express Highway,
Jay Coach Signal, Goreagon (East) Mumbai - 400063
Tel: 91-22-67341600, Fax: 91-22-67341697
KOLKATA OFFICE:
18, Rabindra Sarani, Poddar Court, Gate No-4,5th Floor, Kolkata-700001
Tel.: 033 6612 7000/033 4058 7000, Fax: 033 6612 7004/033 4058 7004
AHMEDABAD OFFICE :
10/A, 4th Floor, Kalapurnam Building, Near Municipal Market,
C G Road, Ahmedabad-380009, Gujarat
Tel : 91-79-26424801 - 05, 40049801 - 03
CHENNAI OFFICE:
Salzburg Square, Flat No.1, III rd Floor, Door No.107, Harrington Road,
Chetpet, Chennai - 600031.
Tel: 044-39109100, Fax -044- 39109111
SECUNDERABAD OFFICE:
315, 4th Floor Above CMR Exclusive, BhuvanaTower,
S D Road, Secunderabad, Telangana-500003
Tel : 040-30031007/8/9
DUBAI OFFICE:
2404, 1 Lake Plaza Tower, Cluster T, Jumeriah Lake Towers,
PO Box 117210, Dubai, UAE
Tel: 97145139780 Fax : 97145139781
Email ID : [email protected]
Printed and Published on behalf of
Mr. Saurabh Jain @ Publication Address
11/6B, Shanti Chamber, Pusa Road, New Delhi-110005
Website: www.smcindiaonline.com
Investor Grievance : [email protected]
Printed at: S&S MARKETING
102, Mahavirji Complex LSC-3, Rishabh Vihar, New Delhi - 110092 (India)
Ph.: +91-11- 43035012, 43035014, Email: [email protected]

NEWS
NOTES:1) These levels should not be confused with the daily trend sheet, which is sent every morning by e-mail in the name
of "Morning Mantra ".2) Sometimes you will find the stop loss to be too far but if we change the stop loss once, we will find more strength
coming into the stock. At the moment, the stop loss will be far as we are seeing the graphs on weekly basis and taking a long-term view and not a short-term view.
TREND SHEET
4
Closing as on 18-01-2019*SENSEX has breached the resistance of 35700 **NIFTY has breached the resistance of 10700 ***ACC has broken the support of 1450
Stocks *Closing Trend Date Rate SUPPORT RESISTANCE Closing
Price Trend Trend S/l
Changed Changed
S&P BSE SENSEX* 36387 DOWN 05.10.18 34970 - 36500
NIFTY50** 10907 DOWN 05.10.18 10316 - 11000
NIFTY IT 14893 UP 21.07.17 10712 13600 13400
NIFTY BANK 27457 UP 30.11.18 26863 25900 25400
ACC*** 1440 UP 16.11.18 1501 - 1430
BHARTIAIRTEL 311 DOWN 25.01.18 453 340 350
BPCL 354 UP 16.11.18 322 345 330
CIPLA 509 DOWN 26.10.18 604 550 560
SBIN 295 UP 02.11.18 286 270 260
HINDALCO 209 DOWN 04.01.19 211 225 230
ICICI BANK 372 UP 02.11.18 355 350 340
INFOSYS 731 UP 14.12.18 706 690 670
ITC 291 UP 11.01.19 295 280 275
L&T 1318 DOWN 18.01.19 1318 1370 1390
MARUTI 7358 DOWN 14.09.18 8627 7600 7800
NTPC 144 DOWN 26.10.18 159 152 155
ONGC 147 DOWN 05.10.18 147 155 158
RELIANCE 1185 UP 30.11.18 1168 1100 1070
TATASTEEL 471 DOWN 26.10.18 552 510 520
FORTHCOMING EVENTS
EQUITY
Meeting Date Company Purpose
21/01/2019 Kotak Mah. Bank Quarterly Results
21/01/2019 L&T Fin.Holdings Quarterly Results
22/01/2019 Asian Paints Quarterly Results
22/01/2019 Shree Cement Quarterly Results,Interim Dividend
22/01/2019 Havells India Quarterly Results
22/01/2019 TVS Motor Co. Quarterly Results
22/01/2019 ICICI Pru Life Quarterly Results
23/01/2019 ITC Quarterly Results
23/01/2019 Can Fin Homes Quarterly Results
23/01/2019 United Spirits Quarterly Results
23/01/2019 InterglobeAviat Quarterly Results
24/01/2019 Colgate-Palm. Quarterly Results
24/01/2019 Reliance Power Quarterly Results
24/01/2019 PVR Quarterly Results
24/01/2019 Biocon Quarterly Results
24/01/2019 UltraTechCem. Quarterly Results
24/01/2019 Yes Bank Quarterly Results
25/01/2019 Larsen & Toubro Quarterly Results
25/01/2019 DewanHsg. Fin. Quarterly Results
25/01/2019 Maruti Suzuki Quarterly Results
Ex-Date Company Purpose
23-Jan-19 MindTree Interim Dividend
24-Jan-19 KPIT Technologies Composite Scheme Of Arrangement
24-Jan-19 Infosys Special Dividend - Rs 4 Per Share
24-Jan-19 Trident Interim Dividend
25-Jan-19 Motilal Oswal Fin. Ser. Interim Dividend - Rs 4 Per Share
28-Jan-19 Siemens Dividend- Rs 7/- Per Share
29-Jan-19 SHREE CEMENT Interim Dividend
DOMESTIC NEWS
Economy
• Consumer Price Index (CPI) inflation fell to 2.19% in December which is an 18-month low. Wholesale Price Index (WPI) Inflation fell to 3.8 percent in December compared to 4.64 percent in November 2018.
Pharmaceuticals
• Aurobindo Pharma will acquire a portfolio of seven branded oncology injectable products from US-based Spectrum Pharmaceuticals Inc in a $ 300 million deal (over Rs 2,100 crore) which includes an upfront cash payment of $ 160 million. The acquisition will help company to enter the branded oncology market in the US with a range of products which are well recognized in the segment.
Technology
• Larsen & Toubro Infotech (LTI) announced the acquisition of Ruletronics, a pure-play Pega consulting and implementation company with offices in the UK, USA, and India for $7.48 million. The acquisition will strengthen LTI’s rapidly growing digital business with a suite of capabilities in Pega implementation space around establishing BPM Roadmap & Strategy, Customer Services, RPA and Decisioning.
Capital Goods
• BHEL won an order worth Rs 565 crore from Singareni Collieries Company for setting up solar photovoltaic (SPV) power plants in Telangana. The plants are to be set up at four locations in Telangana - Ramagundam (50 MW), Yellandu (39 MW), Manuguru (30 MW) and Pegadapally (10 MW), on engineering, procurement and construction (EPC) basis. The company said with the order its solar portfolio has risen to more than 710 MW.
Auto
• Mahindra & Mahindra (M&M) has unveiled a new variant of its recently launched multi-purpose vehicle Marazzo with an eight-seat option. The new version will cost Rs 8,000 more than the M8 seven-seater version, which is tagged at Rs 13.9 lakh (ex-showroom). It comes with various features like a seven-inch touch screen infotainment system, reverse parking camera with dynamic guidelines and 17-inch alloy wheels.
Metals
• Hindustan Copper plans to augment production capacity to up to 20 million tonne per annum by 2024 through strategy which includes expansion of existing mines like Malanjkhand and reopening of closed mines. The company's current capacity of copper ore is 3.8 million tonne per annum (MTPA). The company plans to pump in Rs 5,500 crore over the next six years to scale up its output by six times, is also looking to reopen its Rakha copper mine soon.
INTERNATIONAL NEWS
• U.S. initial jobless claims fell to 213,000, a decrease of 3000 from the previous week's upwardly revised level of 216,000. Economists had expected jobless claims to dip to 220,000.
• U.S. import prices fell by 1.0 percent in December after tumbling by a revised 1.9 percent in November. Economists had expected import prices to decline by 1.3 percent compared to the 1.6 percent slump originally reported for the previous month.
• U.S. producer price index for final demand dipped by 0.2 percent in December after inching up by 0.1 percent in November. Economists had expected prices to slip by 0.1 percent.
• Eurozone construction output declined a calendar and seasonally-adjusted 0.1 percent month-on-month in November, after a 1.6 percent contraction in October. Building construction advanced by 0.1 percent, while civil engineering fell by 0.2 percent in November.
• Japan overall CPI rises 0.3% on year in December, the Ministry of Internal Affairs and Communications said. That was in line with expectations and down from 0.8 percent in November. Core consumer prices - which exclude volatiles prices of food - were up an annual 0.7 percent. That was shy of expectations for 0.8 percent and down from 0.9 percent in the previous month.
• China's exports and imports in December, Exports dropped 4.4 percent year-on-year in December, figures from the General Administration of Customs showed on Monday. That was in contrast to the 3 percent gain economists had predicted. Imports decreased 7.6 percent from a year ago, defying expectations for a 5 percent rise.

BSE SENSEX TOP GAINERS & LOSERS (% Change) NSE NIFTY TOP GAINERS & LOSERS (% Change)
SECTORAL INDICES (% Change)
GLOBAL INDICES (% Change)
INDIAN INDICES (% Change)
FII/FPI & DII TRADING ACTIVITY (In Rs. Crores)
5
SMC Trend
FTSE 100CAC 40
NasdaqDow jonesS&P 500
NikkeiStrait times
Hang SengShanghai
Down SidewaysUp
EQUITY
SMC Trend
BSE Midcap BSE SmallcapSensexNifty Nifty Junior S&P CNX 500
SMC Trend
ITMetal
Oil & GasPower
Cap GoodsCons Durable
Auto BankRealty
FMCGHealthcare
FII / FPI Activity DII trading activity
-6.00
-4.00
-2.00
0.00
2.00
4.00
6.00
8.00
10.00
12.00
Yes Bank Infosys B P C L I O C L Adani Ports Sun Pharma.Inds.
Zee Entertainmen
NTPC UPL GAIL (India)
9.36
7.29
5.314.92 4.60
-4.02
-2.25 -2.09 -1.84 -1.83
-6.00
-4.00
-2.00
0.00
2.00
4.00
6.00
8.00
10.00
12.00
Yes Bank Infosys Reliance Inds. TCS Tata Motors Sun Pharma.Inds.
Larsen & Toubro
St Bk of India NTPC ICICI Bank
9.51
7.27
3.272.89
2.50
-3.62
-1.76 -1.72 -1.52 -1.37
-55.65
-1000.00
-800.00
-600.00
-400.00
-200.00
0.00
200.00
400.00
600.00
800.00
1000.00
Friday Monday Tuesday Wednesday Thursday
425.63
248.71
832.54887.42
242.70
-612.87
-840.84
1.02 1.01
0.080.01
0.70
-0.40
-0.20
0.00
0.20
0.40
0.60
0.80
1.00
1.20
Ni�y Sensex BSE Midcap BSE Smallcap Ni�y Next 50 S&P CNX 500
-0.230.06 0.04
-1.51
-0.14-0.29
-0.66
-2.00
-1.00
0.00
1.00
2.00
3.00
4.00
5.00
Auto Index Bankex Cap Goods Index Cons Durable Index
FMCG Index Healthcare Index IT Index Metal Index Oil & Gas Index Power Index Realty Index
0.49 0.46
4.28
2.60
2.00
0.21
-1.20
0.27
-1.50
-1.00
-0.50
0.00
0.50
1.00
1.50
2.00
Nasdaq Comp. Dow Jones S&P 500 Nikkei Strait Times Hang Seng Shanghai Comp. FTSE 100 CAC 40
0.23
0.49
0.33
1.621.56 1.53
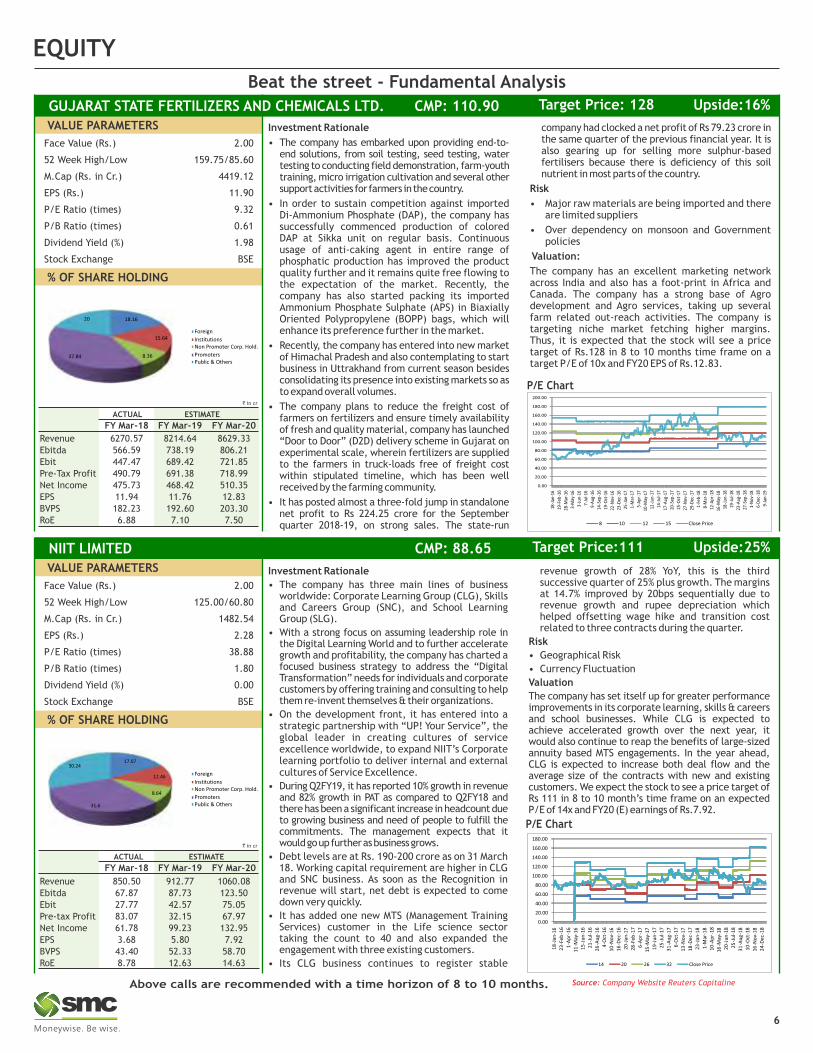
Beat the street - Fundamental Analysis
Source: Company Website Reuters CapitalineAbove calls are recommended with a time horizon of 8 to 10 months.
6
EQUITY
Face Value (Rs.) 2.00
52 Week High/Low 125.00/60.80
M.Cap (Rs. in Cr.) 1482.54
EPS (Rs.) 2.28
P/E Ratio (times) 38.88
P/B Ratio (times) 1.80
Dividend Yield (%) 0.00
Stock Exchange BSE
% OF SHARE HOLDING
VALUE PARAMETERS
ACTUAL ESTIMATE
FY Mar-18 FY Mar-19 FY Mar-20
Revenue 850.50 912.77 1060.08
Ebitda 67.87 87.73 123.50
Ebit 27.77 42.57 75.05
Pre-tax Profit 83.07 32.15 67.97
Net Income 61.78 99.23 132.95
EPS 3.68 5.80 7.92
BVPS 43.40 52.33 58.70
RoE 8.78 12.63 14.63
NIIT LIMITED CMP: 88.65 Upside:25%Target Price:111
` in cr
Foreign
InstitutionsNon Promoter Corp. Hold.
PromotersPublic & Others
Investment Rationale
• The company has embarked upon providing end-to-end solutions, from soil testing, seed testing, water testing to conducting field demonstration, farm-youth training, micro irrigation cultivation and several other support activities for farmers in the country.
• In order to sustain competition against imported Di-Ammonium Phosphate (DAP), the company has successfully commenced production of colored DAP at Sikka unit on regular basis. Continuous usage of anti-caking agent in entire range of phosphatic production has improved the product quality further and it remains quite free flowing to the expectation of the market. Recently, the company has also started packing its imported Ammonium Phosphate Sulphate (APS) in Biaxially Oriented Polypropylene (BOPP) bags, which will enhance its preference further in the market.
• Recently, the company has entered into new market of Himachal Pradesh and also contemplating to start business in Uttrakhand from current season besides consolidating its presence into existing markets so as to expand overall volumes.
• The company plans to reduce the freight cost of farmers on fertilizers and ensure timely availability of fresh and quality material, company has launched “Door to Door” (D2D) delivery scheme in Gujarat on experimental scale, wherein fertilizers are supplied to the farmers in truck-loads free of freight cost within stipulated timeline, which has been well received by the farming community.
• It has posted almost a three-fold jump in standalone net profit to Rs 224.25 crore for the September quarter 2018-19, on strong sales. The state-run
company had clocked a net profit of Rs 79.23 crore in the same quarter of the previous financial year. It is also gearing up for selling more sulphur-based fertilisers because there is deficiency of this soil nutrient in most parts of the country.
Risk
• Major raw materials are being imported and there are limited suppliers
• Over dependency on monsoon and Government policies
Valuation:
The company has an excellent marketing network across India and also has a foot-print in Africa and Canada. The company has a strong base of Agro development and Agro services, taking up several farm related out-reach activities. The company is targeting niche market fetching higher margins. Thus, it is expected that the stock will see a price target of Rs.128 in 8 to 10 months time frame on a target P/E of 10x and FY20 EPS of Rs.12.83.
Face Value (Rs.) 2.00
52 Week High/Low 159.75/85.60
M.Cap (Rs. in Cr.) 4419.12
EPS (Rs.) 11.90
P/E Ratio (times) 9.32
P/B Ratio (times) 0.61
Dividend Yield (%) 1.98
Stock Exchange BSE
% OF SHARE HOLDING
VALUE PARAMETERS
ACTUAL ESTIMATE
FY Mar-18 FY Mar-19 FY Mar-20
Revenue 6270.57 8214.64 8629.33
Ebitda 566.59 738.19 806.21
Ebit 447.47 689.42 721.85
Pre-Tax Profit 490.79 691.38 718.99
Net Income 475.73 468.42 510.35
EPS 11.94 11.76 12.83
BVPS 182.23 192.60 203.30
RoE 6.88 7.10 7.50
GUJARAT STATE FERTILIZERS AND CHEMICALS LTD. CMP: 110.90 Upside:16%Target Price: 128
` in cr
Foreign
InstitutionsNon Promoter Corp. Hold.
PromotersPublic & Others
P/E Chart
Investment Rationale
• The company has three main lines of business worldwide: Corporate Learning Group (CLG), Skills and Careers Group (SNC), and School Learning Group (SLG).
• With a strong focus on assuming leadership role in the Digital Learning World and to further accelerate growth and profitability, the company has charted a focused business strategy to address the “Digital Transformation” needs for individuals and corporate customers by offering training and consulting to help them re-invent themselves & their organizations.
• On the development front, it has entered into a strategic partnership with “UP! Your Service”, the global leader in creating cultures of service excellence worldwide, to expand NIIT’s Corporate learning portfolio to deliver internal and external cultures of Service Excellence.
• During Q2FY19, it has reported 10% growth in revenue and 82% growth in PAT as compared to Q2FY18 and there has been a significant increase in headcount due to growing business and need of people to fulfill the commitments. The management expects that it would go up further as business grows.
• Debt levels are at Rs. 190-200 crore as on 31 March 18. Working capital requirement are higher in CLG and SNC business. As soon as the Recognition in revenue will start, net debt is expected to come down very quickly.
• It has added one new MTS (Management Training Services) customer in the Life science sector taking the count to 40 and also expanded the engagement with three existing customers.
• Its CLG business continues to register stable
revenue growth of 28% YoY, this is the third successive quarter of 25% plus growth. The margins at 14.7% improved by 20bps sequentially due to revenue growth and rupee depreciation which helped offsetting wage hike and transition cost related to three contracts during the quarter.
Risk
• Geographical Risk
• Currency Fluctuation
Valuation
The company has set itself up for greater performance improvements in its corporate learning, skills & careers and school businesses. While CLG is expected to achieve accelerated growth over the next year, it would also continue to reap the benefits of large-sized annuity based MTS engagements. In the year ahead, CLG is expected to increase both deal flow and the average size of the contracts with new and existing customers. We expect the stock to see a price target of Rs 111 in 8 to 10 month’s time frame on an expected P/E of 14x and FY20 (E) earnings of Rs.7.92.
18.16
15.64
8.3637.84
20
0.00
20.00
40.00
60.00
80.00
100.00
120.00
140.00
160.00
180.00
200.00
18-J
an-1
6
19-F
eb-1
6
28-M
ar-1
6
3-M
ay-1
6
3-Ju
n-16
7-Ju
l-16
9-A
ug-1
6
14-S
ep-1
6
19-O
ct-1
6
22-N
ov-1
6
23-D
ec-1
6
25-J
an-1
7
1-M
ar-1
7
5-A
pr-1
7
10-M
ay-1
7
12-J
un-1
7
14-J
ul-1
7
17-A
ug-1
7
20-S
ep-1
7
25-O
ct-1
7
27-N
ov-1
7
29-D
ec-1
7
1-Fe
b-1
8
8-M
ar-1
8
12-A
pr-1
8
16-M
ay-1
8
18-J
un-1
8
19-J
ul-1
8
23-A
ug-1
8
27-S
ep-1
8
1-N
ov-1
8
6-D
ec-1
8
9-Ja
n-19
8 10 12 15 Close Price
17.07
12.46
8.64
31.6
30.24
P/E Chart
14 20 26 32 Close Price
0.00
20.00
40.00
60.00
80.00
100.00
120.00
140.00
160.00
180.00
18
-Jan
-16
23
-Feb
-16
1-A
pr-
16
11
-May
-16
15
-Ju
n-1
6
21
-Ju
l-1
6
26
-Au
g-1
6
4-O
ct-1
6
10
-No
v-1
6
16
-Dec
-16
20
-Jan
-17
28
-Feb
-17
6-A
pr-
17
15
-May
-17
19
-Ju
n-1
7
25
-Ju
l-1
7
31
-Au
g-1
7
6-O
ct-1
7
13
-No
v-1
7
18
-Dec
-17
23
-Jan
-18
1-M
ar-1
8
10
-Ap
r-1
8
16
-May
-18
20
-Ju
n-1
8
25
-Ju
l-1
8
31
-Au
g-1
8
10
-Oct
-18
16
-No
v-1
8
24
-Dec
-18

Charts by Spider Software India Ltd
EQUITY
Above calls are recommended with a time horizon of 1-2 months
Disclaimer : The analyst and its affiliates companies make no representation or warranty in relation to the accuracy, completeness or reliability of the information contained in its research. The analysis contained in the analyst research is based on numerous assumptions. Different assumptions could result in materially different results.The analyst not any of its affiliated companies not any of their, members, directors, employees or agents accepts any liability for any loss or damage arising out of the use of all or any part of the analysis research.
SOURCE: CAPITAL LINE
The stock closed at Rs 2006.85 on 18th January, 2019. It made a 52-week low at
Rs 1644.50 on 23rd October 2018 and a 52-week high of Rs. 2052.95 on 30th July
2018. The 200 days Exponential Moving Average (DEMA) of the stock on the daily
chart is currently at Rs 1867.79
As we can see on charts that stock was forming an “Inverted Head and Shoulder”
pattern on weekly charts which is bullish in nature. Last week, stock ended with
marginal gain and has closed on verge of neckline breakout of pattern along with
high volume so buying momentum can continue for coming days. Therefore, one
can buy in the range of 1880-1890 levels for the upside target of 2140-2180 levels
with SL below 1940.
The stock closed at Rs 280.45 on 18th January, 2019. It made a 52-week low at Rs
215.20 on 08th October 2018 and a 52-week high of Rs. 320.75 on 02nd August
2018. The 200 days Exponential Moving Average (DEMA) of the stock on the daily
chart is currently at Rs 268.89
Short term, medium term and long term bias are positive for the stock as it is
comfortably trading above important moving averages such as 100 WEMA and
200 DEMA, which indicates the uptrend for the stock. Apart from this, it was
forming a “Continuation Triangle” on weekly charts and has given the breakout
of pattern in last traded week and also has managed to close above the same so
follow up buying can continue for coming days. Therefore, one can buy in the
range of 275-277 levels for the upside target of 300-305 levels with SL below 260.
Indraprastha Gas Limited (IGL)
7
Housing Development Finance Corporation Limited (HDFC)
DERIVATIVES
CHANGE IN NIFTY OPTION OI (IN QTY)
WEEKLY VIEW OF THE MARKET
NIFTY OPTION OI CONCENTRATION (IN QTY)
CHANGE IN BANKNIFTY OPTION OI (IN QTY) (MONTHLY)BANKNIFTY OPTION OI CONCENTRATION (IN QTY) (MONTHLY)
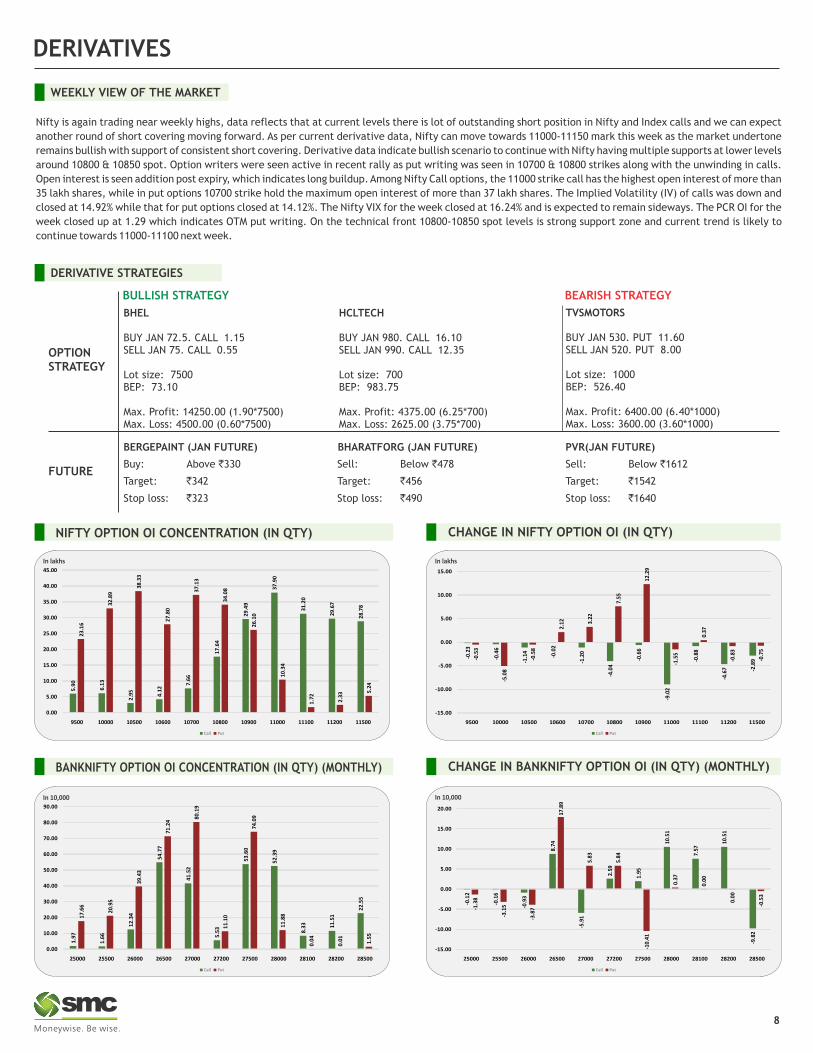
Nifty is again trading near weekly highs, data reflects that at current levels there is lot of outstanding short position in Nifty and Index calls and we can expect
another round of short covering moving forward. As per current derivative data, Nifty can move towards 11000-11150 mark this week as the market undertone
remains bullish with support of consistent short covering. Derivative data indicate bullish scenario to continue with Nifty having multiple supports at lower levels
around 10800 & 10850 spot. Option writers were seen active in recent rally as put writing was seen in 10700 & 10800 strikes along with the unwinding in calls.
Open interest is seen addition post expiry, which indicates long buildup. Among Nifty Call options, the 11000 strike call has the highest open interest of more than
35 lakh shares, while in put options 10700 strike hold the maximum open interest of more than 37 lakh shares. The Implied Volatility (IV) of calls was down and
closed at 14.92% while that for put options closed at 14.12%. The Nifty VIX for the week closed at 16.24% and is expected to remain sideways. The PCR OI for the
week closed up at 1.29 which indicates OTM put writing. On the technical front 10800-10850 spot levels is strong support zone and current trend is likely to
continue towards 11000-11100 next week.
TVSMOTORS
BUY JAN 530. PUT 11.60SELL JAN 520. PUT 8.00
Lot size: 1000BEP: 526.40
Max. Profit: 6400.00 (6.40*1000)Max. Loss: 3600.00 (3.60*1000)
OPTIONSTRATEGY
FUTURE
HCLTECH
BUY JAN 980. CALL 16.10SELL JAN 990. CALL 12.35
Lot size: 700BEP: 983.75
Max. Profit: 4375.00 (6.25*700)Max. Loss: 2625.00 (3.75*700)
DERIVATIVE STRATEGIES
BHEL
BUY JAN 72.5. CALL 1.15SELL JAN 75. CALL 0.55
Lot size: 7500BEP: 73.10
Max. Profit: 14250.00 (1.90*7500)Max. Loss: 4500.00 (0.60*7500)
8
Call Put
Call Put
In lakhs
Call Put
In 10,000
Call Put
In lakhs
BULLISH STRATEGY
BERGEPAINT (JAN FUTURE)
Buy: Above `330
Target: `342
Stop loss: `323
BHARATFORG (JAN FUTURE)
Sell: Below `478
Target: `456
Stop loss: `490
PVR(JAN FUTURE)
Sell: Below `1612
Target: `1542
Stop loss: `1640
BEARISH STRATEGY
In 10,000
5.9
0
6.1
3
2.9
5
4.1
2
7.6
6
17
.64
29
.49
37
.90
31
.20
29
.67
28
.78
23
.16
32
.89
38
.33
27
.80
37
.13
34
.08
26
.10
10
.34
1.7
2
2.3
3 5.2
4
0.00
5.00
10.00
15.00
20.00
25.00
30.00
35.00
40.00
45.00
9500 10000 10500 10600 10700 10800 10900 11000 11100 11200 11500
-0.2
3
-0.4
6
-1.1
4
-0.0
2
-1.2
0
-4.0
4
-0.6
6
-9.0
2
-0.8
8
-4.6
7 -2.8
9-0.5
3
-5.0
8
-0.5
8
2.12 3.
22
7.55
12.2
9
-1.5
5
0.37
-0.8
3
-0.7
5
-15.00
-10.00
-5.00
0.00
5.00
10.00
15.00
9500 10000 10500 10600 10700 10800 10900 11000 11100 11200 11500
1.97
1.66
12.3
4
54.7
7
41.5
2
5.53
53.6
0
52.3
9
8.33 11
.51
22.5
5
17.6
6
20.9
5
39.4
3
71.2
4
80.1
9
11.1
0
74.0
9
11.8
8
0.04
0.01 1.55
0.00
10.00
20.00
30.00
40.00
50.00
60.00
70.00
80.00
90.00
25000 25500 26000 26500 27000 27200 27500 28000 28100 28200 28500
-0.1
2
-0.1
6
-0.9
3
8.74
-5.9
1
2.59
1.95
10.5
1
7.57
10.5
1
-9.8
2
-1.3
8
-3.1
5
-3.8
7
17.8
9
5.83
5.84
-10.
41
0.37
0.00
0.00
-0.5
3
-15.00
-10.00
-5.00
0.00
5.00
10.00
15.00
20.00
25000 25500 26000 26500 27000 27200 27500 28000 28100 28200 28500

DERIVATIVES
FII’s ACTIVITY IN DERIVATIVE SEGMENT
SENTIMENT INDICATOR (NIFTY)
17-Jan 16-Jan 15-Jan 14-Jan 11-Jan
DISCOUNT/PREMIUM 20.65 31.35 41.60 32.20 32.65
COST OF CARRY% 0.81 0.81 0.80 0.79 0.76
PCR(OI) 1.29 1.30 1.29 1.09 1.13
PCR(VOL) 1.02 0.87 1.01 0.89 0.88
A/D RATIO(NIFTY 50) 0.70 1.13 9.20 0.38 0.50
A/D RATIO(ALL FO STOCK)* 0.62 0.91 5.06 0.51 0.56
IMPLIED VOLATILITY 14.92 14.60 15.01 15.14 13.50
VIX 16.24 16.08 15.58 16.16 16.16
HISTORICAL VOLATILITY 15.42 15.90 16.40 15.37 15.65
*All Future Stock
SENTIMENT INDICATOR (BANKNIFTY)
FII’S ACTIVITY IN NIFTY FUTURE
**The highest call open interest acts as resistance and highest put open interest acts as support.# Price rise with rise in open interest suggests long buildup | Price fall with rise in open interest suggests short buildup # Price fall with fall in open interest suggests long unwinding | Price rise with fall in open interest suggests short covering
#All Future Stock
17-Jan 16-Jan 15-Jan 14-Jan 11-Jan
DISCOUNT/PREMIUM 59.40 72.90 118.15 108.50 107.60
COST OF CARRY% 0.81 0.81 0.80 0.79 0.76
PCR(OI) 1.22 1.26 1.25 1.28 1.29
PCR(VOL) 0.95 1.10 1.19 0.96 1.13
A/D RATIO(BANKNIFTY) 0.71 3.00 2.00 0.50 0.33#A/D RATIO(ALL FO STOCK) 0.50 4.25 1.50 0.91 0.50
IMPLIED VOLATILITY 15.07 14.86 14.96 15.02 16.57
VIX 16.24 16.08 15.58 16.16 16.16
HISTORICAL VOLATILITY 14.75 15.20 15.61 15.87 15.96
9
In Cr. In Cr.
TOP 10 SHORT BUILD UPTOP 10 LONG BUILD UP
LTP % Price Change Open interest %OI Chng
DCBBANK 186.60 4.19% 5701500 39.69%
NIITTECH 1226.20 5.00% 1800000 18.81%
KAJARIACER 536.30 1.63% 3014700 15.55%
MINDTREE 868.55 4.11% 3630600 13.29%
WIPRO 336.15 2.50% 29378400 11.35%
APOLLOHOSP 1343.65 3.82% 738500 10.72%
TATACOMM 531.40 2.28% 2503000 8.45%
GODFRYPHLP 968.05 5.94% 611800 8.17%
LICHSGFIN 492.85 1.50% 8760400 6.68%
INFIBEAM 44.70 3.00% 12228000 5.96%
LTP % Price Change Open interest %OI Chng
FEDERALBNK 88.85 -7.40% 57862000 26.70%
JUBLFOOD 1218.25 -1.91% 3492000 18.39%
M&MFIN 449.85 -1.23% 11188750 14.38%
BOSCHLTD 19247.70 -1.90% 165000 11.61%
SAIL 49.95 -4.40% 87168000 11.31%
WOCKPHARMA 502.55 -2.96% 3993300 10.81%
TV18BRDCST 36.20 -5.11% 55354000 9.97%
EXIDEIND 251.85 -3.60% 4948000 9.91%
EQUITAS 120.10 -1.27% 10948000 9.61%
ENGINERSIN 118.85 -3.77% 8130300 9.44%
-47
7
40
8
-41
8
46
0
42
6
-54
0
-99
0
-95
1
-81
8
-59
9
-1200
-1000
-800
-600
-400
-200
0
200
400
600
04-Jan 07-Jan 08-Jan 09-Jan 10-Jan 11-Jan 14-Jan 15-Jan 16-Jan 17-Jan -73
6
10
18
-70
5
13
79
27
98
-25
8
-32
5
21
51
-32
6
40
8
-1000
-500
0
500
1000
1500
2000
2500
3000
04-Jan 07-Jan 08-Jan 09-Jan 10-Jan 11-Jan 14-Jan 15-Jan 16-Jan 17-Jan
10
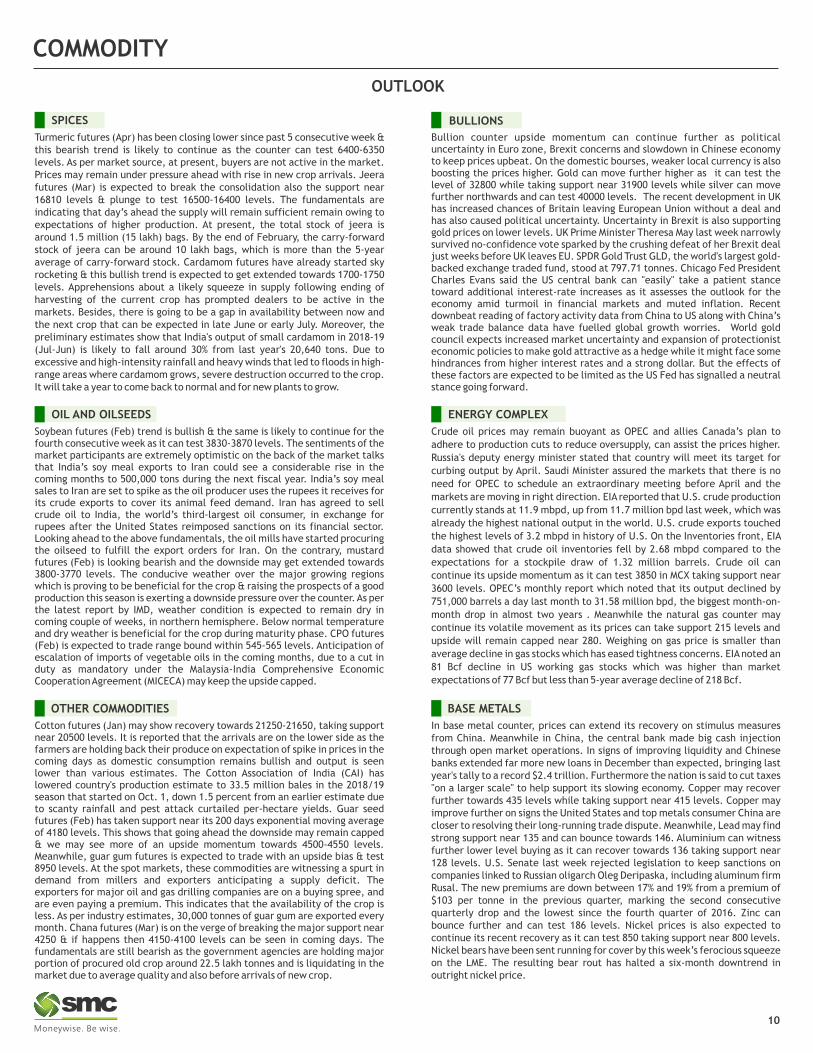
Turmeric futures (Apr) has been closing lower since past 5 consecutive week & this bearish trend is likely to continue as the counter can test 6400-6350 levels. As per market source, at present, buyers are not active in the market. Prices may remain under pressure ahead with rise in new crop arrivals. Jeera futures (Mar) is expected to break the consolidation also the support near 16810 levels & plunge to test 16500-16400 levels. The fundamentals are indicating that day’s ahead the supply will remain sufficient remain owing to expectations of higher production. At present, the total stock of jeera is around 1.5 million (15 lakh) bags. By the end of February, the carry-forward stock of jeera can be around 10 lakh bags, which is more than the 5-year average of carry-forward stock. Cardamom futures have already started sky rocketing & this bullish trend is expected to get extended towards 1700-1750 levels. Apprehensions about a likely squeeze in supply following ending of harvesting of the current crop has prompted dealers to be active in the markets. Besides, there is going to be a gap in availability between now and the next crop that can be expected in late June or early July. Moreover, the preliminary estimates show that India's output of small cardamom in 2018-19 (Jul-Jun) is likely to fall around 30% from last year's 20,640 tons. Due to excessive and high-intensity rainfall and heavy winds that led to floods in high-range areas where cardamom grows, severe destruction occurred to the crop. It will take a year to come back to normal and for new plants to grow.
SPICES
Bullion counter upside momentum can continue further as political uncertainty in Euro zone, Brexit concerns and slowdown in Chinese economy to keep prices upbeat. On the domestic bourses, weaker local currency is also boosting the prices higher. Gold can move further higher as it can test the level of 32800 while taking support near 31900 levels while silver can move further northwards and can test 40000 levels. The recent development in UK has increased chances of Britain leaving European Union without a deal and has also caused political uncertainty. Uncertainty in Brexit is also supporting gold prices on lower levels. UK Prime Minister Theresa May last week narrowly survived no-confidence vote sparked by the crushing defeat of her Brexit deal just weeks before UK leaves EU. SPDR Gold Trust GLD, the world's largest gold-backed exchange traded fund, stood at 797.71 tonnes. Chicago Fed President Charles Evans said the US central bank can "easily" take a patient stance toward additional interest-rate increases as it assesses the outlook for the economy amid turmoil in financial markets and muted inflation. Recent downbeat reading of factory activity data from China to US along with China’s weak trade balance data have fuelled global growth worries. World gold council expects increased market uncertainty and expansion of protectionist economic policies to make gold attractive as a hedge while it might face some hindrances from higher interest rates and a strong dollar. But the effects of these factors are expected to be limited as the US Fed has signalled a neutral stance going forward.
BULLIONS
Soybean futures (Feb) trend is bullish & the same is likely to continue for the fourth consecutive week as it can test 3830-3870 levels. The sentiments of the market participants are extremely optimistic on the back of the market talks that India’s soy meal exports to Iran could see a considerable rise in the coming months to 500,000 tons during the next fiscal year. India’s soy meal sales to Iran are set to spike as the oil producer uses the rupees it receives for its crude exports to cover its animal feed demand. Iran has agreed to sell crude oil to India, the world’s third-largest oil consumer, in exchange for rupees after the United States reimposed sanctions on its financial sector. Looking ahead to the above fundamentals, the oil mills have started procuring the oilseed to fulfill the export orders for Iran. On the contrary, mustard futures (Feb) is looking bearish and the downside may get extended towards 3800-3770 levels. The conducive weather over the major growing regions which is proving to be beneficial for the crop & raising the prospects of a good production this season is exerting a downside pressure over the counter. As per the latest report by IMD, weather condition is expected to remain dry in coming couple of weeks, in northern hemisphere. Below normal temperature and dry weather is beneficial for the crop during maturity phase. CPO futures (Feb) is expected to trade range bound within 545-565 levels. Anticipation of escalation of imports of vegetable oils in the coming months, due to a cut in duty as mandatory under the Malaysia-India Comprehensive Economic Cooperation Agreement (MICECA) may keep the upside capped.
OIL AND OILSEEDS
Crude oil prices may remain buoyant as OPEC and allies Canada’s plan to
adhere to production cuts to reduce oversupply, can assist the prices higher.
Russia's deputy energy minister stated that country will meet its target for
curbing output by April. Saudi Minister assured the markets that there is no
need for OPEC to schedule an extraordinary meeting before April and the
markets are moving in right direction. EIA reported that U.S. crude production
currently stands at 11.9 mbpd, up from 11.7 million bpd last week, which was
already the highest national output in the world. U.S. crude exports touched
the highest levels of 3.2 mbpd in history of U.S. On the Inventories front, EIA
data showed that crude oil inventories fell by 2.68 mbpd compared to the
expectations for a stockpile draw of 1.32 million barrels. Crude oil can
continue its upside momentum as it can test 3850 in MCX taking support near
3600 levels. OPEC’s monthly report which noted that its output declined by
751,000 barrels a day last month to 31.58 million bpd, the biggest month-on-
month drop in almost two years . Meanwhile the natural gas counter may
continue its volatile movement as its prices can take support 215 levels and
upside will remain capped near 280. Weighing on gas price is smaller than
average decline in gas stocks which has eased tightness concerns. EIA noted an
81 Bcf decline in US working gas stocks which was higher than market
expectations of 77 Bcf but less than 5-year average decline of 218 Bcf.
ENERGY COMPLEX
Cotton futures (Jan) may show recovery towards 21250-21650, taking support near 20500 levels. It is reported that the arrivals are on the lower side as the farmers are holding back their produce on expectation of spike in prices in the coming days as domestic consumption remains bullish and output is seen lower than various estimates. The Cotton Association of India (CAI) has lowered country's production estimate to 33.5 million bales in the 2018/19 season that started on Oct. 1, down 1.5 percent from an earlier estimate due to scanty rainfall and pest attack curtailed per-hectare yields. Guar seed futures (Feb) has taken support near its 200 days exponential moving average of 4180 levels. This shows that going ahead the downside may remain capped & we may see more of an upside momentum towards 4500-4550 levels. Meanwhile, guar gum futures is expected to trade with an upside bias & test 8950 levels. At the spot markets, these commodities are witnessing a spurt in demand from millers and exporters anticipating a supply deficit. The exporters for major oil and gas drilling companies are on a buying spree, and are even paying a premium. This indicates that the availability of the crop is less. As per industry estimates, 30,000 tonnes of guar gum are exported every month. Chana futures (Mar) is on the verge of breaking the major support near 4250 & if happens then 4150-4100 levels can be seen in coming days. The fundamentals are still bearish as the government agencies are holding major portion of procured old crop around 22.5 lakh tonnes and is liquidating in the market due to average quality and also before arrivals of new crop.
OTHER COMMODITIES
In base metal counter, prices can extend its recovery on stimulus measures from China. Meanwhile in China, the central bank made big cash injection through open market operations. In signs of improving liquidity and Chinese banks extended far more new loans in December than expected, bringing last year's tally to a record $2.4 trillion. Furthermore the nation is said to cut taxes "on a larger scale" to help support its slowing economy. Copper may recover further towards 435 levels while taking support near 415 levels. Copper may improve further on signs the United States and top metals consumer China are closer to resolving their long-running trade dispute. Meanwhile, Lead may find strong support near 135 and can bounce towards 146. Aluminium can witness further lower level buying as it can recover towards 136 taking support near 128 levels. U.S. Senate last week rejected legislation to keep sanctions on companies linked to Russian oligarch Oleg Deripaska, including aluminum firm Rusal. The new premiums are down between 17% and 19% from a premium of $103 per tonne in the previous quarter, marking the second consecutive quarterly drop and the lowest since the fourth quarter of 2016. Zinc can bounce further and can test 186 levels. Nickel prices is also expected to continue its recent recovery as it can test 850 taking support near 800 levels. Nickel bears have been sent running for cover by this week’s ferocious squeeze on the LME. The resulting bear rout has halted a six-month downtrend in outright nickel price.
BASE METALS

11
TREND SHEET
Closing as on 17.01.19
EXCHANGE COMMODITY CONTRACT CLOSING DATE TREND TREND RATE TREND SUPPORT RESISTANCE CLOSING
PRICE CHANGED CHANGED STOP/LOSS
NCDEX SOYABEAN FEB 3753.00 31.12.18 UP 3444.00 3650.00 - 3600.00
NCDEX JEERA MAR 17020.00 17.01.19 Sideways 17020.00 16800.00 17500.00 -
NCDEX REF.SOY OIL FEB 754.40 07.01.19 UP 739.75 751.00 - 748.00
NCDEX RMSEED FEB 3871.00 19.11.18 Down 4133.00 - 3950.00 3980.00
NCDEX CHANA MAR 4285.00 24.12.18 Down 4520.00 - 4420.00 4460.00
NCDEX GUARSEED FEB 4378.00 17.01.19 Sideways 4378.00 4200.00 4450.00 -
NCDEX COCUD FEB 1990.50 01.01.19 UP 1940.50 1915.00 - 1885.00
NCDEX CASTOR FEB 5258.00 31.12.18 UP 5336.00 5200.00 - 5110.00
MCX CPO JAN 547.80 10.12.18 UP 503.00 542.00 - 536.00
MCX MENTHA OIL JAN 1602.80 26.12.18 UP 1510.00 1566.00 - 1545.00
MCX SILVER MAR 39400.00 27.12.18 UP 38690.00 38850.00 - 38550.00
MCX GOLD FEB 32268.00 03.12.18 UP 31406.00 32000.00 - 31800.00
MCX COPPER FEB 423.25 16.01.19 UP 421.45 417.00 - 411.00
MCX LEAD JAN 139.55 10.01.19 Sideways 139.30 136.00 141.50 -
MCX ZINC JAN 181.60 07.01.19 UP 176.10 177.00 - 175.00
MCX NICKEL JAN 821.40 08.01.19 UP 785.20 798.00 - 783.00
MCX ALUMINIUM JAN 131.45 16.01.19 UP 131.20 129.00 - 127.00
MCX CRUDE OIL FEB 3724.00 02.01.19 UP 3328.00 3600.00 - 3510.00
MCX NATURAL GAS JAN 247.90 17.01.19 Sideways 247.90 218.00 264.00 -
TECHNICAL RECOMMENDATIONS
One can buy at Rs. 423 for a target of Rs. 435 with the stop loss of Rs. 417.
One can buy at Rs. 180 for a target of Rs. 184 with the stop loss of Rs. 178.
One can buy at Rs. 17000 for a target of Rs. 17500 with the stop loss of Rs 16750.
JEERA NCDEX (MAR) contract was closed at Rs. 17020 on 18th Jan’19. The contract
made its high of Rs. 19400 on 1st Nov’18 and a low of Rs. 16700 on 24th Dec’18. The 18-
day Exponential Moving Average of the commodity is currently at Rs. 17138.57. On the
daily chart, the commodity has Relative Strength Index (14-day) value of 45.368.
ZINC MCX (JAN) contract closed at Rs. 181.60 on 17th Jan’19. The contract made its
high of Rs. 201.20 on 10th Oct’18 and a low of Rs. 167.20 on 3rd Jan’19. The 18-day
Exponential Moving Average of the commodity is currently at Rs. 177.55. On the daily
chart, the commodity has Relative Strength Index (14-day) value of 62.54.
COPPER MCX (FEB) contract closed at Rs. 423.25 on 17th Jan’19. The contract made its
high of Rs. 475.30 on 4th Oct’18 and a low of Rs. 397.40 on 3rd Jan’19. The 18-day
Exponential Moving Average of the commodity is currently at Rs. 418.60.On the daily
chart, the commodity has Relative Strength Index (14-day) value of 56.51.

NEWS DIGEST
In the week gone by, bullion counter continued its upside rally as gold prices in MCX crossed the key level of 32300 while silver crossed 39500 owing to political uncertainty in Euro zone and Brexit concerns. Further, factors such as extended partial shutdown of US government and possible pause on interest rate hike also gave underlying support to the bullion market. Dollar index recovered towards 96 taking support at 95 which kept the local currency rupee under pressure. Subdued domestic growth and uncertainty ahead of general elections has also dented the outlook for Indian currency. Base metals saw some fresh buying as Nickel led the recovery followed by zinc and aluminium. Nickel crossed the key level of 830 last week. Treasury Secretary Steven Mnuchin and some Trump administration officials are pushing for the US to lift tariffs on Chinese goods to calm worried investors and get Beijing on board with a larger trade deal. China’s move to inject liquidity into financial system boosted expectations of higher demand. The PBoC is injecting 250 billion yuan ($37 billion) through seven-day reverse bond repurchase agreements and 150 billion yuan through 28-day reverse repos. Natural gas was the pick of the commodities last week as it surged sharply higher amid colder weather conditions and tested 260 levels in MCX. The price was up early on colder than normal weather which is forecast to cover most of the United States for the next 8-14 days. In crude oil, prices continued its recovery for third consecutive week as it crossed $52.7 in NYMEX and 3750 in MCX. OPEC cut oil output sharply in December before a new accord to limit supply took effect suggesting that producers have made a strong start to averting a glut in 2019 as a slowing economy curbs demand. The biggest drop in OPEC supply last month came from Saudi Arabia and amounted to 468,000 bpd.
In agri counter, Soybean prices continued its rally upside as it crossed the key level of 3780 on strong global market and high meal demand from Iran. Cotton prices ended in green as its prices edged higher in Punjab, Haryana and upper Rajasthan due to shortage in this season & positive global cues. Chana traded with bearish bias amid weaker sentiments due to continued selling of stock at lower rates by Nafed. Nafed has sold around 4.69 lakh tonnes of Chana as on January 10, 2019 in various states from the total procured quantity of 27.22 lakh tonnes. In spices; turmeric witnessed selling pressure in the prices owing to higher arrivals whereas jeera bounced back on less the carryover stocks.
12
NCDEX TOP GAINERS & LOSERS (% Change) MCX TOP GAINERS & LOSERS (% Change)
WEEKLY COMMENTARY
COMMODITY UNIT 09.01.19 16.01.19 DIFFERENCE
QTY. QTY.
BRASS MT 1.93 1.93 0.00
CARDAMOM MT 7.40 9.10 1.70
COTTON BALES 48500.00 61100.00 12600.00
GOLD KGS 19.00 19.00 0.00
GOLD MINI KGS 19.30 4.10 -15.20
GOLD GUINEA KGS 4.58 2.97 -1.61
MENTHA OIL KGS 425740.80 423577.45 -2163.35
SILVER (30 KG Bar) KGS 36913.01 32672.74 -4240.27
WEEKLY STOCK POSITIONS IN WAREHOUSE (MCX)
COMMODITY UNIT 10.01.19 17.01.19 DIFFERENCE
QTY. QTY.
CASTOR SEED MT 50449 47122 -3327
CHANA MT 12244 8925 -3319
CORIANDER MT 3775 3475 -300
COCUD MT 16158 20741 4583
GUARGUM MT 16870 16689 -181
GUARSEED MT 18707 21107 2400
JEERA NEW MT 625 586 -39
RM SEED MT 7712 8766 1054
SOYBEAN MT 129031 130756 1725
WEEKLY STOCK POSITIONS IN WAREHOUSE (NCDEX)
• As per latest release of Solvent Extraction of Indian (SEA),
Vegetable Oils (edible & non-edible) imports during
December 2018 is estimated higher by 11% at 1,211,164
tons compared to 1,088,783 tons in December 2017.
• Sebi issued a consultation paper to allow trading in
commodity-index-based futures.
• BSE has received markets regulator Sebi's approval to
launch Gold Mini, Guarseed and Guargum future
contracts on its commodity derivatives segment.
• The Export of Soybean Meal and other Soy Value Added Products
during first quarter of current oil year 2018-19 i.e. during
October 2018 to December 2018 was 6.74 lakh MT as against
6.90 lakh tons during the same period last year declined by 2.3%
over the last year. - Soybean Processors Association of India.
• China's 2018 imports of unwrought copper rose 12.9%
from a year earlier to a record annual high of 5.3 million
tonnes.
• China plans to set a lower economic growth target of 6-6.5%
in 2019 compared with last year’s target of around 6.5%.
• China's central bank injected a record $83 billion into the
country's financial system, seeking to avoid a cash crunch
that would put further pressure on the weakening economy.
• Crude oil output from the United States is expected to
rise to a new record of more than 12 million barrels per
day (bpd) this year and to climb to nearly 13 million bpd
next year.
14.24
3.04 2.792.06 2.00
-2.00
0.00
2.00
4.00
6.00
8.00
10.00
12.00
14.00
16.00
NATURALGAS ZINC CARDAMOM ALUMINIUM NICKEL CASTORSEED MENTHAOIL LEADMINI LEAD
-1.13-0.64 -0.39 -0.36
-3.00
-2.00
-1.00
0.00
1.00
2.00
3.00
4.00
5.00
6.00
7.00
GUARGUM 5MT Cocud GUAR SEED 10 SOYABEAN KAPASNEW CORIANDER WHEATKOTA TURMERIC CHANA PEPPER
5.75
4.16 4.09
3.53
1.68
-1.87
-1.53-1.27
-0.99 -0.95
COMMODITY
PRICES OF METALS IN LME/ COMEX/ NYMEX (in US $)
WEEKLY STOCK POSITIONS IN LME (IN TONNES)
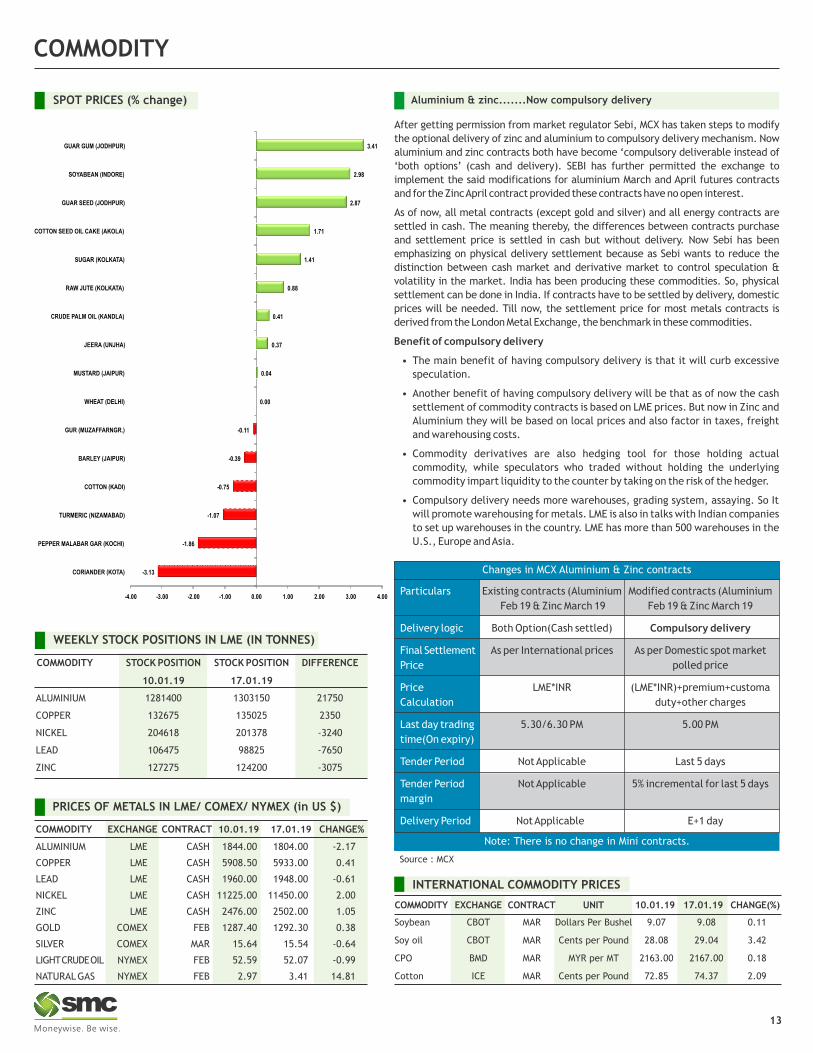
SPOT PRICES (% change) Aluminium & zinc.......Now compulsory delivery
13
COMMODITY EXCHANGE CONTRACT 10.01.19 17.01.19 CHANGE%
ALUMINIUM LME CASH 1844.00 1804.00 -2.17
COPPER LME CASH 5908.50 5933.00 0.41
LEAD LME CASH 1960.00 1948.00 -0.61
NICKEL LME CASH 11225.00 11450.00 2.00
ZINC LME CASH 2476.00 2502.00 1.05
GOLD COMEX FEB 1287.40 1292.30 0.38
SILVER COMEX MAR 15.64 15.54 -0.64
LIGHT CRUDE OIL NYMEX FEB 52.59 52.07 -0.99
NATURAL GAS NYMEX FEB 2.97 3.41 14.81
COMMODITY STOCK POSITION STOCK POSITION DIFFERENCE
10.01.19 17.01.19
ALUMINIUM 1281400 1303150 21750
COPPER 132675 135025 2350
NICKEL 204618 201378 -3240
LEAD 106475 98825 -7650
ZINC 127275 124200 -3075
After getting permission from market regulator Sebi, MCX has taken steps to modify
the optional delivery of zinc and aluminium to compulsory delivery mechanism. Now
aluminium and zinc contracts both have become ‘compulsory deliverable instead of
‘both options’ (cash and delivery). SEBI has further permitted the exchange to
implement the said modifications for aluminium March and April futures contracts
and for the Zinc April contract provided these contracts have no open interest.
As of now, all metal contracts (except gold and silver) and all energy contracts are
settled in cash. The meaning thereby, the differences between contracts purchase
and settlement price is settled in cash but without delivery. Now Sebi has been
emphasizing on physical delivery settlement because as Sebi wants to reduce the
distinction between cash market and derivative market to control speculation &
volatility in the market. India has been producing these commodities. So, physical
settlement can be done in India. If contracts have to be settled by delivery, domestic
prices will be needed. Till now, the settlement price for most metals contracts is
derived from the London Metal Exchange, the benchmark in these commodities.
Benefit of compulsory delivery
• The main benefit of having compulsory delivery is that it will curb excessive
speculation.
• Another benefit of having compulsory delivery will be that as of now the cash
settlement of commodity contracts is based on LME prices. But now in Zinc and
Aluminium they will be based on local prices and also factor in taxes, freight
and warehousing costs.
• Commodity derivatives are also hedging tool for those holding actual
commodity, while speculators who traded without holding the underlying
commodity impart liquidity to the counter by taking on the risk of the hedger.
• Compulsory delivery needs more warehouses, grading system, assaying. So It
will promote warehousing for metals. LME is also in talks with Indian companies
to set up warehouses in the country. LME has more than 500 warehouses in the
U.S., Europe and Asia.
-3.13
-1.86
-1.07
-0.75
-0.39
-0.11
0.00
0.04
-4.00 -3.00 -2.00 -1.00 0.00 1.00 2.00 3.00 4.00
CORIANDER (KOTA)
PEPPER MALABAR GAR (KOCHI)
TURMERIC (NIZAMABAD)
COTTON (KADI)
BARLEY (JAIPUR)
GUR (MUZAFFARNGR.)
WHEAT (DELHI)
MUSTARD (JAIPUR)
JEERA (UNJHA)
CRUDE PALM OIL (KANDLA)
RAW JUTE (KOLKATA)
SUGAR (KOLKATA)
COTTON SEED OIL CAKE (AKOLA)
GUAR SEED (JODHPUR)
SOYABEAN (INDORE)
GUAR GUM (JODHPUR)
0.37
0.41
0.88
1.41
1.71
2.87
2.98
3.41
INTERNATIONAL COMMODITY PRICES
COMMODITY EXCHANGE CONTRACT UNIT 10.01.19 17.01.19 CHANGE(%)
Soybean CBOT MAR Dollars Per Bushel 9.07 9.08 0.11
Soy oil CBOT MAR Cents per Pound 28.08 29.04 3.42
CPO BMD MAR MYR per MT 2163.00 2167.00 0.18
Cotton ICE MAR Cents per Pound 72.85 74.37 2.09
Particulars Existing contracts (Aluminium Modified contracts (Aluminium
Feb 19 & Zinc March 19 Feb 19 & Zinc March 19
Delivery logic Both Option(Cash settled) Compulsory delivery
Final Settlement As per International prices As per Domestic spot market
Price polled price
Price LME*INR (LME*INR)+premium+customa
Calculation duty+other charges
Last day trading 5.30/6.30 PM 5.00 PM
time(On expiry)
Tender Period Not Applicable Last 5 days
Tender Period Not Applicable 5% incremental for last 5 days
margin
Delivery Period Not Applicable E+1 day
Changes in MCX Aluminium & Zinc contracts
Note: There is no change in Mini contracts.
Source : MCX

CURRENCY
Currency Table
Currency Pair Open High Low Close
USD/INR 70.5225 71.4775 70.5225 71.0875
EUR/INR 81.2775 81.7975 81.00 81.1025
GBP/INR 90.51 92.02 90.51 91.5925
JPY/INR 65.2650 65.90 65.2650 65.3875
News Flows of last week
EUR/INR (JAN) contract closed at 81.1025 on 17th Jan’ 19. The contract made its
high of 81.7975 on 15th Jan’19 and a low of 81 on 14th Jan’19 (Weekly Basis). The
14-day Exponential Moving Average of the EUR/INR is currently at 81.03
On the daily chart, EUR/INR has Relative Strength Index (14-day) value of 49.26.
One can sell at 81.50 for a target of 80.90 with the stop loss of 81.80.
(* NSE Currency future, Source: Reliable, Open: Monday 9.00 AM IST, Close: Thursday (5.00 PM IST)
14th JAN India's inflation rate slowed further to 2.19% in December.14th JAN Italy Treasury minister sees stagnation rather than recession.15th JAN India's trade gap narrowed amid lower imports.15th JAN RBI to inject Rs 10,000 cr through open market operations this week.15th JAN Euro zone economy weaker than expected, says Mario Draghi.16th JAN RBI further simplifies ECB norms and lifts sectoral curbs.16th JAN As shutdown lingers, Pelosi urges Trump to reschedule State of the Union.17th JAN Business leaders urge to cut key lending rates during a meet with
RBI governor.17th JAN No-deal Brexit is biggest risk to Britain's economy, says IMF.
Market Stance
Last week, rupee traded with weakness on signs of slowdown in domestic as well as
global economies. Even after the rise in Indian bond yields last week, rupee still
wasn’t able to capitalize on intra-market relationship which exists between bonds
and currencies. Crude oil sustained on the higher side which again is a concern for
INR and weighed higher than other factors affecting it. Indian and US inflation slows
down further which makes a case for rate cut by RBI, eventually the weakness in INR
deepened further. Industry leaders also demanded cut in key lending rates during a
meet with RBI governor. The key news flow was from UK where the suspense on
Brexit is still persists. Meanwhile on the cross currency front, it was a mixed week
where Euro and Yen depreciated on weak economic numbers while sterling
appreciated on short covering ahead of cessation on Brexit. Next week, the lack of
news flow from domestic markets could keep the currency in a range but rise in
Crude oil price could impact INR negatively, also the statements from finance
ministry will hold importance. Expect USDINR to stay above 70.70 and gradually
move towards 71.90.
USD/INR (JAN) contract closed at 71.0875 on 17th Jan’ 19. The contract made its
high of 71.4775 on 17th Jan’19 and a low of 70.5225 on 14th Jan’ 18 (Weekly Basis).
The 14-day Exponential Moving Average of the USD/INR is currently at 70.74
On the daily chart, the USD/INR has Relative Strength Index (14-day) value of
53.25. One can buy at 70.75 for the target of 71.35 with the stop loss of 70.45.
GBP/INR (JAN) contract closed at 91.5925 on 17th Jan’ 19. The contract made its
high of 92.02 on 17th Jan’19 and a low of 90.51 on 14th Jan’18 (Weekly Basis). The
14-day Exponential Moving Average of the GBP/INR is currently at 90.49
On the daily chart, GBP/INR has Relative Strength Index (14-day) value of 62.47.
One can sell below 92 for a target of 91 with the stop loss of 92.50.
JPY/INR (JAN) contract closed at 65.3875 on 17th Jan’ 19. The contract made its
high of 65.90 on 15th Jan’19 and a low of 65.2650 on 14th Jan’19 (Weekly Basis).
The 14-day Exponential Moving Average of the JPY/INR is currently at 65
On the daily chart, JPY/INR has Relative Strength Index (14-day) value of 60.90.
One can buy at 64.70 for a target of 65.30 with the stop loss of 64.40.
USD/INRTechnical Recommendation
Economic gauge for the next week
14
JPY/INRGBP/INR
EUR/INR
Date Currency Event Previous
21st JAN EUR German PPI (MoM) (DEC) 0.1%
22nd JAN GBP Average Earnings Index + Bonus (NOV) 3.3%
22nd JAN USD German ZEW Economic Sentiment (JAN) -17.5
22nd JAN USD Existing Home Sales (DEC) 5.32M
23rd JAN JPY BOJ Monetary Policy Statement
23rd JAN JPY BOJ Press Confernce
24th JAN EUR Manufacturing PMI (JAN) 51.4
24th JAN EUR ECB Interest Rate Decision (JAN) 0.00%
24th JAN EUR ECB Press Conference
24th JAN USD Manufacturing PMI (JAN) 53.8
25th JAN USD Core Durable Goods Ordrs (MoM) (DEC) 0.4%
25th JAN INR Foreign Exchange Reserves 18-JAN

IPOIPOIPOIPO
15
IPO NEWS
Reliance General Insurance looks to renew its IPO plan
Reliance General Insurance is renewing its Rs 1,500-2,000 crore initial public offering (IPO) plan after the deadline for its previous attempt lapsed in a difficult
market. The wholly-owned unit of Reliance Capital has sought ‘revalidation’ from the Insurance Regulatory & Development Authority of India (IRDA) for it. The
company would file a fresh DRHP (draft red herring prospectus) with the Securities & Exchange Board of India (Sebi) once the insurance regulator revalidates the
plan. The earlier Sebi approval for an IPO had lapsed on November 29, 2018.
IPO drought to end as Polycab, Chalet Hotels, others gear up for share sales
After a three-month drought in the Indian primary market, several companies, including cables and consumer electronic goods maker Polycab Wires Pvt. Ltd and
hotel operator Chalet Hotels Ltd, are gearing up for their public offers. In 2018, 24 companies raised Rs. 30,959 crore through their initial public offerings (IPOs),
while 2017 witnessed 36 companies raising Rs. 67,147 crore through public floats. However, between October and December 2018, companies had desisted from
launching IPOs, considering the highly volatile stock market.
*Closing price as on 17-01-2019
IPO TRACKER
Company Sector M.Cap (In Rs Cr.) Issue Size (in Rs Cr.) List Date Issue Price List Price Last Price %Gain/Loss (from Issue price)*
Garden Reach Shipbuilding Shipping 1073.35 345.00 10-Oct-18 118.00 104.00 92.25 -21.82
AAVAS Financiers Ltd NBFC 6676.39 1734.00 8-Oct-18 821.00 758.00 852.50 3.84
Ircon International Ltd Railway 421.20 470.00 28-Sep-18 475.00 410.30 421.20 -11.33
CreditAccess Grameen Ltd. NBFC 5706.21 1131.00 23-Aug-18 422.00 393.00 396.90 -5.95
HDFC Asset Management Co AMC 31371.77 2800.00 6-Aug-18 1100.00 1726.25 1474.00 34.00
TCNS Clothing Co. Limited Retail 4456.77 1125.00 30-Jul-18 716.00 715.00 726.85 1.52
Varroc Engineering Limited Auto Ancillary 9675.66 1945.00 6-Jul-18 967.00 1015.00 715.15 -26.04
Fine Organic Industries Limited FMCG 3661.96 600.00 6-Jul-18 783.00 815.00 1190.40 52.03
RITES Limited Railway 5099.46 460.00 6-Jul-18 185.00 190.00 255.80 38.27
Indostar Capital Finance Ltd NBFC 3229.92 1844.00 21-May-18 572.00 600.00 350.75 -38.68
Lemon Tree Hotels ltd Hotel 5496.15 1038.00 9-Apr-18 56.00 61.60 69.15 23.48
ICICI Securities Ltd Broking House 7904.14 4016.00 4-Apr-18 520.00 431.10 247.95 -52.32
Mishra Dhatu Nigam Ltd Metal 2433.34 439.00 4-Apr-18 90.00 87.00 129.80 44.22
Karda Construction Ltd Construction 256.91 78.00 2-Apr-18 180.00 136.00 207.55 15.31
Sandhar Technologies Ltd Auto Industry 1560.91 513.00 2-Apr-18 332.00 345.00 259.15 -21.94
Hindustan Aeronautics Ltd Defence 26066.64 4229.00 28-Mar-18 1240.00 1169.00 775.20 -37.48
Bandhan Bank Ltd Bank 53708.60 4473.00 27-Mar-18 375.00 485.00 449.90 19.97
Bharat Dynamics Ltd Defence 5350.20 961.00 23-Mar-18 428.00 360.00 292.75 -31.60
H.G. Infra Engineering Ltd Infrastructure 1300.25 4229.00 9-Mar-18 270.00 270.00 199.95 -25.94
Aster DM Healthcare Health Care 8245.06 981.00 26-Feb-18 190.00 182.10 163.40 -14.00
Galaxy Surfactants Ltd FMCG 4170.39 937.00 8-Feb-18 1480.00 1520.00 1170.45 -20.92
Amber Enterprises India Consumer Durables 2831.80 600.00 30-Jan-18 859.00 1180.00 896.55 4.37
Newgen Software Technologies Software 2064.06 424.00 29-Jan-18 245.00 253.00 306.80 25.22
Apollo Micro Systems Ltd Defense 257.96 156.00 22-Jan-18 275.00 478.00 124.75 -54.64
Astron Paper & Board Mill paper 523.92 70.00 28-Dec-17 50.00 120.00 111.35 122.70
Future Supply Chain Solutions Ltd Logistics 2646.54 650.00 18-Dec-17 664.00 674.00 660.00 -0.60
Shalby Ltd Hopsital 1586.20 504.00 15-Dec-17 248.00 237.00 146.40 -40.97
HDFC Standard Life Insurance Ltd Insurance 78928.91 8695.00 17-Nov-17 290.00 311.00 390.15 34.53
Khadim India Ltd Footwear 885.32 544.00 14-Nov-17 750.00 727.00 491.15 -34.51
New India Assurance Co. Ltd. Insurance 30108.21 9600.00 13-Nov-17 800.00 748.90 185.30 -76.84
Mahindra Logistics Ltd Logistics 3577.53 830.00 10-Nov-17 429.00 432.00 502.75 17.19
Reliance Nippon Life Insurance 9404.26 1542.00 6-Nov-17 252.00 294.00 153.45 -39.11
GIC of India General Insurance 45311.99 11373.00 25-Oct-17 912.00 850.00 257.70 -71.74
Indian Energy Exchange Power Trading 4986.81 1000.00 23-Oct-17 1650.00 1500.00 163.70 -90.08
MAS Financial Services Financial Services 3053.41 460.00 18-Oct-17 459.00 660.00 551.80 20.22
Godrej Agrovet Agri Business 9744.36 1157.00 16-Oct-17 460.00 621.00 507.45 10.32
Prataap Snacks Ltd FMCG 2441.96 482.00 5-Oct-17 938.00 1250.00 1030.25 9.83

FIXED DEPOSIT MONITOR
* Interest Rate may be revised by company from time to time. Please confirm Interest rates before submitting the application.
* For Application of Rs.50 Lac & above, Contact to Head Office.
* Email us at [email protected]
FIXED DEPOSIT COMPANIES
PERIOD ADDITIONAL RATE OF INTEREST (%) MIN.
INVESTMENTS.NO (NBFC COMPANY -NAME)
12M 18M 24M 36M 45M 48M 60M 84M
SR. CITIZEN BENEFIT: 0.25% EXTRA FOR
12M TO 35M & 0.40% EXTRA FOR 36M TO 120M
OR 0.05% EXTRA FOR WOMEN CUSTOMERS
0.40% EXTRA FOR SR CITIZEN,WIDOW, EXISTINGDHFL HOME BORROWERS & DHFL MORTGAGE &SME LOAN CUSTOMERS, 0.15% EXTRA FORRENEWAL BUT APP SHOULD REACH IN COMPANYBEFORE DUE DATE.
(Rs.)
96-120M=7.75%; 0.25% FOR FEMALE, SENIORCITIZEN & TRUST
HDFC LTD- PREMIUM DEPOSIT FOR INDIVIDUAL(UPTO RS. 2 CR.)
DEWAN HOUSING FINANCE CORPORATION LTD
FOR < RS. 5 CRORE
DEWAN HOUSING FINANCE CORPORATION LTD
(AASHRAY) FOR < RS. 5 CRORE
0.35% EXTRA FOR SR. CITIZEN OR 0.25% EXTRAFOR EXISTING CUSTOMER (2 MONTH GAP INFIRST & SECOND DEPOSIT) & 0.25% EXTRA IN RENEWAL UPTO RS.5 CR.
AADHAR HOUSING FINANCE LTD. (< RS. 5 CR.)
(FOR TRUST ONLY) (FOR WOMEN ONLY)
0.25% FOR SENIOR CITIZEN UPTO RS. 2 CR.
0.50% ADD. INTEREST TO SR. CITIZEN,EMPLOYEES,SHAREHOLDERS AND PERSON INVESTING RS. 5 LACS AND ABOVE - MAX. 0.50%
20000/- BUT
40000/-
IN MONTHLY
8.50 8.75 9.00 - 9.00 9.00 8.801
8.00 15M=8.05% 8.15 8.75 - 8.75 8.75 -2 BAJAJ FINANCE LTD.(UPTO RS. 5 CR.)
5000/-
413M=8.25% 14M=8.30% 18M=8.30% 40M=9.00%
25000/-
5000/-
5 8.25 - 8.50 9.00 - 9.00 9.00 9.00 5000/-
7.75 13M=7.75 7.75 8.00 - 8.00 8.00 8.258 GRUH FINANCE LTD. 1000/-
9 15M=8.03 22M=8.14 30M=8.08 44M=8.14
HDFC LTD- SPECIAL DEPOSIT FOR INDIVIDUAL(UPTO RS. 2 CR.)
0.25% FOR SENIOR CITIZEN UPTO RS. 2 CR.33M=8.19 - - 66M=8.19 - -
HDFC LTD- REGULAR DEPOSIT FOR INDIVIDUAL(UPTO RS.2 CR.)
0.25% FOR SENIOR CITIZEN UPTO RS. 1 CR.7.98 - 7.98 7.98 - 7.98 7.98 -
HDFC LTD- REGULAR FOR INDIVIDUAL & TRUST(>RS.2 CR TO RS. 10 CR)
0.25% FOR SENIOR CITIZEN UPTO RS. 1 CR.8.24 - 8.24 8.24 - 8.24 8.24 -
HDFC LTD- PREMIUM DEPOSIT FOR TRUST &INSTITUTION (UPTO RS. 2 CR.)
-13 15M=8.19 - - 30M=8.19 - -
HDFC LTD- SPECIAL DEPOSIT FOR TRUST(UPTO RS. 2 CR.)
0.25% FOR SENIOR CITIZEN UPTO RS. 2 CR.33M=8.24 - - 66M=8.24 - -14
HDFC LTD- REGULAR DEPOSIT FOR TRUST &INSTITUTION (UPTO RS.2 CR.)
0.25% FOR SENIOR CITIZEN UPTO RS. 1 CR.8.08 - 8.08 8.08 - 8.08 8.08 -15
7.50 - 7.50 7.50 - 7.25 7.25 -HUDCO LTD.(IND & HUF) 10000/-16 0.25% FOR SENIOR CITIZEN
7.25 - 7.25 7.25 - 7.00 7.00 -HUDCO LTD.(TRUST/CO/INSTITUTION) 10000/-17 -
8.00 - 8.25 8.35 - - - -J K LAKSHMI CEMENT LTD18
0.50% ADD. INTEREST TO SR. CITIZEN,EMPLOYEES, SHAREHOLDERS AND PERSONINVESTING RS. 5 LACS AND ABOVE - MAX. 0.50%
8.00 - 8.25 8.35 - - - -J K TYRE INDUSTRIES LTD.19
8.50 - 8.50 8.50 - 8.25 8.25 -KTDFC (KERALA TRANSPORT) 10000/-20 0.25% EXTRA FOR SR. CITIZEN
8.15 8.15 8.20 8.25 - - 8.30 -LIC HOUSING FINANCE LTD.(UPTO RS. 25 CR.) 10000/-210.25% FOR SENIOR CITIZEN IF APP ABOVE RS. 50,000/- & 0.10% IF APP UPTO RS. 50,000/-
M&M FINANCIAL SERVICES LTD(FOR BELOW RS. 1 CRORE) 8.10 8.10 8.50 8.80 - 8.80 8.80 -22 10000/-0.25% FOR SENIOR CITIZEN
10.50 - 11.00 11.50 - - - -OMAXE LTD23 -
8.30 - 8.30 8.40 - 8.40 8.45 8.30PNB HOUSING FINANCE LTD.(UPTO RS. 5 CR.)
10000/-
24 0.25% EXTRA FOR SR. CITIZEN UPTO RS.1 CRORE
15M=8.30 22M=8.35 30M=8.30 44M=8.45 PNB HOUSING FINANCE LTD.(UPTO RS. 5 CR.)25 0.25% FOR SENIOR CITIZEN
8.25 - 8.50 9.00 - 9.00 9.25 -SHRIRAM TRANSPORT FINANCE-UNNATI SCHEME 5000/-260.25% FOR SENIOR CITIZEN,0.25% EXTRA FOR RENEWALS
8.25 - 8.50 9.00 - 9.00 9.25 -SHRIRAM CITY UNION SCHEME 5000/-270.25% FOR SENIOR CITIZEN,0.25% EXTRA FOR RENEWALS
7.75 8.00 8.00 8.00 - 8.25 8.25 8.003 CENT BANK HOME FINANCE (ONLY RENEWAL)
CUM-5000/-NON CUM-
10000/-
12
0.25% FOR SENIOR CITIZEN
0.40% EXTRA FOR SR CITIZEN,WIDOW, EXISTINGDHFL HOME BORROWERS & DHFL MORTGAGE &SME LOAN CUSTOMERS, 0.15% EXTRA FORRENEWAL BUT APP SHOULD REACH IN COMPANYBEFORE DUE DATE.
DEWAN HOUSING FINANCE CORPORATION LTD
FOR RS. 5 CRORE & ABOVE
DEWAN HOUSING FINANCE CORPORATION LTD
(AASHRAY) FOR RS. 5 CRORE & ABOVE
(FOR TRUST ONLY) (FOR WOMEN ONLY)6
13M=8.50% 14M=8.50% 18M=8.50% 40M=9.00% 5000/-
7 8.50 - 8.60 9.00 - 9.00 9.00 9.00 5000/-
10
11
16

INDUSTRY & FUND UPDATE
Sebi issues norms for mutual funds investments in derivatives
Markets regulator Sebi has decided to allow mutual funds to write call options subject to certain conditions. Generally, call options refer to an
agreement that gives a buyer the right to purchase an asset at a specified price within a particular time period. Currently, mutual fund schemes are
permitted to undertake transactions in equity derivatives but cannot write options or purchase instruments with embedded written options. In a
circular, Sebi said mutual fund schemes (except Index Funds and ETFs) can write call options only under a covered call strategy for constituent stocks
of Nifty 50 and Sensex indices. "The total notional value (taking into account strike price as well as premium value) of call options written by a scheme
shall not exceed 15 per cent of the total market value of equity shares held in that scheme," it said. Further, the total number of shares underlying the
call options written should not exceed 30 per cent of the unencumbered shares of a particular company held in the scheme. "In no case, a scheme shall
write a call option without holding the underlying equity shares. A call option can be written only on shares which are not hedged using other
derivative contracts," the circular said. According to Sebi, the call option written should be marked to market daily and the respective gains or losses
factored into the daily net asset value of the respective scheme until the position closes or expires.
MUTUAL FUND Performance Charts
17
NEW FUND OFFER
Scheme Name ICICI Prudential FMP - Series 84 - 1188 Days Plan Z - Regular Plan (G)
Fund Type Close-Ended
Fund Class Growth
Opens on 08-Jan-2019
Closes on 21-Jan-2019
Investment Objective To seek to generate income by investing in a portfolio of fixed income securities/debt instruments maturing on or before the maturity of the Scheme.
Min. Investment Rs. 5000/-
Fund Manager Rahul Goswami / Rohan Maru
Scheme Name DHFL Pramerica Fixed Duration Fund - Series BI
Fund Type Close-Ended
Fund Class Income
Opens on 11-Jan-2019
Closes on 25-Jan-2019
Investment Objective To generate income by investing in debt and money market instruments maturing on or before the date of the maturity of the Scheme. However, there can be no assurance that the investment objective of the Scheme will be realized.
Min. Investment Rs.1000/-
Fund Manager Kumaresh Ramakrishnan
Scheme Name Aditya Birla Sun Life Dual Advantage Fund - Series 2
Fund Type Close-Ended
Fund Class Income
Opens on 17-Jan-2019
Closes on 31-Jan-2019
Investment Objective The primary investment objective of the Scheme is to generate income by investing in a portfolio of fixed income securities maturing on or before the maturity of the Scheme
Min. Investment Rs.1000/-
Fund Manager Mohit Sharma
Scheme Name Reliance Fixed Horizon Fund - XXXX - Series 12 (1215D) - Regular Plan (G)
Fund Type Close-Ended
Fund Class Growth
Opens on 14-Jan-2019
Closes on 28-Jan-2019
Investment Objective To seek to generate returns and growth of capital by investing in a diversified portfolio.
Min. Investment Rs.5000/-
Fund Manager Amit Tripathi
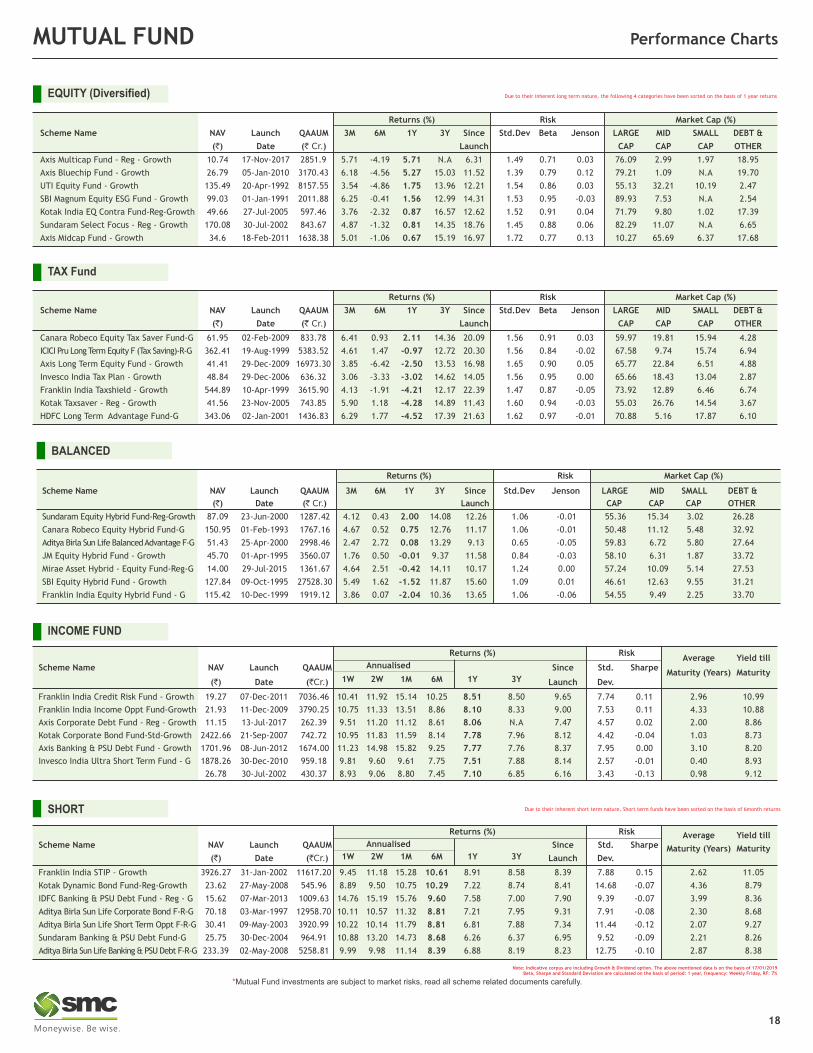
Note: Indicative corpus are including Growth & Dividend option . The above mentioned data is on the basis of 17/01/2019Beta, Sharpe and Standard Deviation are calculated on the basis of period: 1 year, frequency: Weekly Friday, RF: 7%
MUTUAL FUND Performance Charts
Returns (%) Risk Market Cap (%)
Scheme Name NAV Launch QAAUM 3M 6M 1Y 3Y Since Std.Dev Beta Jenson LARGE MID SMALL DEBT &
(`) Date (` Cr.) Launch CAP CAP CAP OTHER
Canara Robeco Equity Tax Saver Fund-G 61.95 02-Feb-2009 833.78 6.41 0.93 2.11 14.36 20.09 1.56 0.91 0.03 59.97 19.81 15.94 4.28
ICICI Pru Long Term Equity F (Tax Saving)-R-G 362.41 19-Aug-1999 5383.52 4.61 1.47 -0.97 12.72 20.30 1.56 0.84 -0.02 67.58 9.74 15.74 6.94
Axis Long Term Equity Fund - Growth 41.41 29-Dec-2009 16973.30 3.85 -6.42 -2.50 13.53 16.98 1.65 0.90 0.05 65.77 22.84 6.51 4.88
Invesco India Tax Plan - Growth 48.84 29-Dec-2006 636.32 3.06 -3.33 -3.02 14.62 14.05 1.56 0.95 0.00 65.66 18.43 13.04 2.87
Franklin India Taxshield - Growth 544.89 10-Apr-1999 3615.90 4.13 -1.91 -4.21 12.17 22.39 1.47 0.87 -0.05 73.92 12.89 6.46 6.74
Kotak Taxsaver - Reg - Growth 41.56 23-Nov-2005 743.85 5.90 1.18 -4.28 14.89 11.43 1.60 0.94 -0.03 55.03 26.76 14.54 3.67
HDFC Long Term Advantage Fund-G 343.06 02-Jan-2001 1436.83 6.29 1.77 -4.52 17.39 21.63 1.62 0.97 -0.01 70.88 5.16 17.87 6.10
TAX Fund
Returns (%) Risk Market Cap (%)
Scheme Name NAV Launch QAAUM 3M 6M 1Y 3Y Since Std.Dev Beta Jenson LARGE MID SMALL DEBT &
(`) Date (` Cr.) Launch CAP CAP CAP OTHER
Axis Multicap Fund - Reg - Growth 10.74 17-Nov-2017 2851.9 5.71 -4.19 5.71 N.A 6.31 1.49 0.71 0.03 76.09 2.99 1.97 18.95
Axis Bluechip Fund - Growth 26.79 05-Jan-2010 3170.43 6.18 -4.56 5.27 15.03 11.52 1.39 0.79 0.12 79.21 1.09 N.A 19.70
UTI Equity Fund - Growth 135.49 20-Apr-1992 8157.55 3.54 -4.86 1.75 13.96 12.21 1.54 0.86 0.03 55.13 32.21 10.19 2.47
SBI Magnum Equity ESG Fund - Growth 99.03 01-Jan-1991 2011.88 6.25 -0.41 1.56 12.99 14.31 1.53 0.95 -0.03 89.93 7.53 N.A 2.54
Kotak India EQ Contra Fund-Reg-Growth 49.66 27-Jul-2005 597.46 3.76 -2.32 0.87 16.57 12.62 1.52 0.91 0.04 71.79 9.80 1.02 17.39
Sundaram Select Focus - Reg - Growth 170.08 30-Jul-2002 843.67 4.87 -1.32 0.81 14.35 18.76 1.45 0.88 0.06 82.29 11.07 N.A 6.65
Axis Midcap Fund - Growth 34.6 18-Feb-2011 1638.38 5.01 -1.06 0.67 15.19 16.97 1.72 0.77 0.13 10.27 65.69 6.37 17.68
EQUITY (Diversified) Due to their inherent long term nature, the following 4 categories have been sorted on the basis of 1 year returns
Annualised
Returns (%) RiskAverage Yield till
Scheme Name NAV Launch QAAUM Since Std. Sharpe
1W 2W 1M 6M 1Y 3YMaturity (Years) Maturity
(`) Date (`Cr.) Launch Dev.
Franklin India Credit Risk Fund - Growth 19.27 07-Dec-2011 7036.46 10.41 11.92 15.14 10.25 8.51 8.50 9.65 7.74 0.11 2.96 10.99
Franklin India Income Oppt Fund-Growth 21.93 11-Dec-2009 3790.25 10.75 11.33 13.51 8.86 8.10 8.33 9.00 7.53 0.11 4.33 10.88
Axis Corporate Debt Fund - Reg - Growth 11.15 13-Jul-2017 262.39 9.51 11.20 11.12 8.61 8.06 N.A 7.47 4.57 0.02 2.00 8.86
Kotak Corporate Bond Fund-Std-Growth 2422.66 21-Sep-2007 742.72 10.95 11.83 11.59 8.14 7.78 7.96 8.12 4.42 -0.04 1.03 8.73
Axis Banking & PSU Debt Fund - Growth 1701.96 08-Jun-2012 1674.00 11.23 14.98 15.82 9.25 7.77 7.76 8.37 7.95 0.00 3.10 8.20
Invesco India Ultra Short Term Fund - G 1878.26 30-Dec-2010 959.18 9.81 9.60 9.61 7.75 7.51 7.88 8.14 2.57 -0.01 0.40 8.93
26.78 30-Jul-2002 430.37 8.93 9.06 8.80 7.45 7.10 6.85 6.16 3.43 -0.13 0.98 9.12
INCOME FUND
Returns (%) Risk Average Yield tillScheme Name NAV Launch QAAUM Since Std. Sharpe
1W 2W 1M 6M 1Y 3YMaturity (Years) Maturity
(`) Date (`Cr.) Launch Dev.
Franklin India STIP - Growth 3926.27 31-Jan-2002 11617.20 9.45 11.18 15.28 10.61 8.91 8.58 8.39 7.88 0.15 2.62 11.05
Kotak Dynamic Bond Fund-Reg-Growth 23.62 27-May-2008 545.96 8.89 9.50 10.75 10.29 7.22 8.74 8.41 14.68 -0.07 4.36 8.79
IDFC Banking & PSU Debt Fund - Reg - G 15.62 07-Mar-2013 1009.63 14.76 15.19 15.76 9.60 7.58 7.00 7.90 9.39 -0.07 3.99 8.36
Aditya Birla Sun Life Corporate Bond F-R-G 70.18 03-Mar-1997 12958.70 10.11 10.57 11.32 8.81 7.21 7.95 9.31 7.91 -0.08 2.30 8.68
Aditya Birla Sun Life Short Term Oppt F-R-G 30.41 09-May-2003 3920.99 10.22 10.14 11.79 8.81 6.81 7.88 7.34 11.44 -0.12 2.07 9.27
Sundaram Banking & PSU Debt Fund-G 25.75 30-Dec-2004 964.91 10.88 13.20 14.73 8.68 6.26 6.37 6.95 9.52 -0.09 2.21 8.26
Aditya Birla Sun Life Banking & PSU Debt F-R-G 233.39 02-May-2008 5258.81 9.99 9.98 11.14 8.39 6.88 8.19 8.23 12.75 -0.10 2.87 8.38
SHORT Due to their inherent short term nature, Short term funds have been sorted on the basis of 6month returns
Annualised
Returns (%) Risk Market Cap (%)
Scheme Name NAV Launch QAAUM 3M 6M 1Y 3Y Since Std.Dev Jenson LARGE MID SMALL DEBT &
(`) Date (` Cr.) Launch CAP CAP CAP OTHER
Sundaram Equity Hybrid Fund-Reg-Growth 87.09 23-Jun-2000 1287.42 4.12 0.43 2.00 14.08 12.26 1.06 -0.01 55.36 15.34 3.02 26.28
Canara Robeco Equity Hybrid Fund-G 150.95 01-Feb-1993 1767.16 4.67 0.52 0.75 12.76 11.17 1.06 -0.01 50.48 11.12 5.48 32.92
Aditya Birla Sun Life Balanced Advantage F-G 51.43 25-Apr-2000 2998.46 2.47 2.72 0.08 13.29 9.13 0.65 -0.05 59.83 6.72 5.80 27.64
JM Equity Hybrid Fund - Growth 45.70 01-Apr-1995 3560.07 1.76 0.50 -0.01 9.37 11.58 0.84 -0.03 58.10 6.31 1.87 33.72
Mirae Asset Hybrid - Equity Fund-Reg-G 14.00 29-Jul-2015 1361.67 4.64 2.51 -0.42 14.11 10.17 1.24 0.00 57.24 10.09 5.14 27.53
SBI Equity Hybrid Fund - Growth 127.84 09-Oct-1995 27528.30 5.49 1.62 -1.52 11.87 15.60 1.09 0.01 46.61 12.63 9.55 31.21
Franklin India Equity Hybrid Fund - G 115.42 10-Dec-1999 1919.12 3.86 0.07 -2.04 10.36 13.65 1.06 -0.06 54.55 9.49 2.25 33.70
BALANCED
18
*Mutual Fund investments are subject to market risks, read all scheme related documents carefully.

Mr. S C Aggarwal (CMD, SMC Group) presenting the memento to Mr. Ashish Kumar Chauhan (Managing Director& CEO, Bombay Stock Exchange) during the ASSOCATION OF NATIONAL EXCHANGES MEMBERS OF INDIA (ANMI)
10th International Convention - "Capital Markets in the Age of Disruption" held on 12th January, 2019at Hotel Grand Hyatt, Mumbai.
Mr. D K Aggarwal (CMD, SMC Investments & Senior VP – PHD Chamber of Commerce) during the Conferenceon “Transforming Urban Mobility in India & Role of Electric Vehicles” Thursday, 29th November, 2018
at PHD House, New Delhi.

Moneywise Financial Services Pvt. Ltd. (A wholly owned subsidiary of SMC Global Securities Ltd.) Corporate Office: 11/6-B, 2nd Floor, Pusa Road, New Delhi 110005, Tel. +91-11-30111000, CIN No.: U51909WB1996PTC078352
At SMC Finance, We make it easy for you to get a loan.
Whether you are expanding your business, upgrading
new equipments or for working capital. We are here to
help you grow fast.
www.smcfinance.com
Medical Equipment Finance | Personal Loan | Loan Against Property | Loan Against Shares/Mutual Funds/Bonds | MSME/SME Financing | Lease Rental Discounting | Promoter Financing | Debtors Financing | Structured Financing | Affordable Housing Application Financing | IPO/ NCD Financing | Business Loan
Professional and Transparent approach
Quick loan approval & disbursal
Hassle-free documentation process
Attractive Rate of Interest
FOCUS ON YOUR BUSINESS, NOT FINANCEGet easy business loans with SMC Finance
SMC GROUP PRESENCE:
DELHI | MUMBAI | KOLKATA | AHEMDABAD | LUCKNOW | CHANDIGARH | DUBAI
Call Toll-Free 1800 11 8818E-mail [email protected]