Forecasting the Demand of Oil in Ghana: A Statistical Approach
ENERGY COMMISSION, GHANA
2018 ENERGY
(SUPPLY AND DEMAND)
OUTLOOK FOR GHANA
April, 2018

i
Executive Summary
The Energy Commission in fulfilment of its mandate under the Energy Commission Act (Act 541,
1997) presents supply and demand forecasts for electricity, crude oil, petroleum products, natural
gas and charcoal for the year 2018. Factors that could influence the demand and supply are also
discussed.
Electricity
1. As at the end of 2017, the installed electricity generation capacity available for grid
power supply at the transmission level in the country was about 4,310 Megawatt (MW).
The installed capacity increases to 4,398.5 MW if primary embedded generation including
the two major solar power plants at the sub-transmission (distribution grid) level are
added1. This was about 16% expansion over the installed capacity in 2016.
2. Total grid electricity generation in the country including the embedded generation2 was
14,069 Gigawatt-hours (GWh), comprising 39.9% hydro, 59.9% thermal and about 0.2%
solar power. It was about 8.4% more than in 2016.
3. Including imports, the grid electricity at the transmission3 level, was around 14,309(±1%)
GWh comprising about 5,616 GWh (39.2%) from hydro generation, 8,373 GWh (58.5%)
from thermal generation and about 320 GWh (2.2%) of import. It was about 4%
improvement over gross transmission in 2016.
4. Peak load on the transmission grid excluding export4, i.e. the maximum capacity utilized
within the country was 2,077 MW; roughly 4% more than in 2016. The system (maximum
including exports) peak i.e. the maximum capacity utilized on the transmission grid was
2,192 MW, which was about 6% more than in 2016.
5. The total dependable grid capacity (3,890 MW) in 2017 was thus in excess of about
1,700MW (±3%).
1 i.e. Trojan (44 MW), Genser (22 MW), BXC Solar (20 MW) and VRA Solar (2.5 MW). 2 i.e. Trojan, Genser thermal plants and the grid-tied solar plants 3 i.e. does not include embedded generation and solar since they are at the distribution grid level. 4 Referred to as Domestic Peak Load by some of the utilities

ii
6. Captive or self-electricity generation plants which have been installed as alternative or
back-up to the grid supply was estimated at about 3,600 GWh. This is roughly equivalent
to the output of a thermal plant of about 500 MW capacity, depending upon its conversion
efficiency. The usage was largely by non-residential and industrial consumers.
7. In 2017, the average electricity end-user tariff was 76.4 Ghp (17.5 US cents) per unit of
electricity (kilowatt-hour), a drop from 81.7 Ghp (21 US cents) per kilowatt-hour in 2016.
8. End-user tariff since the previous load shedding in 2007 to the beginning of the most recent
load shedding in 2012 averaged up to 11 US cents per kilowatt-hour (kWh) whilst the end-
user tariff from 2013 to 2017 averaged 17 US cents per kWh.
9. The relatively high end-user tariff is likely to have contributed to the significant surge in
the installation of alternative or captive or self-electricity back-up generation largely by the
non-residential and industrial customers of the utilities. The said customers apparently
found the self back-up generation more cost-competitive compared to the grid as their
cumulative electricity consumption units exceeded 300 units per month during the year and
thus making it more attractive for the switch at that consumption level. If this trend
continues, it could worsen the income and profitability of the existing electricity utility
companies.
10. For 2018, the average electricity end-user tariff is expected to drop further to 13-15 US
cents per unit kilowatt-hour) equivalent. Such is expected to make the grid electricity more
cost competitive and invariably more attractive to patronise than their back-up generation
and consequently improves its affordability. The intended reduction would simultaneously,
reduce the excess grid capacity.
11. With the Government’s projected real GDP growth of 6.8%5 and particularly 5.4-6%
(non-oil growth), the total electricity required for the expansion of the country’s economy
in 2018 is expected to be as follows:
5 The World Bank and the IMF projects 8-9% for Ghana for 2018.
iii
a) 16,300 -17,200 GWh (with VALCO constrained to operate at most two potlines).
Expected peak capacity demand required would lie within 2,150-2,300 MW. Average
End-User tariff to make it realized should be within US cents 14-15 per kWh.
b) 17,236 -18,400 GWh (with VALCO constrained to operate at most two potlines).
Expected peak capacity demand required would lie within 2,200-2,400 MW. Average
End-User tariff to make it realized should be within US cents 13-14 per kWh.
c) 18,400-19,500 GWh (with VALCO to operate at most, two potlines). Expected peak
capacity demand required would lie within 2,400-2,600 MW. Average End-User tariff
should be within US cents 11-13 per kWh.
All the three scenarios are achievable provided the following are accomplished:
i. There is adequate financial resource to procure all the fuel needed to run the thermal
power plants even at higher utilisation factors; and
ii. Average end-user-tariff is reduced to within 10-15 US cents per kWh.
Fuel for Power Generation
12. In 2017, total gas flow to the thermal power plants rose to about 43 million mmBTU
(43,360 mmscf), almost 60% more the supply of 2016; only about 17% coming from
Nigeria (18% in 2016) via the WAGP and the remaining 73% (82% in 2016) coming from
Ghana Gas, i.e. the Atuabo gas processing plant. The average daily flow were about 30
mmscfd WAGP and almost 81 mmscfd from Ghana Gas.
13. For 2018, total gas required for power generation would be almost 67 million mmBTU
largely coming from the local fields. The expected average WAGP gas flow would be 60
mmscfd throughout the year, whilst an average of 150 mmscfd could come from Ghana
Gas during the first half of the year. Additional gas is expected from the Sankofa-Gye
Nyame fields during the second half of the year and that could boost average supply range
to 200-300 mmscfd during the second half of the year. However, capacity limitations at
the metering stations could restrict average volume flow to only 120 mmscfd if expansion
work at the delivery stations is not completed by end of the year.

iv
14. 1n 2017, the average delivery price of the WAGP gas was $8.6/mmBTU ($8.92/mscf) and
that of the Atuabo gas was a uniform $8.84/mmBTU ($9.17mscf) throughout the year.
15. For 2018, PURC has released a new aggregated delivered gas price based on weighted
average cost of gas comprising the indigenous gas, WAPCo and the expected LNG in the
country by 2020.
16. With this PURC mandate, the computed new adjusted weighted average cost of gas
(AWACOG) for 2018 given as $7.29/mmBTU ($7.56/mscf) would be the uniform
delivery gas price for both WAGP and the Atuabo gas for the year.
17. In 2017, total cost of gas for power generation was almost $330 million.
18. For 2018, the total cost of gas for power generation is estimated to cost almost $490
million.
19. In 2017, light crude oil (LCO) consumed by the thermal power plants for grid power
production was about 1.7 million barrels.
20. For 2018, it is estimated that the LCO required for power generation would be almost 3
million barrels.
21. In 2017, the average delivery price6 of LCO for power generation was $63 per barrel.
22. For 2018, it is expected that the average delivery price of the light crude would increase to
about $75 per barrel. The total cost of LCO required would thus be about $225 million.
23. In 2017, total diesel consumed by the thermal power plants for grid power production as
well as for starting and switching off the plants was about 400 thousand barrels.
24. For 2018, it is estimated that the diesel required largely for the same exercise would drop
to just about 100 thousand barrels and usage limited largely for starting and switching off
the plants due to expected improvement in supply of gas and LCO which are cheaper
alternative for power generation.
25. In 2017, the average delivery price of diesel was about $84 per barrel.
6 i.e. including transportation and treatment.

v
26. For 2018, the delivery price would remain about the same as in 2017 due to the relatively
reduction in the cargo shipment compared to the previous years. The total cost of the
required diesel would be around $8.4 million.
27. HFO is the fuel being used by the Karpower Barge and the AKSA power plant for power
production. In 2017, HFO consumed was about 3.6 million barrels and at an average
delivery price was $55 per barrel.
28. For 2018, it is estimated that the HFO required would be about 3.2 million barrels
(454,400 tonnes) at an average delivery price of $58 per barrel bringing the total cost of
supply to around $184 million. The 5% increment would largely be due to expected
improvement in fuel quality.
29. In all, about $900 million would thus be needed to procure fuel for grid or public electricity
generation.
Crude oil and Petroleum products
30. Ghana’s oil production in 2017 was about 58.6 million barrels coming from the three main
commercial fields, Jubilee (55.8%), TEN (34.9%) and Sankofa-Gye Nyame (9.3%)
compared to about 32.3 million barrels in 2016, representing an increase of about 81% over
the previous year. Average daily production for the year was about 175,000 barrels against
the targeted production of about 250,000 barrels.
31. In 2017, crude oil production from the Jubilee field increased to about 33 million barrels
from about 27 million barrels in 2016. Corresponding daily production however dropped
from an average of 94,200 barrels in 2016 to 91,382 barrels in 2017.
32. For 2018, average crude production from Jubilee is likely to increase marginally stay
within 95,000-105,000 barrels per day.
33. First oil from the TEN field was in August 2016. Total production for the year was just
over 5 million barrels. Total production rose to 20.4 million barrels in 2017 with
corresponding average daily production of about 59,300 barrels from 23,600 barrels in
2016.

vi
34. For 2018, average daily crude production from the TEN field is expected to increase from
59,300 barrels to the range of 70,000-75,000 barrels per day.
35. The year 2017 welcomed the first oil from the Sankofa-Gye Nyame field7 occurring in May
starting with an average daily production of about 12,000 barrels till the third quarter when
it increased to 18,000 barrels, then to 36,000 barrels during the last quarter of the year.
Total production from May to the end of the year was about 5.5 million barrels with an
average daily production of about 25,000 barrels against the year’s target of 45,000-50,000
barrels per day.
36. For 2018, the Sankofa field average daily crude production is expected to increase from
the 25,000 barrels to the range of 35,000-40,000 barrels per day.
37. In 2017, the average purchase price of Brent crude on the global market was $52.4 per
barrel, about 20% rise from that of 2016.
38. For 2018, the average price at which Ghana would source Brent crude is expected to
increase from $54.6 per barrel in 2017 to $69-71 per barrel. The average price for other
light crudes for refinery operations would increase from $53 per barrel in 2017 to within
$63-64 per barrel. Average delivery price for light crude oil for power generation would
increase from $63 per barrel to $71-75 per barrel.
39. In 2017, crude oil from the Jubilee field was sold at $52.8 per barrel. Average prices of
Jubilee field oil in 2016 and 2015 were around $40 and $51 per barrel respectively8, Those
of the TEN and the Sankofa-Gye Nyame fields in 2017 were sold at an average price of
and $49.3 and $48 per barrel respectively.
40. For 2018, average oil price from the Jubilee field is likely to increase further to $68-70 per
barrel whilst those of TEN and Sankofa fields would also rise but both would range from
$63-65 per barrel.
41. In 2017, total petroleum products pumped into the economy was around 3.5 million tonnes,
an increase from 3.3 million tonnes in 2016.
7 Also called OCTP (Offshore Cape Three Point) field 8 TEN and Sankofa fields production in 2017.
vii
42. Also in 2017, there were significant drop in diesel and kerosene consumption which could
be attributed to the normalisation of grid electricity supply after about three consecutive
years of acute load-shedding which made diesel generators and kerosene lamps as back-
up and alternative sources of stop-gap electricity and lighting respectively. However, with
the increasing reliability of the grid supply, such users are returning to the grid, even though
slowly due to the relatively high increases in tariff since 20169.
43. For 2018, total petroleum products required would still range from 3.7-3.9 million tonnes,
equivalent to 70,000-75,000 barrels per stream day refinery capacity just as projected for
2017. It would still largely comprise gasoline about 35-36% and diesel of about 54-55%
(excluding products directly destined for the grid power generating plants).
44. In 2017, LPG supplied was almost 359,000 tonnes, about 27 percent higher than in 2016.
Almost about 56% was imported just as in 2016. About 31% was produced locally but with
almost all the supply coming from the Atuabo Gas Processing Plant which is producing
LPG as by-product from processing the wet associated gas from the local fields into dry
gas largely for electricity generation. There was virtually no supply from Tema Oil
Refinery as it was shut down during some periods of the year to allow retrofitting and
expansion works at the facility to be completed.
45. Some LPG was exported (11%) for the second time since 2009, about 3% more than in
2016.
46. For 2018 however, the Government’s 6.8% GDP growth (5.9% non-oil) for the year would
require 390,000-400,000 tonnes of LPG of which over 40% is likely to come from the
Atuabo gas processing plant. Imports could still dominate since TOR is not likely to operate
at full capacity largely due to financial challenges. There is the growing demand for LPG
as cooking fuel in homes and particularly as transport fuel.
9 End-User tariff since the previous load shedding in 2007 to the beginning of the most recent in 2012 averaged 10
US cents per kWh whilst End-User tariff from 2013 to 2017 averaged 17 US cents per kWh.

viii
Charcoal
47. In 2017, the average prices of charcoal in the country followed the historical increasing
trend; for the mini-bag10, it rose to a little over GH¢25 from about GH¢22 in 2016 whilst
for the maxi-bag, it was from about GH¢35 in 2016 to about GH¢38. The 2016 price
increases however were about 20% for the mini-bag but just about 8% for the maxi-bag; a
kind of a revere from 2015 to 2016 where it averaged just about 5% for the mini-bag and
about 21% for the maxi-bag.
48. Greater Accra and Ashanti regions experienced a moderate increase of about 16%
compared to 5-10% projected for the year. This could be due to relatively adequate supply
of LPG as alternative cooking fuel in the regions.
49. As usual, the high-price zone were along the coast. However unlike the previous years,
Northern and Brong Ahafo regions largely referred to as the Savannah zone of the country
experienced the highest price hikes in the case of the mini-bag; it was on the average
cheaper buying the maxi-bag in these regions. Again, there was another turn-around; unlike
the previous years, the Upper East and Upper West regions experienced significant drop in
prices for both the mini- and the maxi-bags during the year.
50. For 2018, it is estimated that the average charcoal price increment to remain within 5-10%
for both the mini and the maxi bags in the coastal areas of Central, Western and Volta
Regions. Greater Accra would experience a price increment of 12-15% in 2018.
51. Nationwide, we maintain the average price range of 5-10% for both bags due to the
continues improvement of availability of LPG in the country but the relatively increasing
high cost is a key challenge for users interested to shift to the latter fuel for cooking.
10 For the weights and classification, see Annex 5

ix
Recommended Actions
Ameliorating the overall power supply shortage
52. For 2018, the Akosombo hydropower plant would be required to operate three turbine
units during the Off-peak and up to four turbines during Peak periods. This mode of
operation is expected to ensure that the reservoir level is kept above its minimum
operating level of 240ft (73.15 m) by the end of the dry season.
53. Kpong hydroelectric station which is currently undergoing retrofit, would continue to run
three out of the four total installed turbine units. Consequently, the total average plant
output at the Kpong Station would remain at 105 MW.
54. Bui hydropower plant is expected to operate an average of two turbine units throughout the
year. This mode of operation would lead to a projected annual production of 756 GWh and
is expected to ensure that its reservoir level would be about 5 metres above its target
minimum level of 170 metres-high compared to its 168m-minimum operating level. It is
estimated that for continuous and sustainable operation of the Bui Power Station for
2018 and for the subsequent years (in the likely event of low inflows), the reservoir level
at the end of the dry season of 2018 should not drop below its 170 m elevation.
55. For 2018, as a result of the operations of the three hydropower plants, the expected total
annual electricity generation from hydropower would not exceed 5000 GWh.
56. Failure to adhere to the plan for hydropower production could significantly
compromise reservoir integrity for subsequent years.
57. Crucial requirements for reliable power supply are the availability of the required plant
capacities, quantities of fuel and funds to purchase the required fuel in a timely manner.
58. Inadequacy fuel when it is required and gas pricing remain the major risks to reliable
electricity supply in Ghana. The present installed capacity is capable of generating over
20,000 GWh, which is enough to meet the country’s electricity requirement including
supressed demand, should there be adequate and cost-competitive fuel. The key challenge
however is competitive grid electricity tariff.
x
59. The fuel supply challenge also has to do with funding besides technical constraints. It is
therefore necessary to arrange to secure the needed funds to purchase the needed quantities
of fuel on time.
60. Furthermore, there is also the need to pay off any indebtedness to fuel suppliers so that
the required volumes would be obtained for thermal generation timely.
Cash Waterfall Mechanism
61. Arrears and debt situation along the power supply value chain rose from a little over $1
billion by end of 2016 to over $2 billion by the middle of 2017. Most of the debt were due
to short term loans contracted by the power producers and the distribution utilities’ inability
to collect adequate revenue to cover their operations. Persistent untimely and insufficient
payments for gas delivered also contributes to the huge debt burdens of the gas off-takers,
most of them public entities.
62. In order to address the chronic debt challenges and to facilitate equitable distribution of all
cash collected in the power sector value chain using the end user tariff as a basis, the Cash
Waterfall Mechanism (CWM) concept was instituted in 2016. It was to be implemented
through the development of a formula, for adequate distribution of revenue to all
stakeholders in the power sector value chain. The implementation of the CWM was
deferred to 2017 because of delays in the aspects of the inter-utility debt and modalities for
the implementation. However, over a year on, the CWM has still not been operational.
Achieving 50% nationwide penetration of LPG
63. National LPG penetration rate increased from 6% in 2000 to 18% in 2010 and is currently
around 23%. The sector ministry is targeting 50% penetration by 2020 but it is not likely
to be achieved if limited distribution outlets nationwide remain the same.
64. This can however be achieved by implementing the measures to support and accelerate the
supply and use of LPG outlined in the Energy Sector Strategy and Development Plan, and
the LPG Policy Paper. These include:

xi
(a) Deliberate government policy to make the LPG produced available for local
consumption as against export;
(b) Removal of price distortions; which has already been done.
(c) Re-capitalising Ghana Cylinder Manufacturing Company (GCMC) to expand
production capacity with the production of cylinders focused on small sized
cylinders that would be portable and affordable to households in rural communities
which is also on-going. GCMC has recently taken delivery of new equipment which
is expected to boost its current daily production of 1,500 to almost 4,000 cylinders.
(d) Constructing LPG storage and supply infrastructure in all regional and district
capitals in the long term.
65. In this light, the Ministry of Energy and the National Petroleum Authority need to
consider investment incentives to encourage the Oil Marketing Companies and other
interested investors to set up more LPG storage and distribution centres in-country to
increase access and consumption.
66. Also, deliberate government policy not only to make the LPG produced available for local
consumption as against export but producing LPG adequately to cover both local
consumption and for export taking advantage of the market opportunities within the West
Africa sub-region.
Expanding Crude Oil Strategic Reserve
67. Fuel supply security and erratic fuel prices have compelled countries to set up strategic
stocks both for crude oil and refined products. Crude oil storage however, has the
comparative advantage of far longer lifespan and could even be indefinite depending upon
the blend and state. Many developed countries have such storage mix and for OECD
countries, minimum of six month storage is mandatory.
68. The Commission would continue to recommend for the inclusion of crude oil in the
country’s strategic reserve.

xii
Expanding crude refining operations
69. Equivalent of 70,000-75,000 barrels per stream day refinery capacity would be required to
enable the country meet its projected economic growth for 2018. Tema Oil Refinery (TOR)
currently under-going some rehabilitation and expansion works is therefore commendable.
70. However, low capacity utilisation of TOR which has not made the facility profitable to
operate in the past should not be lost in sight in future operations though still dependent on
the production configuration. Profit could start emerging as the capacity utilisation
increases, in most cases 90% and above.
xiii
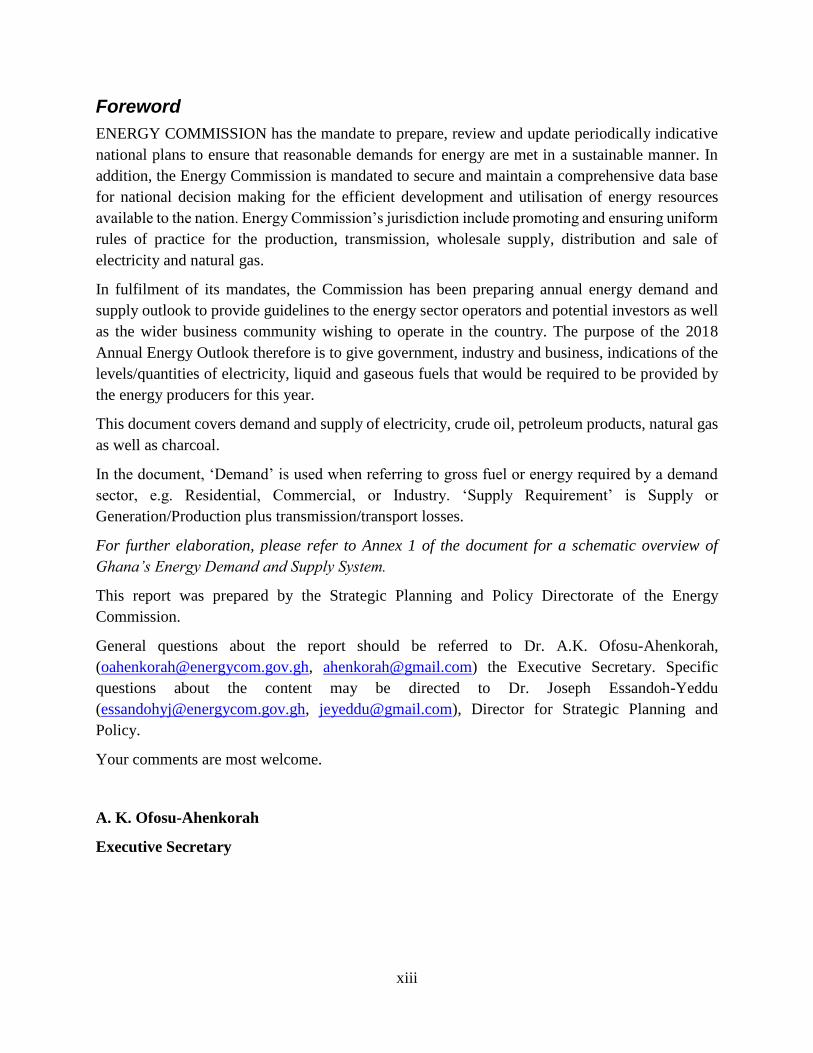
Foreword
ENERGY COMMISSION has the mandate to prepare, review and update periodically indicative
national plans to ensure that reasonable demands for energy are met in a sustainable manner. In
addition, the Energy Commission is mandated to secure and maintain a comprehensive data base
for national decision making for the efficient development and utilisation of energy resources
available to the nation. Energy Commission’s jurisdiction include promoting and ensuring uniform
rules of practice for the production, transmission, wholesale supply, distribution and sale of
electricity and natural gas.
In fulfilment of its mandates, the Commission has been preparing annual energy demand and
supply outlook to provide guidelines to the energy sector operators and potential investors as well
as the wider business community wishing to operate in the country. The purpose of the 2018
Annual Energy Outlook therefore is to give government, industry and business, indications of the
levels/quantities of electricity, liquid and gaseous fuels that would be required to be provided by
the energy producers for this year.
This document covers demand and supply of electricity, crude oil, petroleum products, natural gas
as well as charcoal.
In the document, ‘Demand’ is used when referring to gross fuel or energy required by a demand
sector, e.g. Residential, Commercial, or Industry. ‘Supply Requirement’ is Supply or
Generation/Production plus transmission/transport losses.
For further elaboration, please refer to Annex 1 of the document for a schematic overview of
Ghana’s Energy Demand and Supply System.
This report was prepared by the Strategic Planning and Policy Directorate of the Energy
Commission.
General questions about the report should be referred to Dr. A.K. Ofosu-Ahenkorah,
([email protected], [email protected]) the Executive Secretary. Specific
questions about the content may be directed to Dr. Joseph Essandoh-Yeddu
([email protected], [email protected]), Director for Strategic Planning and
Policy.
Your comments are most welcome.
A. K. Ofosu-Ahenkorah
Executive Secretary

xiv
TABLE OF CONTENTS
Executive Summary i
Recommended Actions ix
Ameliorating the overall power supply shortage ix
Achieving 50% nationwide penetration of LPG x
Expanding Crude Oil Strategic Reserve xi
Expanding crude refining operations xii
Foreword
List of Figures xviii
Acronyms xix
1.0 Power Subsector 1
1.1 Overview of Grid Power Supply in 2017 1
1.1.1 State of the Generation Sources in 2017 3
The Hydro generation 3
Thermal Generation 5
Electricity Exchanges (Export and Import) 6
Embedded and Distributed Generation 7
Renewable Energy Generation 7
1.2 2017 Forecast and Actuals 7
Fuel Supply Issues 9
1.3 Forecast for 2018 15
1.3.1 Electricity Requirement of the Economy 15
Impact of High Electricity Tariff on Demand 16
Achieving Upper Middle Income by 2020 18
1.3.2 The 2018 Grid Electricity Demand Outlook 20
Peak Power Demand 20
Summary of Peak Grid Electricity Demand Forecast for 2018 20
Outlook of Grid Electricity Consumption 21
xv
1.4 Available Electricity Supply for 2018 23
1.4.1 Generation Sources 23
Existing Generation Sources – Hydropower 23
Existing Generation Sources – Thermal Power 27
Planned Maintenance 28
1.4.2 Grid Demand-Supply Balance 30
1.4.3 Fuel Requirements and Cost Implications 33
Fuel Allocation and Cost 33
1.4.4 Transmission System Performance 36
State of the NITS 36
Transmission Line, Feeder and Sub-station Availability 37
Fuel Supply and Transmission Challenges 39
2.0 Petroleum Subsector: Oil 41
2.1 Overview of Petroleum Supply in 2017 41
Indigenous Oil Production 41
Crude Oil Prices 43
Global Scan 44
Domestic consumption and stocks in 2017 45
2.2 2017 Forecast and Actuals 46
2.3 Forecast for 2018 48
3.0 Petroleum Subsector: Natural Gas 52
3.1 Overview of Natural Gas Supply in 2017 52
Jubilee field 52
TEN field 53
Sankofa-Gye Nyame field 53
3.2 2017 Forecast and Actuals 54
3.3 Forecast for 2018 and beyond 55
3.3.1 Gas Supply Challenges 56
Inadequate gas supply 56
Progress of Planned LNG projects 58
Finance – domestic and international payment deficits 59
xvi
4.0 Woodfuel Subsector: Charcoal demand and prices 60
5.0 The Regulatory Regime 62
5.1 The Electricity Supply Industry 62
5.1.1 Licensing and Permitting 62
5.1.2 Codes of Practices and Regulations 63
5.1.3 Establishment of Wholesale Electricity Market 64
5.2 The Natural Gas Supply Industry 65
5.2.1 Licensing and Permitting 65
5.2.2 Codes of Practices and Regulations 65
5.3 Renewable Energy Update 66
Annex1 – Schematic Overview of Ghana Energy Demand and Supply System 68
Annex 2 – National Grid Transmission Map 69
Annex 3 – Liquefied Natural Gas Regas Terminal Technologies 70
Annex 4 – Nigeria Gas Supply Challenges 72
Annex 5 – Woodfuel weights 73

xvii
List of Tables Table 1 Installed Grid Electricity Generation Capacity as of December 2017 1
Table 2 Grid Power Transmission losses since 2008 3
Table 3 Average Unit Costs of Back-up Generation of Non-Residential Customers in 2017 9
Table 4. Projected and Actual Generation of the Power Plants in 2017 10
Table 5 Projected and Actual fuel used by the Thermal Power Plants in 2017 11
Table 6 Savings in Cost due to Projected and Actual Price of the Liquid fuels in 2017 11
Table 7 Monthly and Daily Natural Gas Supply in 2017 12
Table 8 Pricing Component for WAGP Delivered Gas for Foundation Customers in 2017 13
Table 9 Ghana Gas Delivered Gas Price in 2017 13
Table 10 Grid Electricity and Associated fuels: Forecast and Actuals in 2017 14
Table 11 Comparison of Electricity Tariff Customer Class from 2016 to 2018 16
Table 12 Average End User Tariff ranges of Ghana and Selected Middle-Income Developing
Countries and Region, from 2014-2017
17
Table 13 Comparison of Tariff ranges of Ghana and neighbouring Countries in West Africa
from 2017-2018
18
Table 14 Summary of 2018 Peak Grid Power Demand forecast by Customer Classes 21
Table 15 Summary of 2018 Grid Electricity Consumption forecast by Customer Classes 22
Table 16 Existing Grid Electricity Generation Sources for 2018 27
Table 17 2018 Planned Maintenance for the Power Plants. 28
Table 18 2018 Projected Grid Electricity and Supply Balance in GWh 31
Table 19 Projected Monthly Capacity levels and likely Reserve Margins for 2018 32
Table 20 Expected Average Delivered Fuel Prices for the Thermal Plants for 2018 35
Table 21 Estimated Quantities of fuel and Cost involved for the Power Plants for 2018 36
Table 22 Average Crude Oil Prices in Ghana, United States (Gulf Coast), and Europe (the North
Sea) from 2010-2017
43
Table 23 Petroleum products supplied to the Economy from 2014-2017 45
Table 24 Petroleum products produced Locally, Imported and Exported from 2014-2017 46
Table 25 2017 Average Crude Oil Prices in Ghana, United States and Europe 2017; Forecast
and Actuals
46
Table 26 Forecast and Actual Petroleum Products Consumption in 2017 47
Table 27 Forecast for Average Crude Oil Prices for Ghana, United States and Europe for 2018 49

xviii
Table 28 Forecast for Ghana’s Crude Oil Prices and Production for 2018 50
Table 29 Forecast for Petroleum Products requirement for 2018 50
Table 30 Summary of Adjusted Weighted Average Cost of Gas and Tariffs for 2018 55
Table 31 Table 31: Average Delivery Gas Prices in Ghana (WAGP), United States (Henry Hub),
and Europe (North Sea); 2011-2017 and projected prices for 2018.
56
Table 32 Average Price per bag of Charcoal in the Ten Regions for 2016 and 2017
60
List of Figures
Figure 1 2017 Akosombo Reservoir Trajectory 4
Figure 2 Bui Dam reservoir trajectory in 2017 5
Figure 3 Total Electricity Generation from Thermal Power Plants in 2017 6
Figure 4 Trends in Installed-, Dependable- Capacities and Peak Load with Generation
from 2008 - 2017
19
Figure 5 Share of projected peak power demand based on Customer Classes for 2018 20
Figure 6 Share of Projected Grid Electricity Supply based on Customer Classes for 2018 22
Figure 7 Akosombo Reservoir Trajectory projected for 2018 23
Figure 8 Bui Reservoir Trajectory projected for 2018 25
Figure 9 Total Rainfall in key towns in catchment areas and inflows into the Akosombo
Reservoir 2000-2017
26
Figure 10 Monthly Water level at Akosombo Reservoir from 2015-2017 26
Figure 11 Share of Grid Electricity Supply by Generation Types for 2018 30
Figure 12 Jubilee field daily oil production trend; 2011-2017 41
Figure 13 TEN field daily oil production trend in 2017 42
Figure 14 Sankofa-Gye Nyame field daily oil production trend in 2017 43
Figure 15 Comparison of Jubilee field daily yield; 2016 and 2017 52
Figure 16 TEN field daily gas yield from 2016-2017 53
Figure 17 Sankofa-Gye Nyame field daily gas yield in 2017 54
Figure A1-A2 Energy Supply Continuum 68
Figure A3 LNG Energy Bridge Regasification Vessel 70
Figure A4 LNG Floating, Storage and Regasification Plant 71
Figure A5 Permanent LNG Regasification Terminal 71

xix
Acronyms
GDP Gross Domestic Product; measure of wealth of an economy of a
nation.
LPG Liquefied Petroleum Gas
Solar PV Solar Photovoltaic; panel technology for electricity via solar or
sunshine
GWh Gigawatt-hour, i.e. million units of electricity
kWh Kilowatt-hour, i.e. one unit of electricity
MWh Megawatt-hour, i.e. thousand unit of electricity
NG Natural Gas
LNG Liquefied Natural Gas; natural gas liquefied about 600 times
mmBTU Million British Thermal Unit; an energy unit for gas flow
mscfd/mcfd Thousand standard cubic feet per day/ Thousand standard cubic
feet per day; a volumetric unit for gas flow
mmscfd/mmcfd Million standard cubic feet per day/ Million standard cubic feet
per day; a volumetric unit for gas flow
bscfd/bcfd Billion standard cubic feet per day / Billion standard cubic feet
per day; a volumetric unit for gas flow
Tcf/tscfd Trillion standard cubic feet per day / trillion standard cubic feet
per day; a volumetric unit for gas flow
IPP Independent Power Producer
BOST Bulk Oil Storage and Transport company, a state company
supposed to manage the country’s strategic reserve
ECG Electricity Company of Ghana, a public power distributor
TAPCO Takoradi Thermal Power Company, a public power generator
TICO Takoradi International Company, a public power generator
TOR Tema Oil Refinery, the only crude oil and public refinery in the
country.
VRA Volta River Authority, a public power generator
VALCO Volta Aluminium Company, a smelting company
WAGP West African Gas Pipeline
WAGPCo West African Gas Pipeline Company

1
1.0 Power Subsector
1.1 Overview of Grid Power Supply in 2017
Installed generation capacity available for grid power supply at the transmission level as at the
end of 2017 was about 4,310 Megawatt (MW). See Table 1
Table 1: Installed Grid Electricity Generation Capacity operational as of December 2017.
GENERATION PLANT FUEL TYPE
CAPACITY (MW) TOTAL
GENERATION
Inst
all
ed
(na
me
pla
te)
% S
ha
re
Av
era
ge
Dep
end
ab
le
Av
era
ge
Av
ail
ab
le
GW
h
% S
ha
re
(in
cl.e
mb
edd
)
% S
ha
re
(ex
l.em
bed
d)
Hydro Power Plants Akosombo Hydro 1,020 900 505 4,282 30.5 30.6
Bui Hydro 400 340 205 582 4.1 4.2
Kpong Hydro 160 140 115 752 5.3 5.4
Sub-Total 1,580
35.9®
36.7 1,380 825 5,616 39.9 40.2
Thermal Power Plants11
Takoradi Power Company (TAPCO) Oil/NG 330 300 200 686 4.9 4.9
Takoradi Inter. Company (TICO) Oil/NG 340 320 260 1,880 13.4 13.4
Sunon–Asogli Power (SAPP) NG 560 520 180 1,417 10.1 10.1
Kpone Thermal Power Plant(KTPP) Oil/DFO 220 200 20 124 0.9 0.9
Tema Thermal Plant1 (TT1P) Oil/NG 11012 100 70 365 2.6 2.6
Tema Thermal Plant2 (TT2P) Oil/NG 80 70 1 0.5 0.0 0
CENIT Energy Ltd (CEL) Oil/NG 11012 100 30 59 0.4 0.4
AMERI NG 250 230 200 1,229 8.7 8.8
Karpower HFO 470 450 225 1,814 12.9 13.0
AKSA HFO 260 220 100 799 5.7 5.7
Sub – Total 2,730 63.3 2,510 1,286 8,373.5
Trojan* Diesel/NG 44 40 30 52 0.4 -
Genser* Coal/LPG 22 18 0 0 0 -
Sub-total (including embedded generation) 2,796 63.6 2,568 1,316 8,425.5 59.9
Renewables* VRA Solar Solar 2.5
1.5 1.5 3.0 0.02
BXC Solar Solar 20 16 10 25 0.18
Sub – Total 22.5 0.5 11.5 11.5 28.0 0.2
Total (including embedded generation+ Solar) 4,398.5 3966 2,198 14,069
Total (excluding embedded generation and solar) 4,310 3,890 2,156 13,989
NG is Natural gas. * Sub-transmission (primary embedded) connection. Including embedded generation and solar.
11 TAPCO is Takoradi Power Company, a combined cycle (CC) thermal plant; TICO is Takoradi International
Power Company, a single cycle (SC) thermal plant. 12 Nameplate as licensed by Energy Commission is 126 MW.

2
It totalled 4,398.5 MW if primary embedded generation including the listed solar plants13 at the
sub-transmission level are included. This was about 16% expansion over last year’s compared to
19% increment from 2015 to 2016. The dependable capacity on the other hand was almost 20%
more than in 2016 (see Table 1).
The 20 MW BXC Solar and the 2.5 MW VRA Solar are grid-tied plants connected at the
distribution level, just as the Trojan and the Genser power plants.
The Genser power plant however, even though commissioned in 2016 still did not run in 2017,
due to un-concluded negotiations between the operator and the off-taker before the year ended.
The gross grid generation in the country including the embedded generation14 in 2017 was 14,069
Gigawatt-hours (GWh), about 8.4% more than in 2016, comprising 39.9% hydro, 59.9% thermal
and about 0.2% solar power.
Without the primary embedded generation, the country’s gross generation in 2017 was 13,989
Gigawatt-hours (GWh), about 8.3% more than in 2016, comprising 40.2% hydro, 59.8% thermal
power.
Grid electricity made available for gross transmission15, during the year however was around
14,309(±1%) GWh consisting of about 5,616 GWh (39.2%) from hydro generation, 8,373 GWh
(58.5%) from thermal generation and about 320 GWh (2.2%) of import. It was almost 4.45%
improvement over 2016. Supply in 2016 was about 13% more than in 2015.
A total of 284 GWh of electricity was transmitted to Togo and Benin (CEB), comprising 210.6
GWh power exports from VRA and 73.6 GWh wheeled from la Cote d’Voire (CIE). About 57.5
GWh was also transmitted to Burkina Faso (SONABEL).
Total grid electricity supplied to the country was about 14,316 GWh16, comprising about 1.7% net
imports (247 GWh)17, around 39.2% conventional large hydro (5,616 GWh), 58.9% thermal (8,373
GWh)18 and about 0.2% solar (28 GWh). It was about 6% increase over 2016.
The net grid electricity supplied19 was about 13,445 GWh; about 5.5(±2) % less than the minimum
projected requirement of 14,000 GWh (with VALCO constrained at one potline)20
Peak load on the transmission grid excluding export21 was 2,077 Megawatts (MW); roughly 4%
more than in 2016 but fell outside the 2,200-2,300 MW projected for 2017.
13 This does not include embedded or captive back-up generation. 14 i.e. Trojan, Genser thermal plants and the grid-tied solar plants 15 Total generation (13,989 GWh) less total own use (1.2 GWh) plus total imports (320.4 GWh). Does not include
embedded generation and solar since they are at the distribution grid level. 16 Total generation 4,069 + the net imports (247) GWh less export: 17 Total imports (320) less wheeled from CIE to CEB (73.64)=247 GWh 18 Submissions to Energy Commission by GRIDCo indicates 8373 GWh thermal but the 2018 Electricity Plan (Page
12) reported 8243 GWh thermal. 19 Gross grid electricity less wheeled less exports less transmission loss. 20 2017 Energy (Supply and Demand) Outlook for Ghana, April, 2017. Page 13. 21 Referred to as Domestic Peak Load by some of the utilities

3
The total (maximum) system peak on the transmission grid22 was however 2,192 MW, which was
about 5.5% more than in 2016.
Total power transmission loss in 2017 was 4.1% of gross transmission, 0.3 percentage point
lower than in 2016. (see Table 2).
Table 2: Grid Power Transmission losses since 2008.
Year 2008 2009 2010 2011 2012 2013 2014 2015 2016 2017
Transmission losses as
% of gross transmission 3.7 3.8 3.7 4.7 4.3 4.4 4.3 3.8 4.4 4.1
1.1.1 State of the Generation Sources in 2017
The Hydro generation
Akosombo and Kpong
Akosombo was made to produce about 4,282 GWh against projected supply of 3,681 GWh about
16.3% more than estimated23.
The Volta Lake started the year 2017 at an elevation of 250.47ft (76.34m), about 15.47ft (4.72m)
above the minimum operating level of 235ft (71.6m).
Based on the reservoir level, it was projected to operate three (3) and five (5) units at off-peak and
peak period respectively. However, the 2017 projection anticipated gas supply challenges and the
then on-going maintenance activities on thermal units at Aboadze in the first quarter and
recommended the running of six (6) units for the peak periods. Following the implementation of
the above plan, the reservoir elevation dropped to a minimum of 240.09ft (73.18m) which was
0.09ft (0.03m) above the projected. The recorded Lake elevation at the end of the inflow season
was 253.40 feet (77.24m) a rise of 13.31ft (4.06m) above the recorded minimum as against a rise
of 18.04ft (5.50m) in 2016. The corresponding total net inflow was 32.74 MAF24 which is 2.74
MAF above the long-term average of 30 MAF. Figure 1 shows the Akosombo reservoir trajectory
for 2017.
22 Ghana Peak load + Exports 23 Projected for Akosombo was 2681 GWh and for Kpong was 723 GWh in 2017 Electricity Supply plan, p4. 24 MAF is million acres feet.

4
Figure 1. 2017 Akosombo Reservoir Trajectory
The 2017 inflow season for the Volta Lake thus ended with the reservoir attaining a maximum
elevation of 253.40ft (77.24m). This resulting reservoir rise of about a rise of 13.31ft (4.06m) is
thus what is to be managed in 2018 until about beginning of second quarter of the year when the
next rains start upstream.
Kpong GS produced about 752 GWh in 2017; against projected supply of 723 GWh, about 4.4%
more than expected. It operated three units throughout the year since the fourth unit was
undergoing retrofitting. This has reduced the total average available capacity of the dam from 140
MW to 105 MW.
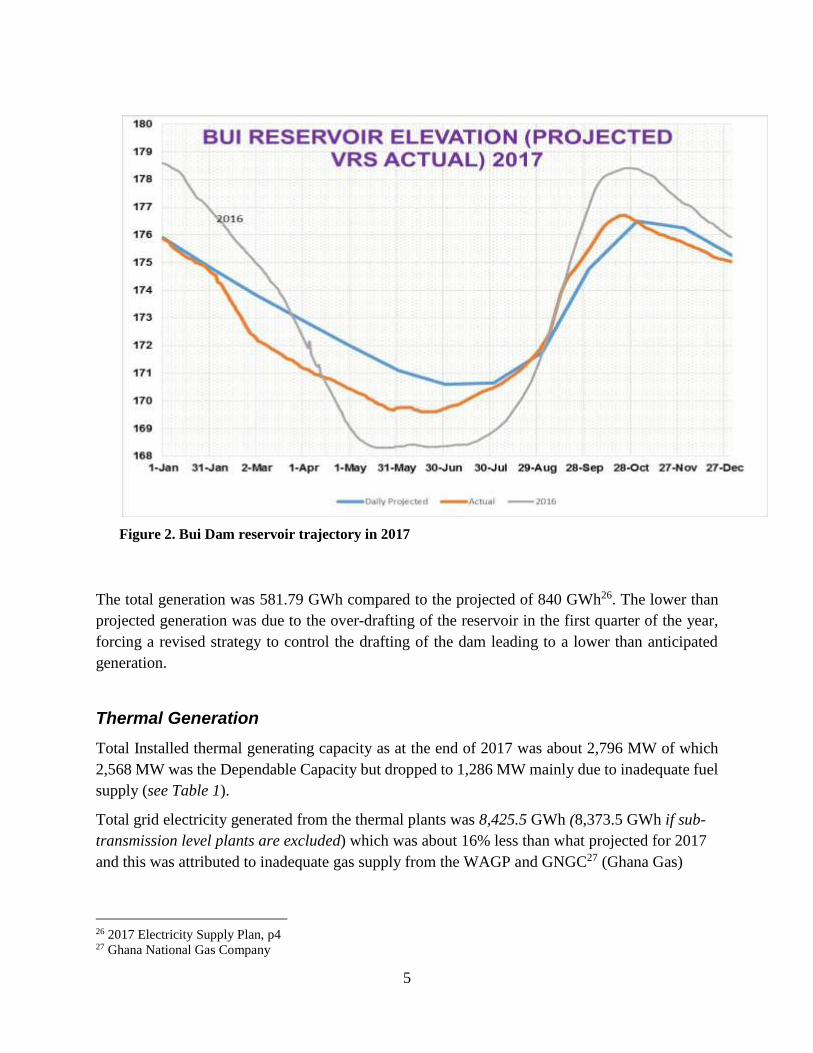
Bui Hydro
Bui reservoir started the year at an elevation of about 175.87 masl25 and dropped to 169.61 masl
in June 2017 due to over-drafting of the lake in the first quarter to make up for power deficit in
the country. The minimum level attained was 0.99 masl below the projected minimum of 170.60
masl for the year 2017. The reservoir attained a maximum level of 176.71 masl and ended the
year with an elevation of 175,92 masl. The Bui reservoir trajectory in 2017 is shown in Figure 2.
25 masl is metres above sea level.
230.00
235.00
240.00
245.00
250.00
255.00
260.00
1-Jan 31-Jan 2-Mar 1-Apr 1-May 31-May 30-Jun 30-Jul 29-Aug 28-Sep 28-Oct 27-Nov 27-Dec
AKOSOMBO RESERVOIR ELEVATION (PROJECTED VRS ACTUAL) 2017
Projected Actual 2016
2016
5
The total generation was 581.79 GWh compared to the projected of 840 GWh26. The lower than
projected generation was due to the over-drafting of the reservoir in the first quarter of the year,
forcing a revised strategy to control the drafting of the dam leading to a lower than anticipated
generation.
Thermal Generation
Total Installed thermal generating capacity as at the end of 2017 was about 2,796 MW of which
2,568 MW was the Dependable Capacity but dropped to 1,286 MW mainly due to inadequate fuel
supply (see Table 1).
Total grid electricity generated from the thermal plants was 8,425.5 GWh (8,373.5 GWh if sub-
transmission level plants are excluded) which was about 16% less than what projected for 2017
and this was attributed to inadequate gas supply from the WAGP and GNGC27 (Ghana Gas)
26 2017 Electricity Supply Plan, p4 27 Ghana National Gas Company
Figure 2. Bui Dam reservoir trajectory in 2017

6
coupled with the inability of the thermal entities to purchase adequate liquid fuels to run the
thermal plants just as it was in 2016 (see Figure 3).
Electricity Exchanges (Export and Import)
Power export to Togo and Benin (CEB) reduced from a maximum of 120 MW in January to an
average of 20 MW during the year. The two countries imported much of its generation needs
from Nigeria due to their relatively low tariffs; the Ghanaian export tariff averaged 13 US cents
per kWh compared to less than 12 US cents per kWh from Nigeria.
A total of 248.2 GWh was transmitted to Togo and Benin, comprising 250.6 GWh from Ghana
(VRA) and 73.6 GWh wheeled from la Cote d’Ivoire (CIE).
Figure 3. Total Grid Electricity Generation from Thermal Power Plants in 2017
0
200
400
600
800
1000
1200
Thermal Generation in 2017 (GWh)
Actual Gen (GWh) Projection Gen (GWh)
7
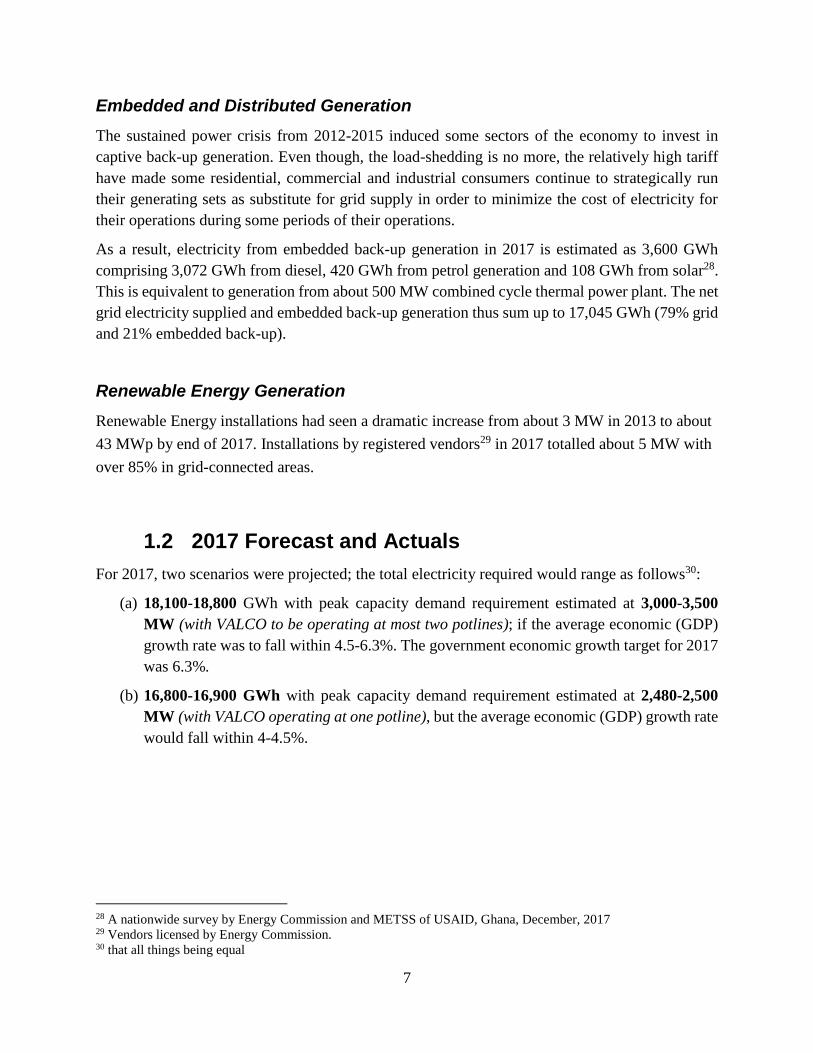
Embedded and Distributed Generation
The sustained power crisis from 2012-2015 induced some sectors of the economy to invest in
captive back-up generation. Even though, the load-shedding is no more, the relatively high tariff
have made some residential, commercial and industrial consumers continue to strategically run
their generating sets as substitute for grid supply in order to minimize the cost of electricity for
their operations during some periods of their operations.
As a result, electricity from embedded back-up generation in 2017 is estimated as 3,600 GWh
comprising 3,072 GWh from diesel, 420 GWh from petrol generation and 108 GWh from solar28.
This is equivalent to generation from about 500 MW combined cycle thermal power plant. The net
grid electricity supplied and embedded back-up generation thus sum up to 17,045 GWh (79% grid
and 21% embedded back-up).
Renewable Energy Generation
Renewable Energy installations had seen a dramatic increase from about 3 MW in 2013 to about
43 MWp by end of 2017. Installations by registered vendors29 in 2017 totalled about 5 MW with
over 85% in grid-connected areas.
1.2 2017 Forecast and Actuals
For 2017, two scenarios were projected; the total electricity required would range as follows30:
(a) 18,100-18,800 GWh with peak capacity demand requirement estimated at 3,000-3,500
MW (with VALCO to be operating at most two potlines); if the average economic (GDP)
growth rate was to fall within 4.5-6.3%. The government economic growth target for 2017
was 6.3%.
(b) 16,800-16,900 GWh with peak capacity demand requirement estimated at 2,480-2,500
MW (with VALCO operating at one potline), but the average economic (GDP) growth rate
would fall within 4-4.5%.
28 A nationwide survey by Energy Commission and METSS of USAID, Ghana, December, 2017 29 Vendors licensed by Energy Commission. 30 that all things being equal

8
We indicated that both scenarios (a) and (b) are achievable provided the following were also
accomplished:
i. Planned capacity additions for the year were timely completed and there were adequate
finance to procure all the fuel needed to run the thermal power plants even at higher
utilisation factors.
ii. Average end-user-tariff was reduced from about 20-21 US cents per kWh to within 10-
15 US cents per kWh.
Otherwise, what could be achievable would be as follows:
c) 15,615-15,700 GWh31 with peak capacity demand requirement estimated at 2,386-
2,400 MW (with VALCO constrained at one potline). Average End-User tariff within
US cents 18-20 per kWh; i.e. a bit lower than the Business-as-usual.
d) 14,000-14,500 GWh with peak capacity demand requirement estimated at 2,200-2,300
MW (with VALCO constrained at one potline). Average End-User tariff within US
cents 20-21 per kWh; Business-as-usual.
We emphasized that scenarios (c) and (d) would just improve the economic growth from about
3.7% in 2016 to about 4% for 2017.
The total grid electricity supplied in 2017 however fell within scenario (d) projection. Even though
the end-user tariff dropped to about 18 US cents per kWh, it was not still enough to drive up the
electricity consumption.
The projected grid electricity required for 2017 was 15,615 GWh compared to the actual supply
of 14,247 (±0.5%) GWh32, a drop of 8-9% in the grid consumption which was largely due to
relatively high tariffs. This was because the industries found the use of embedded generation,
mostly diesel, to be less expensive in some periods of their operations, particularly, when their
consumption exceeds 300 units during each month. Diesel power plants which constituted 85% of
the total embedded back-up generation had a median cost of Ghp106 per kWh as against average33
grid electricity cost of Ghp114 per kWh (range of Ghp102-163 per kWh) and Ghp 146 per kWh
(range of Ghp100-164 per kWh) for Low-Voltage and Medium-High-Voltage Industries
respectively34. Petrol as backup was found to be most costly and thus consequently the least used
(see Table 3).
31 This range adapted from the joint Supply Plan with GRIDCo, VRA, Bui, ECG, NED and other power entities. 32 14,177-14,316 GWh. The minimum point was from 2018 Electricity Supply Plan, p13. 33 Note that Average can be Mean, Median or Mode depending on the shape of the distribution of the curve. 34 Energy Commission and METSS, USAID survey, December,2018

9
Table 3: Average Unit Costs of Back-up Generation of Non-Residential Customers in 2017
Embedded
Back-up
Generator type
Percentage
share
Average usage
hours per month
Average unit cost
of operation
(Ghp per kWh)
Electricity tariff for
consumption above
301 units
Median Mean Median Mean
No
n-
Res
iden
tial
Ind
ust
ries
(SL
T-L
V)
Diesel 85 14 50 106 116
102-163 100-164 Petrol 12 3 10 504 103
Solar 3 104 180 69 70
Source: Energy Commission and METSS, USAID surveys, December,2018
Forex conversion; Ghana cedis $ 4.38 = US$1’ SLT is Special Load Tariff for Industrial customers.
Thus the total electricity consumed in 2017 was about 17,045 GWh comprising 13,445 GWh net
grid electricity35 and 3,600 GWh from embedded back-up generation with the latter equivalent to
about 500 MW capacity. The corresponding Ghana Peak load36 for the year was 2,077 MW but
including the embedded back-up generation would ramp it to about 2,500 MW.
The 2017 total electricity consumption and the corresponding peak load were therefore marginally
above scenario (b) but below scenario (a).
The non-oil economy growth for 2017 was 4.9%. The turn-around economic growth rate from the
3.7% (5% for non-oil) in 2016 and reaching 8.5% (4.9% non-oil) last year thus was largely due to
the higher global oil prices during the year compared to prices in 201637. The real economic
activities (the non-oil growth) however remained about the same as in 2016.
Fuel Supply Issues
Thus there was about 6% drop in electricity demand against what was projected (see Table 4). Even
though, the drop in grid electricity demand also led to reduction in fuel demand, inadequate stocks
of liquid fuels (LCO and diesel) at the thermal plants compelled the hydro plants to be operated
beyond (7%) the projected (see Table 4). The total hydropower reservoir was over-drafted to make
up for power deficit during the first quarter of the year arising from the gas supply shortfall from
Ghana Gas; an offset which could have been addressed with thermal generation to maintain the
integrity of the reservoirs.
35 Gross grid electricity less wheeled less exports less transmission loss. 36 Also called the domestic load 37 $45-47 per barrel in 2016, but $56-60 per barrel in 2017.

10
The thermal generation on the other hand dropped by 13% and was largely due to the inability of
the generating entities to finance fuel purchases. Low availability of LCO at Tema compelled
CENIT power to suspend operation after the first quarter of the year.
Table 4. Projected and Actual Generation of the Power Plants in 2017
Generation Source Fuel type
Generation
(GWh) Remarks
Projected Actual Net
Hydro Power Plants
Akosombo Hydro 3681 4,282 601 To make up
for inadequate
thermal supply Bui Hydro 840 582 -258
Kpong Hydro 723 752 29
Sub-Total 5,244 5,616 372
Thermal Power Plants38
Takoradi Power Company (TAPCO) Oil/NG 1,258 686 -572
Maintenance
& fuel issues
Takoradi Inter. Company (TICO) Oil/NG 1,983 1,880 -103 Within range
Sunon–Asogli Power (SAPP2) NG 1,477 1,417 -58 Within range
Kpone Thermal Power Plant (KTPP) Oil/DFO 62 124 62 Back up
Tema Thermal Plant1 (TT1PP) Oil/NG 177 365 188 Back up
Tema Thermal Plant2 (TT2P) Oil/NG 0 0.5 0.5 Fuel issue
CENIT Energy Ltd (CEL) Oil/NG 154 59 -95 Fuel issue
AMERI NG 1,619 1,229 -390 Inadequate gas
Karpower HFO 1,802 1,814 12 Within range
AKSA HFO 1,174 799 -375 Fuel issue
Trojan* Diesel/NG 19 52 33 Cheaper
Sub – Total 9,725 8,425.5 -1,299
Total 14,969 14,042 -925.5
Thus about 9.4 million barrels of liquid fuels projected dropped to about 5.7 million barrels (see
Table 5). Total of eleven (11) Light crude oil (LCO) cargoes projected reduced to between four to
five cargoes39. Heavy fuel oil (HFO) was destined for Karpower and AKSA plants with expected
12.2 cargo deliveries but with a slight reduction to about nine. Although, diesel (DFO) is largely
used for starting and stopping the thermal plant operations, almost about a cargo procured went to
operate KTPP as a back-up plant and also to Trojan, a captive embedded generation.
38 TAPCO is Takoradi Power Company, a combined cycle (CC) thermal plant; TICO is Takoradi International
Power Company, a single cycle (SC) thermal plant. 39 Based on a usual cargo size of 405,000 barrels.
11
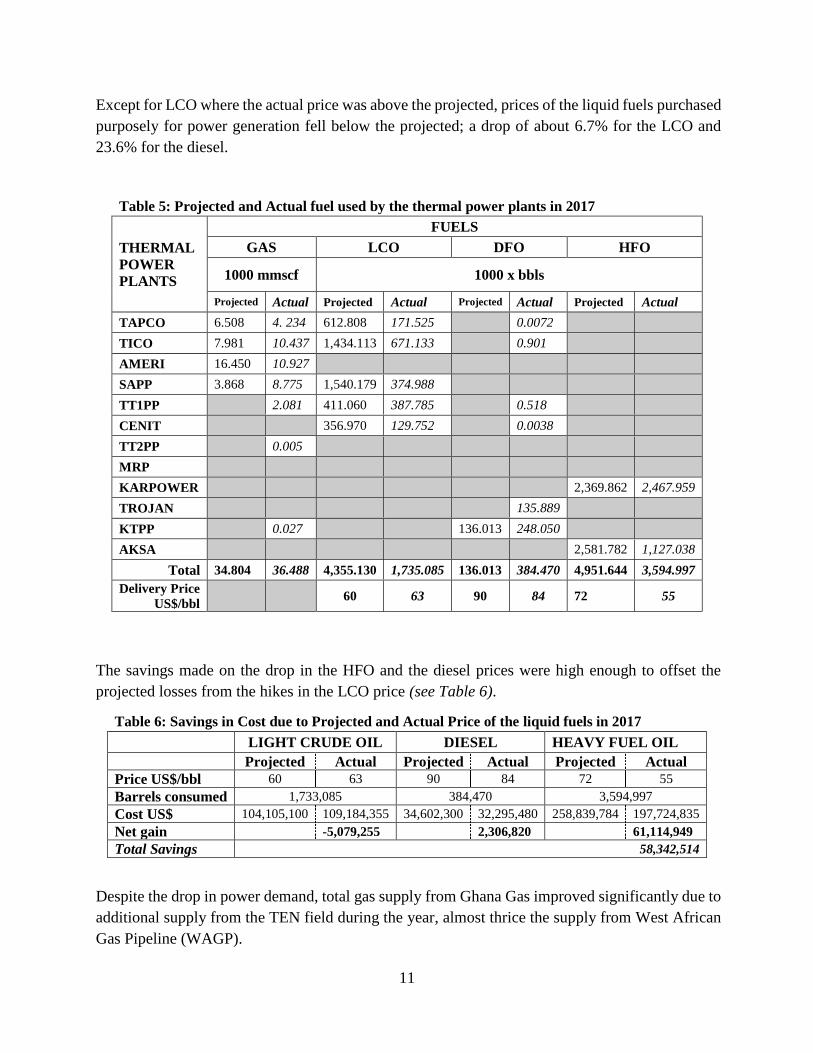
Except for LCO where the actual price was above the projected, prices of the liquid fuels purchased
purposely for power generation fell below the projected; a drop of about 6.7% for the LCO and
23.6% for the diesel.
Table 5: Projected and Actual fuel used by the thermal power plants in 2017
THERMAL
POWER
PLANTS
FUELS
GAS LCO DFO HFO
1000 mmscf 1000 x bbls
Projected Actual Projected Actual Projected Actual Projected Actual
TAPCO 6.508 4. 234 612.808 171.525 0.0072
TICO 7.981 10.437 1,434.113 671.133 0.901
AMERI 16.450 10.927
SAPP 3.868 8.775 1,540.179 374.988
TT1PP 2.081 411.060 387.785 0.518
CENIT 356.970 129.752 0.0038
TT2PP 0.005
MRP
KARPOWER 2,369.862 2,467.959
TROJAN 135.889
KTPP 0.027 136.013 248.050
AKSA 2,581.782 1,127.038
Total 34.804 36.488 4,355.130 1,735.085 136.013 384.470 4,951.644 3,594.997
Delivery Price
US$/bbl 60 63 90 84 72 55
The savings made on the drop in the HFO and the diesel prices were high enough to offset the
projected losses from the hikes in the LCO price (see Table 6).
Table 6: Savings in Cost due to Projected and Actual Price of the liquid fuels in 2017
LIGHT CRUDE OIL DIESEL HEAVY FUEL OIL
Projected Actual Projected Actual Projected Actual
Price US$/bbl 60 63 90 84 72 55
Barrels consumed 1,733,085 384,470 3,594,997
Cost US$ 104,105,100 109,184,355 34,602,300 32,295,480 258,839,784 197,724,835
Net gain -5,079,255 2,306,820 61,114,949
Total Savings 58,342,514
Despite the drop in power demand, total gas supply from Ghana Gas improved significantly due to
additional supply from the TEN field during the year, almost thrice the supply from West African
Gas Pipeline (WAGP).

12
Total gas supply from Ghana Gas was 31,665,446 mmBTU in 2017, about 38% increase from
2016 compared to a drop of 12.6% from 2015 to 2016 (see Table 7). Average daily gas flow from
Ghana Gas increased from 60 mmscf in 2016 to about 81 mmscf in 2017 (see Table 7). Daily flow
during the first quarter averaged 42 mmscfd, a dropped from about 64 mmscfd in the last quarter
of 2016. This was due to maintenance activities by the gas field operators (Tullow Oil and Ghana
Gas) during the first quarter, resulting in curtailment of gas to the power plants and that
consequently led to some brief incidences of load shedding during the period. The average gas
flow in the first quarter then ramped up to about 74 mmscfd during the second quarter reaching a
maximum of about 109 mmscfd in the last quarter.
As usual, the WAGP supply was largely destined to the Tema enclave whilst the Ghana Gas supply
was to the power plants located at the Takoradi power plants enclave. Total gas flow from WAGP
improved considerably from about 4,000,000 mmBTU in 2016 to over 11,000,000 mmBTU in
2017, but was still below that of 2015 (20,625,393 mmBTU). Average daily flow for the entire
year was 30 mmscfd, though about twice that of 2016, still just about a quarter of the contracted
daily volume. The average daily flow from last quarter of 2016 to first quarter of 2017 remained
about the same; around 13 mmscfd, till the half year where the flow increased to around 19 mmsfd
then more than doubled during the second half of the year (see Table 7).
Table 7: Monthly and Daily Natural Gas Supply in 2017
Month
Ghana Gas Supply WAGP Supply Daily flow in mmscf
Monthly
flow in
mmBTU
Daily flow
in mmscf
Monthly
flow in
mmBTU
Daily flow
in mmscf
Takoradi
Enclave
Tema
Enclave
January 1,562,334 47.28 501,590 15.18 42.88 16.28
February 203,654 6.82 405,951 13.60 6.22 13.07
March 2,337,678 70.74 434,063 13.14 65.09 13.02
April 2,449,701 76.60 515,013 16.10 69.20 15.48
May 2,380,521 72.04 532,696 16.12 63.80 15.36
June 2,390,938 74.76 804,453 25.15 67.56 24.47
July 2,765,699 83.69 1,085,054 32.83 75.42 30.92
August 3,548,455 107.38 1,721,805 52.10 95.28 50.61
September 3,339,851 104.44 1,716,647 53.68 90.49 50.25
October 3,607,305 109.16 1,436,114 43.46 95.85 37.64
November 3,433,342 107.36 1,290,747 40.36 94.86 39.07
December 3,635,968 110.03 1,268,765 38.39 101.03 36.34
Total 31,655,446 11,712,897
Average 2,637,954 80.86 976,075 30.01 72.31 28.54.

13
Average WAGP delivery gas price to VRA the foundation customer was $8.62 per mmBTU
($9.44/mscf) in 2017; about 7% increase from 2016. It averaged $8.79 per mmBTU for the first
half of the year but dropped to an average of $8.45 per mmBTU during the second half (Table 8).
Table 8: Pricing Component for WAGP Delivered Gas for Foundation Customers in 2017
Details
Customer Price
2016 Jan-Jun 2017 Jul-Dec 2017
$/mmBTU
Gas Purchase 1.6171-2.2901 1.4218 1.5176
ELPS Transport 1.2983 1.3120 1.3120
WAGP Transport 5.0330 5.0859 5.0859
WAGP Credit Support Charge* 0.9765 0.6472 0.2378
WAGPA Charge 0.0600 0.0600 0.0600
Pipeline Protection Zone Charge 0.0250 0.0250 0.0250
Shipper Fee 0.1000 0.2000 0.2000
Fuel Charge** 0.1308-0.1823 0.0400 0.0126
Delivered Gas Price ($/mmBTU) 7.9568-8.1341 8.7919 8.4509
Note: *Credit Support Charge is a monthly lump sum charge and NOT an actual charge per mmBTU.
The $0.9765/mmBTU shown above is a calculated average charge based on the average monthly
throughput from January to December 2017
The delivered price of gas from Ghana Gas was as usual uniform at $8.842/mmBTU ($9.01/mscf)
throughout the year. The average delivery prices were thus within our projections for 2017 (see
Table 9)
Table 9: Ghana Gas Delivered Gas Price in 2017
Details Customer Price for 2017
Gas commodity price 2.9
Gathering, Processing & transportation 5.28
PURC levy 0.66
Delivered Gas Price ($/mmBTU)40 8.84
Energy Commission, 2017.
Table 10 shows the summary of some of projected and actual indicators in 2017.
40
Delivered gas price is not necessarily an absolute sum of the listed charges.

14
Table 10: Grid Electricity and Associated fuels: Forecast and Actuals in 2017.
2016 2017
Forecast Actual
Ghana’s Electricity requirement (GWh)
VALCO at one potline @20-21 UScents EUT 16,798-16,900 14,000-14,500
VALCO at one potline @18-20 UScents EUT 15,615-15,700
Total Grid Electricity available
(i.e. including imports) GWh 13,722 14,316
Grid Electricity generation available
(i.e. excluding imports) GWh 12,978 14,069
Percentage hydropower of generation (%) 42.8
(5,560 GWh)
33.7
(5,239 GWh)
39.9
(5,616 GWh)
Ghana System Peak (Domestic peak ) MW 2,105 (1,997) 2,200-2,300 2,077
GRIDCO Transmission System
Peak/Maximum Demand MW
(Ghana/CEB System peak)
2,087
(2,405) 2,386 2,192
Average WAGP gas flow
(mmscf per day)
13 (all year)
19 (for supplied
period only)
30 30
Average GhanaGas gas flow
(mmscf per day) 60 80-100 81
Delivered WAGP gas price *
US$ per mmBTU ($ per mscf)
7.9-8.13
(8.19-8.43)
8.45
(8.76)
8.45-8.79
8.76-9.12)
Delivered WAGP gas price
(VRA receipt +other charges included#)
US$ per mmBTU ($ per mscf)
8.45
(8.76)
8.7
(9.02)
8.6
(8.92)
Delivered GhanaGas gas price *
(other charges included)
US$ per mmBTU ($ per mscf)
8.84
(9.17)
9
(9.33)
9.02
(9.35)
Oil required
(Million barrels)
LCO
4.3
Diesel 0.1
HFO 4.9
+*Oil consumed
(Million barrels)
LCO 3.9
1.7
Diesel 0.4 0.4
HFO 2.3 3.6
Average delivered light crude oil price dedicated for power production
$ per bbl ($ per mmBTU)
55
(9.45)
60
(10.31)
63
(10.82)
EUT implies End-User Tariff
* Actual data in $/mmBTU courtesy of WAPCo. Low-side for Foundation customers and high-side for Standard
customers. Other charges include delivery fee, ELPS transport fees, insurance, etc.
**Prices indexed to LCO and negotiated between the buyer and supplier and reviewed every six months. Actual
data in $/mmBTU courtesy of WAPCo. Low-side for Foundation and high-side for Standard customers. #VRA indicates that it adds administrative charges to the delivered gas price from WAPCo.

15
1.3 Forecast for 2018
1.3.1 Electricity Requirement of the Economy
The real GDP growth for 2017 was 8.5% (4.9% non-oil), a turn-around from the 3.7% (5% for
non-oil) in 2016. This was largely attributed to the higher global oil prices during the year 41.
Besides the higher oil prices, oil production in the country in 2017 almost doubled that of 2016
with increased and additional production from the TEN and the Sankofa-Gye Nyame fields.
The real manufacturing-production based economic activities (the non-oil growth) however
remained about the same as in 2016.
As indicated in the earlier Outlooks, the World Bank42 has established that electricity is the second
most important constraint to business activities in the country and that Ghana lost about 1.8% of
GDP during the 2007 power crisis.
ISSER43, indicated that the country lost about US$680 million in 2014 translating into about 2%
of GDP due to the power crisis that year. It further indicated that firms that did not have access to
sufficient electricity had lower output/sales, and that not having sufficient electricity lowers a
firm’s annual sales by about 37-48%.
Ghana’s annual electricity consumption per capita increased from about 403 kWh to 417 kWh in
2017 due to the improvement in electricity supply, a significant improvement from pre-2016 era,
though still below the global minimum average of 500 kWh for lower middle-income developing
countries.
With the significance improvement in power supply due to expanded thermal generation capacity,
Ghana’s real GDP growth is projected to remain or improve slightly to 9% (inclusive of oil)44
although the Government expects a more conservative growth; a drop from 8.5% to 6.8%
(inclusive of oil) and 5.4% (non-oil) in 201845.
For the Government’s projected GDP growth rate of 6.8% (8-9% by donor agencies) and
particularly 5.4-6% (non-oil growth) for the country in 2018, we expect the total electricity
required for the GDP growth to be as follows:
a) 16,300 -17,200 GWh (with VALCO constrained to operate at most two potlines).
Expected peak capacity demand required would lie within 2,150-2,300 MW. Average
End-User tariff to make it realized should be within US cents 14-15 per kWh.
41 $45-47 per barrel in 2016, but $56-60 per barrel in 2017. 42 World Bank, Energizing Economic Growth in Ghana: Making the Power and the Petroleum Sectors Rise to the
Challenge, February, 2013 43 ISSER is Institute of Statistical Social and Economic Research 44 IMF World Economic Outlook, Ghana outlook, 2018; AfDB Ghana Economic Outlook, 2018, www.afdb.org./ 45 2018 Ghana Government’s Budget highlights. www.pwc.com.gh

16
b) 17,236 -18,400 GWh (with VALCO constrained to operate at most two potlines).
Expected peak capacity demand required would lie within 2,200-2,400 MW. Average
End-User tariff to make it realized should be within US cents 13-14 per kWh.
c) 18,400-19,500 GWh (with VALCO to operate at most, two potlines). Expected peak
capacity demand required would lie within 2,400-2,600 MW. Average End-User tariff
should be within US cents 11-13 per kWh.
All the three scenarios are achievable provided the following are accomplished:
i. There is adequate financial resource to procure all the fuel needed to run the thermal
power plants even at higher utilisation factors; and
ii. Average end-user-tariff is reduced to within 10-15 US cents per kWh.
Impact of High Electricity Tariff on Demand
In March, 2018, new tariffs were released by the Government announcing the following
reductions; about 17% reduction in Residential; 30% in Commercial and 25% in industrial tariffs.
Table 11 compares the 2018 tariffs against the 2016-2017 tariff regime46.
Table 11: Comparison of Grid Electricity Tariffs Customer Class from 2016 to 2018
CONSUMPTION
CLASS
RESIDENTIAL
(Domestic usage)
NON-RESIDENTIAL
(Commercial usage less
than 100 kVA)
INDUSTRIES
(SLT usage)*
Ghp/ kWh
US
cents/
kWh
Ghp/kWh
US
cents/
kWh
Gp/kWh
US
cents/
kWh
2016-17 2018 2016-17 2018 2016-17 2018
51-300 67.33 55.54 12 96.79 67.75 15
301-600 87.38 72.09 16 102.99 72.09 16
601+ 97.09 80.09 18 162.51 113.76 26
SLT – L V 100.88 75.66 17
SLT – MV 78.09 58.57 13
SLT – HV 71.76 53.82 12
SLT – HV Mines 113.97 102.57 23
US cent 1 – 4.40 Ghana pesewas average as at March, 2018.
US cents / kWh rounded up to the nearest whole number.
*SLT is Special Load Tariff for energy usage for industrial purposes; supply voltages LV–Low Voltage (400V);
MV- Medium Voltage (11,000 V) and HV-High Voltage (33,000 V).
46

17
The drop in tariffs is expected to see higher grid electricity consumption this year. Even though
encouraging and a big step to improve the revenue flow and consequently the sustainability of the
power sector, it is still on the high side. Encouraging consumption could improve job creation and
government finances as well.
As indicated in the previous Outlooks, the prevailing high electricity tariff moves Ghana from once
among less expensive countries to very expensive grid tariff regimes among middle-income
developing countries and such threatens the country’s competitiveness as an investment
destination since her average grid electricity pricing is about twice higher than in South Africa,
China and India ( Table 12).
Table 12: Average End User Tariff ranges of Ghana, selected Middle-Income Developing
Countries and South-East Asia from 2014-2017
Country/Region Ghana South Africa India China
South-East
Asia
US cents/kWh 15-19 8-10 8-9 7-8 4-7
Source:47
Most heavy or base metal industries including the underground gold mines would require on the
average tariff less than 6 US cents per kWh to stay competitive with similar products imported.
Light industries could go as high as 10 US cents per kWh to survive. Thus the prevailing energy
tariffs for industries are still on the very high-side48.
Significance of 2018 Tariffs
Nonetheless, the drop in the tariffs now makes the average grid less expensive than the back-up
alternatives and consequently making it cheaper now for the non-residential (see Table 11)
customers, to rely largely on the grid instead of switching to their back-up gensets during the last
weeks of the month. It would also discourage the hospitality industry specifically the hotels, from
switching to their back-up diesel generation, when their occupancy rates are above 80%49.
Otherwise, these have been some of the survival strategies that the commercial and some industrial
entities have adopted to cope with the relatively high tariffs.
Some businesses have also adopted product importation strategy in order to maintain their market
shares.
Major consumers and businesses shifting from the grid to alternative sources have apparently given
rise to “excess capacity” with corresponding excess capacity charges which would have to be paid
47 Adapted from 2016 World Energy Outlook, International Energy Agency 48 Low or less expensive tariff: 2-9 US cents/kWh; medium expensive tariff: 10-15 cents/kWh; High or very
expensive 18-25 US cents. 26-35 US cents/kWh most expensive. 49 Energy Commission industrial field survey, 2016.

18
either by Government or consumers. Passing on the excess capacity charges would further increase
the already high tariff. Government could absorb the excess cost if also it does not put the country’s
GDP-debt ratio at risk.
Export Market
An option for the excess grid capacity is the export market through the West African Power Pool
(WAPP). The new tariff is expected to improve export to Togo and Benin but marginal since the
said countries equally have the option to import from la Cote d’Voire and wheeled through Ghana
or from Nigeria where the tariffs are lower (see Table 13).
Table 13: Comparison of Electricity Tariff ranges of Ghana and neighbouring Countries in
West Africa from 2017-2018
Country La Cote d’Voire Ghana Togo Benin Nigeria
US cents/kWh 9-12 13-19 16-18 17-19 12-17
Achieving Upper Middle Income by 2020
With per capita income of US$1,225 ($2,950 ppp50) in November 2010 in Ghana attained a lower
middle-income status. Her per capita income has been growing since then. However there has been
wide gaps in infrastructural indicators. For instance, total energy consumption per capita should
average one tonne of oil equivalent (TOE) compared to her current average of 0.25 TOE. The total
electricity consumption per capita should range between 1,000 and 1,100 kWh instead of the
current average hovering below 500 kWh since 2010.
By the end of the last decade, the then Ministry of Energy put up a policy statement to increase the
country’s installed capacity from about 2,100 MW in 2010 to achieve 5,000 MW by 2018 at a
period where the average end-user tariff was below 10 US cents per kWh with the main objective
of achieving upper middle income status by 2020.
Having an total installed capacity of over 5,000 MW could generate about 36,000 GWh by 2020
and corresspondingly increase the average annual electricity consumption per household51 from
about 3,018 kWh in 2010 to around 5,000 kWh by 2020 and consequently grounding the country
firmly in the Upper Middle Income Status.
By close of 2017, the country had achieved an installed capacity of about 4,398 MW capable of
generating over 20,000 GWh which is enough to meet the country’s electricity requirement
50 Purchasing Power Parity 51 Number of households is assumed to expand from 5.5 million to 7.3 million in 2020. Average household size is
assumed to range between 4.3-4.4 by 2020.
19
including supressed demand. However, the average end-user tariff now is about double that of the
last decade and thus consequently making the prevailing tariff less affordable and consequently
creating the excess grid capacity the country is now witnessing.
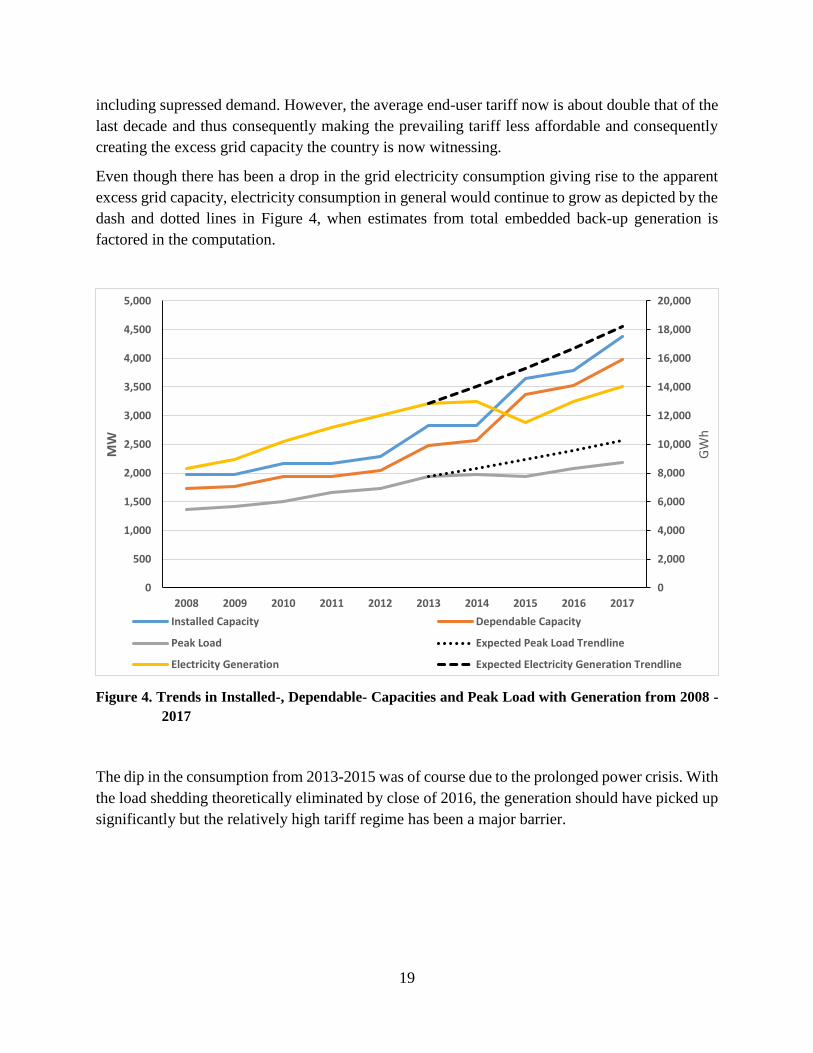
Even though there has been a drop in the grid electricity consumption giving rise to the apparent
excess grid capacity, electricity consumption in general would continue to grow as depicted by the
dash and dotted lines in Figure 4, when estimates from total embedded back-up generation is
factored in the computation.
Figure 4. Trends in Installed-, Dependable- Capacities and Peak Load with Generation from 2008 -
2017
The dip in the consumption from 2013-2015 was of course due to the prolonged power crisis. With
the load shedding theoretically eliminated by close of 2016, the generation should have picked up
significantly but the relatively high tariff regime has been a major barrier.
0
2,000
4,000
6,000
8,000
10,000
12,000
14,000
16,000
18,000
20,000
0
500
1,000
1,500
2,000
2,500
3,000
3,500
4,000
4,500
5,000
2008 2009 2010 2011 2012 2013 2014 2015 2016 2017
GW
h
MW
Installed Capacity Dependable Capacity
Peak Load Expected Peak Load Trendline
Electricity Generation Expected Electricity Generation Trendline

20
1.3.2 The 2018 Grid Electricity Demand Outlook52
Peak Power Demand
The following spot loads are expected to contribute to peak demand growth in 2018:
a) Second potline operation of VALCO i.e., increase from one potline (75 MW) to two
potlines (150 MW)
b) Increase in export to SONABEL (Burkina Faso) - from 9.2 MW in 2017 to 50 MW by the
end of first half of 2018 and 100 MW in the second half of 2018.
c) On-going distribution network expansion works intended to extend coverage and improve
service quality to consumers.
d) Various rural electrification projects under the National Electrification Programme
earmarked for commissioning in 2018.
Summary of Peak Grid Electricity Demand Forecast for 2018
Figure 5 describes the Peak Demand, showing the percentage share of each customer class.
2018 Share of Projected Peak Demand based on Customer Classes
EXPORTS LOSSES
4%
5%
VALCO
6%
Other users 2%
MINES 9%
Enclave Power
1% NEDCo
8% ECG 65%
Figure 5. Share of projected peak power demand based on Customer Classes for 2018
52 This work mostly adapted from a 2018 Electricity Supply report jointly produced with GRIDCo, VRA, Bui, ECG
and NEDCo, January, 2018.

21
From Figure 5, ECG’s demand would constitute 65% of the total system peak followed by NEDCo
and the Mines at 9% each53. VALCO at two potlines would constitute 6%. Other Bulk Consumers
would constitute 2 % whilst Exports to Togo & Benin (CEB) and Burkina Faso (SONABEL)
together would account for 5%.
Table 14 shows a summary of 2018 peak grid power demand forecast based on the utilities’
customer classes.
Outlook of Grid Electricity Consumption
Total grid electricity consumption including transmission network losses is projected at 16,304.79
GWh in 2018. This includes estimated transmission losses and network usage of 594.30 GWh,
representing 3.6 % of total electricity consumption. The projected 2018 grid electricity
consumption represents a growth of approximately 15.11 %, over the 2017 actual consumption of
14,177.33 GWh, an increase of 2,127.46 GWh.
Table 15 presents the summary of 2018 grid electricity consumption by customer classes.
53 ECG is Electricity Company of Ghana, a distribution utility for largely southern Ghana.
NEDCo is Northern Electrification Company of Ghana, a distribution utility for largely northern Ghana.
Table 14: Summary of 2018 Peak Grid Power Demand forecast by Customer Classes
DEMAND SECTOR CUSTOMER CLASS COINCIDENT PEAK DEMAND
(MW)
Domestic Peak Demand
ECG 1642.72
NEDCo 211.71
Enclave Power 34.23
Mines (largely gold mining) 226.71
Other Bulk 40.74
Losses+Network Usage 84.37
Total Domestic Peak Demand 2240.48
Exports
CEB (Togo & Benin) 30
CIE (la Cote d’Voire) 3
SONABEL (Burkina Faso) 100
Total Exports 133
VALCO 150
Coincident Peak Demand MW 2523.48

22
Table 15: Summary of Projected 2018 Grid Electricity Supply by Customer Classes.
ENERGY CUSTOMER
PROJECTED
REQUIREMENT (GWh)
Domestic Consumption
Electricity Company of
Ghana (ECG) 10,588.86
Northern Electrification
Development Co. (NEDCo) 1,373.10
Enclave Power Company 167.74
Mines (largely gold mining) 1,495.41
Other Bulk Customers 259.22
Losses + Network Usage 594.30
Total Domestic 14,478.63
Export
CEB (Togo & Benin) 230.00
CIE (la Cote d’Voire) 13.21
SONABEL (Burkina Faso) 428.76
VALCO 1,154.19
Total Electricity (GWh) 16,304.79
Source: 2018 Electricity Supply Plan
Figure 6 shows a representation of the projected consumption of the various customer groupings
and their percentage share in 2018. As shown in Figure 6, ECG’s uptake of 10,588.86 GWh for its
customers represents about 65% of the total projected grid electricity requirement in 2018. It is
followed by Mines with a projected consumption of 1,495.41 GWh representing 9% of the total
consumption.
2018 Share of Projected Grid Electricity Supply to Costumers (GWh)
EXPORTS Losses
4%
4%
VALCO
7%
OTHER BULK CUSTOMERS
2%
MINES
9%
Enclave Power Company
1%
NEDCo
8%
ECG
65%
Figure 6. Share of Projected Grid Electricity Supply based on Customer Classes for 2018

23
1.4 Available Electricity Supply for 201854
1.4.1 Generation Sources
The sources of generation considered are mainly from the existing generation and the committed
projects expected to come online in 2018.
Existing Generation Sources – Hydropower
Akosombo and Kpong Hydro
The year start elevation for the Akosombo reservoir was 76.60m (251.31ft) which is lower than
the Lower Operating Rule Curve of 76.87m (252.20ft) for the reservoir.
In the light of this low elevation of the Akosombo reservoir, it is planned to operate three (3)
turbine units during Off-peak and up to four (4) units during Peak periods in 2018. This mode of
operation is expected to result in an average Plant Output of 600 MW at Akosombo and this would
ensure that the reservoir level is kept above the Minimum Operating Level of 240 ft (73.15m) by
the end of the dry season.
Figure 7. Akosombo Reservoir Trajectory projected for 2018
54 This work mostly adapted from a 2018 Electricity Supply Plan jointly produced with GRIDCo, VRA, Bui, ECG
and NED, January, 2018.
24
Kpong Hydroelectric Station which is currently undergoing retrofit, would be required to run three
(3) out of the four (4) total installed turbine units resulting in an average plant output at Kpong
Station is projected at 105 MW.
As a result of the two hydroplants operations, the expected total annual electricity generation from
Kpong and Akosombo hydropower Stations is 4,200 GWh.
Bui Hydro
In 2018, Bui hydropower plant is projected to operate an average of two turbine (2) units
throughout the year. This mode of operation would lead to a projected annual production of 756
GWh. Bui Hydro is assumed to provide an average generation capacity of 220 MW to support
demand.
It is estimated that, for continuous and sustainable operation of the Bui Power Station for 2018 and
for the subsequent years (in the likely event of low inflows), the reservoir level at the end of the
dry season of 2018 should not drop below elevation 170 masl55.
With a projected year-start elevation of 175 masl in 2018 and the total estimated total electricity
production of 756.21 GWh for 2018, the year-end elevation is projected at 174.9 masl.
Assumptions for the projected 2018 generation from the Bui Hydro Plant are as follows:
i. 64% long-term average inflow of 6,167 million cubic metres.
ii. 2018 year start elevation of the Bui reservoir at 175 masl.
iii. Operation of two turbine units in normal mode at 110 MW during the year.
iv. Operation of third unit in Synchronous Condenser Mode (SCM) when required by NITS
during the year.
v. Operation of an additional 4 MW ‘small’ hydropower plant also installed and available at
Bui which has a 3.75 MW turbine throughout the year.
Figure 8 shows the 2018 projected trajectory for Bui hydropower plant.
55 metres above sea level, a description used by the Bui Power Authority to describe the reservoir level at Bui.
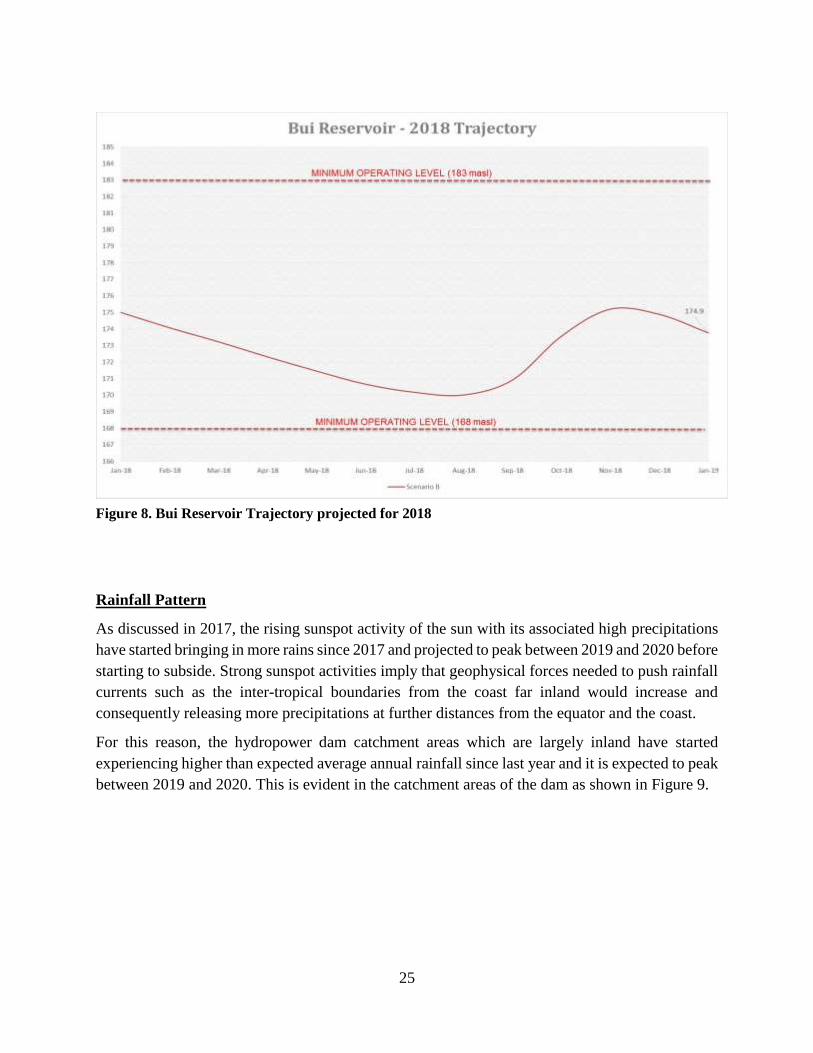
25
Figure 8. Bui Reservoir Trajectory projected for 2018
Rainfall Pattern
As discussed in 2017, the rising sunspot activity of the sun with its associated high precipitations
have started bringing in more rains since 2017 and projected to peak between 2019 and 2020 before
starting to subside. Strong sunspot activities imply that geophysical forces needed to push rainfall
currents such as the inter-tropical boundaries from the coast far inland would increase and
consequently releasing more precipitations at further distances from the equator and the coast.
For this reason, the hydropower dam catchment areas which are largely inland have started
experiencing higher than expected average annual rainfall since last year and it is expected to peak
between 2019 and 2020. This is evident in the catchment areas of the dam as shown in Figure 9.

26
Figure 9. Total Rainfall in key towns in catchment areas and inflows into the Akosombo Reservoir
2000-2017
Thus the precipitations and inflows indicate upward trend from 2015 to present.
Figure 10. Monthly Water Level at Akosombo Reservoir from 2015-2017
15
25
35
45
55
65
20
25
30
35
40
45
Infl
ow
in B
illio
n m
3
fee
t
Year
Total Rainfall in Catchment Areas of Akosombo Dam and Inflows
2000-2017
Rainfall (ft) Akosombo Level (ft 0') Inflow (Billion m3)
225
230
235
240
245
250
255
Monthly Water Level from 2015-2017
2015 2016 2017 Minimum level
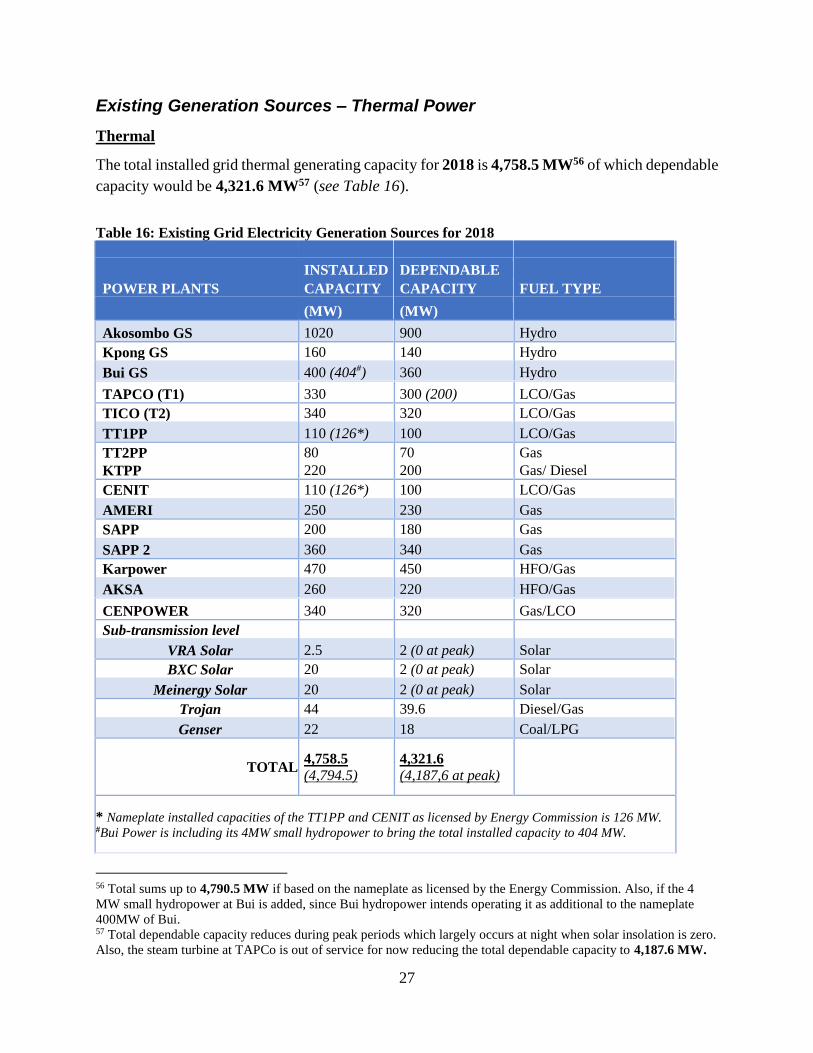
27
Existing Generation Sources – Thermal Power
Thermal
The total installed grid thermal generating capacity for 2018 is 4,758.5 MW56 of which dependable
capacity would be 4,321.6 MW57 (see Table 16).
Table 16: Existing Grid Electricity Generation Sources for 2018
INSTALLED DEPENDABLE
POWER PLANTS CAPACITY CAPACITY FUEL TYPE
(MW) (MW)
Akosombo GS 1020 900 Hydro
Kpong GS 160 140 Hydro
Bui GS 400 (404#) 360 Hydro
TAPCO (T1) 330 300 (200) LCO/Gas
TICO (T2) 340 320 LCO/Gas
TT1PP 110 (126*) 100 LCO/Gas
TT2PP 80 70 Gas
KTPP 220 200 Gas/ Diesel
CENIT 110 (126*) 100 LCO/Gas
AMERI 250 230 Gas
SAPP 200 180 Gas
SAPP 2 360 340 Gas
Karpower 470 450 HFO/Gas
AKSA 260 220 HFO/Gas
CENPOWER 340 320 Gas/LCO
Sub-transmission level
VRA Solar 2.5 2 (0 at peak) Solar
BXC Solar 20 2 (0 at peak) Solar
Meinergy Solar 20 2 (0 at peak) Solar
Trojan 44 39.6 Diesel/Gas
Genser 22 18 Coal/LPG
TOTAL 4,758.5
(4,794.5) 4,321.6
(4,187,6 at peak)
* Nameplate installed capacities of the TT1PP and CENIT as licensed by Energy Commission is 126 MW. #Bui Power is including its 4MW small hydropower to bring the total installed capacity to 404 MW.
56 Total sums up to 4,790.5 MW if based on the nameplate as licensed by the Energy Commission. Also, if the 4
MW small hydropower at Bui is added, since Bui hydropower intends operating it as additional to the nameplate
400MW of Bui. 57 Total dependable capacity reduces during peak periods which largely occurs at night when solar insolation is zero.
Also, the steam turbine at TAPCo is out of service for now reducing the total dependable capacity to 4,187.6 MW.

28
In 2018, two new major generating plants expected to be commissioned are:
340 MW Cenpower Thermal Power Plant. The plant is expected to be commissioned
by the second quarter of 2018.
20 MWp Meinergy Solar PV Plant. The Plant would feed directly into the Medium
Voltage (MV) Network and is located in the Central Region. It is also expected to be
commissioned in the second half of 2018.
Planned Maintenance
The schedule of key maintenance activities planned to be undertaken in 2018 on generating units
at the various power stations is shown in Table 17.
Table 17: 2018 Planned Maintenance for the Power Plants.
PLANTS PLANNED MAINTENANCE
Akosombo GS Each of the six (6) units is scheduled to undergo annual maintenance, one at a time
for a duration 18 days
Kpong GS Unit 1: Post retrofit inspection for 30 days from July 1 – 30, 2018
Unit 2: undergoes quarterly maintenance for a period of 1 week in August and
December, 2018
Unit 3: Major Retrofit from January 1 - October 31, 2018
Unit 4: undergoes quarterly maintenance for a period of 1 week in June and October. Underwent one week in February.
Bui GS Unit 1 underwent maintenance from March 7 – April 18, 2018. Unit 2 is scheduled for July 3 - 31, 2018.
Unit 3 is scheduled for October 1 - 29, 2018.
TAPCO (T1) Unit 1: Fuel Nozzle Inspection and Compressor Water Wash from September 16 - 23,
2018.
Unit 3: scheduled for minor Inspection from March 30 – April 21. Steam turbine is out of service.
TICO (T2) Unit 1: Major Inspection from October 1 - November 29, 2018.
Unit 3: Warranty Clearance Outage completed from January 13 - 27, 2018
TT1PP 12 days’ maintenance from February 19 - March 2, 2018 completed.

29
TT2PP Unit 1: Core Engine swap and main gearbox overhaul from July 17 – August 10,
2018.
Unit 2: Core Engine swap and main gearbox overhaul from June 1 – June 25, 2018.
Unit 3: Core Engine Swap and main gearbox overhaul from July 24 – July 18.
Unit 4: Undergo maintenance for 12 days from October 1 - 12, 2018
Unit 5: Undergo maintenance for 12 days from September 14 - 25, 2018
Unit 6: Undergo maintenance for 12 days from September 22 - October 3
Unit 7: Undergo maintenance for 12 days from October 9 - 20, 2018
Unit 8: Undergo maintenance for 12 days from October 17 - 28, 2018
KTPP Unit 2 scheduled for maintenance for 10 days from April 16 – 25, 2018.
ASOGLI I Unit 4 & 6: undergo maintenance from July 1 - 31, 2018
Unit 5 : undergoes maintenance from August 5 - 18, 2018
Unit 2 & 3: undergo maintenance from August 18 - 31, 2018
Unit 1 undergoes maintenance from September 8 - 18, 2018
ASOGLI II Unit 7: undergoes maintenance from September 1 - 21, 2018
Unit 9 & 10 : undergo maintenance from November 10 - 27, 2018
CENIT Plant scheduled for Hot Gas Path Inspection from April 21 - May 12, 2018
AKSA One unit undergoes maintenance in September, October and November
for 12 days each time.
Karpower
Barge Units 1 to 24 scheduled for maintenance for a total of 336 hrs in February, April and
November 2018 and then for 384 hrs in September 2018.
Units 1 to 26 undergo maintenance for a total of 672 hrs in June 2018.
Units 25 & 26 will undergo maintenance in August and December, 2018 and then for 96 hrs in October 2018.

30
1.4.2 Grid Demand-Supply Balance
The criteria used to determine which power plants would be dispatched on a monthly basis
during the year are as follows:
a. Merit order dispatch.
b. Availability of fuel per plant.
c. Must-run plants; take-or-pay plants.
d. Variable or intermittent systems like the solar plants.
e. System stability requirements.
f. Instances where there is supply surplus, some plants would not be dispatched under normal
operating conditions.
The grid electricity demand - supply balance for 2018 is presented in Table 18.
It is seen from the Table 18 that the total generation from VRA plants would be about 8,539
GWh, representing 52.4% of the projected total grid electricity generation in 2018. Generation
from Bui Hydro and other Independent Power Producers (IPPs) total about 7,766 GWh,
accounting for 47.6%, out of which total IPP generation is 7,010 GWh, representing 43% of
projected total generation in 2018.
Figure 11 shows a graphical representation of Table 17, giving the percentage share of each
generation type. Thermal generation thus would constitute 69.3% of projected total generation
whilst hydro generation and generation from solar PV would constitute 30.4% and 0.3%
respectively.
Figure 11. Share of Grid Electricity Supply by Generation Type for 2018

31
Table 18: 2018 Projected Grid Electricity and Supply Balance in GWh
Projected Grid Demand/Supply Demand/Supply (GWh)
Total Ghana (so-called Domestic) 14,478.63 VALCO 1,154.19 Exports (CEB+SONABEL+CIE) 671.97
Total Projected Requirement 16,304.79
Projected Supply
Total VRA Hydro (Akosombo & Kpong GS) 4,200.11 Bui GS 756.21
Sub-Total: hydro 4,956.32 VRA Existing Thermal & Solar Generation T1 1,457.06 T2 2,155.05 TT1PP 352.98 KTPP 369.24 MRPP 0 TT2PP/TT2PP-X 0 Solar 4.20 Sub Total 4,338.53
Existing IPP Thermal & Solar Generation AMERI Power Plant 796.53 Karpower Barge 2,708.25 SAPP+SAPP Phase 2 1,466.11 CENIT 380.93 AKSA 558.49 CENPOWER 1,061.21 BXC Solar 25.54 MEINERGY Solar 12.90
Total IPP Thermal & Solar Generation 7,009.96
Total VRA Supply 8,538.64
Total Non-VRA Supply 7,766.15
Total Supply 16,305
This implies that in 2018, generation from thermal sources would be more than twice that from
hydro sources. This high percentage of thermal generation could have serious implications for the
power sector for the following reasons:
i. It will adversely impact the finances of the local power utilities, since local tariffs are cedi
denominated and if the cedi becomes relatively unstable during the year.
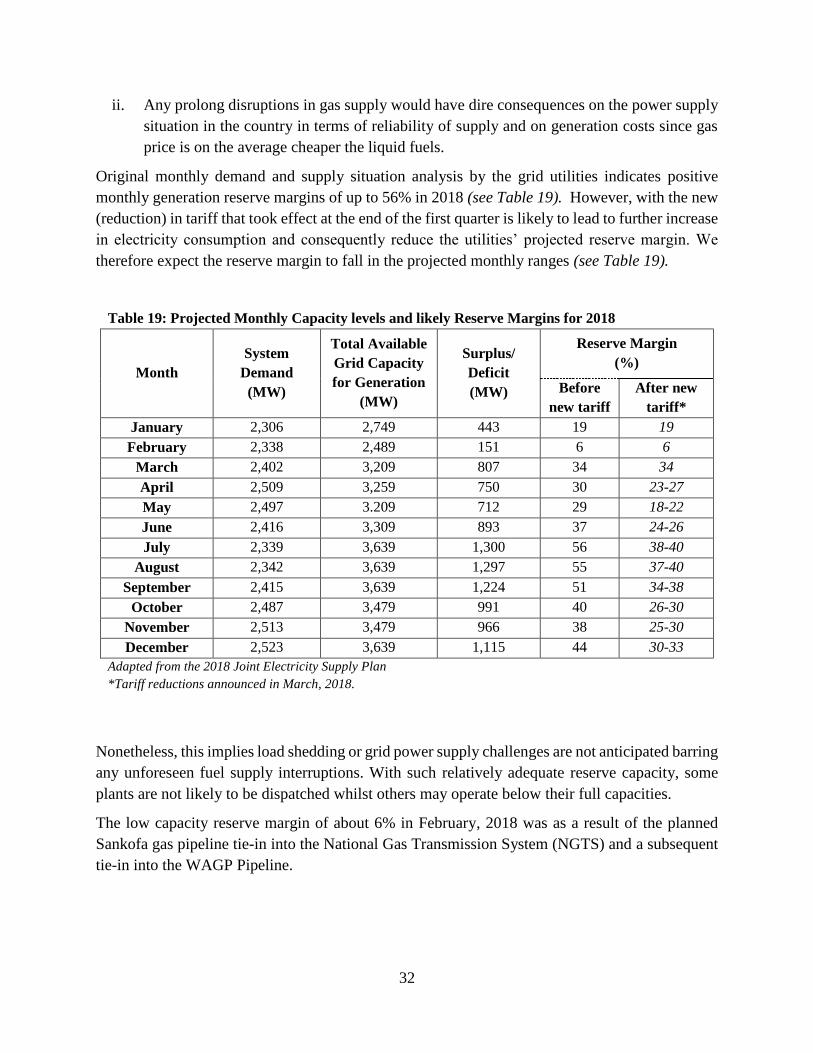
32
ii. Any prolong disruptions in gas supply would have dire consequences on the power supply
situation in the country in terms of reliability of supply and on generation costs since gas
price is on the average cheaper the liquid fuels.
Original monthly demand and supply situation analysis by the grid utilities indicates positive
monthly generation reserve margins of up to 56% in 2018 (see Table 19). However, with the new
(reduction) in tariff that took effect at the end of the first quarter is likely to lead to further increase
in electricity consumption and consequently reduce the utilities’ projected reserve margin. We
therefore expect the reserve margin to fall in the projected monthly ranges (see Table 19).
Table 19: Projected Monthly Capacity levels and likely Reserve Margins for 2018
Month
System
Demand
(MW)
Total Available
Grid Capacity
for Generation
(MW)
Surplus/
Deficit
(MW)
Reserve Margin
(%)
Before
new tariff
After new
tariff*
January 2,306 2,749 443 19 19
February 2,338 2,489 151 6 6
March 2,402 3,209 807 34 34
April 2,509 3,259 750 30 23-27
May 2,497 3.209 712 29 18-22
June 2,416 3,309 893 37 24-26
July 2,339 3,639 1,300 56 38-40
August 2,342 3,639 1,297 55 37-40
September 2,415 3,639 1,224 51 34-38
October 2,487 3,479 991 40 26-30
November 2,513 3,479 966 38 25-30
December 2,523 3,639 1,115 44 30-33
Adapted from the 2018 Joint Electricity Supply Plan
*Tariff reductions announced in March, 2018.
Nonetheless, this implies load shedding or grid power supply challenges are not anticipated barring
any unforeseen fuel supply interruptions. With such relatively adequate reserve capacity, some
plants are not likely to be dispatched whilst others may operate below their full capacities.
The low capacity reserve margin of about 6% in February, 2018 was as a result of the planned
Sankofa gas pipeline tie-in into the National Gas Transmission System (NGTS) and a subsequent
tie-in into the WAGP Pipeline.

33
1.4.3 Fuel Requirements and Cost Implications
In 2018, natural gas, Light crude oil (LCO), diesel and Heavy fuel oil (HFO) are the types of fuel
that would be required for firing thermal generating plants on the Ghana power system just as in
the previous years. HFO, LCO and diesel are procured from the open market but are largely to
come from Nigeria to save freight cost.
Fuel Allocation and Cost
Fuel type
Natural Gas
Natural gas would come from two sources; WAGP carrying gas from Nigeria; and Ghana Gas
pipeline carrying indigenous gas from the Jubilee, TEN and Sankofa fields.
WAGP Gas – Average supply of 60 mmscfd is assumed throughout the year.
Ghana Gas
i. Jubilee Fields- Average of 100 mmscfd is assumed throughout the year.
ii. TEN Fields – Average of 50 mmscfd is assumed throughout the year.
iii. Sankofa Fields – Average of 120 mmscfd during the second half of the year.
Average WAGP gas delivered in 2017 was 30 mmscfd, whilst supply from Ghana Gas was about
81 mmscfd.
For 2018, we expect the average WAGP gas flow to double that of last year. We also expect the
Ghana Gas supply to double; increasing to about 150 mmscfd and then up to about 300 mmscfd
by close of the year due to additional supplies from TEN and the Sankofa-Gye Nyame fields.
Total gas delivered in 2017 was about 43,368,000 mmBTU. For 2018, we expect gas delivery of
about 66,816,000 mmBTU.
Average delivery price of the WAGP gas in 2017 was $8.6/mmBTU ($9.42/mscf) and that of
Ghana Gas was $8.84/mmBTU ($9.69/mscf). For 2018, the delivery gas price would be an
weighted average price of $7.29/mmBTU ($7.56/mscf)58. About $487 million would be needed
for the gas procurement.
58 Announced by PURC in March, 2018.

34
LCO
The total LCO used in 2017 was about 1.7 million barrels. For 2018, almost 3 million barrels
would be required, i.e. equivalent to a total of 6 cargoes (405,000 barrels) of LCO.
In 2017, the average delivery price of the light crude (i.e. including transportation and treatment)
for power generation was $63 per barrel. For 2018, we expect the average delivery price to increase
to $75 per barrel remain. The total cost involved thus would average $225 million59.
HFO
HFO would be used mainly by the Karpower Barge and AKSA power plant. Total HFO used in
2017 was about 3.6 million barrels.
For 2018, an estimated 3.2 million barrels (454,399 tonnes) would be required. This translates to
almost 8 cargoes, assuming a cargo size of 405,000 barrels at an estimated delivery cost of about
$184 million at $58 per barrel.
Diesel
As usual, diesel would be used mainly for starting and shutting down the thermal plants. In 2017,
about 400,000 barrels were used but also by the standby plants. For 2018, just about 100,000
barrels (about one-fourth of a cargo size of 405,000 barrels) would be required costing about $8.4
million at $84 per barrel.
Fuel Allocation
Since the available gas would still not be enough for all the gas-fuelled thermal plants, fuel supply
to the Tema and Takoradi Power Enclaves shall be strategically managed as follows:
Tema Enclave
WAGP 60 mmscfd; 30 mmscfd would be allocated to Sunon-Asogli power plants and 30
mmscfd for the following VRA plants at Tema, namely, Tema Thermal Plant 1 (TT1PP)
and Kpone Thermal Plant (KTPP).
VRA Tema Thermal Plant (TT2PP/TT2PP-X) to operate on gas but would be on standby.
CENIT and Cenpower would operate on LCO.
Karpower would continue to operate on HFO for the first half of the year and then be
relocated to Takoradi to be run on gas from Sankofa field during the second half of the
year.
AKSA would also operate on HFO.
59 Joint Supply team estimated US$210 million initially.

35
Takoradi Enclave
TAPCo (T1) to operate mainly on gas and TICo (T2) also to operate mainly on gas.
Any excess gas to be directed to the AMERI plant.
Karpower plant to operate on gas from Sankofa field from July to December 2018 but
likely to be delayed due to slow pace of work.
Fuel Prices
Table 20 provides the delivery prices of fuels assumed for the year:
Table 20: Expected Average Delivered Fuel Prices for the Thermal Plants for 2018
FUEL TYPE Average Delivered Price and equivalent
US$/mmBTU US$/mscf US$/bbl US$/tonne
WAGP (Nigeria) Gas 7,29* 7.56
Ghana Gas 7.29* 7.56
LCO 13 7560 525
Diesel 14 84 588
HFO 10 58 405
The US$/mmBTU in italics are approximate equivalent prices of the liquid fuels.
*weighted gas price released by PURC, 2018.
In all, about $905 million would be needed for fuel. Summary of estimated amount of fuel needed
and the cost involved are as presented in Table 21.
60 LCO price volatility range could increase to US$ 70-80 per barrel by the close of the year.

36
Table 21: Estimated Quantities of Fuel and Cost involved for the Power Plants for 2018.
PLANT LCO Natural Gas HFO Diesel
(Barrels) (mmBTU) (Barrels) (Barrels)
TAPCO (T1) 11,996,329
TICO (T2) 596,986 13,987,551
Tema Thermal (TT1PP) 4,204,032
Kpong Thermal (KTPP) 4,393,956
CENIT 885,658
AMERI 8,094,557
Sunon-Asogli Plants 13,194,185
CENPOWER 1,512,221
Karpower Barge 10,945,185 1,977,045
AKSA 1,203,328
Starting and switching off plants 100,000
TOTAL FUEL 2,994,865 66,816,052 3,180,373 100,000
TOTAL FUEL COST (US$) 224,614,875 487,089,019 184,461,634 8,400,000
905,233,689
1.4.4 Transmission System Performance
State of the NITS61
In Ghana, the transmission of electricity is done at three main voltage levels, namely; 161 kV, 69
kV network and 330 kV. There is also a 225 kV voltage level transmission but this is only through
an interconnection with Ghana’s western neighbour Cote d’Ivoire. A similar interconnection with
Togo is through two 161 kV lines.
The National Interconnected Transmission System (NITS) increased from approximately 5,208
circuit kilometres (km) of high voltage transmission lines in 2016 to about 5,284 circuit km at the
end of 2017. It connects all the major generation plants to sixty four (64) Bulk Supply Points across
the nation.
The transmission lines consist of 364 km of 330 kV line, about 4,637 km of 161 kV and 133 km
of 69 kV lines. There is a 225 kV tie-line which interconnects the Ghana grid with that of Cote
d’Ivoire and two 161 kV tie-lines that interconnect Ghana grid with that of Togo. In addition, there
61 See Annex 2

37
is a single circuit 225 kV tie-line of about 74 km linking the country’s network with that of Cote
d’Ivoire.
The network now has 127 transformers from 123 in 2016, installed at various load centres across
the country with a Total Transformer Capacity increased from 4,598.86 MVA62 to almost 5,610
MVA by close of 2017.
The System Control Centre (SCC) in Tema is responsible for the real time dispatch (monitoring,
coordination and control) of the Ghana Power System as well as cross-border power exchanges
with neighbouring countries.
Ghana Grid Company (GRIDCo) is the operator of the NITS and is responsible for the real time
dispatch (monitoring, coordination and control) of power system operations on the Ghana Power
System as well as cross-border power exchanges with neighbouring countries.
Transmission Line, Feeder and Sub-station Availability
The criteria for transmission Line, Feeder and Substation availability are as presented below;
i. All existing transmission lines are expected to be in service to ensure transmission of
electricity from the generation stations to the Bulk Supply Points across the nation and to
enable the execution of power exchanges with neighbouring countries.
ii. Maintenance work on transmission lines and substations is not to significantly affect
power supply to customers except for single transformer substations and consumers
served on radial lines.
In 2018, just as in the previous years, all existing transmission lines are expected to be in service
for the transmission of electricity generated at the power plants to bulk supply points across the
nation and as well to enable the execution of power exchange programmes with neighbouring
countries.
Maintenance work on transmission lines and substations are not expected to significantly affect
power supply to customers except for single transformer substations and consumers served on
single radial lines. Most transformers in operation on the NITS are designed with a capability of
100% continuous loading and Transformer Utilization Factor (TUF). Indications from GRIDCo
therefore suggests that there is adequate transformer capacity on the NITS for the supply of power
under normal operating conditions63.
62 MVA is Megavolt-Ampere 63 2018 Electricity Supply Plan; joint work with GRIDCo, VRA, Bui Authority, ECG and NEDCo.
38
Impacts of Transmission on Network Expansion Projects
There are a number of transmission expansion projects currently on-going which are expected to
be commissioned into service during the second half of 2018. They are:
i. Volta–Achimota–Mallam Transmission Line Upgrade Project
Upgrading of transmission lines in the Volta – Achimota corridor would increase the
evacuation capacity from Tema generation hub to the load centre of Accra. This is
necessary to ensure the evacuation of generation from the new thermal power plants in
Tema, namely Karpower (225MW), Sunon-Asogli Phase II (360MW) and the Kpone
Thermal Power Plant (KTPP-200MW). The project would increase transfer capacity to
Accra Central station to facilitate high voltage power transmission close to the central
business district of Accra. This would also significantly reduce system losses.
ii. Aboadze–Prestea-Kumasi 330 kV Transmission Line Project:
This would improve high voltage transmission in Kumasi and adjacent substations and
consequently reduce overall system losses. The project would also allow for increase in
power export capacity to Northern region as well as Burkina Faso.
iii. Kumasi – Bolgatanga 330 kV transmission line Project:
The project would primarily allow for the export of up to 150 MW of power to Burkina
Faso. It would also improve upon the supply capacity and reliability to the northern Ghana.
iv. Construction of 330 kV Bulk Supply Point substation at Pokuase
This would increase the reliability of supply to Accra and increase transfer capacity
between the generation hub of Aboadze and Tema to the load Centre at Accra. It would
also allow for the reliable evacuation of the 360 MW Sunon Asogli Phase II plant.
v. Construction of 3x125 MVA station64 at Accra Central: The station would supply
Power to the Central Business District of Accra to meet its growing demand and also clear
the overload on the Achimota and Mallam stations which supply power above the station’s
firm capacity.
vi. Construction of 2x66 MVA Bulk Supply Point at Afienya: The project is expected to
improve upon supply reliability to Ghana Water Company’s pumping station at Dodowa.
It would also reduce the loading on the New Tema substation and increase supply
reliability to Afienya and its environs.
64 Gas-Insulated Substation

39
Fuel Supply and Transmission Challenges
Fuel Supply Challenges
Hydro Risk
Even though, there is high prospects for rainfall this year, it would still be prudent to continue the
conservative dispatch of the hydro plants to ensure that the reservoirs are not drawn down below
their minimum operating levels to guarantee sustainable operations in the coming years.
Thermal Fuel Risk
Ghana Gas and Tullow have scheduled to carry out planned works between February and July,
2018. The Tie-in of the Sankofa Gas Pipeline to the National Gas Transmission System (NGTS)
at Sanzule scheduled for February has already been completed.
Tie-in of the NGTS with the WAPCo Gas Pipeline which started in 2016 is on-going and it is
expected to be completed in the second quarter of the year. This line would facilitate West-to-East
Reverse Flow of gas using the WAPCo Gas Pipeline and pave the way for Ghana Gas to supply
natural gas to power plants in the East of Ghana, i.e. Tema Power Generation Enclave. ENI oil,
the main developer of the Sankofa gas fields is sponsoring the 225 mmscfd capacity pipeline
project.
Nonetheless, one crucial requirement for reliable power supply is the availability of the required
dependable plant capacities, quantities of fuel and funds to purchase the fuel in a timely manner.
Gas supply sustainability remains one of the major risks to reliable electricity supply in Ghana.
Although, installed generating capacity is currently high, inadequacy and/or unavailability of fuel
to run the thermal units would rendered some thermal plants inoperable.
To forestall fuel supply deficits and possible electricity supply disruptions to consumers during
maintenance periods, there is the need to make advanced arrangements for adequate LCO storage
at both Tema and Takoradi power enclaves.
It is also imperative that the companies in the Gas Supply chain, namely, Tullow, ENI, GNPC,
Ghana Gas, BOST and others collaborate strongly with the power supply entities to ensure
effective planning and coordination.

40
Transmission Challenges
Power Evacuation
There are also transmission capacity constraints in some portions of the network which could
lead to transmission line overloads. For instance, insufficient reactive power compensation could
lead to poor customer supply voltage in areas such as Kumasi, Accra and some parts of the
Western region.
Radial Lines and Single Transformer Stations
Currently, supply reliability to customers served via single circuit radial lines is quite low. This is
because an outage on such single circuit radial lines interrupts supply to such customers. Some of
the single circuit radial lines on the NITS are the: Tamale–Yendi, Takoradi–Esiama; Dunkwa–
Asawinso; Bogoso–Akyempim; Bolga- Zebilla; Zebila–Bawku lines, etc. Supply reliability to
customers served on these lines would improve in future when such lines are upgraded through
construction of additional line(s) or by looping them into other adjoining substations.
Similar to single circuit radial lines, consumers supplied by single transformer substations also
suffer low level of supply reliability. Maintenance and/or upgrade works at these stations are often
a challenge due to difficulties in securing outages to carry out planned maintenance works. Such
townships supplied via single transformer stations are Yendi, Sogakope, Esiama, Akosombo
Township, VRA Township at Akuse, etc.

41
2.0 Petroleum Subsector: Oil
2.1 Overview of Petroleum Supply in 2017
Ghana’s oil production in 2017 was about 58.6 million barrels coming from the three main
commercial fields, Jubilee (55.8%), TEN (34.9%) and Sankofa-Gye Nyame (9.3%) compared to
about 32.3 million barrels in 2016, representing an increase of about 81% over the previous year.
Average daily production for the year was about 175,000 barrels against the targeted production
of about 250,000 barrels.
Indigenous Oil Production
Saltpond field
There was no production from the Saltpond field, it has been closed since 2016.
Jubilee field
Total oil production from the Jubilee field in 2017 was around 32.7 million barrels compared with
26.9 million barrels in 2016 and 37.4 million barrels in 2015.
Average daily oil production from the Jubilee field continued its downward trend; dropped from
about 94,200 barrels in 2016 to 91,382 barrels in 2017, unable to reach the target of 120,000 barrels
per day as projected by the industry since 2012 (see Figure 12).
Figure 12. Jubilee field daily oil production trend; 2011-2017
0
20,000
40,000
60,000
80,000
100,000
120,000
140,000
1/1/2011 1/1/2012 1/1/2013 1/1/2014 1/1/2015 1/1/2016 1/1/2017
bar
rels
pe
r d
ay
Jubilee Daily Production 2011-2017
Net Oil Produced (BBLS) Expected Production

42
Mean daily production rose from about 86,000 barrels during the first quarter to about 90,000
during of the second half year, then peaking to about 97,000 barrels at the end of the third quarter
before dropping to around 91,000 barrels by close of the year.
TEN field
First oil from the TEN field was in August 2016 with production for the year totalling over 5
million barrels. Total production rose to 20.4 million barrels in 2017. Average daily production
rose from about 23,600 barrels in 2016 to about 59,300 barrels in 2017, falling short of the
projected average production target of 80,000 barrels for 2017 (see Figure 13).
Figure 13. TEN field daily oil production trend, 2016-2017
Sankofa-Gye Nyame field
First oil from the Sankofa-Gye Nyame field65 occurred in May, 2017. Total production for the year
was about 5.5 million barrels. Starting with average daily production of about 12,000 barrels,
increased slightly to almost 18,000 barrels in the third quarter then reaching around 36,000 barrels
at the end of the year. The average daily production target for the year was 45,000-50,000 barrels
per day but only about 25,000 barrels could be realised66 (Figure 14)
65 Also called OCTP (Offshore Cape Three Point) field 66 http://www.oilviewafrica.com/exploration/ghana-sankofa-field; https://ghanatalksbusiness.com/first-oil-flow-
sankofa/
0
10,000
20,000
30,000
40,000
50,000
60,000
70,000
80,000
90,000
18
-Au
g-1
6
18
-Se
p-1
6
18
-Oct
-16
18
-No
v-1
6
18
-Dec
-16
18
-Jan
-17
18
-Fe
b-1
7
18
-Mar
-17
18
-Ap
r-1
7
18
-May
-17
18
-Ju
n-1
7
18
-Ju
l-1
7
18
-Au
g-1
7
18
-Se
p-1
7
18
-Oct
-17
18
-No
v-1
7
18
-Dec
-17
Bar
rels
pe
r d
ay
TEN Daily Oil Production 2016-2017
Net Oil Produced (BBLS) Expected Production
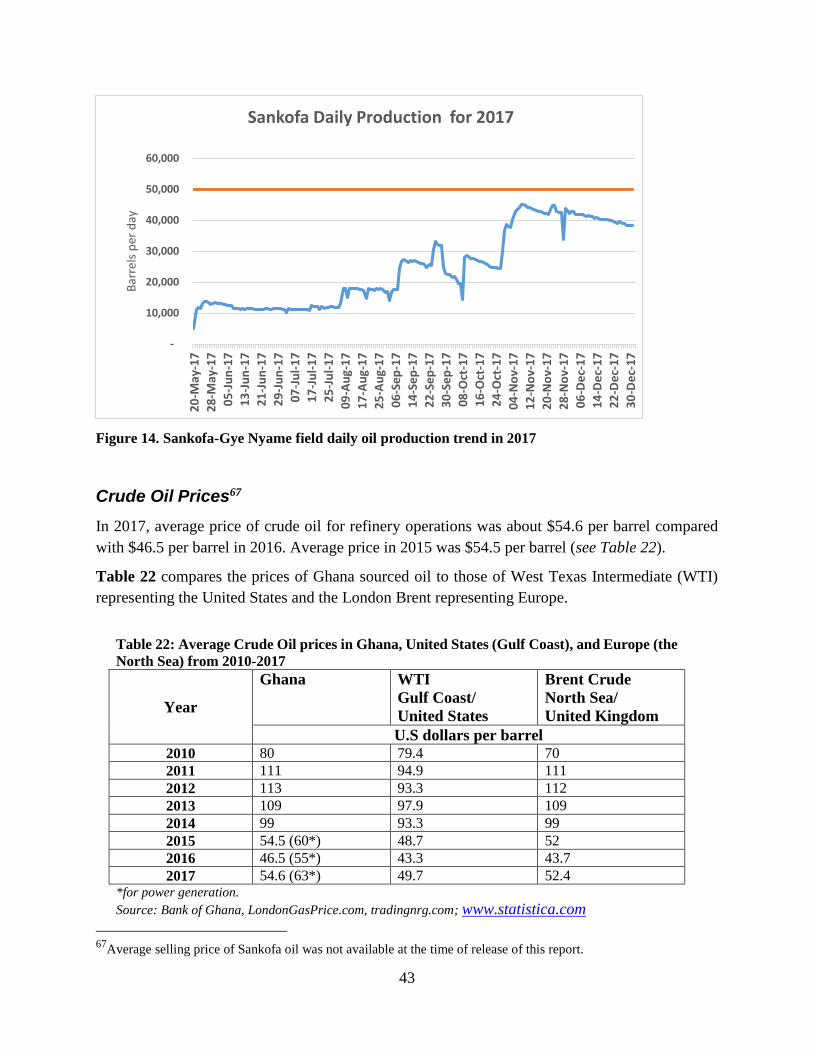
43
Figure 14. Sankofa-Gye Nyame field daily oil production trend in 2017
Crude Oil Prices67
In 2017, average price of crude oil for refinery operations was about $54.6 per barrel compared
with $46.5 per barrel in 2016. Average price in 2015 was $54.5 per barrel (see Table 22).
Table 22 compares the prices of Ghana sourced oil to those of West Texas Intermediate (WTI)
representing the United States and the London Brent representing Europe.
Table 22: Average Crude Oil prices in Ghana, United States (Gulf Coast), and Europe (the
North Sea) from 2010-2017
Year
Ghana WTI
Gulf Coast/
United States
Brent Crude
North Sea/
United Kingdom
U.S dollars per barrel
2010 80 79.4 70
2011 111 94.9 111
2012 113 93.3 112
2013 109 97.9 109
2014 99 93.3 99
2015 54.5 (60*) 48.7 52
2016 46.5 (55*) 43.3 43.7
2017 54.6 (63*) 49.7 52.4 *for power generation.
Source: Bank of Ghana, LondonGasPrice.com, tradingnrg.com; www.statistica.com
67
Average selling price of Sankofa oil was not available at the time of release of this report.
-
10,000
20,000
30,000
40,000
50,000
60,000
20
-May
-17
28
-May
-17
05
-Ju
n-1
7
13
-Ju
n-1
7
21
-Ju
n-1
7
29
-Ju
n-1
7
07
-Ju
l-1
7
17
-Ju
l-1
7
25
-Ju
l-1
7
09
-Au
g-1
7
17
-Au
g-1
7
25
-Au
g-1
7
06
-Se
p-1
7
14
-Se
p-1
7
22
-Se
p-1
7
30
-Se
p-1
7
08
-Oct
-17
16
-Oct
-17
24
-Oct
-17
04
-No
v-1
7
12
-No
v-1
7
20
-No
v-1
7
28
-No
v-1
7
06
-De
c-1
7
14
-De
c-1
7
22
-De
c-1
7
30
-De
c-1
7
Bar
rels
per
day
Sankofa Daily Production for 2017
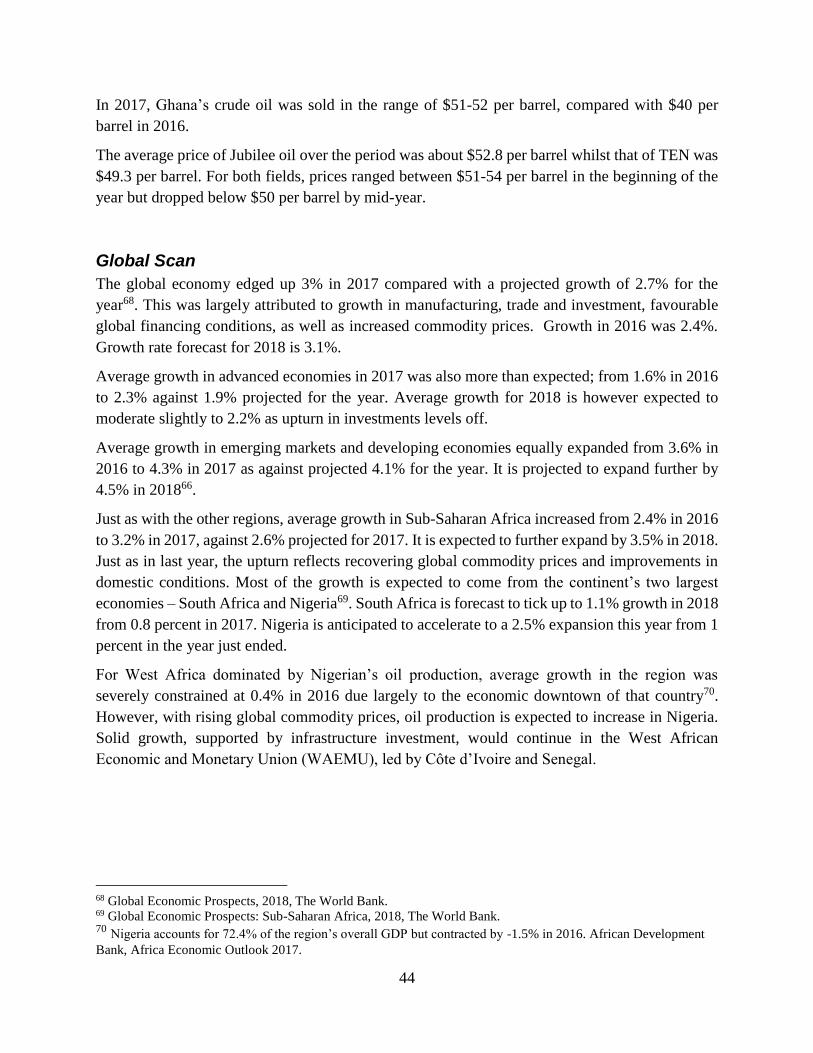
44
In 2017, Ghana’s crude oil was sold in the range of $51-52 per barrel, compared with $40 per
barrel in 2016.
The average price of Jubilee oil over the period was about $52.8 per barrel whilst that of TEN was
$49.3 per barrel. For both fields, prices ranged between $51-54 per barrel in the beginning of the
year but dropped below $50 per barrel by mid-year.
Global Scan
The global economy edged up 3% in 2017 compared with a projected growth of 2.7% for the
year68. This was largely attributed to growth in manufacturing, trade and investment, favourable
global financing conditions, as well as increased commodity prices. Growth in 2016 was 2.4%.
Growth rate forecast for 2018 is 3.1%.
Average growth in advanced economies in 2017 was also more than expected; from 1.6% in 2016
to 2.3% against 1.9% projected for the year. Average growth for 2018 is however expected to
moderate slightly to 2.2% as upturn in investments levels off.
Average growth in emerging markets and developing economies equally expanded from 3.6% in
2016 to 4.3% in 2017 as against projected 4.1% for the year. It is projected to expand further by
4.5% in 201866.
Just as with the other regions, average growth in Sub-Saharan Africa increased from 2.4% in 2016
to 3.2% in 2017, against 2.6% projected for 2017. It is expected to further expand by 3.5% in 2018.
Just as in last year, the upturn reflects recovering global commodity prices and improvements in
domestic conditions. Most of the growth is expected to come from the continent’s two largest
economies – South Africa and Nigeria69. South Africa is forecast to tick up to 1.1% growth in 2018
from 0.8 percent in 2017. Nigeria is anticipated to accelerate to a 2.5% expansion this year from 1
percent in the year just ended.
For West Africa dominated by Nigerian’s oil production, average growth in the region was
severely constrained at 0.4% in 2016 due largely to the economic downtown of that country70.
However, with rising global commodity prices, oil production is expected to increase in Nigeria.
Solid growth, supported by infrastructure investment, would continue in the West African
Economic and Monetary Union (WAEMU), led by Côte d’Ivoire and Senegal.
68 Global Economic Prospects, 2018, The World Bank. 69 Global Economic Prospects: Sub-Saharan Africa, 2018, The World Bank. 70 Nigeria accounts for 72.4% of the region’s overall GDP but contracted by -1.5% in 2016. African Development
Bank, Africa Economic Outlook 2017.
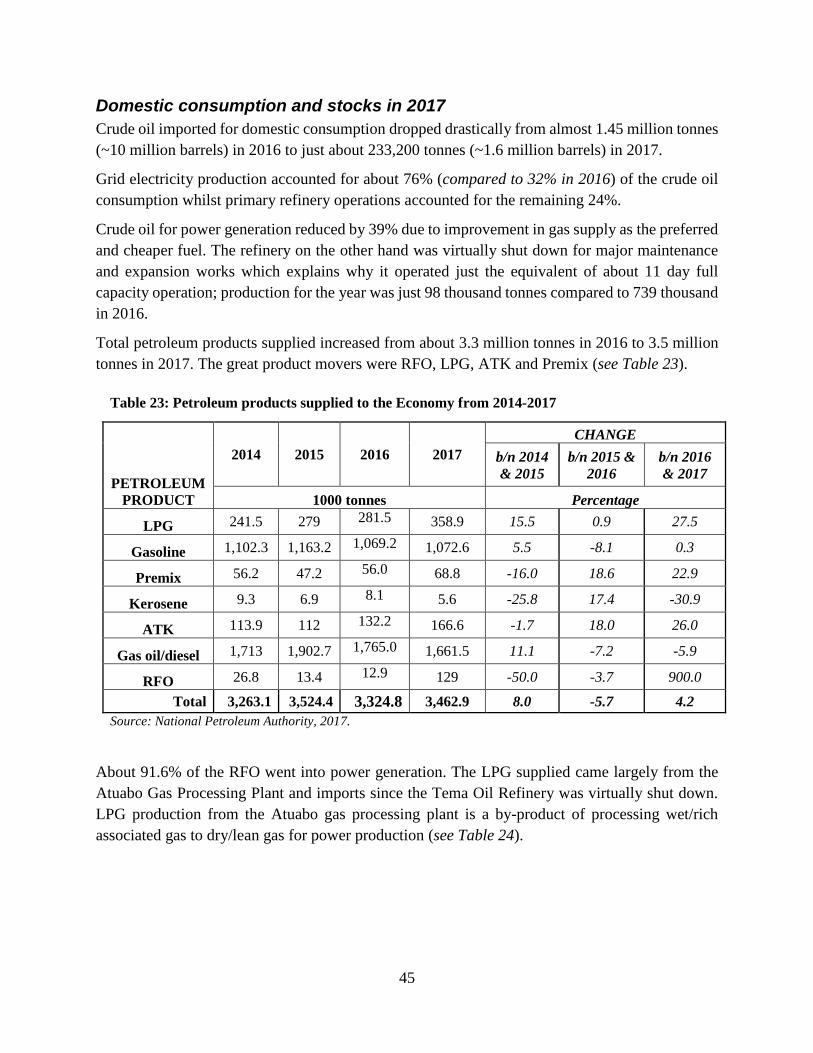
45
Domestic consumption and stocks in 2017
Crude oil imported for domestic consumption dropped drastically from almost 1.45 million tonnes
(~10 million barrels) in 2016 to just about 233,200 tonnes (~1.6 million barrels) in 2017.
Grid electricity production accounted for about 76% (compared to 32% in 2016) of the crude oil
consumption whilst primary refinery operations accounted for the remaining 24%.
Crude oil for power generation reduced by 39% due to improvement in gas supply as the preferred
and cheaper fuel. The refinery on the other hand was virtually shut down for major maintenance
and expansion works which explains why it operated just the equivalent of about 11 day full
capacity operation; production for the year was just 98 thousand tonnes compared to 739 thousand
in 2016.
Total petroleum products supplied increased from about 3.3 million tonnes in 2016 to 3.5 million
tonnes in 2017. The great product movers were RFO, LPG, ATK and Premix (see Table 23).
Table 23: Petroleum products supplied to the Economy from 2014-2017
PETROLEUM
PRODUCT
2014 2015 2016 2017
CHANGE
b/n 2014
& 2015
b/n 2015 &
2016
b/n 2016
& 2017
1000 tonnes Percentage
LPG 241.5 279 281.5 358.9 15.5 0.9 27.5
Gasoline 1,102.3 1,163.2 1,069.2 1,072.6 5.5 -8.1 0.3
Premix 56.2 47.2 56.0 68.8 -16.0 18.6 22.9
Kerosene 9.3 6.9 8.1 5.6 -25.8 17.4 -30.9
ATK 113.9 112 132.2 166.6 -1.7 18.0 26.0
Gas oil/diesel 1,713 1,902.7 1,765.0 1,661.5 11.1 -7.2 -5.9
RFO 26.8 13.4 12.9 129 -50.0 -3.7 900.0
Total 3,263.1 3,524.4 3,324.8 3,462.9 8.0 -5.7 4.2
Source: National Petroleum Authority, 2017.
About 91.6% of the RFO went into power generation. The LPG supplied came largely from the
Atuabo Gas Processing Plant and imports since the Tema Oil Refinery was virtually shut down.
LPG production from the Atuabo gas processing plant is a by-product of processing wet/rich
associated gas to dry/lean gas for power production (see Table 24).

46
Table 24: Petroleum Products produced Locally, Imported and Exported from 2014-2017
PETROL
PRODUCT
2014 2015 2016 2017
1000 tonnes Pro Imp Exp Pro Imp Exp Pro Imp Exp Pro Imp Exp
LPG 3.3 236.4 0 2.0 197.7 0 114.2 177.9 25.1 114 202.4 40.3
Gasolines 40.4 1,254 10.2 31.8 1182 9.9 244 1,235.7 271.6 6.5 1,304.1 184.4
Kerosene 4.5 0 0 0.2 0 0 24.5 0 0 2 0 0
ATK 9.4 112.4 105.6 18.2 109.1 101.9 37.6 112.7 115 0.1 181.4 150
Gas oil 27.8 1,742 10.8 28 2,161 10.3 254.7 2,161 170.1 6.1 1,780.9 190.2
RFO 43.7 48.6 0 8.9 0 0 64 20.6 69.8 1.3 248.8 53
Total 129.2 3,394 126.6 89.1 3,650 122.1 739 3,266.7 651.6 129.9 3,717.6 618.0
Pro refers to production at the TOR and Atuabo; Imp refers to imports while Exp refers to exports. NB:
Diesel export is largely sales to international bunkers. ATK export is sales to international aviation
bunkers. Gasoline export is largely heavy gasoline.
Source: Tema Oil Refinery and National Petroleum Authority.
2.2 2017 Forecast and Actuals
Average Brent crude price for refinery operations was $54.6 per barrel thus falling within the
forecast price for 2017. Average prices in other regions also fell within forecast for the year (see
Table 25)
Table 25: 2017 Average Crude Oil Prices in Ghana, United States and Europe 2017 - Forecast and
Actuals
Ghana WTI & NYMEX
Gulf Coast/
United States
Brent Crude
North Sea/
Europe
Brent LCOs* LCOs Brent
Forecast 53-58 (48-52) 60# 51 51-55
Actual 54.6 (53) 63# 50.79 54.15
* Other light crudes / U.S refiner
# power generation requirements Source: Bank of Ghana, U.S EIA Short Term Energy Outlook, 2017, 2018
Tema Oil Refinery (TOR) was virtually shut down throughout the year, except for few hours of
operation. This was to allow a new crude oil furnace to be installed at the plant in order to increase
the production capacity of the Crude Distillation Unit (CDU) from 45,000 barrels to 60,000 barrels

47
per stream day. The expansion works could not be completed in 2016 as originally scheduled but
finished in 2017. The capacity of the Residual Fluid Catalytic Cracker (RFCC) unit however
remains the same; 14,000 barrels per day71. The supply of all petroleum products with the
exception of LPG were below the 2017 projections and consequently, contributing to the low non-
oil economic growth of 4.9% for the year. The consumption however was equivalent to operating
a 75,000 barrels per stream day refinery which is still higher than the new capacity of TOR (see
Table 26).
Table 26: Forecast and Actual Petroleum Products Consumption in 2017
PRODUCT
Products Supplied to the Economy
Requirement
(Forecast)
Consumption
(Actual)
1000 Tonnes
For economic
growth
>4%
For economic
growth
≤6.3%
Economic growth
4.9% (non-oil)
8.5% (oil)
Total Gasolines 1,300 -1,400 1,700-1,800 1,073
Total Diesel 2,000 - 2,100 2,300-2,400 1,662
Kerosene 10-15 16-20 5.6
ATK 140-160 200 – 220 167
LPG 290 – 300 320 – 350 359
Total 3,740-3,975 4,516-4,790 3,267
Equivalent
refinery capacity 70-75 per day 85-90 per day 75 per day
ATK supply started increasing in 2016. ATK consumption had dropped consistently since 2012
until 2016 which was attributed to its relatively high cost in the country. It would be recalled that
ATK supply shortfall in the country in 2013 compelled a number of foreign airlines to make
alternative refuelling arrangements with neighbouring countries before landing or taking off in
Ghana.
The shortfall in kerosene consumption has largely been due to the shifts from its usage as fuel for
lighting and cooking to better options such as dry-cell powered and solar lanterns for lighting and
LPG for cooking.
LPG supply improved slightly and also above forecast for 2017. This was largely attributed to the
supplies from the Atuabo Gas Processing Plant which is producing LPG as by-product from
processing the wet associated gas from the Jubilee Field into dry gas largely for electricity
71 The RFCC processes the Residual Fuel Oil (RFO), which is a by-product of crude oil processed by the CDU, into
more products, namely diesel, gasoline, LPG, etc.

48
generation. Imports however still dominated; about 56% of the total stock largely because the
Tema Oil Refinery was shut down. Some LPG was exported (11%) for the second time since 2009,
but about 3% more than in 2016.
2.3 Forecast for 2018
The year 2017 saw dramatic changes in the global oil and gas market largely due to the crisis in
the Middle East, Venezuela and in Europe owing to the frozen conflict between the West and
Russia over the crisis in Ukraine and annexation of Crimea.
The Middle East is still ‘boiling’ with the Syrian crisis and the Arab-Israeli tension, the latter due
to the 70th anniversary celebration of the founding of the State of Israel this year. If 2016 was the
year of cutting costs, 2017 was finally the year of cutting stocks. Several notable events also
happened such that while not directly impacting oil prices, certainly had an impact on perceptions
of global risk and forecasts of future economic growth. For instance;
Prices stable after OPEC agrees to an output cut. Prices started 2017 trading in a stable
range after OPEC and non-OPEC allies reached an agreement in late-2016 to limit crude
oil production.
OPEC extends the oil output deal agreed to in 2016 through the end of December
2018. At its annual November 2017 meeting, OPEC surprised the global market by
extending the supply deal in place through the end of 2018 and placing additional caps on
Libyan and Nigerian production. This decision and evidence of compliance has since
supported prices at their increasing levels since 2017. However, it could be challenged by
other relatively poor members of the cartel since some would like to make up for the losses
in revenue generation in the previous years of lower prices. Thus the supply quota cuts
measure would largely hold but there is likely to be marginal increase in output by end of
the year.
Besides the geopolitics, the rising oil production costs, due to rising material costs, and the shift to
increasingly challenging operating areas, such as the deep- and ultra- deep-waters such as in the
Jubilee fields and Sankofa fields, have also emerged as factors in the increasing oil prices though
yet to reach the average levels encountered in 2011.
To curb the increasing oil prices, the US released some of its reserved stock unto the global market.
The OPEC countries led by Saudi Arabia and the Non-OPEC led by Russia countered the impact
by reducing production outputs. Saudi Arabia opines that the prices of oil at the current level are
still not attractive enough for further investment and that prices need to be above at least $90 per
barrel to spur investment. The country warns of a risk of global oil shortages and that supplies
could stall by 2020 if oil prices remain below $100s. This is being attributed to lack of investment

49
flows for the last two or three years to ramp up oil supply. Similar assertion has been made by the
International Energy Agency (IEA) in its market analysis and forecast report, Oil 2017. The IEA
further warned that the global investment slump of 2015 and 2016 already poses a risk to future
oil supplies and that 2017 global spending didn’t look encouraging72.
The main driver for oil price forecast this year therefore is still going to be a mix of geopolitics
and petroleum demand supply fundamentals, including the speculation factor due to trade in oil
futures. The challenge is determining the right balance.
Irrespective however of the geopolitical events, demand and supply fundamentals still serve as the
major drivers for crude oil price volatility. The increasing global economic growth expected this
year is likely to drive energy demand upwards and potentially result in oil price increases.
The U.S EIA forecasts average world crude oil prices to range between $65-71 per barrel in 2018
whilst IMF and the World Bank forecast an average of $63 and $65 per barrel respectively for the
year.
In any case high oil prices offer field operators an opportunity to produce more oil from
unconventional sources as well as from deeper and offshore depths. Besides, high crude oil prices
encourage relatively small fields such as in Ghana to boost production since their total impact on
the global market tend not to be significant.
Forecast for Ghana: Since oil supplies to Ghana largely come from Nigeria (an OPEC country)
and Equatorial Guinea (a non-OPEC country) all in West Africa, it is expected that average Brent
crude oil that Ghana buys would lie within the price range of $69-71 per barrel and $63-65 per
barrel for other light crudes for refinery operations (see Table 27). Average delivery price of light
crudes for power production would be within $73-75 per barrel.
Table 27: Forecast for Average Crude Oil Prices for Ghana, United States and Europe for 2018
FUEL BRAND Ghana
United States EIA
(WTI and NYMEX)
Europe73
(UK & Holland)
US dollars per barrel
Brent crude 69-71 70.68 68-70
Other light crudes/ U.S refiner 63-64 65.58 63-65
In 2017, Jubilee field oil was sold at an average price of $53 per barrel whilst that of TEN field
was sold at $49 in 2017.
72 https://oilprice.com/Energy/Energy-General/Are-We-Sleepwalking-Into-The-Next-Oil-Crisis.html 73 London and Rotterdam trading for Brent averaged $65-68 for 2018. www.tradingeconomics.com The IMF and
World Bank forecast average of $63 and 65 per barrel respectively for all crudes for 2018.

50
For 2018, we expect prices of oil from both fields to increase; the average price for Jubilee oil
falling within $68-70 per barrel and that of TEN field hitting $63-65 per barrel. The average price
of oil from Sankofa field is likely to be the same as the forecast for that of TEN field (see Table
28).
With favourable oil price forecast for 2018, Ghana’s total production is expected to increase from
the average of 175,000 barrels per day in 2017 to between 200,000 – 220,000 barrels per day.
Table 28: Forecast for Ghana’s Crude Oil Prices and Production for 2018
SOURCE OF OIL
Fuel Prices
US$ per barrel
Average Daily Production
1000 barrels
Actual in 2017 Forecast for
2018 Actual in 2017
Forecast for
2018
Jubilee field 53 68-70 91 95-105
TEN field 49 63-65 59 70-75
Sankofa field 48 63-65 25 35-40
Total 175 200-220
To meet the Government economic growth rate target of 6.8% (oil) or 5.4% (non-oil) growth for
2018, it would require about 3.6 million tonnes of products with gasoline and diesel having an
average share of 32% and 51% respectively due to the expected growth of the Industrial and
Agricultural sectors of the economy as the result of the One-District-One Factory, the One-Village-
One Dam and Planting for Food & Jobs policies of the government (see Table 29).
Table 29: Forecast for Petroleum Products requirements for 2018
PRODUCT
National supply requirement
1000 Tonnes
For economic growth target 6.8% (oil); 5.4% (non-oil)
Total Gasolines 1,182 -1,300
Total Diesel 1,832 - 2,000
Kerosene 4 - 6
ATK 184-200
LPG 396 – 400
Total 3,598-3,906
Equivalent refinery capacity 80-90 per day
51
The requirement for diesel (gas oil) includes demand by the mining and the petroleum upstream
industries. Diesel constituted about 51% of the total products demand in 2017. Reduction in the
electricity tariff during the first quarter of the year and the drop in the activities of illegal gold
miners are likely to reduce diesel demand. Gasoline demand however would increase but
marginally.
For LPG, at least half of the total LPG requirement is still expected to come from local production.
To achieve a 50% nationwide penetration of LPG, the consumption would require an LPG supply
of at least 450,000 tonnes by 2020 based on an estimated population of 31-32 million by the end
of the decade.
About 50% LPG supplies could come from the Atuabo Gas Processing Plant processing wet
associated gas from the Jubilee field. For instance, processing 100 mmscfd of the wet gas would
provide at least additional 500 tonnes of LPG a day, which would be enough to meet the country’s
projected short to medium term demand of 400,000-450,000 tonnes per annum by 2020. Ability
to meeting this supply requirement would translate into achieving the country’s target of 50%
penetration by 2020.
However, Atuabo LPG is a natural gas refining product and thus have different characteristics
from that of TOR since the latter is a crude oil refining product. For instance, the propane level in
the Atuabo LPG is said to range from 50-70% whilst butane constitutes the remaining depending
on the blend of the consignment.
LPG from TOR is processed to constitute a mixture of about 20% propane and 80% butane and
this ratio has also been used to regulate the import market.
Besides, natural gas by its nature is odourless and so its LPG is relatively of less odour compared
to that from crude oil processing.
Atuabo LPG is therefore supposed to be odourised and treated to reduce to propane content to
around 20% but such entails additional cost for the supplier.
Nonetheless, higher penetration of the Atuabo LPG would require more attention in terms of safety
and standardization and also more public education to avoid potential fire hazards in homes.
As a result of frequent gas explosions that occurred last year and which were likely due to the said
challenges with the Atuabo LPG, the government has come up with a new policy, in fact, a re-
introduction of the cylinder re-circulation policy which was put in place during the national
promotion of LPG use in the home during the early 1990s but later scrapped. To this end, all gas
cylinders is supposed to be filled at designated bottling plants for onward distribution to retail
outlets.
Government is also re-capitalising the Ghana Cylinder Manufacturing Company (GCMC) to
expand its production capacity. GCMC has recently taken delivery of new equipment which is
expected to boost its current daily production of 1,500 to almost 4,000 cylinders.

52
3.0 Petroleum Subsector: Natural Gas
3.1 Overview of Natural Gas Supply in 2017
Total gas flow to consuming facilities in Ghana in 2017 was 45,461,817 mmBTU (~45,462
mmscf), about 65% more than in 201674. About 26% (15% in 2016) was from Nigeria via the
WAGP and the remaining 74% (75% in 2015) coming from the Atuabo gas processing plant.
Almost 25% (26% in 2016) of the gas was supplied to the thermal plants in the Tema power
enclave and 62 % (74% in 2016) largely indigenous gas (i.e. the Jubilee and the TEN fields) went
to the Takoradi power enclave. The remaining 13% went for non-power activities.
Jubilee field
Total associated gas from the Jubilee field operations in 2017 was almost 42,000 mmscf compared
to 29,273 mmscf in 2016. Average daily gas production was however higher in 2016 (126 mmscfd)
than in 2017 (122 mmscfd) even though production was throughout the year in 2017 compared to
about 10 calendar months in 2016. This was because the average daily oil production was higher
for the latter. Average daily production in both years however were within expected yield levels
from the field (see Figure 15).
Figure 15. Comparison of Jubilee field daily gas yield; 2016 and 2017
74 Total gas flow in 2016 was 27,475,590 mmBTU (27,475 mmscf).
0
20
40
60
80
100
120
140
160
180
mm
scfd
Associated Gas Produced (MMSCF), 2017 Expected Daily Production, 2017
Associated Gas Produced (MMSCF), 2016
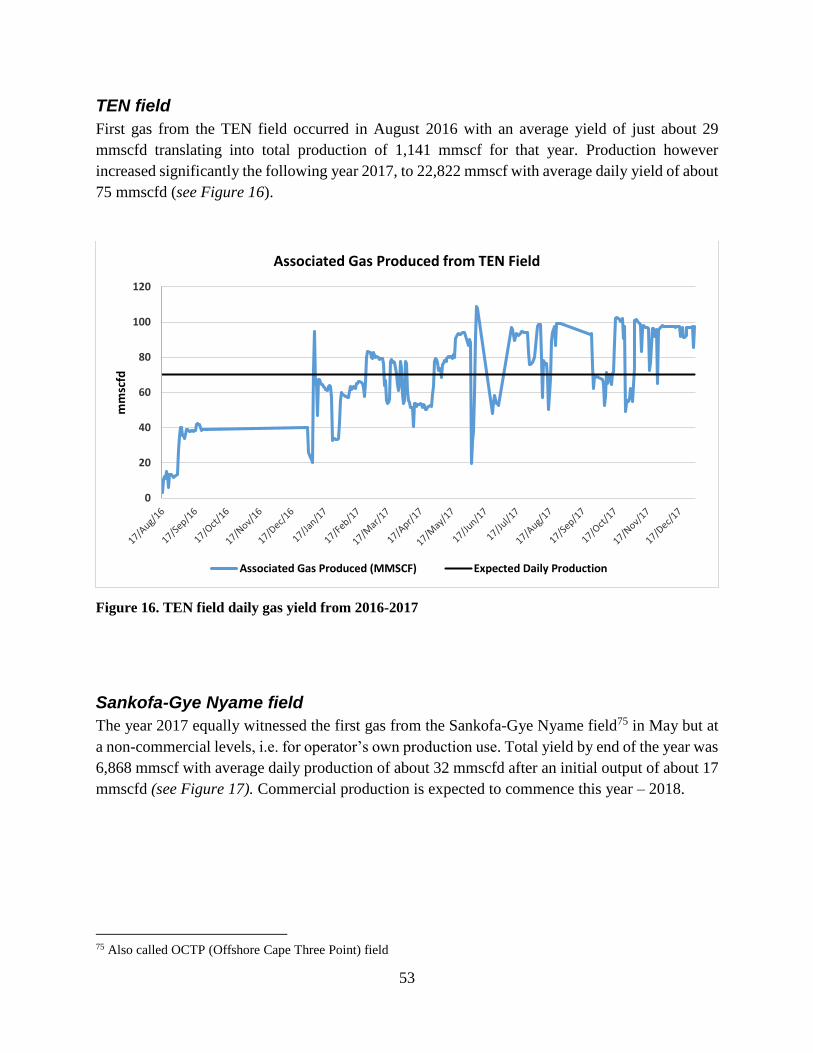
53
TEN field
First gas from the TEN field occurred in August 2016 with an average yield of just about 29
mmscfd translating into total production of 1,141 mmscf for that year. Production however
increased significantly the following year 2017, to 22,822 mmscf with average daily yield of about
75 mmscfd (see Figure 16).
Figure 16. TEN field daily gas yield from 2016-2017
Sankofa-Gye Nyame field
The year 2017 equally witnessed the first gas from the Sankofa-Gye Nyame field75 in May but at
a non-commercial levels, i.e. for operator’s own production use. Total yield by end of the year was
6,868 mmscf with average daily production of about 32 mmscfd after an initial output of about 17
mmscfd (see Figure 17). Commercial production is expected to commence this year – 2018.
75 Also called OCTP (Offshore Cape Three Point) field
0
20
40
60
80
100
120
mm
scfd
Associated Gas Produced from TEN Field
Associated Gas Produced (MMSCF) Expected Daily Production

54
Figure 17: Sankofa-Gye Nyame field daily gas yield in 2017
3.2 2017 Forecast and Actuals
Average gas flow from the WAGP was 30 mmscfd as projected for the year.
Average gas flow from the Jubilee field was 81 mmscfd compared to the projected 80-100 mmscfd
for the year, whilst that of TEN field, 75 mmscfd exceeded expected yield of 70 mmscfd from that
field.
The WAGP delivery gas price averaged $8.6/mmBTU ($8.92/mscf). Jubilee and TEN fields
delivered gas prices were $4.23/mmBTU ($4.39/mscf) and $6.16/mmBTU ($6.33/mscf)
respectively.
Comparatively, average spot (Henry Hub) price in the United States in 2017 was $2.99/mmBTU
($3.1/mscf)76. Average natural gas import price in the European Union (EU) increased from
$4.56/mmBTU ($4.73/mscf) in 2016 to $5.65/mmBTU ($5.97/mscf) in 201777.
76 Spot prices usually do not include transportation cost. 77 https://ycharts.com/indicators/europe_natural_gas_price
0
10
20
30
40
50
60
70
20
-May
-17
27
-May
-17
3-J
un
-17
10
-Ju
n-1
7
17
-Ju
n-1
7
24
-Ju
n-1
7
1-J
ul-
17
8-J
ul-
17
15
-Ju
l-1
7
23
-Ju
l-1
7
30
-Ju
l-1
7
13
-Au
g-1
7
20
-Au
g-1
7
27
-Au
g-1
7
7-S
ep
-17
14
-Se
p-1
7
21
-Se
p-1
7
28
-Se
p-1
7
5-O
ct-1
7
12
-Oct
-17
19
-Oct
-17
29
-Oct
-17
5-N
ov-
17
12
-No
v-1
7
19
-No
v-1
7
26
-No
v-1
7
3-D
ec-
17
10
-De
c-1
7
17
-De
c-1
7
24
-De
c-1
7
31
-De
c-1
7
mm
scfd
Associated Gas Produced from Sankofa Field
Associated Gas Produced (MMSCF)

55
3.3 Forecast for 2018 and beyond
Unlike the previous years, PURC, the regulator for natural gas prices in the country has released
for the first time a regulated gas tariff which is a weighted average of all the natural gas sources
including planned LNG projects for the country (see Table 30). For 2018, the gas tariff is pegged
at $7.29/mmBTU which is about 4 % and 15.6% lower than the prices that Ghana Gas and WAGP
would have charged respectively for their supplies.
Table 30: Summary of Adjusted Weighted Average Cost of Gas and Tariffs – 2018
On the global scene, the average US spot price for gas is projected to increase slightly from the
$2.99/mmBTU ($3.1/mscf) in 2017 to about $3.01/mmBTU ($3.12/mscf) in 2018.78 . For the EU,
the gas import price would inch up slightly from the $5.65/mmBTU ($5.86/mcf) in 2017 to
$5.7/mmBTU ($5.91/mscf) in 2018 (see Table 31).
78 US EIA Short Term Energy Outlook, March, 2018.
COST TYPE
SOURCE OF GAS SUPPLY US$/mmBTU
AW
AC
OG
*
Ju
bil
ee
TE
N
HE
SS
San
kofa
1
San
kofa
2
LN
G
Tak
ora
di
LN
Tem
a 1
LN
G T
ema 2
WA
PC
o
Commodity Charge 0.50 2.35 2.90 6.78 6.78 5.80 5.85 6.36 2.59
Gathering Charge /
ELPS Charge 1.04 1.12 1.12 1.27
Processing Charge 1.12 1.12 1.12
Transmission Service
Charge:
Transportation to
Takoradi 1.12 1.12 1.12 1.12 1.12
Transportation to
Tema 0 0 0 0 0 4.55
Regulatory Levy 0.40 0.40 0.40 0.40 0.40
Shipping & Aggregation 0.05 0.05 0.05 0.05 0.05 0.05 0.05 0.05
Regasification fee 1.40 1.60 1.38
Total Delivered Gas Price 4.23 6.16 6.71 8.35 8.35 7.25 7.50 7.79 8.41 7.29
*Adjusted Weighted Average Cost of gas
Source: PURC, 2018
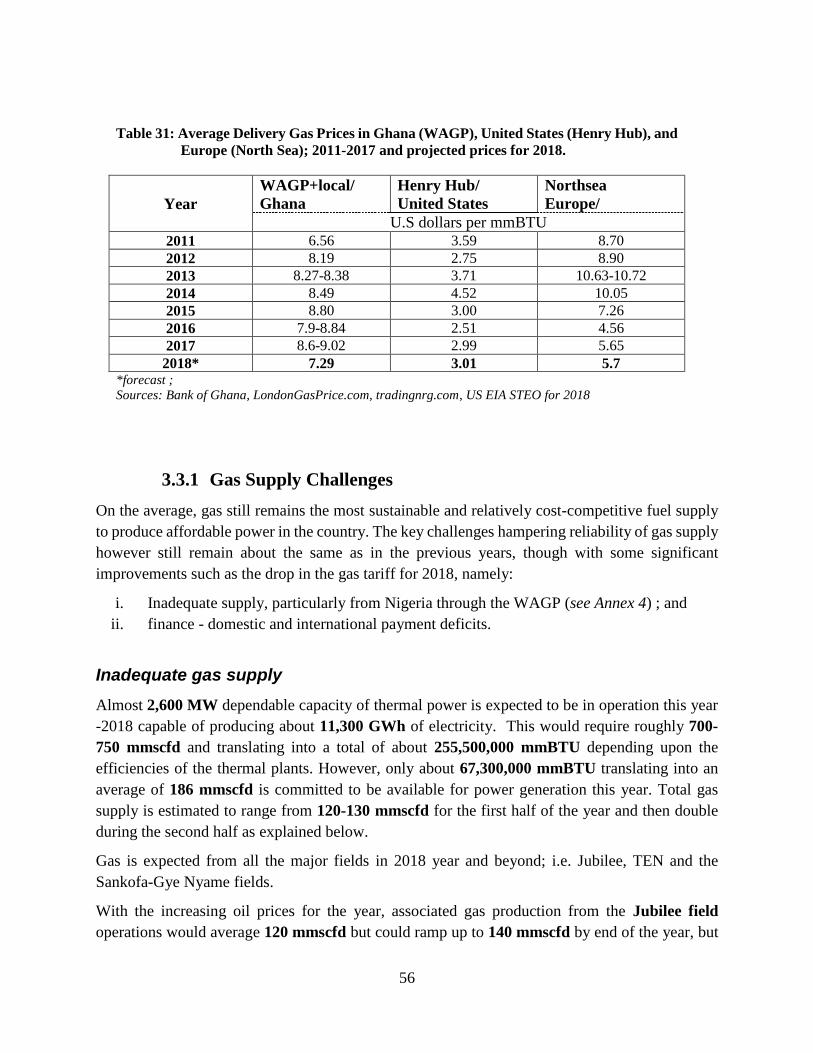
56
Table 31: Average Delivery Gas Prices in Ghana (WAGP), United States (Henry Hub), and
Europe (North Sea); 2011-2017 and projected prices for 2018.
Year
WAGP+local/
Ghana
Henry Hub/
United States
Northsea
Europe/
U.S dollars per mmBTU
2011 6.56 3.59 8.70
2012 8.19 2.75 8.90
2013 8.27-8.38 3.71 10.63-10.72
2014 8.49 4.52 10.05
2015 8.80 3.00 7.26
2016 7.9-8.84 2.51 4.56
2017 8.6-9.02 2.99 5.65
2018* 7.29 3.01 5.7 *forecast ;
Sources: Bank of Ghana, LondonGasPrice.com, tradingnrg.com, US EIA STEO for 2018
3.3.1 Gas Supply Challenges
On the average, gas still remains the most sustainable and relatively cost-competitive fuel supply
to produce affordable power in the country. The key challenges hampering reliability of gas supply
however still remain about the same as in the previous years, though with some significant
improvements such as the drop in the gas tariff for 2018, namely:
i. Inadequate supply, particularly from Nigeria through the WAGP (see Annex 4) ; and
ii. finance - domestic and international payment deficits.
Inadequate gas supply
Almost 2,600 MW dependable capacity of thermal power is expected to be in operation this year
-2018 capable of producing about 11,300 GWh of electricity. This would require roughly 700-
750 mmscfd and translating into a total of about 255,500,000 mmBTU depending upon the
efficiencies of the thermal plants. However, only about 67,300,000 mmBTU translating into an
average of 186 mmscfd is committed to be available for power generation this year. Total gas
supply is estimated to range from 120-130 mmscfd for the first half of the year and then double
during the second half as explained below.
Gas is expected from all the major fields in 2018 year and beyond; i.e. Jubilee, TEN and the
Sankofa-Gye Nyame fields.
With the increasing oil prices for the year, associated gas production from the Jubilee field
operations would average 120 mmscfd but could ramp up to 140 mmscfd by end of the year, but

57
for some months of shut-down to allow the OCTP and the WAGP reverse flow tie-in connections.
The TEN field is expected to produce an average gas supply in the range of 75-80 mmscfd for the
year whilst gas supply from Sankofa fields, the most significant proven non-associated gas
discovery79, is expected to ramp up from the average of about 32mmscfd in 2017 to about 100
mmscfd in 2018.
Maximum gas supply for the year thus could reach 300 mmscfd if all goes well as planned
considering the favourable and increasing global oil prices. However, there are also some technical
challenges to overcome, minor though, yet could limit the flow from the indigenous fields in the
West to Tema. For instance the maximum capacity of the Takoradi Regulatory & Metering (R&M)
station is 120 mmscfd and that of Tema is 140 mmscfd. These R&M stations need to be expanded
to receive the additional gas.
The gas supply deficit would fall within 400-550 mmscfd during the year. Thus, reinforcing the
fact that the indigenous gas would still not be adequate to meet the gas requirements for the
medium-to-long term requirements of the country. Ghana has therefore considered supplementing
the gas supply with LNG imports (see Annex 5).
The estimated deficit of about 400-550 mmscfd is within the breakeven point for a typical 200-
250 mmscfd LNG re-gasification facility.
Meanwhile, there has been some new developments in the gas industry value-chain so far.
Recalling that in 2014, GNPC80 was appointed by the government as the National Gas Aggregator
and was also mandated to takeover Ghana National Gas Company (GNGC) popularly referred to
as Ghana Gas.
As the national gas aggregator, GNPC, also the national oil company (NOC) is mandated to buy
all natural gas produced in Ghana and to market it as well. GNPC is made responsible for sourcing
natural gas such as LNG from international suppliers to supplement indigenous gas production.
The role also mandates GNPC to make specific investments in gas infrastructure to create a viable
domestic gas market.
79 Sankofa field has estimated proven 1 trillion cubic feet of natural gas. 80 GNPC is Ghana National Petroleum Corporation.
58
Progress of Planned LNG projects
Two major LNG projects are expected in the country by 2020. They are;
the Tema LNG Terminal Company, and
a small-scale virtual LNG project.
The Tema LNG Terminal Company project is a Floating Storage + Regasification Unit with
expected capacity of 250 mmscfd (1.7 mmtpa81) expected to be completed in 2020. Initial
contracted supply amount is about 180 mmscfd. The company has secured a provisional licence
and is in the process of acquiring a Siting Permit from the regulator82. GNPC has signed a 12-year
agreement with Rosneft of Russia for the supply of the LNG.
GNPC earlier in 2017 signed an agreement with a private company, Quantum Power for the latter
to construct and operate a 500 mmscfd83 floating LNG storage, regasification and delivery facility
moored offshore Tema. The US$550 million facility which was supposed to be operational this
year apparently fell through and has been replaced with the Rosneft facility.
The small-scale virtual LNG is a virtual pipeline project being built by a consortium of small
entities along the gas value-chain to supply gas to Sunon-Asogli and Trojan power plants. It is an
apparent a stop-gap short-to-medium term measure to meet the fuel requirements of the said power
plants. It would comprise seventeen ‘52-cubic-metre’ LNG trucks ferrying LNG from small-scale
LNG ships berthed at the Tema port; eight (8) trucks at the loading gantry at a time and additional
eight (8) trucks moving every night to deliver the fuel to the 560 MW gas-fired Sunon-Asogli
Power Plant thermal plants. Loading is estimated to take an average of an hour. Each LNG truck
would take an average of 45 minutes to reach the Sunon-Asogli Power Plant where instant
regasification is expected, taking advantage of the relatively high ambient temperatures. Initial
contract quantity is said to be 60 mmscfd. Negotiations on the delivery gas price is said to be
nearing conclusion stages since the project is expected to commence by end of the year.
Unlike the GNPC-Rosneft/Gazprom agreement, the source of LNG for the small-scale project is
the LNG2Africa initiative; an Equatorial Guinea84 initiative to sell small-scale LNG for
utilisation in Africa. Initial target countries are Togo, Burkina Faso and Ghana.
81 million tonnes per annum 82 The natural gas transport and use regulator is the Energy Commission. 83 3.4 million tonnes of LPG per year. 84 Equatorial Guinea has been an LNG producer since 2007 with production of 24,000-25,000 cu m per day
(151,000 bpd LNG). Proven reserve estimated in 2010 was 4.5 Tcf. Target countries are Togo LNG project (MoU,
April) 2018; Burkina Faso LNG project (MoU,2017); and Ghana LNG project (15-yr MoU) 150 mmscfd
equivalent.

59
Finance – domestic and international payment deficits
The Power or the Electricity subsector of the Energy Sector is still bedevilled with financial
challenges.
Arrears and debt situation along the power supply value chain was over $2 billion by the middle
of 2017. Most of the debt were due to short term loan contracted by the power producers and the
distribution utilities’ inability to collect adequate revenue to cover their operations. Persistent
untimely and insufficient payments for gas delivered also contributes to the huge debt burdens of
the gas off-takers most of them public entities. For instance, untimely and inadequate payments
still contribute to the reasons for the inadequate gas supply from Nigeria through the WAGP. On
the domestic side, VRA still owes Ghana Gas Company for gas supplied from Atuabo, and the
latter in turn also owes GNPC for the wet gas supplied. On the distribution or retail end, the
Electricity Company of Ghana (ECG) is still owing the electricity supply utilities.
In order to address the chronic debt challenges and to facilitate equitable distribution of all cash
collected in the power sector value chain using the end user tariff as a basis, the Cash Waterfall
Mechanism (CWM) concept was instituted in 2016. It was to be implemented through the
development of a formula, for adequate distribution of revenue to all stakeholders in the power
sector value chain. However, over a year on, the CWM has still not been operational.
Nonetheless, in April 2017, the Government issued a 15-year bond seeking to raise 6 billion cedis
to settle all outstanding debts in the energy sector. The 15-year bond was issued under two separate
bonds; a 7-year bond and a 10-year bond. Both bonds however accrued a total of 4.69 billion cedis
(~$1.1 billion) after the auction was closed; falling short by about 1.3 billion cedis. The 7-year
bond received the targeted 2.4 billion cedis but the 10-year bond accrued about 2.29 billion cedis,
below its targeted 3.6 billion cedis.
Even though, unable to reach the expected target, the government is said to have used part to clear
a significant portion of the sector debt.

60
4.0 Woodfuel Subsector: Charcoal demand and prices
In 2017, the average prices of charcoal in the country followed the historical increasing trend; for
the mini bag it rose to a little over GH¢25 from about GH¢22 per bag in 2016 whilst for the maxi
bag, it increased from about GH¢35 in 2016 to around GH¢38 (See Annex 5).
The 2017 increases however were just about 8% for the maxi-bag but over 20% for the mini-bag
compared to a little over 16% and about 5% for the maxi-bag and the mini-bag respectively in
2016 (see Table 32).
Table 32: Average Price per bag of Charcoal in the Ten Regions for 2016 and 201785.
Region
Mean Price per Mini bag in
Ghana Cedi (GH¢)
Mean Price per Maxi bag in
Ghana Cedi (GH¢)
Percentage
change in mean
prices
2015/2016*
2016 2017 %
change 2016 2017
%
change Mini Maxi
Ashanti 16.66 19.37 16.27 26.23 28.59 9.00 10.2 14.5
Brong Ahafo 12.15 16.80 38.27 22.48 26.77 19.08 0.0 10.9
Central 25.30 32.25 27.47 41.44 47.33 17.04 -18.4 3.6
Eastern 21.51 25.52 18.64 30.55 36.83 20.56 0.0 0.0
Gt. Accra 26.99 31.17 15.49 38.68 42.50 9.88 1.4 4.3
Volta 27.17 35.34 30.07 38.16 50.0 13.22 -3.9. -10.8
Western 22.75 27.17 19.43 36.67 43.13 17.62 4.9 11.3
Northern 11 19.46 76.91 28.97 32.33 11.60 -30.3 14.4
Upper East 30.83 24.67 -19.98 53.74 38.49 -28.38 34.0 56.0
Upper West 23.85 19.59 -17.86 37.00 32.84 -11.24 54.2 60.9
National 21.82 25.13 20.47 35.39 37.88 7.84 5.2 16.5
*revised with latest data available
Except for Greater Accra, the average percentage increments were far above the 5-10% projected
for 2017. Even though, this has been attributed to high inflation in 2016 and 2017, relatively high
85 The price survey was conducted in the district capitals and computed as average for each region.

61
prices of LPG, the alternative but cleaner fuel, could play a significant role in the charcoal price
inflation.
Average increases in LPG prices on the other hand were 31% and 26% respectively from 2015 to
2016 and 2016 to 2017.
Greater Accra and Ashanti regions experienced the lowest price changes.
As usual, the high-price zones were along the coast. Northern region experienced the highest price
change for the minibag, whilst Upper East and West regions experienced negative price changes.
Official reasons are yet to be known. The low-price areas were also the transitional regions of
Brong Ahafo, Northern and Upper West regions followed by the forest regions of Ashanti, Eastern
and Western.
For 2018, we estimate that the average charcoal price increment will drop to within 12-15% for
both the mini and the maxi bags in the coastal areas of Central, Western and Volta Regions due to
the drop in national inflation86.
Greater Accra would maintain a moderate increase of 10-15% in 2018. Nationwide, we estimate
an average price to range from 15-20% for the year due the increasing LPG prices which is an
alternative or substitute fuel for charcoal in urban areas.
86 The national economic inflation in 2015 and 2016 averaged about 17% but dropped to 12.37% in 2017.

62
5.0 The Regulatory Regime
5.1 The Electricity Supply Industry
5.1.1 Licensing and Permitting
The Energy Commission in 2006 established a licensing framework for issuing licences to
electricity service providers. The Licensing Manual for service providers in the Electricity Supply
Industry was revised and published in 2012, setting the requirements and guidelines for entities
desiring to acquire licences to operate in the electricity supply industry.
Under the Licensing framework, provisional and full licences have been issued to entities engaged
in the various segments of electricity supply. Besides adding generating capacity to the existing
capacity and enhancing service delivery to customers, the licensing regime enhances the
Commission’s authority to hold the licensees to the terms and conditions stipulated in the licence.
Licences and permits issued by the Commission so far are as follows:
i. Number of power generation companies with Operation Licences stands at 13 just as at the
end of 2016 but the total capacity had expanded from 2,261.5 MW in 2016 to 2,680 MW
as at the end of 2017.
ii. Electricity Embedded Generation licence issued to Genser Power Limited87, stood at two
just as in 2016; 30 MW at Chirano and a 23 MW plant at Damang all in the Western Region.
The 5 MW at Tema however has been decommissioned and the license withdrawn.
iii. Construction permits have been issued to the following four power companies with
installed capacity totalling 1,303 MW:
a. Rotan Power Limited 660 MW Combined Cycle at Aboadze in the Western Region has
renewed their construction permit. It was first issued in 2016.
b. 80 MW Simple Cycle Marinus Energy Power Plant at Anochie near Atuabo in the Western
Region also renewed their construction permit.
Construction works on the 360 MW combined cycle plant by Cenpower Company Limited has
been completed. Commissioning process is still on-going and expected to be completed by mid-
2018.
Fourteen (14) Power Generation Companies have been issued with Siting Permits with total
generation capacity of 6,033 MW, from 4,555 MW in 2016.
Sage Power Limited was issued with Electricity Brokerage License as well as Electricity Export
Licence.
Sunon-Asogli has been issued with an export licence to export excess power.
87 an IPP to distribute electricity to specific consumers in the distribution network,

63
Enclave Power Company was issued with distribution and sale licence to distribute and sell
electricity to customers in Dawa Power Enclave (under-construction) besides its existing
operations at Tema.
Bulk Customers of electricity operating in the deregulated Wholesale Electricity Market increased
from 33 in early 2015 to 43 as at third quarter of 2017.
5.1.2 Codes of Practices and Regulations
The Commission developed and launched the National Electricity Grid Code in 2012 to govern
the operation of the National Interconnected Transmission System (NITS). The Grid Code
specifies in detail the technical operational rules, codes and procedures as well as obligations and
liabilities of all players in the market. Complementary to the National Electricity Grid Code, the
Energy Commission Board approved the National Electricity Distribution Code that sets in detail,
the minimum acceptable technical standards for the development of the electricity distribution
networks, provides guidelines and technical requirements for interconnection and evacuation of
embedded generation and other relevant issues related to the safe and reliable management and
operation of the Electricity Distribution Network in accordance with LI 1816 and LI 1935.
Both the Grid Code and the National Electricity Distribution Code are currently being updated
to cover Renewable energy and embedded generation.
The Commission has developed the Electrical Wiring Regulation 2011, L.I. 2008 to regulate
electrical wiring in the country.
Pursuant to the above, a certification guideline has been developed. Furthermore, a curriculum for
the certification examination was developed in conjunction with the Technical/Vocational
Education Directorate of the Ghana Education Service in 2013.
In 2014, The Energy Commission in collaboration with the Technical Examinations Unit, of the
Ghana Education Service conducted the first certification examination for potential and practicing
electrician for certification as Certified Electrical Wiring Professionals (CEWPs).
So far, nine (9) examinations have been conducted.
Full implementation of the wiring law came into effect in October, 2017. Under the full
implementation, non-certified persons would not be allowed to practice. Also, CEWP persons are
expected to invite certified inspectors to inspect their wiring jobs when complete. The certification
is being expanded to cover solar infrastructural installations and technicians.
In addition, EWR, 2011 LI 2008 mandates the Energy Commission to a register of electrical
contractors expected to roll out by end of the year. Also, the LI requires all buildings 10 years and
older to be inspected to ascertain the integrity of its wiring installations. The Energy Commission
is commencing the exercise this year beginning with commercial buildings.

64
As at third quarter of 2017, about 5,000 electricians had been certified as CEWPs and 84 as
Certified Electrical Wiring Inspectors. The examinations are conducted twice in a year at 4 centres
(Accra, Takoradi, Kumasi and Tamale).
The Commission continues to carry out public sensitization activities to create awareness in the
general public on the provisions of the Regulations. In addition, the Commission has conducted
training programmes in all the regional capitals for the CEWPs.
As part of its implementation, monitoring exercises are being carried out. CEWPs who are
suspected to have violated provisions in the wiring regulations are first giving hearing by a
Disciplinary Committee and those found culpable are penalized.
5.1.3 Establishment of Wholesale Electricity Market
The Electricity Regulation 2008 (LI 1937) provides for the establishment of a competitive
wholesale electricity market to facilitate wholesale electricity trading and the provision of ancillary
services in the National Interconnected Transmission System (NITS). The Wholesale Electricity
Market (WEM) in Ghana, the Electricity Transmission Utility (ETU) shall ensure the procurement
and dispatch of electricity from any facility of a wholesale supplier to a bulk customer and
distribution utility in a fair, transparent and non-discriminatory manner.
The Wholesale Electricity Market would allow for choice and competition in the wholesale supply
of electricity and subsequently create an enabling environment to attract Independent Power
Producers (IPPs) into the country.
Further incentive for private sector investment in the Wholesale Supply of electricity is Ghana’s
interconnection with some neighbouring West African countries, through which the market for
electricity in those countries will be opened up to the IPP’s in Ghana.
Such a market, in principle, requires to be guided by rules and regulations (backed by legislation)
that should essentially reflect the government’s broad policy objectives regarding the structure and
administrative management and operation of the market.
The Market Oversight Panel (MOP) was thus set up in 2015 and members of the panel had been
nominated by the appropriate institutions and had since been approved by the Ministry. The MOP
was inaugurated in 2017, MOP has been publishing a monthly bulletin which is available on the
Commission’s website88.
88 http://www.energycom.gov.gh/index.php/planning/ghana-wholesale-electricity-market-watch-monthly-bulletin
65
5.2 The Natural Gas Supply Industry
Natural gas supply from Nigeria through the West African Gas Pipeline (WAGP) has not
improved, it is proven to be very limited and unreliable primarily due to the country’s indebtedness
to WAGP as well N-Gas89 supply limitations (see Annex 4). Gas from the indigenous fields are
therefore mitigating the supply situation.
5.2.1 Licensing and Permitting
A Licensing Manual for Natural Gas Supply Industry was developed by the Energy Commission
in 2008 to serve as a guide for prospective natural gas service providers with regard to licensing
requirements as well as assisting in ensuring compliance with codes and standards governing
quality, health and safety in the industry as stipulated in the Energy Commission Act, 1997 (Act
541). The manual was reviewed in 2012 to facilitate the accelerated development of the natural
gas industry. BOST is the Natural Gas Transmission Utility Licence to operate the Natural Gas
Interconnected Transmission System (NGITS).
The Energy Commission has thus further issued the following licences to players in the Natural
Gas industry.
i. ENI is expected to renew its Construction Permit from the Energy Commission during the
third quarter of the year to complete the construction of the Onshore Receiving Facility
(ORF) at Sanzule, Western Region.
ii. Three (3) Natural Gas Bulk customer Permits were issued in 2016 for downstream
offtakers.
iii. As at end of the first quarter, only four (4) companies hold Provisional LNG facility
licences. The rest have all expired and have not yet been renewed.
iv. The Commission renewed a Natural Gas Wholesale Supply licence to Volta River
Authority (VRA) for the importation of gas through the WAGP.
v. Continental Fuels Limited also holds a Provisional Natural Gas Wholesale Supply Licence.
5.2.2 Codes of Practices and Regulations
Since the natural gas industry is still new in Ghana and like any other energy industry, it is
important that developers satisfy some basic requirements and comply with established regulation
before the construction of facilities takes place. It is in this respect that the Energy Commission
has developed the following Legislative Instruments (L.I.) with adopted Ghanaian Standards and
which have been approved by Parliament:.
i. Natural Gas Pipeline Safety (Construction, Operation and Maintenance) Regulation (L.I. 2189)
ii. Natural Gas Distribution And Sale( Technical And Operational) Rules, 2007(LI 1911)
iii. Natural Gas Distribution And Sale (Standard of Performance) Regulations, 2007(LI 1912)
89 owners of the commodity

66
iv. Natural Gas Transmission Utility( Technical And Operational) Rules, 2007(LI 1913)
v. Natural Gas Transmission Utility (Standards of Performance) Regulations, 2008(LI 1936)
A Natural Gas Transmission Access Code to establish conditions for Natural Gas Service
Providers to have fair, transparent and safe access to the Natural Gas Transmission Network in
Ghana, Access Code has also been developed in accordance with Sections 24, 27 and 28 of the
Energy Commission Act, 1997 (Act 541). The Commission however has still not finalise the
Occupational Health and Safety Regulation with adopted Ghanaian Standards.
5.3 Renewable Energy Update
As at end of first quarter of 2018, 113 Provisional Wholesale Electricity Supply Licences had been
issued to potential Independent Power Producers (IPPs) proposing to develop a total of about 6,698
MW of electricity from various renewable energy sources. 75 of the licences issued are for solar
photovoltaic (PV) generation with a total capacity of about 4,243 MW.
About 35 licensees have moved to the Siting Permit stage of the licensing process of which about
29 are for solar PV. However, only eight companies have been issued with Construction Permits
to develop a solar PV project. A Construction Permit has also been issued for a 225 MW wind
project.
In February 2016, the government through the Energy Commission began the implementation of
a Rooftop Solar PV Programme in the country, where solar PV panels up to a maximum of 500
peak Watts (Wp) were given to prospective residential applicants after the prospective beneficiary
had satisfied the following conditions:
i. Changed all lamps in his/her facility to LED lamps; and
ii. Purchased and installed the requisite Balance of System (BoS) components such as
inverter, batteries, charge controllers, change over, etc. from a licensed solar vendor90,
whose products meet the minimum Technical Standards set by Ghana Standards Authority
(GSA).
The primary objective of the programme was to provide 200 MW peak load relief on the national
grid through solar PV technology in the medium term at the time the country was undergoing a
nationwide load shedding.
The first phase of the National Rooftop Solar Photovoltaic (PV) Programme, which was targeted
at residential facilities (homes) in urban areas, recorded a total number of 1,006 (out 2,823)
approved applicants for the installation.
90Solar vendor licensed by the Energy Commission

67
In an effort to contribute to the national goal of universal access by 2020 and promote socio-
economic development through Productive Use of Energy (PUE), the second phase of the National
Rooftop Solar Programme which focuses on providing electricity to rural households in off-grid
communities which might not have access to electricity by 2020 and beyond was piloted in 2017.
Solar PV systems of 500Wp capacity each were piloted in 200 rural households in 16 off-grid
communities in the Abetifi and Mpraeso constituencies of the Eastern Region.
Partial funding was secured from the Skills Development Fund (SDF) of COTVET91 to train 250
technicians in the design, installation and maintenance of solar PV systems.
In addition, the Energy Commission in collaboration with ECG has successfully piloted 33 net-
meters equipped with automatic reading mechanism at various residential and commercial
facilities. Implementation of the Net-Metering Scheme began in October 2016 with ECG after the
successful pilot. However, ECG put the scheme on hold in the first quarter of 2017 for alleged fear
of reduction in their revenue generation. The Energy Commission in collaboration with ECG and
PURC are therefore currently working on resolving this challenge.
.
91 Council for Technical and Vocational Education and Training (COTVET) is a national body set up by an Act of
Parliament of the Republic of Ghana to co-ordinate and oversee all aspects of technical and vocational education
and training in the country.

68
Annex1 – Schematic Overview of Ghana Energy Demand and Supply
System
The integrated energy supply feeds the energy-demand economic sectors comprising Residential,
Commercial & Services, Agricultural & Fisheries, Transport and Industries. The Energy Supply Sector of
Ghana is thus: Biomass, Petroleum and Power (Electricity), whilst the Energy Demand sectors of the
economy are the Residential, Commercial & Services, Agricultural & Fisheries, Transport and
Industries (Figure A).
Figure Annex A1. Energy supply continuum
ENERGY SUPPLY
SECTOR
ENERGY DEMAND SECTORS OF THE ECONOMY
Economic Sectors Sub-sector classification
Woodfuels / Biomass Residential Urban, Rural
Commercial and Services Schools, hotels, restaurants, hospitals
Stores/shops Petroleum (oil and gas).
Agricultural and Fisheries Irrigation, Land Preparation and Harvest,
Spraying and Logging, Post Harvest
Processing, Livestock, Fisheries.
Transport Road, Rail, Maritime/Water, Air
Power
Industries Manufacturing, Mining, Utilities,
Construction, etc.
Figure A2. Energy supply continuum
Charcoal, briquettes
Petroleum products
Electricity / Power
Heat & others
Residential
Commercial & Services
Agricultural & Fisheries
Transport
Industrial
Energy Supply Energy-Economic sectors
Energy transportation
/transmission /
distribution
Biomass/wood/
firewood
Hydro /
Crude Oil
Solar & others
Primary fuels
Energy
conversion
Secondary
fuels/Energy

69
Annex 2 – National Grid Transmission Map
Source: GRIDCo, 2018 Electricity Supply Plan

70
Annex 3 – Liquefied Natural Gas Regas Terminal Technologies
The normal way to transport natural gas is through pipelines, but pipelines aren’t considered economical for
transoceanic shipments of natural gas. Liquefied natural gas, or LNG, has been cooled so that it can be shipped
more efficiently as a liquid in specially designed cargo ships. Transporting natural gas this way requires
specialized facilities at both ends of the voyage.
LNG could be delivered through the following terminal technologies:
Temporary or stop-gap through “Energy Bridge Re-gasification Vessels” (EBRVs)
Floating Re-gasification plants using grounded LNG vessels which have retired from services.
Permanent LNG re-gasification plants.
Energy Bridge Regasification Vessels
Energy Bridge Regasification Vessels, or EBRVs™, are purpose-built floating storage re-gasification units
(FSRU) LNG tankers that incorporate on-board equipment for the vapourisation of LNG and delivery of high
pressure natural gas. It is the technology that can be delivered in the shortest possible time; i.e. within a year.
These vessels load in the same manner as standard LNG tankers at traditional liquefaction terminals, and also
retain the flexibility to discharge the gas in two distinct ways. These are:
Through the EBRV’s connection with subsea buoy in the hull of the ship; and
through a high pressure gas manifold located in front of the vessel’s LNG loading arms.
The maximum rate of discharge of the natural gas from an EBRV into the deepwater port is determined by a
combination of the availability of capacity on downstream pipelines and the regasification capabilities of the
facilities located on-board each EBRV.
Figure A3. LNG Energy Bridge Regasification Vessel

71
LNG Floating, Storage and Re-gasification (FSRU) plants
Average lifetime of most LNG vessels is 25 years. This means LNG vessels built more than 25 years ago have
become less competitive for transport services. Such an LNG ship is retired and reconfigured as floating storage
LNG re-gasification unit or facility (FSRU). Typical LNG ship has capacity of 120,000-125,000 liquid cubic
metres (lm3). The larger the containment the greater the application for floating storage and regasification
applications92. Construction of floating regas terminals has rapidly increased since 2005 when the first one was
built in Louisiana, USA.
Floating Regas facility would take about one -to-two years to build if a project is approved and money is readily
available today, otherwise up to two and half years to allow for initial paper work.
Figure A4. LNG Floating, Storage And Re-Gasification Plant
Permanent LNG discharge/re-gasification terminal
Contrary to FSRU, this is permanently fixed as the name implies and it is usually a specialised or dedicated
harbour. Development of permanent LNG re-gasification plant of say 100-200 mmscfd capacity would require at
least 3-4 years even if a project is approved and money is available today.
Figure A5: Permanent LNG Re-Gasification Terminal
92 Zeus Liquefied Natural Gas Report, January 28, 2009

72
Annex 4 – Nigeria Gas Supply Challenges
Ghana has been expecting much of its natural gas to come from Nigeria. However, there are over 25
grid-connected generating plants in operation in the Nigerian Electricity Supply Industry (NESI), with
a total installed capacity of about 12,500 MW and dependable capacity of about 6,800 MW. Most
generation is thermal based of total installed capacity of about 11,000 MW from 9000 MW in early
2017 93. Available capacity has however ranged between 3,500-5,000 MW. The target is to hit 15,000
MW by 2020 against an estimated demand of 26,651 MW by the end of the decade94.
Nigeria estimates that it would require 40,000 MW of additional capacity to address the energy needs.
This ambition puts a greater strain on the existing gas supply situation as the country struggles to
achieve its domestic gas supply and export plans. Supply requirement totals about 5 billion cubic feet
per day (bcfd) for domestic consumption, LNG contractual shipments and WAGP commitments.
Despite, the country is currently only able to produce about 4 bcfd, of which about 2.8-3.0 bcfd is for
the production of the 22 million tonnes of LNG the county exports annually. Existing power plants
require at least 1.5 bcfd, which translates into very little or no gas for pipeline export to WAGP partner.
The supply to the WAGP partner however ramps up only when a local power plant trips or is offline
for maintenance. The country thus needs to develop new fields to meet the projected demand but
industry experts estimate that to happen within 2017-2018, provided the existing schedule is executed
as planned.
The current policy of the Nigerian government somehow seems to be to meet local gas demand first
before considering exports to neighbouring countries. For this reason, there is a policy in place
compelling all major gas shippers including N-Gas that ship gas to Ghana through the West African
Gas Pipeline (WAGP) to meet local supply quota first before export. As at the end of 2013, most
shippers were finding it difficult to meet the local quota obligation. Besides, the sabotaging of oil and
gas facilities in the Delta region still remains a challenge95. These are contributing to the relatively low
average supplies to the WAGP, aside untimely payments by off-takers particularly in Ghana for gas
supplied.
The country has done well in reducing gas flaring over the years from 2 bcfd in 2015 to about 750
mmscfd, this still equates to burning $700 million annually or wasting fuel that could have been used
to generate nearly 3,000MW of electricity.
Thus for N-Gas of Nigeria to limit gas supply to WAGP at the contracted volume of 123 mmscfd
instead of the full capacity of 440 mmscfd as originally agreed in the supply contract is of concern but
not hopeless96. The supply balance of 312 mmscfd reinforces the opportunity for the development of a
viable alternative supply option such as an LNG terminal along Ghana’s coast.
93 http://www.nipptransactions.com, 2017 94 Power Generation: Status and Outlook, a presentation by Presidential Task Force on Power, at Electric Power
Investors ‘ Forum by Bureau of Public Enterprises, 95 Orient Energy Review, Vol.5 No. 02/03 Feb-March, 2018. 96 Energy Commission source.

73
Annex 5 – Woodfuel weights
Firewood/fuelwood 1 Tonne 0.30 - 0.36 TOE
Charcoal 1 Tonne 0.68 - 0.88 TOE
Sawdust/sawmill residues/wood chips 1 Tonne 0.20 - 0.30 TOE
Low side reflecting average dry wood and corresponding Charcoal in the forest zones and the high
side reflecting average dry wood and corresponding charcoal in the savannah zones of the country.
Charcoal production is based on the fact that between 4 – 5 mass units of wood have been used to
produce one mass unit of charcoal in the country
Charcoal Source
Average Weight (kg) of Charcoal
Mini Bag Maxi Bag Moisture Content
Sawmill residue 21 – 22 44 - 45 Up to 40%
Savannah wood 30 – 32 55 - 60 Up to 20%
Acacia plant 31 – 32 57 - 63 Up to 20%
All other woods 25 – 27 50 - 55 Up to 25%