Measuring Demand for Sanitation in Ghana - Hygiene Central
36
1 Behavioral Indicators of Household Decision-Making and Demand for 1 Sanitation and Potential Gains from Sanitation Marketing in Ghana 2 Marion W. Jenkins 1 and Beth Scott 2 3 June, 2006 4 5 1 Asst. Research Engineer, Dept. of Civil and Environmental Engineering, University of California-Davis, one Shields Ave, Davis, CA 95616, USA. Email: [email protected] 2 Research Fellow, The Hygiene Centre, DCVB Unit, Infectious and Tropical Diseases, London School of Hygiene and Tropical Medicine, Keppel St., London WC1E 7HT, UK. Email: [email protected]
Transcript of Measuring Demand for Sanitation in Ghana - Hygiene Central
1
Behavioral Indicators of Household Decision-Making and Demand for 1
Sanitation and Potential Gains from Sanitation Marketing in Ghana 2
Marion W. Jenkins1 and Beth Scott2 3
June, 2006 4
5
1 Asst. Research Engineer, Dept. of Civil and Environmental Engineering, University of California-Davis, one
Shields Ave, Davis, CA 95616, USA. Email: [email protected]
2 Research Fellow, The Hygiene Centre, DCVB Unit, Infectious and Tropical Diseases, London School of
Hygiene and Tropical Medicine, Keppel St., London WC1E 7HT, UK. Email: [email protected]
2
Abstract 6
Household demand for improved sanitation in developing countries is an important 7
social and behavioral process with implications for public health, sanitation policy and 8
planning, and sanitation design and technology development. This paper develops a 9
behavioral approach to assess household demand for improved sanitation in Ghana. Adoption 10
decision stages of preference, intention, and choice to install a toilet in Ghana are defined, 11
measured in a survey and used to estimate sanitation demand, identify factors affecting 12
demand at each stage, and classify households by adoption stage to identify targeted demand-13
stimulation strategies. Results from a representative national sample of 536 households 14
indicate that of 74% of households without any home sanitation, 31% have some likelihood of 15
installing a toilet within the next year, but only 6% are very likely to do so; 62% had not 16
considered the idea. Motivating and constraining factors are compared at each adoption stage 17
and strategies likely to increase toilet installation in Ghana discussed. The approach is useful 18
for assessing behavioral indicators of sanitation demand in developing countries and 19
suggesting where marketing approaches can and cannot work to accelerate adoption of 20
household sanitation improvements. 21
Introduction 22
Good sanitation is a foundation for health that affords protection from a wide range of 23
infections including diarrhea, a leading cause of child deaths, yet 2.6 billion people still do not 24
have a safe means of excreta disposal at home (WHO and UNICEF 2004). A target to halve 25
this number by 2015 was added to the Millennium Development Goals in 2002. The 26
enormity of the challenge, however, comes with the acknowledgement that public resources 27
3
alone are unable to solve this global problem and new demand-oriented approaches are 28
needed (Mehta and Knapp 2004; WSSCC and WHO 2005). 29
Few large investment programs have been effective in increasing household sanitation 30
in developing countries, yet people in these countries continue to install household toilets on 31
their own without subsidy (Cairncross 2004; Jenkins and Sugden 2006). Using public funds 32
to stimulate households to adopt improved sanitation through market-based promotion is 33
increasingly advocated to leverage household and community resources for sanitation and 34
may hold great promise for sustainably closing the sanitation gap (Mehta and Knapp 2004; 35
Cairncross 2004). Such an approach parallels the use of social marketing in public health to 36
achieve large-scale changes in health-related household and personal behaviors, where market 37
research, audience segmentation, commercial marketing practices, and targeted products and 38
interventions are fundamental components of program design (Kotler et al. 2002). However, 39
often other tools are needed to stimulate and support private behaviors to achieve public 40
goals. With this wider perspective in mind, Rothschild (1999) developed a framework for the 41
strategic use of marketing along with two other primary tools for behavior change - education 42
and law - to achieve public social or health goals. The degree to which a target population is 43
prone, resistant or unable to adopt a new behavior derives from the presence or absence of 44
self-interest (motivation), opportunity, and ability to voluntarily adopt the sanitation behavior 45
(Rothschild 1999). Marketing can enhance awareness of self-interests and create 46
opportunities to act, and can sometimes overcome lack of ability. When the target’s self-47
interests are not served regardless of opportunities or abilities, the law may be needed to gain 48
compliance, particularly when large negative externalities from non-adoption exist as they 49
typically do for sanitation. 50
4
Recognizing where and how marketing can affect household sanitation decisions is the 51
first of several challenges for sanitation managers wanting to use marketing approaches to 52
increase demand for and access to improved sanitation. Where marketing is likely to be 53
effective, a second challenge is to understand existing household sanitation behaviors and 54
adoption decisions in ways that inform development of cost-effective strategies to increase 55
adoption. In this study, a model of household sanitation adoption decision-making that 56
accounts for motivation, opportunity, and ability was developed and applied in Ghana to 57
allow sanitation managers to better measure, understand and predict behavioral determinants 58
of demand for sanitation and strategically plan interventions based on marketing principles. 59
The approach is broadly applicable where household sanitation coverage is low, but can also 60
be adapted to areas where sanitation coverage might be high, but toilets (or latrines) unsafe or 61
in poor condition. The model and survey tool serve three major purposes: 62
� Measure baseline household sanitation adoption and demand patterns 63
� Predict changes in demand for sanitation improvements by mapping the decision-64
making process into behavioral stages, classifying households within this process, and 65
understanding barriers to adoption at each stage. 66
� Identify actions and policies to increase sanitation demand among households in 67
different adoption stages. 68
A study of the decision to install a home toilet among households in Ghana illustrates 69
how this assessment approach achieves these purposes. We label households who have 70
already installed a toilet or latrine in Ghana ‘adopters’, while new demand is approximated by 71
the portion of ‘non-adopter’ (without sanitation) households projected to pay for and build a 72
new home toilet in the next 12 months. We describe our model of sanitation adoption stages 73
5
and how the survey was conceptualized and applied nationally in Ghana. Then we present 74
and discuss the survey results related to estimating new household demand for sanitation in 75
Ghana. Finally, we examine the segmentation of households by adoption stage and how this 76
information can be used to design demand stimulation strategies based on marketing 77
principles in the Ghanaian context. 78
Few studies have assessed consumer demand for sanitation in developing countries, 79
and most of these have applied economic contingent valuation methods to approximate 80
demand with willingness-to-pay bids (Wittington et al. 1993; Altaf 1994; Altaf and Hughes 81
1994). WTP estimates provide a measure of the hypothetical monetary value people place on 82
what is often a narrowly prescribed sanitation change (crucial for bid accuracy) but are unable 83
to provide time-bound predictions of demand. WTP studies typically ignore the transaction 84
costs and constraints households encounter in real life and the tradeoffs they face when 85
deciding to adopt and purchase new sanitation systems for the first time in developing 86
countries. Yet these features emerge as important determinants of household demand for 87
sanitation in this and other studies (Jenkins 1999, 2004). Contingent valuation studies also 88
offer limited insight into weak demand, apart from price and income, and minimal guidance 89
on ways to stimulate demand and change behavior. 90
Applying decision making models to estimate new sanitation demand draws from 91
cognitive psychology and consumer purchase decision behavior to explain and predict 92
changes in individual sanitation behavior over time by observing past and future sanitation 93
adoption decisions, measuring their behavioral determinants, and mapping population into 94
categories useful for understanding behavior change. Of particular interest are the individual 95
attitudinal and structural determinants of preferring and choosing different competing 96
6
behavioral outcomes, rather than on socio-economic characteristics, to explain and predict 97
household demand. Although commonly applied in WTP and other surveys, socio-economic 98
characteristics typically lack explanatory power and provide poor predictors of individual 99
changes in behavior for strategic planning and policy evaluation. 100
Sanitation Change Adoption in Developing Countries 101
A model is developed of the household decision to adopt a sanitation change, focusing 102
on the process, observable stages, and households’ logic behind each decision stage. 103
Adoption Decision Process 104
For a household without adequate sanitation in a developing country, deciding to 105
improve sanitation by installing a toilet (e.g., pit latrine, bucket latrine, flush toilet, water 106
closet or another excreta disposal facility) for the first time, changing to a new toilet system, 107
or connecting to a sewer, can be a complicated and lengthy process. To first contemplate this 108
decision, a household must be aware of the personal benefits of the sanitation change and the 109
availability of products and services. Consumer theory and empirical evidence suggests that 110
with sufficiently strong interest, a household will actively seek information about options, 111
perhaps discuss with family members and technical specialists how and when to make a 112
change. An adoption plan might mean choosing a sanitation technology (or service level) to 113
fit the household’s budget and lifestyle, picking a site, finding a mason and supplier of 114
construction materials, negotiating costs, saving money, and acquiring a building permit in 115
some settings. Viewing the adoption decision as a progression of evolving attitudes, 116
knowledge, and actions provides a more detailed causal understanding of what generates 117
demand for sanitation, and where sanitation coverage is low, factors that may constrain it. 118
7
Broadly speaking, non-adopter households can be categorized by whether or not they 119
have thought about making a change to home sanitation, and if so, how far they have taken 120
such thinking. While some may have considered a change, for example, installing a latrine, 121
others will have little awareness of options or meaningful benefits of having a latrine and 122
therefore never considered adopting. Among those who have considered installing a latrine, 123
intention to actually build it will vary with priority given to the outcome and with the time 124
frame and level of planning and preparations. Some may want a latrine but have ruled it out 125
as unobtainable or “wishful” thinking. Perceived lack of ability to control arises from 126
personal context or resources, or from absence of local information and opportunities, making 127
the choice to build improved sanitation unavailable or beyond reach. 128
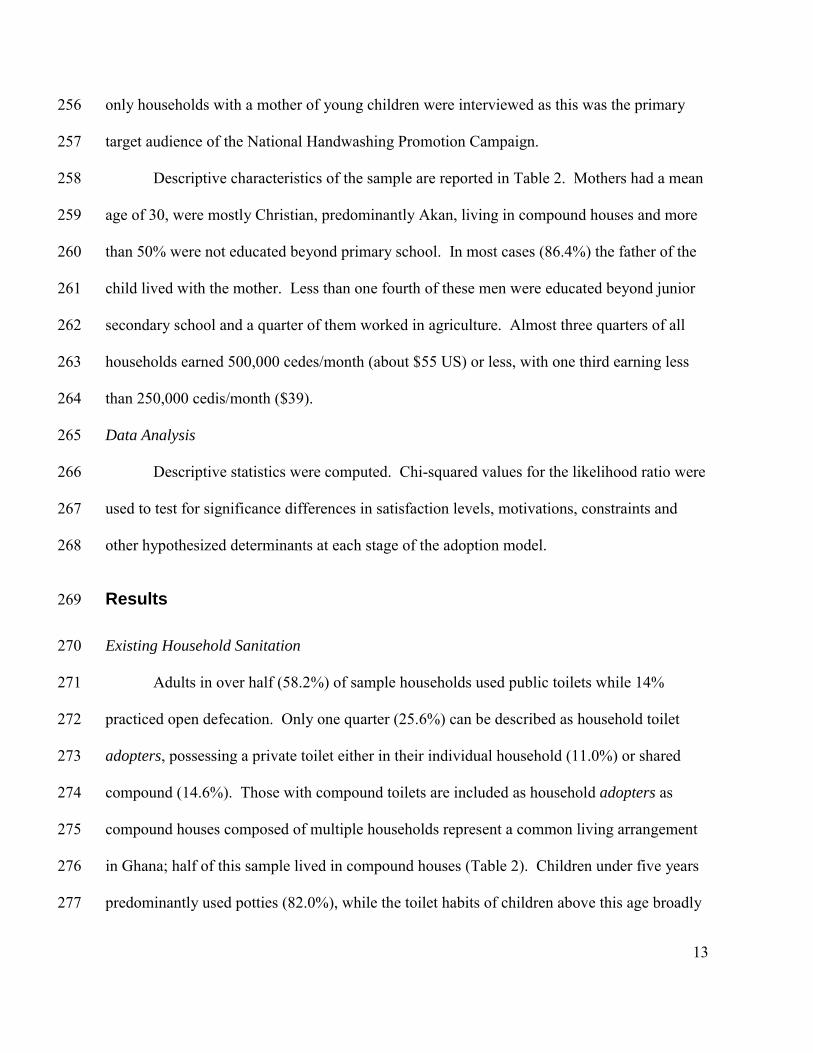
Preference, Intention and Choice Stages 129
Drawing from behavior change models and cognitive theories of individual decision-130
making, particularly the theories of reasoned action (Fishbein and Ajzen 1975) and planned 131
behavior (Ajzen 1985) and empirical study of household sanitation choices in Benin (Jenkins 132
1999, 2004; Jenkins and Curtis 2005), we develop a simplified model of three progressive 133
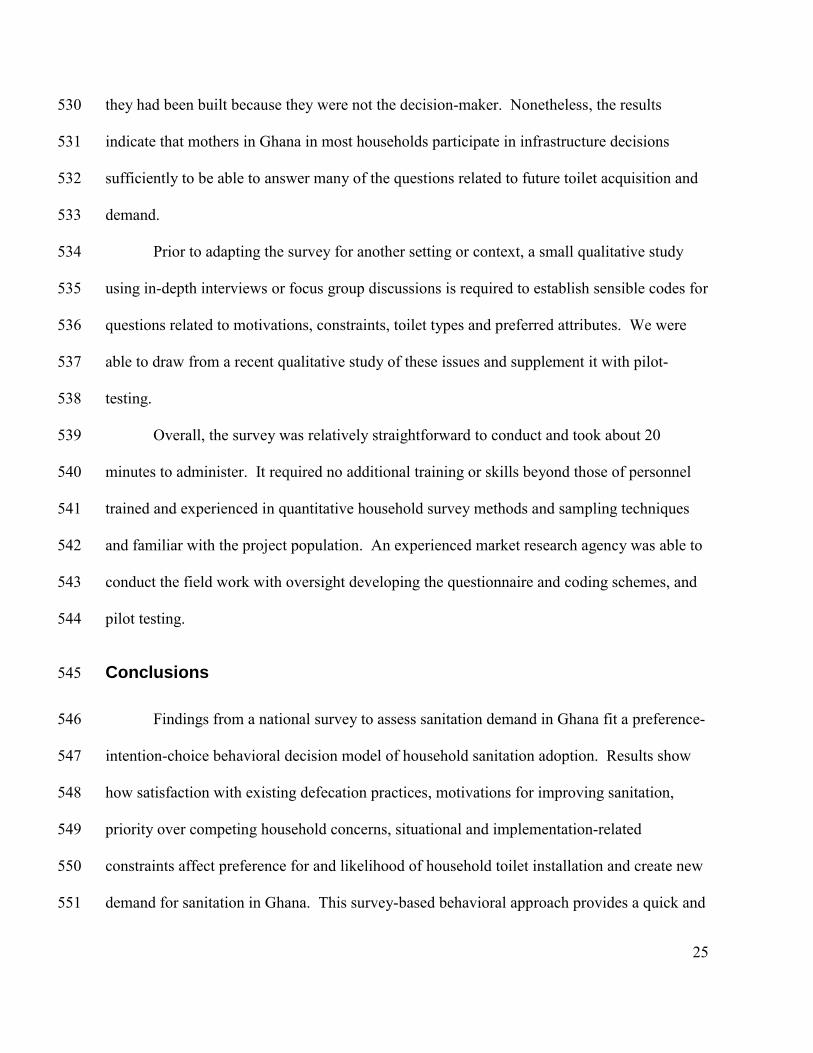
stages of the decision to adopt a sanitation change called preference, intention, and choice. 134
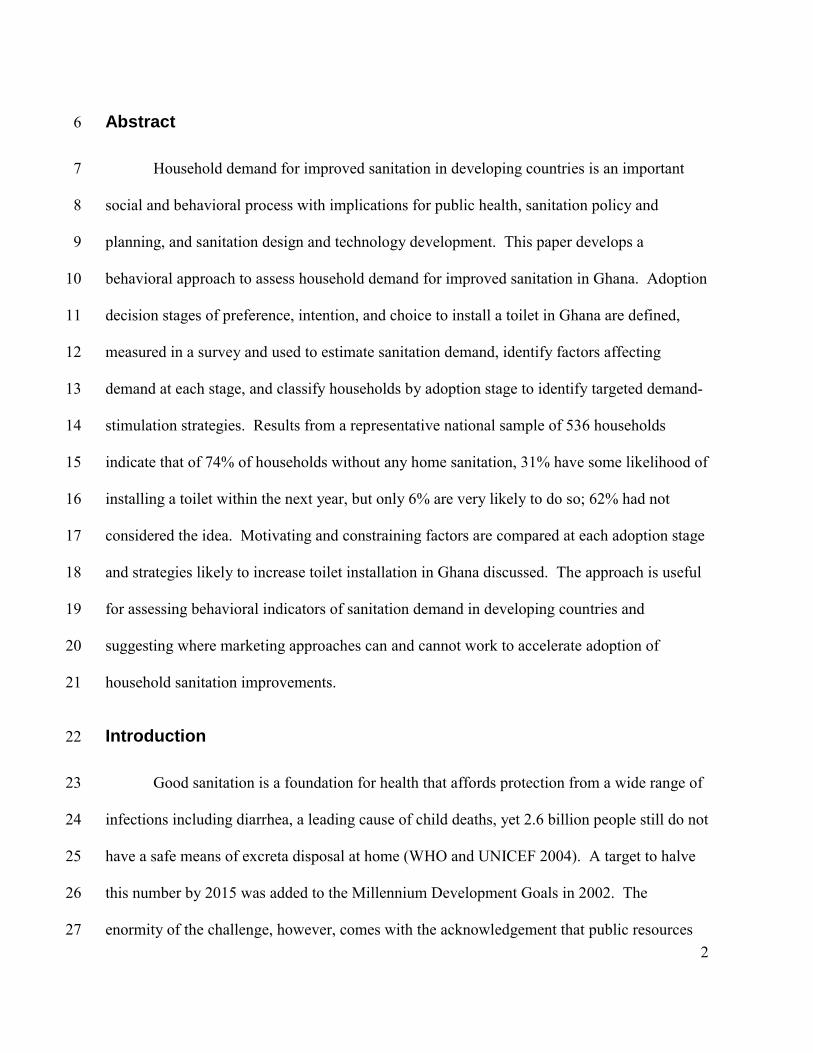
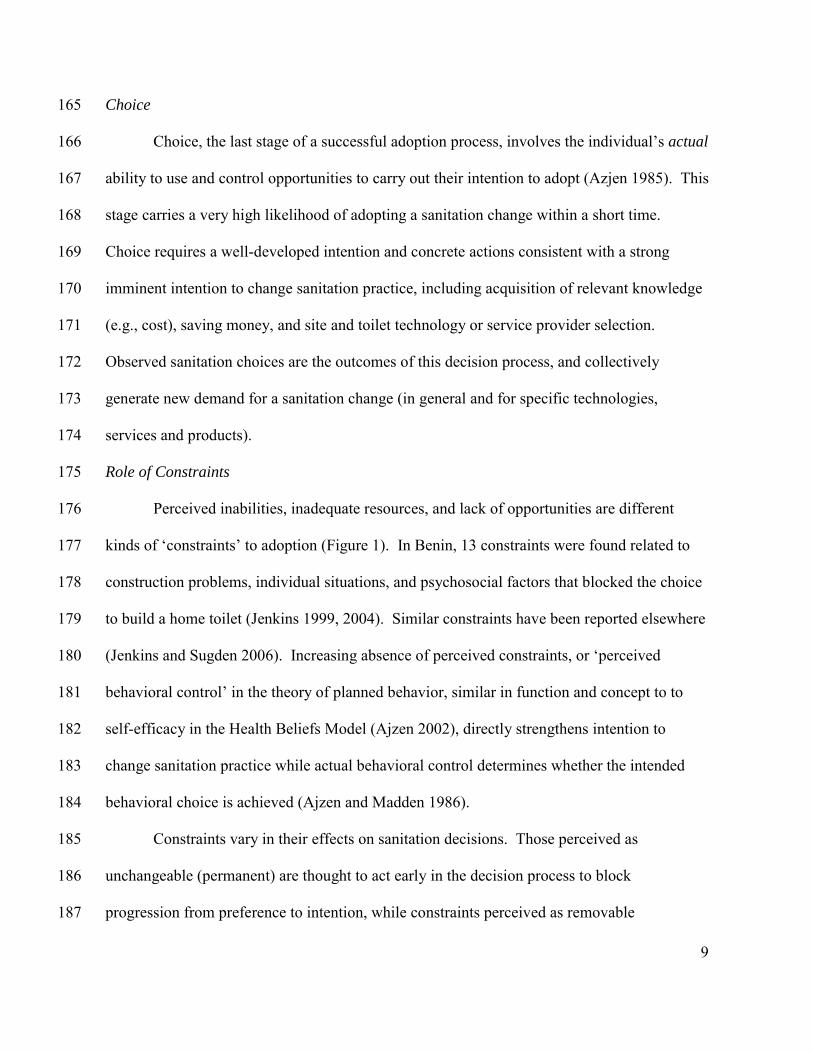
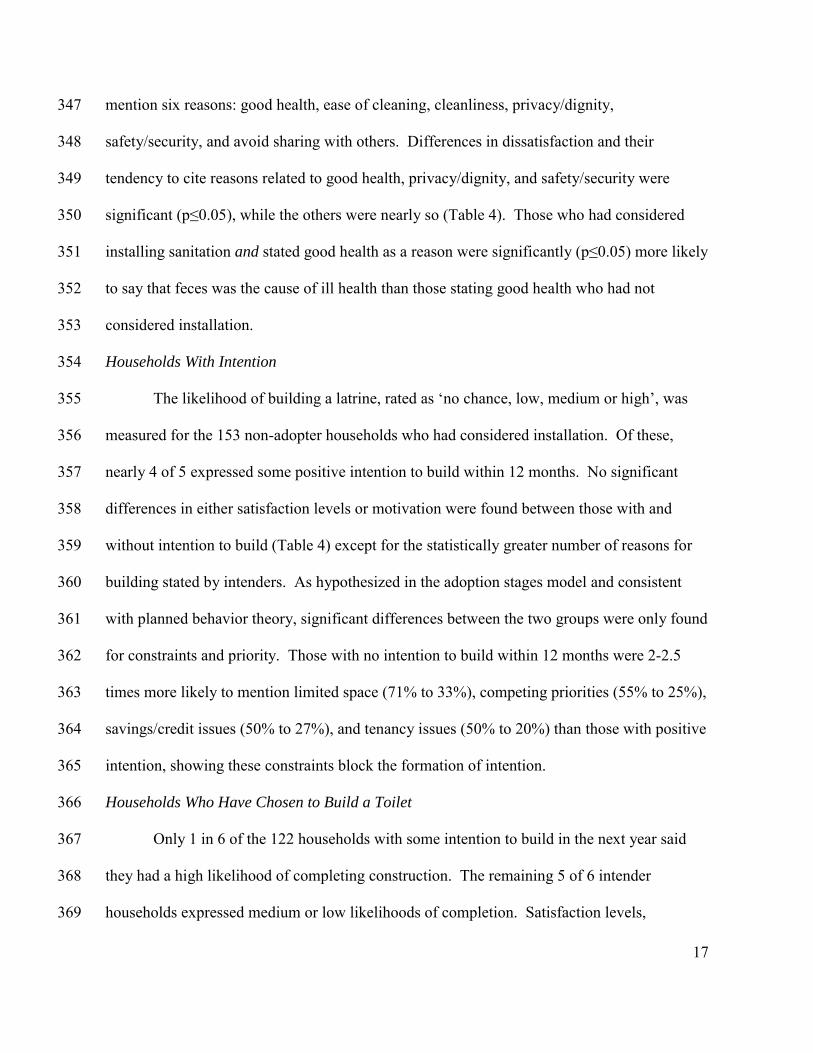
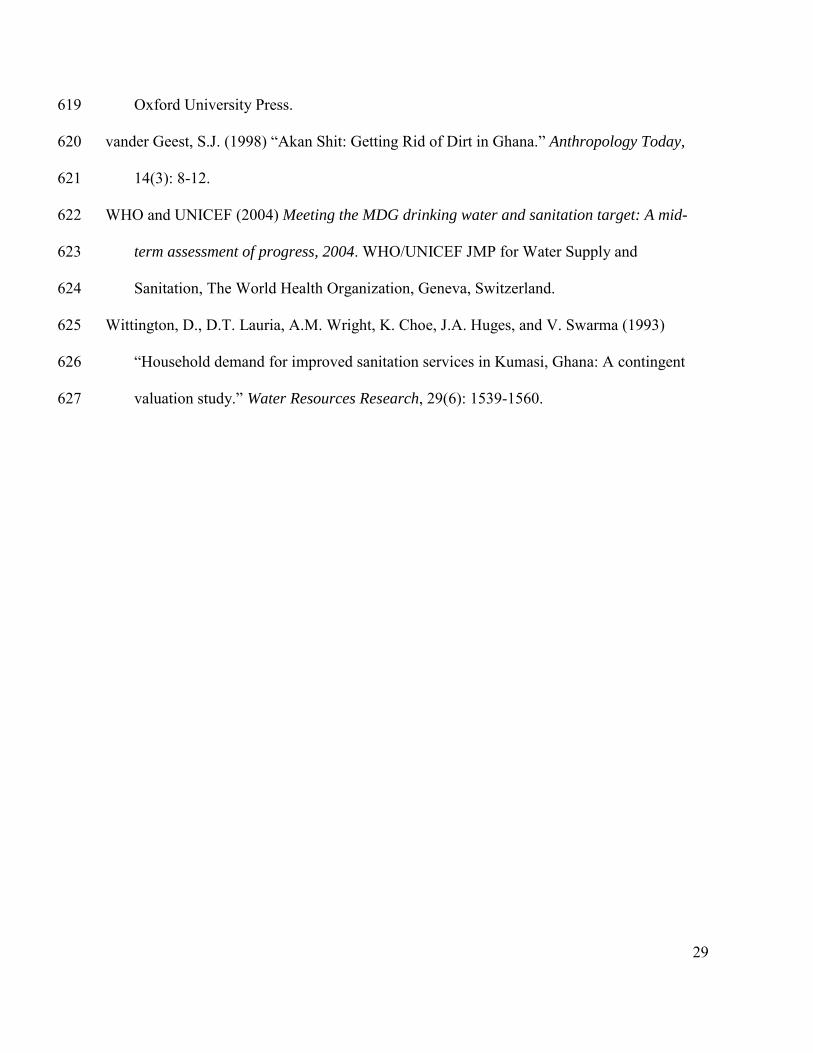
Figure 1 illustrates the key theorized determinants of progression at each stage. 135
Preference 136
The adoption decision starts with development of ‘preference’ for a sanitation 137
improvement over one’s present defecation practice. Preference captures purchase motivation 138
and the expected relative advantages, benefits and reasons (perceived utility gain) for wanting 139
a sanitation improvement. Motivation to change sanitation arises from dissatisfaction with 140
current household defecation or excreta management practices coupled with sufficient 141
8
awareness of advantages of new options (Jenkins and Curtis 2005). In this stage, households 142
are interested in and have considered a sanitation change but have not necessarily begun to 143
plan it. 144
Intention 145
Households in the intention stage have begun to plan a sanitation change, but vary in 146
their degree of plan development. For many behavior changes, once awareness and 147
motivation are sufficient, change is within the voluntary control of the individual or 148
household. This is the case for example with hand washing, when soap, water, and technical 149
knowledge usually exist within the household. However, changing sanitation infrastructure 150
for the first time requires more than awareness and motivation, including new and unfamiliar 151
materials, products/services, technical knowledge and skills, much of which must be acquired 152
outside the home. These less controllable inputs often entail uncertainty and risks for 153
households without prior sanitation experience. Even do-it-yourself latrine construction 154
usually requires special materials and new technical knowledge. Starting a plan to change 155
home sanitation technology or practice (‘intention’ in Figure 1) depends directly on the 156
availability, quality, and cost of opportunities to acquire materials, products, construction 157
services, financing, skills, and knowledge, and on the personal resources, experience, and 158
abilities of individual households to take advantage of these opportunities. Commitment to 159
changing sanitation reflects the priority given to this change compared to expected outcomes 160
from alternative uses of limited savings, time, effort, and other household resources. If 161
required abilities or opportunities are perceived to be lacking, or priority low, a household is 162
likely to form a very weak or no intention to adopt a sanitation change (Azjen and Madden 163
1986). 164
9
Choice 165
Choice, the last stage of a successful adoption process, involves the individual’s actual 166
ability to use and control opportunities to carry out their intention to adopt (Azjen 1985). This 167
stage carries a very high likelihood of adopting a sanitation change within a short time. 168
Choice requires a well-developed intention and concrete actions consistent with a strong 169
imminent intention to change sanitation practice, including acquisition of relevant knowledge 170
(e.g., cost), saving money, and site and toilet technology or service provider selection. 171
Observed sanitation choices are the outcomes of this decision process, and collectively 172
generate new demand for a sanitation change (in general and for specific technologies, 173
services and products). 174
Role of Constraints 175
Perceived inabilities, inadequate resources, and lack of opportunities are different 176
kinds of ‘constraints’ to adoption (Figure 1). In Benin, 13 constraints were found related to 177
construction problems, individual situations, and psychosocial factors that blocked the choice 178
to build a home toilet (Jenkins 1999, 2004). Similar constraints have been reported elsewhere 179
(Jenkins and Sugden 2006). Increasing absence of perceived constraints, or ‘perceived 180
behavioral control’ in the theory of planned behavior, similar in function and concept to to 181
self-efficacy in the Health Beliefs Model (Ajzen 2002), directly strengthens intention to 182
change sanitation practice while actual behavioral control determines whether the intended 183
behavioral choice is achieved (Ajzen and Madden 1986). 184
Constraints vary in their effects on sanitation decisions. Those perceived as 185
unchangeable (permanent) are thought to act early in the decision process to block 186
progression from preference to intention, while constraints perceived as removable 187
10
(temporary) are expected to act later in the decision process to delay preparations and final 188
choice (Jenkins 1999). The differential effects of constraints on adoption are explored in the 189
Ghana study. 190
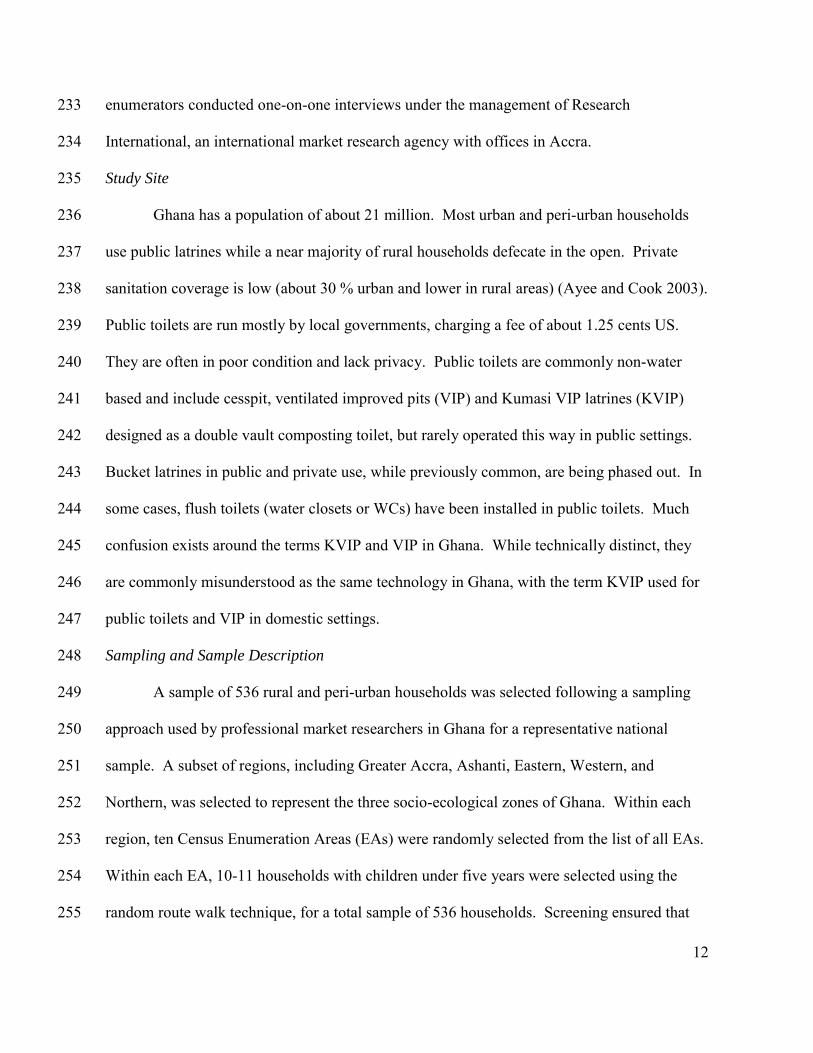
Adoption Stage Indicators, Determinants and Question Formats 191
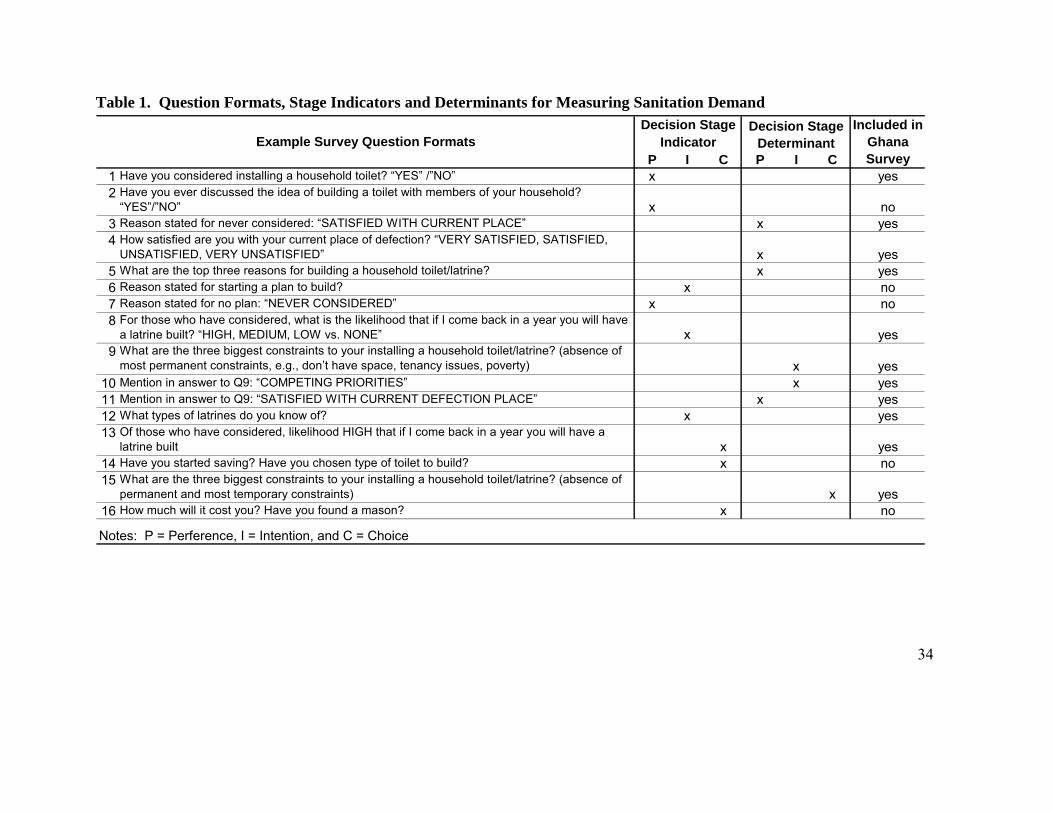
Indicators were developed and questions constructed in a survey format to measure the 192
three decision stages and their determinants (Table 1). Sanitation demand in Ghana was 193
assessed by the number of non-adopter households at each stage of preference, intention, and 194
choice, and new demand estimated by households in the last stage of ‘choice’ who expressed 195
a ‘high’ likelihood of building a home toilet within 12 months. 196
While the household is our unit of analysis, dynamics of intra-household decision-197
making are beyond this research. To capture a household’s adoption decision behavior in an 198
interview format, the household member most responsible for making decisions about 199
changes in home sanitation infrastructure should be interviewed. In our experience, this has 200
consistently been the head of household in non-tenant households but is less clear who this 201
should be in tenant households in developing countries where tenancy is often informal and 202
takes many different forms under complex occupancy patterns (see Gilbert (1983), UNCHS 203
(1996) and Rakodi (1995)). 204
Methods and Materials 205
A questionnaire based on the indicators in Table 1 was developed to achieve the 206
following objectives: 207
� measure baseline household sanitation coverage levels, 208
� estimate new demand for household toilets among those without adequate sanitation, 209
11
measured by a high likelihood of installing a toilet within 12 months, 210
� classify households by adoption stage to assist in designing marketing strategies, and 211
� examine predictors at each stage, related to awareness, dissatisfaction, motivations, 212
and constraints, 213
� quick and easy to implement in developing countries. 214
Ghana Questionnaire and Survey Execution 215
Table 1 shows the question formats used in the Ghana survey to measure the three 216
adoption stages and their determinants. The questionnaire was divided into five sections: 217
1. Description of current defecation places and technologies, satisfaction with current 218
situation, and most and least appreciated features of present defecation place. 219
2. Information related to ownership, age, decision-making, cost, and trigger reason for 220
installed toilet asked of adopter households, identified from section 1. 221
3. Expected benefits of installing home sanitation, asked to all households. 222
4. Perception of constraints and awareness of toilet technologies asked to households without 223
home sanitation, consideration of home toilet installation and strength of intention within 12 224
months. 225
5. Socio-economic and demographic characteristics. 226
Thirty-four structured questions (15 on socio-demographics) were included in a larger 227
baseline survey for the National Handwashing Promotion Program 228
(www.globalhandwashing.org) under the Ghana Community Water and Sanitation Agency. 229
Coded responses were initially informed by an in-depth qualitative study in one town. 230
Question formats and coding were refined following pre-testing of the survey in late July 231
2003 and field work conducted from 29th August through 22nd September 2003. Trained 232
12
enumerators conducted one-on-one interviews under the management of Research 233
International, an international market research agency with offices in Accra. 234
Study Site 235
Ghana has a population of about 21 million. Most urban and peri-urban households 236
use public latrines while a near majority of rural households defecate in the open. Private 237
sanitation coverage is low (about 30 % urban and lower in rural areas) (Ayee and Cook 2003). 238
Public toilets are run mostly by local governments, charging a fee of about 1.25 cents US. 239
They are often in poor condition and lack privacy. Public toilets are commonly non-water 240
based and include cesspit, ventilated improved pits (VIP) and Kumasi VIP latrines (KVIP) 241
designed as a double vault composting toilet, but rarely operated this way in public settings. 242
Bucket latrines in public and private use, while previously common, are being phased out. In 243
some cases, flush toilets (water closets or WCs) have been installed in public toilets. Much 244
confusion exists around the terms KVIP and VIP in Ghana. While technically distinct, they 245
are commonly misunderstood as the same technology in Ghana, with the term KVIP used for 246
public toilets and VIP in domestic settings. 247
Sampling and Sample Description 248
A sample of 536 rural and peri-urban households was selected following a sampling 249
approach used by professional market researchers in Ghana for a representative national 250
sample. A subset of regions, including Greater Accra, Ashanti, Eastern, Western, and 251
Northern, was selected to represent the three socio-ecological zones of Ghana. Within each 252
region, ten Census Enumeration Areas (EAs) were randomly selected from the list of all EAs. 253
Within each EA, 10-11 households with children under five years were selected using the 254
random route walk technique, for a total sample of 536 households. Screening ensured that 255
13
only households with a mother of young children were interviewed as this was the primary 256
target audience of the National Handwashing Promotion Campaign. 257
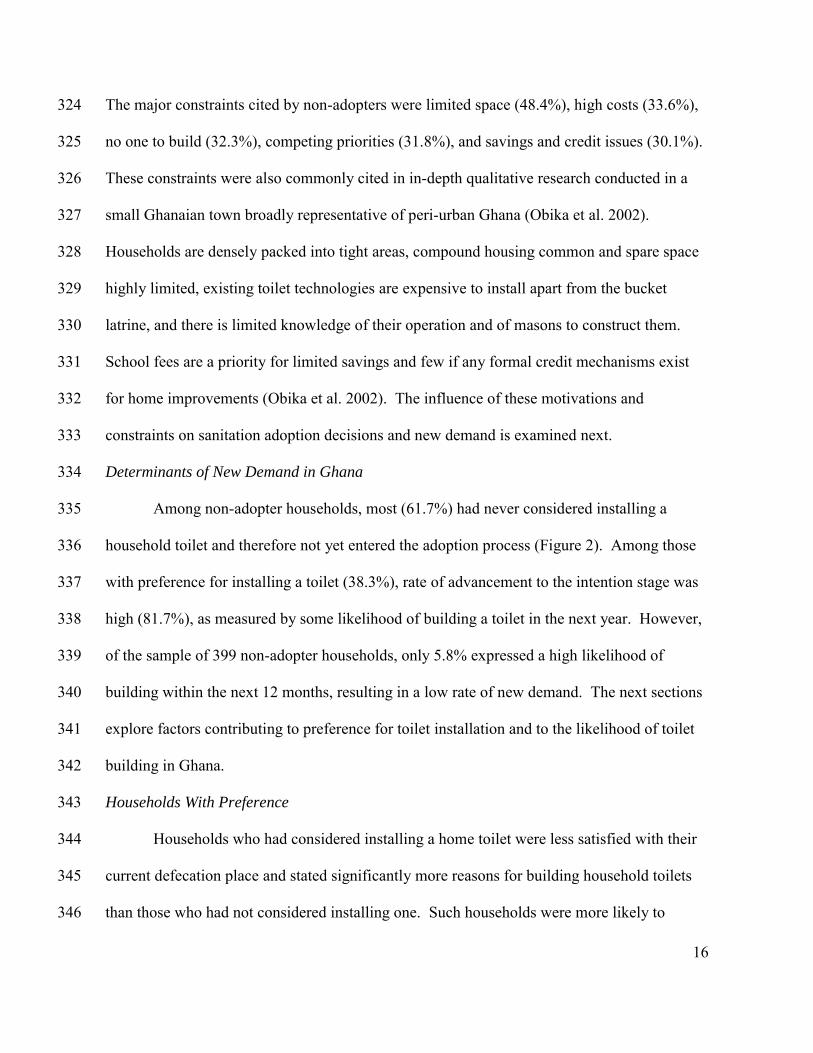
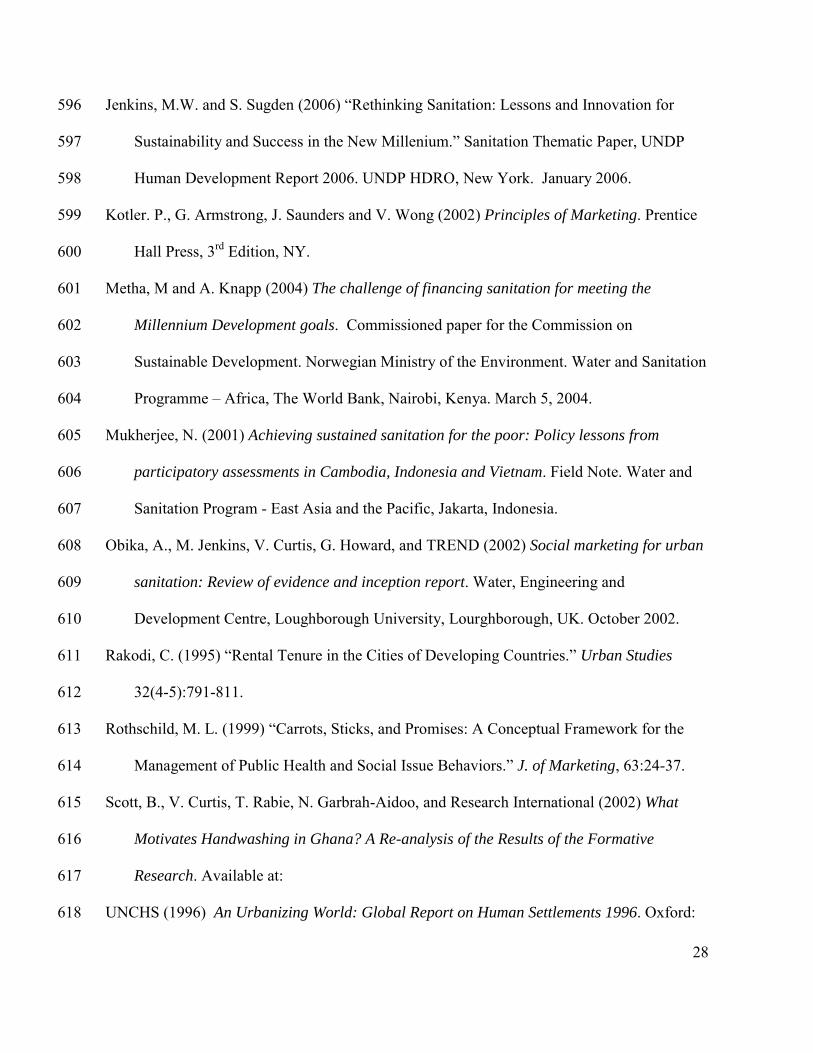
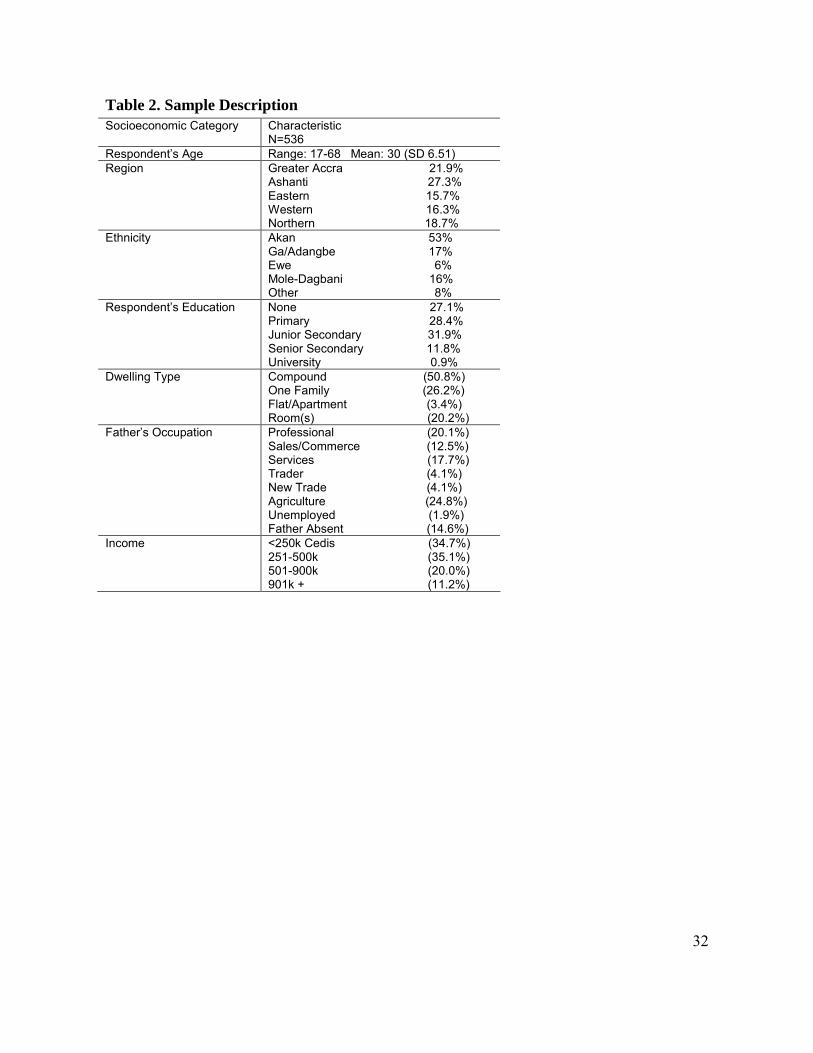
Descriptive characteristics of the sample are reported in Table 2. Mothers had a mean 258
age of 30, were mostly Christian, predominantly Akan, living in compound houses and more 259
than 50% were not educated beyond primary school. In most cases (86.4%) the father of the 260
child lived with the mother. Less than one fourth of these men were educated beyond junior 261
secondary school and a quarter of them worked in agriculture. Almost three quarters of all 262
households earned 500,000 cedes/month (about $55 US) or less, with one third earning less 263
than 250,000 cedis/month ($39). 264
Data Analysis 265
Descriptive statistics were computed. Chi-squared values for the likelihood ratio were 266
used to test for significance differences in satisfaction levels, motivations, constraints and 267
other hypothesized determinants at each stage of the adoption model. 268
Results 269
Existing Household Sanitation 270
Adults in over half (58.2%) of sample households used public toilets while 14% 271
practiced open defecation. Only one quarter (25.6%) can be described as household toilet 272
adopters, possessing a private toilet either in their individual household (11.0%) or shared 273
compound (14.6%). Those with compound toilets are included as household adopters as 274
compound houses composed of multiple households represent a common living arrangement 275
in Ghana; half of this sample lived in compound houses (Table 2). Children under five years 276
predominantly used potties (82.0%), while the toilet habits of children above this age broadly 277
14
reflected those of their parents, particularly in adopter households. Among non-adopters, a 278
higher percentage of older children (25.2%) than adults (14.0%) practiced open defecation. 279
Five household toilet technologies presently exist in Ghana – the flush toilet (WC) 280
(15%), bucket latrine (20%), traditional pit latrine (21%), and KVIP/VIP latrine (44%). 281
Among the 137 household toilet adopters, two thirds were able to recall when their current 282
toilets had been constructed. Less than 5% of adopter households had built their toilet prior to 283
1990, with adoption accelerating in the late 1990s. 284
In over half of cases (56.2%), landlords (generalized term for compound owner) were 285
reported to have decided to build the household latrine (consistent with shared compound 286
living), while household heads were the decision-maker in one in four adopter households. It 287
was extremely rare (1.5%) for tenants to decide to install a toilet. Where household heads had 288
taken the decision, the perception of ownership was sometimes more broadly defined. In over 289
a third of these cases, women stated that it was the whole household, not just the head, who 290
‘owned’ the toilet. 291
Although rarely making the decision themselves, nearly 80% of respondents were able 292
to cite motives for constructing the facility. The most common reasons given were: 293
� for sick or old relatives (23.2%) 294
� to offer safety at night (18.8%) 295
� for convenience (12.5%) 296
� to make it easier to keep the facility clean (9.8%) 297
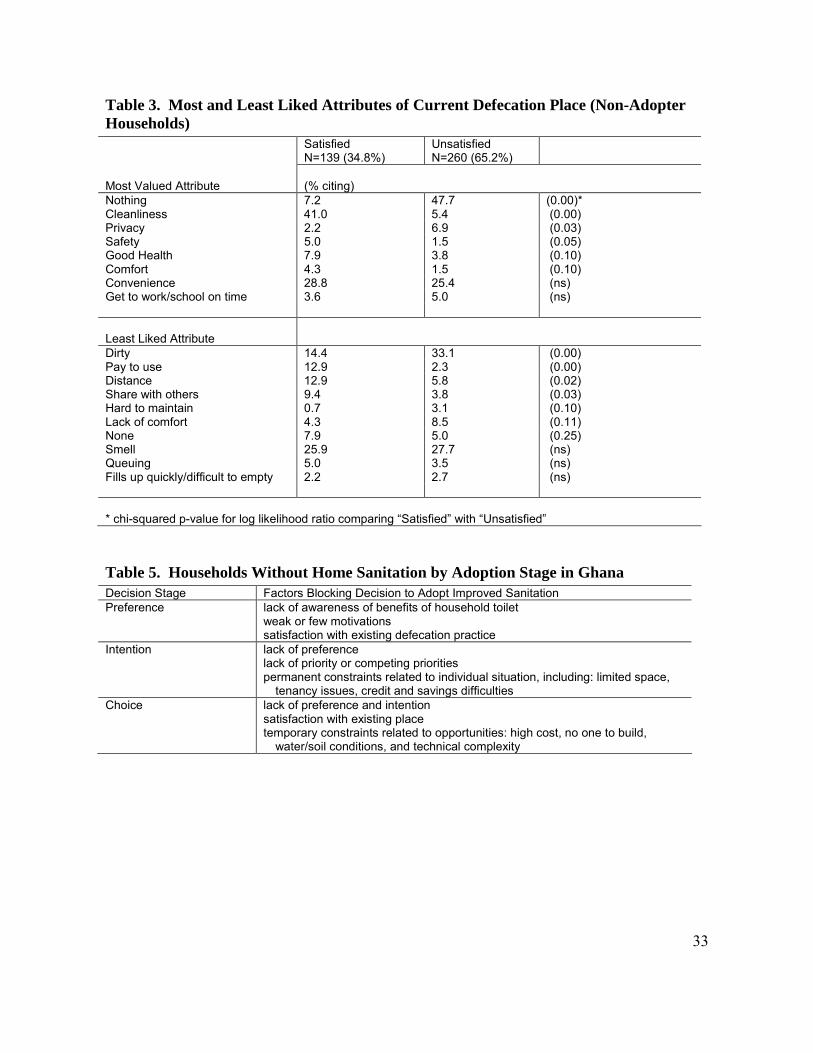
Non-adopter Households - Satisfaction Levels 298
Non-adopters were 74.4% of sample households, reflecting the general population in 299
Ghana. Among these, 65.2% were dissatisfied with their current place of defecation. The two 300
15
most disliked attributes of current defecation places were that they were smelly (27.1%) and 301
dirty (26.6%). Other cited dislikes included the distance to toilet facilities (8.3%), lack of 302
comfort (7.0%), having to pay to use them (6.0%), and having to share with others (5.8%). 303
A third of non-adopters could cite no positive attributes for their place of defecation. 304
Among those that could, the most liked attributes were that toilets were convenient (26.6%) 305
and clean (17.8%). Dissatisfaction with one’s defecation facility was significantly associated 306
with being unable to cite any positive attributes, with citing privacy as the most positive 307
attribute, and with disliking its dirty state (Table 3). Conversely, satisfaction was 308
significantly associated with valuing its cleanliness and safety. 309
Non-adopter Households - Motivating Reasons for Toilet Installation 310
All non-adopters were asked to give three top reasons for building a household toilet. 311
The most heavily cited reasons were convenience (51.4%), that they are easy to keep clean 312
(43.1%), good health (41.9%), and general cleanliness (27.8%). Presently non-adopters 313
travel to open defecation sites and public latrines, and in the latter case, join long queues in 314
the morning or evening. Public latrines in particular tend to be dirty and squalid, with feces 315
lying around squat holes which emit heat, gases and bad odors, believed to cause ill-health 316
(Obika et al 2002). Indeed, while 41.9% of respondents cited good health as a key reason to 317
build a household toilet, only one third said that germs were the cause of ill-health, two thirds 318
believing illness to be caused by heat, smell, feces or dirt. Thus toilets need to be clean to 319
protect health, but further, in Ghana, people have a particular need or desire to be neat, clean 320
and not smell, reflecting not just physical but mental and moral purity (van der Geest 1998). 321
Non-Adopter Households - Constraining Factors Blocking Adoption 322
Respondents also were asked about the constraints to constructing household toilets. 323
16
The major constraints cited by non-adopters were limited space (48.4%), high costs (33.6%), 324
no one to build (32.3%), competing priorities (31.8%), and savings and credit issues (30.1%). 325
These constraints were also commonly cited in in-depth qualitative research conducted in a 326
small Ghanaian town broadly representative of peri-urban Ghana (Obika et al. 2002). 327
Households are densely packed into tight areas, compound housing common and spare space 328
highly limited, existing toilet technologies are expensive to install apart from the bucket 329
latrine, and there is limited knowledge of their operation and of masons to construct them. 330
School fees are a priority for limited savings and few if any formal credit mechanisms exist 331
for home improvements (Obika et al. 2002). The influence of these motivations and 332
constraints on sanitation adoption decisions and new demand is examined next. 333
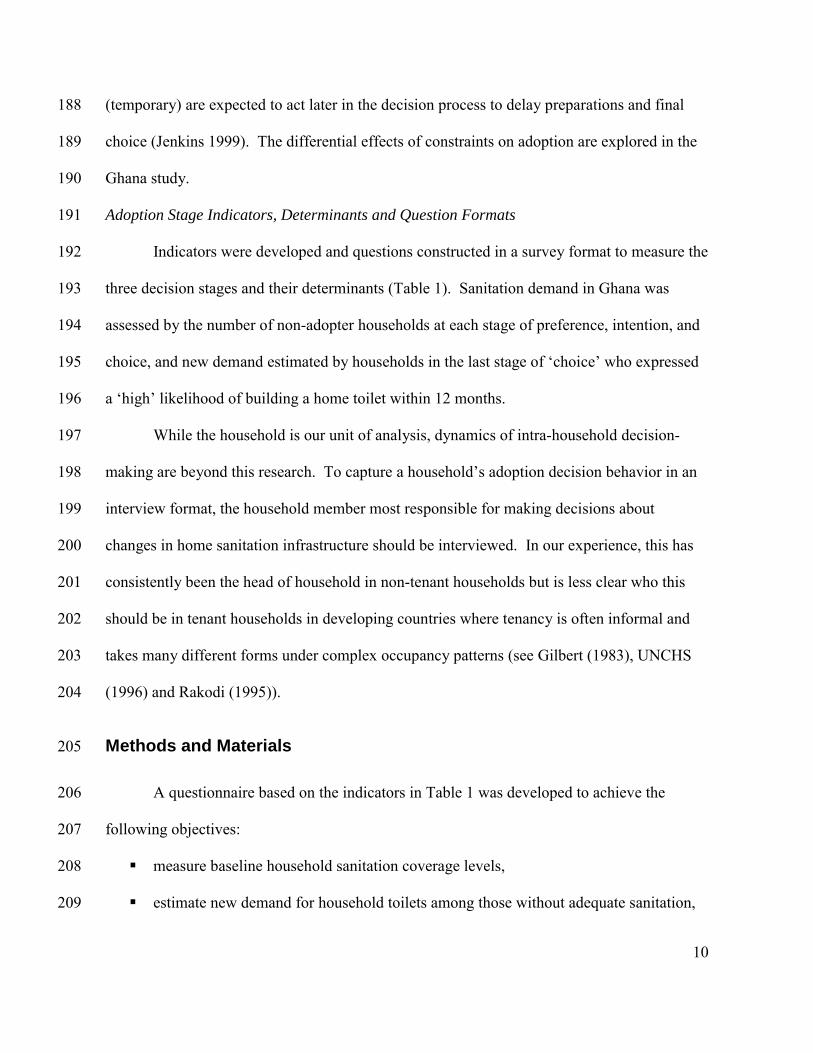
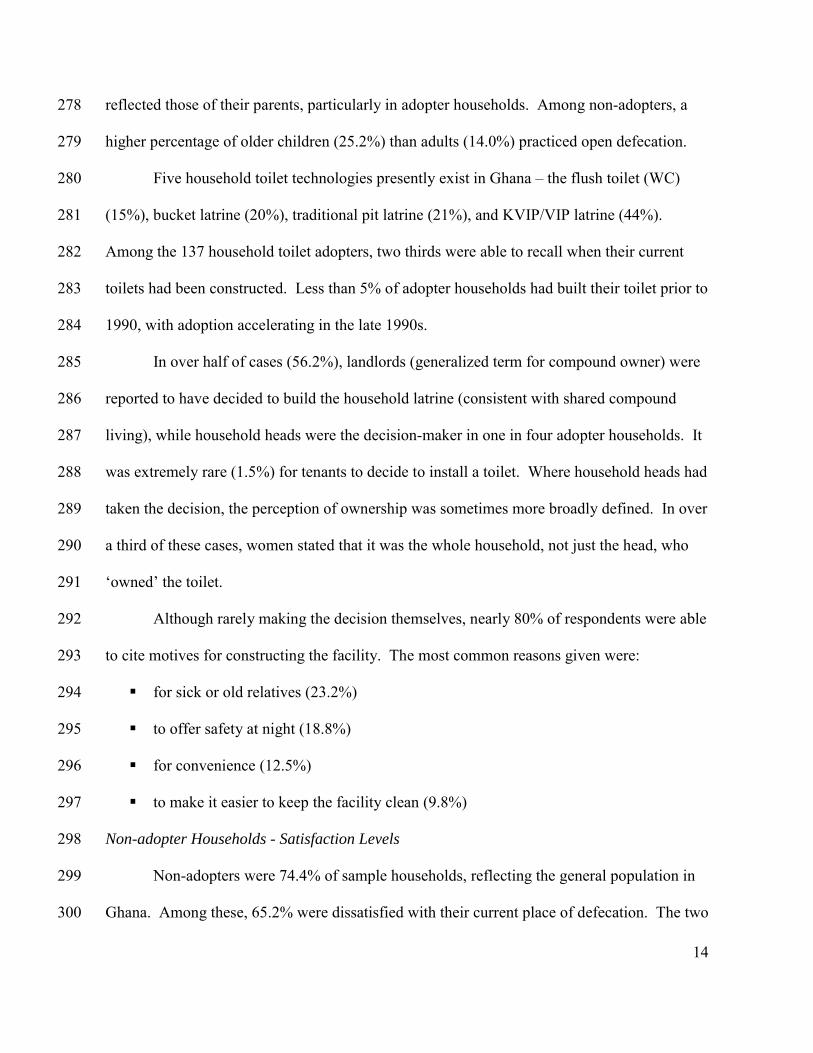
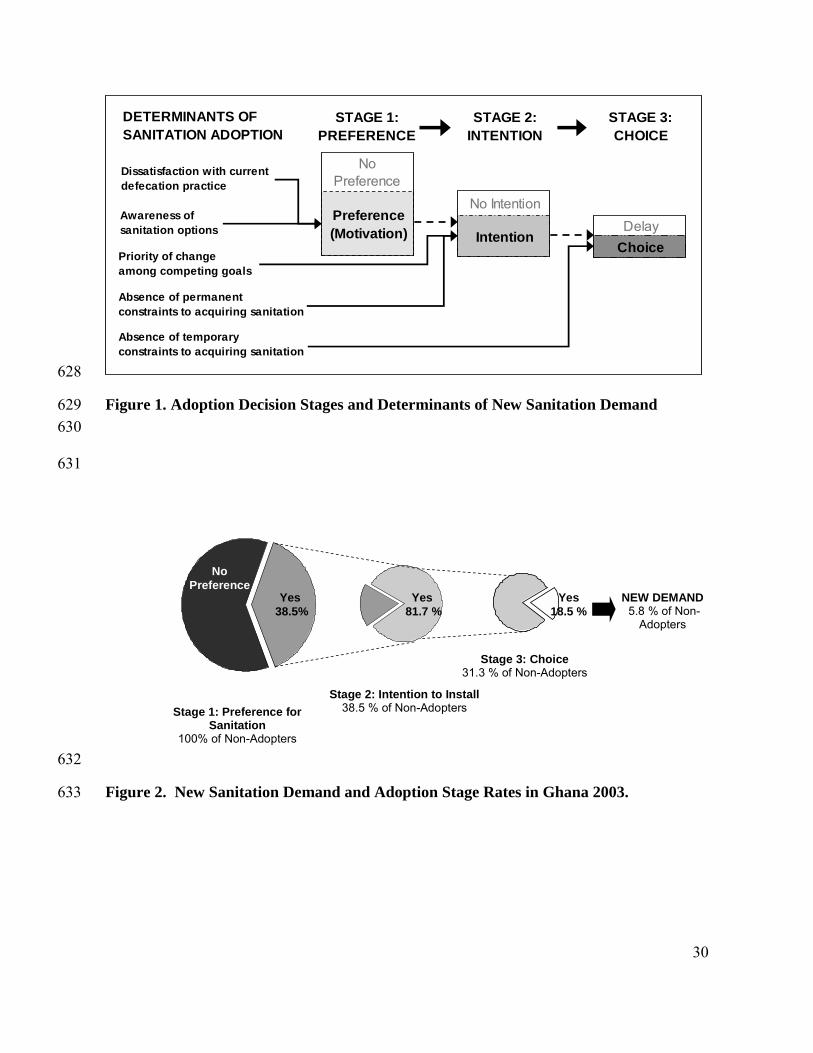
Determinants of New Demand in Ghana 334
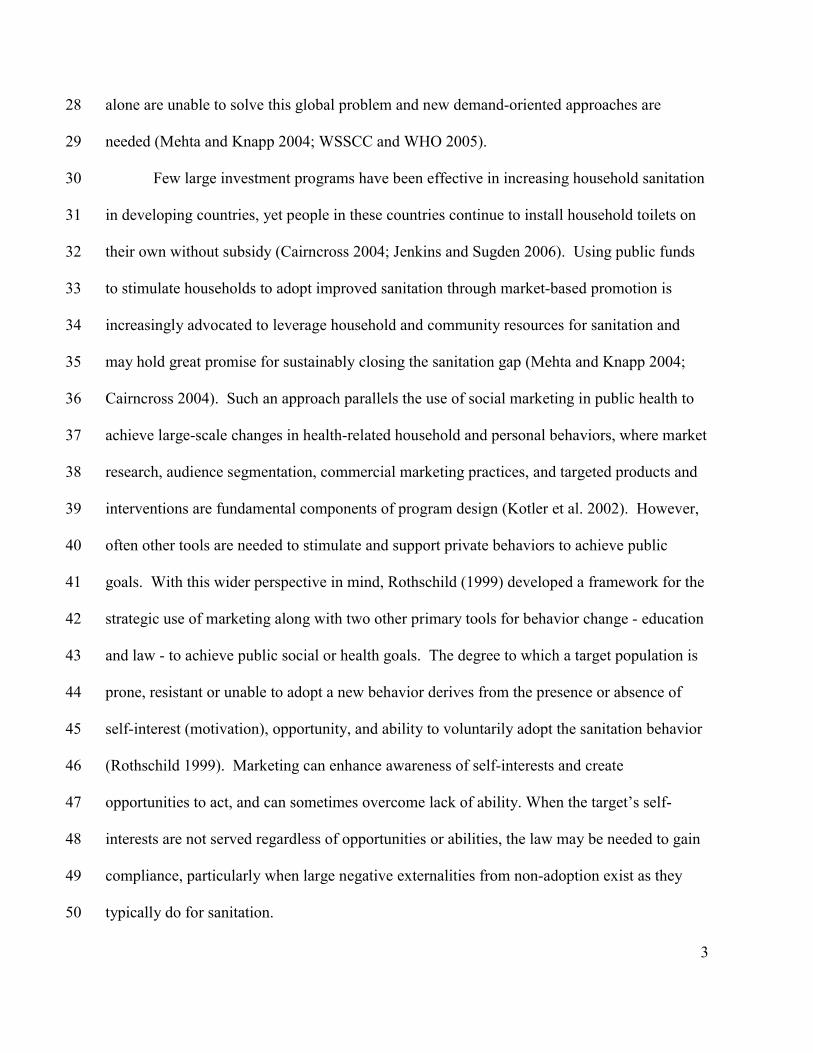
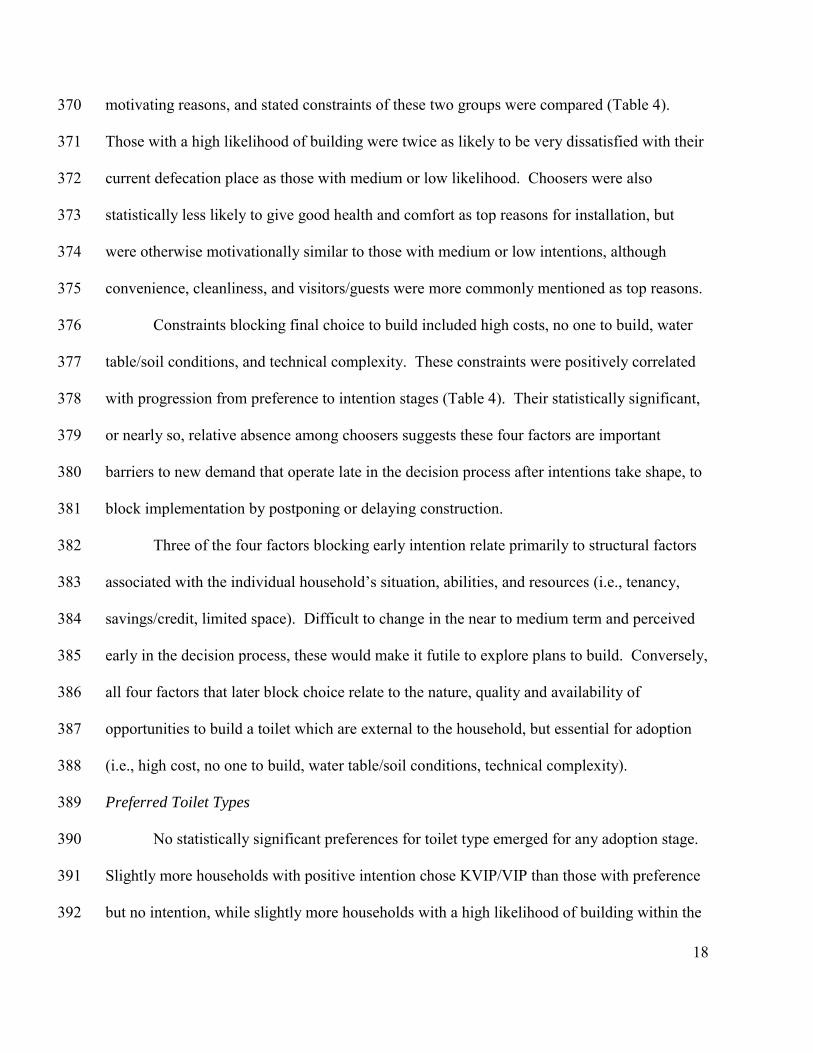
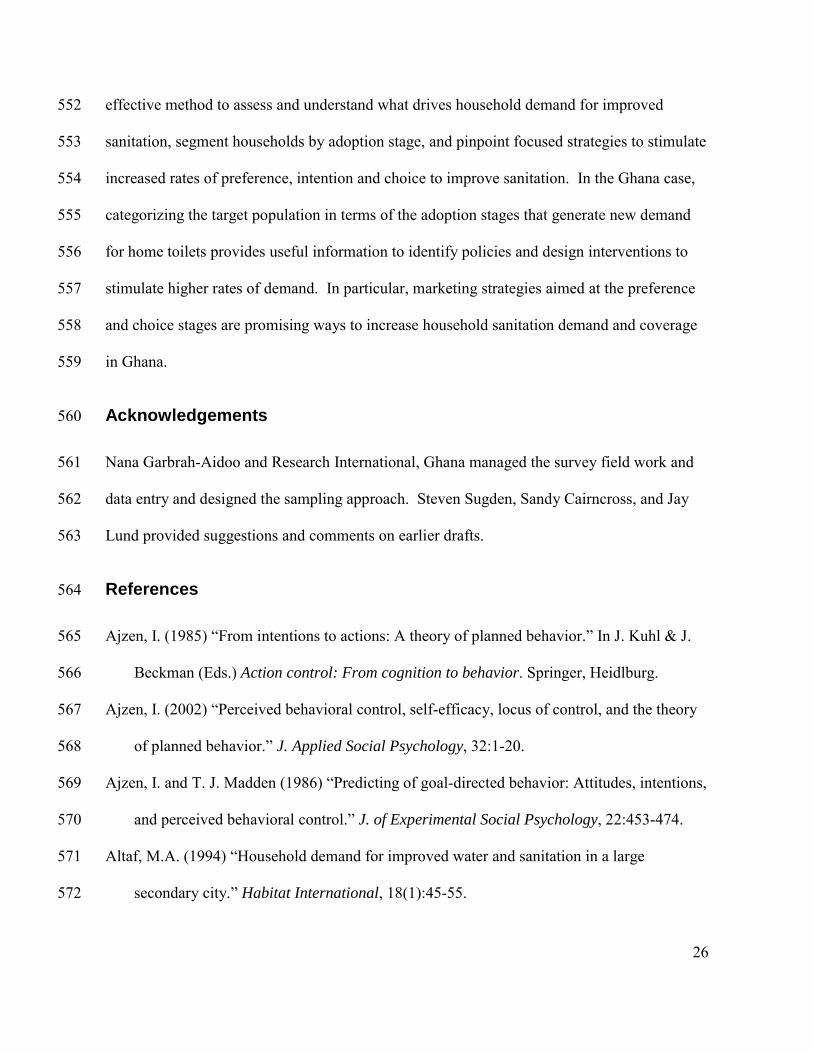
Among non-adopter households, most (61.7%) had never considered installing a 335
household toilet and therefore not yet entered the adoption process (Figure 2). Among those 336
with preference for installing a toilet (38.3%), rate of advancement to the intention stage was 337
high (81.7%), as measured by some likelihood of building a toilet in the next year. However, 338
of the sample of 399 non-adopter households, only 5.8% expressed a high likelihood of 339
building within the next 12 months, resulting in a low rate of new demand. The next sections 340
explore factors contributing to preference for toilet installation and to the likelihood of toilet 341
building in Ghana. 342
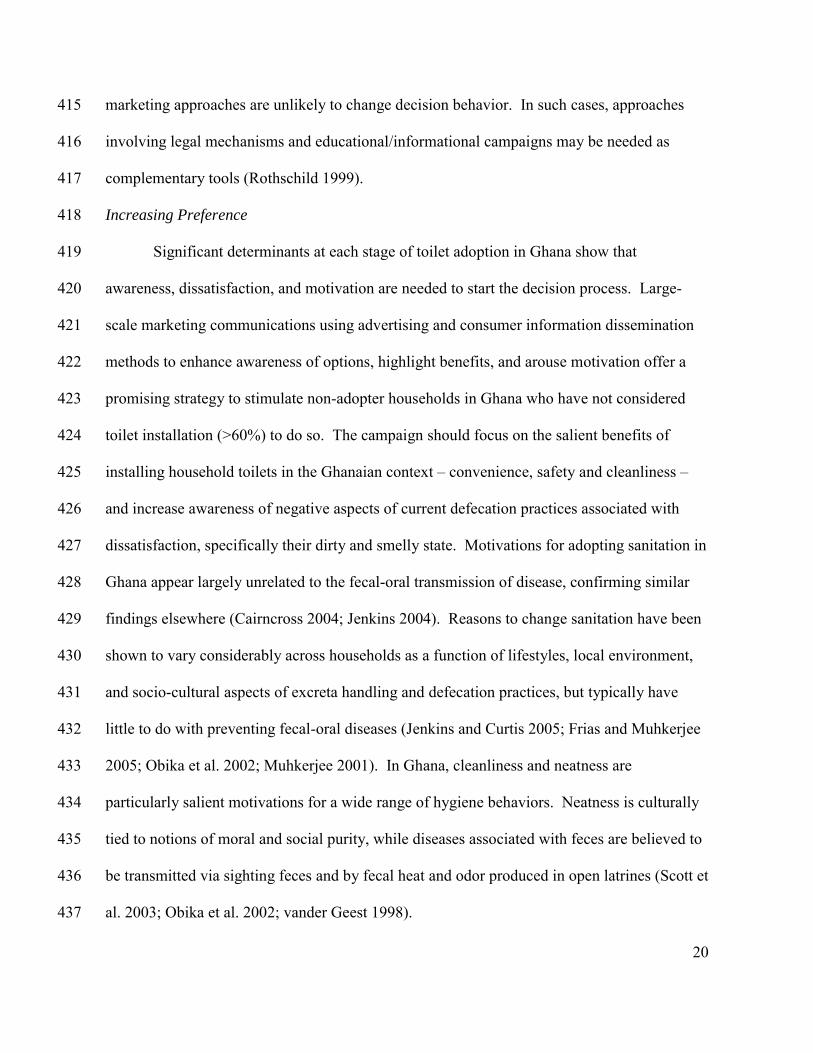
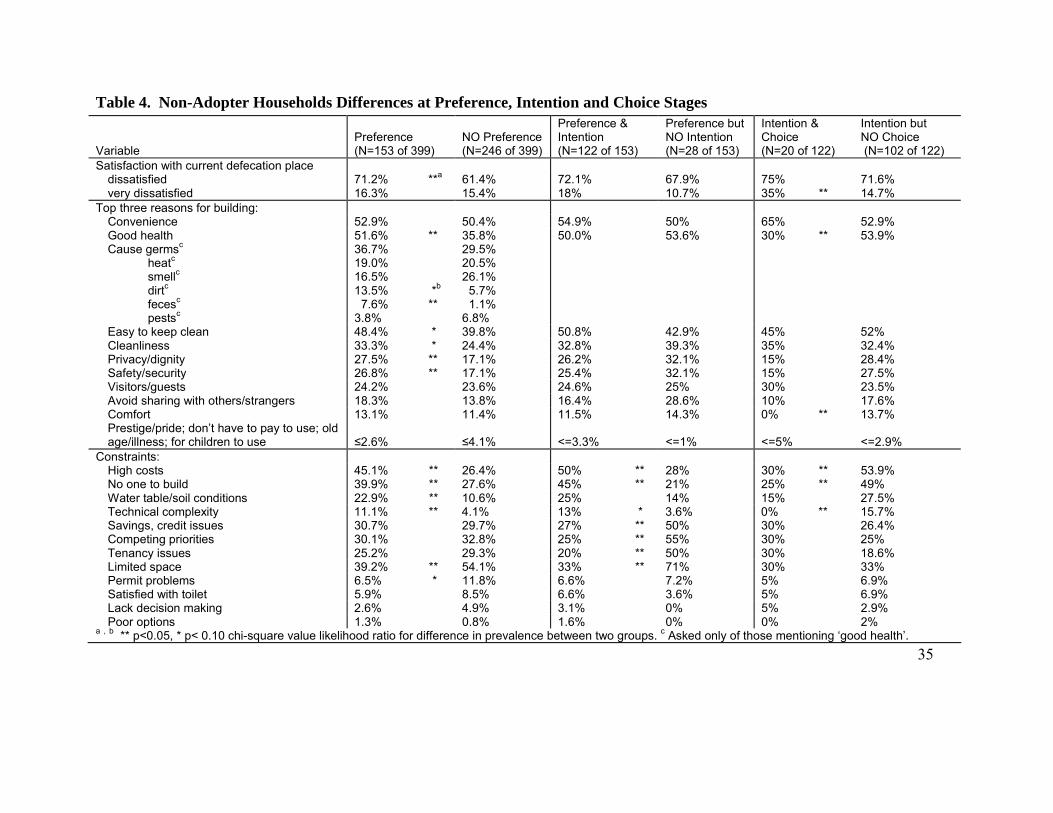
Households With Preference 343
Households who had considered installing a home toilet were less satisfied with their 344
current defecation place and stated significantly more reasons for building household toilets 345
than those who had not considered installing one. Such households were more likely to 346
17
mention six reasons: good health, ease of cleaning, cleanliness, privacy/dignity, 347
safety/security, and avoid sharing with others. Differences in dissatisfaction and their 348
tendency to cite reasons related to good health, privacy/dignity, and safety/security were 349
significant (p≤0.05), while the others were nearly so (Table 4). Those who had considered 350
installing sanitation and stated good health as a reason were significantly (p≤0.05) more likely 351
to say that feces was the cause of ill health than those stating good health who had not 352
considered installation. 353
Households With Intention 354
The likelihood of building a latrine, rated as ‘no chance, low, medium or high’, was 355
measured for the 153 non-adopter households who had considered installation. Of these, 356
nearly 4 of 5 expressed some positive intention to build within 12 months. No significant 357
differences in either satisfaction levels or motivation were found between those with and 358
without intention to build (Table 4) except for the statistically greater number of reasons for 359
building stated by intenders. As hypothesized in the adoption stages model and consistent 360
with planned behavior theory, significant differences between the two groups were only found 361
for constraints and priority. Those with no intention to build within 12 months were 2-2.5 362
times more likely to mention limited space (71% to 33%), competing priorities (55% to 25%), 363
savings/credit issues (50% to 27%), and tenancy issues (50% to 20%) than those with positive 364
intention, showing these constraints block the formation of intention. 365
Households Who Have Chosen to Build a Toilet 366
Only 1 in 6 of the 122 households with some intention to build in the next year said 367
they had a high likelihood of completing construction. The remaining 5 of 6 intender 368
households expressed medium or low likelihoods of completion. Satisfaction levels, 369
18
motivating reasons, and stated constraints of these two groups were compared (Table 4). 370
Those with a high likelihood of building were twice as likely to be very dissatisfied with their 371
current defecation place as those with medium or low likelihood. Choosers were also 372
statistically less likely to give good health and comfort as top reasons for installation, but 373
were otherwise motivationally similar to those with medium or low intentions, although 374
convenience, cleanliness, and visitors/guests were more commonly mentioned as top reasons. 375
Constraints blocking final choice to build included high costs, no one to build, water 376
table/soil conditions, and technical complexity. These constraints were positively correlated 377
with progression from preference to intention stages (Table 4). Their statistically significant, 378
or nearly so, relative absence among choosers suggests these four factors are important 379
barriers to new demand that operate late in the decision process after intentions take shape, to 380
block implementation by postponing or delaying construction. 381
Three of the four factors blocking early intention relate primarily to structural factors 382
associated with the individual household’s situation, abilities, and resources (i.e., tenancy, 383
savings/credit, limited space). Difficult to change in the near to medium term and perceived 384
early in the decision process, these would make it futile to explore plans to build. Conversely, 385
all four factors that later block choice relate to the nature, quality and availability of 386
opportunities to build a toilet which are external to the household, but essential for adoption 387
(i.e., high cost, no one to build, water table/soil conditions, technical complexity). 388
Preferred Toilet Types 389
No statistically significant preferences for toilet type emerged for any adoption stage. 390
Slightly more households with positive intention chose KVIP/VIP than those with preference 391
but no intention, while slightly more households with a high likelihood of building within the 392
19
year picked flush toilet than those stating medium and low likelihoods, but these differences 393
were not significant. 394
Discussion 395
The survey results, summarized in Table 5, support a model of three adoption stages 396
of preference, intention and choice as a practical tool for assessing demand for sanitation 397
among households in Ghana. Preference for changing sanitation is largely created by 398
dissatisfaction with current practices and good awareness of the benefits of home toilets in 399
Ghana. Intention to build is determined by positive preference, prioritization, and the absence 400
of structural constraints related to individual situational factors or abilities that may appear 401
insurmountable to the household. The final choice to install a toilet depends on the additional 402
access to appropriate opportunities to build, related to product choices, cost, building services, 403
soil conditions and access to good technical information and support. 404
High levels of dissatisfaction with one’s current defection place in the choice stage 405
suggest added urgency to put an existing plan into action. Trigger events such as an 406
embarrassing accident or missing an important school or work event due to queues at the 407
public toilets (Obika et al. 2002), or sudden sickness or deteriorated health of an aged parent, 408
may increase dissatisfaction with the household’s present defecation situation and raise 409
priority for a home toilet above other demands on household resources. 410
Strategies to Increase Sanitation Demand in Ghana 411
Strategically designed and targeted marketing and market-based interventions could 412
remove or reduce some barriers to adoption identified in Ghana. We discuss strategies to 413
increase demand for household toilets in Ghana at each adoption stage and examine where 414
20
marketing approaches are unlikely to change decision behavior. In such cases, approaches 415
involving legal mechanisms and educational/informational campaigns may be needed as 416
complementary tools (Rothschild 1999). 417
Increasing Preference 418
Significant determinants at each stage of toilet adoption in Ghana show that 419
awareness, dissatisfaction, and motivation are needed to start the decision process. Large-420
scale marketing communications using advertising and consumer information dissemination 421
methods to enhance awareness of options, highlight benefits, and arouse motivation offer a 422
promising strategy to stimulate non-adopter households in Ghana who have not considered 423
toilet installation (>60%) to do so. The campaign should focus on the salient benefits of 424
installing household toilets in the Ghanaian context – convenience, safety and cleanliness –425
and increase awareness of negative aspects of current defecation practices associated with 426
dissatisfaction, specifically their dirty and smelly state. Motivations for adopting sanitation in 427
Ghana appear largely unrelated to the fecal-oral transmission of disease, confirming similar 428
findings elsewhere (Cairncross 2004; Jenkins 2004). Reasons to change sanitation have been 429
shown to vary considerably across households as a function of lifestyles, local environment, 430
and socio-cultural aspects of excreta handling and defecation practices, but typically have 431
little to do with preventing fecal-oral diseases (Jenkins and Curtis 2005; Frias and Muhkerjee 432
2005; Obika et al. 2002; Muhkerjee 2001). In Ghana, cleanliness and neatness are 433
particularly salient motivations for a wide range of hygiene behaviors. Neatness is culturally 434
tied to notions of moral and social purity, while diseases associated with feces are believed to 435
be transmitted via sighting feces and by fecal heat and odor produced in open latrines (Scott et 436
al. 2003; Obika et al. 2002; vander Geest 1998). 437
21
Increasing Intention to Build 438
In Ghana, household situational constraints related to limited space, tenancy, and 439
savings were the main factors preventing households with positive preference for a home 440
toilet from forming an intention to build one. Tenant households in Ghana have little or no 441
control over the sanitation infrastructure where they live. Only two of the 76 tenant adopter 442
households said they had made the decision to build and only one indicated some claim to 443
ownership of the latrine. This explains the disproportionately higher fraction of non-adopter 444
households stalled at the preference stage who are tenants (55%) compared to the intention 445
stage (20%). Interestingly 100% of tenant households stated competing priorities as a main 446
reason for not building a toilet compared to just 5.6% of other non-adopter households. 447
Investigation of the variety of tenant occupancy patterns, tenant priorities, and how different 448
kinds of landlords make sanitation installation decisions in Ghana is warranted to understand 449
the unique sanitation access problems of non-owner households and identify strategies for this 450
distinct population segment. Tenancy in tenant-only houses is likely to create a housing 451
situation where marketing is ineffective in achieving sanitation improvements without legal 452
action to encourage landlords to add sanitation facilities to their properties. 453
Limited space is also a more complex constraint to overcome - it may require 454
development of new sanitation technologies and services before marketing can be applied. 455
Expression of this constraint is symptomatic of lack of pit emptying services in poor 456
urbanizing areas and of sanitation technologies that require excessive amounts of space, 457
relative to the cost and opportunity value of space in poorer dense neighborhoods and over-458
crowded slums. The bucket latrine with frequent and regular emptying service was a product-459
service package that worked well for decades for hundreds of thousands of Ghanaian 460
22
households who lacked space and capital, until national policy called for phasing them out 461
and public conservancy labor arrangements ended in many towns. In Tanzania, the 462
importance of pit emptying services for sustaining on-site urban sanitation has emerged as a 463
critical factor for adoption and maintenance of household toilets (Jenkins and Sugden 2006). 464
The savings constraint reflects two structural problems: real poverty and a lack of 465
financing and credit options for home improvement. Marketing is unlikely to be able to fully 466
address either of these and laws, public policies, and other mechanisms are required. 467
However, work in Vietnam is finding that development of flexible payment schemes can help 468
reduce savings difficulties related to the high initial cash cost of sanitation installation (Frias 469
and Mukherjee 2005). 470
Increasing Final Choice 471
Approximately 30% of non-adopter households in Ghana have begun planning to 472
install sanitation as shown by their positive intention to build. However 5 of 6 are stalled in 473
the process, failing to carry through their intention. Major reasons for failure to progress are 474
perceived high costs of toilet options, no one to build, the complexity of building related to 475
lack of information, and water table and soil problems. These constraints to new demand 476
could be addressed by actions to improve the quality, range, and costs of toilet technologies 477
offered in the market place, innovative ways and incentives to extend the private sector supply 478
chain of these products and related services (e.g. vault or pit emptying) needed to build, 479
operate, and maintain toilets closer to these households, and sales promotion and product 480
education and marketing to reduce households’ transaction time and effort costs involved in 481
searching for good information about technologies and how to get them built; product, place, 482
price and sales promotion comprising the four basic ‘Ps’ of a marketing plan (Kolter et al 483
23
2003). 484
Sanitation Gains using Marketing Strategies 485
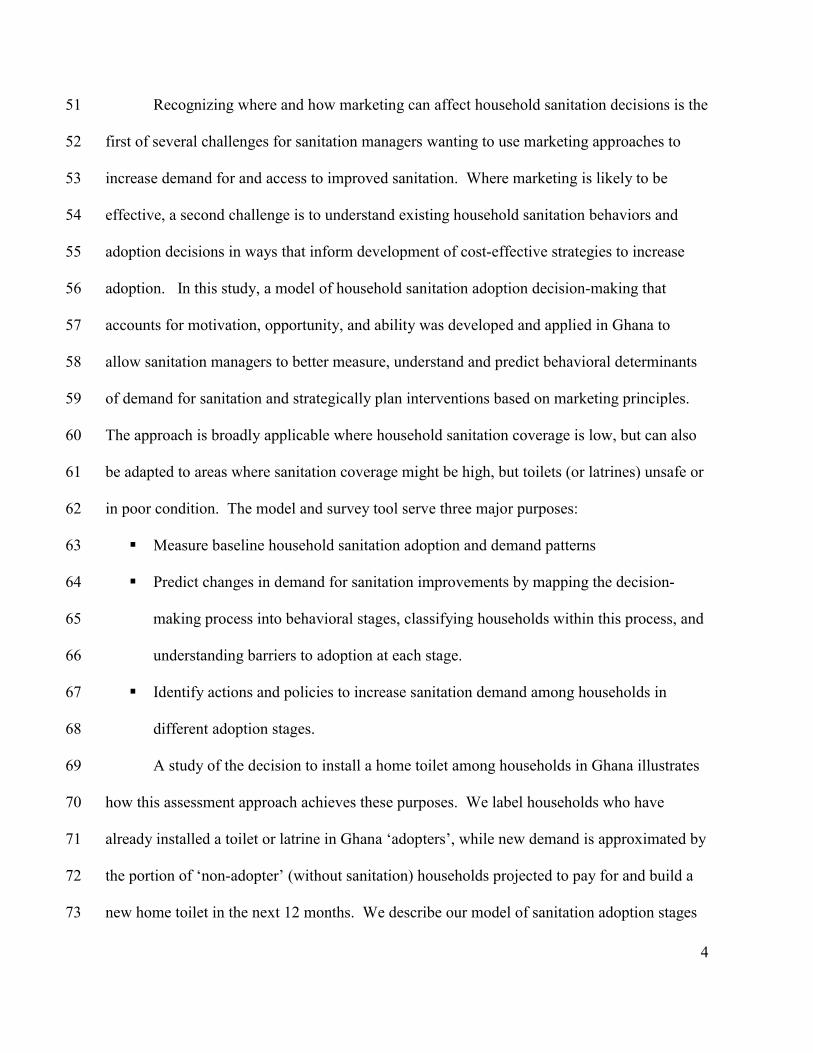
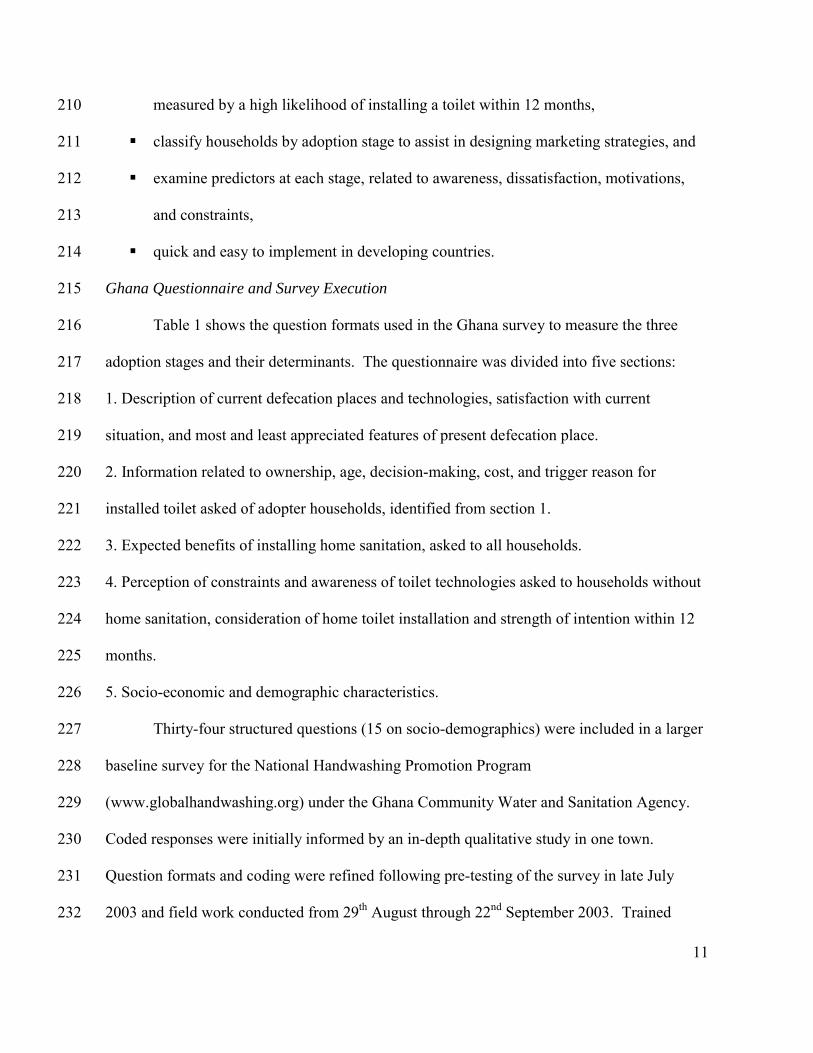
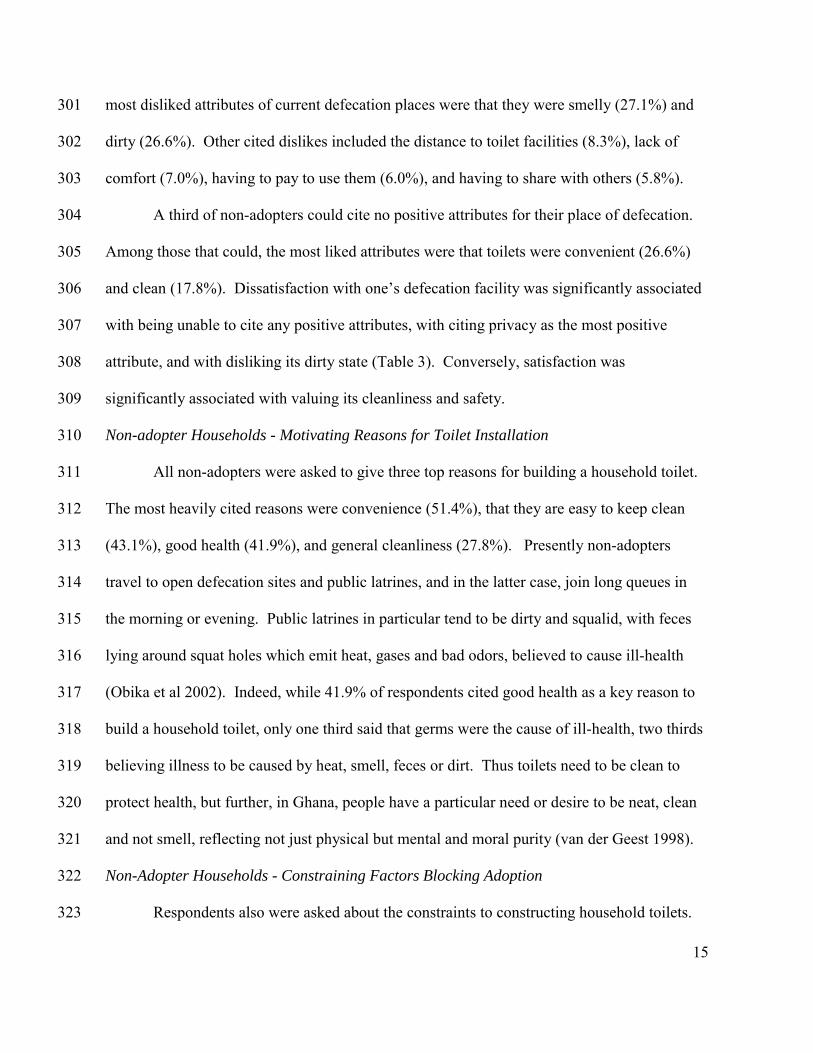
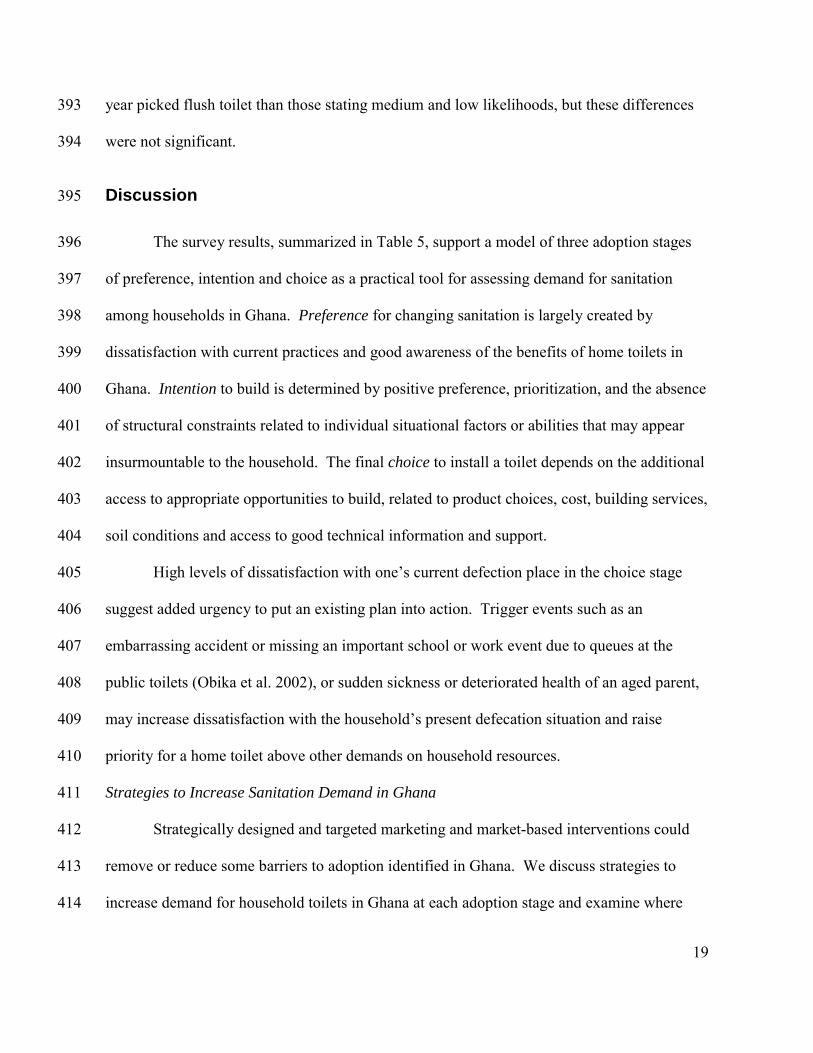
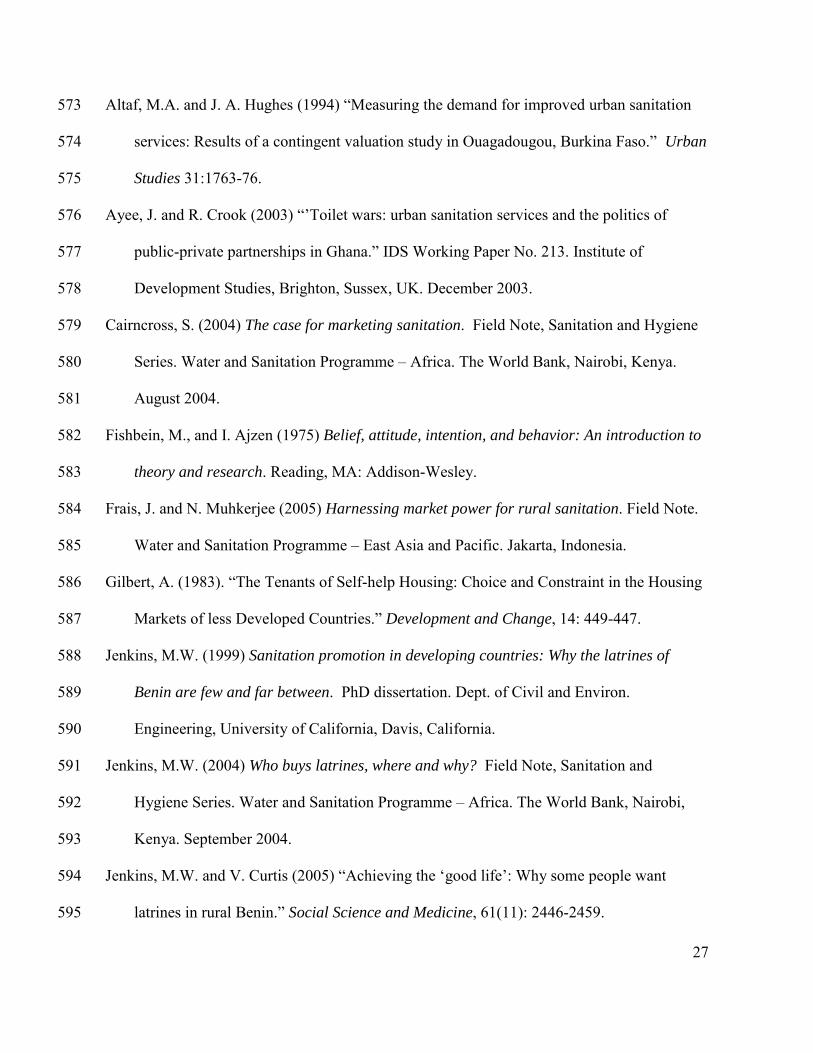
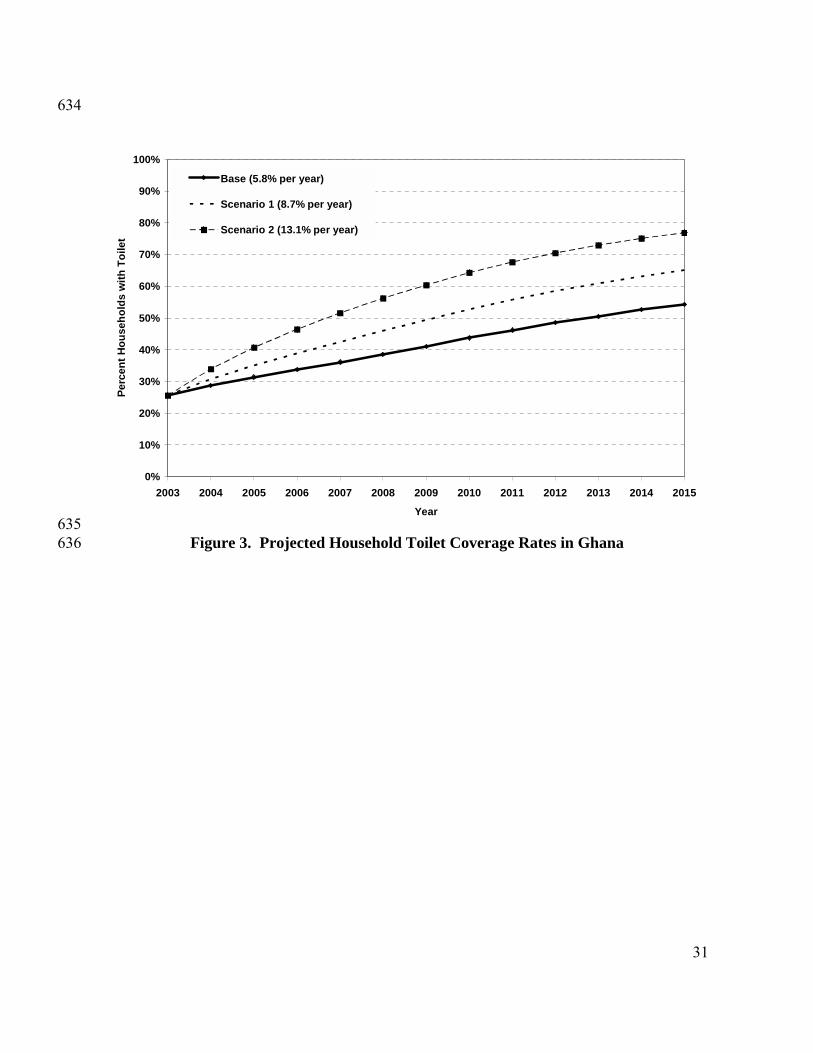
Projections to 2015 were made for Ghana to examine sanitation access scenarios in 486
light of development goals and the potential gains from marketing strategies emerging from 487
this national demand assessment. Assuming a uniform annual rate of new household toilet 488
adoption at 5.8% of non-adopter households, 100% maintenance of installed household 489
facilities, phasing out bucket latrines by 2010, current housing patterns, and a population 490
growth rate of 1.9%, calculations indicate home toilet access in Ghana would rise from 25.6% 491
of households in 2003 to 54.3% by 2015 (Figure 3) without additional action. How much 492
would proposed marketing strategies to reduce blockages at the preference and choice stages 493
be expected to increase adoption rates and coverage? 494
2015 projections for two marketing scenarios were compared to the “no action” base 495
case. Scenario 1 assumes a national advertising and communications campaign raises 496
household awareness and interest in home toilet installation and increases the rate of 497
preference (those who have considered installing a toilet) by 50% (from 38.5% to 57.8% of 498
non-adopter households). No actions to change the base rates of intention and choice are 499
assumed. Scenario 1 increases adoption rates to 8.7% per year and achieves 65% projected 500
sanitation access by 2015. Scenario 2 adds a mix of marketing strategies to scenario 1 to 501
reduce barriers and increase the rate of choice in the last stage of adoption by 50% (from 502
18.5% to 27.8% of intenders). Again, no change is made to the intention rate, determined 503
largely by constraints which marketing may be ineffective at addressing. Combining the 504
changed rates of preference and choice, Scenario 2 yields a 13.1% annual rate of adoption and 505
projected 77% sanitation access by 2015, achieving an estimated 1.2 million more households 506
24
or 5.8 million more people with home sanitation by 2015 over the baseline in Ghana. 507
Although these projections reflect the simplified assumptions of a static adoption rate and 508
instantaneous effects, they illustrate the causal pathways by which marketing strategies work 509
to accelerate adoption rates above baseline trends. 510
Segmenting Households 511
This analysis reveals how population sub-groups blocked at the intention stage would 512
remain without access to a home toilet unless other non-market-based actions and policies 513
were developed to address constraints of extreme poverty and tenancy that block home toilet 514
installation in Ghana. Consumer segmentation is a fundamental planning tool in marketing, 515
whereby the target population is divided into more manageable homogenous segments for 516
which a specific mix of marketing activities can be developed. A core implication of our 517
sanitation adoption decision model and this analysis is the need for different interventions at 518
different stages in the adoption process. Programs may choose to design a set of strategies 519
that target only one adoption stage, or all of them, but one blanket intervention for everyone is 520
unlikely to work. Using a behavioral approach to assess demand allows managers to work out 521
where most of their target population lies in the adoption process and how vulnerable sub-522
groups compare to the majority, enabling development of actions that target barriers at each 523
adoption stage for any population segment of interest. 524
Limitations and Recommendations 525
Response rates and reliability for some questions in the Ghana survey would have 526
been improved by interviewing the person in each household responsible for decisions about 527
building or improving housing facilities. One third of the women respondents in this survey 528
were unable to say when their toilets were built and over twenty percent unable to say why 529
25
they had been built because they were not the decision-maker. Nonetheless, the results 530
indicate that mothers in Ghana in most households participate in infrastructure decisions 531
sufficiently to be able to answer many of the questions related to future toilet acquisition and 532
demand. 533
Prior to adapting the survey for another setting or context, a small qualitative study 534
using in-depth interviews or focus group discussions is required to establish sensible codes for 535
questions related to motivations, constraints, toilet types and preferred attributes. We were 536
able to draw from a recent qualitative study of these issues and supplement it with pilot-537
testing. 538
Overall, the survey was relatively straightforward to conduct and took about 20 539
minutes to administer. It required no additional training or skills beyond those of personnel 540
trained and experienced in quantitative household survey methods and sampling techniques 541
and familiar with the project population. An experienced market research agency was able to 542
conduct the field work with oversight developing the questionnaire and coding schemes, and 543
pilot testing. 544
Conclusions 545
Findings from a national survey to assess sanitation demand in Ghana fit a preference-546
intention-choice behavioral decision model of household sanitation adoption. Results show 547
how satisfaction with existing defecation practices, motivations for improving sanitation, 548
priority over competing household concerns, situational and implementation-related 549
constraints affect preference for and likelihood of household toilet installation and create new 550
demand for sanitation in Ghana. This survey-based behavioral approach provides a quick and 551
26
effective method to assess and understand what drives household demand for improved 552
sanitation, segment households by adoption stage, and pinpoint focused strategies to stimulate 553
increased rates of preference, intention and choice to improve sanitation. In the Ghana case, 554
categorizing the target population in terms of the adoption stages that generate new demand 555
for home toilets provides useful information to identify policies and design interventions to 556
stimulate higher rates of demand. In particular, marketing strategies aimed at the preference 557
and choice stages are promising ways to increase household sanitation demand and coverage 558
in Ghana. 559
Acknowledgements 560
Nana Garbrah-Aidoo and Research International, Ghana managed the survey field work and 561
data entry and designed the sampling approach. Steven Sugden, Sandy Cairncross, and Jay 562
Lund provided suggestions and comments on earlier drafts. 563
References 564
Ajzen, I. (1985) “From intentions to actions: A theory of planned behavior.” In J. Kuhl & J. 565
Beckman (Eds.) Action control: From cognition to behavior. Springer, Heidlburg. 566
Ajzen, I. (2002) “Perceived behavioral control, self-efficacy, locus of control, and the theory 567
of planned behavior.” J. Applied Social Psychology, 32:1-20. 568
Ajzen, I. and T. J. Madden (1986) “Predicting of goal-directed behavior: Attitudes, intentions, 569
and perceived behavioral control.” J. of Experimental Social Psychology, 22:453-474. 570
Altaf, M.A. (1994) “Household demand for improved water and sanitation in a large 571
secondary city.” Habitat International, 18(1):45-55. 572
27
Altaf, M.A. and J. A. Hughes (1994) “Measuring the demand for improved urban sanitation 573
services: Results of a contingent valuation study in Ouagadougou, Burkina Faso.” Urban 574
Studies 31:1763-76. 575
Ayee, J. and R. Crook (2003) “’Toilet wars: urban sanitation services and the politics of 576
public-private partnerships in Ghana.” IDS Working Paper No. 213. Institute of 577
Development Studies, Brighton, Sussex, UK. December 2003. 578
Cairncross, S. (2004) The case for marketing sanitation. Field Note, Sanitation and Hygiene 579
Series. Water and Sanitation Programme – Africa. The World Bank, Nairobi, Kenya. 580
August 2004. 581
Fishbein, M., and I. Ajzen (1975) Belief, attitude, intention, and behavior: An introduction to 582
theory and research. Reading, MA: Addison-Wesley. 583
Frais, J. and N. Muhkerjee (2005) Harnessing market power for rural sanitation. Field Note. 584
Water and Sanitation Programme – East Asia and Pacific. Jakarta, Indonesia. 585
Gilbert, A. (1983). “The Tenants of Self-help Housing: Choice and Constraint in the Housing 586
Markets of less Developed Countries.” Development and Change, 14: 449-447. 587
Jenkins, M.W. (1999) Sanitation promotion in developing countries: Why the latrines of 588
Benin are few and far between. PhD dissertation. Dept. of Civil and Environ. 589
Engineering, University of California, Davis, California. 590
Jenkins, M.W. (2004) Who buys latrines, where and why? Field Note, Sanitation and 591
Hygiene Series. Water and Sanitation Programme – Africa. The World Bank, Nairobi, 592
Kenya. September 2004. 593
Jenkins, M.W. and V. Curtis (2005) “Achieving the ‘good life’: Why some people want 594
latrines in rural Benin.” Social Science and Medicine, 61(11): 2446-2459. 595
28
Jenkins, M.W. and S. Sugden (2006) “Rethinking Sanitation: Lessons and Innovation for 596
Sustainability and Success in the New Millenium.” Sanitation Thematic Paper, UNDP 597
Human Development Report 2006. UNDP HDRO, New York. January 2006. 598
Kotler. P., G. Armstrong, J. Saunders and V. Wong (2002) Principles of Marketing. Prentice 599
Hall Press, 3rd Edition, NY. 600
Metha, M and A. Knapp (2004) The challenge of financing sanitation for meeting the 601
Millennium Development goals. Commissioned paper for the Commission on 602
Sustainable Development. Norwegian Ministry of the Environment. Water and Sanitation 603
Programme – Africa, The World Bank, Nairobi, Kenya. March 5, 2004. 604
Mukherjee, N. (2001) Achieving sustained sanitation for the poor: Policy lessons from 605
participatory assessments in Cambodia, Indonesia and Vietnam. Field Note. Water and 606
Sanitation Program - East Asia and the Pacific, Jakarta, Indonesia. 607
Obika, A., M. Jenkins, V. Curtis, G. Howard, and TREND (2002) Social marketing for urban 608
sanitation: Review of evidence and inception report. Water, Engineering and 609
Development Centre, Loughborough University, Lourghborough, UK. October 2002. 610
Rakodi, C. (1995) “Rental Tenure in the Cities of Developing Countries.” Urban Studies 611
32(4-5):791-811. 612
Rothschild, M. L. (1999) “Carrots, Sticks, and Promises: A Conceptual Framework for the 613
Management of Public Health and Social Issue Behaviors.” J. of Marketing, 63:24-37. 614
Scott, B., V. Curtis, T. Rabie, N. Garbrah-Aidoo, and Research International (2002) What 615
Motivates Handwashing in Ghana? A Re-analysis of the Results of the Formative 616
Research. Available at: 617
UNCHS (1996) An Urbanizing World: Global Report on Human Settlements 1996. Oxford: 618
29
Oxford University Press. 619
vander Geest, S.J. (1998) “Akan Shit: Getting Rid of Dirt in Ghana.” Anthropology Today, 620
14(3): 8-12. 621
WHO and UNICEF (2004) Meeting the MDG drinking water and sanitation target: A mid-622
term assessment of progress, 2004. WHO/UNICEF JMP for Water Supply and 623
Sanitation, The World Health Organization, Geneva, Switzerland. 624
Wittington, D., D.T. Lauria, A.M. Wright, K. Choe, J.A. Huges, and V. Swarma (1993) 625
“Household demand for improved sanitation services in Kumasi, Ghana: A contingent 626
valuation study.” Water Resources Research, 29(6): 1539-1560. 627
30
Preference (Motivation) Intention
Choice
Awareness of sanitation options
Dissatisfaction with current defecation practice
Absence of temporary constraints to acquiring sanitation
Absence of permanentconstraints to acquiring sanitation
Priority of change among competing goals
No Intention
No Preference
Delay
DETERMINANTS OF SANITATION ADOPTION
STAGE 1:PREFERENCE
STAGE 2:INTENTION
STAGE 3:CHOICE
628
Figure 1. Adoption Decision Stages and Determinants of New Sanitation Demand 629 630
631
No Preference
Yes 81.7 %
Yes 38.5%
Yes 18.5 %
Stage 1: Preference for Sanitation
100% of Non-Adopters
Stage 2: Intention to Install38.5 % of Non-Adopters
Stage 3: Choice 31.3 % of Non-Adopters
NEW DEMAND 5.8 % of Non-
Adopters
632
Figure 2. New Sanitation Demand and Adoption Stage Rates in Ghana 2003.633
31
634
0%
10%
20%
30%
40%
50%
60%
70%
80%
90%
100%
2003 2004 2005 2006 2007 2008 2009 2010 2011 2012 2013 2014 2015
Year
Perc
ent H
ouse
hold
s w
ith T
oile
t
Base (5.8% per year)
Scenario 1 (8.7% per year)
Scenario 2 (13.1% per year)
635 Figure 3. Projected Household Toilet Coverage Rates in Ghana 636
32
Table 2. Sample Description Socioeconomic Category Characteristic
N=536 Respondent’s Age Range: 17-68 Mean: 30 (SD 6.51) Region Greater Accra 21.9%
Ashanti 27.3% Eastern 15.7% Western 16.3% Northern 18.7%
Ethnicity Akan 53% Ga/Adangbe 17% Ewe 6% Mole-Dagbani 16% Other 8%
Respondent’s Education None 27.1% Primary 28.4% Junior Secondary 31.9% Senior Secondary 11.8% University 0.9%
Dwelling Type Compound (50.8%) One Family (26.2%) Flat/Apartment (3.4%) Room(s) (20.2%)
Father’s Occupation Professional (20.1%) Sales/Commerce (12.5%) Services (17.7%) Trader (4.1%) New Trade (4.1%) Agriculture (24.8%) Unemployed (1.9%) Father Absent (14.6%)
Income <250k Cedis (34.7%) 251-500k (35.1%) 501-900k (20.0%) 901k + (11.2%)
33
Table 3. Most and Least Liked Attributes of Current Defecation Place (Non-Adopter Households) Satisfied
N=139 (34.8%) Unsatisfied N=260 (65.2%)
Most Valued Attribute
(% citing)
Nothing 7.2 47.7 (0.00)* Cleanliness 41.0 5.4 (0.00) Privacy 2.2 6.9 (0.03) Safety 5.0 1.5 (0.05) Good Health 7.9 3.8 (0.10) Comfort 4.3 1.5 (0.10) Convenience 28.8 25.4 (ns) Get to work/school on time 3.6 5.0 (ns) Least Liked Attribute
Dirty 14.4 33.1 (0.00) Pay to use 12.9 2.3 (0.00) Distance 12.9 5.8 (0.02) Share with others 9.4 3.8 (0.03) Hard to maintain 0.7 3.1 (0.10) Lack of comfort 4.3 8.5 (0.11) None 7.9 5.0 (0.25) Smell 25.9 27.7 (ns) Queuing 5.0 3.5 (ns) Fills up quickly/difficult to empty 2.2 2.7 (ns) * chi-squared p-value for log likelihood ratio comparing “Satisfied” with “Unsatisfied”
Table 5. Households Without Home Sanitation by Adoption Stage in Ghana Decision Stage Factors Blocking Decision to Adopt Improved Sanitation Preference lack of awareness of benefits of household toilet
weak or few motivations satisfaction with existing defecation practice
Intention lack of preference lack of priority or competing priorities permanent constraints related to individual situation, including: limited space,
tenancy issues, credit and savings difficulties Choice lack of preference and intention
satisfaction with existing place temporary constraints related to opportunities: high cost, no one to build,
water/soil conditions, and technical complexity
34
Table 1. Question Formats, Stage Indicators and Determinants for Measuring Sanitation Demand
P I C P I C1 Have you considered installing a household toilet? “YES” /”NO” x yes2 Have you ever discussed the idea of building a toilet with members of your household?
“YES”/”NO” x no3 Reason stated for never considered: “SATISFIED WITH CURRENT PLACE” x yes4 How satisfied are you with your current place of defection? “VERY SATISFIED, SATISFIED,
UNSATISFIED, VERY UNSATISFIED” x yes5 What are the top three reasons for building a household toilet/latrine? x yes6 Reason stated for starting a plan to build? x no7 Reason stated for no plan: “NEVER CONSIDERED” x no8 For those who have considered, what is the likelihood that if I come back in a year you will have
a latrine built? “HIGH, MEDIUM, LOW vs. NONE” x yes9 What are the three biggest constraints to your installing a household toilet/latrine? (absence of
most permanent constraints, e.g., don’t have space, tenancy issues, poverty) x yes10 Mention in answer to Q9: “COMPETING PRIORITIES” x yes11 Mention in answer to Q9: “SATISFIED WITH CURRENT DEFECTION PLACE” x yes12 What types of latrines do you know of? x yes13 Of those who have considered, likelihood HIGH that if I come back in a year you will have a
latrine built x yes14 Have you started saving? Have you chosen type of toilet to build? x no15 What are the three biggest constraints to your installing a household toilet/latrine? (absence of
permanent and most temporary constraints) x yes16 How much will it cost you? Have you found a mason? x no
Included in Ghana Survey
Notes: P = Perference, I = Intention, and C = Choice
Decision Stage Indicator
Decision Stage DeterminantExample Survey Question Formats
35
Table 4. Non-Adopter Households Differences at Preference, Intention and Choice Stages Variable
Preference (N=153 of 399)
NO Preference (N=246 of 399)
Preference & Intention (N=122 of 153)
Preference but NO Intention (N=28 of 153)
Intention & Choice (N=20 of 122)
Intention but NO Choice (N=102 of 122)
Satisfaction with current defecation place dissatisfied 71.2% **a 61.4% 72.1% 67.9% 75% 71.6% very dissatisfied 16.3% 15.4% 18% 10.7% 35% ** 14.7% Top three reasons for building:
Convenience 52.9% 50.4% 54.9% 50% 65% 52.9% Good health Cause germsc heatc smellc dirtc fecesc pestsc
51.6% ** 36.7% 19.0% 16.5% 13.5% *b 7.6% ** 3.8%
35.8% 29.5% 20.5% 26.1% 5.7% 1.1% 6.8%
50.0% 53.6% 30% ** 53.9%
Easy to keep clean 48.4% * 39.8% 50.8% 42.9% 45% 52% Cleanliness 33.3% * 24.4% 32.8% 39.3% 35% 32.4% Privacy/dignity 27.5% ** 17.1% 26.2% 32.1% 15% 28.4% Safety/security 26.8% ** 17.1% 25.4% 32.1% 15% 27.5% Visitors/guests 24.2% 23.6% 24.6% 25% 30% 23.5% Avoid sharing with others/strangers 18.3% 13.8% 16.4% 28.6% 10% 17.6% Comfort 13.1% 11.4% 11.5% 14.3% 0% ** 13.7% Prestige/pride; don’t have to pay to use; old age/illness; for children to use
≤2.6%
≤4.1%
<=3.3%
<=1%
<=5%
<=2.9%
Constraints: High costs 45.1% ** 26.4% 50% ** 28% 30% ** 53.9% No one to build 39.9% ** 27.6% 45% ** 21% 25% ** 49% Water table/soil conditions 22.9% ** 10.6% 25% 14% 15% 27.5% Technical complexity 11.1% ** 4.1% 13% * 3.6% 0% ** 15.7% Savings, credit issues 30.7% 29.7% 27% ** 50% 30% 26.4% Competing priorities 30.1% 32.8% 25% ** 55% 30% 25% Tenancy issues 25.2% 29.3% 20% ** 50% 30% 18.6% Limited space 39.2% ** 54.1% 33% ** 71% 30% 33% Permit problems 6.5% * 11.8% 6.6% 7.2% 5% 6.9% Satisfied with toilet 5.9% 8.5% 6.6% 3.6% 5% 6.9% Lack decision making 2.6% 4.9% 3.1% 0% 5% 2.9% Poor options 1.3% 0.8% 1.6% 0% 0% 2%
a , b ** p<0.05, * p< 0.10 chi-square value likelihood ratio for difference in prevalence between two groups. c Asked only of those mentioning ‘good health’.

36