2018 Annual Report - Naval Safety Center
78
2 2018 Annual Report
Transcript of 2018 Annual Report - Naval Safety Center
2
2018 Annual Report
Message from the Commander As we finish the year, the Safety Center is transforming itself from a rudimentary analytic organization to one that is providing advanced analytics and sophisticated modeling data to provide a forward-looking assessment of risk that can be used to prevent future mishaps. We also reshaped part of our existing workforce into the Knowledge Management and Safety Promotions Directorate to share data and analysis across aviation, afloat, shore, and expeditionary communities. This restructuring will provide better safety studies and analysis to the Fleet and Marine Corps, from senior leaders all the way down to our junior Sailors and Marines.
We lose too many of our people each year to mishaps and thousands more are injured. We cannot continue to operate under the banner of business as usual. We must reinforce a culture of safety and foster an environment that encourages risk management, problem solving, and proactive thinking. We need to move from a culture of compliance to a culture of excellence in safety. This requires a sense of urgency in everything we do, a focused action to deliver safe outcomes, saving lives and preserving readiness. The Navy and Marine Corps must invigorate our level of safety awareness by focusing on four key themes: be a safety leader, report areas where we can improve, recognize that cutting corners costs lives, and improve readiness by reducing mishaps. As we focus on the upcoming year, please talk with your teammates about risks involved in tasks on the job and in off-duty activities. Help us create a culture of safety in everything we do.
Themes • Every Sailor, Marine, and civilian cares enough to be a safety leader - Sailors, Marines and civilians
who execute the standards, speak up when they see something unsafe, and practice solid riskmanagement, are leaders at every level and the backbone of a culture of excellence with the unit andthroughout the DON.
• Reporting helps us learn and prevent – Reporting all mishaps, hazards, and near misses is how welearn and prevent future mishaps from occurring. The main limiting factor to what we can learn fromanalytics is accuracy of reporting. Developing a culture of transparent and accurate reporting is key tosaving lives and resources, and preserving our combat readiness.
• Cutting corners costs lives – Normalization of deviation occurs when shortcuts are taken and allowedto become the standard. Every Sailor, Marine and civilian has the right and the obligation to speak upwhen corners are cut.
• Reducing mishaps improve readiness – Mishaps mean more work and fewer resources for everyone.When material resources are scarce and operational tempo is high, risk management is a requirement toreadiness.
As the year progresses, the Naval Safety Center will continue to improve our forward looking assessment of risk to help the entire fleet prevent mishaps and protect our most valued resource – our Sailors and Marines. Know that we are your safety advocate.
Mark L. Leavitt Rear Admiral, United State Navy Commander, Naval Safety Center
Contents Introduction 1 Major Safety Assurance Issues 2 Status of Class A Mishap Investigations, Recommendations 3 Outstanding MISRECs 5 Aviation FY18 Class A and B mishaps 7 FY18 Class C mishaps 9 FY18 Trends in Aviation Facilities 10 FY18 Physiological Episodes 10 FY18 Aviation Analysis by Community 11
2 and C-2 E- 11 C/KC-130 and C-40 14 Light Transports 17 Maritime Patrol and Reconnaissance Aircraft 19 TACAMO 21 F/A-18A-F and EA-18G 22
35 F- 26 Fixed Wing Training Series 30 AV-8B 34
F-5 and F-16 36 MV-22 39 MH/CH-53 42
60 H- 45 UH-1 and AH-1 49 TH-57 51 Unmanned Aerial Systems 53
FY18 Trends in Squadron/Unit Aviation Safety Assessments 54 FY18 Aviation Directorate Studies 56 Lessons Learned and Sanitized Safety Investigation Report 56 Ashore Shore/Ground Class A Mishaps 57 Civilian Lost Workdays 58 Open Deficiencies 59 OSHA Citations 60 Off-Duty Recreational Fatalities 61 2-Wheel (PMV2) Fatalities (Motorcycles) 61 4-Wheel PMV (PMV4) Fatalities 62 FY18 Shore Directorate Studies 63 Lessons Learned and Sanitized Safety Investigation Reports 64
65 65
Afloat Dynamic Assessments FY18 Mishap Trends and Reporting FY18 Afloat Directorate Studies 68 Lessons Learned and Sanitized Safety Investigation Reports 70
71 71 72
Expeditionary Dive/Jump/EOD Items of Interest FY18 Expeditionary Directorate Accomplishments Expeditionary Operational Safety Assessments (EOSA) USMC Ground 73 Lessons Learned and Sanitized Safety Investigation Reports 73
THIS PAGE INTENTIONALLY LEFT BLANK
1
Introduction This annual mishap overview contains a spectrum of measures of how the Navy and Marine Corps fared during FY18. The true picture, however, is composed of a myriad of details that provide a clearer understanding of the year’s trends. Class A mishaps get the most attention, but many key pieces of the mishap puzzle exist below that level. These nuts-and-bolts details of the safety program highlight shortfalls in fleet knowledge, training, experience, and execution. As you study the following pages, please look for areas where increased or adjusted mishap-prevention efforts are necessary. These are the issues where we can work together to identify and avoid costly preventable mishaps that remain all too common.
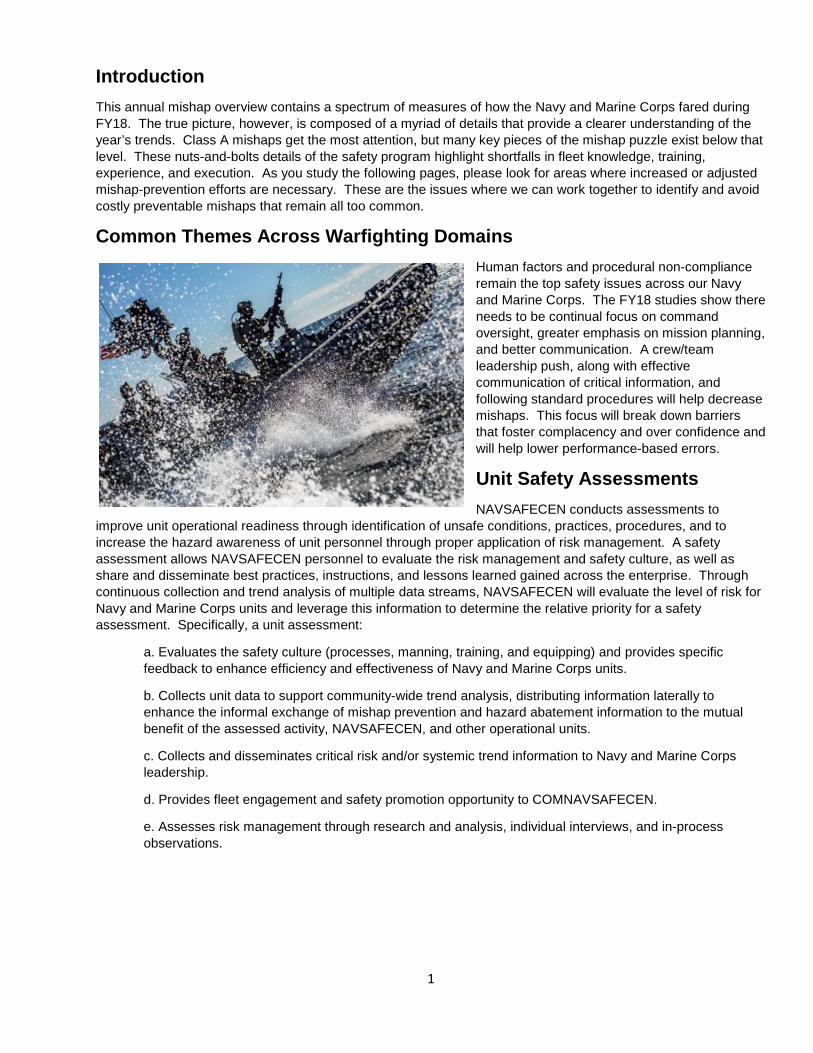
Common Themes Across Warfighting Domains Human factors and procedural non-compliance remain the top safety issues across our Navy and Marine Corps. The FY18 studies show there needs to be continual focus on command oversight, greater emphasis on mission planning, and better communication. A crew/team leadership push, along with effective communication of critical information, and following standard procedures will help decrease mishaps. This focus will break down barriers that foster complacency and over confidence and will help lower performance-based errors.
Unit Safety Assessments NAVSAFECEN conducts assessments to
improve unit operational readiness through identification of unsafe conditions, practices, procedures, and to increase the hazard awareness of unit personnel through proper application of risk management. A safety assessment allows NAVSAFECEN personnel to evaluate the risk management and safety culture, as well as share and disseminate best practices, instructions, and lessons learned gained across the enterprise. Through continuous collection and trend analysis of multiple data streams, NAVSAFECEN will evaluate the level of risk for Navy and Marine Corps units and leverage this information to determine the relative priority for a safety assessment. Specifically, a unit assessment:
a. Evaluates the safety culture (processes, manning, training, and equipping) and provides specific feedback to enhance efficiency and effectiveness of Navy and Marine Corps units.
b. Collects unit data to support community-wide trend analysis, distributing information laterally to enhance the informal exchange of mishap prevention and hazard abatement information to the mutual benefit of the assessed activity, NAVSAFECEN, and other operational units.
c. Collects and disseminates critical risk and/or systemic trend information to Navy and Marine Corps leadership.
d. Provides fleet engagement and safety promotion opportunity to COMNAVSAFECEN.
e. Assesses risk management through research and analysis, individual interviews, and in-process observations.
2
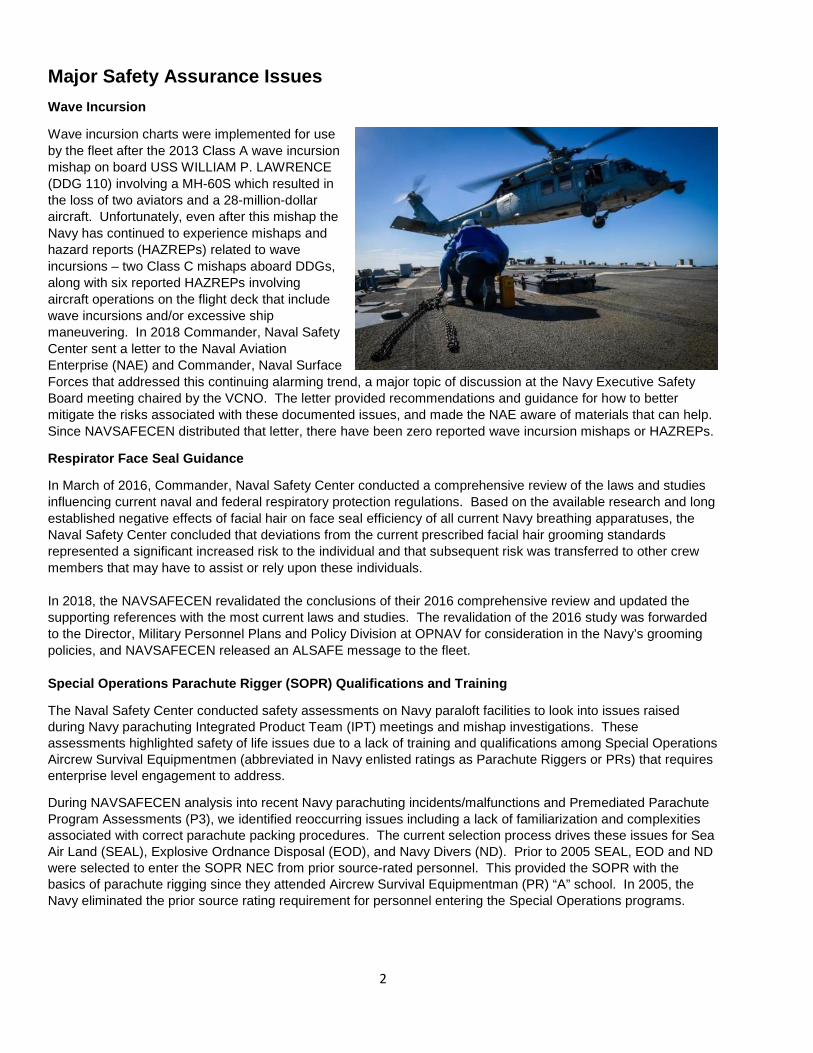
Major Safety Assurance Issues Wave Incursion
Wave incursion charts were implemented for use by the fleet after the 2013 Class A wave incursion mishap on board USS WILLIAM P. LAWRENCE (DDG 110) involving a MH-60S which resulted in the loss of two aviators and a 28-million-dollar aircraft. Unfortunately, even after this mishap the Navy has continued to experience mishaps and hazard reports (HAZREPs) related to wave incursions – two Class C mishaps aboard DDGs, along with six reported HAZREPs involving aircraft operations on the flight deck that include wave incursions and/or excessive ship maneuvering. In 2018 Commander, Naval Safety Center sent a letter to the Naval Aviation Enterprise (NAE) and Commander, Naval Surface Forces that addressed this continuing alarming trend, a major topic of discussion at the Navy Executive Safety Board meeting chaired by the VCNO. The letter provided recommendations and guidance for how to better mitigate the risks associated with these documented issues, and made the NAE aware of materials that can help. Since NAVSAFECEN distributed that letter, there have been zero reported wave incursion mishaps or HAZREPs.
Respirator Face Seal Guidance
In March of 2016, Commander, Naval Safety Center conducted a comprehensive review of the laws and studies influencing current naval and federal respiratory protection regulations. Based on the available research and long established negative effects of facial hair on face seal efficiency of all current Navy breathing apparatuses, the Naval Safety Center concluded that deviations from the current prescribed facial hair grooming standards represented a significant increased risk to the individual and that subsequent risk was transferred to other crew members that may have to assist or rely upon these individuals.
In 2018, the NAVSAFECEN revalidated the conclusions of their 2016 comprehensive review and updated the supporting references with the most current laws and studies. The revalidation of the 2016 study was forwarded to the Director, Military Personnel Plans and Policy Division at OPNAV for consideration in the Navy’s grooming policies, and NAVSAFECEN released an ALSAFE message to the fleet.
Special Operations Parachute Rigger (SOPR) Qualifications and Training
The Naval Safety Center conducted safety assessments on Navy paraloft facilities to look into issues raised during Navy parachuting Integrated Product Team (IPT) meetings and mishap investigations. These assessments highlighted safety of life issues due to a lack of training and qualifications among Special Operations Aircrew Survival Equipmentmen (abbreviated in Navy enlisted ratings as Parachute Riggers or PRs) that requires enterprise level engagement to address.
During NAVSAFECEN analysis into recent Navy parachuting incidents/malfunctions and Premediated Parachute Program Assessments (P3), we identified reoccurring issues including a lack of familiarization and complexities associated with correct parachute packing procedures. The current selection process drives these issues for Sea Air Land (SEAL), Explosive Ordnance Disposal (EOD), and Navy Divers (ND). Prior to 2005 SEAL, EOD and ND were selected to enter the SOPR NEC from prior source-rated personnel. This provided the SOPR with the basics of parachute rigging since they attended Aircrew Survival Equipmentman (PR) “A” school. In 2005, the Navy eliminated the prior source rating requirement for personnel entering the Special Operations programs.
3
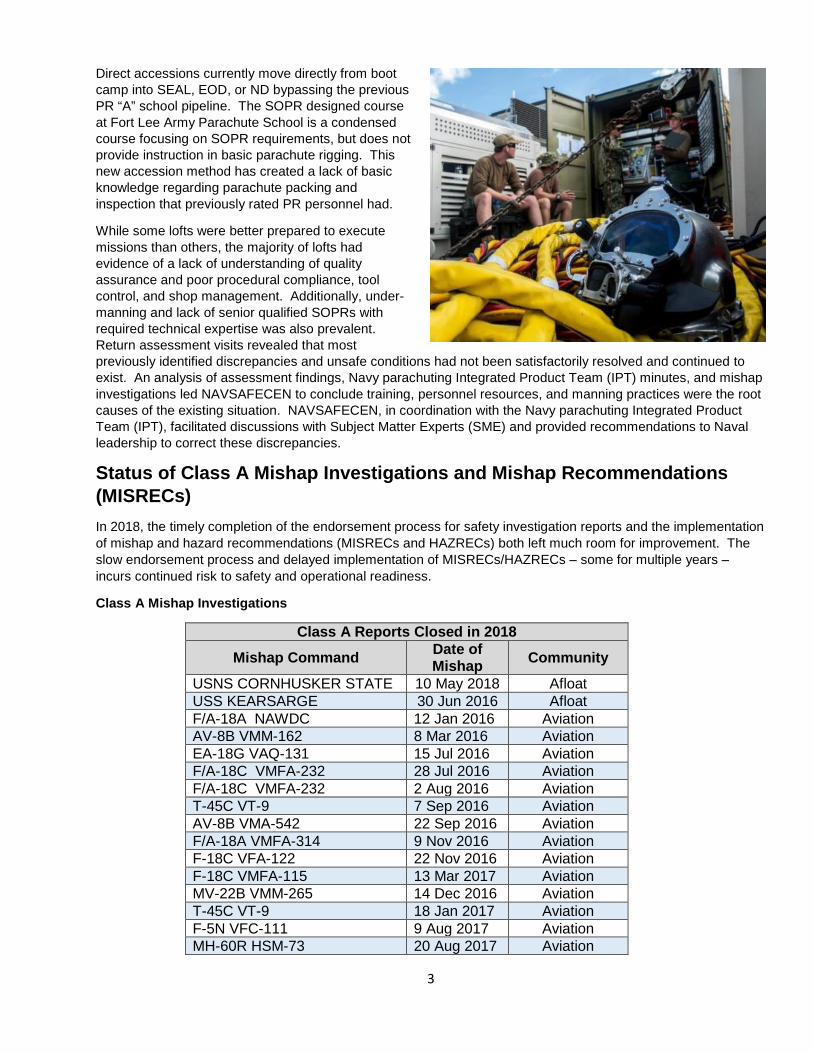
Direct accessions currently move directly from boot camp into SEAL, EOD, or ND bypassing the previous PR “A” school pipeline. The SOPR designed course at Fort Lee Army Parachute School is a condensed course focusing on SOPR requirements, but does not provide instruction in basic parachute rigging. This new accession method has created a lack of basic knowledge regarding parachute packing and inspection that previously rated PR personnel had.
While some lofts were better prepared to execute missions than others, the majority of lofts had evidence of a lack of understanding of quality assurance and poor procedural compliance, tool control, and shop management. Additionally, under-manning and lack of senior qualified SOPRs with required technical expertise was also prevalent. Return assessment visits revealed that most previously identified discrepancies and unsafe conditions had not been satisfactorily resolved and continued to exist. An analysis of assessment findings, Navy parachuting Integrated Product Team (IPT) minutes, and mishap investigations led NAVSAFECEN to conclude training, personnel resources, and manning practices were the root causes of the existing situation. NAVSAFECEN, in coordination with the Navy parachuting Integrated Product Team (IPT), facilitated discussions with Subject Matter Experts (SME) and provided recommendations to Naval leadership to correct these discrepancies.
Status of Class A Mishap Investigations and Mishap Recommendations (MISRECs) In 2018, the timely completion of the endorsement process for safety investigation reports and the implementation of mishap and hazard recommendations (MISRECs and HAZRECs) both left much room for improvement. The slow endorsement process and delayed implementation of MISRECs/HAZRECs – some for multiple years – incurs continued risk to safety and operational readiness.
Class A Mishap Investigations
Class A Reports Closed in 2018 Mishap Command Date of
Mishap Community USNS CORNHUSKER STATE 10 May 2018 Afloat USS KEARSARGE 30 Jun 2016 Afloat F/A-18A NAWDC 12 Jan 2016 Aviation AV-8B VMM-162 8 Mar 2016 Aviation EA-18G VAQ-131 15 Jul 2016 Aviation F/A-18C VMFA-232 28 Jul 2016 Aviation F/A-18C VMFA-232 2 Aug 2016 Aviation T-45C VT-9 7 Sep 2016 Aviation AV-8B VMA-542 22 Sep 2016 Aviation F/A-18A VMFA-314 9 Nov 2016 Aviation F-18C VFA-122 22 Nov 2016 Aviation F-18C VMFA-115 13 Mar 2017 Aviation MV-22B VMM-265 14 Dec 2016 Aviation T-45C VT-9 18 Jan 2017 Aviation F-5N VFC-111 9 Aug 2017 Aviation MH-60R HSM-73 20 Aug 2017 Aviation

4
Active Class A Reports
Mishap Command Date of Mishap Current Endorser
Current Endorser
Time (Days)
Community
USS GUNSTON HALL 3 Mar 2015 NAVSEA 993 Afloat USS LOUISIANA 18 Aug 2016 NAVSAFECEN 430 Afloat USS HENSON 4 Sep 2016 USFFC 614 Afloat USS WASP 12 Nov 2016 NAVSEA 573 Afloat USNS SALVOR 21 Dec 2016 MSC 590 Afloat USS FITZGERALD 17 Jun 2017 Legal Hold N/A Afloat USS McCAIN 21 Aug 2017 Legal Hold N/A Afloat USS BOXER 2 May 2018 CNSP 91 Afloat USS OSCAR AUSTIN 10 Nov 2018 CSG-10 20 Afloat USS JASON DUNHAM 8 Jul 2018 NAVSEA 36 Afloat USS DECATUR 9 Jul 2018 SWRMC 120 Afloat USS ESSEX 8 Aug 2018 I MEF 45 Afloat USS GUNSTON HALL 22 Oct 2018 Ship 15 Afloat MAWTS-1 HMH-365 5 Apr 2017 NSC 18 Aviation VMGR-452 10 Jul 2017 USAF 27 Aviation VMM-261 11 Jul 2017 MCI East 75 Aviation VFA-154 16 Jul 2017 CNAP 168 Aviation VMM-265 5 Aug 2017 CMFP 1 Aviation VFA-122 5 Aug 2017 CNAP 178 Aviation VFA-146 12Aug 2017 AMB 534 Aviation VMM-364 28Sep 2017 3rd MAW 53 Aviation HMH-462 11Oct 2017 CO 13 Aviation VRC-30 22Nov 2017 AMB 432 Aviation VQ-3 12Dec 2017 CNAP 28 Aviation HMLA-267 21Feb 2018 NSC 25 Aviation VFA-213 14Mar 2018 CSWL 16 Aviation VMM-162 3 Apr 2018 MAG 14 36 Aviation HMH-465 3 Apr 2018 AMB 300 Aviation VFA-115 13 Apr 2018 AMB 290 Aviation HSC-22 27 Apr 2018 NSC 19 Aviation VFA-115 9 Jun 2018 AMB 233 Aviation HSM-75 18 Jul 2018 CMSWP 28 Aviation HSC-85 30 Jul 2018 NSC 33 Aviation HMLA-169 3 Aug 2018 T&E CCOM 7 Aviation HSC-26 17Aug 2018 HSCWL 35 Aviation VFA-125 22Aug 2018 VFA-101 36 Aviation VAW-120 17Sep 2018 CVN-77 17 Aviation VMFAT-501 28Sep 2018 2MAW 19 Aviation VFA-22 4Oct 2018 AMB 116 Aviation HSC-85 9Oct 2018 CHSCP 12 Aviation HSM-77 18Oct 2018 AMB 102 Aviation VFA102 11Nov 2018 AMB 78 Aviation VMGR-152 5 Dec 2018 AMB 54 Aviation

5
HMH-464 9 Dec 2018 AMB 50 Aviation VMM-264 5 Jan 2019 AMB 23 Aviation COMFLEACT Yokosuka 25-Sep-15 NAVFACENGCOM 372 Shore NSWC DET White Sands 25-Nov-15 CNIC 51 Shore Norfolk Naval Shipyard 7-Aug-15 COMNAVSEASYSCOM 56 Shore Norfolk Naval Shipyard 27-Feb-18 COMNAVSEASYSCOM 51 Shore NMCP 25-May-18 COMNAVSAFECEN 41 Shore USS GUNSTON HALL 3-Mar-15 COMNAVSEASYSCOM Unknown Shore DDG 79 OSCAR AUSTIN 10-Nov-18 CSG 10 27 Shore
Outstanding MISRECs
MISRECs are produced through the deliberative mishap investigation board process after a mishap. Mishap board members are encouraged to be creative and not limit themselves to the bounds of technology or fiscal constraint. Once a safety investigation report is finalized, the originating command should continue to track and shepherd their recommendations through completion. Recommendations (MISRECs) are vetted through the endorsing chain, up to and including the Type Commander (TYCOM) or aviation controlling custodian, who should ensure action by the assigned action agencies is completed. The Naval Safety Center tracks all recommendations until their completion, or in some cases, their administrative closure when risk of not completing the recommendation is accepted at the appropriate level. Communication is critical as some recommendations and endorsement processes can last longer than a safety officer's or CO's tenure in a command. The MISREC tracking program at the NAVSAFECEN is process that affords this critical communication for the fleet.
1 2 3 4 5 6 7 8NAVSEA 31 0 2 7 0 8 7 1 6SURFOR 10 0 3 1 0 1 0 5 0
CNIC 2 0 0 0 0 0 0 0 2CNETC 6 0 0 1 0 1 1 3 0
BUPERS 2 0 0 0 0 1 0 1 0PEO IWS
VMS PROGRAM
OFFICE
1 0 0 0 0 0 0 1 0
SUBFOR 1 0 0 0 0 0 1 0 0AIRFOR 1 0 0 0 0 0 1 0 0CSCS 1 0 1 0 0 0 0 0 0
55 0 6 9 0 11 10 11 8
Number of Years OldOutstanding MISRECs - Afloat
Consolidated TYCOM
Currently Due
6
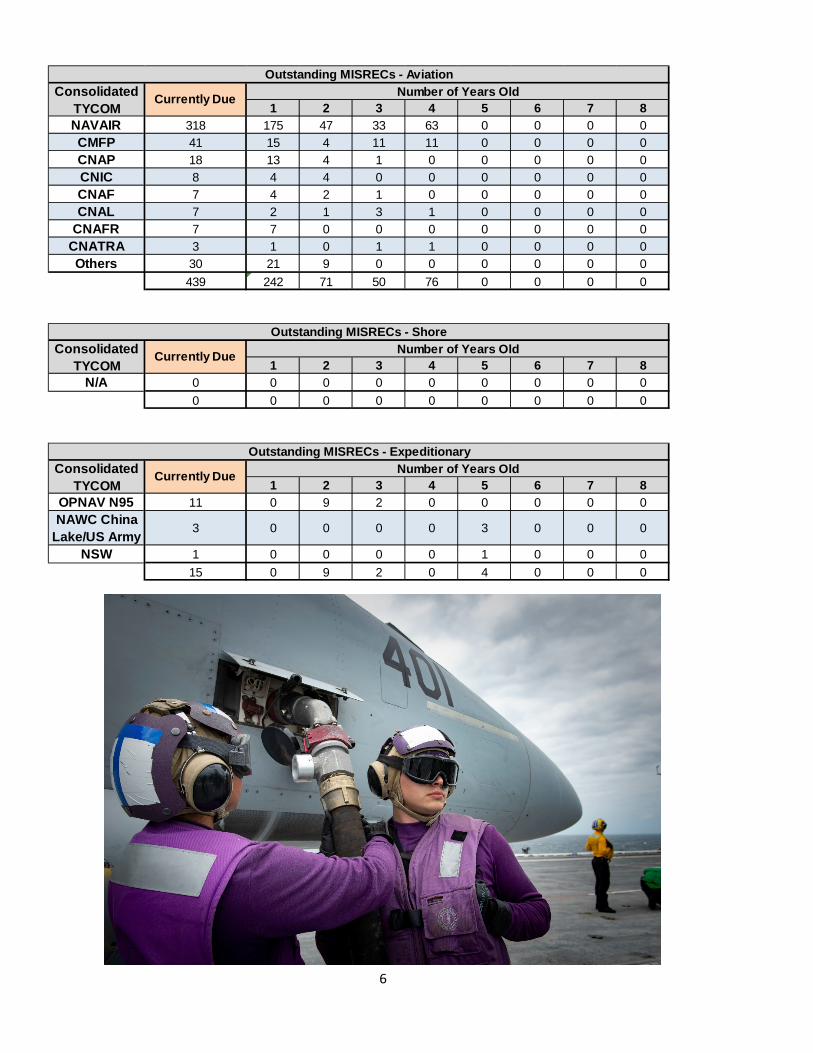
1 2 3 4 5 6 7 8NAVAIR 318 175 47 33 63 0 0 0 0CMFP 41 15 4 11 11 0 0 0 0CNAP 18 13 4 1 0 0 0 0 0CNIC 8 4 4 0 0 0 0 0 0CNAF 7 4 2 1 0 0 0 0 0CNAL 7 2 1 3 1 0 0 0 0
CNAFR 7 7 0 0 0 0 0 0 0CNATRA 3 1 0 1 1 0 0 0 0Others 30 21 9 0 0 0 0 0 0
439 242 71 50 76 0 0 0 0
Number of Years OldConsolidated TYCOM
Currently Due
Outstanding MISRECs - Aviation
1 2 3 4 5 6 7 8N/A 0 0 0 0 0 0 0 0 0
0 0 0 0 0 0 0 0 0
Number of Years OldConsolidated TYCOM
Currently Due
Outstanding MISRECs - Shore
1 2 3 4 5 6 7 8OPNAV N95 11 0 9 2 0 0 0 0 0NAWC China
Lake/US Army 3 0 0 0 0 3 0 0 0
NSW 1 0 0 0 0 1 0 0 015 0 9 2 0 4 0 0 0
Number of Years OldOutstanding MISRECs - Expeditionary
Consolidated TYCOM
Currently Due
7
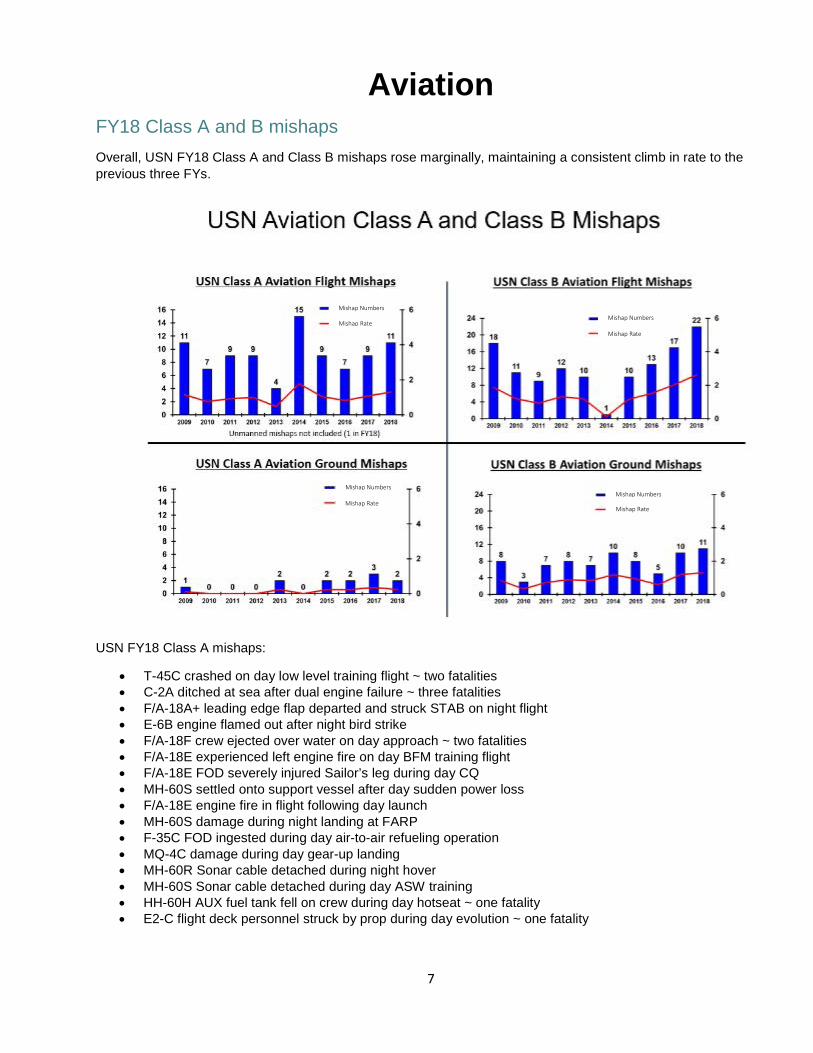
Aviation FY18 Class A and B mishaps
Overall, USN FY18 Class A and Class B mishaps rose marginally, maintaining a consistent climb in rate to the previous three FYs.
USN FY18 Class A mishaps:
• T-45C crashed on day low level training flight ~ two fatalities• C-2A ditched at sea after dual engine failure ~ three fatalities• F/A-18A+ leading edge flap departed and struck STAB on night flight• E-6B engine flamed out after night bird strike• F/A-18F crew ejected over water on day approach ~ two fatalities• F/A-18E experienced left engine fire on day BFM training flight• F/A-18E FOD severely injured Sailor’s leg during day CQ• MH-60S settled onto support vessel after day sudden power loss• F/A-18E engine fire in flight following day launch• MH-60S damage during night landing at FARP• F-35C FOD ingested during day air-to-air refueling operation• MQ-4C damage during day gear-up landing• MH-60R Sonar cable detached during night hover• MH-60S Sonar cable detached during day ASW training• HH-60H AUX fuel tank fell on crew during day hotseat ~ one fatality• E2-C flight deck personnel struck by prop during day evolution ~ one fatality
Mishap Numbers
Mishap Rate Mishap Numbers
Mishap Numbers Mishap Numbers
Mishap Rate
Mishap Rate
Mishap Rate
8
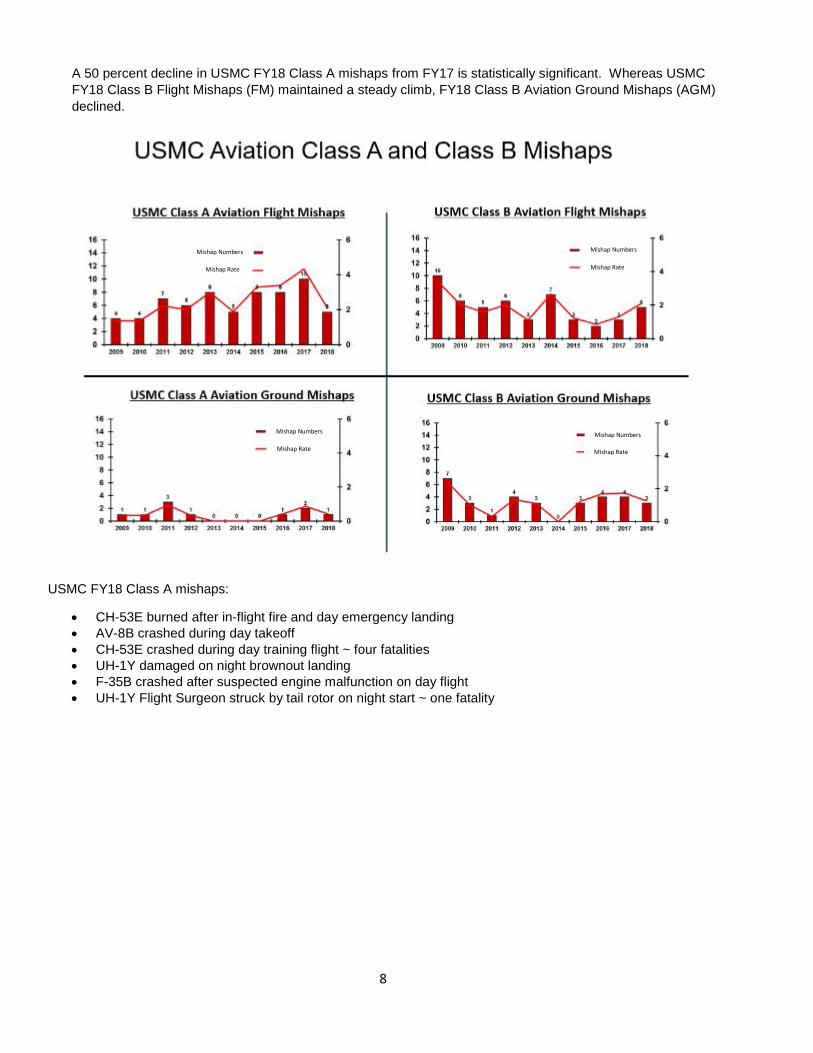
A 50 percent decline in USMC FY18 Class A mishaps from FY17 is statistically significant. Whereas USMC FY18 Class B Flight Mishaps (FM) maintained a steady climb, FY18 Class B Aviation Ground Mishaps (AGM) declined.
USMC FY18 Class A mishaps:
• CH-53E burned after in-flight fire and day emergency landing• AV-8B crashed during day takeoff• CH-53E crashed during day training flight ~ four fatalities• UH-1Y damaged on night brownout landing• F-35B crashed after suspected engine malfunction on day flight• UH-1Y Flight Surgeon struck by tail rotor on night start ~ one fatality
Mishap Rate
Mishap Rate Mishap Rate
Mishap Rate
Mishap Numbers Mishap Numbers
Mishap Numbers Mishap Numbers
9
FY18 Class C mishaps
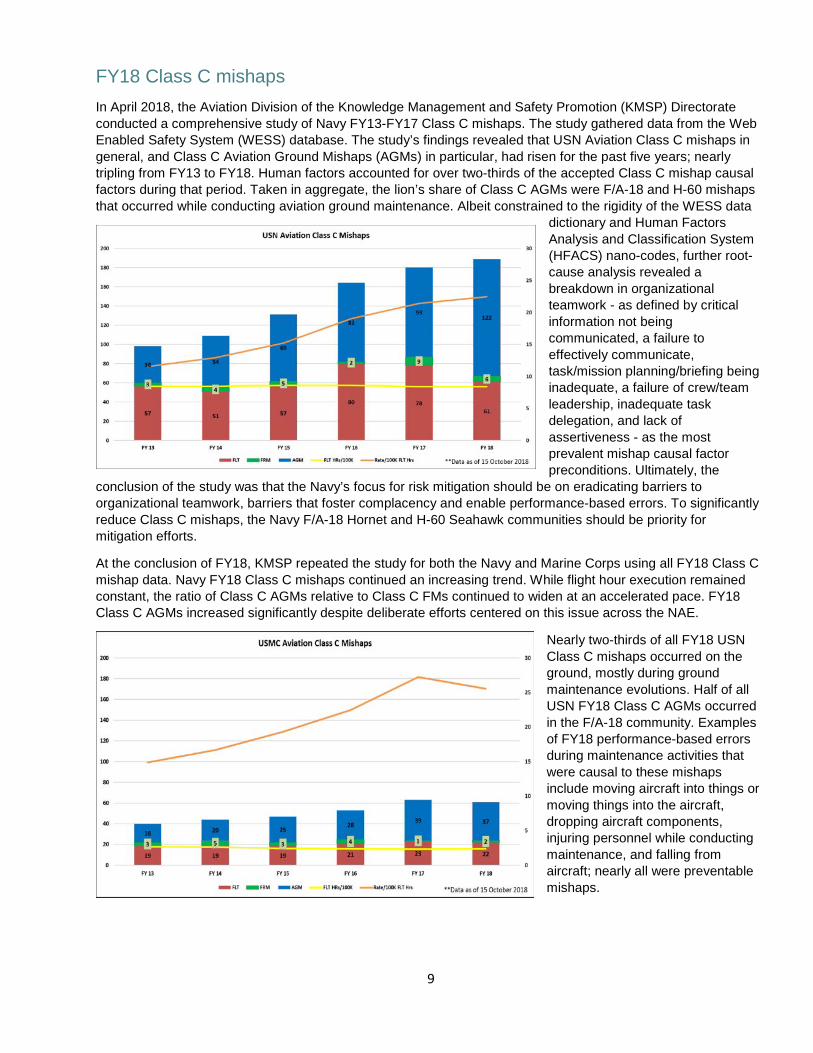
In April 2018, the Aviation Division of the Knowledge Management and Safety Promotion (KMSP) Directorate conducted a comprehensive study of Navy FY13-FY17 Class C mishaps. The study gathered data from the Web Enabled Safety System (WESS) database. The study’s findings revealed that USN Aviation Class C mishaps in general, and Class C Aviation Ground Mishaps (AGMs) in particular, had risen for the past five years; nearly tripling from FY13 to FY18. Human factors accounted for over two-thirds of the accepted Class C mishap causal factors during that period. Taken in aggregate, the lion’s share of Class C AGMs were F/A-18 and H-60 mishaps that occurred while conducting aviation ground maintenance. Albeit constrained to the rigidity of the WESS data
dictionary and Human Factors Analysis and Classification System (HFACS) nano-codes, further root-cause analysis revealed a breakdown in organizational teamwork - as defined by critical information not being communicated, a failure to effectively communicate, task/mission planning/briefing being inadequate, a failure of crew/team leadership, inadequate task delegation, and lack of assertiveness - as the most prevalent mishap causal factor preconditions. Ultimately, the
conclusion of the study was that the Navy’s focus for risk mitigation should be on eradicating barriers to organizational teamwork, barriers that foster complacency and enable performance-based errors. To significantly reduce Class C mishaps, the Navy F/A-18 Hornet and H-60 Seahawk communities should be priority for mitigation efforts.
At the conclusion of FY18, KMSP repeated the study for both the Navy and Marine Corps using all FY18 Class C mishap data. Navy FY18 Class C mishaps continued an increasing trend. While flight hour execution remained constant, the ratio of Class C AGMs relative to Class C FMs continued to widen at an accelerated pace. FY18 Class C AGMs increased significantly despite deliberate efforts centered on this issue across the NAE.
Nearly two-thirds of all FY18 USN Class C mishaps occurred on the ground, mostly during ground maintenance evolutions. Half of all USN FY18 Class C AGMs occurred in the F/A-18 community. Examples of FY18 performance-based errors during maintenance activities that were causal to these mishaps include moving aircraft into things or moving things into the aircraft, dropping aircraft components, injuring personnel while conducting maintenance, and falling from aircraft; nearly all were preventable mishaps.
10
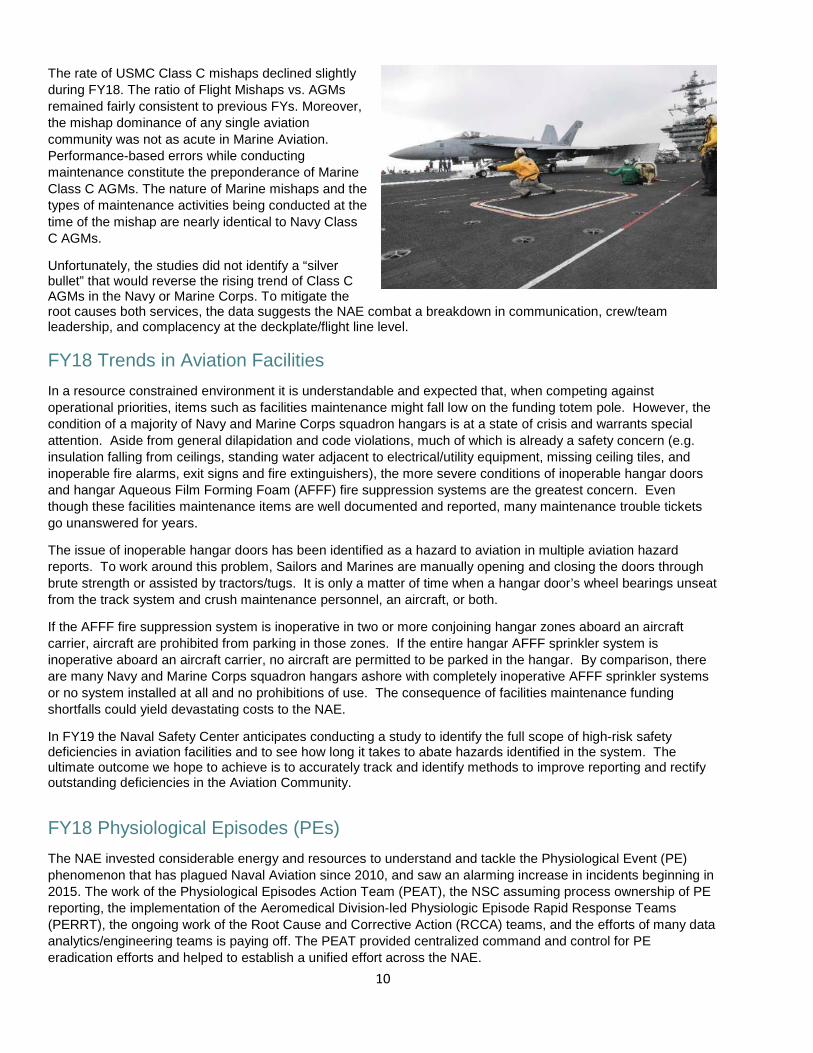
The rate of USMC Class C mishaps declined slightly during FY18. The ratio of Flight Mishaps vs. AGMs remained fairly consistent to previous FYs. Moreover, the mishap dominance of any single aviation community was not as acute in Marine Aviation. Performance-based errors while conducting maintenance constitute the preponderance of Marine Class C AGMs. The nature of Marine mishaps and the types of maintenance activities being conducted at the time of the mishap are nearly identical to Navy Class C AGMs.
Unfortunately, the studies did not identify a “silver bullet” that would reverse the rising trend of Class C AGMs in the Navy or Marine Corps. To mitigate the root causes both services, the data suggests the NAE combat a breakdown in communication, crew/team leadership, and complacency at the deckplate/flight line level.
FY18 Trends in Aviation Facilities In a resource constrained environment it is understandable and expected that, when competing against operational priorities, items such as facilities maintenance might fall low on the funding totem pole. However, the condition of a majority of Navy and Marine Corps squadron hangars is at a state of crisis and warrants special attention. Aside from general dilapidation and code violations, much of which is already a safety concern (e.g. insulation falling from ceilings, standing water adjacent to electrical/utility equipment, missing ceiling tiles, and inoperable fire alarms, exit signs and fire extinguishers), the more severe conditions of inoperable hangar doors and hangar Aqueous Film Forming Foam (AFFF) fire suppression systems are the greatest concern. Even though these facilities maintenance items are well documented and reported, many maintenance trouble tickets go unanswered for years.
The issue of inoperable hangar doors has been identified as a hazard to aviation in multiple aviation hazard reports. To work around this problem, Sailors and Marines are manually opening and closing the doors through brute strength or assisted by tractors/tugs. It is only a matter of time when a hangar door’s wheel bearings unseat from the track system and crush maintenance personnel, an aircraft, or both.
If the AFFF fire suppression system is inoperative in two or more conjoining hangar zones aboard an aircraft carrier, aircraft are prohibited from parking in those zones. If the entire hangar AFFF sprinkler system is inoperative aboard an aircraft carrier, no aircraft are permitted to be parked in the hangar. By comparison, there are many Navy and Marine Corps squadron hangars ashore with completely inoperative AFFF sprinkler systems or no system installed at all and no prohibitions of use. The consequence of facilities maintenance funding shortfalls could yield devastating costs to the NAE.
In FY19 the Naval Safety Center anticipates conducting a study to identify the full scope of high-risk safety deficiencies in aviation facilities and to see how long it takes to abate hazards identified in the system. The ultimate outcome we hope to achieve is to accurately track and identify methods to improve reporting and rectify outstanding deficiencies in the Aviation Community.
FY18 Physiological Episodes (PEs) The NAE invested considerable energy and resources to understand and tackle the Physiological Event (PE) phenomenon that has plagued Naval Aviation since 2010, and saw an alarming increase in incidents beginning in 2015. The work of the Physiological Episodes Action Team (PEAT), the NSC assuming process ownership of PE reporting, the implementation of the Aeromedical Division-led Physiologic Episode Rapid Response Teams (PERRT), the ongoing work of the Root Cause and Corrective Action (RCCA) teams, and the efforts of many data analytics/engineering teams is paying off. The PEAT provided centralized command and control for PE eradication efforts and helped to establish a unified effort across the NAE.
11
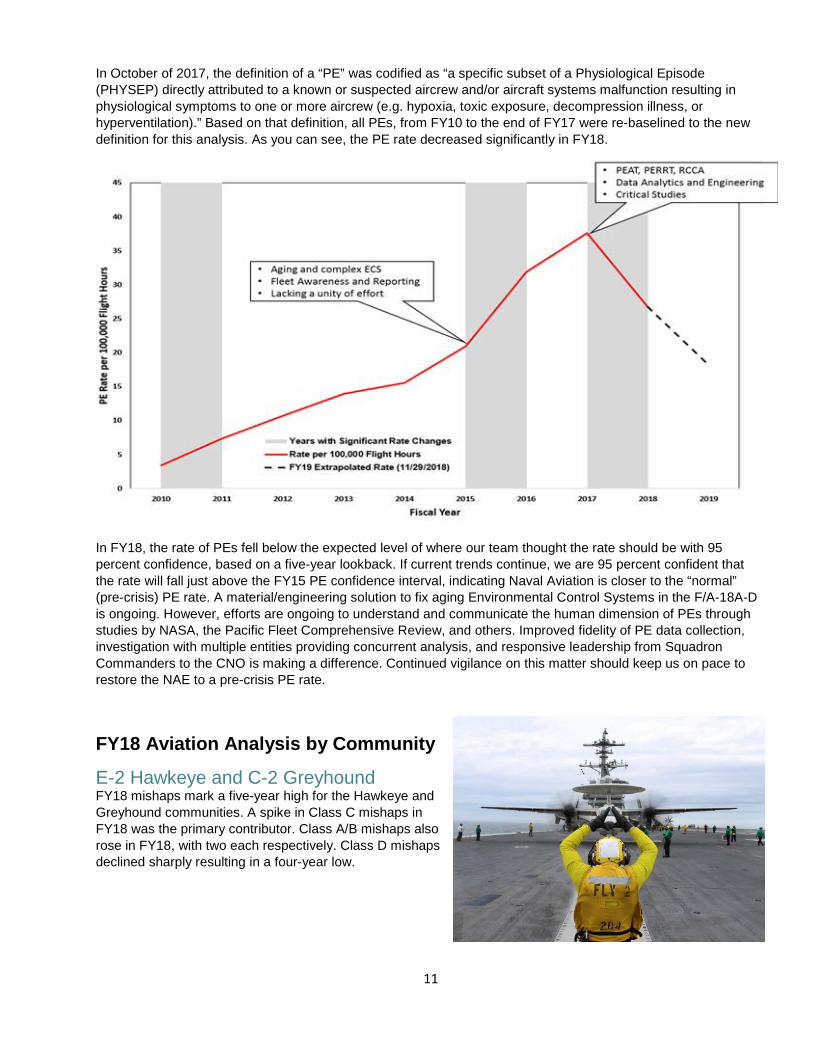
In October of 2017, the definition of a “PE” was codified as “a specific subset of a Physiological Episode (PHYSEP) directly attributed to a known or suspected aircrew and/or aircraft systems malfunction resulting in physiological symptoms to one or more aircrew (e.g. hypoxia, toxic exposure, decompression illness, or hyperventilation).” Based on that definition, all PEs, from FY10 to the end of FY17 were re-baselined to the new definition for this analysis. As you can see, the PE rate decreased significantly in FY18.
In FY18, the rate of PEs fell below the expected level of where our team thought the rate should be with 95 percent confidence, based on a five-year lookback. If current trends continue, we are 95 percent confident that the rate will fall just above the FY15 PE confidence interval, indicating Naval Aviation is closer to the “normal” (pre-crisis) PE rate. A material/engineering solution to fix aging Environmental Control Systems in the F/A-18A-D is ongoing. However, efforts are ongoing to understand and communicate the human dimension of PEs through studies by NASA, the Pacific Fleet Comprehensive Review, and others. Improved fidelity of PE data collection, investigation with multiple entities providing concurrent analysis, and responsive leadership from Squadron Commanders to the CNO is making a difference. Continued vigilance on this matter should keep us on pace to restore the NAE to a pre-crisis PE rate.
FY18 Aviation Analysis by Community
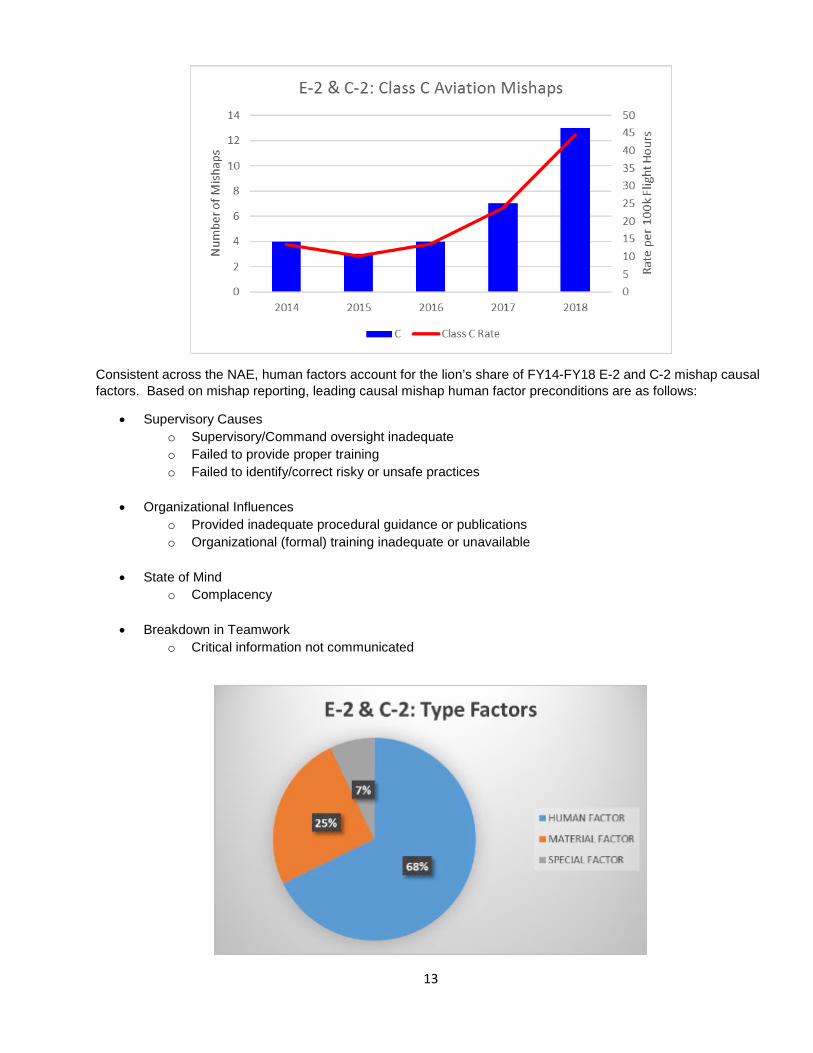
E-2 Hawkeye and C-2 GreyhoundFY18 mishaps mark a five-year high for the Hawkeye and Greyhound communities. A spike in Class C mishaps in FY18 was the primary contributor. Class A/B mishaps also rose in FY18, with two each respectively. Class D mishaps declined sharply resulting in a four-year low.

12
FY18 Class A mishap:
• C-2 ditched while inbound to CVN with 11 onboard. Three fatalities.• Fatal incident onboard CVN involving a propeller of an E-2C aircraft and CVN flight deck personnel.
FY18 Class B mishaps:
• C-2: Port Propeller Spinner departs aircraft.• System malfunction results in EMIRS cable sever after failure to retract.
FY18 E-2/C-2 Class C mishaps accelerated a four-year climb, nearly doubling the previous year. An overwhelming majority of FY18 Class C mishaps occurred during maintenance evolutions.
13
Consistent across the NAE, human factors account for the lion’s share of FY14-FY18 E-2 and C-2 mishap causal factors. Based on mishap reporting, leading causal mishap human factor preconditions are as follows:
• Supervisory Causeso Supervisory/Command oversight inadequateo Failed to provide proper trainingo Failed to identify/correct risky or unsafe practices
• Organizational Influenceso Provided inadequate procedural guidance or publicationso Organizational (formal) training inadequate or unavailable
• State of Mindo Complacency
• Breakdown in Teamworko Critical information not communicated
14
Despite being a relatively small community, the Hawkeye and Greyhound hazard reporting culture was excellent in FY18.
• 183 Hazard Reports received from the Hawkeye community• 32 Hazard Reports received from the Greyhound community
FY18 HAZREP trends included the following: • BASH• Hydraulic system failure• Stuck flaps
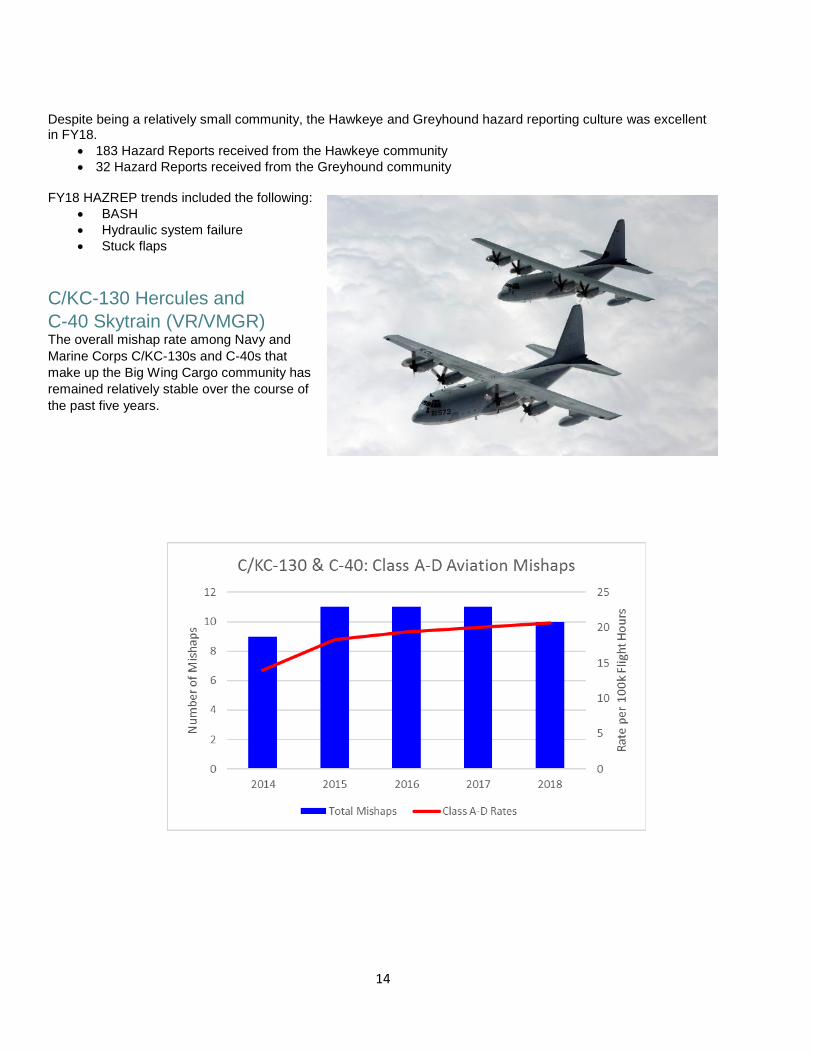
C/KC-130 Hercules and C-40 Skytrain (VR/VMGR)The overall mishap rate among Navy and Marine Corps C/KC-130s and C-40s that make up the Big Wing Cargo community has remained relatively stable over the course of the past five years.

15
No Class A or B mishaps occurred in the Big Wing Cargo community during FY18. While Class C mishaps continued to decline, FY18 Class D mishaps continued a sharp rise. Nearly all FY18 mishaps, seven of ten, occurred during a maintenance evolution. Of note, the C-40 community reported only one mishap for the FY; a Class D mishap involving an aircrew injury while encountering severe turbulence.
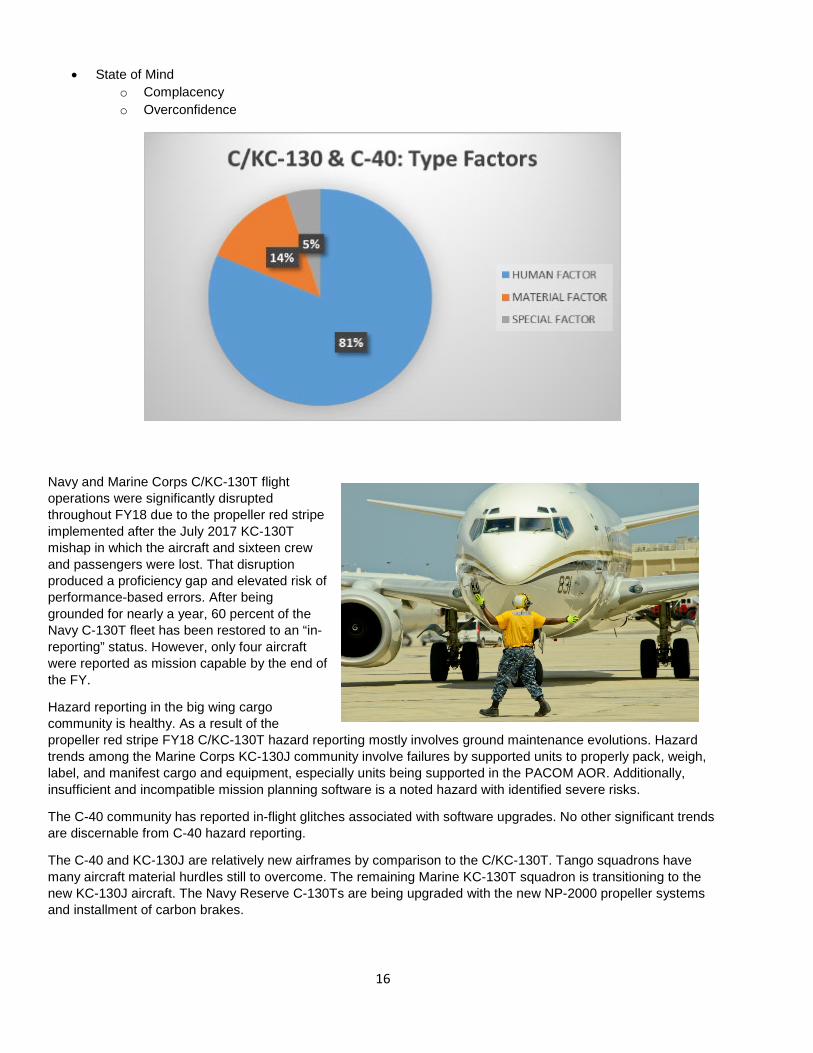
The C/KC-130 and C-40 aircraft are traditionally very reliable airframes that seldom experience material failure-based mishaps despite the high number of flight hours they fly. FY14-FY18 mishap data shows that when the Big Wing Cargo community has a mishap, human factors are cited overwhelmingly as the causal factors. Based on C/KC-130 and C-40 mishap reporting, the leading causal mishap human factors preconditions are as follows:
• A break down in Teamworko Critical information not being communicatedo Failure to effectively communicateo Failure of crew/team leadership
16
• State of Mindo Complacencyo Overconfidence
Navy and Marine Corps C/KC-130T flight operations were significantly disrupted throughout FY18 due to the propeller red stripe implemented after the July 2017 KC-130T mishap in which the aircraft and sixteen crew and passengers were lost. That disruption produced a proficiency gap and elevated risk of performance-based errors. After being grounded for nearly a year, 60 percent of the Navy C-130T fleet has been restored to an “in-reporting” status. However, only four aircraft were reported as mission capable by the end of the FY.
Hazard reporting in the big wing cargo community is healthy. As a result of the propeller red stripe FY18 C/KC-130T hazard reporting mostly involves ground maintenance evolutions. Hazard trends among the Marine Corps KC-130J community involve failures by supported units to properly pack, weigh, label, and manifest cargo and equipment, especially units being supported in the PACOM AOR. Additionally, insufficient and incompatible mission planning software is a noted hazard with identified severe risks.
The C-40 community has reported in-flight glitches associated with software upgrades. No other significant trends are discernable from C-40 hazard reporting.
The C-40 and KC-130J are relatively new airframes by comparison to the C/KC-130T. Tango squadrons have many aircraft material hurdles still to overcome. The remaining Marine KC-130T squadron is transitioning to the new KC-130J aircraft. The Navy Reserve C-130Ts are being upgraded with the new NP-2000 propeller systems and installment of carbon brakes.
17
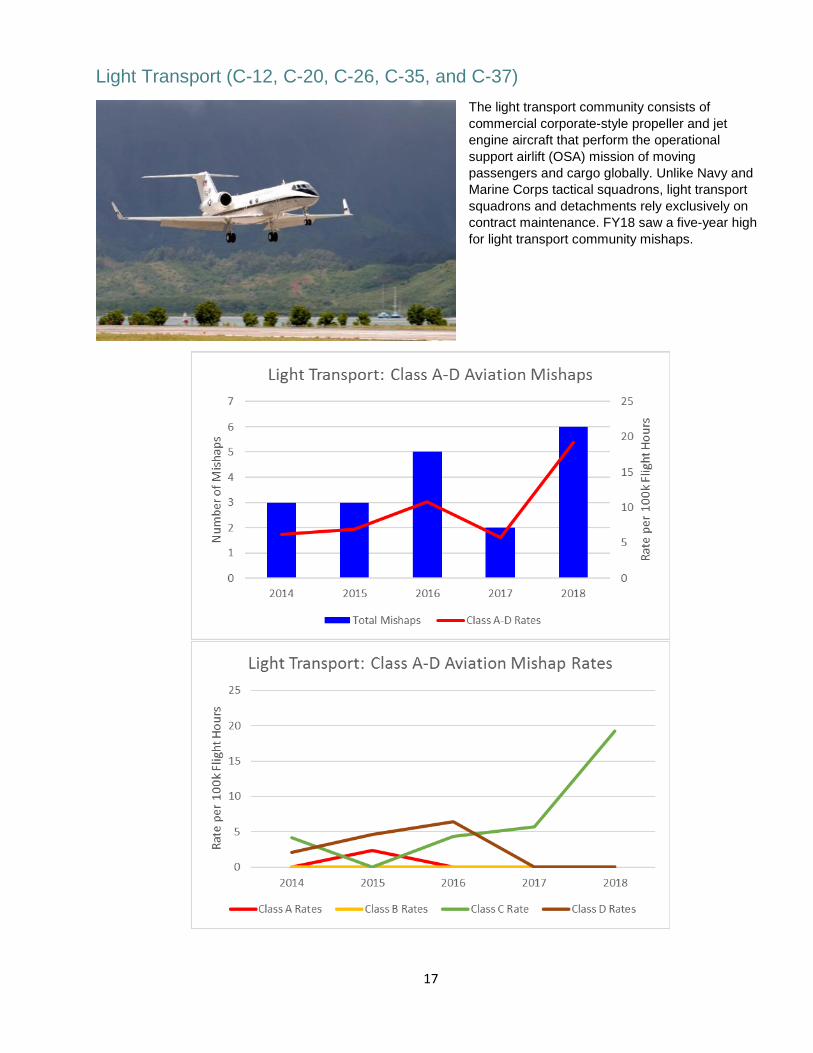
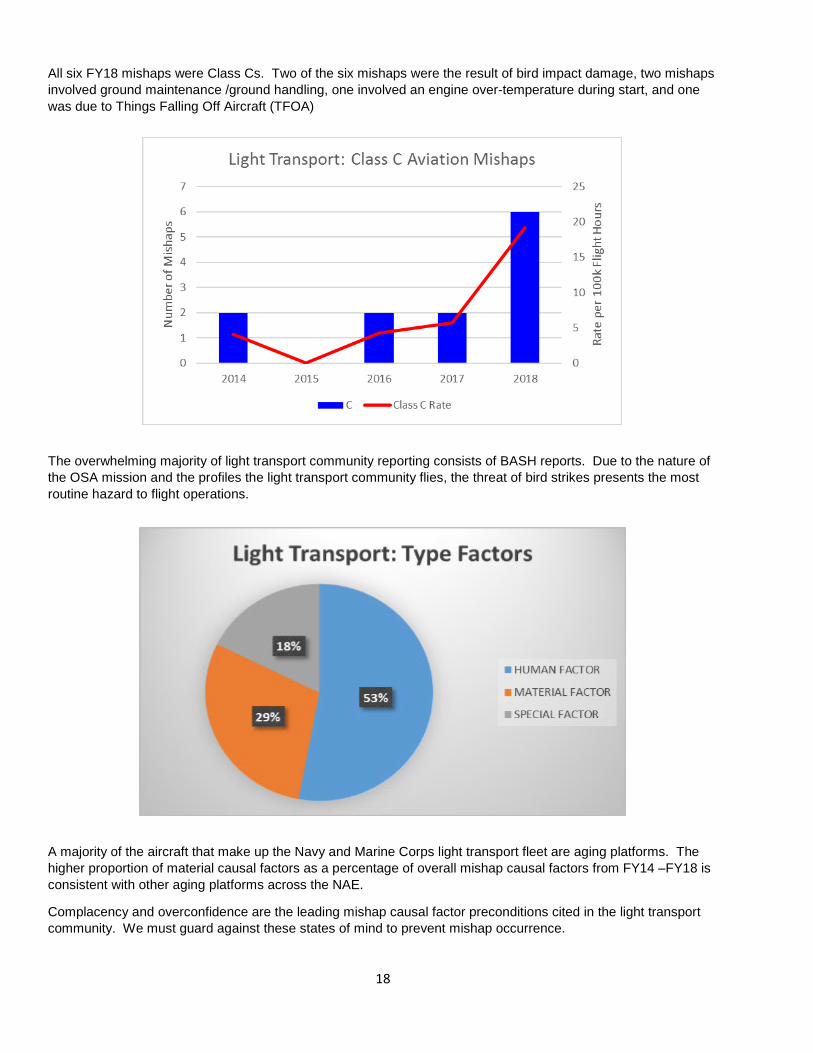
Light Transport (C-12, C-20, C-26, C-35, and C-37) The light transport community consists of commercial corporate-style propeller and jet engine aircraft that perform the operational support airlift (OSA) mission of moving passengers and cargo globally. Unlike Navy and Marine Corps tactical squadrons, light transport squadrons and detachments rely exclusively on contract maintenance. FY18 saw a five-year high for light transport community mishaps.
18
All six FY18 mishaps were Class Cs. Two of the six mishaps were the result of bird impact damage, two mishaps involved ground maintenance /ground handling, one involved an engine over-temperature during start, and one was due to Things Falling Off Aircraft (TFOA)
The overwhelming majority of light transport community reporting consists of BASH reports. Due to the nature of the OSA mission and the profiles the light transport community flies, the threat of bird strikes presents the most routine hazard to flight operations.
A majority of the aircraft that make up the Navy and Marine Corps light transport fleet are aging platforms. The higher proportion of material causal factors as a percentage of overall mishap causal factors from FY14 –FY18 is consistent with other aging platforms across the NAE.
Complacency and overconfidence are the leading mishap causal factor preconditions cited in the light transport community. We must guard against these states of mind to prevent mishap occurrence.
19
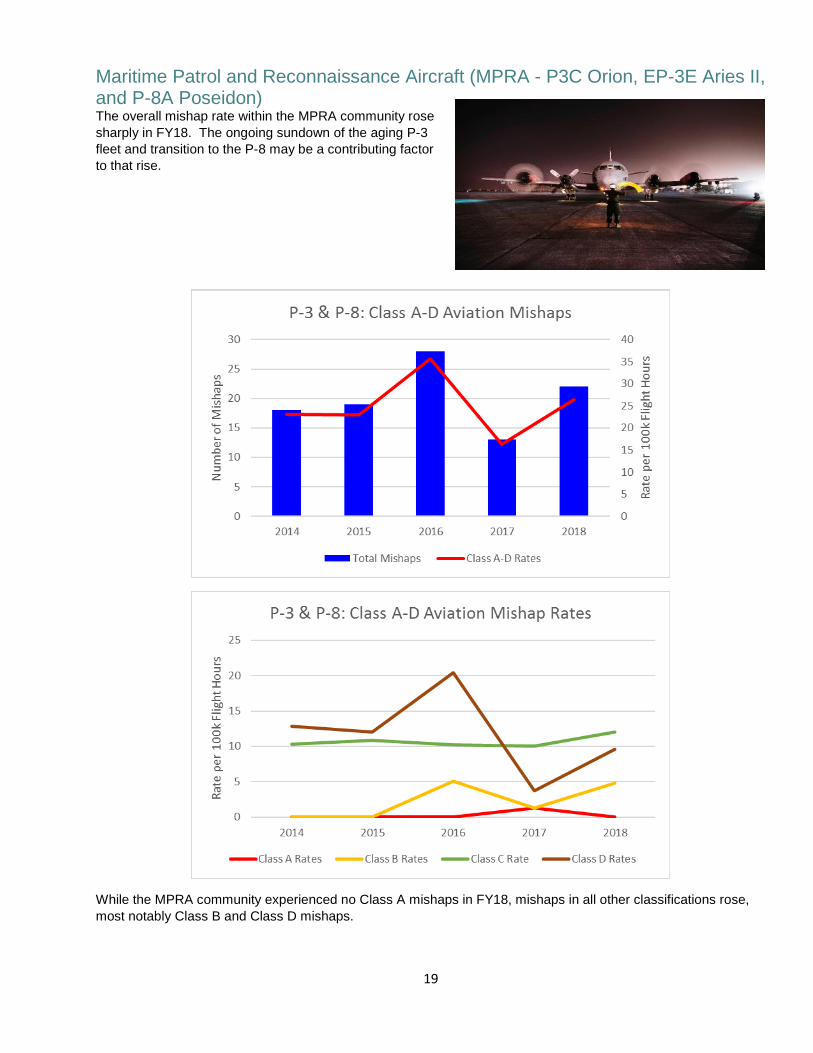
Maritime Patrol and Reconnaissance Aircraft (MPRA - P3C Orion, EP-3E Aries II, and P-8A Poseidon) The overall mishap rate within the MPRA community rose sharply in FY18. The ongoing sundown of the aging P-3 fleet and transition to the P-8 may be a contributing factor to that rise.
While the MPRA community experienced no Class A mishaps in FY18, mishaps in all other classifications rose, most notably Class B and Class D mishaps.
20
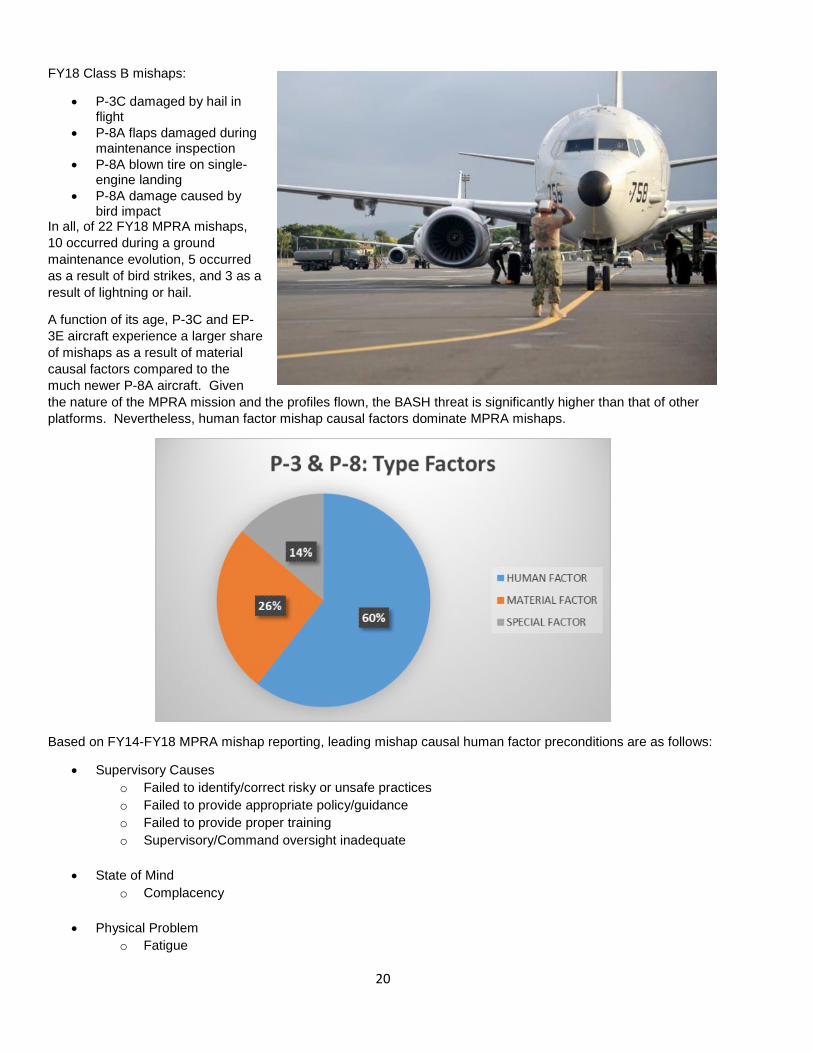
FY18 Class B mishaps:
• P-3C damaged by hail inflight
• P-8A flaps damaged duringmaintenance inspection
• P-8A blown tire on single-engine landing
• P-8A damage caused bybird impact
In all, of 22 FY18 MPRA mishaps, 10 occurred during a ground maintenance evolution, 5 occurred as a result of bird strikes, and 3 as a result of lightning or hail.
A function of its age, P-3C and EP-3E aircraft experience a larger share of mishaps as a result of material causal factors compared to the much newer P-8A aircraft. Given the nature of the MPRA mission and the profiles flown, the BASH threat is significantly higher than that of other platforms. Nevertheless, human factor mishap causal factors dominate MPRA mishaps.
Based on FY14-FY18 MPRA mishap reporting, leading mishap causal human factor preconditions are as follows:
• Supervisory Causeso Failed to identify/correct risky or unsafe practiceso Failed to provide appropriate policy/guidanceo Failed to provide proper trainingo Supervisory/Command oversight inadequate
• State of Mindo Complacency
• Physical Problemo Fatigue
21
• Breakdown in Teamworko Critical information not communicatedo Failed to effectively communicate
The hazard reporting culture of the MPRA community is exceptional. FY18 HAZREP trends included the following:
• BASH• P-3C three-engine landings due to engine malfunction• Uncommanded Lasing Event (ULE)
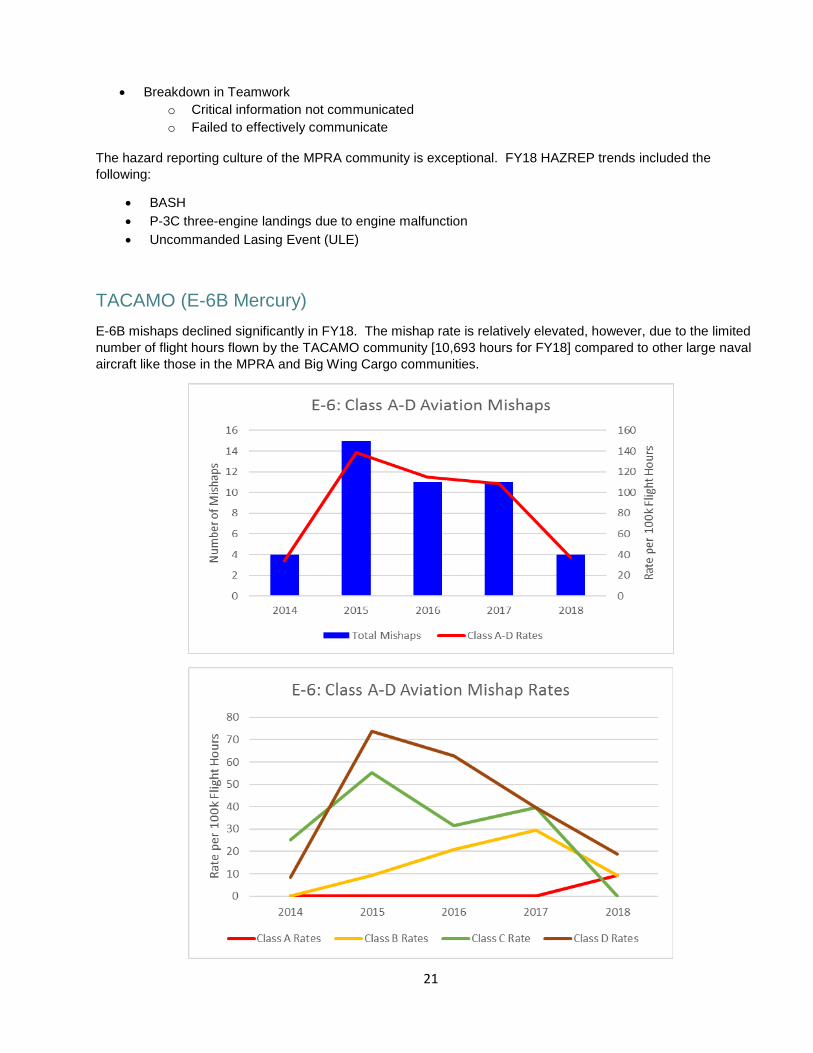
TACAMO (E-6B Mercury) E-6B mishaps declined significantly in FY18. The mishap rate is relatively elevated, however, due to the limitednumber of flight hours flown by the TACAMO community [10,693 hours for FY18] compared to other large navalaircraft like those in the MPRA and Big Wing Cargo communities.

22
In FY18 the TACAMO community experienced four mishaps in total. The Class A mishap was the result of a bird ingested into the engine. The Class B mishap was the result of nose tire separation due to unauthorized tires making it into the supply chain, a repeat of a similar event that occurred four months earlier in FY17. The two Class D mishaps continued a four-year decline and were the result of failure to follow maintenance procedures and complacency. There were no FY18 Class C mishaps.
Human factors constitute the bulk of accepted mishap causal factors in the TACAMO community. Based on FY14-FY18 E-6B mishap reporting, leading mishap causal human factor preconditions are as follows:
• Supervisory Causeso Failed to identify/correct risky or unsafe practiceso Failed to provide appropriate policy/guidanceo Failed to provide proper training
• State of Mindo Complacency
• Physical Problemo Fatigue
• Breakdown in Teamworko Failed to effectively communicate
E-6B hazard reporting in FY18 consists almost exclusively of BASH reports.
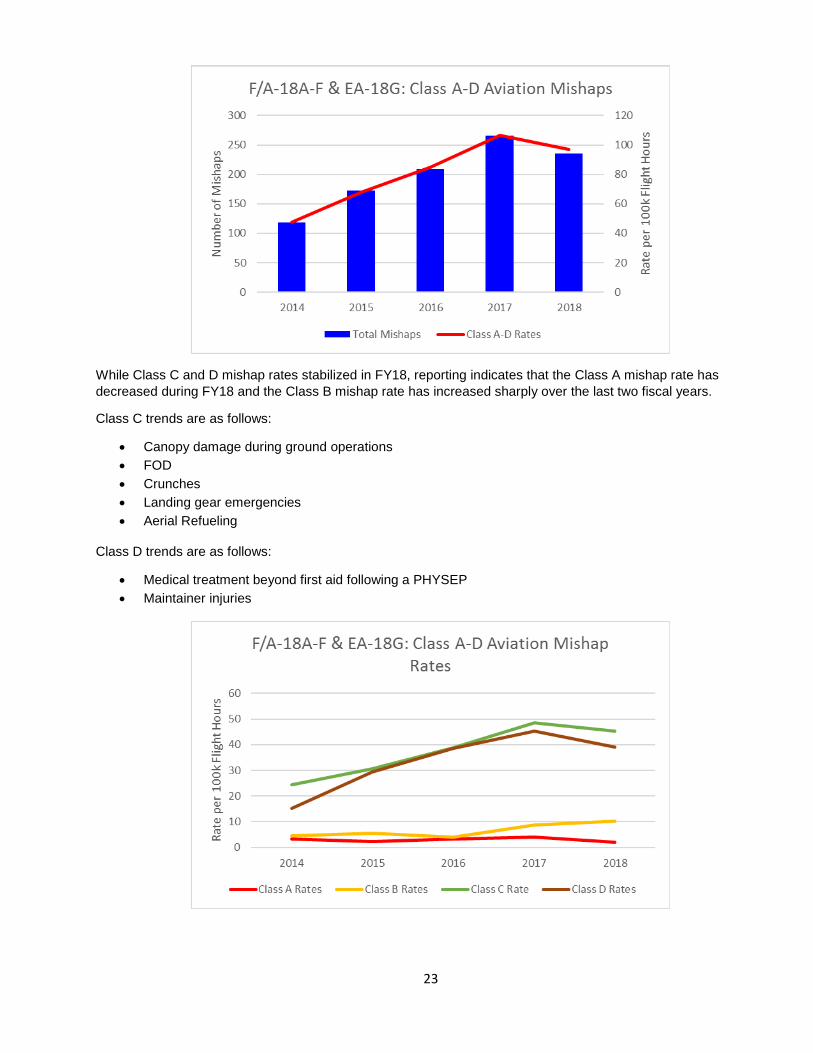
F/A-18A-F Hornet and EA-18G Growler After a few years of a steady increase in mishap rates for the F/A-18A-F and EA-18G, the mishap rate flattened out at approximately 100 mishaps per 100,000 flight hours during FY18.
23
While Class C and D mishap rates stabilized in FY18, reporting indicates that the Class A mishap rate has decreased during FY18 and the Class B mishap rate has increased sharply over the last two fiscal years.
Class C trends are as follows:
• Canopy damage during ground operations• FOD• Crunches• Landing gear emergencies• Aerial Refueling
Class D trends are as follows:
• Medical treatment beyond first aid following a PHYSEP• Maintainer injuries
24
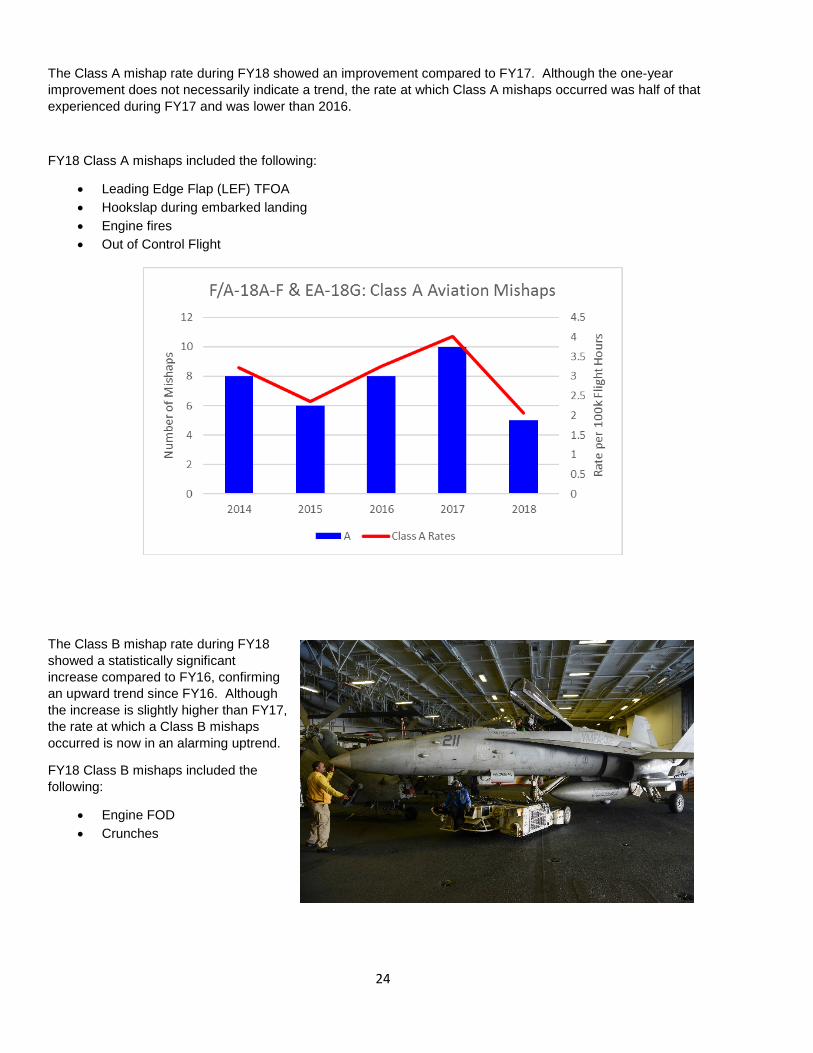
The Class A mishap rate during FY18 showed an improvement compared to FY17. Although the one-year improvement does not necessarily indicate a trend, the rate at which Class A mishaps occurred was half of that experienced during FY17 and was lower than 2016.
FY18 Class A mishaps included the following:
• Leading Edge Flap (LEF) TFOA• Hookslap during embarked landing• Engine fires• Out of Control Flight
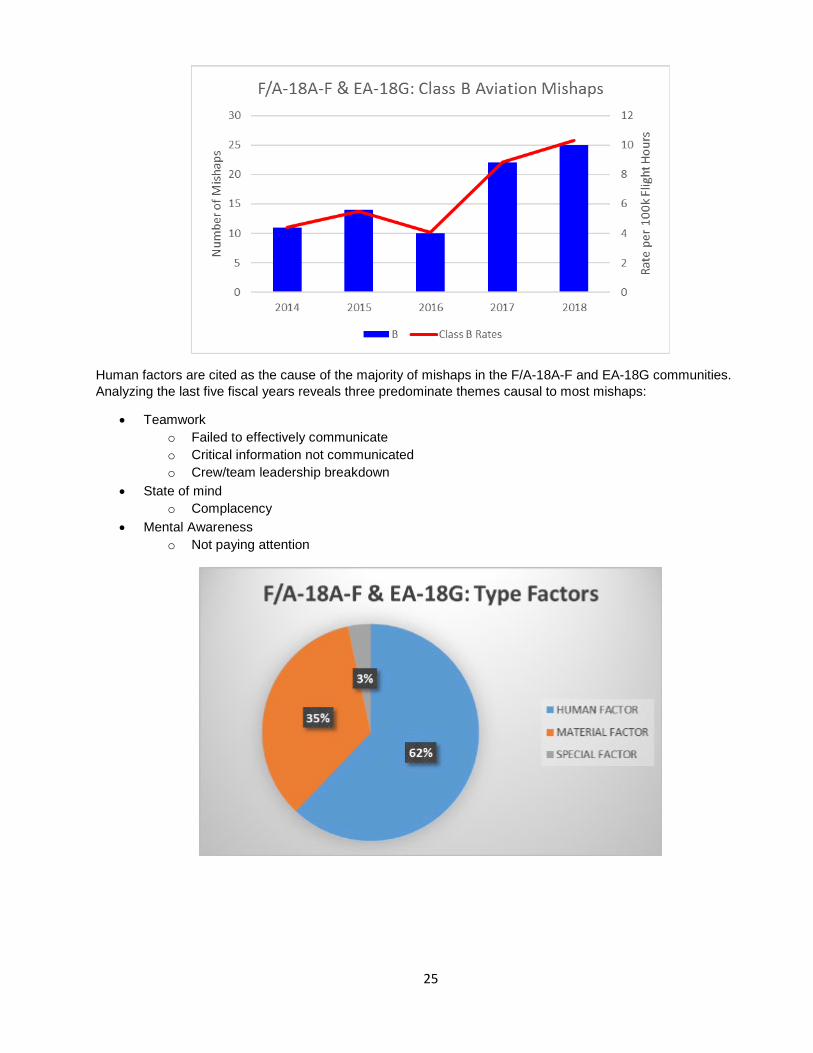
The Class B mishap rate during FY18 showed a statistically significant increase compared to FY16, confirming an upward trend since FY16. Although the increase is slightly higher than FY17, the rate at which a Class B mishaps occurred is now in an alarming uptrend.
FY18 Class B mishaps included the following:
• Engine FOD• Crunches
25
Human factors are cited as the cause of the majority of mishaps in the F/A-18A-F and EA-18G communities. Analyzing the last five fiscal years reveals three predominate themes causal to most mishaps:
• Teamworko Failed to effectively communicateo Critical information not communicatedo Crew/team leadership breakdown
• State of mindo Complacency
• Mental Awarenesso Not paying attention

26
An analysis of FY18 hazard reports indicates that the following represent hazards to the F/A-18A-F and EA-18G communities:
• BASH• TFOA• Cabin pressure fluctuations / PHYSEPS• Hydraulic return line failures• Generator failures
Recommend the following actions to counter the Class B mishap trend:
• Review/determine squadron’s NAMP FOD program effectiveness.• Review processes for aircraft movement while ashore and embarked.
Recommend the following to reduce Human Factor related mishaps:
• Incorporate team building into squadron aircrew and maintainer training with a focus on effectivecommunication.
• Emphasize proper by-the-book maintenance to mitigate the risk of complacency in the workplace.
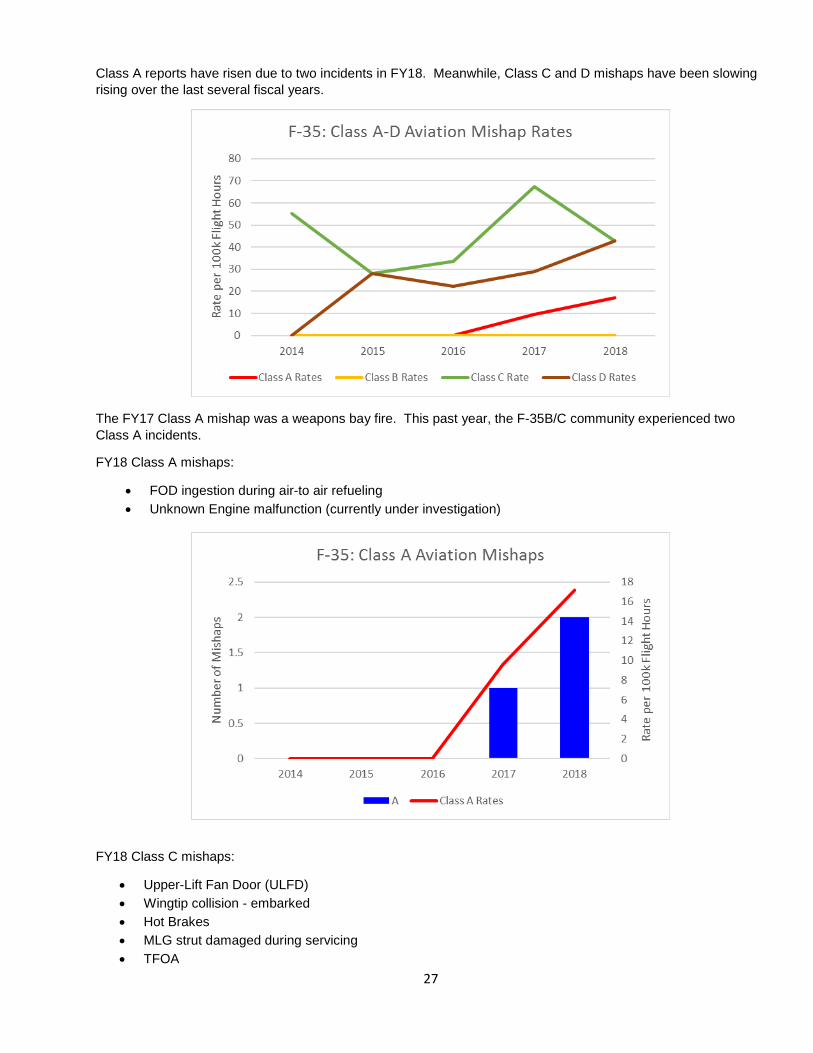
F-35 Lightning IIAs more and more aircraft are being delivered to the fleet, the number of mishaps are beginning to rise. The below graph shows a steady rise over the last five years. We expect to see higher fidelity data as we continue to receive incident Hazard Reports and SIRs.
27
Class A reports have risen due to two incidents in FY18. Meanwhile, Class C and D mishaps have been slowing rising over the last several fiscal years.
The FY17 Class A mishap was a weapons bay fire. This past year, the F-35B/C community experienced two Class A incidents.
FY18 Class A mishaps:
• FOD ingestion during air-to air refueling• Unknown Engine malfunction (currently under investigation)
FY18 Class C mishaps:
• Upper-Lift Fan Door (ULFD)• Wingtip collision - embarked• Hot Brakes• MLG strut damaged during servicing• TFOA
28
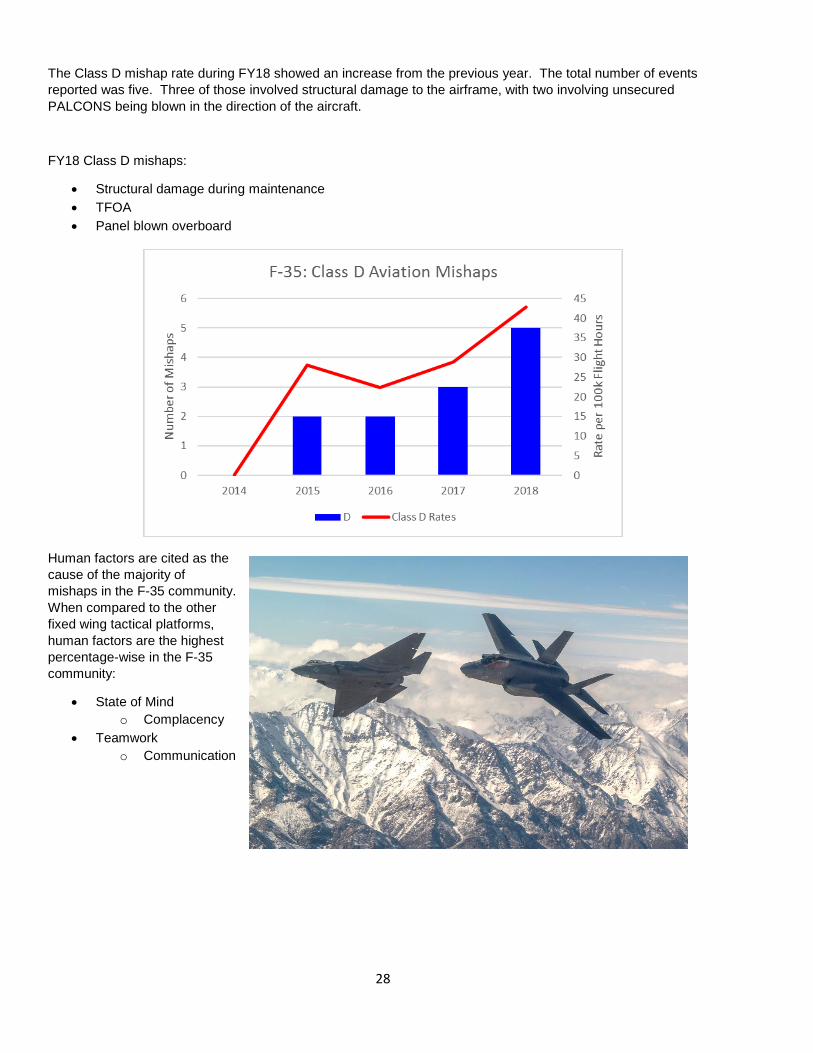
The Class D mishap rate during FY18 showed an increase from the previous year. The total number of events reported was five. Three of those involved structural damage to the airframe, with two involving unsecured PALCONS being blown in the direction of the aircraft.
FY18 Class D mishaps:
• Structural damage during maintenance• TFOA• Panel blown overboard
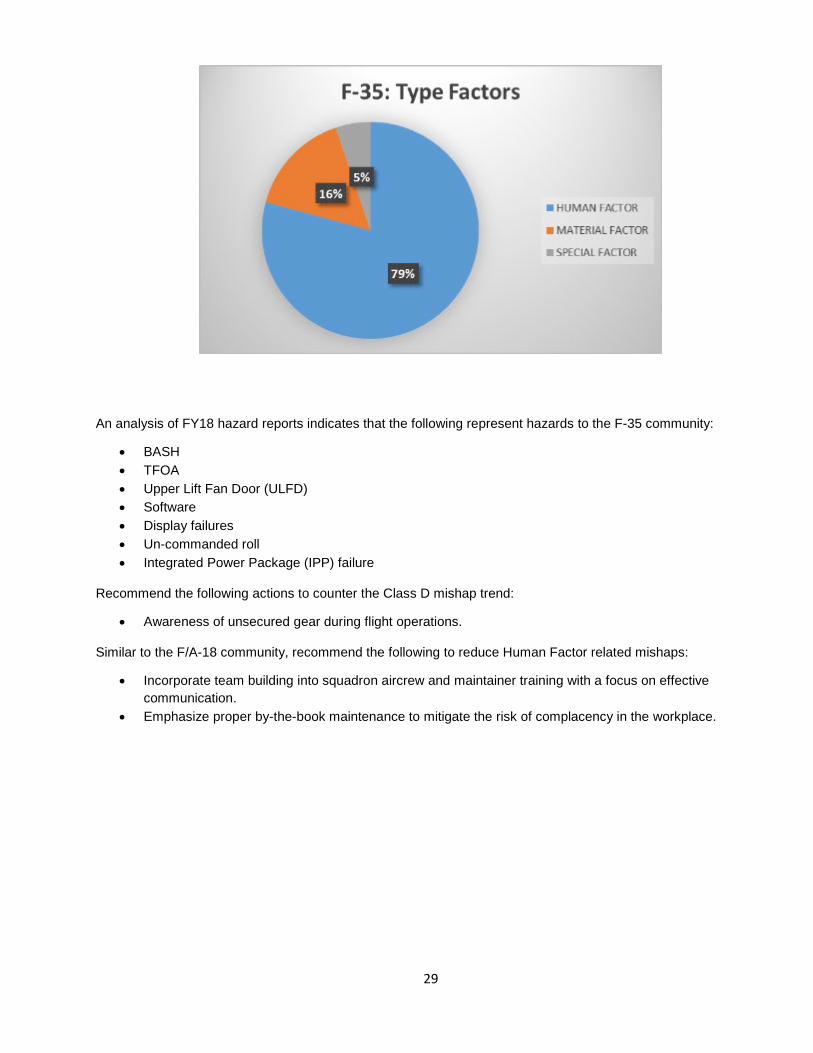
Human factors are cited as the cause of the majority of mishaps in the F-35 community. When compared to the other fixed wing tactical platforms, human factors are the highest percentage-wise in the F-35 community:
• State of Mindo Complacency
• Teamworko Communication
29
An analysis of FY18 hazard reports indicates that the following represent hazards to the F-35 community:
• BASH • TFOA • Upper Lift Fan Door (ULFD) • Software • Display failures • Un-commanded roll • Integrated Power Package (IPP) failure
Recommend the following actions to counter the Class D mishap trend:
• Awareness of unsecured gear during flight operations.
Similar to the F/A-18 community, recommend the following to reduce Human Factor related mishaps:
• Incorporate team building into squadron aircrew and maintainer training with a focus on effective communication.
• Emphasize proper by-the-book maintenance to mitigate the risk of complacency in the workplace.
30
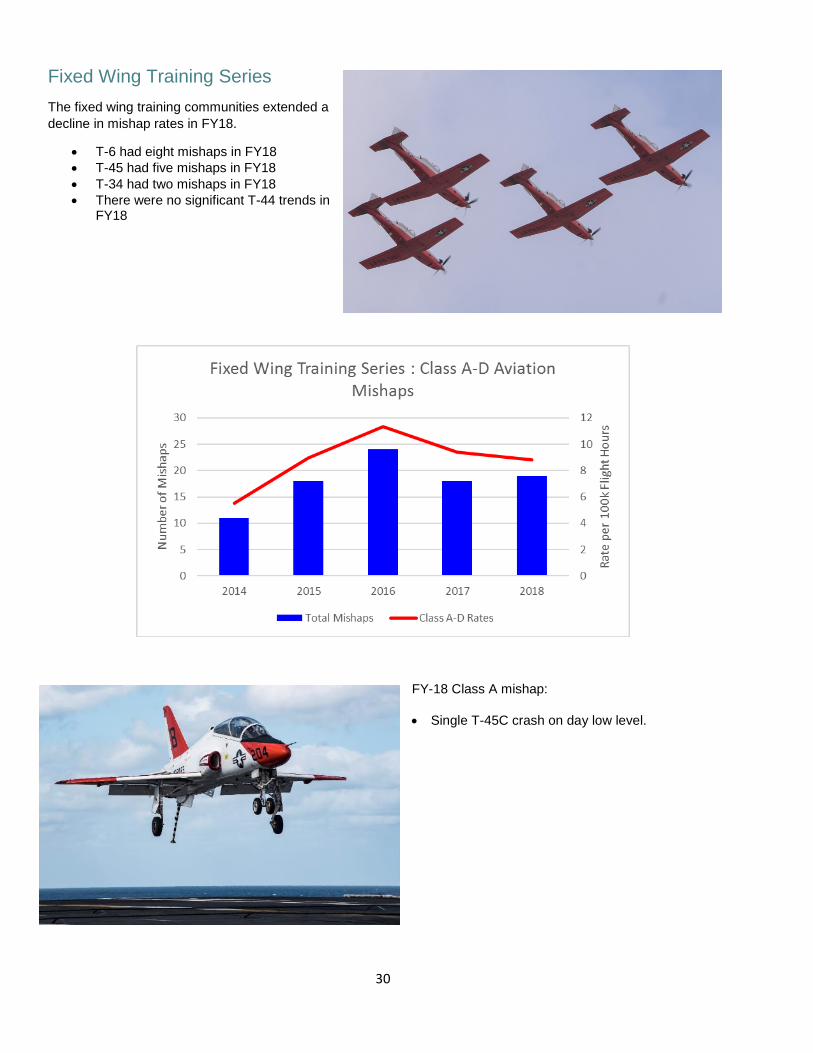
Fixed Wing Training Series The fixed wing training communities extended a decline in mishap rates in FY18.
• T-6 had eight mishaps in FY18 • T-45 had five mishaps in FY18 • T-34 had two mishaps in FY18 • There were no significant T-44 trends in
FY18
FY-18 Class A mishap: • Single T-45C crash on day low level.
31
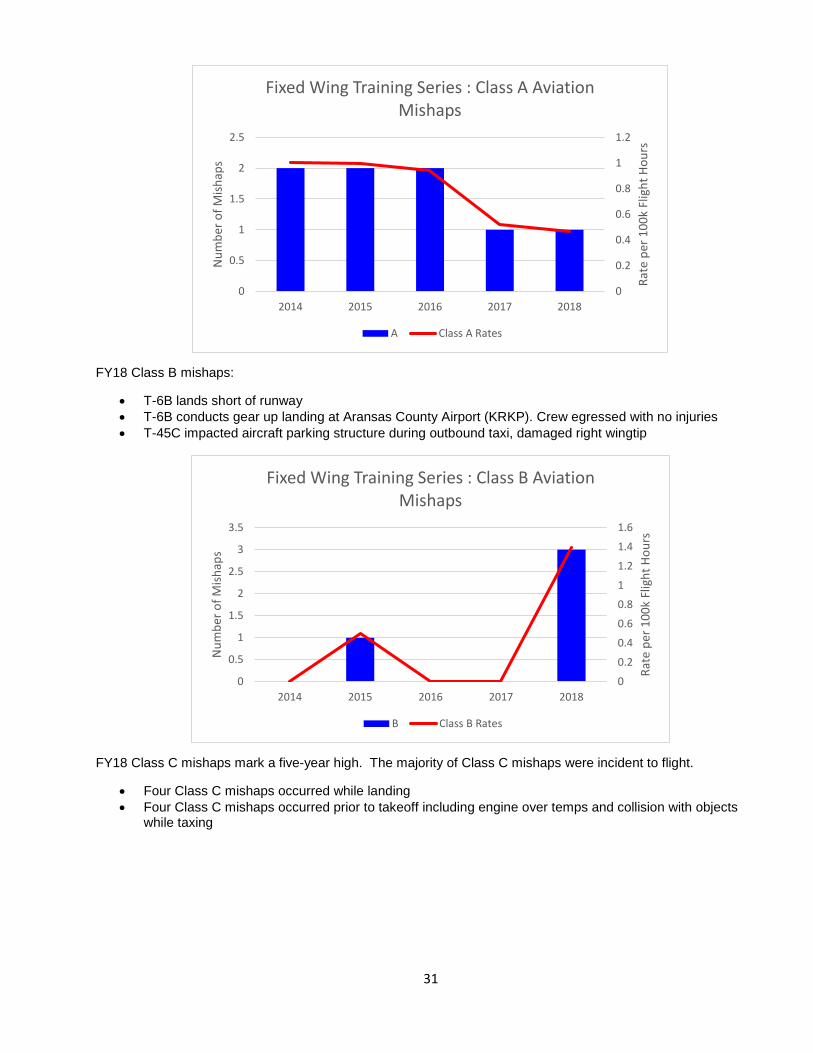
FY18 Class B mishaps:
• T-6B lands short of runway • T-6B conducts gear up landing at Aransas County Airport (KRKP). Crew egressed with no injuries • T-45C impacted aircraft parking structure during outbound taxi, damaged right wingtip
FY18 Class C mishaps mark a five-year high. The majority of Class C mishaps were incident to flight.
• Four Class C mishaps occurred while landing • Four Class C mishaps occurred prior to takeoff including engine over temps and collision with objects
while taxing
0
0.2
0.4
0.6
0.8
1
1.2
0
0.5
1
1.5
2
2.5
2014 2015 2016 2017 2018
Rate
per
100
k Fl
ight
Hou
rs
Num
ber o
f Mish
aps
Fixed Wing Training Series : Class A Aviation Mishaps
A Class A Rates
0
0.2
0.4
0.6
0.8
1
1.2
1.4
1.6
0
0.5
1
1.5
2
2.5
3
3.5
2014 2015 2016 2017 2018
Rate
per
100
k Fl
ight
Hou
rs
Num
ber o
f Mish
aps
Fixed Wing Training Series : Class B Aviation Mishaps
B Class B Rates
32
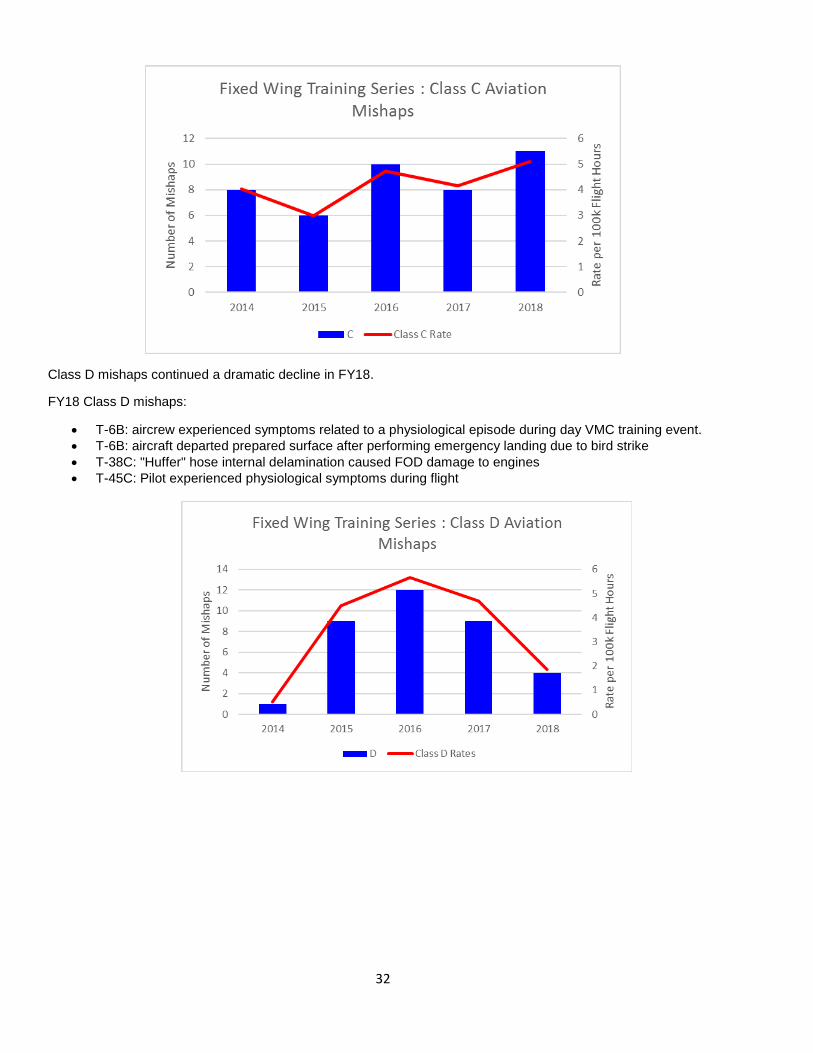
Class D mishaps continued a dramatic decline in FY18.
FY18 Class D mishaps:
• T-6B: aircrew experienced symptoms related to a physiological episode during day VMC training event. • T-6B: aircraft departed prepared surface after performing emergency landing due to bird strike • T-38C: "Huffer" hose internal delamination caused FOD damage to engines • T-45C: Pilot experienced physiological symptoms during flight
33
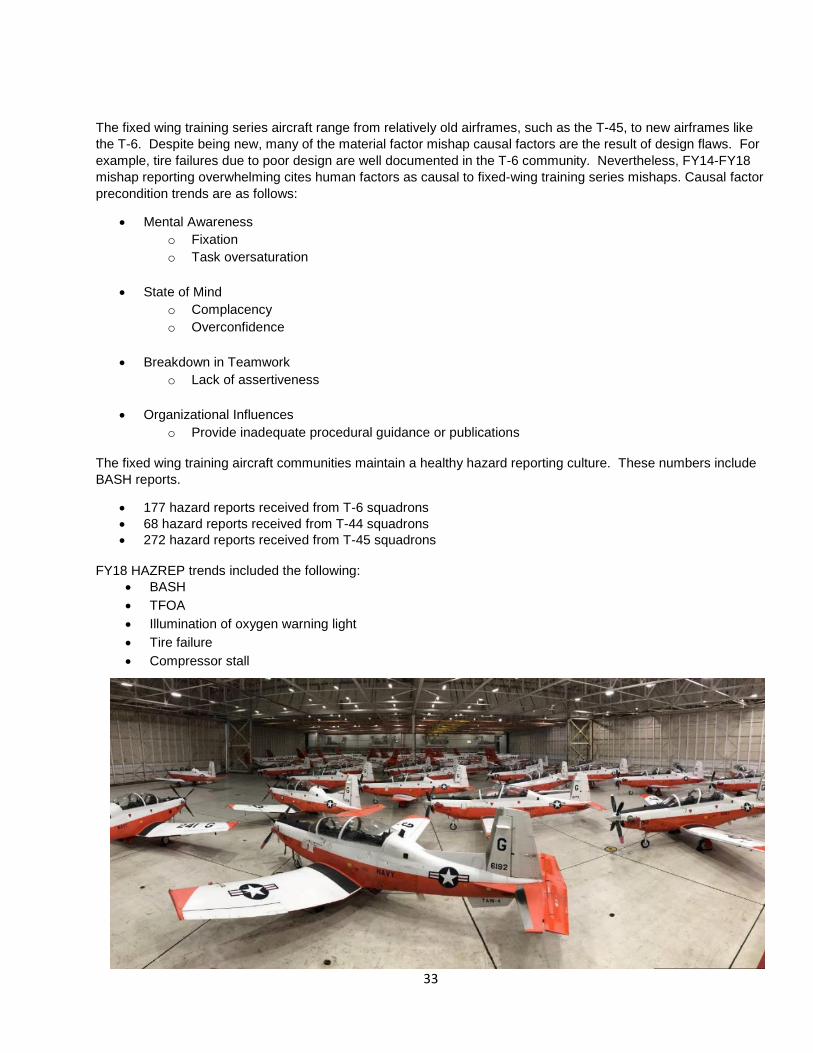
The fixed wing training series aircraft range from relatively old airframes, such as the T-45, to new airframes like the T-6. Despite being new, many of the material factor mishap causal factors are the result of design flaws. For example, tire failures due to poor design are well documented in the T-6 community. Nevertheless, FY14-FY18 mishap reporting overwhelming cites human factors as causal to fixed-wing training series mishaps. Causal factor precondition trends are as follows:
• Mental Awareness o Fixation o Task oversaturation
• State of Mind
o Complacency o Overconfidence
• Breakdown in Teamwork
o Lack of assertiveness
• Organizational Influences o Provide inadequate procedural guidance or publications
The fixed wing training aircraft communities maintain a healthy hazard reporting culture. These numbers include BASH reports.
• 177 hazard reports received from T-6 squadrons • 68 hazard reports received from T-44 squadrons • 272 hazard reports received from T-45 squadrons
FY18 HAZREP trends included the following:
• BASH • TFOA • Illumination of oxygen warning light • Tire failure • Compressor stall
34
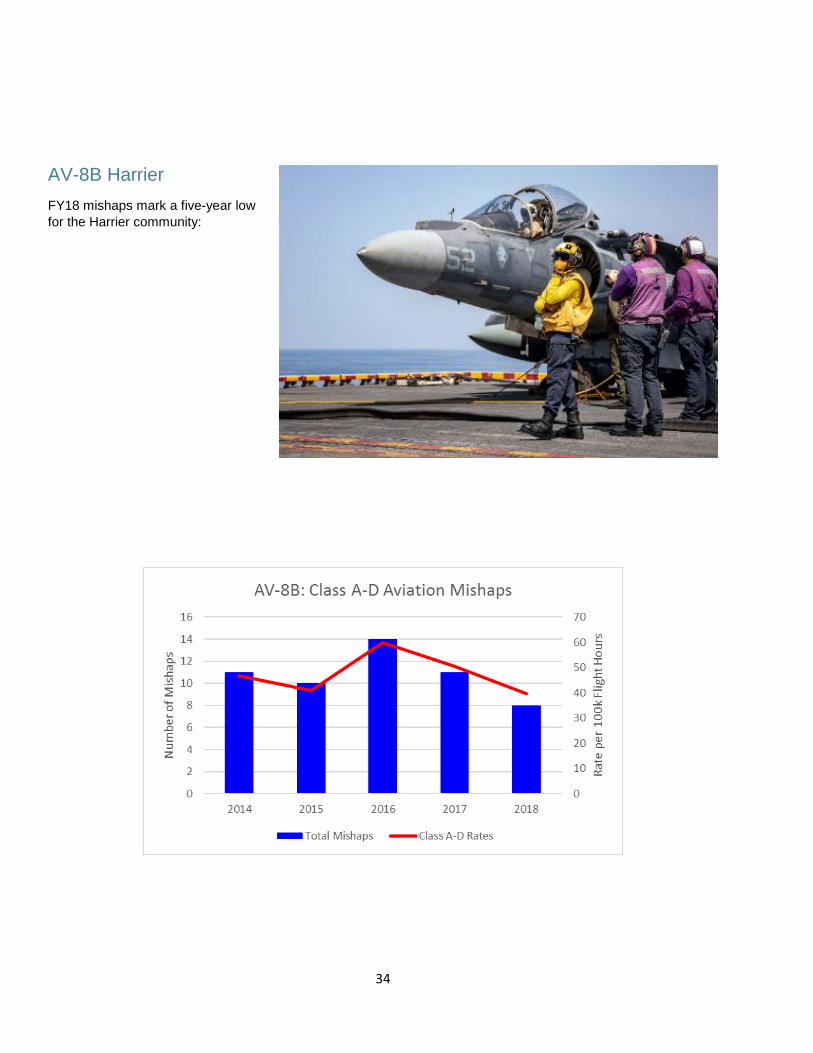
AV-8B Harrier FY18 mishaps mark a five-year low for the Harrier community:
35
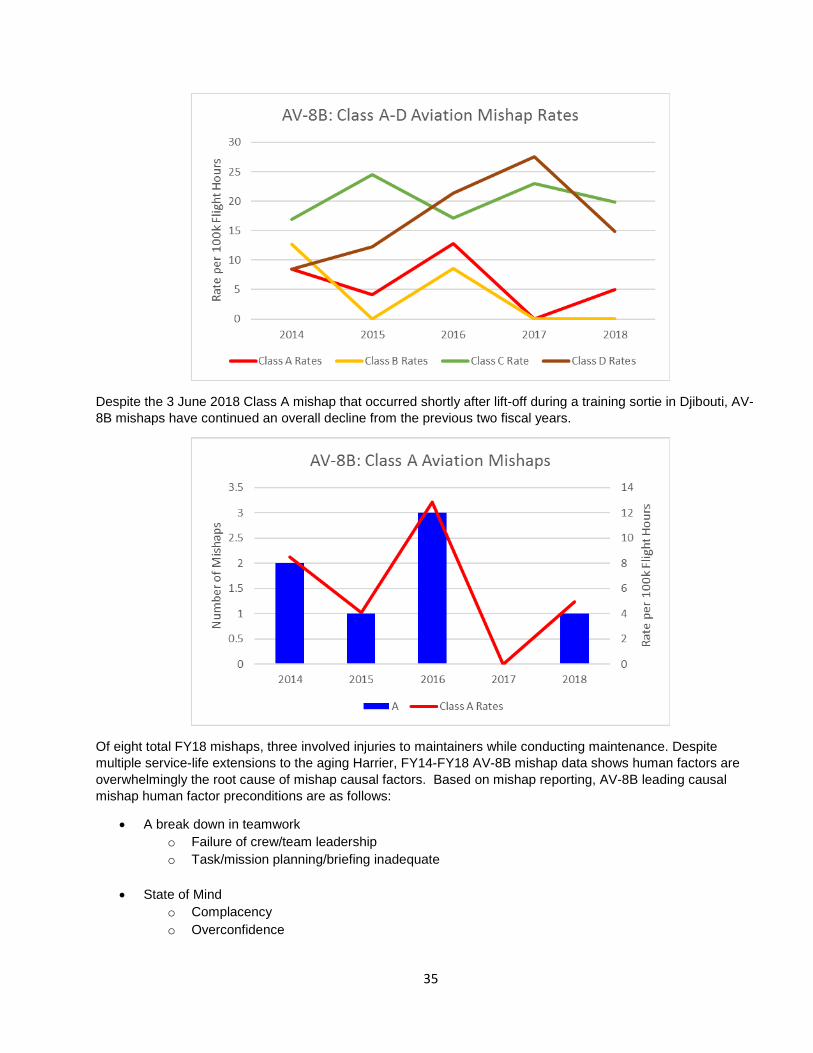
Despite the 3 June 2018 Class A mishap that occurred shortly after lift-off during a training sortie in Djibouti, AV-8B mishaps have continued an overall decline from the previous two fiscal years.
Of eight total FY18 mishaps, three involved injuries to maintainers while conducting maintenance. Despite multiple service-life extensions to the aging Harrier, FY14-FY18 AV-8B mishap data shows human factors are overwhelmingly the root cause of mishap causal factors. Based on mishap reporting, AV-8B leading causal mishap human factor preconditions are as follows:
• A break down in teamwork o Failure of crew/team leadership o Task/mission planning/briefing inadequate
• State of Mind
o Complacency o Overconfidence
36
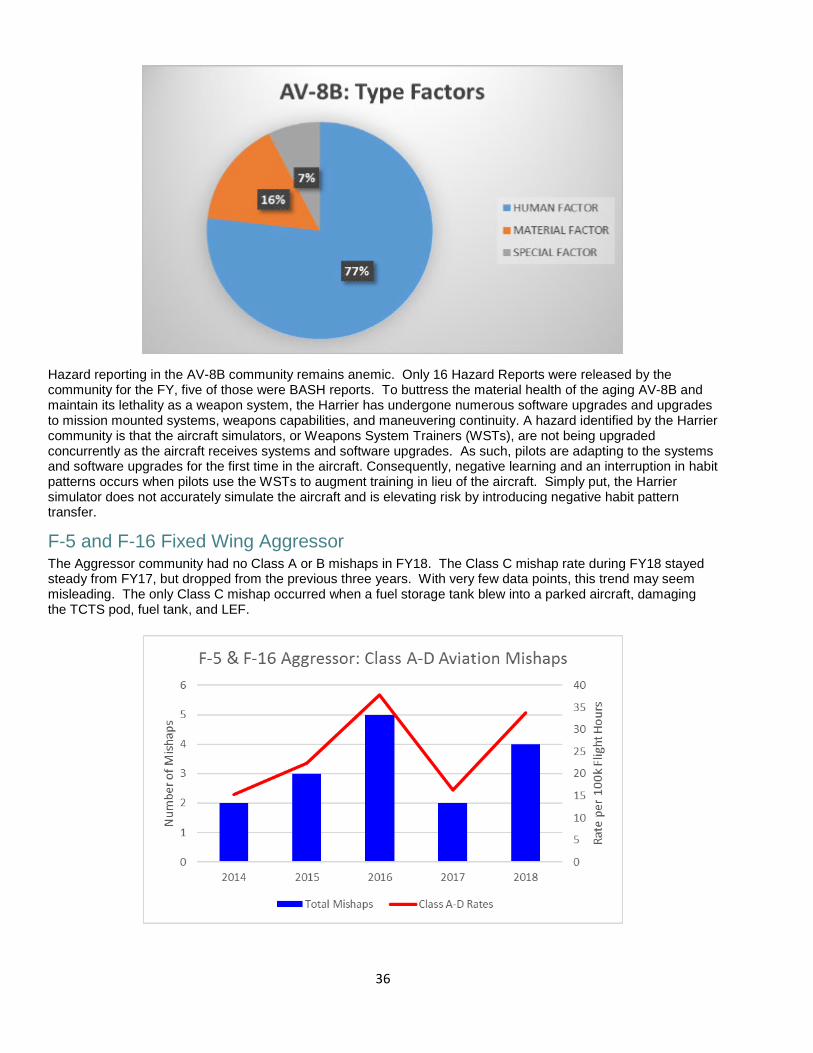
Hazard reporting in the AV-8B community remains anemic. Only 16 Hazard Reports were released by the community for the FY, five of those were BASH reports. To buttress the material health of the aging AV-8B and maintain its lethality as a weapon system, the Harrier has undergone numerous software upgrades and upgrades to mission mounted systems, weapons capabilities, and maneuvering continuity. A hazard identified by the Harrier community is that the aircraft simulators, or Weapons System Trainers (WSTs), are not being upgraded concurrently as the aircraft receives systems and software upgrades. As such, pilots are adapting to the systems and software upgrades for the first time in the aircraft. Consequently, negative learning and an interruption in habit patterns occurs when pilots use the WSTs to augment training in lieu of the aircraft. Simply put, the Harrier simulator does not accurately simulate the aircraft and is elevating risk by introducing negative habit pattern transfer.
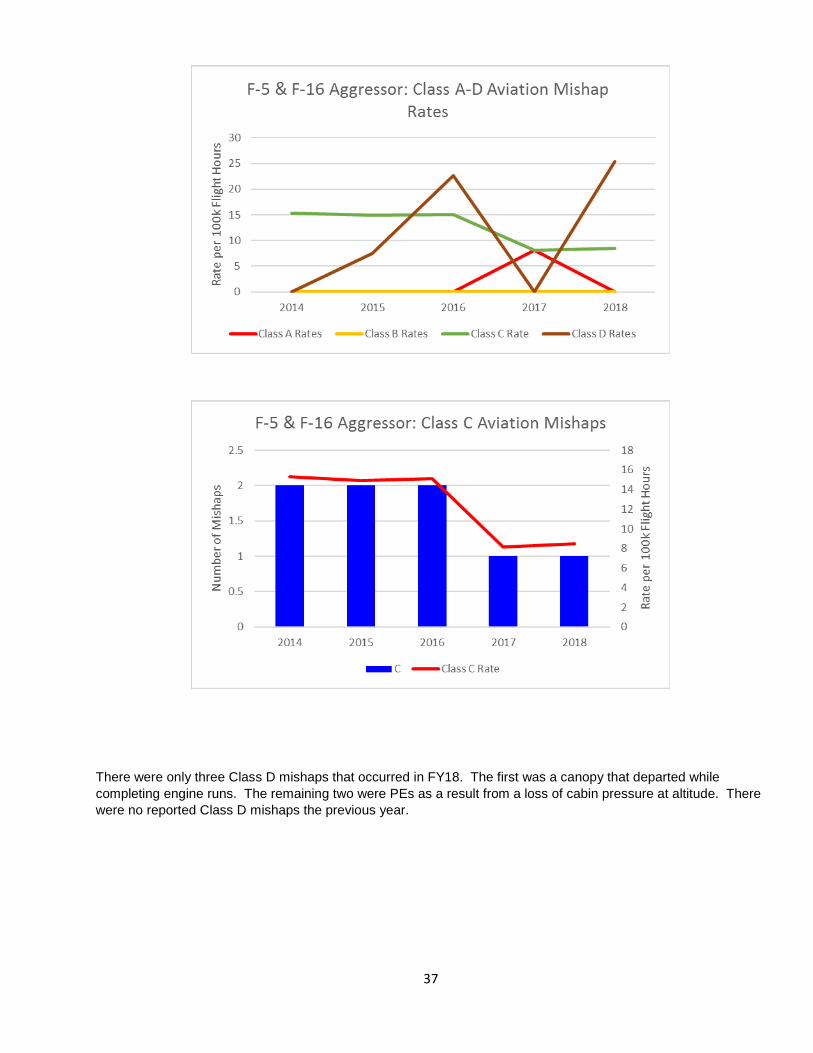
F-5 and F-16 Fixed Wing Aggressor The Aggressor community had no Class A or B mishaps in FY18. The Class C mishap rate during FY18 stayed steady from FY17, but dropped from the previous three years. With very few data points, this trend may seem misleading. The only Class C mishap occurred when a fuel storage tank blew into a parked aircraft, damaging the TCTS pod, fuel tank, and LEF.
37
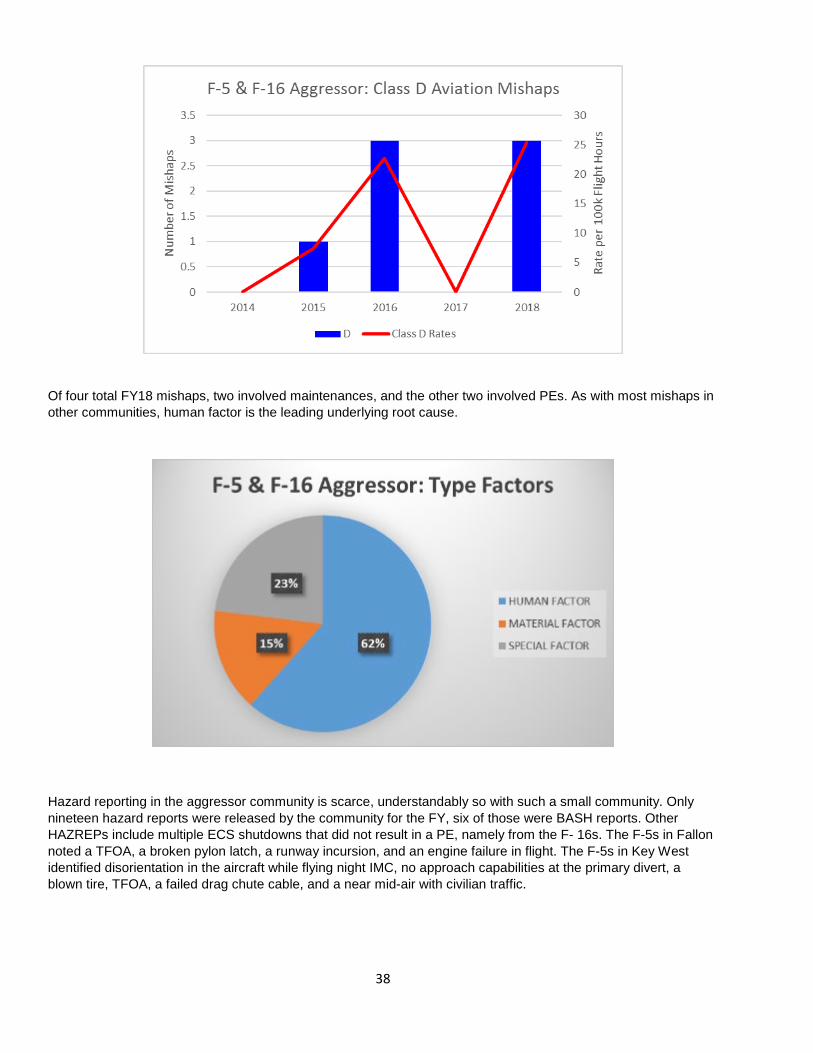
There were only three Class D mishaps that occurred in FY18. The first was a canopy that departed while completing engine runs. The remaining two were PEs as a result from a loss of cabin pressure at altitude. There were no reported Class D mishaps the previous year.
38
Of four total FY18 mishaps, two involved maintenances, and the other two involved PEs. As with most mishaps in other communities, human factor is the leading underlying root cause.
Hazard reporting in the aggressor community is scarce, understandably so with such a small community. Only nineteen hazard reports were released by the community for the FY, six of those were BASH reports. Other HAZREPs include multiple ECS shutdowns that did not result in a PE, namely from the F- 16s. The F-5s in Fallon noted a TFOA, a broken pylon latch, a runway incursion, and an engine failure in flight. The F-5s in Key West identified disorientation in the aircraft while flying night IMC, no approach capabilities at the primary divert, a blown tire, TFOA, a failed drag chute cable, and a near mid-air with civilian traffic.
39
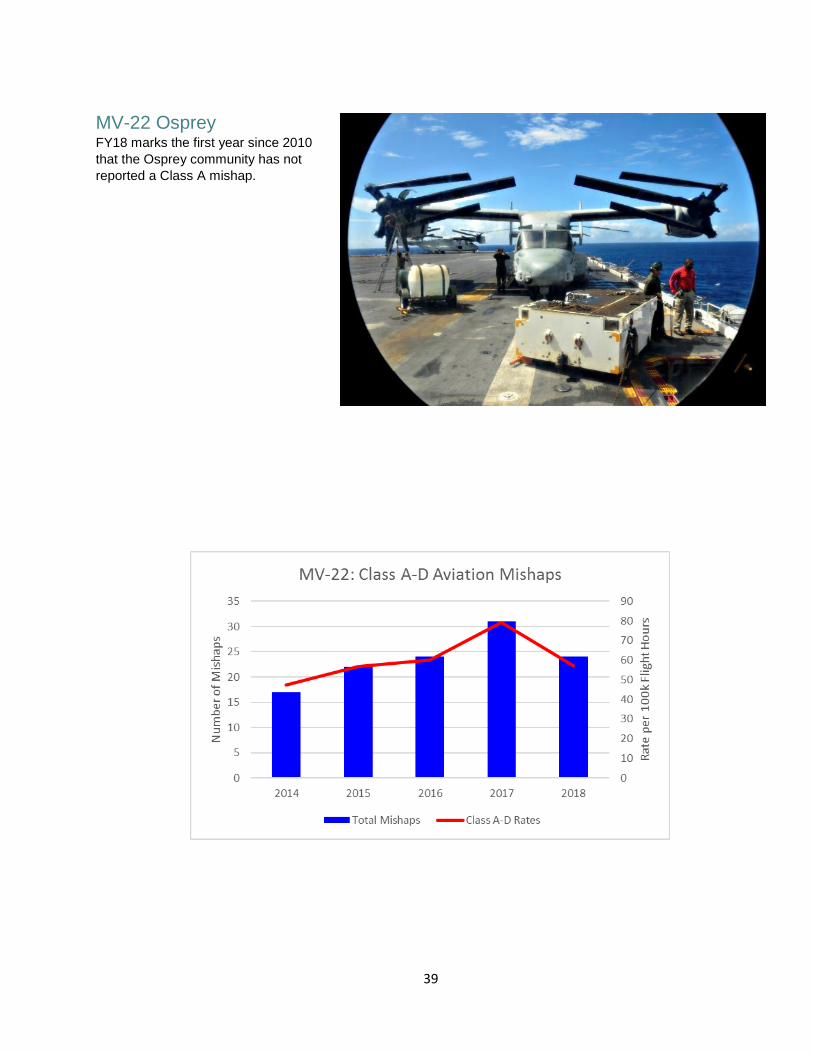
MV-22 Osprey FY18 marks the first year since 2010 that the Osprey community has not reported a Class A mishap.
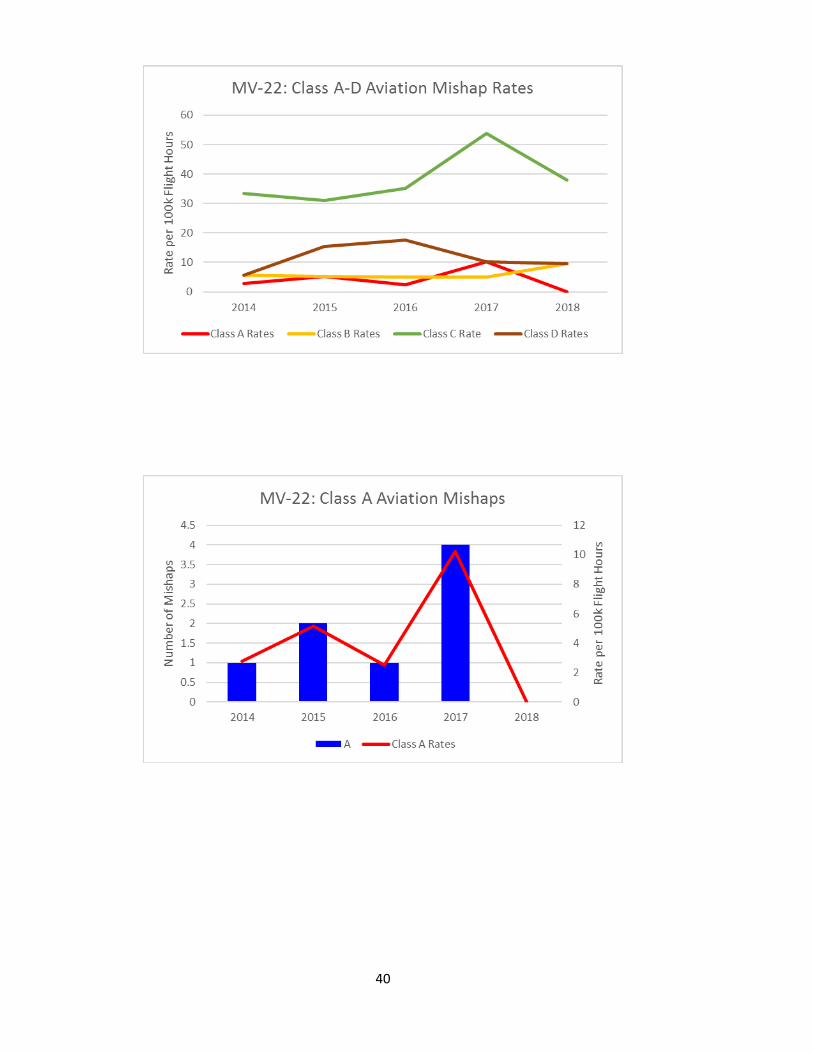
40
41
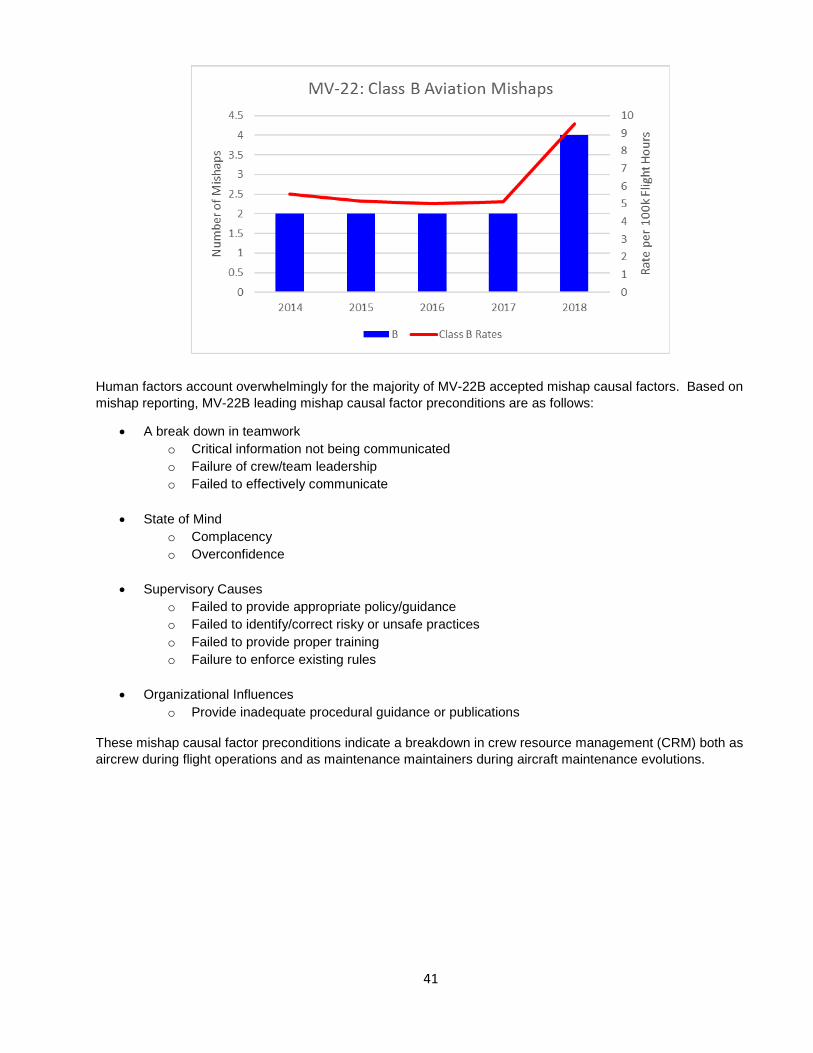
Human factors account overwhelmingly for the majority of MV-22B accepted mishap causal factors. Based on mishap reporting, MV-22B leading mishap causal factor preconditions are as follows:
• A break down in teamwork o Critical information not being communicated o Failure of crew/team leadership o Failed to effectively communicate
• State of Mind
o Complacency o Overconfidence
• Supervisory Causes
o Failed to provide appropriate policy/guidance o Failed to identify/correct risky or unsafe practices o Failed to provide proper training o Failure to enforce existing rules
• Organizational Influences
o Provide inadequate procedural guidance or publications
These mishap causal factor preconditions indicate a breakdown in crew resource management (CRM) both as aircrew during flight operations and as maintenance maintainers during aircraft maintenance evolutions.
42
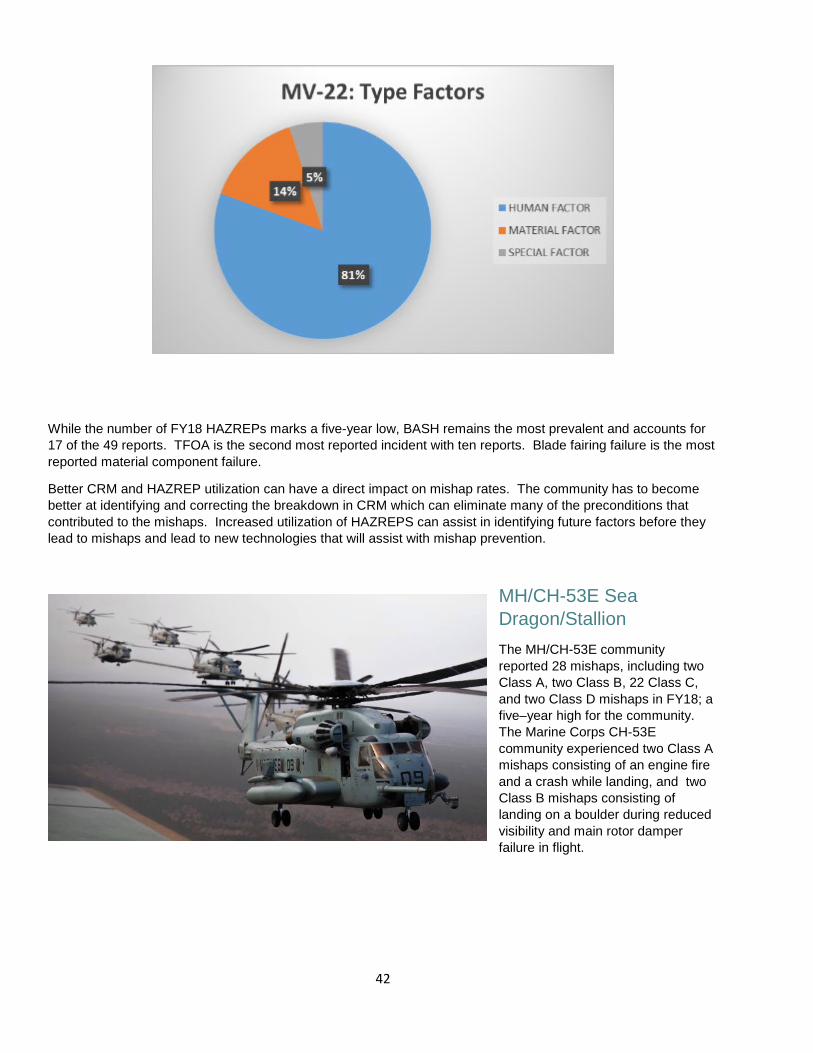
While the number of FY18 HAZREPs marks a five-year low, BASH remains the most prevalent and accounts for 17 of the 49 reports. TFOA is the second most reported incident with ten reports. Blade fairing failure is the most reported material component failure.
Better CRM and HAZREP utilization can have a direct impact on mishap rates. The community has to become better at identifying and correcting the breakdown in CRM which can eliminate many of the preconditions that contributed to the mishaps. Increased utilization of HAZREPS can assist in identifying future factors before they lead to mishaps and lead to new technologies that will assist with mishap prevention.
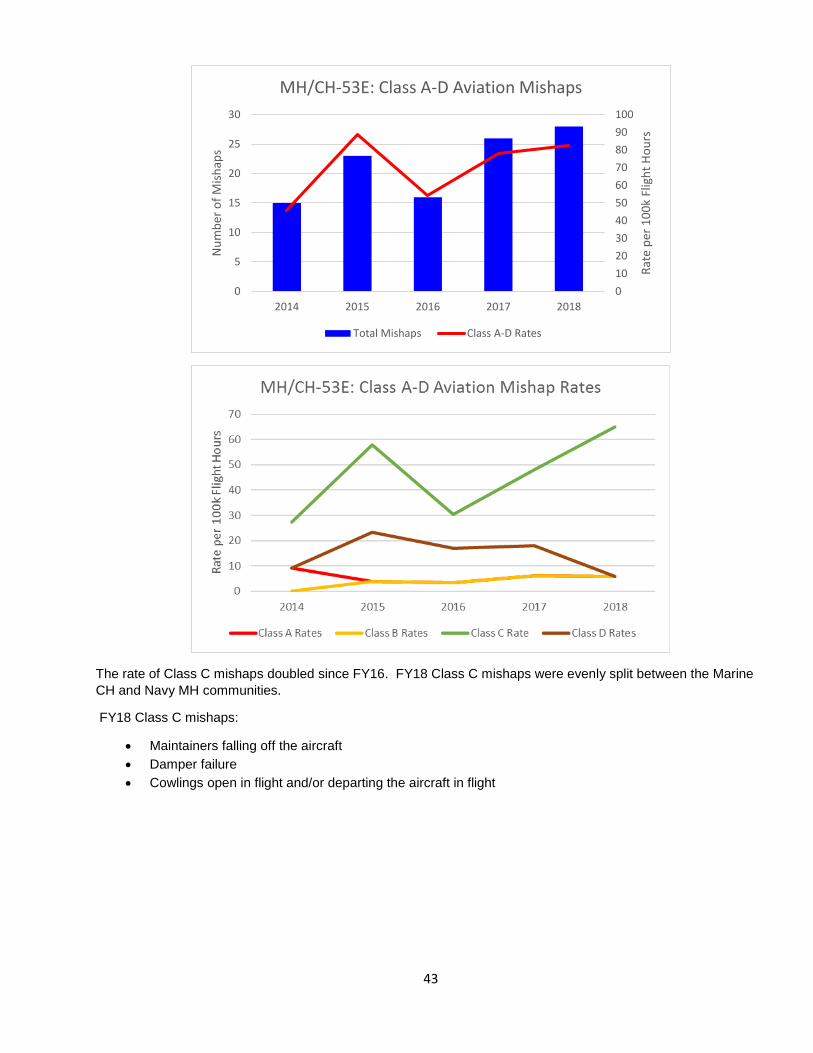
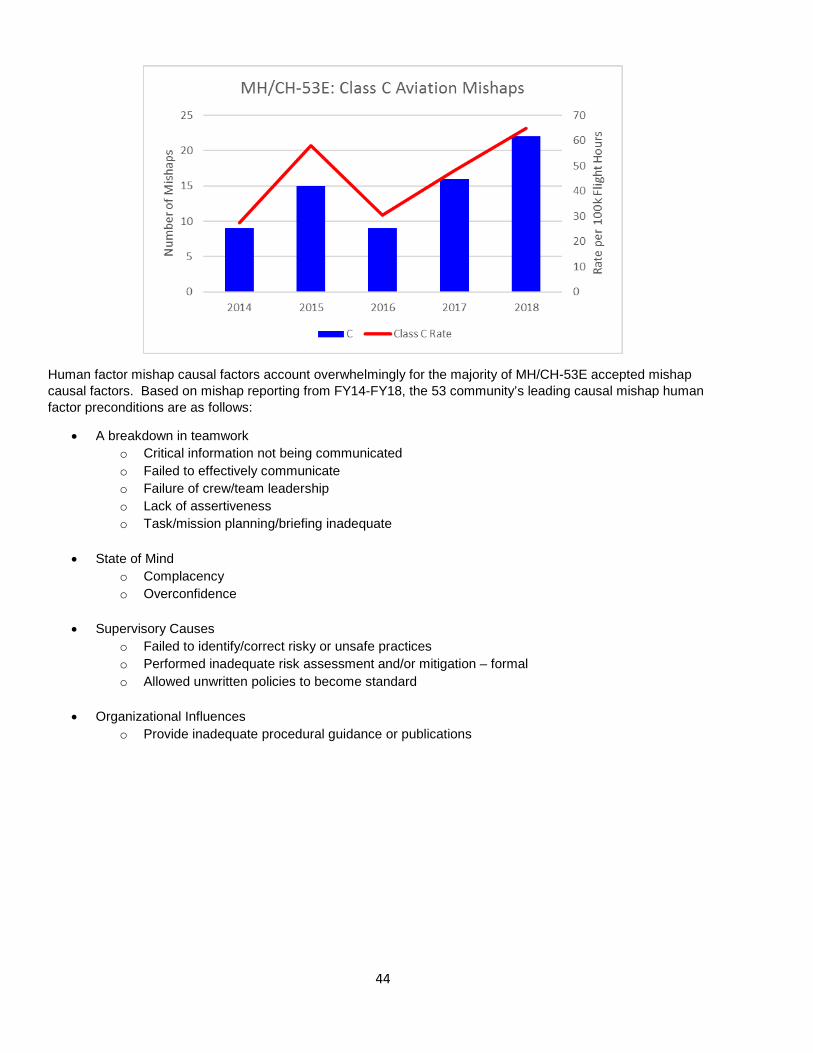
MH/CH-53E Sea Dragon/Stallion The MH/CH-53E community reported 28 mishaps, including two Class A, two Class B, 22 Class C, and two Class D mishaps in FY18; a five–year high for the community. The Marine Corps CH-53E community experienced two Class A mishaps consisting of an engine fire and a crash while landing, and two Class B mishaps consisting of landing on a boulder during reduced visibility and main rotor damper failure in flight.
43
The rate of Class C mishaps doubled since FY16. FY18 Class C mishaps were evenly split between the Marine CH and Navy MH communities.
FY18 Class C mishaps:
• Maintainers falling off the aircraft • Damper failure • Cowlings open in flight and/or departing the aircraft in flight
0102030405060708090100
0
5
10
15
20
25
30
2014 2015 2016 2017 2018
Rate
per
100
k Fl
ight
Hou
rs
Num
ber o
f Mish
aps
MH/CH-53E: Class A-D Aviation Mishaps
Total Mishaps Class A-D Rates
44
Human factor mishap causal factors account overwhelmingly for the majority of MH/CH-53E accepted mishap causal factors. Based on mishap reporting from FY14-FY18, the 53 community’s leading causal mishap human factor preconditions are as follows:
• A breakdown in teamworko Critical information not being communicatedo Failed to effectively communicateo Failure of crew/team leadershipo Lack of assertivenesso Task/mission planning/briefing inadequate
• State of Mindo Complacencyo Overconfidence
• Supervisory Causeso Failed to identify/correct risky or unsafe practiceso Performed inadequate risk assessment and/or mitigation – formalo Allowed unwritten policies to become standard
• Organizational Influenceso Provide inadequate procedural guidance or publications
45
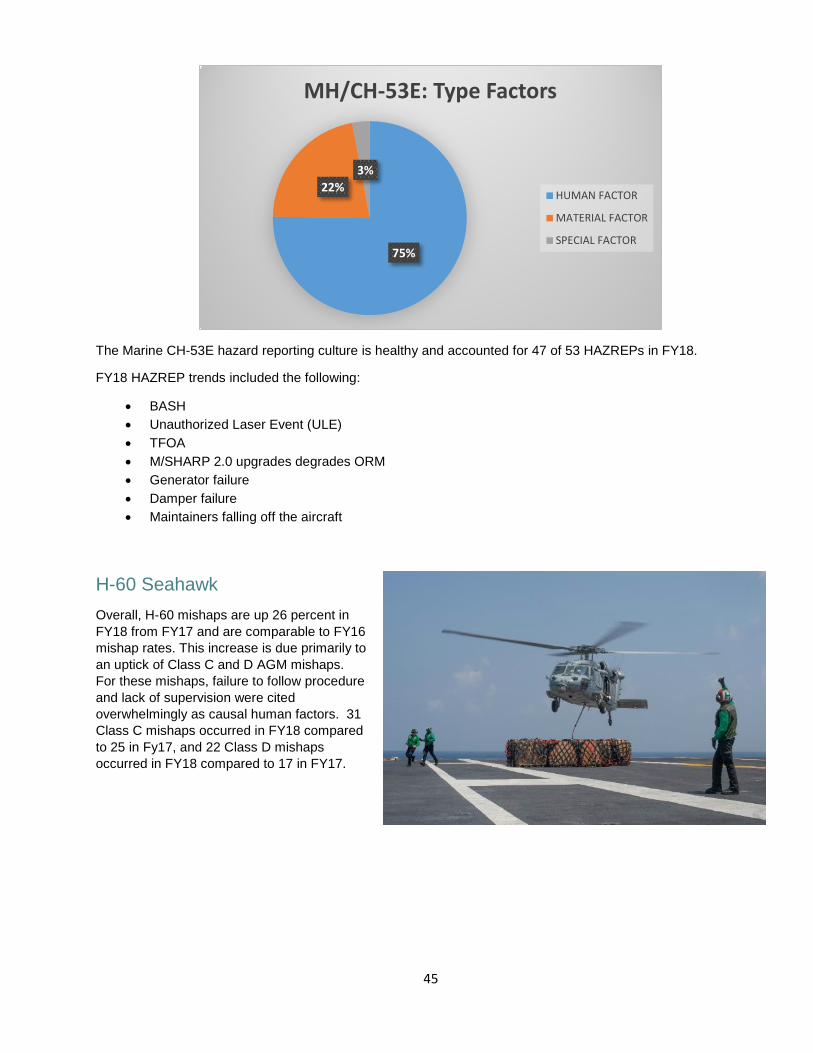
The Marine CH-53E hazard reporting culture is healthy and accounted for 47 of 53 HAZREPs in FY18.
FY18 HAZREP trends included the following:
• BASH • Unauthorized Laser Event (ULE) • TFOA • M/SHARP 2.0 upgrades degrades ORM • Generator failure • Damper failure • Maintainers falling off the aircraft
H-60 Seahawk Overall, H-60 mishaps are up 26 percent in FY18 from FY17 and are comparable to FY16 mishap rates. This increase is due primarily to an uptick of Class C and D AGM mishaps. For these mishaps, failure to follow procedure and lack of supervision were cited overwhelmingly as causal human factors. 31 Class C mishaps occurred in FY18 compared to 25 in Fy17, and 22 Class D mishaps occurred in FY18 compared to 17 in FY17.
75%
22%3%
MH/CH-53E: Type Factors
HUMAN FACTOR
MATERIAL FACTOR
SPECIAL FACTOR

46
The MH-60R community experienced two transducer related mishaps in which material factors were causal to the mishaps. The HSC community experienced three Class A mishaps:
• MH-60S experienced a hard landing while attempting to land at a Forward Air Refueling Point (FARP)• HH-60H auxiliary fuel tank was inadvertently dropped from the aircraft during maintenance severely
injuring one aircrewman and killing another• MH-60S experienced a sudden power loss while in a hover conducting Helicopter Rope Suspension
Techniques (HRST) operations
47
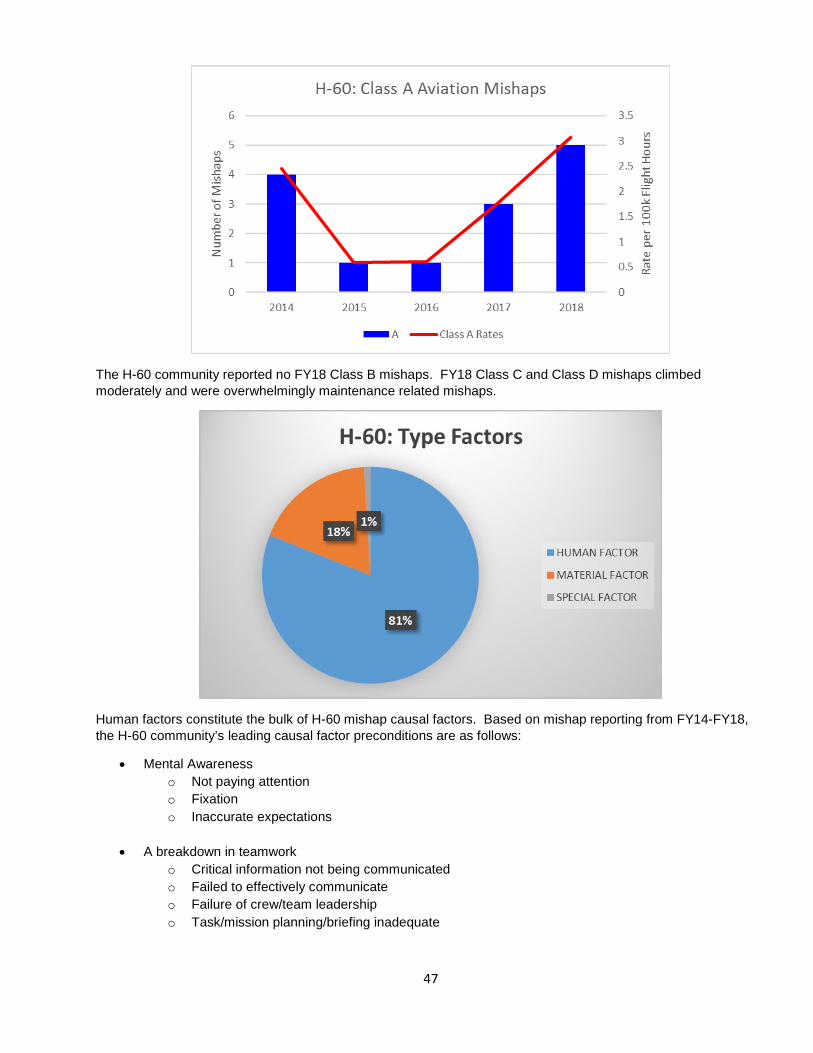
The H-60 community reported no FY18 Class B mishaps. FY18 Class C and Class D mishaps climbed moderately and were overwhelmingly maintenance related mishaps.
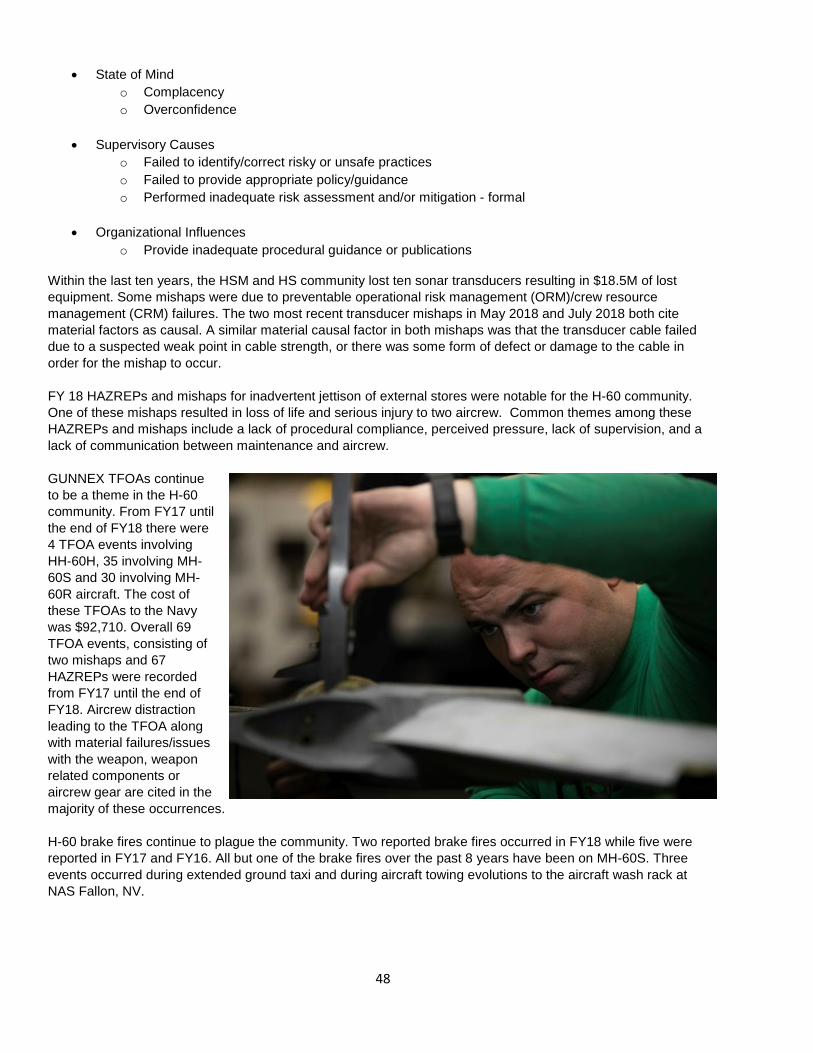
Human factors constitute the bulk of H-60 mishap causal factors. Based on mishap reporting from FY14-FY18, the H-60 community’s leading causal factor preconditions are as follows:
• Mental Awarenesso Not paying attentiono Fixationo Inaccurate expectations
• A breakdown in teamworko Critical information not being communicatedo Failed to effectively communicateo Failure of crew/team leadershipo Task/mission planning/briefing inadequate
48
• State of Mindo Complacencyo Overconfidence
• Supervisory Causeso Failed to identify/correct risky or unsafe practiceso Failed to provide appropriate policy/guidanceo Performed inadequate risk assessment and/or mitigation - formal
• Organizational Influenceso Provide inadequate procedural guidance or publications
Within the last ten years, the HSM and HS community lost ten sonar transducers resulting in $18.5M of lost equipment. Some mishaps were due to preventable operational risk management (ORM)/crew resource management (CRM) failures. The two most recent transducer mishaps in May 2018 and July 2018 both cite material factors as causal. A similar material causal factor in both mishaps was that the transducer cable failed due to a suspected weak point in cable strength, or there was some form of defect or damage to the cable in order for the mishap to occur.
FY 18 HAZREPs and mishaps for inadvertent jettison of external stores were notable for the H-60 community. One of these mishaps resulted in loss of life and serious injury to two aircrew. Common themes among these HAZREPs and mishaps include a lack of procedural compliance, perceived pressure, lack of supervision, and a lack of communication between maintenance and aircrew.
GUNNEX TFOAs continue to be a theme in the H-60 community. From FY17 until the end of FY18 there were 4 TFOA events involving HH-60H, 35 involving MH-60S and 30 involving MH-60R aircraft. The cost of these TFOAs to the Navy was $92,710. Overall 69 TFOA events, consisting of two mishaps and 67 HAZREPs were recorded from FY17 until the end of FY18. Aircrew distraction leading to the TFOA along with material failures/issues with the weapon, weapon related components or aircrew gear are cited in the majority of these occurrences.
H-60 brake fires continue to plague the community. Two reported brake fires occurred in FY18 while five werereported in FY17 and FY16. All but one of the brake fires over the past 8 years have been on MH-60S. Threeevents occurred during extended ground taxi and during aircraft towing evolutions to the aircraft wash rack atNAS Fallon, NV.
49
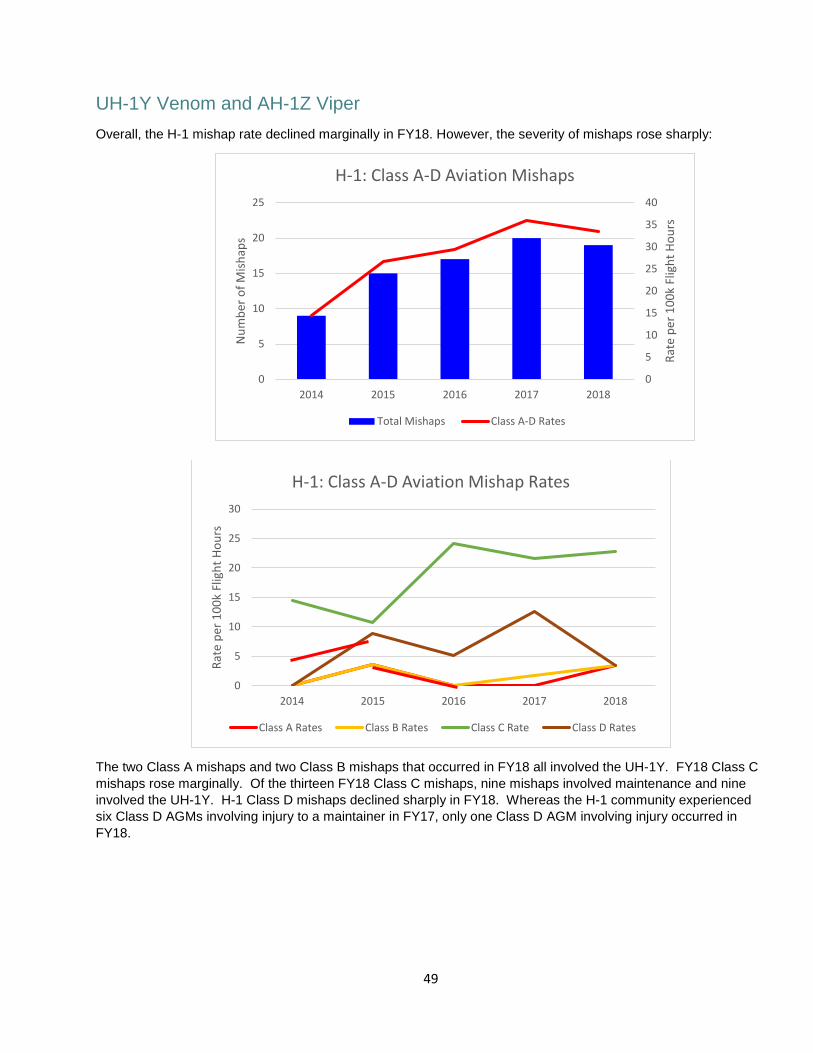
UH-1Y Venom and AH-1Z Viper Overall, the H-1 mishap rate declined marginally in FY18. However, the severity of mishaps rose sharply:
The two Class A mishaps and two Class B mishaps that occurred in FY18 all involved the UH-1Y. FY18 Class C mishaps rose marginally. Of the thirteen FY18 Class C mishaps, nine mishaps involved maintenance and nine involved the UH-1Y. H-1 Class D mishaps declined sharply in FY18. Whereas the H-1 community experienced six Class D AGMs involving injury to a maintainer in FY17, only one Class D AGM involving injury occurred in FY18.
0
5
10
15
20
25
30
2014 2015 2016 2017 2018
Rate
per
100
k Fl
ight
Hou
rs
H-1: Class A-D Aviation Mishap Rates
Class A Rates Class B Rates Class C Rate Class D Rates
0
5
10
15
20
25
30
35
40
0
5
10
15
20
25
2014 2015 2016 2017 2018
Rate
per
100
k Fl
ight
Hou
rs
Num
ber o
f Mish
aps
H-1: Class A-D Aviation Mishaps
Total Mishaps Class A-D Rates
50
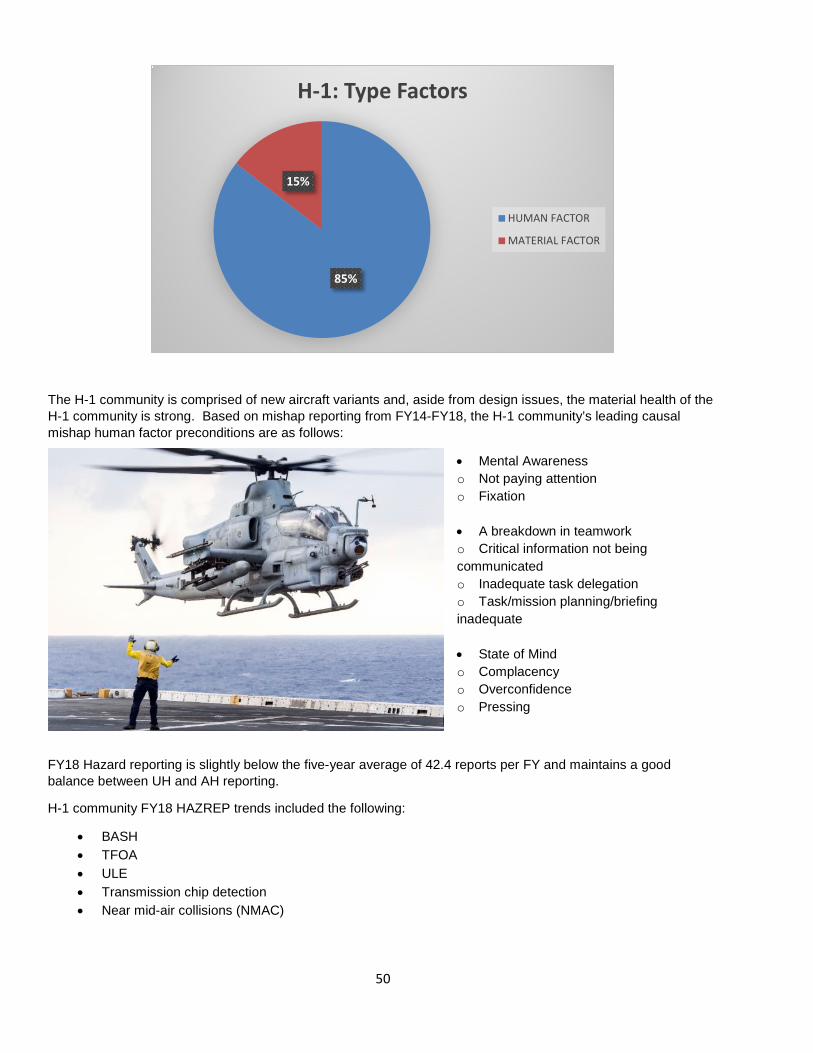
The H-1 community is comprised of new aircraft variants and, aside from design issues, the material health of the H-1 community is strong. Based on mishap reporting from FY14-FY18, the H-1 community’s leading causal mishap human factor preconditions are as follows:
• Mental Awareness o Not paying attention o Fixation • A breakdown in teamwork o Critical information not being communicated o Inadequate task delegation o Task/mission planning/briefing inadequate • State of Mind o Complacency o Overconfidence o Pressing
FY18 Hazard reporting is slightly below the five-year average of 42.4 reports per FY and maintains a good balance between UH and AH reporting.
H-1 community FY18 HAZREP trends included the following:
• BASH • TFOA • ULE • Transmission chip detection • Near mid-air collisions (NMAC)
85%
15%
H-1: Type Factors
HUMAN FACTOR
MATERIAL FACTOR

51
TH-57 Jet Ranger The TH-57 FY18 mishap rate rose marginally from the previous FY, consisting of five Class D mishaps and one Class C mishap.
52
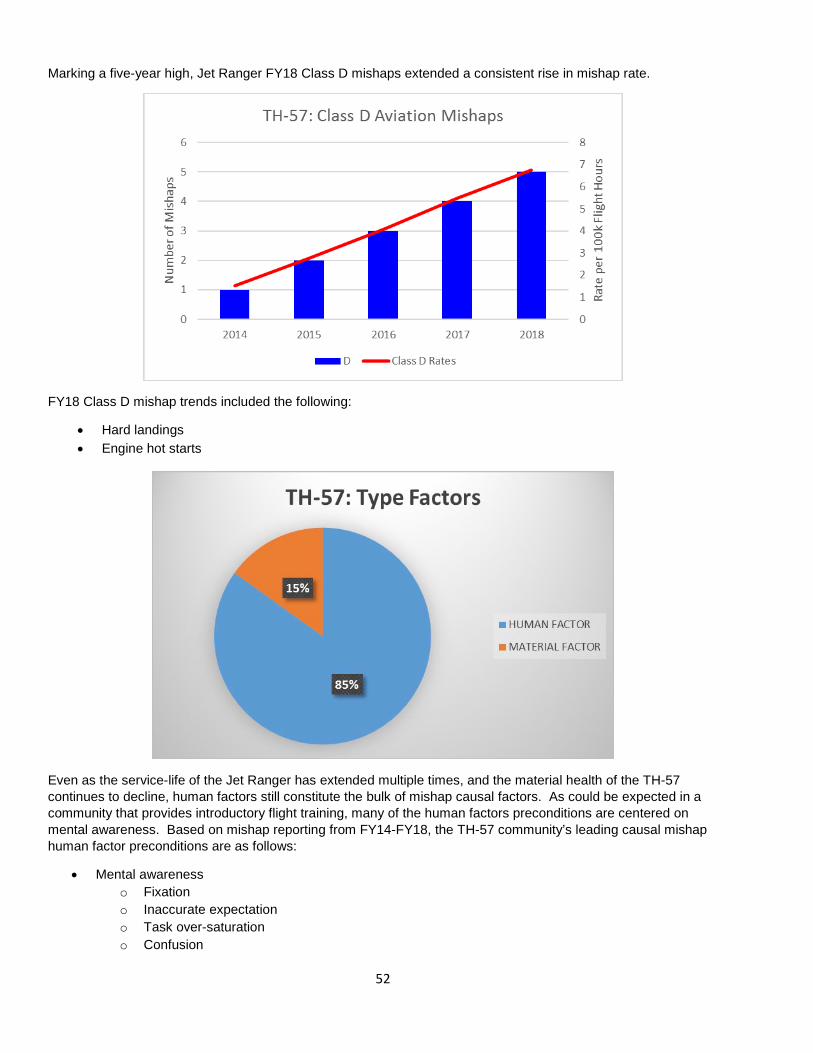
Marking a five-year high, Jet Ranger FY18 Class D mishaps extended a consistent rise in mishap rate.
FY18 Class D mishap trends included the following:
• Hard landings • Engine hot starts
Even as the service-life of the Jet Ranger has extended multiple times, and the material health of the TH-57 continues to decline, human factors still constitute the bulk of mishap causal factors. As could be expected in a community that provides introductory flight training, many of the human factors preconditions are centered on mental awareness. Based on mishap reporting from FY14-FY18, the TH-57 community’s leading causal mishap human factor preconditions are as follows:
• Mental awareness o Fixation o Inaccurate expectation o Task over-saturation o Confusion
53
• State of Mind o Complacency o Overconfidence
TH-57 hazard reporting has remained consistent. FY18 HAZREP trends included the following:
• BASH • Engine over torque • Engine over temp • Fuel/electric fumes • Hard landing • Tail strike • Near mid-air collisions (NMAC)
Unmanned Aerial Systems (UAS)
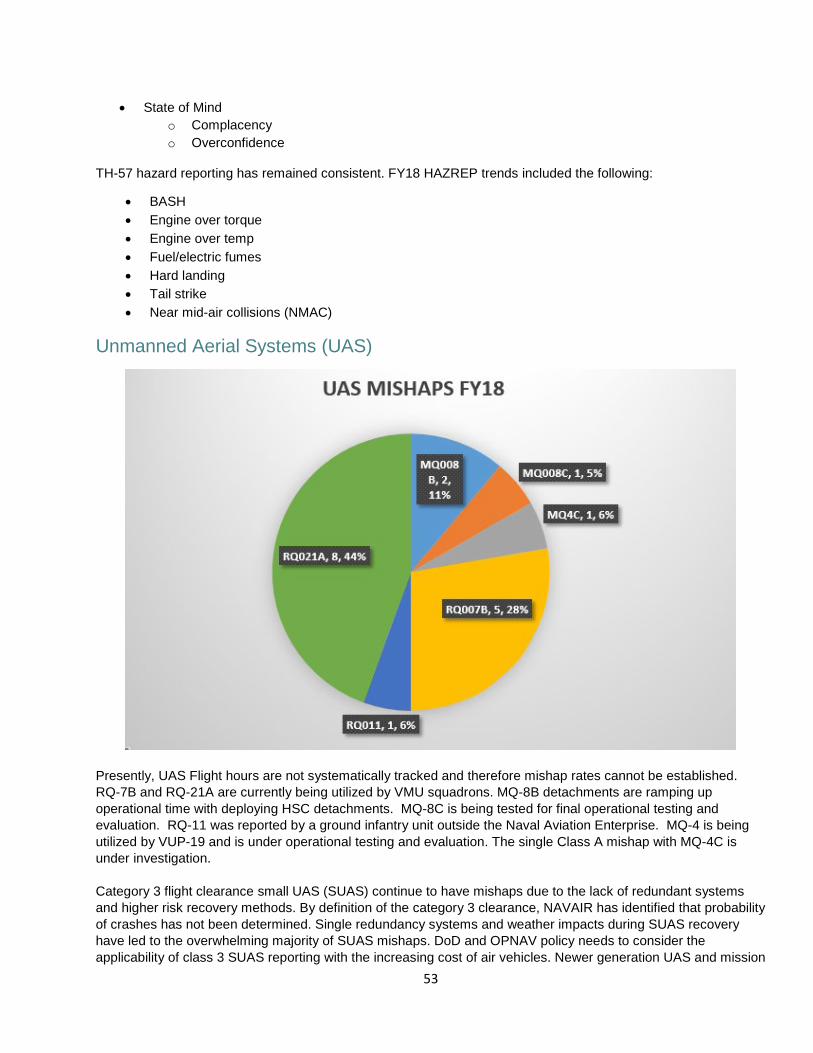
Presently, UAS Flight hours are not systematically tracked and therefore mishap rates cannot be established. RQ-7B and RQ-21A are currently being utilized by VMU squadrons. MQ-8B detachments are ramping up operational time with deploying HSC detachments. MQ-8C is being tested for final operational testing and evaluation. RQ-11 was reported by a ground infantry unit outside the Naval Aviation Enterprise. MQ-4 is being utilized by VUP-19 and is under operational testing and evaluation. The single Class A mishap with MQ-4C is under investigation. Category 3 flight clearance small UAS (SUAS) continue to have mishaps due to the lack of redundant systems and higher risk recovery methods. By definition of the category 3 clearance, NAVAIR has identified that probability of crashes has not been determined. Single redundancy systems and weather impacts during SUAS recovery have led to the overwhelming majority of SUAS mishaps. DoD and OPNAV policy needs to consider the applicability of class 3 SUAS reporting with the increasing cost of air vehicles. Newer generation UAS and mission
54
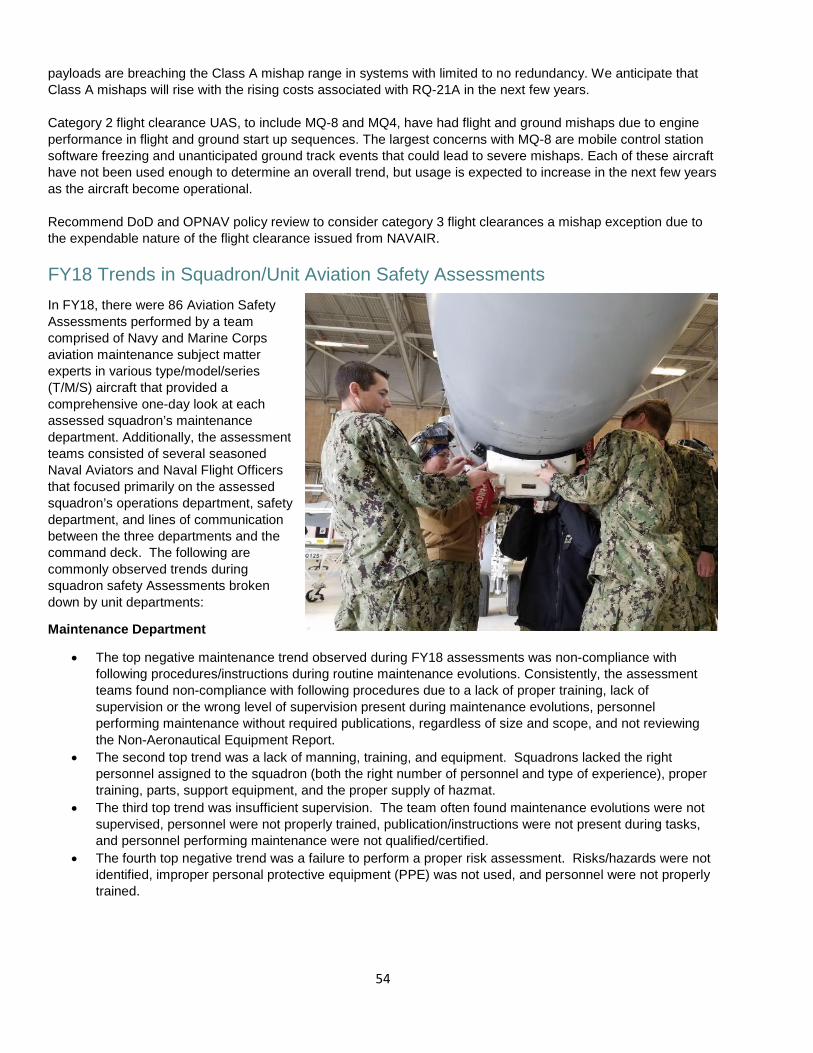
payloads are breaching the Class A mishap range in systems with limited to no redundancy. We anticipate that Class A mishaps will rise with the rising costs associated with RQ-21A in the next few years. Category 2 flight clearance UAS, to include MQ-8 and MQ4, have had flight and ground mishaps due to engine performance in flight and ground start up sequences. The largest concerns with MQ-8 are mobile control station software freezing and unanticipated ground track events that could lead to severe mishaps. Each of these aircraft have not been used enough to determine an overall trend, but usage is expected to increase in the next few years as the aircraft become operational. Recommend DoD and OPNAV policy review to consider category 3 flight clearances a mishap exception due to the expendable nature of the flight clearance issued from NAVAIR. FY18 Trends in Squadron/Unit Aviation Safety Assessments In FY18, there were 86 Aviation Safety Assessments performed by a team comprised of Navy and Marine Corps aviation maintenance subject matter experts in various type/model/series (T/M/S) aircraft that provided a comprehensive one-day look at each assessed squadron’s maintenance department. Additionally, the assessment teams consisted of several seasoned Naval Aviators and Naval Flight Officers that focused primarily on the assessed squadron’s operations department, safety department, and lines of communication between the three departments and the command deck. The following are commonly observed trends during squadron safety Assessments broken down by unit departments:
Maintenance Department
• The top negative maintenance trend observed during FY18 assessments was non-compliance with following procedures/instructions during routine maintenance evolutions. Consistently, the assessment teams found non-compliance with following procedures due to a lack of proper training, lack of supervision or the wrong level of supervision present during maintenance evolutions, personnel performing maintenance without required publications, regardless of size and scope, and not reviewing the Non-Aeronautical Equipment Report.
• The second top trend was a lack of manning, training, and equipment. Squadrons lacked the right personnel assigned to the squadron (both the right number of personnel and type of experience), proper training, parts, support equipment, and the proper supply of hazmat.
• The third top trend was insufficient supervision. The team often found maintenance evolutions were not supervised, personnel were not properly trained, publication/instructions were not present during tasks, and personnel performing maintenance were not qualified/certified.
• The fourth top negative trend was a failure to perform a proper risk assessment. Risks/hazards were not identified, improper personal protective equipment (PPE) was not used, and personnel were not properly trained.
55
Safety Department
• Many squadrons lacked a formalized Safety Management System (SMS) instruction as required by OPNAVINST 3750.6.
• Many squadrons had outdated material in their Web-Enabled Safety System (WESS) that exceeded OPNAVINST 3750.6 timelines, such as safety investigation reports (SIRs), endorsements, mishap recommendation responses, etc. • Pre-mishap drills needed to be more robust. Units needed to exercise their internal Aviation Mishap Boards (AMB) and integrate external assets such as squadron flight surgeons, crash fire rescue, air traffic controllers, etc. • Aviation Safety Awareness Programs (ASAP) were inconsistent across the Naval Aviation Enterprise (NAE). Each T/M/S employed the system uniquely. • Most Squadrons did not have an Aviation Safety Officer (ASO) without collateral duties, as delineated by instruction.
Operations Department
• Currency and proficiency gaps were strong indicators of increased risk that affected human performance. Many squadrons were flying below Deputy Commandant of Aviation (DCA) and Commander Naval Air Forces (CNAF) flight time tactical hard deck limits. It was common to see pilots flying between 8-12 hours during 30-day periods resulting in degraded proficiency.
• A safety department representative was not usually involved in the operations/maintenance long or short range planning process in USN units. All USMC squadrons integrated the director of safety and standardization (DOSS) into the deliberate Operational Risk Management planning process.
• Aircrews consistently executed weekly training, while maintenance departments used training days to catch up. Maintenance training days were usually shortened for maintenance and did not include “in rate” training.
• Squadrons were concerned with lack of Carrier Qualification (CQ) or Deck Landing Qualification (DLQ) opportunities to maintain proficiency.
Communications. The best observed squadrons shared a common theme of effective communications vertically and laterally. Effective squadron commanding officers communicated with department heads and officers as well as provided schedule updates and expectations directly to command personnel via a combination of written and verbal communication.
56
FY18 Aviation Directorate Studies
During FY18 the Naval Safety Center Aviation Safety Directorate conducted the following studies: 1. A comprehensive root-cause analysis of Class C AGMs FY13-FY17. 2. Study of all USN F/A-18 Class A mishaps FY13-FY17 to determine if a “training gap” was causal or a contributing factor to Class A mishaps. 3. A comprehensive study of Navy and Marine Corps TFOAs to determine if TFOAs are a leading indicator of squadrons “at risk” of mishap occurrence. 4. Study of F/A-18 and H-60 FY15-FY17 maintenance cannibalization of aircraft parts to test if high cannibalization rates are a harbinger of mishap risk. 5. Study of unauthorized laser events (ULEs) to naval aviation, the reporting requirements, and mediums or report promulgation across the Fleet. 6. Study of H-60 community-wide external stores inadvertent jettison.
Lessons Learned (LL) and Sanitized Safety Investigation Reports (SSIR) During FY18 the Naval Safety Center developed and disseminated the following Lessons Learned and Sanitized Safety Investigation Reports for the Aviation community:
1. Wrong Oil in Aircraft – LL 18-01 2. Gasoline vs Jet Fuel – LL 18-02 3. FA-18 and EA-18 Turn Screen Pins – LL 18-06 4. Growler Tipover – LL 18-08 5. Helo Uncommanded Ground Yaw – LL 18-10 6. Aerial Refueling System (ARS) Basket Incorrectly Configured – LL 18-12 7. Inadvertent Jettison (Jet and Hel0) of Fuel Tanks – LL 18-14 8. Helo Wire Strike – SSIR 18-01 9. Helo Sonar Transducer Lost – SSIR 18-03 10. Helo Intermediate Gearbox (IGB) Failure – SSIR 18-04 11. H-53 Fuel Starvation –SSIR 18-05 12. MV-22 Landed On Deck Edge – SSIR 18-07 All of these Lessons Learned and Sanitized SIRs are available on the “Lessons Learned” pages of the Naval Safety Center’s CAC-enabled website, https://intelshare.intelink.gov/sites/navsafe.
57
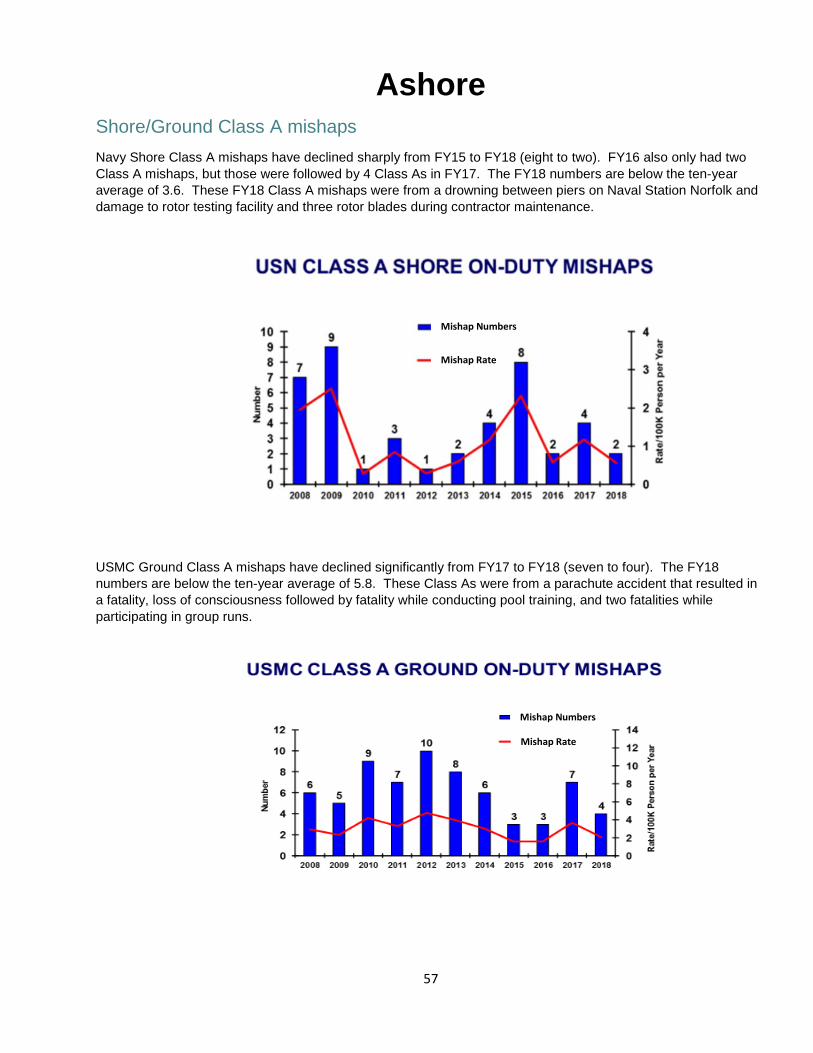
Ashore Shore/Ground Class A mishaps Navy Shore Class A mishaps have declined sharply from FY15 to FY18 (eight to two). FY16 also only had two Class A mishaps, but those were followed by 4 Class As in FY17. The FY18 numbers are below the ten-year average of 3.6. These FY18 Class A mishaps were from a drowning between piers on Naval Station Norfolk and damage to rotor testing facility and three rotor blades during contractor maintenance.
USMC Ground Class A mishaps have declined significantly from FY17 to FY18 (seven to four). The FY18 numbers are below the ten-year average of 5.8. These Class As were from a parachute accident that resulted in a fatality, loss of consciousness followed by fatality while conducting pool training, and two fatalities while participating in group runs.
Mishap Numbers
Mishap Rate
Mishap Numbers
Mishap Rate
58
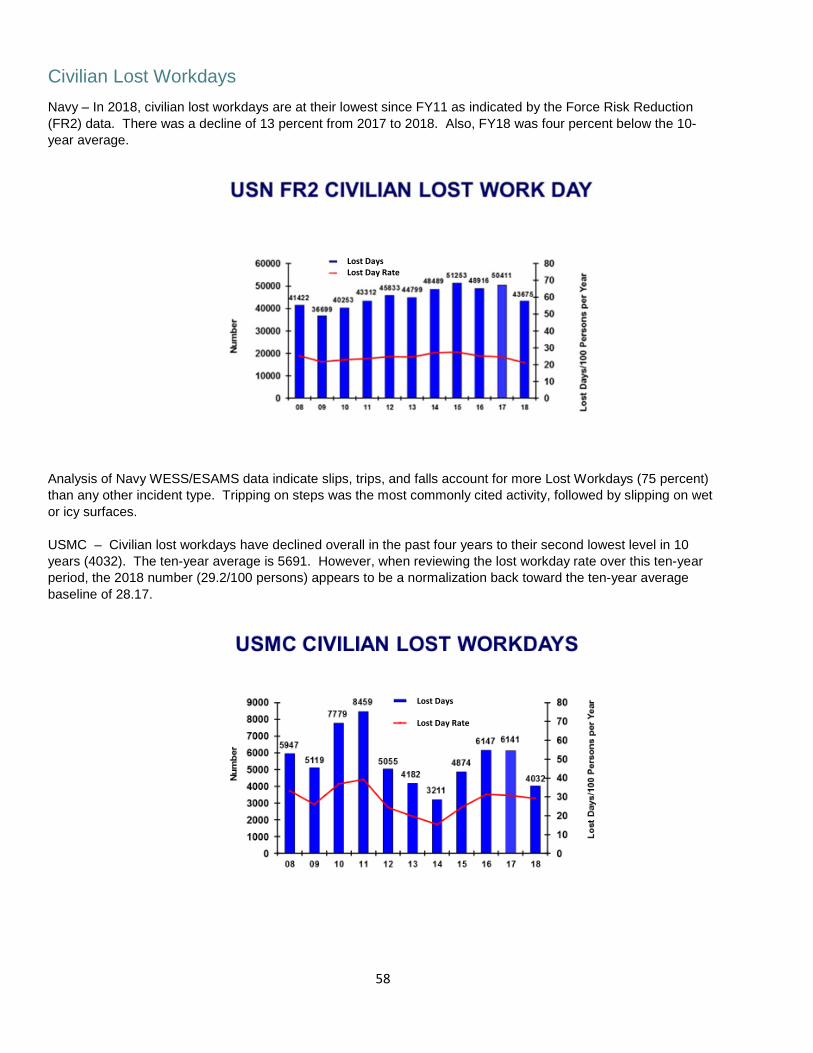
Civilian Lost Workdays Navy – In 2018, civilian lost workdays are at their lowest since FY11 as indicated by the Force Risk Reduction (FR2) data. There was a decline of 13 percent from 2017 to 2018. Also, FY18 was four percent below the 10-year average.
Analysis of Navy WESS/ESAMS data indicate slips, trips, and falls account for more Lost Workdays (75 percent) than any other incident type. Tripping on steps was the most commonly cited activity, followed by slipping on wet or icy surfaces. USMC – Civilian lost workdays have declined overall in the past four years to their second lowest level in 10 years (4032). The ten-year average is 5691. However, when reviewing the lost workday rate over this ten-year period, the 2018 number (29.2/100 persons) appears to be a normalization back toward the ten-year average baseline of 28.17.
Lost Days Lost Day Rate
Lost Days
Lost Day Rate
59
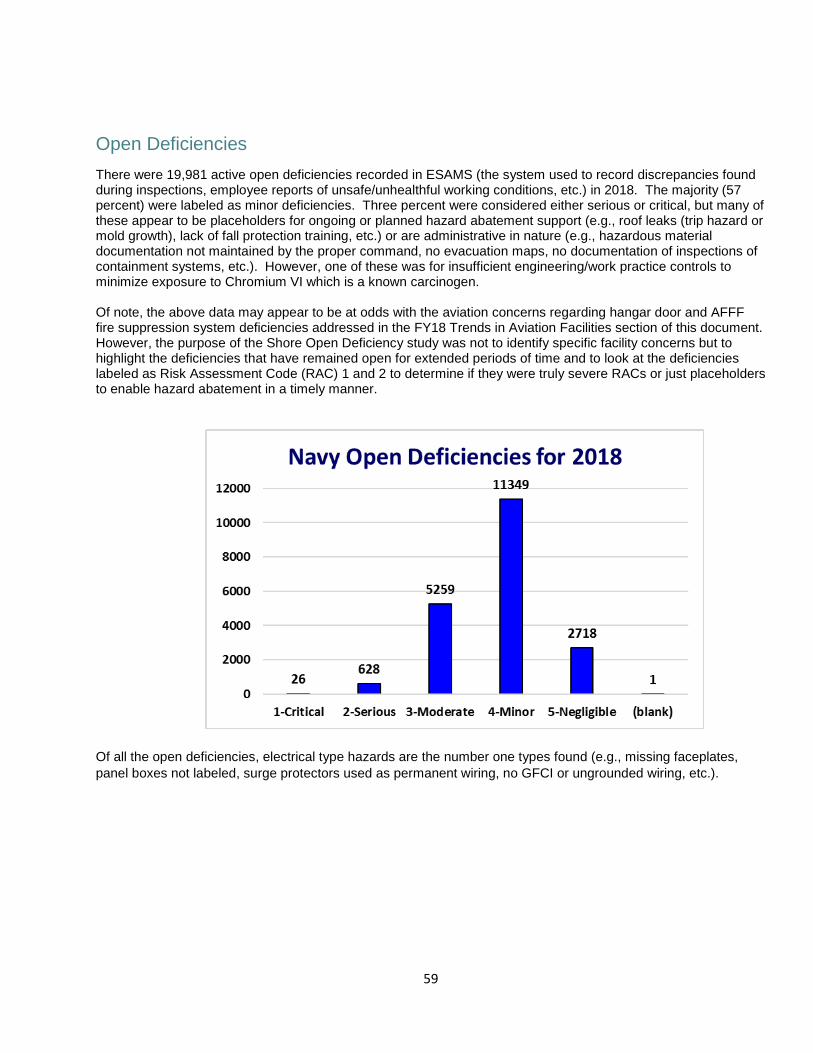
Open Deficiencies There were 19,981 active open deficiencies recorded in ESAMS (the system used to record discrepancies found during inspections, employee reports of unsafe/unhealthful working conditions, etc.) in 2018. The majority (57 percent) were labeled as minor deficiencies. Three percent were considered either serious or critical, but many of these appear to be placeholders for ongoing or planned hazard abatement support (e.g., roof leaks (trip hazard or mold growth), lack of fall protection training, etc.) or are administrative in nature (e.g., hazardous material documentation not maintained by the proper command, no evacuation maps, no documentation of inspections of containment systems, etc.). However, one of these was for insufficient engineering/work practice controls to minimize exposure to Chromium VI which is a known carcinogen.
Of note, the above data may appear to be at odds with the aviation concerns regarding hangar door and AFFF fire suppression system deficiencies addressed in the FY18 Trends in Aviation Facilities section of this document. However, the purpose of the Shore Open Deficiency study was not to identify specific facility concerns but to highlight the deficiencies that have remained open for extended periods of time and to look at the deficiencies labeled as Risk Assessment Code (RAC) 1 and 2 to determine if they were truly severe RACs or just placeholders to enable hazard abatement in a timely manner.
Of all the open deficiencies, electrical type hazards are the number one types found (e.g., missing faceplates, panel boxes not labeled, surge protectors used as permanent wiring, no GFCI or ungrounded wiring, etc.).

60
Open deficiencies are a sign of good safety assurance; however, they must be tracked to closure to prevent hazards in the workplace. There are some minor electrical discrepancies that are still open and date back to 2004. Some common deficiencies that have been open for more than 10 years are chipping paint, leaking roofs, cracked floors and walls, ratings not stenciled on landings, docks, floors, etc., improper storage of hazardous material, emergency lighting not working, and working more than four feet in the air. The average number of days a deficiency stays open within the Navy is 1371 days (almost four years).
OSHA Citations In FY18 there were 37 visits with a total of 37 citations issued (average one citation per visit) with 76 percent categorized as serious violations. In FY17 there were 56 visits with 133 citations issued (average 2.4 citations per visit) with 74 percent categorized as serious violations. There has been an overall downward trend of serious violations from FY15 (110) to FY18 (28).
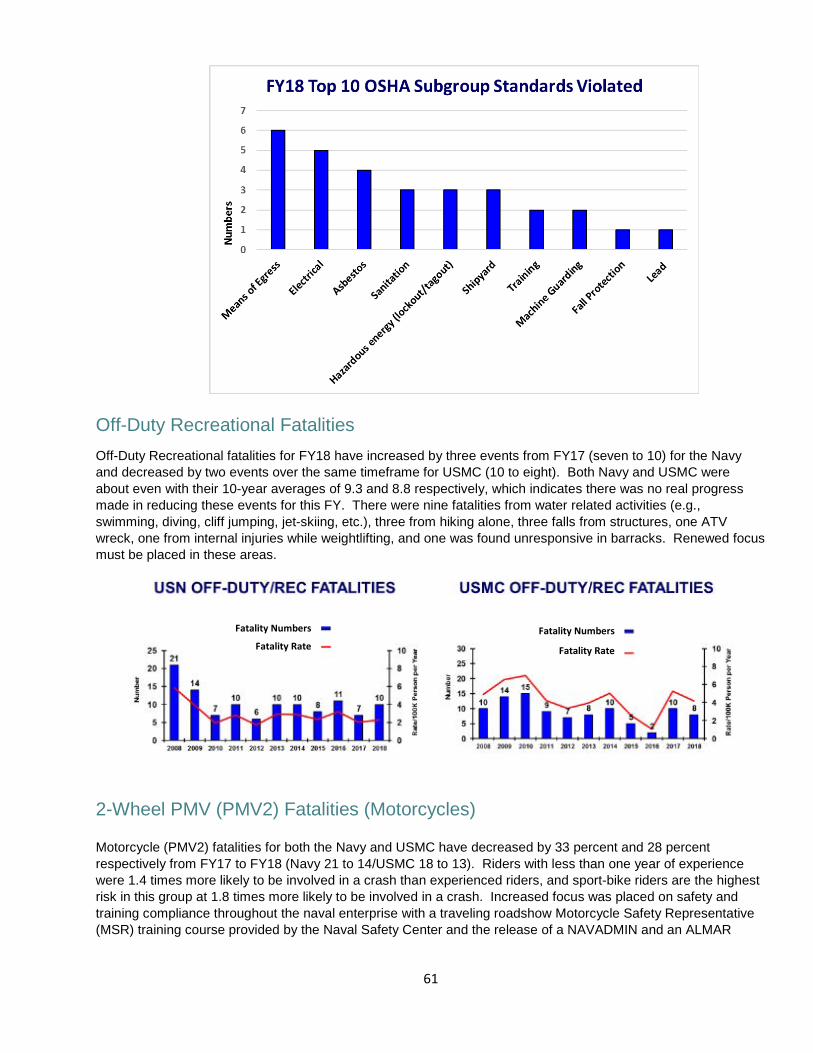
Means of Egress (design and construction requirements for exit routes) and electrical (specifically wiring methods, components and equipment for general use) and asbestos standards were the most frequently cited in fiscal year 2018. OSHA does not provide the scenario for each in their database.
61
Off-Duty Recreational Fatalities Off-Duty Recreational fatalities for FY18 have increased by three events from FY17 (seven to 10) for the Navy and decreased by two events over the same timeframe for USMC (10 to eight). Both Navy and USMC were about even with their 10-year averages of 9.3 and 8.8 respectively, which indicates there was no real progress made in reducing these events for this FY. There were nine fatalities from water related activities (e.g., swimming, diving, cliff jumping, jet-skiing, etc.), three from hiking alone, three falls from structures, one ATV wreck, one from internal injuries while weightlifting, and one was found unresponsive in barracks. Renewed focus must be placed in these areas.
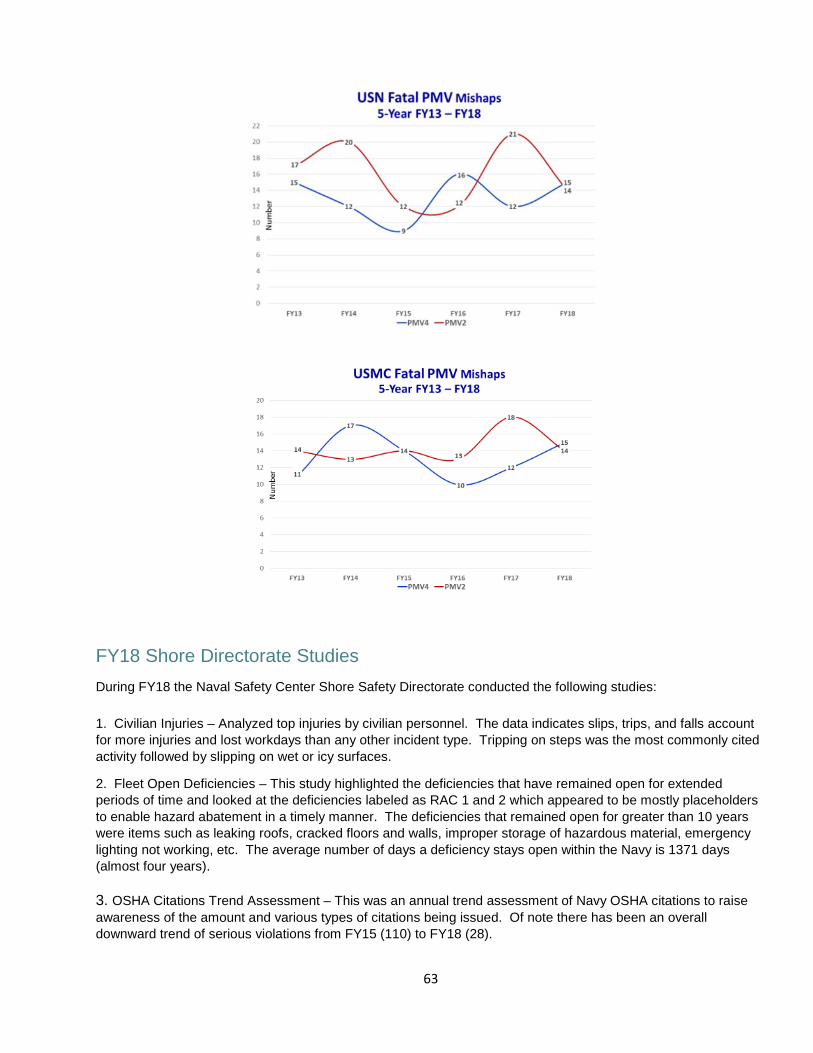
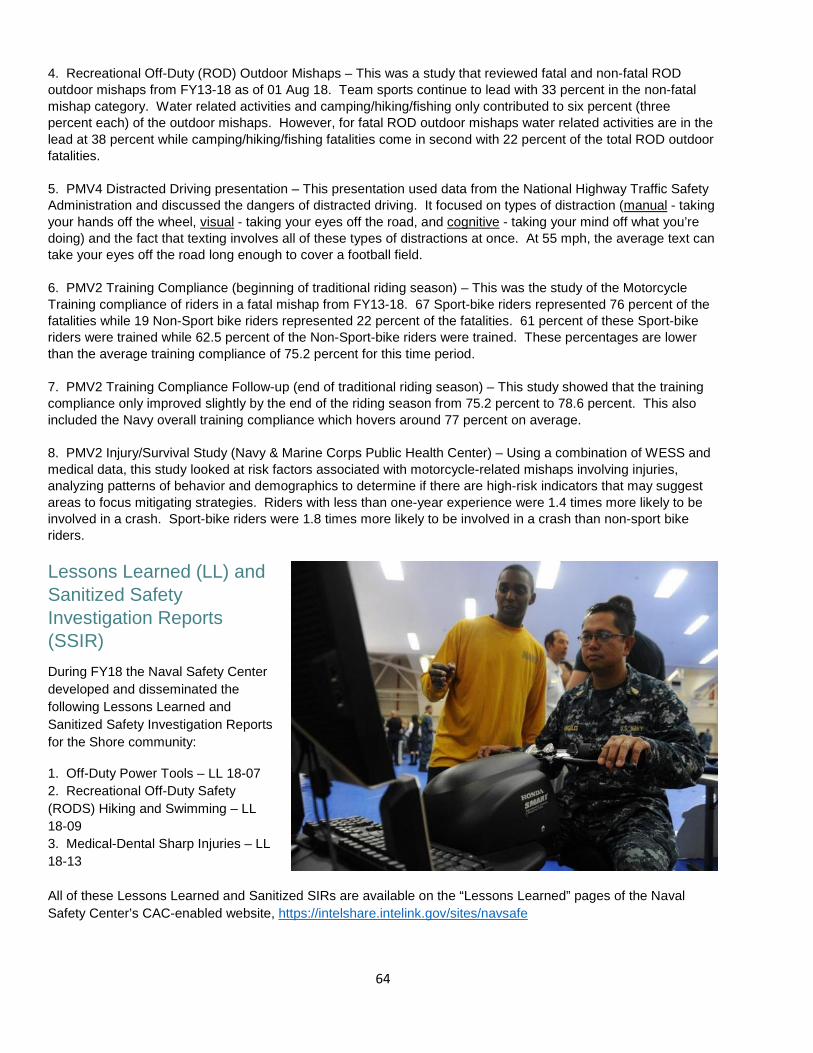
2-Wheel PMV (PMV2) Fatalities (Motorcycles) Motorcycle (PMV2) fatalities for both the Navy and USMC have decreased by 33 percent and 28 percent respectively from FY17 to FY18 (Navy 21 to 14/USMC 18 to 13). Riders with less than one year of experience were 1.4 times more likely to be involved in a crash than experienced riders, and sport-bike riders are the highest risk in this group at 1.8 times more likely to be involved in a crash. Increased focus was placed on safety and training compliance throughout the naval enterprise with a traveling roadshow Motorcycle Safety Representative (MSR) training course provided by the Naval Safety Center and the release of a NAVADMIN and an ALMAR
Fatality Numbers
Fatality Rate Fatality Numbers
Fatality Rate
62
message drawing attention to the need for increased awareness and vigilance at all levels in preventing these mishaps.
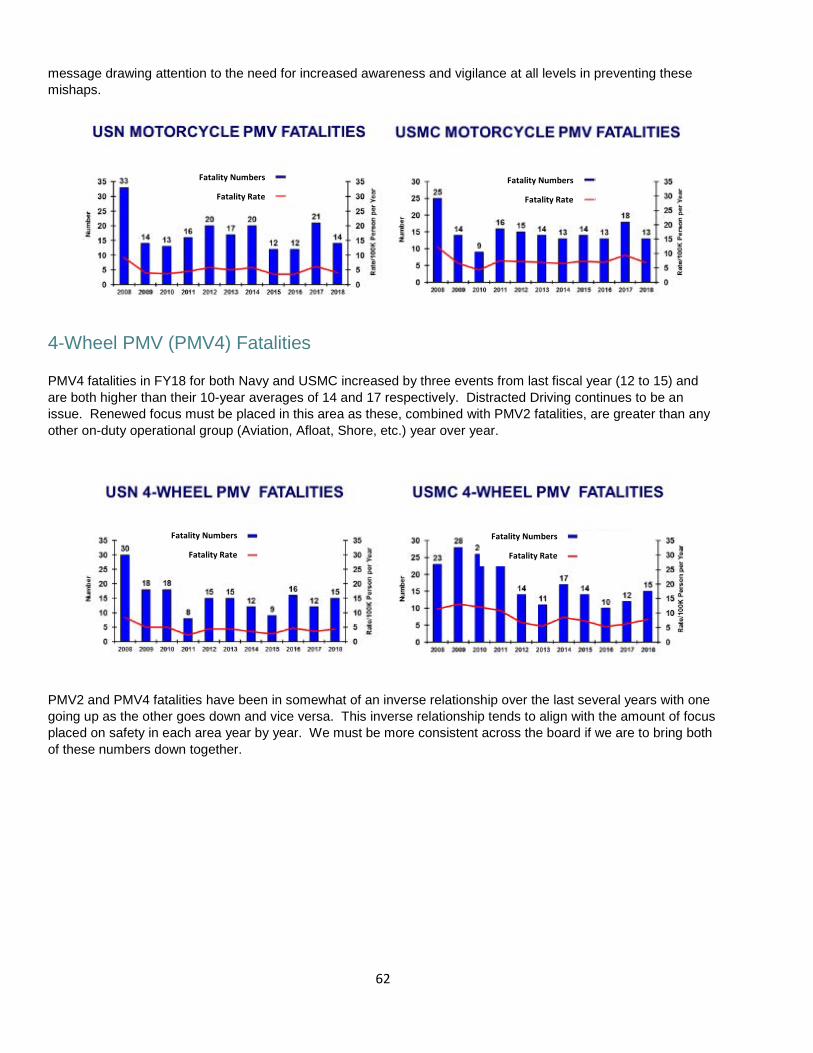
4-Wheel PMV (PMV4) Fatalities PMV4 fatalities in FY18 for both Navy and USMC increased by three events from last fiscal year (12 to 15) and are both higher than their 10-year averages of 14 and 17 respectively. Distracted Driving continues to be an issue. Renewed focus must be placed in this area as these, combined with PMV2 fatalities, are greater than any other on-duty operational group (Aviation, Afloat, Shore, etc.) year over year.
PMV2 and PMV4 fatalities have been in somewhat of an inverse relationship over the last several years with one going up as the other goes down and vice versa. This inverse relationship tends to align with the amount of focus placed on safety in each area year by year. We must be more consistent across the board if we are to bring both of these numbers down together.
Fatality Numbers
Fatality Rate
Fatality Numbers
Fatality Rate
Fatality Numbers
Fatality Rate
Fatality Numbers
Fatality Rate
63
FY18 Shore Directorate Studies During FY18 the Naval Safety Center Shore Safety Directorate conducted the following studies: 1. Civilian Injuries – Analyzed top injuries by civilian personnel. The data indicates slips, trips, and falls account for more injuries and lost workdays than any other incident type. Tripping on steps was the most commonly cited activity followed by slipping on wet or icy surfaces.
2. Fleet Open Deficiencies – This study highlighted the deficiencies that have remained open for extended periods of time and looked at the deficiencies labeled as RAC 1 and 2 which appeared to be mostly placeholders to enable hazard abatement in a timely manner. The deficiencies that remained open for greater than 10 years were items such as leaking roofs, cracked floors and walls, improper storage of hazardous material, emergency lighting not working, etc. The average number of days a deficiency stays open within the Navy is 1371 days (almost four years). 3. OSHA Citations Trend Assessment – This was an annual trend assessment of Navy OSHA citations to raise awareness of the amount and various types of citations being issued. Of note there has been an overall downward trend of serious violations from FY15 (110) to FY18 (28).
64
4. Recreational Off-Duty (ROD) Outdoor Mishaps – This was a study that reviewed fatal and non-fatal ROD outdoor mishaps from FY13-18 as of 01 Aug 18. Team sports continue to lead with 33 percent in the non-fatal mishap category. Water related activities and camping/hiking/fishing only contributed to six percent (three percent each) of the outdoor mishaps. However, for fatal ROD outdoor mishaps water related activities are in the lead at 38 percent while camping/hiking/fishing fatalities come in second with 22 percent of the total ROD outdoor fatalities. 5. PMV4 Distracted Driving presentation – This presentation used data from the National Highway Traffic Safety Administration and discussed the dangers of distracted driving. It focused on types of distraction (manual - taking your hands off the wheel, visual - taking your eyes off the road, and cognitive - taking your mind off what you’re doing) and the fact that texting involves all of these types of distractions at once. At 55 mph, the average text can take your eyes off the road long enough to cover a football field. 6. PMV2 Training Compliance (beginning of traditional riding season) – This was the study of the Motorcycle Training compliance of riders in a fatal mishap from FY13-18. 67 Sport-bike riders represented 76 percent of the fatalities while 19 Non-Sport bike riders represented 22 percent of the fatalities. 61 percent of these Sport-bike riders were trained while 62.5 percent of the Non-Sport-bike riders were trained. These percentages are lower than the average training compliance of 75.2 percent for this time period. 7. PMV2 Training Compliance Follow-up (end of traditional riding season) – This study showed that the training compliance only improved slightly by the end of the riding season from 75.2 percent to 78.6 percent. This also included the Navy overall training compliance which hovers around 77 percent on average. 8. PMV2 Injury/Survival Study (Navy & Marine Corps Public Health Center) – Using a combination of WESS and medical data, this study looked at risk factors associated with motorcycle-related mishaps involving injuries, analyzing patterns of behavior and demographics to determine if there are high-risk indicators that may suggest areas to focus mitigating strategies. Riders with less than one-year experience were 1.4 times more likely to be involved in a crash. Sport-bike riders were 1.8 times more likely to be involved in a crash than non-sport bike riders. Lessons Learned (LL) and Sanitized Safety Investigation Reports (SSIR) During FY18 the Naval Safety Center developed and disseminated the following Lessons Learned and Sanitized Safety Investigation Reports for the Shore community: 1. Off-Duty Power Tools – LL 18-07 2. Recreational Off-Duty Safety (RODS) Hiking and Swimming – LL 18-09 3. Medical-Dental Sharp Injuries – LL 18-13
All of these Lessons Learned and Sanitized SIRs are available on the “Lessons Learned” pages of the Naval Safety Center’s CAC-enabled website, https://intelshare.intelink.gov/sites/navsafe
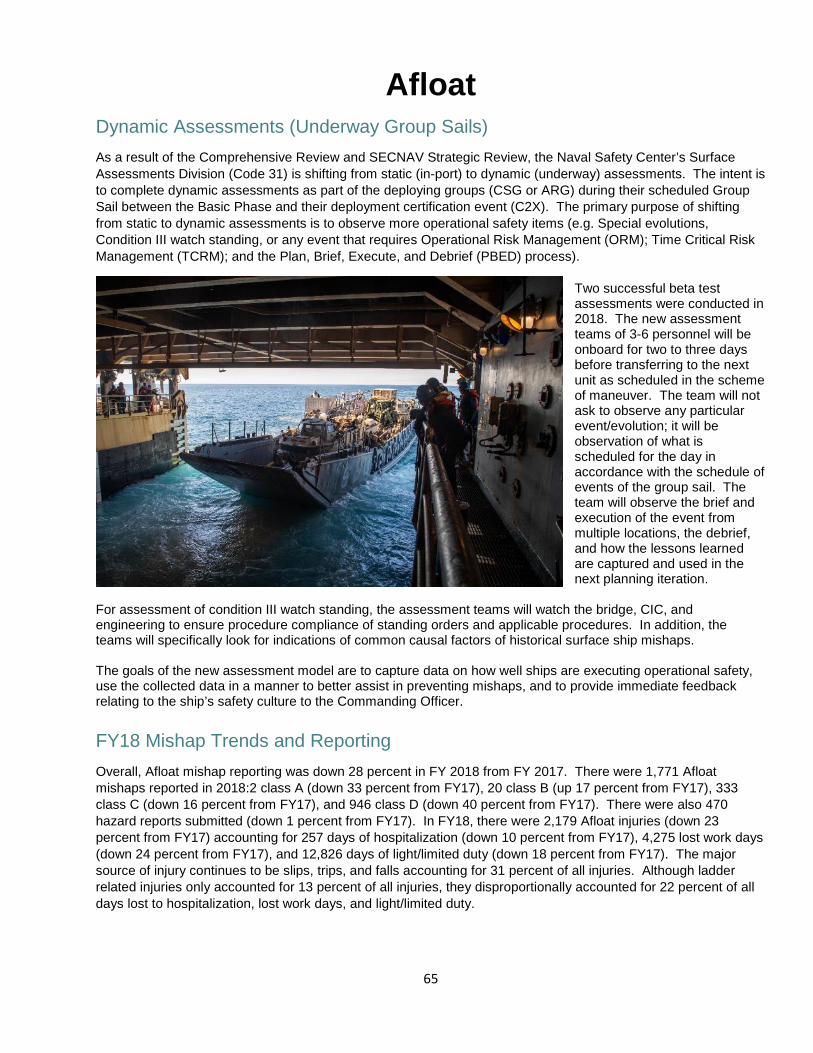
65
Afloat Dynamic Assessments (Underway Group Sails) As a result of the Comprehensive Review and SECNAV Strategic Review, the Naval Safety Center’s Surface Assessments Division (Code 31) is shifting from static (in-port) to dynamic (underway) assessments. The intent is to complete dynamic assessments as part of the deploying groups (CSG or ARG) during their scheduled Group Sail between the Basic Phase and their deployment certification event (C2X). The primary purpose of shifting from static to dynamic assessments is to observe more operational safety items (e.g. Special evolutions, Condition III watch standing, or any event that requires Operational Risk Management (ORM); Time Critical Risk Management (TCRM); and the Plan, Brief, Execute, and Debrief (PBED) process).
Two successful beta test assessments were conducted in 2018. The new assessment teams of 3-6 personnel will be onboard for two to three days before transferring to the next unit as scheduled in the scheme of maneuver. The team will not ask to observe any particular event/evolution; it will be observation of what is scheduled for the day in accordance with the schedule of events of the group sail. The team will observe the brief and execution of the event from multiple locations, the debrief, and how the lessons learned are captured and used in the next planning iteration.
For assessment of condition III watch standing, the assessment teams will watch the bridge, CIC, and engineering to ensure procedure compliance of standing orders and applicable procedures. In addition, the teams will specifically look for indications of common causal factors of historical surface ship mishaps. The goals of the new assessment model are to capture data on how well ships are executing operational safety, use the collected data in a manner to better assist in preventing mishaps, and to provide immediate feedback relating to the ship’s safety culture to the Commanding Officer. FY18 Mishap Trends and Reporting Overall, Afloat mishap reporting was down 28 percent in FY 2018 from FY 2017. There were 1,771 Afloat mishaps reported in 2018:2 class A (down 33 percent from FY17), 20 class B (up 17 percent from FY17), 333 class C (down 16 percent from FY17), and 946 class D (down 40 percent from FY17). There were also 470 hazard reports submitted (down 1 percent from FY17). In FY18, there were 2,179 Afloat injuries (down 23 percent from FY17) accounting for 257 days of hospitalization (down 10 percent from FY17), 4,275 lost work days (down 24 percent from FY17), and 12,826 days of light/limited duty (down 18 percent from FY17). The major source of injury continues to be slips, trips, and falls accounting for 31 percent of all injuries. Although ladder related injuries only accounted for 13 percent of all injuries, they disproportionally accounted for 22 percent of all days lost to hospitalization, lost work days, and light/limited duty.
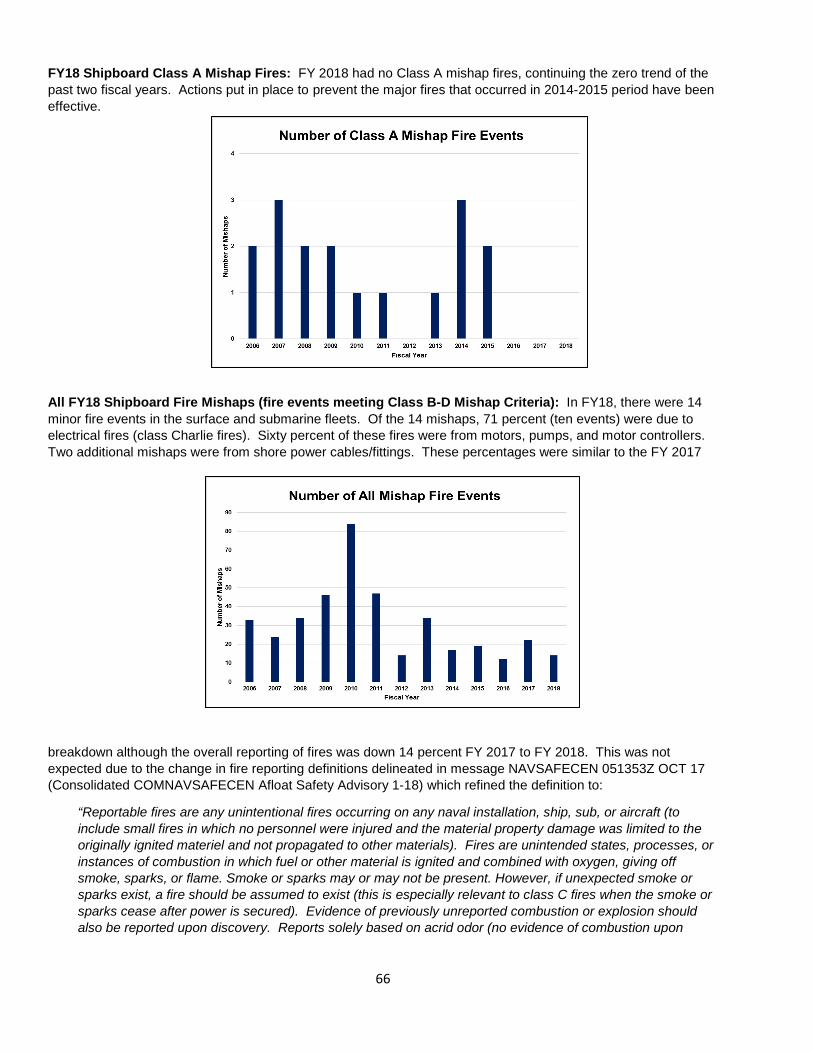
66
FY18 Shipboard Class A Mishap Fires: FY 2018 had no Class A mishap fires, continuing the zero trend of the past two fiscal years. Actions put in place to prevent the major fires that occurred in 2014-2015 period have been effective.
All FY18 Shipboard Fire Mishaps (fire events meeting Class B-D Mishap Criteria): In FY18, there were 14 minor fire events in the surface and submarine fleets. Of the 14 mishaps, 71 percent (ten events) were due to electrical fires (class Charlie fires). Sixty percent of these fires were from motors, pumps, and motor controllers. Two additional mishaps were from shore power cables/fittings. These percentages were similar to the FY 2017
breakdown although the overall reporting of fires was down 14 percent FY 2017 to FY 2018. This was not expected due to the change in fire reporting definitions delineated in message NAVSAFECEN 051353Z OCT 17 (Consolidated COMNAVSAFECEN Afloat Safety Advisory 1-18) which refined the definition to:
“Reportable fires are any unintentional fires occurring on any naval installation, ship, sub, or aircraft (to include small fires in which no personnel were injured and the material property damage was limited to the originally ignited materiel and not propagated to other materials). Fires are unintended states, processes, or instances of combustion in which fuel or other material is ignited and combined with oxygen, giving off smoke, sparks, or flame. Smoke or sparks may or may not be present. However, if unexpected smoke or sparks exist, a fire should be assumed to exist (this is especially relevant to class C fires when the smoke or sparks cease after power is secured). Evidence of previously unreported combustion or explosion should also be reported upon discovery. Reports solely based on acrid odor (no evidence of combustion upon
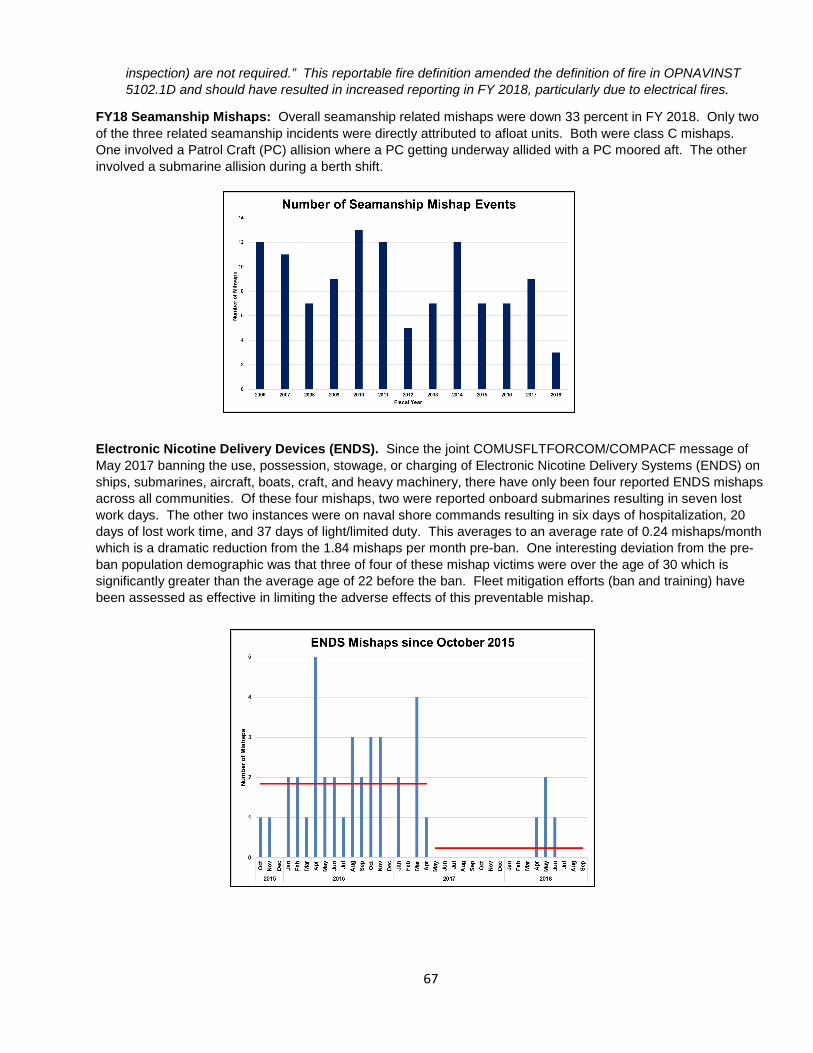
67
inspection) are not required.” This reportable fire definition amended the definition of fire in OPNAVINST 5102.1D and should have resulted in increased reporting in FY 2018, particularly due to electrical fires.
FY18 Seamanship Mishaps: Overall seamanship related mishaps were down 33 percent in FY 2018. Only two of the three related seamanship incidents were directly attributed to afloat units. Both were class C mishaps. One involved a Patrol Craft (PC) allision where a PC getting underway allided with a PC moored aft. The other involved a submarine allision during a berth shift.
Electronic Nicotine Delivery Devices (ENDS). Since the joint COMUSFLTFORCOM/COMPACF message of May 2017 banning the use, possession, stowage, or charging of Electronic Nicotine Delivery Systems (ENDS) on ships, submarines, aircraft, boats, craft, and heavy machinery, there have only been four reported ENDS mishaps across all communities. Of these four mishaps, two were reported onboard submarines resulting in seven lost work days. The other two instances were on naval shore commands resulting in six days of hospitalization, 20 days of lost work time, and 37 days of light/limited duty. This averages to an average rate of 0.24 mishaps/month which is a dramatic reduction from the 1.84 mishaps per month pre-ban. One interesting deviation from the pre-ban population demographic was that three of four of these mishap victims were over the age of 30 which is significantly greater than the average age of 22 before the ban. Fleet mitigation efforts (ban and training) have been assessed as effective in limiting the adverse effects of this preventable mishap.
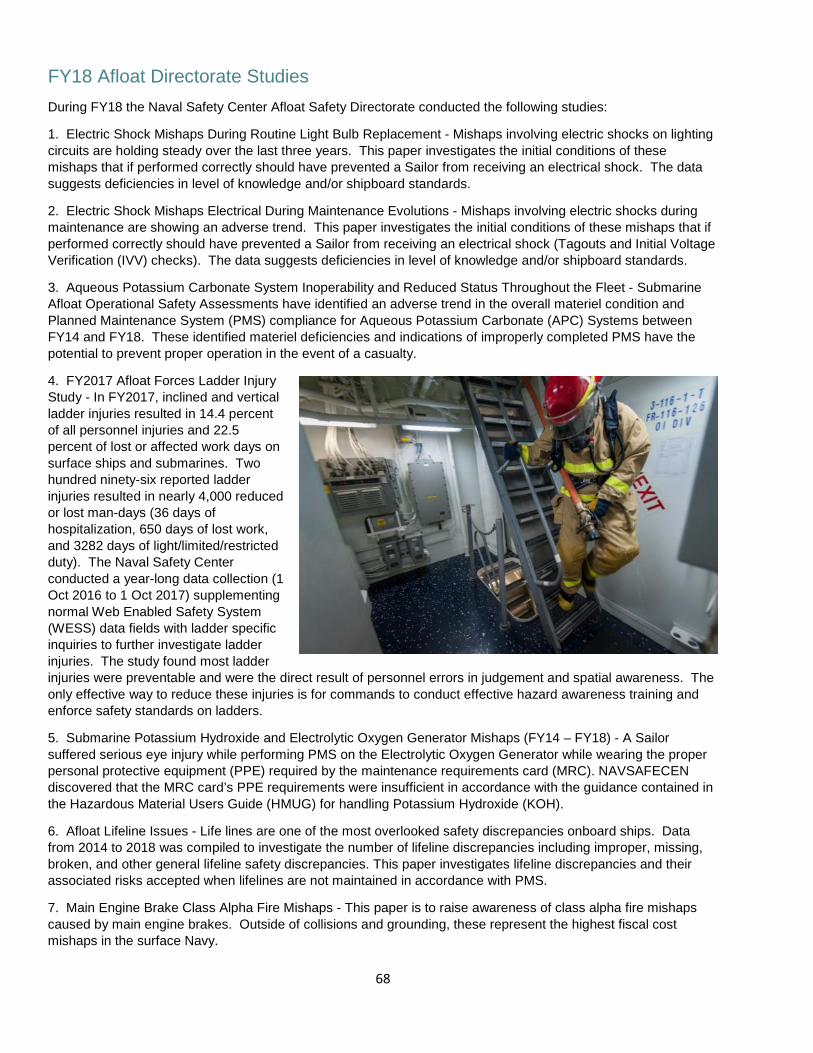
68
FY18 Afloat Directorate Studies
During FY18 the Naval Safety Center Afloat Safety Directorate conducted the following studies:
1. Electric Shock Mishaps During Routine Light Bulb Replacement - Mishaps involving electric shocks on lighting circuits are holding steady over the last three years. This paper investigates the initial conditions of these mishaps that if performed correctly should have prevented a Sailor from receiving an electrical shock. The data suggests deficiencies in level of knowledge and/or shipboard standards.
2. Electric Shock Mishaps Electrical During Maintenance Evolutions - Mishaps involving electric shocks during maintenance are showing an adverse trend. This paper investigates the initial conditions of these mishaps that if performed correctly should have prevented a Sailor from receiving an electrical shock (Tagouts and Initial Voltage Verification (IVV) checks). The data suggests deficiencies in level of knowledge and/or shipboard standards.
3. Aqueous Potassium Carbonate System Inoperability and Reduced Status Throughout the Fleet - Submarine Afloat Operational Safety Assessments have identified an adverse trend in the overall materiel condition and Planned Maintenance System (PMS) compliance for Aqueous Potassium Carbonate (APC) Systems between FY14 and FY18. These identified materiel deficiencies and indications of improperly completed PMS have the potential to prevent proper operation in the event of a casualty.
4. FY2017 Afloat Forces Ladder Injury Study - In FY2017, inclined and vertical ladder injuries resulted in 14.4 percent of all personnel injuries and 22.5 percent of lost or affected work days on surface ships and submarines. Two hundred ninety-six reported ladder injuries resulted in nearly 4,000 reduced or lost man-days (36 days of hospitalization, 650 days of lost work, and 3282 days of light/limited/restricted duty). The Naval Safety Center conducted a year-long data collection (1 Oct 2016 to 1 Oct 2017) supplementing normal Web Enabled Safety System (WESS) data fields with ladder specific inquiries to further investigate ladder injuries. The study found most ladder injuries were preventable and were the direct result of personnel errors in judgement and spatial awareness. The only effective way to reduce these injuries is for commands to conduct effective hazard awareness training and enforce safety standards on ladders.
5. Submarine Potassium Hydroxide and Electrolytic Oxygen Generator Mishaps (FY14 – FY18) - A Sailor suffered serious eye injury while performing PMS on the Electrolytic Oxygen Generator while wearing the proper personal protective equipment (PPE) required by the maintenance requirements card (MRC). NAVSAFECEN discovered that the MRC card’s PPE requirements were insufficient in accordance with the guidance contained in the Hazardous Material Users Guide (HMUG) for handling Potassium Hydroxide (KOH).
6. Afloat Lifeline Issues - Life lines are one of the most overlooked safety discrepancies onboard ships. Data from 2014 to 2018 was compiled to investigate the number of lifeline discrepancies including improper, missing, broken, and other general lifeline safety discrepancies. This paper investigates lifeline discrepancies and their associated risks accepted when lifelines are not maintained in accordance with PMS.
7. Main Engine Brake Class Alpha Fire Mishaps - This paper is to raise awareness of class alpha fire mishaps caused by main engine brakes. Outside of collisions and grounding, these represent the highest fiscal cost mishaps in the surface Navy.
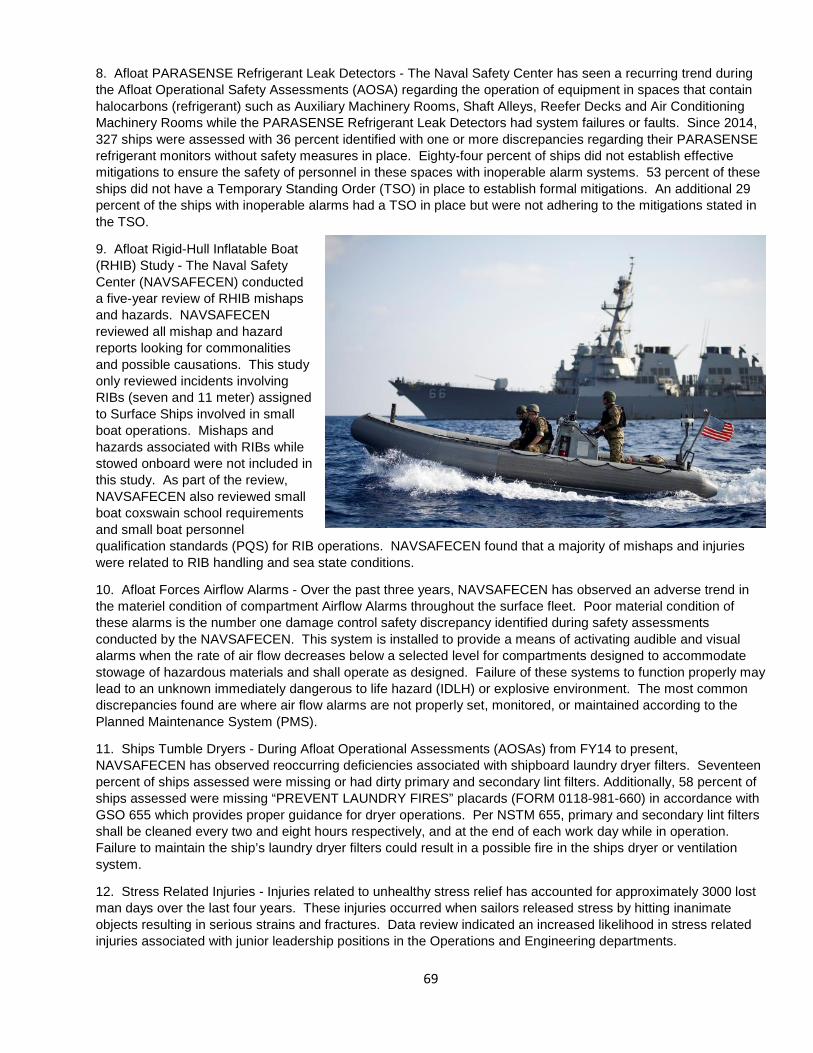
69
8. Afloat PARASENSE Refrigerant Leak Detectors - The Naval Safety Center has seen a recurring trend during the Afloat Operational Safety Assessments (AOSA) regarding the operation of equipment in spaces that contain halocarbons (refrigerant) such as Auxiliary Machinery Rooms, Shaft Alleys, Reefer Decks and Air Conditioning Machinery Rooms while the PARASENSE Refrigerant Leak Detectors had system failures or faults. Since 2014, 327 ships were assessed with 36 percent identified with one or more discrepancies regarding their PARASENSE refrigerant monitors without safety measures in place. Eighty-four percent of ships did not establish effective mitigations to ensure the safety of personnel in these spaces with inoperable alarm systems. 53 percent of these ships did not have a Temporary Standing Order (TSO) in place to establish formal mitigations. An additional 29 percent of the ships with inoperable alarms had a TSO in place but were not adhering to the mitigations stated in the TSO.
9. Afloat Rigid-Hull Inflatable Boat (RHIB) Study - The Naval Safety Center (NAVSAFECEN) conducted a five-year review of RHIB mishaps and hazards. NAVSAFECEN reviewed all mishap and hazard reports looking for commonalities and possible causations. This study only reviewed incidents involving RIBs (seven and 11 meter) assigned to Surface Ships involved in small boat operations. Mishaps and hazards associated with RIBs while stowed onboard were not included in this study. As part of the review, NAVSAFECEN also reviewed small boat coxswain school requirements and small boat personnel qualification standards (PQS) for RIB operations. NAVSAFECEN found that a majority of mishaps and injuries were related to RIB handling and sea state conditions.
10. Afloat Forces Airflow Alarms - Over the past three years, NAVSAFECEN has observed an adverse trend in the materiel condition of compartment Airflow Alarms throughout the surface fleet. Poor material condition of these alarms is the number one damage control safety discrepancy identified during safety assessments conducted by the NAVSAFECEN. This system is installed to provide a means of activating audible and visual alarms when the rate of air flow decreases below a selected level for compartments designed to accommodate stowage of hazardous materials and shall operate as designed. Failure of these systems to function properly may lead to an unknown immediately dangerous to life hazard (IDLH) or explosive environment. The most common discrepancies found are where air flow alarms are not properly set, monitored, or maintained according to the Planned Maintenance System (PMS).
11. Ships Tumble Dryers - During Afloat Operational Assessments (AOSAs) from FY14 to present, NAVSAFECEN has observed reoccurring deficiencies associated with shipboard laundry dryer filters. Seventeen percent of ships assessed were missing or had dirty primary and secondary lint filters. Additionally, 58 percent of ships assessed were missing “PREVENT LAUNDRY FIRES” placards (FORM 0118-981-660) in accordance with GSO 655 which provides proper guidance for dryer operations. Per NSTM 655, primary and secondary lint filters shall be cleaned every two and eight hours respectively, and at the end of each work day while in operation. Failure to maintain the ship’s laundry dryer filters could result in a possible fire in the ships dryer or ventilation system.
12. Stress Related Injuries - Injuries related to unhealthy stress relief has accounted for approximately 3000 lost man days over the last four years. These injuries occurred when sailors released stress by hitting inanimate objects resulting in serious strains and fractures. Data review indicated an increased likelihood in stress related injuries associated with junior leadership positions in the Operations and Engineering departments.
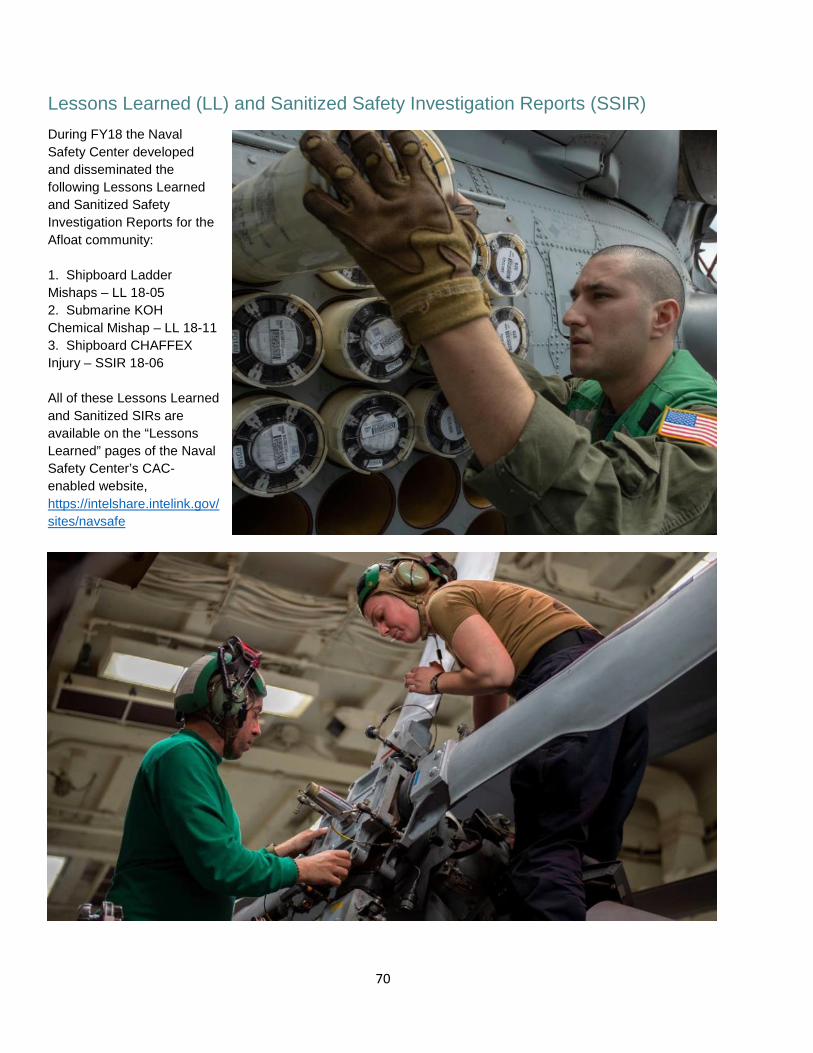
70
Lessons Learned (LL) and Sanitized Safety Investigation Reports (SSIR) During FY18 the Naval Safety Center developed and disseminated the following Lessons Learned and Sanitized Safety Investigation Reports for the Afloat community: 1. Shipboard Ladder Mishaps – LL 18-05 2. Submarine KOH Chemical Mishap – LL 18-11 3. Shipboard CHAFFEX Injury – SSIR 18-06 All of these Lessons Learned and Sanitized SIRs are available on the “Lessons Learned” pages of the Naval Safety Center’s CAC-enabled website, https://intelshare.intelink.gov/ sites/navsafe
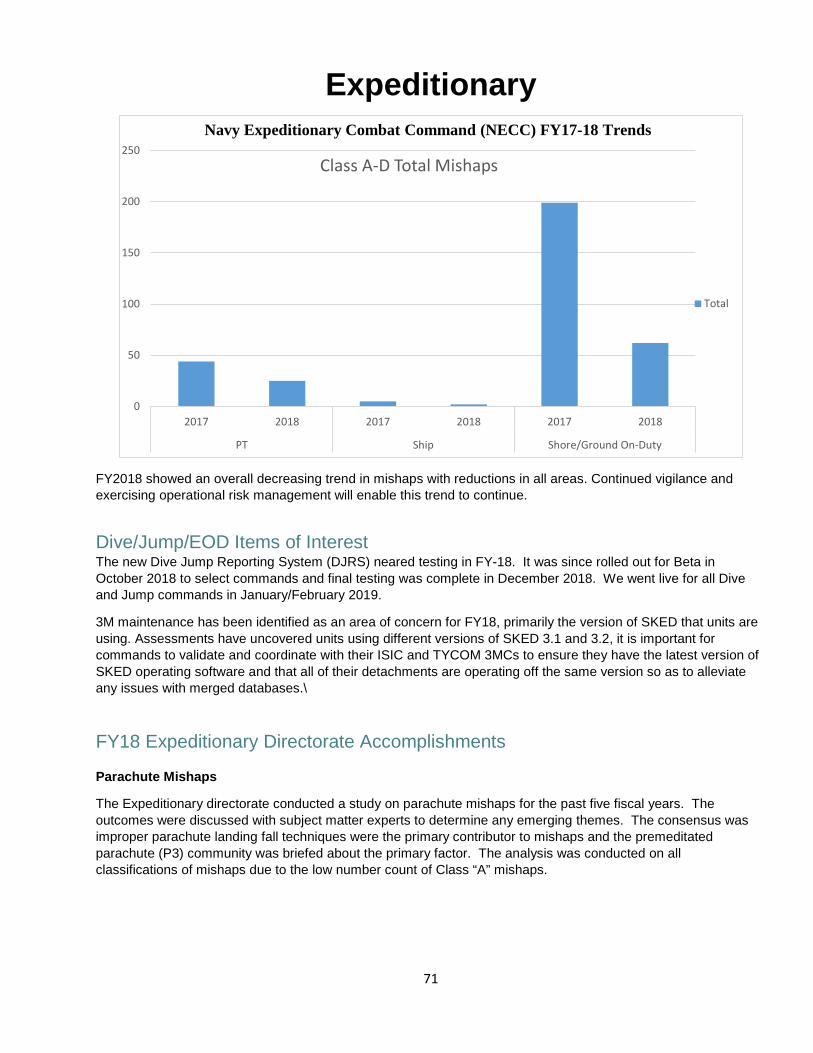
71
Expeditionary
FY2018 showed an overall decreasing trend in mishaps with reductions in all areas. Continued vigilance and exercising operational risk management will enable this trend to continue.
Dive/Jump/EOD Items of Interest The new Dive Jump Reporting System (DJRS) neared testing in FY-18. It was since rolled out for Beta in October 2018 to select commands and final testing was complete in December 2018. We went live for all Dive and Jump commands in January/February 2019.
3M maintenance has been identified as an area of concern for FY18, primarily the version of SKED that units are using. Assessments have uncovered units using different versions of SKED 3.1 and 3.2, it is important for commands to validate and coordinate with their ISIC and TYCOM 3MCs to ensure they have the latest version of SKED operating software and that all of their detachments are operating off the same version so as to alleviate any issues with merged databases.\
FY18 Expeditionary Directorate Accomplishments Parachute Mishaps
The Expeditionary directorate conducted a study on parachute mishaps for the past five fiscal years. The outcomes were discussed with subject matter experts to determine any emerging themes. The consensus was improper parachute landing fall techniques were the primary contributor to mishaps and the premeditated parachute (P3) community was briefed about the primary factor. The analysis was conducted on all classifications of mishaps due to the low number count of Class “A” mishaps.
0
50
100
150
200
250
2017 2018 2017 2018 2017 2018
PT Ship Shore/Ground On-Duty
Class A-D Total Mishaps
Total
Navy Expeditionary Combat Command (NECC) FY17-18 Trends
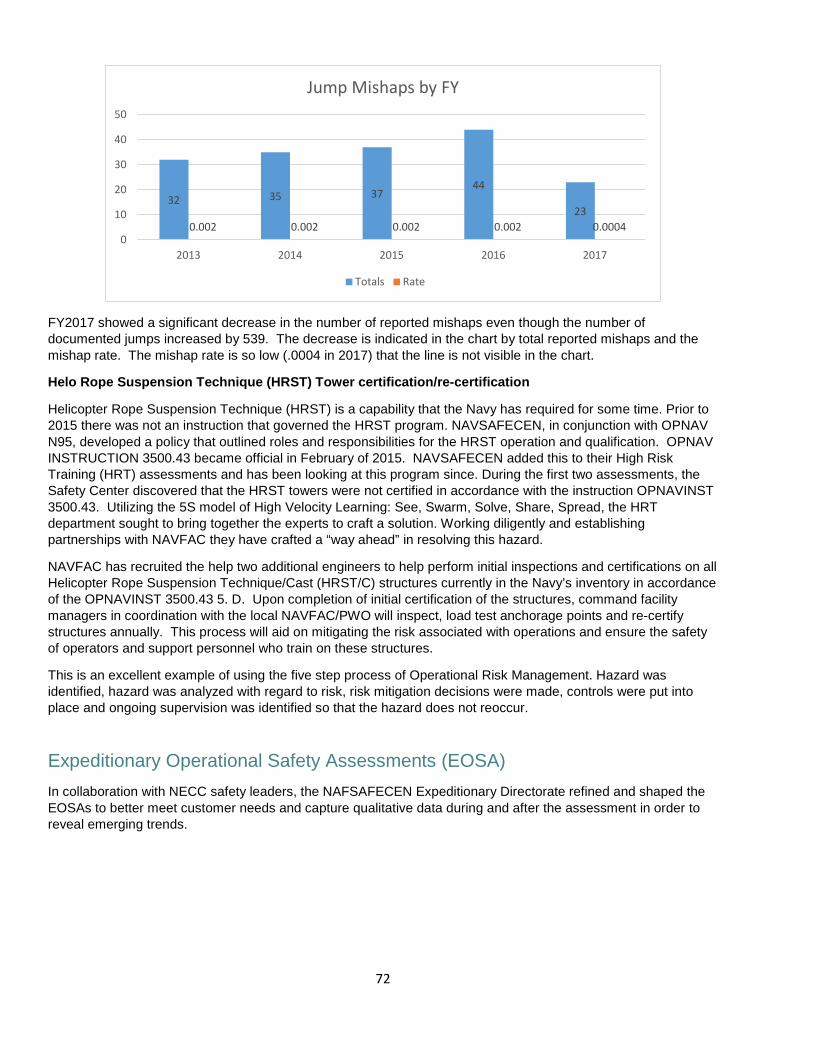
72
FY2017 showed a significant decrease in the number of reported mishaps even though the number of documented jumps increased by 539. The decrease is indicated in the chart by total reported mishaps and the mishap rate. The mishap rate is so low (.0004 in 2017) that the line is not visible in the chart.
Helo Rope Suspension Technique (HRST) Tower certification/re-certification
Helicopter Rope Suspension Technique (HRST) is a capability that the Navy has required for some time. Prior to 2015 there was not an instruction that governed the HRST program. NAVSAFECEN, in conjunction with OPNAV N95, developed a policy that outlined roles and responsibilities for the HRST operation and qualification. OPNAV INSTRUCTION 3500.43 became official in February of 2015. NAVSAFECEN added this to their High Risk Training (HRT) assessments and has been looking at this program since. During the first two assessments, the Safety Center discovered that the HRST towers were not certified in accordance with the instruction OPNAVINST 3500.43. Utilizing the 5S model of High Velocity Learning: See, Swarm, Solve, Share, Spread, the HRT department sought to bring together the experts to craft a solution. Working diligently and establishing partnerships with NAVFAC they have crafted a “way ahead” in resolving this hazard.
NAVFAC has recruited the help two additional engineers to help perform initial inspections and certifications on all Helicopter Rope Suspension Technique/Cast (HRST/C) structures currently in the Navy’s inventory in accordance of the OPNAVINST 3500.43 5. D. Upon completion of initial certification of the structures, command facility managers in coordination with the local NAVFAC/PWO will inspect, load test anchorage points and re-certify structures annually. This process will aid on mitigating the risk associated with operations and ensure the safety of operators and support personnel who train on these structures.
This is an excellent example of using the five step process of Operational Risk Management. Hazard was identified, hazard was analyzed with regard to risk, risk mitigation decisions were made, controls were put into place and ongoing supervision was identified so that the hazard does not reoccur.
Expeditionary Operational Safety Assessments (EOSA) In collaboration with NECC safety leaders, the NAFSAFECEN Expeditionary Directorate refined and shaped the EOSAs to better meet customer needs and capture qualitative data during and after the assessment in order to reveal emerging trends.
32 35 3744
230.002 0.002 0.002 0.002 0.0004
0
10
20
30
40
50
2013 2014 2015 2016 2017
Jump Mishaps by FY
Totals Rate
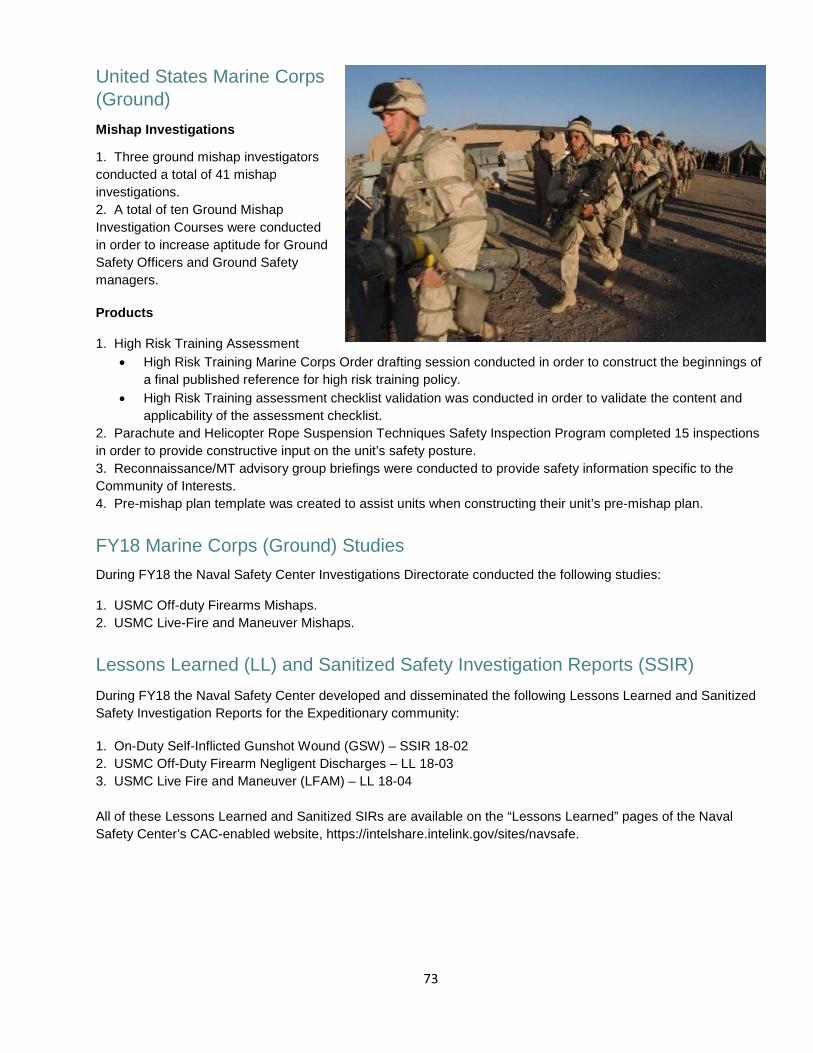
73
United States Marine Corps (Ground) Mishap Investigations
1. Three ground mishap investigatorsconducted a total of 41 mishapinvestigations.2. A total of ten Ground MishapInvestigation Courses were conductedin order to increase aptitude for GroundSafety Officers and Ground Safetymanagers.
Products
1. High Risk Training Assessment• High Risk Training Marine Corps Order drafting session conducted in order to construct the beginnings of
a final published reference for high risk training policy.• High Risk Training assessment checklist validation was conducted in order to validate the content and
applicability of the assessment checklist.2. Parachute and Helicopter Rope Suspension Techniques Safety Inspection Program completed 15 inspectionsin order to provide constructive input on the unit’s safety posture.3. Reconnaissance/MT advisory group briefings were conducted to provide safety information specific to theCommunity of Interests.4. Pre-mishap plan template was created to assist units when constructing their unit’s pre-mishap plan.
FY18 Marine Corps (Ground) StudiesDuring FY18 the Naval Safety Center Investigations Directorate conducted the following studies:
1. USMC Off-duty Firearms Mishaps.2. USMC Live-Fire and Maneuver Mishaps.
Lessons Learned (LL) and Sanitized Safety Investigation Reports (SSIR)During FY18 the Naval Safety Center developed and disseminated the following Lessons Learned and Sanitized Safety Investigation Reports for the Expeditionary community:
1. On-Duty Self-Inflicted Gunshot Wound (GSW) – SSIR 18-022. USMC Off-Duty Firearm Negligent Discharges – LL 18-033. USMC Live Fire and Maneuver (LFAM) – LL 18-04
All of these Lessons Learned and Sanitized SIRs are available on the “Lessons Learned” pages of the Naval Safety Center’s CAC-enabled website, https://intelshare.intelink.gov/sites/navsafe.