
2017 Technology, Media and Telecommunications Predictions ... · Welcome to the 2017 edition of...
8
2017 Technology, Media and Telecommunications Predictions Middle East edition
Transcript of 2017 Technology, Media and Telecommunications Predictions ... · Welcome to the 2017 edition of...

2017 Technology, Media and Telecommunications Predictions Middle East edition
Foreword
Welcome to the 2017 edition of Deloitte’s Predictions for the technology, media and telecommunications (TMT) sectors.
For the first time in our 5 years of releasing our Middle East edition, we are including predictions for all three sectors together, and not splitting them into different sub-industries. This, by itself, is a reflection of the exciting industry we are in. An industry that continues to blur the boundaries of innovation, and reshape how operators, media players and technology companies collaborate and interact in an increasingly integrated market place.
Across the global and regional predictions, we believe that the distinction between sectors is fast becoming obsolete. The introduction of dedicated machine learning capability to smartphones is relevant across all industry sectors, not just the technology or telecommunications verticals. The transition to 5G and resulting implications on machine to machine communication is a critical enabler to new technology adoption, starting with self-driving cars. IoT itself is the epitome of this borderless ecosystem with operators and technology companies working closely together to shape the cities and lives of tomorrow. Cybersecurity is an evergreen topic in the region raising threats to media companies and Telcos equally, and requiring cross sectorial regulations and safety measures.
With smart cities and nations so high in the agenda of the Middle East countries, our region is at the forefront of this borderless market place, with regional Telcos talking more about AI and IoT than network expansion. In this day and age, breaking borders, albeit at industry level, is a refreshing twist. 2017 promises to be yet another exciting year for the TMT sector. We wish you all the best for this year and trust that you and your colleagues will find this year’s predictions a useful stimulant in your strategic thinking. We look forward to discussing them with you.
Paul LeePartner, Head of Global TMT ResearchDeloitte Touche Tohmatsu Limited
Emmanuel DurouPartner, Head of Middle East TMT industryDeloitte & Touche (M.E.)
01
Technology, Media & Telecommunications Predictions | 2017
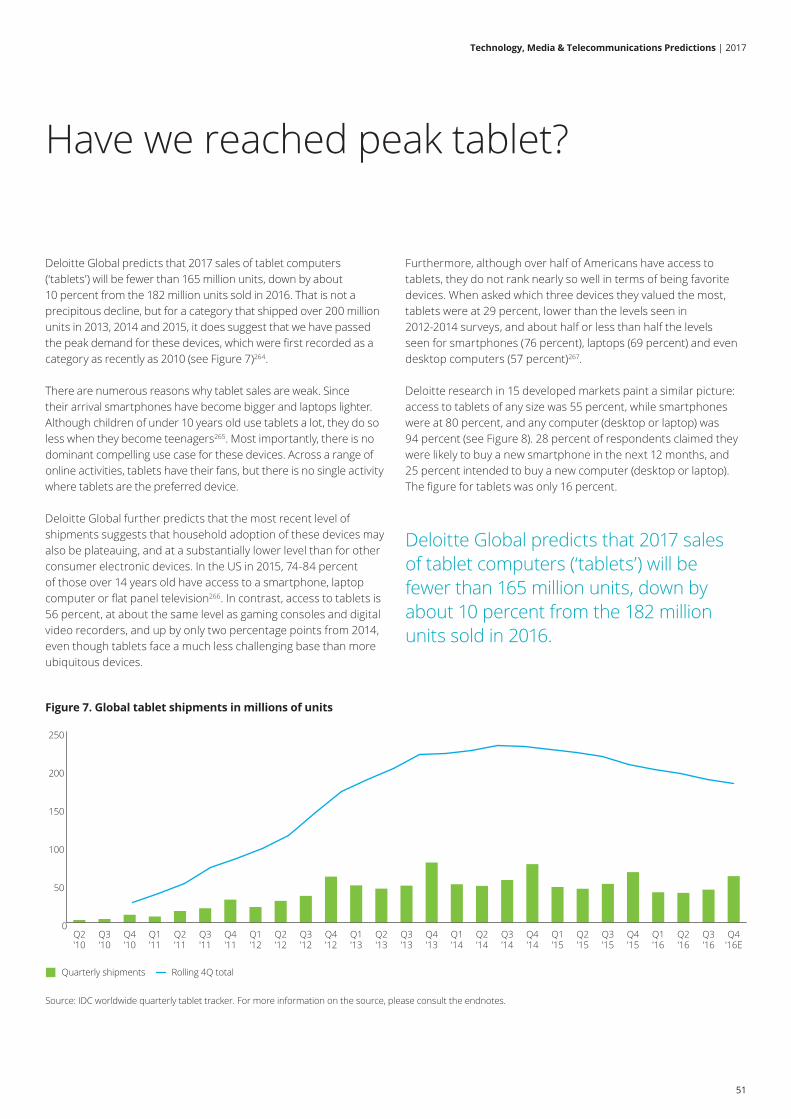
Deloitte Global predicts that 2017 sales of tablet computers (‘tablets’) will be fewer than 165 million units, down by about 10 percent from the 182 million units sold in 2016. That is not a precipitous decline, but for a category that shipped over 200 million units in 2013, 2014 and 2015, it does suggest that we have passed the peak demand for these devices, which were first recorded as a category as recently as 2010 (see Figure 7)264.
There are numerous reasons why tablet sales are weak. Since their arrival smartphones have become bigger and laptops lighter. Although children of under 10 years old use tablets a lot, they do so less when they become teenagers265. Most importantly, there is no dominant compelling use case for these devices. Across a range of online activities, tablets have their fans, but there is no single activity where tablets are the preferred device.
Deloitte Global further predicts that the most recent level of shipments suggests that household adoption of these devices may also be plateauing, and at a substantially lower level than for other consumer electronic devices. In the US in 2015, 74-84 percent of those over 14 years old have access to a smartphone, laptop computer or flat panel television266. In contrast, access to tablets is 56 percent, at about the same level as gaming consoles and digital video recorders, and up by only two percentage points from 2014, even though tablets face a much less challenging base than more ubiquitous devices.
Furthermore, although over half of Americans have access to tablets, they do not rank nearly so well in terms of being favorite devices. When asked which three devices they valued the most, tablets were at 29 percent, lower than the levels seen in 2012-2014 surveys, and about half or less than half the levels seen for smartphones (76 percent), laptops (69 percent) and even desktop computers (57 percent)267.
Deloitte research in 15 developed markets paint a similar picture: access to tablets of any size was 55 percent, while smartphones were at 80 percent, and any computer (desktop or laptop) was 94 percent (see Figure 8). 28 percent of respondents claimed they were likely to buy a new smartphone in the next 12 months, and 25 percent intended to buy a new computer (desktop or laptop). The figure for tablets was only 16 percent.
Deloitte Global predicts that 2017 sales of tablet computers (‘tablets’) will be fewer than 165 million units, down by about 10 percent from the 182 million units sold in 2016.
Have we reached peak tablet?
Figure 7. Global tablet shipments in millions of units
Source: IDC worldwide quarterly tablet tracker. For more information on the source, please consult the endnotes.
Quarterly shipments Rolling 4Q total
0
50
100
150
200
250
Q4'16E
Q3'16
Q2'16
Q1'16
Q4'15
Q3'15
Q2'15
Q1'15
Q4'14
Q3'14
Q2'14
Q1'14
Q4'13
Q3'13
Q2'13
Q1'13
Q4'12
Q3'12
Q2'12
Q1'12
Q4'11
Q3'11
Q2'11
Q1'11
Q4'10
Q3'10
Q2'10
51
Technology, Media & Telecommunications Predictions | 2017
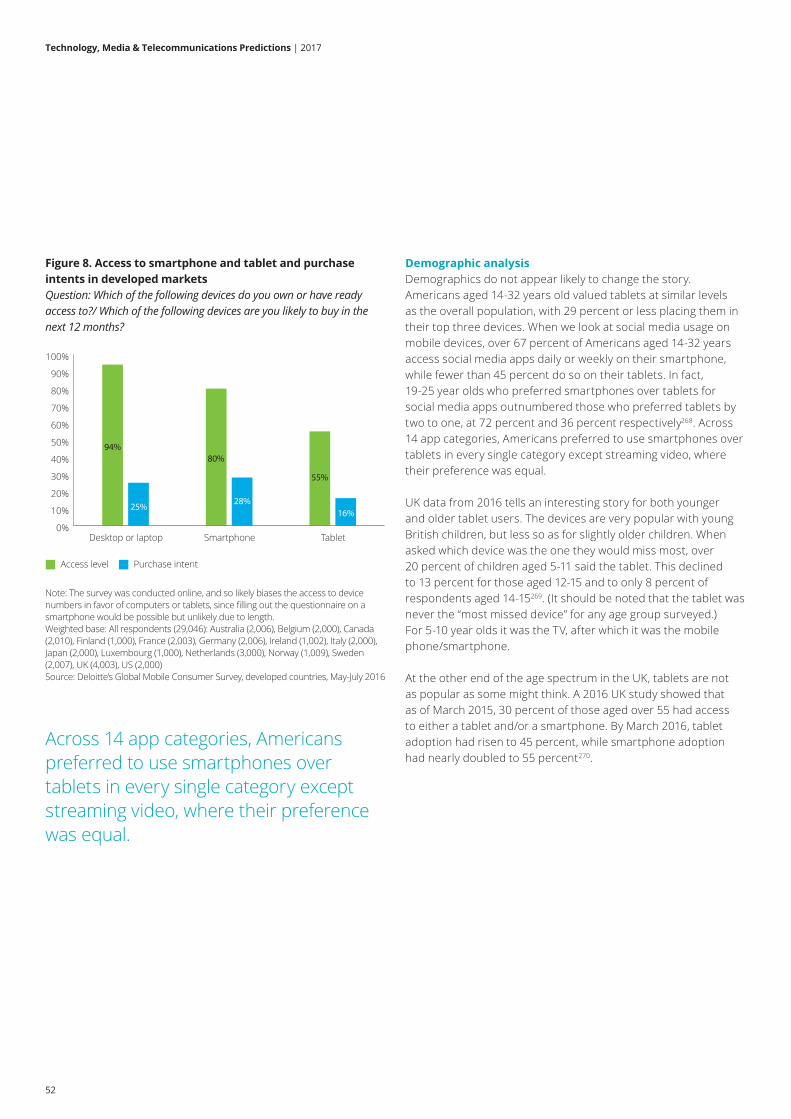
Figure 8. Access to smartphone and tablet and purchase intents in developed marketsQuestion: Which of the following devices do you own or have ready access to?/ Which of the following devices are you likely to buy in the next 12 months?
Access level
Note: The survey was conducted online, and so likely biases the access to device numbers in favor of computers or tablets, since filling out the questionnaire on a smartphone would be possible but unlikely due to length.Weighted base: All respondents (29,046): Australia (2,006), Belgium (2,000), Canada (2,010), Finland (1,000), France (2,003), Germany (2,006), Ireland (1,002), Italy (2,000), Japan (2,000), Luxembourg (1,000), Netherlands (3,000), Norway (1,009), Sweden (2,007), UK (4,003), US (2,000)Source: Deloitte’s Global Mobile Consumer Survey, developed countries, May-July 2016
0%
10%
20%
30%
40%
50%
60%
70%
80%
90%
100%
TabletSmartphoneDesktop or laptop
Purchase intent
94%
25%
80%
28%
55%
16%
Demographic analysisDemographics do not appear likely to change the story. Americans aged 14-32 years old valued tablets at similar levels as the overall population, with 29 percent or less placing them in their top three devices. When we look at social media usage on mobile devices, over 67 percent of Americans aged 14-32 years access social media apps daily or weekly on their smartphone, while fewer than 45 percent do so on their tablets. In fact, 19-25 year olds who preferred smartphones over tablets for social media apps outnumbered those who preferred tablets by two to one, at 72 percent and 36 percent respectively268. Across 14 app categories, Americans preferred to use smartphones over tablets in every single category except streaming video, where their preference was equal.
UK data from 2016 tells an interesting story for both younger and older tablet users. The devices are very popular with young British children, but less so as for slightly older children. When asked which device was the one they would miss most, over 20 percent of children aged 5-11 said the tablet. This declined to 13 percent for those aged 12-15 and to only 8 percent of respondents aged 14-15269. (It should be noted that the tablet was never the “most missed device” for any age group surveyed.) For 5-10 year olds it was the TV, after which it was the mobile phone/smartphone.
At the other end of the age spectrum in the UK, tablets are not as popular as some might think. A 2016 UK study showed that as of March 2015, 30 percent of those aged over 55 had access to either a tablet and/or a smartphone. By March 2016, tablet adoption had risen to 45 percent, while smartphone adoption had nearly doubled to 55 percent270.
Across 14 app categories, Americans preferred to use smartphones over tablets in every single category except streaming video, where their preference was equal.
52
Technology, Media & Telecommunications Predictions | 2017
Other competitionDetachable tablets (laptop/tablet 2-in-1s) are growing but not by enough to change the overall market. As of September 2016 only about 14 percent of all tablet sales were detachables, or about 25 million units271,272.
Tablets are being squeezed out to some extent, as phones get bigger and laptops get lighter. In 2010, when the first commercially successful tablet was launched, the average smartphone had a screen size of under 3.5 inches. By late 2014 it was five inches, or 40 percent larger273. A standard laptop in 2010 weighed around six pounds274. Similar models in 2016 were 22 percent lighter, at five pounds275.
In addition, the life of tablets is being extended, with many users keeping them for more than three years. Across 15 developed market countries only 37 percent of tablets were bought in 2015 or 2016, according to the 2016 Deloitte’s Global Mobile Consumer Survey. More than half were pre-2015 models and more than a quarter more than three years old276.
It seems likely that various factors are driving the slower replacement cycle. Tablets tend not to be used for as many hours a day and so they suffer less wear and tear. They are not used on the go in the same way as smartphones and so are less likely to be dropped, damaged or lost. Tablets tend to be jointly owned or household devices, in contrast to smartphones which are typically owned by individuals. Although the smartphone subsidy model, whereby the cost of a new phone is included as part of a data and/or voice plan, is shifting, it is generally more common that new smartphones are subsidized, while new tablets are not. Finally, although tablets have cameras, they aren’t used nearly as much for taking pictures as smartphones. For many people, camera technology and the ability to take and share better photographs drive decisions on device upgrades.
Few prefer a tablet to a laptop, smartphone, TV set… or even desktopBut perhaps the biggest challenge for the tablet is that it is seldom the preferred device for any category of usage, and for any demographic. The 2016 Deloitte’s Global Mobile Consumer Survey data for developed countries draws on responses from just under 30,000 people. They were asked their preferred device for 15 different digital and media activities. As can be seen in Figure 9, across all demographics and activities, the laptop or desktop computer tended to be the most common top choice for just under half of the activity/demographic permutations. Smartphones were the second most common preference and the top choice a third of the time. For video uses, the large screen of the TV set made it the top choice over a sixth of the time. The important thing to note is that for no activity or demographic were tablets the preferred choice.
But perhaps the biggest challenge for the tablet is that it is seldom the preferred device for any category of usage, and for any demographic.
53
Technology, Media & Telecommunications Predictions | 2017
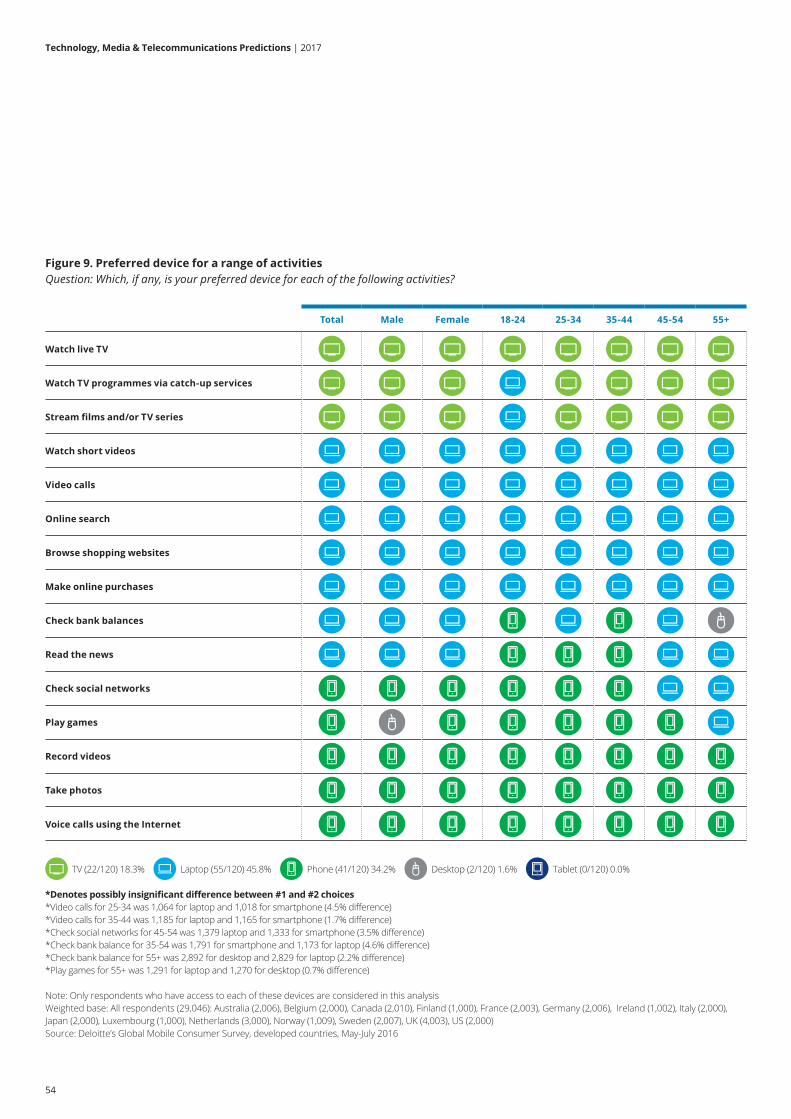
Figure 9. Preferred device for a range of activitiesQuestion: Which, if any, is your preferred device for each of the following activities?
Total Male Female 18-24 25-34 35-44 45-54 55+
Watch live TV
Watch TV programmes via catch-up services
Stream films and/or TV series
Watch short videos
Video calls
Online search
Browse shopping websites
Make online purchases
Check bank balances
Read the news
Check social networks
Play games
Record videos
Take photos
Voice calls using the Internet
TV (22/120) 18.3% Laptop (55/120) 45.8% Phone (41/120) 34.2% Desktop (2/120) 1.6% Tablet (0/120) 0.0%
*Denotes possibly insignificant difference between #1 and #2 choices *Video calls for 25-34 was 1,064 for laptop and 1,018 for smartphone (4.5% difference)*Video calls for 35-44 was 1,185 for laptop and 1,165 for smartphone (1.7% difference)*Check social networks for 45-54 was 1,379 laptop and 1,333 for smartphone (3.5% difference)*Check bank balance for 35-54 was 1,791 for smartphone and 1,173 for laptop (4.6% difference)*Check bank balance for 55+ was 2,892 for desktop and 2,829 for laptop (2.2% difference)*Play games for 55+ was 1,291 for laptop and 1,270 for desktop (0.7% difference)
Note: Only respondents who have access to each of these devices are considered in this analysisWeighted base: All respondents (29,046): Australia (2,006), Belgium (2,000), Canada (2,010), Finland (1,000), France (2,003), Germany (2,006), Ireland (1,002), Italy (2,000), Japan (2,000), Luxembourg (1,000), Netherlands (3,000), Norway (1,009), Sweden (2,007), UK (4,003), US (2,000) Source: Deloitte’s Global Mobile Consumer Survey, developed countries, May-July 2016
54
Technology, Media & Telecommunications Predictions | 2017
This does not mean that no one likes using tablets. In the same survey, tablets finished fourth in terms of being the preferred device for playing games, behind phones, laptops and desktops (in descending order). But this data obscures some important points. Although tablets were fourth, they still represented the preferred device for one in six respondents, or 17 percent. In addition, although phones were the top device for the population as a whole, tablets were the top device for 24 percent of those aged over 55, well ahead of phones, which scored only 14 percent for this cohort, but still behind laptops and desktops. There are also countries where tablets are relatively more popular. For playing games, in Canada the tablet was the second most preferred device by women, and by both genders for those aged 45-54 years and those over 55.
Another interesting trend is that not only are fewer tablets being sold over time but the number connected to the cellular network is declining even more rapidly. Historically, reports suggest that 80 percent of tablets sold are Wi-Fi-only models, and only half of those with cellular capability are connected to a network277, meaning just 10 percent of all tablets are connected. In the US, the four largest cellular operators have seen the number of tablets activated in the third quarter fall from about 1.8 million in 2015 to just over half a million in 2016, or a decline of roughly 70 percent278.
The bottom line
In the Olympics there is not even a tin medal for fourth place. The numbers vary by country, but there are three consumer devices that are at present head and shoulders above the others: TVs, smartphones and computers.
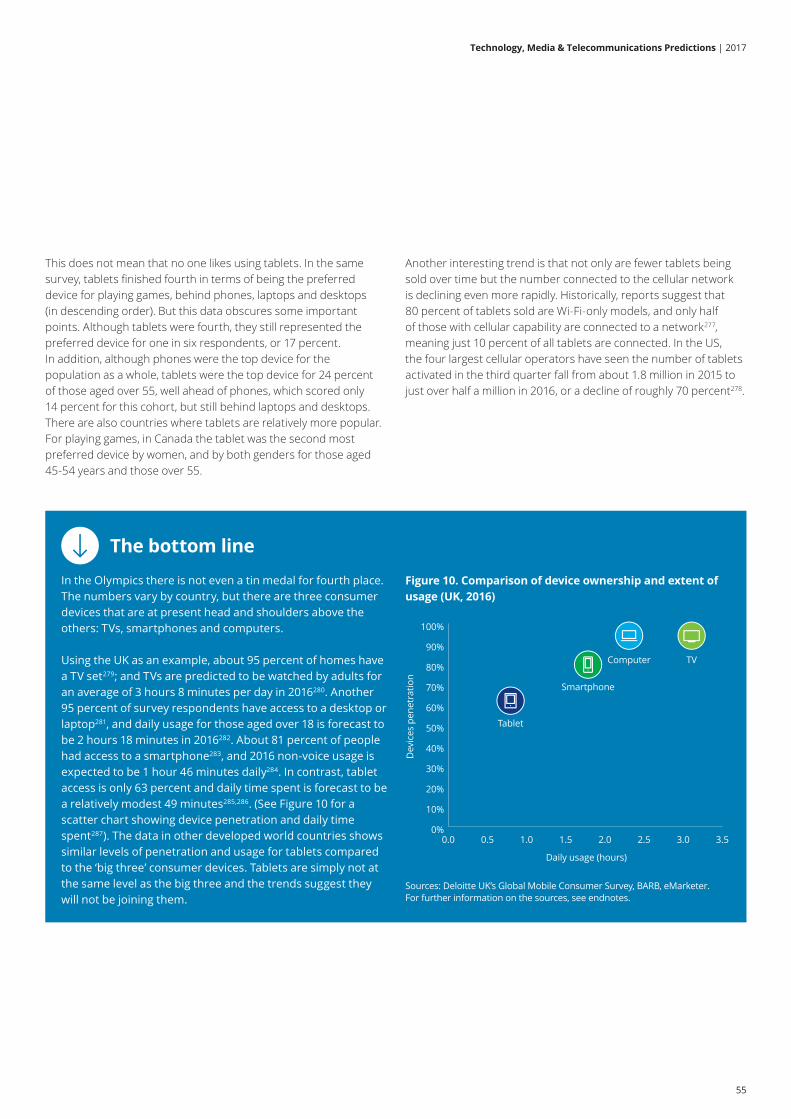
Using the UK as an example, about 95 percent of homes have a TV set279; and TVs are predicted to be watched by adults for an average of 3 hours 8 minutes per day in 2016280. Another 95 percent of survey respondents have access to a desktop or laptop281, and daily usage for those aged over 18 is forecast to be 2 hours 18 minutes in 2016282. About 81 percent of people had access to a smartphone283, and 2016 non-voice usage is expected to be 1 hour 46 minutes daily284. In contrast, tablet access is only 63 percent and daily time spent is forecast to be a relatively modest 49 minutes285,286. (See Figure 10 for a scatter chart showing device penetration and daily time spent287). The data in other developed world countries shows similar levels of penetration and usage for tablets compared to the ‘big three’ consumer devices. Tablets are simply not at the same level as the big three and the trends suggest they will not be joining them.
Figure 10. Comparison of device ownership and extent of usage (UK, 2016)
Sources: Deloitte UK’s Global Mobile Consumer Survey, BARB, eMarketer.For further information on the sources, see endnotes.
0.0 0.5 1.0 1.5 2.0 2.5 3.0 3.50%
10%
20%
30%
40%
50%
60%
70%
80%
90%
100%
Dev
ices
pen
etra
tion
Daily usage (hours)
Tablet
Smartphone
Computer TV
55
Technology, Media & Telecommunications Predictions | 2017

Deloitte refers to one or more of Deloitte Touche Tohmatsu Limited, a UK private company limited by guarantee (“DTTL”), its network of member firms, and their related entities. DTTL and each of its member firms are legally separate and independent entities. DTTL (also referred to as “Deloitte Global”) does not provide services to clients. Please see www.deloitte.com/about to learn more about our global network of member firms.
This communication contains general information only, and none of Deloitte Touche Tohmatsu Limited, its member firms, or their related entities (collectively the “Deloitte Network”) is, by means of this communication, rendering professional advice or services. Before making any decision or taking any action that may affect your finances or your business, you should consult a qualified professional adviser. No entity in the Deloitte Network shall be responsible for any loss whatsoever sustained by any person who relies on this communication.
© 2017. For information, contact Deloitte Touche Tohmatsu Limited.
Designed and produced by The Creative Studio at Deloitte, London. J10517