2017 Standard Scenarios Report: A U.S. Electricity Sector ... · o The large potential for battery...
41
2017 Standard Scenarios Report: A U.S. Electricity Sector Outlook Wesley Cole, Trieu Mai, James Richards, and Paritosh Das, NREL Paul Donohoo-Vallett, U.S. DOE October 17, 2017 W. Cole et al., “2017 Standard Scenarios Report: A U.S. Electricity Sector Outlook,” NREL/TP-6A20-68548, 62 pp. (October 2017). NREL/PR-6A20-70328
Transcript of 2017 Standard Scenarios Report: A U.S. Electricity Sector ... · o The large potential for battery...

2017 Standard Scenarios Report: A U.S. Electricity Sector Outlook
Wesley Cole, Trieu Mai, James Richards, andParitosh Das, NREL
Paul Donohoo-Vallett, U.S. DOE
October 17, 2017
W. Cole et al., “2017 Standard Scenarios Report: A U.S. Electricity SectorOutlook,” NREL/TP-6A20-68548, 62 pp. (October 2017).NREL/PR-6A20-70328

NATIONAL RENEWABLE ENERGY LABORATORY 2
• Suite of 26 forward-looking scenarios (projections) of the U.S. power sector
• NREL report that identifies themes from the scenarios
o Uses the 26 scenarios to provide an outlook of the power sector
• Companion product of the Annual Technology Baseline
What is the “Standard Scenarios?”

NATIONAL RENEWABLE ENERGY LABORATORY 3
• Internal Value
o Consistency across analyses
o Improved efficiency
• External Value
o Share our input assumptions and model results
o Provide an additional perspective on power sector evolution
o Inform stakeholder decision-making
Why do we do the Standard Scenarios?

NATIONAL RENEWABLE ENERGY LABORATORY 4
• More scenarios
o Additional nuclear retirement sensitivities
o Low/high battery storage cost
o Low PV and Low Wind cost
• Clean Power Plan included only as a sensitivity
• Default nuclear retirements updated (mix of 60 and 80 years)
• State policy updates
• Various model improvements
Changes from last year

NATIONAL RENEWABLE ENERGY LABORATORY 5
• Summary of the Standard Scenarios
• Insights and perspectives from the 2017 Standard Scenarios (i.e., what is in the report)
• How to access the scenario data
Webinar Outline

The Standard Scenarios

NATIONAL RENEWABLE ENERGY LABORATORY 7
• Fuel prices: EIA Annual Energy Outlook (AEO) 2017
• Demand growth: AEO 2017
• Technology cost and performance: 2017 Annual Technology Baseline (ATB)
• Current policies (no Clean Power Plan)
• Current fleet characteristics: ABB Velocity Suite
The Mid-case Scenario
0
1
2
3
4
5
6
7
2010 2020 2030 2040 2050
Fu
el
Pri
ce
(2015$/M
MB
tu) Natural Gas
Coal
Uranium
0
0.2
0.4
0.6
0.8
1
1.2
1.4
2010 2020 2030 2040 2050
Dem
an
d G
row
th

NATIONAL RENEWABLE ENERGY LABORATORY 8
Summary of the Standard Scenarios
Non-Policy Scenarios
Other
•Low Cost Financing
•Climate Change Impacts
•Reduced RE Resource
•Transmission Expansion Barriers
•Restricted Cooling Water
Fuel Cost
•High Oil & Gas Resource (AEO 2017)
•Low Oil & Gas Resource (AEO 2017)
Technology Cost
•Low RE Cost
•High RE Cost
•Low Wind Cost
•Low PV Cost
•Nuclear Breakthrough
•Low Battery Cost
•High Battery Cost
Retirements
•80 Year Nuclear
•60 Year Nuclear
•Accelerated Nuclear Retirement
•Accelerated Coal Retirement
Demand
•Low Demand
•High Demand
•Vehicle Electrification
Policy
•Clean Power Plan (as finalized in 2015)
•National 80% RPS by 2050
•83% CO2 Reduction by 2050
•ITC & PTC Extension to 2030

NATIONAL RENEWABLE ENERGY LABORATORY 9
Modeling Tools
• ReEDS: Central-planning optimization model of U.S. Electricity Sectoro 134 Balancing Areas
o Explicit consideration of RE integration issues
o Represents transmission
• dGen: Consumer adoption model of distributed PVo Solar PV
o County-level resolution
o Incorporates state and local incentives and rate structures
o Residential and C&I included

Electricity Sector Trends and Outlook

The Mid-case Scenario

NATIONAL RENEWABLE ENERGY LABORATORY 12
Most new energy growth is met by wind and solar.
No dramatic changes until post-2040.
Mid-case Power Sector Evolution
13
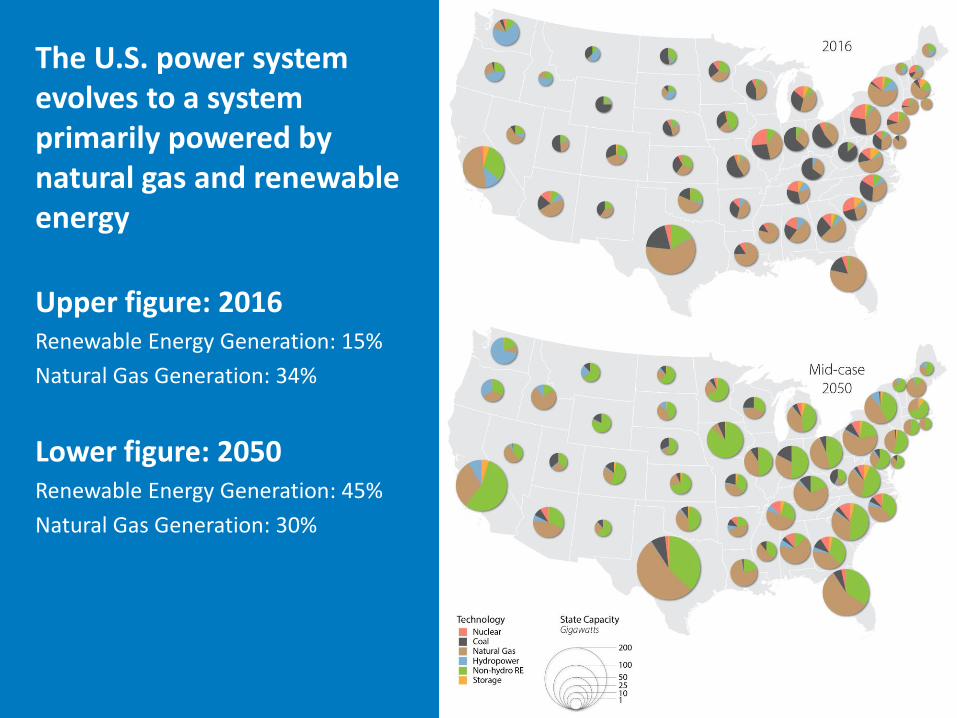
The U.S. power system evolves to a system primarily powered by natural gas and renewable energy
Upper figure: 2016Renewable Energy Generation: 15%
Natural Gas Generation: 34%
Lower figure: 2050Renewable Energy Generation: 45%
Natural Gas Generation: 30%

Theme #1: A promising future for natural gas and renewable energy

NATIONAL RENEWABLE ENERGY LABORATORY 15
Historical net additions are defined as the differences in installed net summer capacity at the end of the year shown from the end of the prior year. Planned net additions are defined as planned capacity minus planned retirements. Planned additions differ from forecasted additions and can understate the amount of renewable capacity under consideration, as renewable technologies can have short siting and construction periods.Data sources: EIA Electric Power Annual and Electric Power Monthly
Recent historical and planned capacity additions are predominantly natural gas and renewable energy technologies
-30
-20
-10
0
10
20
30
40
50
Net
An
nu
al
Ch
an
ge in
C
ap
acit
y (
GW
)
RE
NG
Coal
Nuclear
Other
Historical net additions Planned net additions
NATIONAL RENEWABLE ENERGY LABORATORY 16
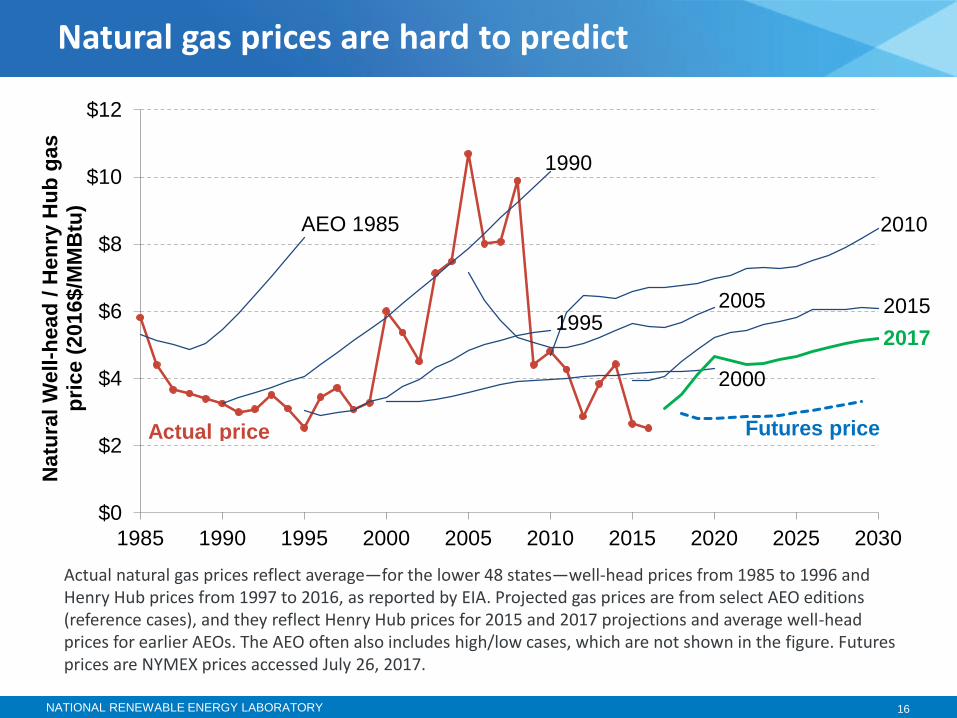
Actual natural gas prices reflect average—for the lower 48 states—well-head prices from 1985 to 1996 and Henry Hub prices from 1997 to 2016, as reported by EIA. Projected gas prices are from select AEO editions (reference cases), and they reflect Henry Hub prices for 2015 and 2017 projections and average well-head prices for earlier AEOs. The AEO often also includes high/low cases, which are not shown in the figure. Futures prices are NYMEX prices accessed July 26, 2017.
Natural gas prices are hard to predict
$0
$2
$4
$6
$8
$10
$12
1985 1990 1995 2000 2005 2010 2015 2020 2025 2030
Natu
ral
Well
-head
/ H
en
ry H
ub
gas
pri
ce (
2016$/M
MB
tu)
AEO 1985
1990
1995
2000
Actual price
2005
2010
2015
2017
Futures price

NATIONAL RENEWABLE ENERGY LABORATORY 17
The figure is a modified version of one from Margolis, Feldman, and Boff (2017).
So are renewable energy costs
$0.0
$0.5
$1.0
$1.5
$2.0
$2.5
$3.0
$3.5
$4.0
$4.5
$5.0
2008
2009
2010
2011
2012
2013
2014
2015
2016
2017
2018
2019
2020
PV
Mo
du
le P
rice (
2016$/W
)
Estimates Made in 2008200920102011201220132014201520162017Actual

NATIONAL RENEWABLE ENERGY LABORATORY 18
0
500
1,000
1,500
2,000
2,500
3,000
TW
h
0
500
1,000
1,500
2,000
2,500
3,000
TW
h
Uncertainties in future technology and market conditions drive uncertainties in projected generation across many technologies
0
500
1,000
1,500
2,000
2,500
3,000
TW
h
Sensitivity Range
Mid-case0
500
1,000
1,500
2,000
2,500
3,000
TW
h
Renewable Energy Natural Gas
Coal Nuclear

NATIONAL RENEWABLE ENERGY LABORATORY 19
Interaction of Natural Gas and Renewable Energy
0
500
1,000
1,500
2,000
2,500
3,000
0 1,000 2,000 3,000 4,000
NG
Ge
nera
tio
n (
TW
h)
RE Generation (TWh)
2020 2030 2040 2050
Low RE Cost
High NG Price
Low NG Price
High RE Cost
0
200
400
600
800
1,000
0 1,000 2,000 3,000 4,000N
G C
ap
acit
y (
GW
)RE Generation (TWh)
2020 2030 2040 2050
Although future competition for RE and NG exists, there is also complementary generation and capacity growth

20
2050 Capacity Mix
Top: Low RE CostRenewable Energy Generation: 57%Natural Gas Generation: 23%
Bottom: Low NG PriceRenewable Energy Generation: 27%Natural Gas Generation: 56%

NATIONAL RENEWABLE ENERGY LABORATORY 21
Power sector emissions and water use are mostly flat in all non-policy scenarios
Emissions and Water
0
0.5
1
1.5
2
2.5
2020 2030 2040 2050
CO
2E
mis
sio
ns
(billio
n m
etr
ic t
on
s)
Sensitivity Range
Mid-case
0
200
400
600
800
1,000
1,200
1,400
1,600
2020 2030 2040 2050
Wa
ter
Co
nsu
mp
tio
n
(billio
n g
allo
ns)

Theme #2: Wind and Solar Competition

NATIONAL RENEWABLE ENERGY LABORATORY 23
Recent growth in RE generation is primarily from wind and from PV
0
100
200
300
400
500
600
7002000
2001
2002
2003
2004
20
05
2006
2007
2008
2009
2010
2011
2012
2013
2014
2015
2016
RE
Gen
era
tio
n (
TW
h)
Geothermal, CSP, Bio
Wind
DPV
UPV
Hydropower(three-year rolling average)
6.8%
8.5%

NATIONAL RENEWABLE ENERGY LABORATORY 24
Note that PPAs are market values that reflect the impact of tax credits and other incentives.
Figure from Wiser, Bolinger, and Seel (2017).
Wind and PV PPA prices show noticeable decline and convergence over the past decade
$0
$20
$40
$60
$80
$100
$120
$140
$160
$180
$200
PPA Execution Date
Utility-Scale PV
Utility-Scale Wind
Leve
lize
d P
PA
Pri
ce (
20
16
$/M
Wh
)
250 MW
30 MW
99 MW
2008 2009 2010 2011 2012 2013 2014 2015 2016 2017

NATIONAL RENEWABLE ENERGY LABORATORY 25
NG, Wind, and PV Are Increasingly Competitive
ITC Stepdown
PTC Expiration
Mid Case RE Costs Low Wind Costs Low PV Costs
Costs include effects of tax credits but exclude the highest cost, lowest resource quality wind resources (techno-resource groups [TRGs] 8–10) for ease of comparison. These ranges also exclude geographic capital cost factors, and only account for costs within the plant boundary. Fuel price assumes combined-cycle heat rate. For details, see Eurek et al. (2016) and the 2017 Annual Technology Baseline (ATB) (NREL 2017)

NATIONAL RENEWABLE ENERGY LABORATORY 26
Relative wind and solar costs along with natural gas prices are major factors driving VRE generation
0%
10%
20%
30%
40%
50%
60%
2020 2030 2040 2050
VR
E P
en
etr
ati
on
(%
)
2020 2030 2040 20502020 2030 2040 2050
High NG
Price
(+$25/MWh)
Low NG
Price
Low RE
Cost
High RE
Cost
Low Wind
Cost
Low PV
Cost

NATIONAL RENEWABLE ENERGY LABORATORY 27
2020 2030 2040 2050
Trade-off of wind and solar is not 1:1
Low RE Cost Low Wind Cost Low PV Cost
-800
-600
-400
-200
0
200
400
600
800
2020 2030 2040 2050
Ge
ne
rati
on
Dif
fere
nce
(TW
h)
Wind
Coal
Natural Gas
UPV
2020 2030 2040 2050
Differences are relative to the Mid-case
DPV
CSP
Theme #3: There is a lot of potential for low-cost battery storage

NATIONAL RENEWABLE ENERGY LABORATORY 29
Battery costs are from Cole, Marcy, et al. (2016) and NG-CT costs are from the 2017 Annual Technology Baseline (NREL 2017).
8-hour battery: low-cost projection approaches NG-CT
0
500
1,000
1,500
2,000
2,500
3,000
3,500
4,000
4,500
2015 2020 2025 2030 2035 2040 2045 2050
Overn
igh
t C
ap
ital C
ost
($/k
W) High Battery CostMid-case Battery CostLow Battery CostNG-CT

NATIONAL RENEWABLE ENERGY LABORATORY 30
Cumulative storage capacity over time
0
50
100
150
2002
016
2018
2020
2022
2024
2026
2028
2030
2032
2034
2036
2038
2040
2042
2044
2046
20
48
2050
Sto
rag
e C
ap
acit
y (
GW
)
Sensitivity Range
Mid-case
Low Battery Cost
Carbon Cap
80% National RPS
High NG Price

NATIONAL RENEWABLE ENERGY LABORATORY 31
Storage vs. VRE penetration
0
50
100
150
200
250
0 0.2 0.4 0.6 0.8
2050 S
tora
ge
Cap
acit
y (
GW
)
2050 VRE Penetration Fraction
Low Battery Cost
Scenario
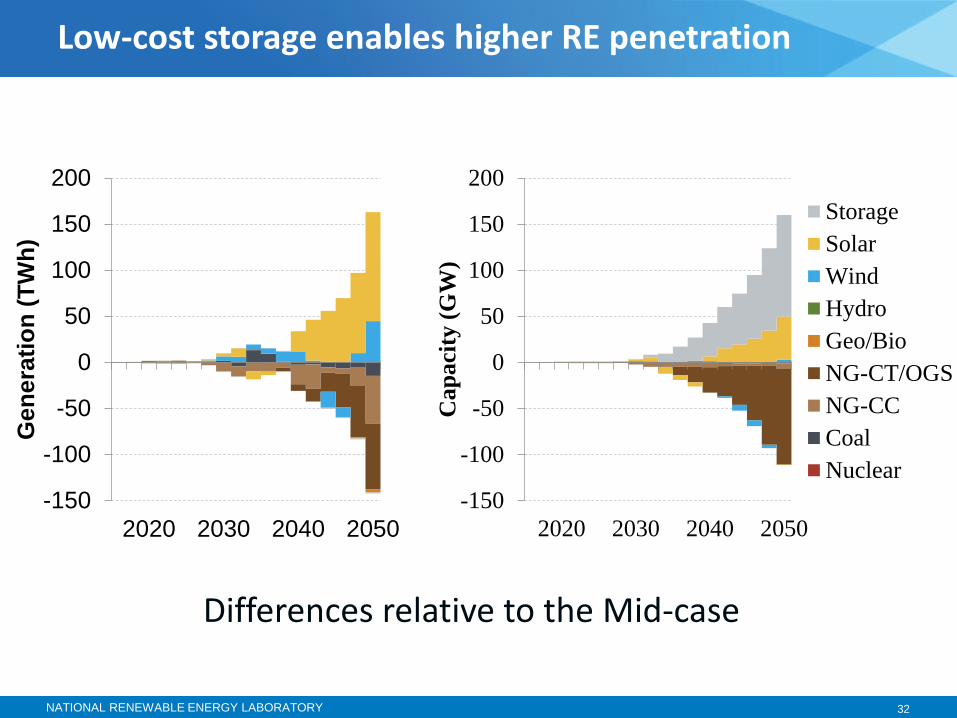
NATIONAL RENEWABLE ENERGY LABORATORY 32
Low-cost storage enables higher RE penetration
-150
-100
-50
0
50
100
150
200
2020 2030 2040 2050
Gen
era
tio
n (
TW
h)
-150
-100
-50
0
50
100
150
200
2020 2030 2040 2050
Cap
aci
ty (
GW
)
Storage
Solar
Wind
Hydro
Geo/Bio
NG-CT/OGS
NG-CC
Coal
Nuclear
Differences relative to the Mid-case

Theme #4: Uncertainty in nuclear retirements lead to uncertainty in
future capacity and generation needs

NATIONAL RENEWABLE ENERGY LABORATORY 34
Recent and announced nuclear retirements

NATIONAL RENEWABLE ENERGY LABORATORY 35
Nuclear capacity over time across the four retirement scenarios
0
20
40
60
80
100
120
2015 2020 2025 2030 2035 2040 2045 2050
Nu
cle
ar C
apac
ity
(GW
)
80-year
Mid-case
60-year
Early Retire

NATIONAL RENEWABLE ENERGY LABORATORY 36
NG-CC is natural gas combined cycle, NG-CT is natural gas combustion turbine, OGS is oil-gas-steam, and Geo/Bio is geothermal and biopower.
Generation and capacity differences by technology relative to the Mid-case scenario for 2030 and 2050
-400
-300
-200
-100
0
100
200
300
400
2030
2050
2030
2050
2030
2050
Early
Retire
60-year 80-
year
Dif
fere
nce
in
Gen
erati
on
fro
m
Mid
-case
(T
Wh
)
-125
-75
-25
25
75
125
2030
2050
2030
2050
2030
2050
Early
Retire
60-year 80-
year
Dif
fere
nce
in
Cap
aci
ty f
rom
Mid
-case
(G
W)
Storage
Solar
Wind
Hydro
Geo/Bio
NG-
CT/OGSNG-CC
Coal
Nuclear

NATIONAL RENEWABLE ENERGY LABORATORY 37
Impact of nuclear retirements on CO2 emissions

How to Access Scenario Data

NATIONAL RENEWABLE ENERGY LABORATORY 39
Scenario data available online

NATIONAL RENEWABLE ENERGY LABORATORY 40
• Standard Scenarios provides a framework to
o Improve analysis and modeling work
o Provide a perspective on the U.S. electricity sector evolution
o Get access to state-level projections
• Themes from 2017:
o Growth in natural gas and renewables
o Competition between wind and PV
o The large potential for battery storage
o Nuclear lifetimes
Summary

www.nrel.gov
NREL is a national laboratory of the U.S. Department of Energy, Office of Energy Efficiency and Renewable Energy, operated by the Alliance for Sustainable Energy, LLC.
Questions or Comments?
The Standard Scenarios Report is available at
http://www.nrel.gov/analysis/data-tech-baseline.html
Viewer: https://openei.org/apps/reeds/