South Florida Everglades Ecosystem Restoration Program South ...
Upload
rodney-langerCategory
view
573download
0
RETAIL REAL ESTATESouth Florida Market Report
SPRING 2016

Should you have any questions or comments, or want the complete 30-market report, please call or email us at any time. We seek to be of service!
Sincerely,
John CrossmanPresidentCrossman & CompanyJanuary 2016
EXECUTIVE SUMMARYI am pleased to present the South Florida excerpt of our 2016 Crossman & Company Retail Report for the Southeast.
This report is the result of a tremendous amount of effort from our research department and the many outstanding relationships that we enjoy throughout the country. Our partnerships with universities, trade organizations and many industry leaders lend a unique and dynamic perspective to this report. A list of our contributing partners is included at the end of the report, and we are grateful for and proud of our association with these groups.
REPORT REVIEW & RESEARCH METHODOLOGY Our presentation begins with an in-depth exploration of the Miami-Dade County market and easy-to-navigate infographics for Broward and Palm Beach Counties. This is followed by editorial articles on capital markets, Millennials’ shopping habits and their impact, and the retail market in Florida.
In the larger market report found on our website, we identified the top 30 markets in the Southeast. Of those 30, we took an in-depth look at the 5 investment-grade markets; the result is what we’ve come to call the “Top 5 Deep Dive.” In addition to reporting the fundamental market metrics, we highlight a few of the major developments, touch on tenant activity, and report updates on improvements in the infrastructure of the biggest metropolitan areas in the Southeast: Atlanta, Charlotte, Miami-Dade County, Orlando, and Tampa.
The remaining 25 markets are grouped by state, and the states are listed alphabetically. We organized data from a variety of sources and reported them in an easy-to-navigate infographic, with quotes from people operating in those markets. Please note: we annotated the data in the ‘Data Sources’ page at the back of the report instead of citing the sources on each page.
EXECUTIVE SUMMARY & METHODOLOGY
Crossman & Company cover all the major markets: the 30 retail real estate markets covered in the report are shaded. Atlanta, Charlotte, Miami-Dade County, Orlando, and Tampa are shown in red; the balance of the 25 markets are shown in dark grey.

3.
SEPTEMBER 2015 UNEMPLOYMENT
6.2%
Down from 6.8%
in Sept 2014
DEEP DIVE 3: MIAMI-DADE COUNTY2.66 million residents
Bureau of Labor Statistics
Source: Bureau of Labor Statistics Generated on: September 3, 2014 (02:49:00 PM)
Area:Area Type:State/Region/Division:Measure:Years:
Local Area Unemployment StatisticsOriginal Data Value
Not Seasonally Adjusted
Florida
2004 to 2015
4%
5%
6%
7%
8%
9%
Unemployment Rates
National Florida Miami-Dade County
1.31 million people in the workforce
$43,427 median 2015 household income
65.5 million square feet of retail in shopping centers, power centers and malls
Shopping Center
71%
Power Center
5%
Mall 24%
Total Retail GLA
506,000 square feet of retail delivered to market in 2015
2.77 million square feet of retail under construction in 2015
2015 ASSET SALES VOLUME (Rolling 12 mo)
$2.17 billion
Down from $2.26 billion in
2014
2015 AVERAGE CAP RATE
7.2%
Down 30 basis pts from 2014
BIENVENIDO A MIAMIMiami-Dade county’s population continues to grow, but not in a uniform way. People are not settling evenly across the county geographically either. 2014 saw a net increase of more than 21,000 people, with more than half of them having moved there in that year rather than being born there. Of those who moved in, the skew in the data is even more revealing: more than 27,000 domestic residents left the area, while there was an influx of nearly 39,000 people from outside the US, resulting in a net gain of 11,559 people. The labor market is also improving: 21,800 jobs were added and the unemployment rate dropped 60 basis points from September 2014 to September 2015. Job growth registers at 2.0%, just ahead of the 1.9% national average. Internationals are coming to Miami to live, work, and shop, and developers have responded with condominium and luxury housing, transit-oriented development, and mixed-use centers with breadth and scale that rival other international markets.
PUT YOUR MONEY WHERE YOUR MOUTH ISInvestors and developers continue to place their confidence in Miami as a market, as evidenced by recent transactions, notable deliveries, and projects under development that have broken ground in 2015. Lincoln Road continues to climb the ranks of high street retail: a set of buildings totaling 74,532 square feet

4.
MIAMI-DADE COUNTYtopped the bill as 2015’s largest retail sale. 1001 to 1035 Lincoln Road traded hands for $370 million, or $4,964 per square foot. Other significant transactions include the Bayside Marketplace in downtown Miami for $196 million ($918/square foot), and Mary Brickell Village in Brickell for $113.5 million ($1,158/square foot).
Significant deliveries include a 182,000 square foot Walmart opening in Liberty City, Fountain Square shopping center measuring 177,231 square feet, and Doral Commons, a 133,208 square foot Publix-anchored retail center. Properties in the development pipeline that are slated for a 2016 delivery include the retail mall element of Brickell City Centre which weighs in at 500,000 square feet; CityPlace Doral, a mixed-use center with 300,000 square feet of retail; and a 113,508 square foot Silverspot Cinema located in the Met Square apartment development in downtown Miami.
MIXED-USE IN THE CONSTRUCTION PIPELINEIn speaking to Dale Scott of Hawkins Construction, Inc, he had this to say about construction demand in Florida in general and Miami-Dade in particular: “The greatly-reduced retail development and construction throughout the recession created pent up demand for
new retail space, which has fueled development activity. Throughout the entire state of Florida there has been a corresponding uptick in construction activity. This started mid- to late-2013, gaining an aggressive head of steam. Miami-Dade has lead this trend and this momentum has extended to virtually all of the state. Many contractors now have a cache of work that echos back pre-reccession levels. This forecasts vigorous construction activity through 2017, and based on the projects in planning, should sustain construction activity well into 2018. Developers should beware of potential issues in the form of labor shortages and escalating construction pricing. These negatives are to be expected, and are standard procedure during every growth period. Construction is the last step in the development process, which means contractors are busy well after the development efforts have slowed. All predictions point to good times in the Florida construction industry for the next several years.”
Miami-Dade’s retail fundamentals were subject to erratic swings in the boom before the recession. However, by the beginning of 2010, vacancy began a gentle descent and while construction had hit bottom, it too began to slowly find its bearings. From 2010 through 2013, there was an annual average of 835,000 square feet under construction. Things began to pick up steam in 2014 with a total of
This is what Miami’s biggest retail transaction of 2015 looks like: a rendering of the refreshed GAP anchor store at 1001 Lincoln Road. Other tenants include Apple and Nike. Source: Comras Company website
Publix-anchored Doral Commons opened in December 2015. Source: Publix Facebook

5.
MIAMI-DADE COUNTY
Submarket Total GLA Occ % Rates Total GLA Occ % Rates Total GLA Occ % RatesAventura 1,881,210 97.0% $33.75 388,141 100.0% - 3,350,166 100.0% -Biscayne Corridor 525,428 85.2% $35.81 0 - - 0 - -Brickell 155,393 98.8% $175.00 0 - - 0 - -Coconut Grove 511,487 98.9% $46.89 0 - - 199,683 91.9% -Coral Gables 394,694 94.5% $46.71 0 - - 1,046,671 98.2% $45.02Coral Way 455,625 99.3% $26.00 241,272 95.9% $35.01 0 - -Downtown Miami 120,988 90.4% $50.00 0 - - 213,438 96.7% -Hialeah Gardens 1,341,591 96.0% $18.45 0 - - 466,744 93.8% $10.90Kendall 9,949,642 95.6% $29.73 362,493 100.0% $40.00 3,175,024 96.9% $45.06Medley / Hialeah 5,320,246 97.3% $21.16 796,413 98.5% $22.24 815,174 100.0% -Miami Airport 6,084,186 96.9% $24.53 1,018,034 99.3% $30.00 3,525,969 99.8% -Miami Beach 531,032 97.0% $39.27 180,000 98.7% - 1,471,950 94.7% $190.53Miami Lakes 2,552,078 94.2% $21.85 0 - - 0 - -Miami 2,184,832 93.5% $33.34 0 - - 32,711 100.0% -NE Dade 5,607,493 94.6% $19.75 0 - - 681,469 91.8% -Outlying Miami-Dade 185,951 96.0% $22.89 0 - - 0 - -South Dade 4,557,064 94.8% $19.71 361,785 98.2% - 961,486 98.4% -West Miami 3,805,853 97.1% $27.10 0 - - 0 - -Total / Averages 46,164,793 95.7% $25.40 3,348,138 98.9% $30.93 15,940,485 98.0% $42.08
Shopping Centers, Q3 2015 Power Centers, Q3 2015 Malls, Q3 2015
$20.00
$30.00
$40.00
$50.00
$60.00
$70.00
Rental Rates by Category
Mall Power Center Shopping Center
94.0%
95.5%
97.0%
98.5%
100.0%
Occupancy by Category
Mall Power Center Shopping Center
$20.00
$30.00
$40.00
$50.00
$60.00
$70.00
Rental Rates by Category
Mall Power Center Shopping Center
94.0%
95.5%
97.0%
98.5%
100.0%
Occupancy by Category
Mall Power Center Shopping Center
3.77 million square feet under construction, bolstered strongly by large-scale mixed-use projects. 2015 averaged 693,000 square feet per quarter and wrapped up the year with more than 2.77 million square feet under construction. Retail deliveries have experienced a bit of a lag following construction, again due to the complexity and heft of mixed-use projects in the pipeline for 2016. Looking back, deliveries ebbed to an average of 207,000 square feet between 2010 and 2014, and finished 2015 with a total of 506,000 square feet coming to market.
STRONG ABSORPTION, LAG IN DELIVERIES CHIP AT VACANCYDuring the recovery, specifically between 2010 - 2014, net absorption averaged more than double the square footage delivered, coming in at 423,000 square feet per year. This helped to drive down the market
vacancy, which fell about 180 basis points over that time period. The net absorption ticked up to match the deliveries in 2015, averaging 194,000 square feet per quarter and 776,000 square feet in total. Overall retail vacancies dipped to 3.5% in 2015, a level not seen since mid-2008.
Areas to watch: Brickell, Miami Beach, Doral, Design District
“While the Miami retail sector continues to define itself as a mature international market, as we enter the later stages of this business cycle we anticipate reaching an inflection point at which rate growth is no longer supported by underlying retail sales.”
- Corey Winsett, Asset Manager Torchlight Loan Services

6.
$17.00$17.50$18.00$18.50$19.00$19.50$20.00$20.50
Shopping Center Rental Rates
Average Rental Rate
89.5%
90.0%
90.5%
91.0%
91.5%
92.0%
92.5%
Shopping Center Occupancy
% Occupied
BROWARD COUNTY1.87 million residents
1.00 million people in the workforce
SEPTEMBER 2015 UNEMPLOYMENT
4.9%
Down from 5.8%
in Sept 2014
Bureau of Labor Statistics
Source: Bureau of Labor Statistics Generated on: September 3, 2014 (02:49:00 PM)
Area:Area Type:State/Region/Division:Years:
Broward County, FLCounties and equivalentsFlorida2004 to 2015
Local Area Unemployment StatisticsOriginal Data Value
Not Seasonally Adjusted
4%
5%
6%
7%
8%
9%
Unemployment Rates
National Florida Broward County
$52,146 median 2015 household income
65.5 million square feet of retail in shopping centers, power centers and malls
$17.00$17.50$18.00$18.50$19.00$19.50$20.00$20.50
Shopping Center Rental Rates
Average Rental Rate
89.5%
90.0%
90.5%
91.0%
91.5%
92.0%
92.5%
Shopping Center Occupancy
% Occupied
Shopping Center
76%
Power Center
11%
Mall 13%
Total Retail GLA
Submarket Total GLA Occ % Rates Total GLA Occ % Rates Total GLA Occ % RatesCommercial Blvd 798,243 92.6% $15.31 248,718 100.0% - 0 - -Cypress Creek 1,661,544 90.9% $19.64 0 - - 0 - -Downtown Ft Lauderdale 994,898 97.5% $28.04 0 - - 1,227,477 80.6% -Ft Lauderdale 5,853,781 92.3% $19.59 620,676 100.0% - 463,924 86.3% $11.75Hallandale 1,728,862 90.8% $20.00 341,366 100.0% - 535,717 96.3% -Hollywood 4,689,430 91.9% $21.24 1,990,119 99.2% $29.61 163,179 56.2% -NW Broward / Coral Sprgs 8,470,872 91.5% $16.96 0 - - 1,037,203 98.8% $30.00Outlying Broward County 485,664 95.7% $19.14 0 - - 0 - -Plantation 6,975,419 89.5% $18.75 1,112,828 87.7% - 995,384 98.5% -Pompano Beach 8,001,303 92.5% $19.22 1,204,384 93.2% $16.26 319,498 94.9% $34.68Sawgrass Park 1,131,664 95.6% $27.39 0 - - 2,416,115 95.4% -Southwest Broward 7,660,160 92.9% $24.22 1,129,875 98.1% $20.00 1,272,570 97.7% $41.76Total / Averages 48,451,840 92.0% $19.75 6,647,966 96.1% $21.96 8,431,067 93.2% $29.55
Shopping Centers, Q3 2015 Power Centers, Q3 2015 Malls, Q3 2015
“Retail growth is poised to continue with the continued growth of high-paying jobs and new businesses moving into Miramar and Broward County. As the 2015 Greater Fort Lauderdale Economic Development Partner of the Year, The City of Miramar remains a leader in Broward County in attracting new companies and continues to offer a business-friendly environment that encourages retail development and growth.” - Wayne Messam, CGC, LEED AP BD+C,
Partner, Messam Construction Mayor of Miramar

7.
PALM BEACH COUNTY1.40 million residents
SEPTEMBER 2015 UNEMPLOYMENT
5.2%
Down from 5.9%
in Sept 2014
Bureau of Labor Statistics
Source: Bureau of Labor Statistics Generated on: September 3, 2014 (02:49:00 PM)
Area:Area Type:State/Region/Division:
Years:
Local Area Unemployment StatisticsOriginal Data Value
Not Seasonally AdjustedPalm Beach County, FLCounties and equivalentsFlorida
2004 to 20154%
5%
6%
7%
8%
9%
Unemployment Rates
National Florida Palm Beach County
685,000 people in the workforce
$52,951 median 2015 household income
$16.00
$16.50
$17.00
$17.50
$18.00
Shopping Center Rental Rates
Average Rental Rate
89.5%
90.0%
90.5%
91.0%
91.5%
92.0%
Shopping Center Occupancy
% Occupied
48.1 million square feet of retail in shopping centers, power centers and malls
$16.00
$16.50
$17.00
$17.50
$18.00
Shopping Center Rental Rates
Average Rental Rate
89.5%
90.0%
90.5%
91.0%
91.5%
92.0%
Shopping Center Occupancy
% Occupied Submarket Total GLA Occ % Rates Total GLA Occ % Rates Total GLA Occ % RatesBoca Raton East 1,984,818 93.3% $20.15 0 - - 317,695 95.6% $28.96Boca Raton North 112,465 100.0% $34.48 0 - - 0 - -Boca Raton West 2,869,007 95.2% $28.30 227,345 93.8% - 2,036,771 99.8% $50.00Boynton / Lantana 5,086,393 90.1% $18.20 1,316,060 90.7% $12.72 1,286,134 99.2% $18.85Delray Beach 3,113,972 91.5% $17.30 993,262 97.9% $30.44 259,753 91.7% -Jupiter 2,857,178 94.5% $18.08 0 - - 0 - -North Palm Beach 4,136,202 90.9% $18.07 421,485 88.6% $37.92 1,821,902 96.7% $27.66Outlying Palm Beach Co 2,438,906 93.6% $20.62 0 - - 0 - -Palm Beach 137,636 88.3% $40.00 0 - - 153,526 96.6% $30.00Palm Springs / Lake Worth 1,324,457 93.1% $12.08 0 - - 0 - -Royal Palm Bch / Wellington 4,048,845 91.2% $17.37 844,618 88.1% $15.15 1,271,000 100.0% -West Palm Beach CBD 62,037 92.2% $13.00 0 - - 1,209,527 100.0% -West Palm Beach 7,797,884 89.3% $15.14 0 - - 0 - -Total / Averages 35,969,800 91.6% $17.86 3,802,770 92.0% $19.92 8,356,308 98.6% $22.77
Shopping Centers, Q3 2015 Power Centers, Q3 2015 Malls, Q3 2015
Shopping Center
75%
Power Center
8%
Mall 17%
Total Retail GLA “Palm Beach county as well as other markets across the country have experienced an unprecedented compression of cap rates which has translated into record setting sales prices. Lease rates and absorption rates have followed suit in existing inventory on the market, all of which have propelled the sellers’ market. All of these factors make it difficult to have much value add to acquisitions, therefore, I believe value is created through development deals in this market.” - Patrick C. Koenig, President
Flagler Realty & Development, Inc.

8.
The Federal Reserve moved to increase interest rates for the first time in nine years this past December. In doing so, the Federal Open Market Committee (FOMC) cited considerable improvement in labor market conditions as well as rising household spending and business investment. In spite of significant strains on the global stage, policymakers’ outlook for the domestic economy is generally healthy.
The retail property sector will be one of the key beneficiaries of a strengthening job market. The combination of more confident consumers, the fading memory of the crisis, and rising wages alongside limited new supply point to gains in segments of the retail market that have not seen meaningful substitution into online commerce. The impact of online commerce in the world of bricks and mortar has been a degree of market Darwinism, where surviving retailers are better equipped to leverage internet sales than simply compete against it.
In its most recent Consensus Forecast, the Urban Land Institute projects the national retail availability rate will extend the gradual decline that has characterized the post-financial crisis era. (Exhibit 1) That has positive implications for property values, which
will come under pressure as rates rise. Assets with better cash flow growth prospects will do the best job of absorbing higher rates into cap rate spreads.
Notwithstanding the positive near-term outlook, the first weeks of the new year have underscored persistent headwinds ranging from economic and geopolitical challenges outside of the United States to the idiosyncrasies of a lackluster but aging domestic expansion. On one hand, investor attention has been focused on the impact of higher interest rates on cap rates and valuations; all else equal, appreciation will lose some of its momentum. On the other hand, the threats to expansion should not be underestimated.
A little further out on the horizon, there is an even larger question of how much longer the current expansion will endure. According to the most recent RELA–Chandan Survey of Commercial Real Estate Lender Sentiment, more than 80 percent of lenders are forecasting that origination volumes will peak prior to 2018. Even as we shake off the rust of the Great Recession, the aging of the current economic cycle means the next downturn will very likely fall within our current investment time-horizon.
6%
7%
8%
9%
10%
11%
12%
13%
14%
2003 2005 2007 2009 2011 2013 2015 2017
Exhibit 1: Retail Commercial Real Estate Vacancy Rates
CAPITAL MARKETSA REPORT FROM CHANDAN ECONOMICS
:
Source: ULI Consensus ForecastNote: Shaded Region is Forecast
Jonathan O’KaneAnalystChandan Economics
“On one hand, investor attention has been focused on the impact of higher interest rates on cap rates and valuations...”
“On the other hand, the threats
to expansion should not be
underestimated.”
9.
Additional editing byOwen Beitsch, Ph.D., Senior DirectorDavid Darsey, Senior Director
Laura Jones Smith, Senior Project AnalystCommunity Solutions Group, GAI Consultants, Inc. Service Group
RETAIL TRENDS MILLENNIALS’ IMPACT:
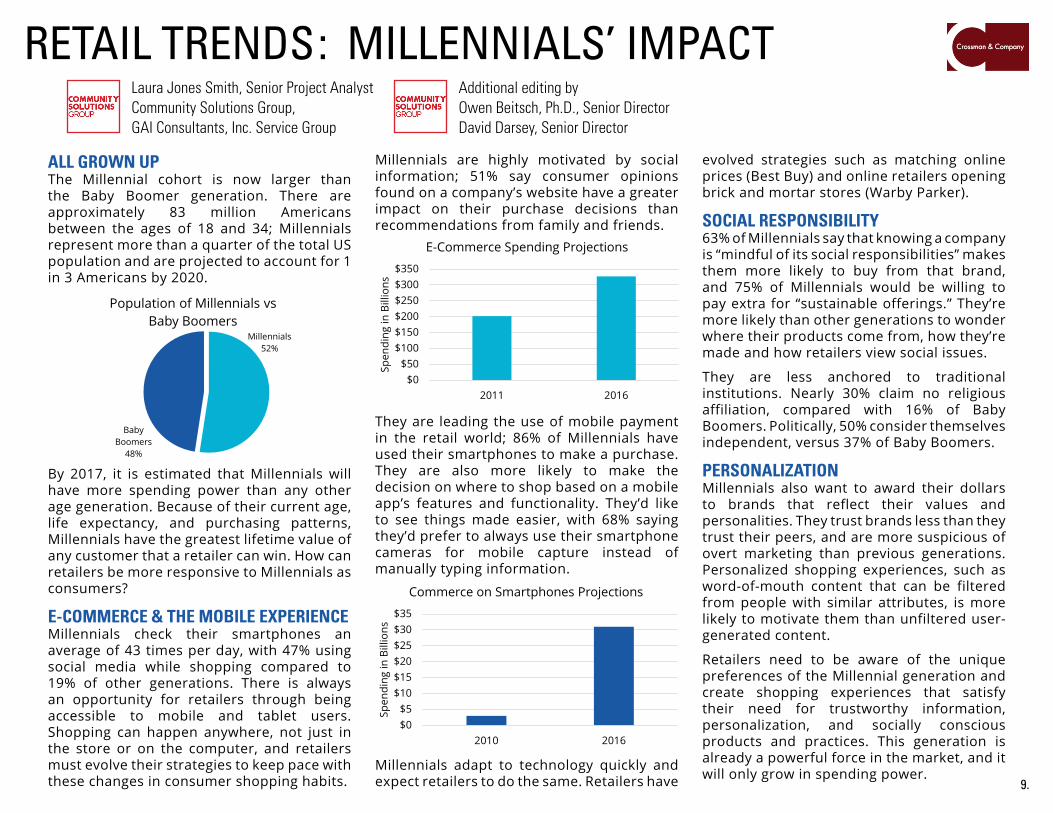
ALL GROWN UPThe Millennial cohort is now larger than the Baby Boomer generation. There are approximately 83 million Americans between the ages of 18 and 34; Millennials represent more than a quarter of the total US population and are projected to account for 1 in 3 Americans by 2020.
By 2017, it is estimated that Millennials will have more spending power than any other age generation. Because of their current age, life expectancy, and purchasing patterns, Millennials have the greatest lifetime value of any customer that a retailer can win. How can retailers be more responsive to Millennials as consumers?
E-COMMERCE & THE MOBILE EXPERIENCEMillennials check their smartphones an average of 43 times per day, with 47% using social media while shopping compared to 19% of other generations. There is always an opportunity for retailers through being accessible to mobile and tablet users. Shopping can happen anywhere, not just in the store or on the computer, and retailers must evolve their strategies to keep pace with these changes in consumer shopping habits.
Millennials are highly motivated by social information; 51% say consumer opinions found on a company’s website have a greater impact on their purchase decisions than recommendations from family and friends.
They are leading the use of mobile payment in the retail world; 86% of Millennials have used their smartphones to make a purchase. They are also more likely to make the decision on where to shop based on a mobile app’s features and functionality. They’d like to see things made easier, with 68% saying they’d prefer to always use their smartphone cameras for mobile capture instead of manually typing information.
Millennials adapt to technology quickly and expect retailers to do the same. Retailers have
evolved strategies such as matching online prices (Best Buy) and online retailers opening brick and mortar stores (Warby Parker).
SOCIAL RESPONSIBILITY63% of Millennials say that knowing a company is “mindful of its social responsibilities” makes them more likely to buy from that brand, and 75% of Millennials would be willing to pay extra for “sustainable offerings.” They’re more likely than other generations to wonder where their products come from, how they’re made and how retailers view social issues.
They are less anchored to traditional institutions. Nearly 30% claim no religious affiliation, compared with 16% of Baby Boomers. Politically, 50% consider themselves independent, versus 37% of Baby Boomers.
PERSONALIZATIONMillennials also want to award their dollars to brands that reflect their values and personalities. They trust brands less than they trust their peers, and are more suspicious of overt marketing than previous generations. Personalized shopping experiences, such as word-of-mouth content that can be filtered from people with similar attributes, is more likely to motivate them than unfiltered user-generated content.
Retailers need to be aware of the unique preferences of the Millennial generation and create shopping experiences that satisfy their need for trustworthy information, personalization, and socially conscious products and practices. This generation is already a powerful force in the market, and it will only grow in spending power.
Millennials 83.1Baby Boomers 75.4
Millennials 52%
Baby Boomers
48%
Population of Millennials vs Baby Boomers
2011 $2022016 $327
2010 $32016 $31
Commerce on Smartphones Projections
E-Commerce Spending Projections
* $ in billions
* $ in billions
$0$50
$100$150$200$250$300$350
2011 2016Sp
endi
ng in
Bill
ions
E-Commerce Spending Projections
$0$5
$10$15$20$25$30$35
2010 2016
Spen
ding
in B
illio
ns
Commerce on Smartphones Projections
2011 $2022016 $327
2010 $32016 $31
Commerce on Smartphones Projections
E-Commerce Spending Projections
* $ in billions
* $ in billions
$0$50
$100$150$200$250$300$350
2011 2016
Spen
ding
in B
illio
ns
E-Commerce Spending Projections
$0$5
$10$15$20$25$30$35
2010 2016
Spen
ding
in B
illio
ns
Commerce on Smartphones Projections
10.
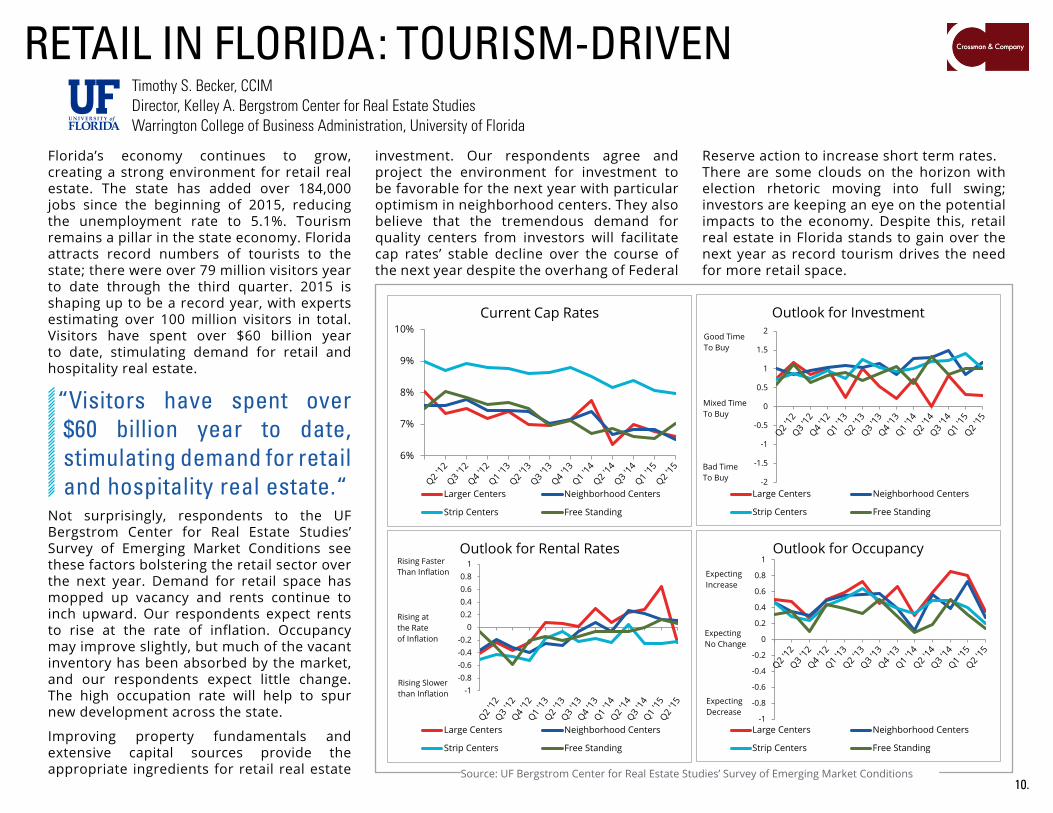
Florida’s economy continues to grow, creating a strong environment for retail real estate. The state has added over 184,000 jobs since the beginning of 2015, reducing the unemployment rate to 5.1%. Tourism remains a pillar in the state economy. Florida attracts record numbers of tourists to the state; there were over 79 million visitors year to date through the third quarter. 2015 is shaping up to be a record year, with experts estimating over 100 million visitors in total. Visitors have spent over $60 billion year to date, stimulating demand for retail and hospitality real estate.
Not surprisingly, respondents to the UF Bergstrom Center for Real Estate Studies’ Survey of Emerging Market Conditions see these factors bolstering the retail sector over the next year. Demand for retail space has mopped up vacancy and rents continue to inch upward. Our respondents expect rents to rise at the rate of inflation. Occupancy may improve slightly, but much of the vacant inventory has been absorbed by the market, and our respondents expect little change. The high occupation rate will help to spur new development across the state.
Improving property fundamentals and extensive capital sources provide the appropriate ingredients for retail real estate
investment. Our respondents agree and project the environment for investment to be favorable for the next year with particular optimism in neighborhood centers. They also believe that the tremendous demand for quality centers from investors will facilitate cap rates’ stable decline over the course of the next year despite the overhang of Federal
Reserve action to increase short term rates. There are some clouds on the horizon with election rhetoric moving into full swing; investors are keeping an eye on the potential impacts to the economy. Despite this, retail real estate in Florida stands to gain over the next year as record tourism drives the need for more retail space.
RETAIL IN FLORIDA Timothy S. Becker, CCIMDirector, Kelley A. Bergstrom Center for Real Estate StudiesWarrington College of Business Administration, University of Florida
TOURISM-DRIVEN:
-2
-1.5
-1
-0.5
0
0.5
1
1.5
2
Outlook for Investment
Large Centers Neighborhood Centers
Strip Centers Free Standing
Bad Time To Buy
Good Time To Buy
Mixed Time To Buy
-1
-0.8
-0.6
-0.4
-0.2
0
0.2
0.4
0.6
0.8
1Outlook for Occupancy
Large Centers Neighborhood Centers
Strip Centers Free Standing
Expecting Increase
Expecting Decrease
Expecting No Change
-1-0.8-0.6-0.4-0.2
00.20.40.60.8
1Outlook for Rental Rates
Large Centers Neighborhood Centers
Strip Centers Free Standing
Rising Faster Than Inflation
Rising at the Rate of Inflation
Rising Slower than Inflation
6%
7%
8%
9%
10%Current Cap Rates
Larger Centers Neighborhood Centers
Strip Centers Free Standing
Source: UF Bergstrom Center for Real Estate Studies’ Survey of Emerging Market Conditions
“Visitors have spent over $60 billion year to date, stimulating demand for retail and hospitality real estate.“

MARKETING22 MILLION SF
IN 307 SHOPPINGCENTERS ACROSS
SOUTHEAST
ATLANTA OFFICE
ORLANDO OFFICE
BOCA RATONOFFICE
TAMPAOFFICE
THE
LEASINGOur leasing team provides expert service for a wide range of retail property types including: neighborhood, community, regional, power centers, lifestyle and town centers.
PROPERTY MANAGEMENT & ACCOUNTINGOur property management and accounting team assists in providing budget projections, complete and customized financial reporting, collections, tenant retention strategy, on staff maintenance personnel, 24 hour help line, regular site inspection and evaluation of properties.
INVESTMENT SALESOur investment sales team provides owner disposition and consultation services using proprietary methodologies facilitated through exclusive representation.
ASSET MANAGEMENT & RECEIVERSHIPOur asset management and receivership team maximizes value for banks and financial institutions through strategic planning, financial analysis, REO disposition, property repositioning and construction management.
PROJECT MANAGEMENT Our project management team adds value to client relationships through its ability to manage projects such as construction, renovations, landscaping and tenant improvements.
MARKETINGOur marketing team leverages social media and public relations to create powerful messages for our projects.
RESEARCHOur staff uses cutting edge industry data and proprietary databases to create a competitive advantage for our clients.
TRADE ASSOCIATION LEADERSHIPMost members of Crossman and Company are actively involved in local and national trade associations, with particular concentration on the International Council of Shopping Centers (ICSC).
Kim Fitzgerald Senior Associate
Rodney Langer Senior Associate, Investment Sales
Johnny Fitzgerald Senior Associate
Shawna Rosner Property Manager
Michael Rautbord Senior Associate
Fernando Espino Associate
South Florida TeamWHY CROSSMAN & COMPANY?
BOCA RATON980 North Federal Hwy, Suite 434 | Boca Raton, Florida 33432
561-447-8940 | www.crossmanco.com