2016 Population By-census Household Income Distribution in ...
32
二零一六年中期人口統計 香港的住戶收入分布 2016 Population By-census Household Income Distribution in Hong Kong 二零一七年六月九日 9 June 2017 政府統計處 Census and Statistics Department
Transcript of 2016 Population By-census Household Income Distribution in ...

二零一六年中期人口統計
香港的住戶收入分布
2016 Population By-census
Household Income Distribution
in Hong Kong
二零一七年六月九日
9 June 2017
政府統計處 Census and Statistics Department
政府統計處 Census and Statistics Department
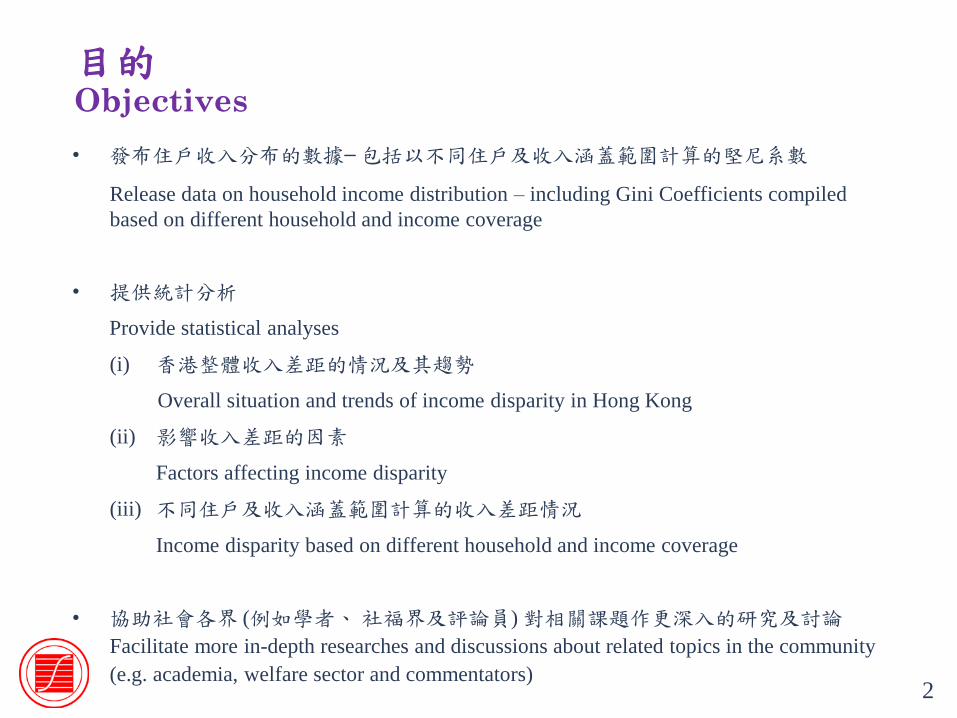
• 發布住戶收入分布的數據– 包括以不同住戶及收入涵蓋範圍計算的堅尼系數
Release data on household income distribution – including Gini Coefficients compiled
based on different household and income coverage
• 提供統計分析
Provide statistical analyses
(i) 香港整體收入差距的情況及其趨勢
Overall situation and trends of income disparity in Hong Kong
(ii) 影響收入差距的因素
Factors affecting income disparity
(iii) 不同住戶及收入涵蓋範圍計算的收入差距情況
Income disparity based on different household and income coverage
• 協助社會各界 (例如學者、 社福界及評論員) 對相關課題作更深入的研究及討論
Facilitate more in-depth researches and discussions about related topics in the community
(e.g. academia, welfare sector and commentators)
目的 Objectives
2

政府統計處 Census and Statistics Department
概述 Outline
1. 影響原本住戶收入分布 的多個因素 Various Factors Affecting the Original Household Income
Distribution • 低十等分組別的職業收入升幅較高十等分組別快=>差距收窄
Higher employment income growth in lower than upper decile groups
=> Disparity narrowed
• 政府在現金社會福利的開支增加=> 差距收窄 Increase in government spending on cash social benefits => Disparity narrowed
• 人口老化下非從事經濟活動的家庭住戶(住戶收入一般較低)增加 => 差距擴大 Increasing number of economically inactive households under population ageing (with
lower household income in general) => Disparity widened
• 一、二人住戶(住戶收入一般較低)增加 =>差距擴大 Increasing number of households with one or two persons (with lower household
income in general) =>Disparity widened
2. 稅務及實物形式的社會福利影響 Impact of Taxation and In-kind Social Benefits 3. 堅尼系數 –其中一個收入差距程度的量數 Gini Coefficients – One of Income Disparity Measures
3

政府統計處 Census and Statistics Department
1. 影響住戶原本收入差距的因素 Intervening Factors Affecting Disparity of Original
Household Income
(1) 職業收入分布變化
Changes in employment income distribution
(2) 政府在現金社會福利的開支增加
Increase in government spending on cash social benefits
(3) 人口老化下非從事經濟活動的家庭住戶增加
Increasing number of economically inactive households under population ageing
(4) 一、二人住戶數目上升
Increasing number of households with one or two persons
政府統計處 Census and Statistics Department
影響因素(1) - 職業收入
Intervening Factor (1) - Employment Income

政府統計處 Census and Statistics Department
職業收入(包括工資、薪金和相關的津貼)
Employment Income (covers wages,
salaries and related allowances)
其他現金收入(例如租金收入、股息及利息,以及非住戶成員定期
給予的款項)
Other cash income
(e.g. rental income,
dividends and interest,
and regular
contributions from
non-household
members)
6
職業收入為住戶收入主要來源 Employment Income being the Major Source of Household Income
2016年家庭住戶收入(不包括外籍家庭傭工)的85.8%是
從職業收入而來
85.8% of the domestic household income (excluding FDHs)
attributable to employment income in 2016
現金社會福利 (例如綜援及長者生活
津貼)
Cash Social Benefits
(e.g. CSSA and
OALA)

政府統計處 Census and Statistics Department
港元
HK$
每月主要職業收入中位數在過去五年大幅上升29.2% Median Monthly Income from Main Employment Increased Significantly by 29.2% in the Past Five Years
年 Year
變動 Change
每月主要職業 綜合消費 收入中位數 物價指數
Median monthly Composite
income from main employment Consumer Price Index
2006-2011 +20.0% +16%
2011-2016 +29.2% +18%
$10,000
$12,000
$15,500
0
5,000
10,000
15,000
20,000
2006 2011 2016
7 備註:不包括外籍家庭傭工
Note : Excluding foreign domestic helpers

政府統計處 Census and Statistics Department
十等分組別 Decile Group
每月主要職業收入中位數(港元) Median Monthly Income from Main Employment (HK$)
以當時市價計算 At Current Prices 變動率 % change
2006 2011 2016 2006 - 2011 2011 - 2016
第一(最低) 1st (lowest)
3,000 3,580 5,250 +19.3 +46.6
第二 2nd
5,500 6,940 9,000 +26.3 +29.6
第三 3rd
7,000 8,000 10,250 +14.3 +28.1
第四 4th
8,000 9,900 12,250 +23.8 +23.7
第五 5th
10,000 11,000 15,000 +10.0 +36.4
第六 6th
11,000 13,500 17,000 +22.7 +25.9
第七
7th 14,000 16,150 20,000 +15.4 +23.8
第八 8th
18,000 20,000 26,250 +11.1 +31.3
第九 9th
25,000 30,000 37,000 +20.0 +23.3
第十(最高) 10th (highest)
45,000 55,000 68,000 +22.2 +23.6
合計
Overall 10,000 12,000 15,500 +20.0 +29.2
各階層的職業收入均顯著改善 – 尤其低收入組別的升幅較高收入組別為高 =>收入差距收窄 Significant Growth in Employment Income in all Strata of Society – Particularly Higher Growth in Lower than Upper Decile Groups => Income Disparity Narrowed
備註:不包括外籍家庭傭工
Note : Excluding foreign domestic helpers 8

政府統計處 Census and Statistics Department
職業收入差距收窄與勞動市場情况變化有關 Narrowing of Employment Income Disparity was Associated with Changes in Labour Market Situation
法定最低工資於2011 年5月實施(其影響並未能在2011 年6月的職
業收入上完全反映)及其後於2013年5月和2015 年5 月上調
Statutory Minimum Wage – Implementation in May 2011 (effect not yet
fully reflected in employment income in June 2011) and subsequent
upratings in May 2013 and May 2015
勞動市場偏緊,較低技術工種勞工需求殷切
Tight labour market, with sturdy labour demand in lower-skilled jobs
9

政府統計處 Census and Statistics Department
影響因素(2) -政府在現金社會福利的開支
Intervening Factor (2) –Government Spending
on Cash Social Benefits

政府統計處 Census and Statistics Department
現金社會福利有助提高非從事經濟活動住戶的收入=>收入差距收窄 Cash Social Benefits Raise Income for Economically Inactive Households=> Income Disparity Narrowed
備註:不包括外籍家庭傭工 Note : Excluding foreign domestic helpers 11
變動 Change
年
Year
家庭住戶每月收入中位數
Median monthly domestic household income
綜合消費 物價指數 Composite
Consumer Price Index 所有家庭住戶
All domestic households
從事經濟活動的家庭住戶
Economically active households
非從事經濟活動的家庭住戶
Economically inactive households
2006-2011 +18.1% +22.5% +2.9% +16%
2011-2016 +23.2% +22.4% +38.7% +18%
非從事經濟活動的家庭住戶百分比
Proportion of Economically Inactive Households
十等分組別
Decile Group
2006
2011
2016
第一及第二
1st and 2nd 57.7% 64.4% 72.1%
所有家庭住戶
All Domestic Households 15.9% 17.9% 19.0%
↑6.7 ↑7.7

政府統計處 Census and Statistics Department
影響因素(3) –人口老化下非從事經濟活動的家庭住戶增加
Intervening Factor (3) –Increasing Number of
Economically Inactive Households under
Population Ageing

政府統計處 Census and Statistics Department
13
在過去五年間,長者比例由13.3%上升至15.9% Proportion of Elderly Increased from 13.3% to 15.9% in the Past Five Years
852 796 941 312 1 163 153
12.4%
13.3%
15.9%
0.0
2.0
4.0
6.0
8.0
10.0
12.0
14.0
16.0
18.0
200 000
400 000
600 000
800 000
1 000 000
1 200 000
1 400 000
2006 2011 2016
(%)
長者人口
Elderly population
長者人口
Elderly population
佔整體人口比例 (%)
Share to overall
population (%)
↑0.9
↑2.6

政府統計處 Census and Statistics Department
1 873 391
1 944 373 2 033 525
353 155424 423
476 209
0
500 000
1 000 000
1 500 000
2 000 000
2 500 000
3 000 000
(15.9%)
(84.1%)
(17.9%)
(82.1%)
(19.0%)
(81.0%)
2006 2011 2016
人口老化下,非從事經濟活動的家庭住戶增加 Increasing Number of Economically Inactive Households under
Population Ageing
從事經濟活動 的家庭住戶 Economically active
households
非從事經濟活動 的家庭住戶 Economically inactive
households
家庭住戶數目
No. of domestic households
14
164 883 207 062
264 347
0
50 000
100 000
150 000
200 000
250 000
300 000
2006 2011 2016
非從事經濟活動的長者住戶數目
No. of economically inactive elderly households
非從事經濟活動的家庭住戶 Number of economically inactive
households
+51 786
非從事經濟活動的長者住戶 Number of economically inactive
elderly households
+57 285
備註:非從事經濟活動的長者住戶是指撇除外籍家庭傭工,所有成員均在六十五歲或以上的住戶。
Note : Economically inactive elderly households refer to households with all household members, excluding foreign domestic helpers, aged 65 and over.

政府統計處 Census and Statistics Department
$17,100
$20,200
$24,890
$20,000
$24,500
$30,000
$4,200 $4,320
$5,990
0
5,000
10,000
15,000
20,000
25,000
30,000
35,000
2006 2011 2016
港元
HK$
非從事經濟活動的家庭住戶增加, 其住戶收入中位數遠低於從事經濟活動的家庭住戶=>收入差距擴大 Increase in Economically Inactive Households which had Much Lower Median Household Income than that of Economically Active Households => Income Disparity Widened
所有家庭住戶 All domestic
households
從事經濟活動 的家庭住戶 Economically active
households
備註:不包括外籍家庭傭工 Note : Excluding foreign domestic helpers 15
非從事經濟活動 的家庭住戶 Economically
inactive households
(2.9) (3.1) (1.8) (2.8) (3.0) (1.8) (2.7) (3.0) (1.6)
(平均住戶人數 Average household size)

政府統計處 Census and Statistics Department
影響因素(4) - 一、二人住户增加 Intervening Factor (4) – Increase in Households
with One or Two Persons

政府統計處 Census and Statistics Department
一、二人住户增加, 其收入一般較低 =>收入差距擴大 Increase in Households with One or Two Persons which
Generally Had Lower Income =>Income Disparity Widened
備註:不包括外籍家庭傭工 Note : Excluding foreign domestic helpers
住戶人數
Household Size
住戶數目
Number of Households
(%)
變動率 %
change
2016年住戶收入中位數
Median
Household
Income in
2016 ($) 2006 2011 2016
2006 -
2011
2011 -
2016
1 377 515
(17.0)
422 676
(17.9)
488 461
(19.5) +12.0 +15.6 9,500
2 547 416
(24.6)
615 762
(26.0)
686 023
(27.4) +12.5 +11.4 18,500
3 553 371
(24.9)
613 468
(25.9)
650 600
(25.9) +10.9 +6.1 30,000
4 508 002
(22.8)
506 134
(21.4)
498 920
(19.9) -0.4 -1.4 38,000
5 173 148
(7.8)
156 191
(6.6)
135 445
(5.4) -9.8 -13.3 40,000
6人及以上
6 and above
65 989
(3.0)
52 971
(2.2)
48 573
(1.9) -19.7 -8.3 42,500
合計
Overall
2 225 441
(100.0)
2 367 202
(100.0)
2 508 022
(100.0) +6.4 +5.9 24,890
住戶帄均人數
Average Household Size 2.9 2.8 2.7
17

政府統計處 Census and Statistics Department
香港整體收入情況 - 各十等分組別的住戶收入升幅相近 Overall Income Situation - Similar Growth in Household Income Across all Decile Groups
備註:不包括外籍家庭傭工 Note : Excluding foreign domestic helpers
家庭住戶每月收入中位數 Median Monthly Domestic Household Income
十等分組別 Decile
Group
以當時市價計算 (港元)
At Current Prices (HK$)
變動率 % change
2006 2011 2016 2006 - 2011 2011 - 2016
第一(最低) 1st (lowest)
2,250 2,070 2,560 -8.0 +23.7
第二 2nd
6,000 6,500 7,480 +8.3 +15.1
第三 3rd
9,000 10,000 12,000 +11.1 +20.0
第四 4th
12,000 14,000 16,400 +16.7 +17.1
第五 5th
15,200 18,200 21,290 +19.7 +17.0
第六 6th
19,430 23,000 28,000 +18.4 +21.7
第七
7th 24,000 29,400 35,500 +22.5 +20.7
第八 8th
30,600 37,540 45,750 +22.7 +21.9
第九 9th
42,000 51,430 62,500 +22.5 +21.5
第十(最高) 10th (highest)
76,250 95,000 112,450 +24.6 +18.4
合計
Overall 17,100 20,200 24,890 +18.1 +23.2
18

政府統計處 Census and Statistics Department
2. 稅務及實物形式的社會福利
Taxation and In-kind Social Benefits
政府統計處 Census and Statistics Department
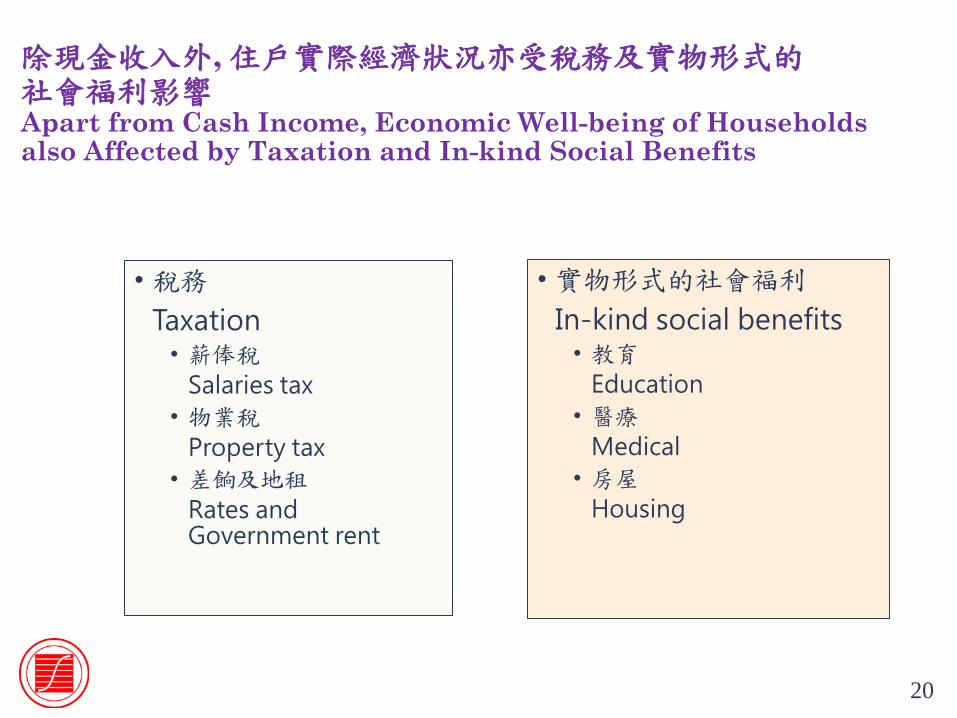
除現金收入外, 住戶實際經濟狀況亦受稅務及實物形式的 社會福利影響 Apart from Cash Income, Economic Well-being of Households also Affected by Taxation and In-kind Social Benefits
• 稅務
Taxation • 薪俸稅
Salaries tax
• 物業稅
Property tax
• 差餉及地租
Rates and Government rent
• 實物形式的社會福利
In-kind social benefits • 教育
Education
• 醫療
Medical
• 房屋
Housing
20
政府統計處 Census and Statistics Department
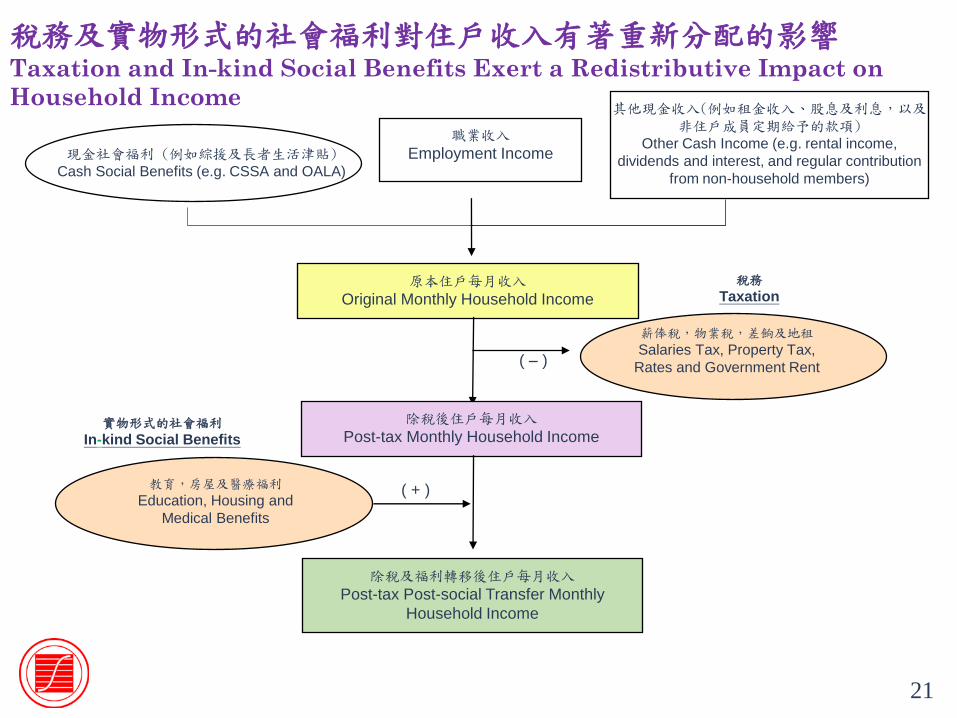
稅務及實物形式的社會福利對住戶收入有著重新分配的影響 Taxation and In-kind Social Benefits Exert a Redistributive Impact on
Household Income
原本住戶每月收入
Original Monthly Household Income
除稅及福利轉移後住戶每月收入
Post-tax Post-social Transfer Monthly
Household Income
教育,房屋及醫療福利
Education, Housing and
Medical Benefits
薪俸稅,物業稅,差餉及地租
Salaries Tax, Property Tax,
Rates and Government Rent
( + )
( – )
實物形式的社會福利
In-kind Social Benefits
稅務
Taxation
除稅後住戶每月收入
Post-tax Monthly Household Income
職業收入
Employment Income
其他現金收入(例如租金收入、股息及利息,以及非住戶成員定期給予的款項)
Other Cash Income (e.g. rental income,
dividends and interest, and regular contribution
from non-household members)
現金社會福利 (例如綜援及長者生活津貼)
Cash Social Benefits (e.g. CSSA and OALA)
21

政府統計處 Census and Statistics Department
2011 2016
第一個
及第二個
十等分組別
1st-2nd
deciles
第九個
及第十個
十等分組別
9th-10th deciles
第一個
及第二個十等分組
別
1st-2nd
deciles
第九個
及第十個
十等分組別
9th-10th deciles
帄均原本住戶每月收入
Average Original Monthly Household
Income
$4,340 $94,680 $5,390 $114,480
帄均除稅後住戶每月收入
Average Post-tax Monthly Household
Income
$4,120 $85,350 $4,910 $102,810
帄均除稅及福利轉移後住戶每月收入
Average Post-tax Post-social Transfer
Monthly Household Income
$7,560 $88,180 $9,420 $106,520
-5.0%
+83.7% +3.3%
-9.9% -8.9%
+91.7%
-10.2%
+3.6%
稅務及實物形式的社會福利有助收窄住戶收入差距 Taxation and In-kind Social Benefits Helped Narrow Household
Income Disparity
22

政府統計處 Census and Statistics Department
3.堅尼系數 Gini Coefficient
23

政府統計處 Census and Statistics Department
堅尼系數 Gini Coefficient
• 堅尼系數是被較多經濟體系用以分析收入差距的量數。 Gini Coefficient is a statistic commonly used by many economies to analyse income disparity.
• 堅尼系數的數值介乎0和1之間。堅尼系數的數值愈大反映差距程度愈大。 The value of Gini Coefficient ranges from 0 to 1. The higher the Gini Coefficient, the more the disparity it implies.
• 除職業收入分布變化外,住戶收入差距亦受人口老化、一、二人住戶數目上升,以及稅務及實物形式社會福利轉移影響,因此統計處編製不同的堅尼系數以了解導致轉變的因素。 Apart from changes in employment income distribution, household income disparity is also affected by population ageing, increasing number of households with one or two persons, taxation and transfer of in-kind social benefits. Thus, C&SD compiles a set of Gini Coefficients to better understand factors leading to the changes.
24

政府統計處 Census and Statistics Department
堅尼系數 – 原本住戶收入 Gini Coefficient – Original Household Income
2006 2011 2016
原本住戶每月收入
Original Monthly Household Income
0.533
0.537
0.539
+0.004 +0.002
25
影響收入差距 /
堅尼系數的因素
Factors affecting income disparity / GCs
原本住戶收入
Original Household
Income
較低十等分組別職業收入升幅較大
Higher increase in employment income for lower decile
groups
政府在現金社會福利的開支增加
Increase in government spending on cash social benefits
人口老化下非從事經濟活動的家庭住戶增加
Increasing number of economically inactive households
under population ageing
一、二人住戶增加
Increasing Number of households with 1 or 2 persons

政府統計處 Census and Statistics Department
2006 2011 2016
原本住戶每月收入
Original Monthly Household Income
0.533
0.537
0.539
從事經濟活動住戶原本住戶每月收入
Original Monthly Household Income of
Economically Active Households
0.490 0.489 0.482
人口帄均原本住戶每月收入
Per-capita Original Monthly Household income
0.502
0.507
0.499
人口帄均從事經濟活動住戶原本住戶每月收入
Per-capita Original Monthly Household Income
of Economically Active Households
0.484 0.485 0.474
堅尼系數 – 原本住戶收入 Gini Coefficient – Original Household Income
+0.005
+0.004
-0.008
+0.002
-0.001 -0.007 扣除非從事經濟活動的家庭住戶在人口老化下日益增加的影響
To discount the effect of increase in economically inactive households under population ageing
扣除住戶人數變化的影響
To discount the effect of change in household size
26
同時扣除非從事經濟活動的家庭住戶在人口老化下日益增加的影響及住戶人數變化的影響
To discount the combined effects of increase in economically inactive households under population ageing and change in household size
-0.011 +0.001

政府統計處 Census and Statistics Department
堅尼系數 – 稅務及實物形式社會福利轉移後 Gini Coefficient – After Taxation and Transfer of In-kind Social Benefits
2006 2011 2016
除稅後住戶每月收入 Post-tax Monthly Household Income 反映稅務政策的影響 To reflect the effect of taxation
0.521
0.521
0.524
除稅及福利轉移後住戶每月收入 Post-tax Post-social Transfer Monthly Household Income反映稅務及以實物形式提供的社會福利轉移的影響 To reflect the effects of taxation and transfer of in-kind social benefits
0.475
0.475
0.473
人口帄均除稅及福利轉移後住戶每月收入 Per Capita Post-tax Post-Social Transfer Monthly
Household Income 反映稅務及以實物形式提供的社會福利轉移並扣除住戶人數變化的影響 To reflect the effects of taxation and transfer of in-kind social benefits while netting out the effect of change in household size
0.427 0.431 0.420
人口帄均除稅及福利轉移後從事經濟活動住戶每月收入 Per Capita Post-tax Post-Social Transfer Monthly
Household Income of Economically Active Households 反映稅務及以實物形式提供的社會福利轉移並同時扣除非從事經濟活動的家庭住戶在人口老化下日益增加的影響及住戶人數變化的影響 To reflect the effects of taxation and transfer of in-kind social benefits while netting out the combined effects of increase in economically inactive households under population ageing and change in household size
0.412 0.413 0.401
--
--
+0.003
-0.002
+0.004 -0.011
27
+0.001 -0.012

政府統計處 Census and Statistics Department
稅務及實物形式社會福利轉移對堅尼系數的影響 Impact of Taxation and Transfer of In-kind Social Benefits on
Gini Coefficient
2006 2011 2016
原本住戶每月收入
Original Monthly Household Income
0.533 0.537 0.539
除稅後住戶每月收入
Post-tax Monthly Household Income
(相對按原本住戶收入計算的堅尼系數的減幅)
(Reduction compared with Gini Coefficient
based on original household income)
0.521
(-0.012)
0.521
(-0.016)
0.524
(-0.015)
除稅及福利轉移後住戶每月收入
Post-tax Post-social Transfer Monthly
Household Income (相對按原本住戶收入計算的堅尼系數的減幅)
(Reduction compared with Gini Coefficient
based on original household income)
0.475
(-0.058)
0.475
(-0.062)
0.473
(-0.066)
28

政府統計處 Census and Statistics Department
多謝 Thank you
29
補充資料
Supplementary Information
二零一七年六月九日
9 June 2017
政府統計處 Census and Statistics Department

政府統計處 Census and Statistics Department
影響收入差距 /
堅尼系數的因素
Factors affecting income disparity /
Gini Coefficient
原本住戶收入
Original Household Income
除稅及福利
轉移後的住戶收入
Post-tax Post-social Transfer
Household Income
較低十等分組別職業收入升幅較大
Higher increase in employment income for lower
decile groups
政府在現金社會福利的開支增加
Increase in government spending on cash social
benefits
人口老化下非從事經濟活動的家庭住戶增加
Increasing number of economically inactive
households under population ageing
一、二人住戶增加
Increasing number of households with 1-2 persons
政府在教育、房屋及醫療方面的實物形式福利開支
增加
Increase in government spending on in-kind social
benefits (education, housing and medical)
堅尼系數受不同因素影響 Gini Coefficients Affected by Different Factors
政府統計處 Census and Statistics Department
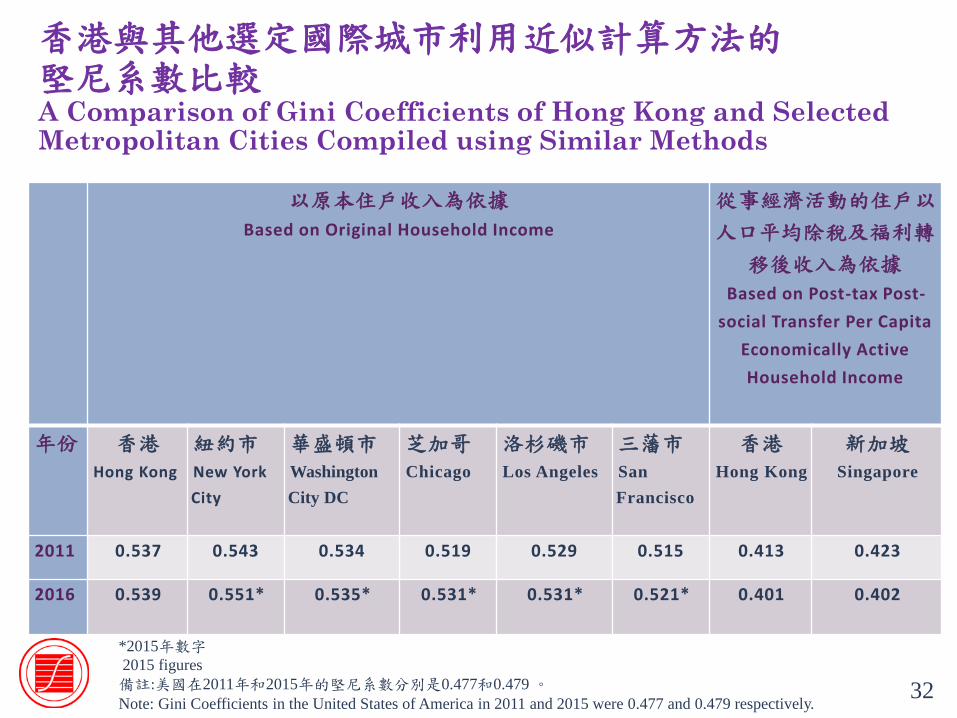
香港與其他選定國際城市利用近似計算方法的 堅尼系數比較 A Comparison of Gini Coefficients of Hong Kong and Selected Metropolitan Cities Compiled using Similar Methods
32
,
以原本住戶收入為依據
Based on Original Household Income
從事經濟活動的住戶以
人口帄均除稅及福利轉
移後收入為依據
Based on Post-tax Post-
social Transfer Per Capita
Economically Active
Household Income
年份 香港
Hong Kong
紐約市
New York
City
華盛頓市
Washington
City DC
芝加哥
Chicago
洛杉磯市
Los Angeles
三藩市
San
Francisco
香港
Hong Kong
新加坡
Singapore
2011 0.537 0.543 0.534 0.519 0.529 0.515 0.413 0.423
2016 0.539
0.551*
0.535*
0.531* 0.531* 0.521* 0.401 0.402
*2015年數字 2015 figures 備註:美國在2011年和2015年的堅尼系數分別是0.477和0.479 。 Note: Gini Coefficients in the United States of America in 2011 and 2015 were 0.477 and 0.479 respectively.