2016 Part C and Part D Program Audit and Enforcement Report · 2016 Part C and Part D Program Audit...
43
2016 Part C and Part D Program Audit and Enforcement Report Medicare Parts C and D Oversight and Enforcement Group Date: May 9, 2017 This report is also published online at: http://www.cms.gov/Medicare/Compliance-and-Audits/Part-C-and-Part-D-Compliance-and- Audits/Program-Audits.html
Transcript of 2016 Part C and Part D Program Audit and Enforcement Report · 2016 Part C and Part D Program Audit...

2016 Part C and Part D Program Audit and Enforcement Report
Medicare Parts C and D Oversight and Enforcement Group Date: May 9, 2017
This report is also published online at: http://www.cms.gov/Medicare/Compliance-and-Audits/Part-C-and-Part-D-Compliance-and-Audits/Program-Audits.html

1 | P a g e
Table of Contents EXECUTIVE SUMMARY ......................................................................................................... 2
INTRODUCTION ....................................................................................................................... 4
AUDIT SCOPE AND SPONSOR SELECTION ........................................................................ 5
CURRENT PROGRAM AUDIT LANDSCAPE ........................................................................ 6
AUDIT LIFECYCLE................................................................................................................. 10
2016 AUDIT INNOVATIONS AND PROCESS IMPROVEMENTS ..................................... 12
AUDIT RESULTS AND TRENDING ...................................................................................... 13
2016 MOST COMMON CONDITIONS................................................................................... 30
ENFORCEMENT ACTIONS .................................................................................................... 34
CIVIL MONEY PENALTIES (CMPs) ..................................................................................... 35
INTERMEDIATE SANCTIONS .............................................................................................. 37
PROGRAM AUDIT INTERMEDIATE SANCTIONS ............................................................ 41
2017 AUDIT PROCESS IMPROVEMENTS ........................................................................... 42
CONCLUSION .......................................................................................................................... 42

2 | P a g e
EXECUTIVE SUMMARY The Medicare Parts C and D Oversight and Enforcement Group (MOEG) within the Centers for Medicare & Medicaid Services (CMS) is responsible for conducting program audits of Medicare Advantage (MA) and Prescription Drug Plan (PDP) organizations. Rigorous auditing of these organizations (referred to as sponsors) provides measurable benefits by:
• Ensuring enrollees have adequate access to health care services and medications, • Verifying sponsors’ adherence to selected aspects of their contract with CMS, • Providing a forum to share audit results and trends, and • Soliciting feedback from the sponsor community and external stakeholders on potential
audit improvements. Each year, the Program Audit and Enforcement Report emphasizes pertinent analyses and information sponsors and other stakeholders can adopt to continue to improve performance within their respective organizations. Furthermore, the report serves to convey the initiatives undertaken to advance the transparency, accuracy, and reliability of the entire audit cycle. Highlights of this year’s report include: Audit Scope, Sponsor Selection and Audit Strategy
This section of the report includes the rationale for selection of sponsors for audit and audit progress by percentage of plans audited and beneficiary enrollment. In 2016, CMS audited sponsors that cover approximately 32% of beneficiaries enrolled in the MA and Prescription Drug programs.
Audit Innovations and Process Improvements
CMS continually engages in efforts to improve audits through solicitation of sponsor feedback on audit protocols and processes. This year’s report focuses on the following:
• Releasing the 2017 audit protocols for two public comment periods, • More clearly defining what constitutes an observation, a corrective action required
(CAR) and an immediate corrective action required (ICAR) to set sponsor expectations and promote greater transparency in classifying instances of non-compliance, and
• Making changes to the audit process to reduce burden placed on sponsors undergoing an audit, including:
o Making the audit review periods for Part D Coverage Determinations, Appeals, and Grievances (CDAG) and Part C Organization Determinations, Appeals, and Grievances (ODAG) dependent on the size of a sponsor’s enrollment, and
o Streamlining the Compliance Program Effectiveness (CPE) audit protocol to make it more sponsor-friendly.

3 | P a g e
Summary of 2016 Audit Results and Analyses
CMS presents the results of its analyses of data emerging from the 2016 audits. A few key points of interest include:
• Analysis of change in overall audit scores and specific audit scores by program area. Scores fell markedly both overall and in each individual program area audited in 2016.
• The average number of conditions cited per sponsor has fallen from 38 in 2012 to just under 18 in 2016.
• New analyses initiated to study potential correlations between audit performance and specific operational factors, e.g., the number of formularies sponsors operate and the number of Part C first tier, downstream, and related entities (FDRs) they utilize. The results demonstrated there was a positive correlation between the number of formularies sponsors operate and their Part D Formulary and Benefit Administration (FA) and CDAG scores.
• An analysis of conditions cited as most common ICARs based on 2015 and 2016 audits.
Audit Enforcement Actions
CMS also summarizes the types of enforcement actions taken, such as Civil Money Penalties (CMPs) and intermediate sanctions, presents year-to-year analyses of differing types of enforcement actions by program area, shows correlations between audit conditions and enforcement violations, and identifies the average number of CMP violations by program area.
As part of our commitment to industry-wide improvement, we continue to refine and improve our audit processes and audit tools. We recognize the importance of collaboration with and clear communication to sponsors and external stakeholders to assist the industry with its own process improvement initiatives. Our fundamental mission is to ensure enrollees have adequate access to health care services and medications. Through improving the operational activities encompassed in MA and PDP program audits, we remain committed to the attainment of that goal.

4 | P a g e
INTRODUCTION The Medicare Advantage (MA or Part C) and Prescription Drug Plans (Part D) provide health care and prescription drug benefits for eligible individuals aged 65 years and older and eligible individuals with disabilities. CMS contracts with private companies, referred to as “sponsors,” to provide these benefits to beneficiaries. MOEG resides within the Center for Medicare (CM) and performs program audits to evaluate sponsors’ delivery of health care services and medications to Medicare beneficiaries enrolled in the Part C and Part D programs. In addition to program audits, we also develop, maintain, and oversee the requirements for sponsors to have an effective compliance program implemented within their organization, including compliance with key fraud and abuse program initiatives. CMS’ enforcement authorities allow the imposition of CMPs, intermediate sanctions (suspension of payment, enrollment and/or marketing activities), and for-cause contract terminations. In addition, validations ensure that sponsors correct all deficiencies (1) identified during program audits, or (2) that were the basis for intermediate sanctions. Lastly, we serve as CM’s liaison to the Center for Program Integrity (CPI) in matters concerning fraud, waste, and abuse in the Part C and Part D programs. This report summarizes activities for the 2016 audit year, as well as describes the scope of audits and the audit selection process. It also discusses the current audit landscape, implemented audit process improvements, results of analyses of data from 2016 audits, the most common conditions found during audits, and a summary of enforcement activities. In several areas of the report, there are text boxes entitled “Sponsor Tips.” These tips provide information on how a sponsor can utilize the information in that section of the report to inform its own compliance and audit activities.
5 | P a g e
AUDIT SCOPE AND SPONSOR SELECTION In order to conduct a comprehensive audit of a sponsor’s operation and maximize Agency resources, program audits occur at the parent organization level. Therefore, nearly all MA, MA-PD, and PDP contracts owned and operated by the sponsors we audited in 2016 were included in the scope of the 2016 audits. The audits evaluate sponsor compliance in the following program areas:
• Compliance Program Effectiveness (CPE) • Part D Formulary and Benefit Administration (FA) • Part D Coverage Determinations, Appeals, and Grievances (CDAG) • Part C Organization Determinations, Appeals, and Grievances (ODAG) • Special Needs Plans Model of Care (SNP-MOC)
Each sponsor is audited in all program areas, unless a protocol is not applicable to its operation. For example, if a sponsor does not operate a SNP plan, then a SNP-MOC audit is not performed. Likewise, a standalone PDP will not have the ODAG protocol applied, since it does not offer the MA benefit. A new Part D Medication Therapy Management (MTM) audit protocol was piloted in 2016, but this program area is excluded from the 2016 Annual Report since it is still in the pilot phase. Sponsor selection for audit relies on a number of sources, including the yearly risk assessment. This risk assessment is data-driven and utilizes various data related to the Medicare Parts C and D programs, as well as other operational information (e.g., large enrollment growth in a short period of time) to identify the level of risk of each sponsor that operates in those programs. Other factors that come into play in the selection process include audit referrals (from Regional Offices and/or Central Office) and whether a given sponsor underwent audit in the current audit cycle. Consequently, some of the sponsors selected for audit in a given year may not be the highest-risk, as calculated by the risk assessment.
6 | P a g e
CURRENT PROGRAM AUDIT LANDSCAPE The figures below show the progress of program audits on Parts C and D by enrollment and percentage of sponsors audited. These figures are based on enrollment and parent organization data as of January 2017 and include all coordinated care plans (CCPs), private fee-for-service (PFFS) plans, 1876 cost plans, stand-alone prescription drug plans (PDPs), and employer group waiver plans (800 series). Figure 1*
* These enrollment data are summed by parent organization at the contract level. All contracts active in 2017 that are associated with sponsors that were audited in 2016 are reflected in this chart.
The sponsors audited in 2016 account for 32% (i.e., roughly 14 million beneficiaries) of the total MA, other Medicare managed care health plans, and PDPs’ enrollment (Figure 1). Approximately 78% of all Part C and Part D enrollees were covered in part by auditing sponsors with a large number of enrollees during the first two years of this audit cycle. This number will increase to 94% once 2017 program audits are complete. While the sponsors audited in 2015 and 2016 represent 78% of all enrollment, they only represent 26% of the sponsors with currently active Medicare contracts. By the end of 2017, this number increases to roughly 46% (Figure 2). Note that 2015 included 22 audited sponsors, but some of these sponsors have been acquired by other organizations or have terminated their Medicare contracts, which is why Figure 2 shows only 17 sponsors audited.
20,287,226(46%)
14,067,292(32%)
7,326,114(16%)
2,727,652(6%)
Number of Enrollees Covered by Cycle 2 Audits
2015 Audits 2016 Audits 2017 Audits Unaudited

7 | P a g e
Figure 2
Figure 3 on the following page shows the percentage of Medicare beneficiaries in each state that were covered by the program audits conducted in 2016. The largest percentage of enrollees audited in any one state was approximately 47% (note that these enrollment data are at the plan level, whereas all other figures (e.g., Figure 1) reporting on enrollment in this document are at the contract level). Figure 4 on page 9 depicts the percentage of plans in each state included in 2016 program audits. No state had fewer than 18% of its plans audited, and in one state 28% of the plans were audited.
17(8%)
37(18%)
40(20%)
111(54%)
Number of Sponsors Covered by Cycle 2 Audits
2015 Audits 2016 Audits 2017 Audits Unaudited

8 | P a g e
Figure 3
Percentage of Medicare Enrollees in Each State Included in 2016 Program Audits

9 | P a g e
Figure 4
Percentage of Medicare Plans in Each State Included in 2016 Program Audits

10 | P a g e
AUDIT LIFECYCLE The lifecycle of an audit begins the day the sponsor receives an engagement letter and concludes with the sponsor’s receipt of an audit closeout letter. The average amount of time to issue draft and final audit reports for all 2015 and 2016 audits is below in Table 1. Additionally, we added the amount of time it takes to issue the preliminary draft audit report, a new process for 2016. Table 1
Audit Phase 2015 2016 Change Average Time between Engagement Letter and Preliminary Draft Audit Report (in days)
NA 52 NA
Average Time between Engagement Letter and Draft Audit Report (in days) 129 153 24 Average Time between Engagement Letter and Final Audit Report (in days) 179 181 2 Average Time between Engagement Letter and Audit Closeout (in days) 443 TBD TBD
Based on Table 1 above, the average time between engagement letter and draft and final reports increased slightly from 2015 to 2016. Improvements made to the processes should result in a decrease in time to receive these reports in 2017. The duration of the validation process and audit closeout is now largely dependent on the sponsor due to the use of independent auditors to perform audit validations. An analysis of audit scores and the time to close out the audit process generally shows the higher a sponsor’s audit score (worse performance), the longer the length of the overall audit process, as measured from engagement letter receipt date to the date of the audit closeout letter. Figure 5 shows this relationship. As audit score increases (going from left to right across the chart), so, too, does audit duration. Note these data represent 2015 audits because most 2016 audits have not yet closed, giving us insufficient data on which to report. Figure 5
Figure 6 on the following page provides an overview of what each stage of the audit process entails, as well as the estimated timeframe for completion of each stage.
0
100
200
300
400
500
600
700
0.00 0.50 1.00 1.50 2.00 2.50 3.00 3.50 4.00
Num
ber
of D
ays E
laps
ed b
etw
een
Eng
agem
ent L
ette
r an
d A
udit
Clo
seou
t
Overall Audit Score
Audit Score vs. Audit Duration 2015

11 | P a g e
Figure 6
Audit Engagement andUniverse Submission
Week 0 - 6
•Engagement Letter - CMS notification to sponsor of audit selection, identification of audit scope and logistics, and sponsor instructions for pre-audit issue summary submission
•Universe Submission - Sponsor submission of requested universes to CMS•Universe Validation - CMS integrity testing of sponsor's universe submissions
Audit FieldworkWeek 7 - 8
•Entrance Conference - Discussion of CMS audit objectives and expectations; sponsor voluntary presentation on organization
•Webinar Reviews (week 7) - CMS testing of sample cases live in sponsor systems via webinar•Onsite Review of Compliance Program (week 8) - Compliance program review interviews; sponsor submission of supplemental documentation (including screenshots and impact analyses); CMS documentation analysis
•Issuance of Preliminary Draft Audit Report - CMS issues a preliminary draft audit report to the sponsor stating the conditions, observations, and best practices noted during the audit
•Exit Conference - Review and discussion of preliminary draft report with CMS and sponsor
Audit ReportingWeek 9 - 21
• ICAR Email - CMS notification to sponsor of any findings requiring immediate corrective action; sponsor ICAR Corrective Action Plan (CAP) submission within 3 business days
•Draft Report Issuance - Inclusive of condition classification and audit score to sponsor approximately 60 calendar days after exit conference
•Sponsor Response to Draft Report - Sponsor submission of comments to draft report within ten business days of draft report receipt
•Final Report Issuance - With CMS response to sponsor comments and updated audit score (if applicable). Target issuance within 10 business days after receipt of sponsor comments to draft report
Audit Validation and Close Out
Week 22 - 48
•Sponsor CAP Submission - Sponsor submission of CAP within 30 calendar days of final report issuance
•CMS Review and Acceptance of CAP - CMS performance of CAP reasonableness review and notification to sponsor of acceptance or need for revision
•Sponsor Demonstration of Condtion Correction - Sponsor demonstration of condition correction within 150 calendar days of CAP acceptance, either by CMS or Independent Auditor hired by the sponsor
•Sponsor Attestation Submission - Sponsor CEO attestation submission to CMS that all conditions corrected and not likely to recur
•CMS Audit Close Out - CMS evaluation of attestation and audit validation report to determine if conditions are corrected; if so, CMS issuance of close out letter to sponsor

12 | P a g e
2016 AUDIT INNOVATIONS AND PROCESS IMPROVEMENTS Gathering feedback from sponsors and external stakeholders is key to informing improvements in documentation, processes, and procedures and allows for better education and support. This resulted in the following changes and improvements: • Publicly released the definitions of ICARs, CARs, and observations via a Health Plan
Management System (HPMS) memo in November 2015 to clarify classification of non-compliance instances during the 2016 audit year. The decreases seen in audit scores from 2015 to 2016 are partly attributable to the changes in the different finding types communicated in this memo. In particular, ICARs must now involve access to care, which exempts certain types of non-compliance from being ICAR-eligible
• Began to issue preliminary draft audit reports to sponsors at the onsite exit conference • Began to base the audit review period for CDAG and ODAG on a sponsor’s enrollment to
reduce the burden associated with submitting universes • Updated the CPE protocol. In particular, eliminated employee interviews, added tracer
reviews, and moved all tracer reviews to Week 2. These changes promote more outcome-based results and reduce burden on sponsors
• Began to utilize fully-integrated audio/video webinar technology (WebEx) during audits
SPONSOR TIP: Is your organization undergoing a program audit? Do you think you will undergo an audit in the near future? The audit protocols are valuable resources for audit preparation and detail the process for audits. Sponsors are encouraged to perform practice audits, including practicing universe pulls. Practice audits will not only help you prepare for an actual CMS audit, but may help you improve your operations by exposing areas that are problematic or otherwise non-compliant with CMS regulations. Because audit findings may impact Medicare Advantage and Part D Star Ratings, routine self-audits are encouraged to i mprove operations.

13 | P a g e
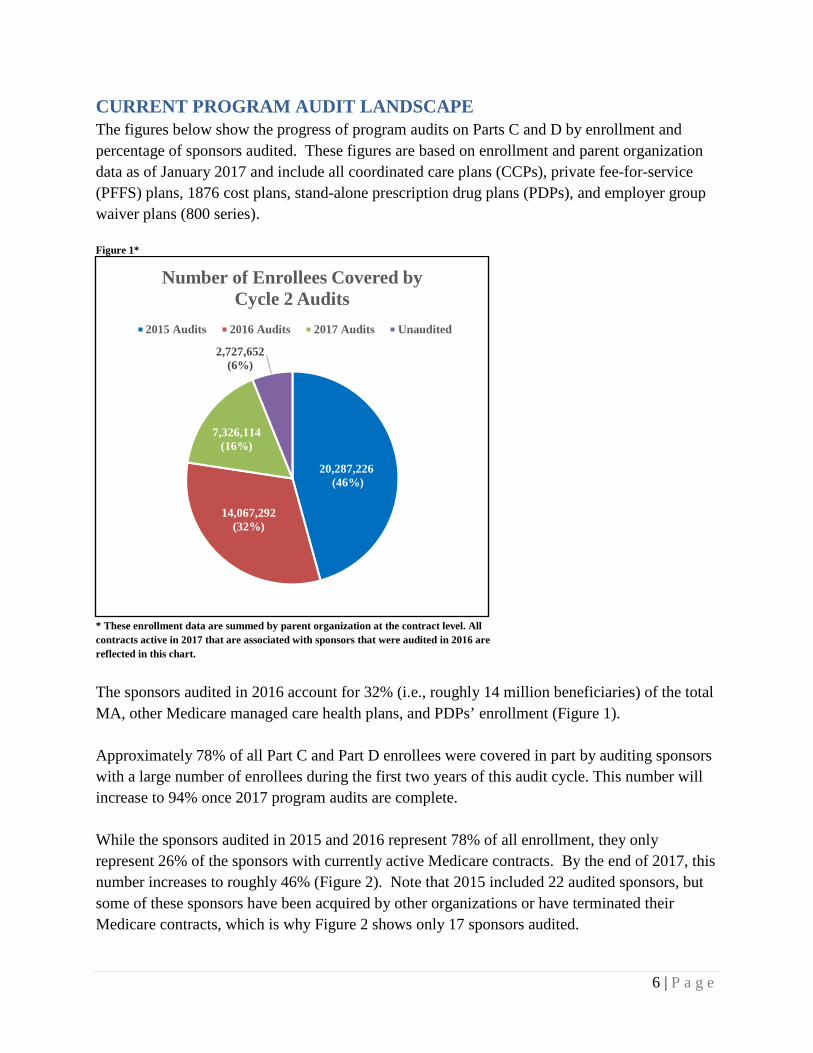
AUDIT RESULTS AND TRENDING The scoring system for audits generates a score for each sponsor based on the number and severity of non-compliant conditions detected during the audit. In this scoring system, a lower score represents better performance on the audit. Because the calculated audit score uses the number of non-compliant conditions discovered, the maximum audit score is unlimited. In addition, we weight conditions to ensure that those conditions that have a greater impact on beneficiary access to care have a greater impact on the overall score. The audit score assigns 0 points to observations, 1 point to each corrective action required (CAR), 1 point to each invalid data submission (IDS), and 2 points to each immediate corrective action required (ICAR). We then divide the sum of these points by the number of audit elements tested. The following is the formula for calculating the audit score: Audit score = ((# CARs + # IDS) + (# of ICARs x 2)) / # of audited elements Calculations produce an overall audit score, as well as a score for each program area. As previously mentioned, not all sponsors audited in 2016 had every program area audited. This scoring system quantifies a sponsor’s performance and allows comparisons of scores across the industry. The next several figures compare scores between 2015 and 2016 and display overall and program-area specific audit scores for sponsors audited in 2016. Comparison of 2015 and 2016 Audit Results Figure 7 depicts the average audit score in each program area audited in 2015 compared to the 2016 scores. The overall scores in 2016 are markedly better than in 2015, as are the scores in each individual program area. The program area with the largest average score improvement from 2015 to 2016 was CDAG, where the average score was more than halved (1.51 in 2016 vs. 3.03 in 2015). The average overall audit score fell by 31% from 2015 to 2016 (1.22 in 2016 vs. 1.76 in 2015). Over the course of two audit cycles, sponsors’ performance continues to improve. The average number of conditions cited per audit in 2012 was 38 and is now at an average of just under 18 per audit in 2016. Part of this decrease in the number of conditions is based on limiting ICARs to situations involving access to care.

14 | P a g e
Figure 7*
* Audit scores are analyzed at the sponsor (parent organization) level. The average audit score is an unweighted score across all audited sponsors within each group. A lower audit score represents better audit performance.
ICARs by Program Area 2015 vs. 2016 Figure 8 displays the average number of ICARs cited per audit by program area in both 2015 and 2016. All ICARs were cited in FA, CDAG, and ODAG. There was a marked decrease in the number of ICARs issued per audit in CDAG and ODAG between the two years, whereas in FA the average number of ICARs issued per audit in both years remained the same.
1.76 0.54 1.61 3.03 2.98 2.611.22 0.36 0.91 1.51 2.21 1.910.00
0.50
1.00
1.50
2.00
2.50
3.00
3.50
Overall CPE FA CDAG ODAG SNP-MOC
Aud
it Sc
ore
Audit Score Comparison 2015 vs. 20162015 2016
SPONSOR TIP: If you utilize delegated entities to perform any of the functions currently included in a program audit, ensure you are able to collect and consolidate the relevant universe data accurately. When performing internal audits, sponsors should practice the submission of the universe data from delegated entities and ensure their accuracy to prepare for a future audit and to ensure compliance with CMS requirements. It is important that both your organization and any delegated entities are prepared for all aspects of a CMS audit.

15 | P a g e
Figure 8
2016 Program Audit Scores Figures 9-14 array the overall and individual program area audit scores. The audit scores are displayed from best to worst score (i.e., lowest score to highest score) moving from left to right across the graph. The red line in each graph represents the average audit score across all audited sponsors. The orange line represents the average audit score across all High-Star sponsors audited, both overall and for each individual program area. High-Star sponsors are those sponsors that had a weighted (by enrollment) Star Rating average of 4.5 or better across all of their contracts.
0.86 2.05 2.950.86 0.97 1.570.00
0.50
1.00
1.50
2.00
2.50
3.00
3.50
FA CDAG ODAG
Num
ber
of IC
AR
sAverage Number of ICARs per Audit
2015 vs. 20162015 2016

16 | P a g e
Figure 9*
*A lower audit score represents better audit performance. The average audit score is an unweighted score across all sponsors audited in 2016.
0.23 0.31 0.47 0.65 0.65 0.71 0.76 0.76 0.85 0.88 0.90 1.05 1.05 1.06 1.10 1.11 1.15 1.20 1.20 1.24 1.29 1.30 1.35 1.35 1.35 1.45 1.50 1.55 1.55 1.59 1.60 1.65 1.70 1.80 2.00 2.10 2.700.00
0.50
1.00
1.50
2.00
2.50
3.00
Aud
it Sc
ore
2016 Overall Audit ScoresAverage Score = 1.22 High Star Average = 1.05

17 | P a g e
Figure 10*
*A lower audit score represents better audit performance. The average audit score is an unweighted score across all sponsors audited for the CPE program area in 2016.
0.00 0.00 0.00 0.00 0.00 0.14 0.14 0.14 0.14 0.14 0.14 0.14 0.14 0.29 0.29 0.29 0.29 0.29 0.43 0.43 0.43 0.43 0.43 0.57 0.57 0.57 0.71 0.71 1.00 1.00 1.290.00
0.20
0.40
0.60
0.80
1.00
1.20
1.40
Aud
it Sc
ore
2016 CPE Audit ScoresAverage Score = 0.36 High Star Average = 0.29

18 | P a g e
Figure 11*
*A lower audit score represents better audit performance. The average audit score is an unweighted score across all sponsors audited for the FA program area in 2016.
0.00 0.00 0.00 0.00 0.33 0.33 0.33 0.33 0.33 0.33 0.33 0.33 0.33 0.33 0.33 0.67 0.67 0.67 0.67 0.67 0.67 1.00 1.00 1.00 1.00 1.33 1.33 1.33 1.67 1.67 1.67 1.67 1.67 2.00 2.00 2.67 3.000.00
0.50
1.00
1.50
2.00
2.50
3.00
3.50
Aud
it Sc
ore
2016 FA Audit ScoresAverage Score = 0.91 High Star Average = 0.75
19 | P a g e
Figure 12*
*A lower audit score represents better audit performance. The average audit score is an unweighted score across all sponsors audited for the CDAG program area in 2016.
0.00 0.00 0.33 0.33 0.33 0.33 0.67 0.67 0.67 0.67 0.67 1.00 1.00 1.00 1.00 1.00 1.00 1.00 1.33 1.33 1.33 1.33 1.67 2.00 2.00 2.00 2.00 2.33 2.33 2.67 2.67 2.67 3.00 3.00 3.33 3.33 4.000.00
0.50
1.00
1.50
2.00
2.50
3.00
3.50
4.00
4.50
Aud
it Sc
ore
2016 CDAG Audit ScoresAverage Score = 1.51 High Star Average = 1.34

20 | P a g e
Figure 13*
*A lower audit score represents better audit performance. The average audit score is an unweighted score across all sponsors audited for the ODAG program area in 2016.
0.25 0.50 0.75 0.75 0.75 1.00 1.00 1.00 1.25 1.25 1.25 1.50 1.50 1.50 1.50 1.75 1.75 1.75 2.00 2.00 2.00 2.00 2.25 3.50 3.50 3.50 3.75 3.75 3.75 4.00 4.00 4.00 4.00 4.25 4.250.00
0.50
1.00
1.50
2.00
2.50
3.00
3.50
4.00
4.50
Aud
it Sc
ore
2016 ODAG Audit ScoresAverage Score = 2.21 High Star Average = 1.96

21 | P a g e
Figure 14*
*A lower audit score represents better audit performance. The average audit score is an unweighted score across all sponsors audited for the SNP-MOC program area in 2016. Note that only two High-Star sponsors were audited for SNP-MOC in 2016.
0.00 0.33 0.67 0.67 0.67 1.00 1.33 1.67 2.00 2.33 2.33 2.33 2.67 2.67 3.00 3.33 3.33 4.000.00
0.50
1.00
1.50
2.00
2.50
3.00
3.50
4.00
4.50
Aud
it Sc
ore
2016 SNP-MOC Audit ScoresAverage Score = 1.91 High Star Average = 2.50

22 | P a g e
2016 Overall Audit Scores Compared to 2017 Star Rating Data Figure 15 compares the 2016 average audit score and an organization’s 2017 Star Rating. Sponsors may receive a Star Rating between 1 and 5, with 5 being the best rating. Sponsors fall into one of five Star Rating ranges, and then the average overall audit score for sponsors in that group is calculated. This figure demonstrates that sponsors with the highest Star Ratings (i.e., greater than 4.5), among those audited in 2016, performed better than those with average or low Star Ratings. However, the lack of a stronger inverse relationship suggests that program audits reveal unique information about sponsor performance and compliance that other data do not show. While Star Ratings remain a valuable measure of quality and beneficiary experience, they evaluate other aspects of sponsors’ operations and delivery of the benefit. Therefore, both Star Ratings and audit scores are valuable indicators of performance. Figure 15*
*Audit and Star Rating scores are analyzed at the sponsor (parent organization) level. A lower audit score represents better audit performance. One sponsor audited in 2016 had no contracts with associated Star Ratings and therefore is excluded from this chart.
1.45 1.22 1.32 1.19 1.050.00
0.20
0.40
0.60
0.80
1.00
1.20
1.40
1.60
Below 3 Starsn=1
From 3 to 3.5 Starsn=5
From 3.5 to 4 Starsn= 10
From 4 to 4.5 Starsn= 12
4.5 Stars and Aboven= 8
Aud
it Sc
ore
2016 Overall Audit Scores by 2017 STAR Ratings

23 | P a g e
2016 Audit Scores by Number of Part C FDRs Figure 16 displays average ODAG audit scores broken into five groups depending on the number of Part C FDRs the audited sponsors utilize. The FDRs included in the following analyses are only those that administer, process, or adjudicate claims on behalf of sponsors. We cannot discern any relationship between the number of Part C FDRs the sponsors we audited in 2016 utilized and their ODAG audit scores. Figure 16*
* Audit scores are analyzed at the sponsor (parent organization) level. The average audit score is an unweighted score across all audited sponsors within each group. A lower audit score represents better audit performance. Two of the sponsors audited in 2016 were PDPs and therefore had no Part C FDRs.
2.52 2.05 1.65 1.88 2.250.00
0.50
1.00
1.50
2.00
2.50
3.00
1-2 FDRsn=16
3-4 FDRsn=5
5-6 FDRsn=5
7-8 FDRsn=4
9 or More FDRsn=5
Aud
it Sc
ore
2016 ODAG Audit Scores by Number of Part C FDRs

24 | P a g e
Number of Part C FDRs Utilized by Sponsors Audited in 2016 Figure 17 shows a detailed distribution of the numbers of FDRs used by the sponsors audited in 2016. The average number of Part C FDRs across all sponsors audited for ODAG in 2016 was 6.2, and number of Part C FDRs ranged from 1 to 52. Figure 17
9 7 3 2 4 1 1 3 1 1 1 1 10
1
2
3
4
5
6
7
8
9
10
OneFDR
TwoFDRs
ThreeFDRs
FourFDRs
FiveFDRs
SixFDRs
SevenFDRs
EightFDRs
NineFDRs
TwelveFDRs
FifteenFDRs
ThirtyTwo
FDRs
FiftyTwo
FDRs
Num
ber
of S
pons
ors
Number of Part C FDRs Utilized by Sponsors 2016

25 | P a g e
2016 FA and CDAG Scores by Number of Formularies Figure 18 displays the average 2016 FA and CDAG scores across audited sponsors broken into two groups: those that operate one formulary and those that operate more than one. In the latter group, the number of formularies used ranged from two to 17. The sponsors that operated one formulary had lower average scores in both FA and CDAG. This finding may be attributable to difficulties associated with managing multiple formularies and monitoring and correcting compliance issues. The difference was larger in FA, where the sponsors that operate one formulary had an average score of .74, whereas those that operated more than one had an average score of 1.09. In CDAG, sponsors operating only one formulary had an average score of 1.4, whereas those operating more than one had an average score of 1.63. The average number of formularies used across all sponsors audited in 2016 was 2.65. Figure 18*
* Audit scores are analyzed at the sponsor (parent organization) level. The average audit score is an unweighted score across all audited sponsors within each group. A lower audit score represents better audit performance.
0.74 1.091.4 1.630.00
0.20
0.40
0.60
0.80
1.00
1.20
1.40
1.60
1.80
Sponsors With One Formularyn=18
Sponsors With More Than One Formularyn=19
Aud
it Sc
ore
Number of Formularies vs. 2016 FA and CDAG ScoresFA CDAG

26 | P a g e
2016 Overall Audit Scores by Tax Status Figure 19 depicts the 2016 overall average audit scores by tax status (non-profit vs. for-profit), assigned at the contract level. Sponsors were grouped into each category based on all of their offerings under their parent organization, which could include both for-profit and non-profit contracts. The majority of sponsors were either classified as for-profit or as non-profit, but not both. Only three sponsors operated both for-profit and non-profit subsidiaries. Those sponsors with either a non-profit tax status designation or a mix of both non-profit and for-profit contracts fared better than sponsors operating only for-profit contracts. Figure 19*
*Audit scores are analyzed at the sponsor (parent organization) level. The tax status is assigned at the contract level; both for-profit and non-profit contracts can exist under a single parent organization. The average audit score is an unweighted score across all audited sponsors within each tax status group. A lower audit score represents better audit performance.
1.35 0.89 1.180.00
0.20
0.40
0.60
0.80
1.00
1.20
1.40
1.60
For Profitn=14
Both For-Profit and Non-Profitn=3
Non-Profitn=20
Aud
it Sc
ore
2016 Overall Audit Scores by Tax Status

27 | P a g e
2016 Overall Audit Scores by Program Experience Figure 20 breaks down the 2016 overall audit scores into three categories, depending on how long a sponsor has had an active Medicare contract. A sponsor’s earliest effective contract is used to determine the length of program experience. For example, if a sponsor has one contract dating back to 2005 and five contracts dating back to 2015, they were included in the “5 to 15 years” category below. The audit scores for sponsors operating Medicare contracts from five to 15 years and over 15 years are similar. The sponsors offering Medicare contracts for fewer than five years had somewhat higher audit scores than the other two groups of sponsors (i.e., 1.61 vs 1.07 and 1.18). There are a number of possible reasons for this difference. It may be that more experienced sponsors have more time to familiarize themselves with regulatory guidance and more time to operationalize that guidance. In some cases, sponsors may have had the benefit of undergoing previous program audits, giving them an opportunity to remediate deficiencies discovered during those audits. Figure 20*
* Audit scores are analyzed at the sponsor (parent organization) level. The length of time a sponsor has offered Medicare contracts is based on the contract a sponsor has with the earliest effective date. The average audit score is an unweighted score across all audited sponsors within each group. A lower audit score represents better audit performance.
1.61 1.07 1.180.00
0.20
0.40
0.60
0.80
1.00
1.20
1.40
1.60
1.80
Fewer than 5 Yearsn=7
Between 5 and 15 Yearsn=14
Over 15 Yearsn=16
Aud
it Sc
ore
2016 Overall Audit Scores by Program Experience
28 | P a g e
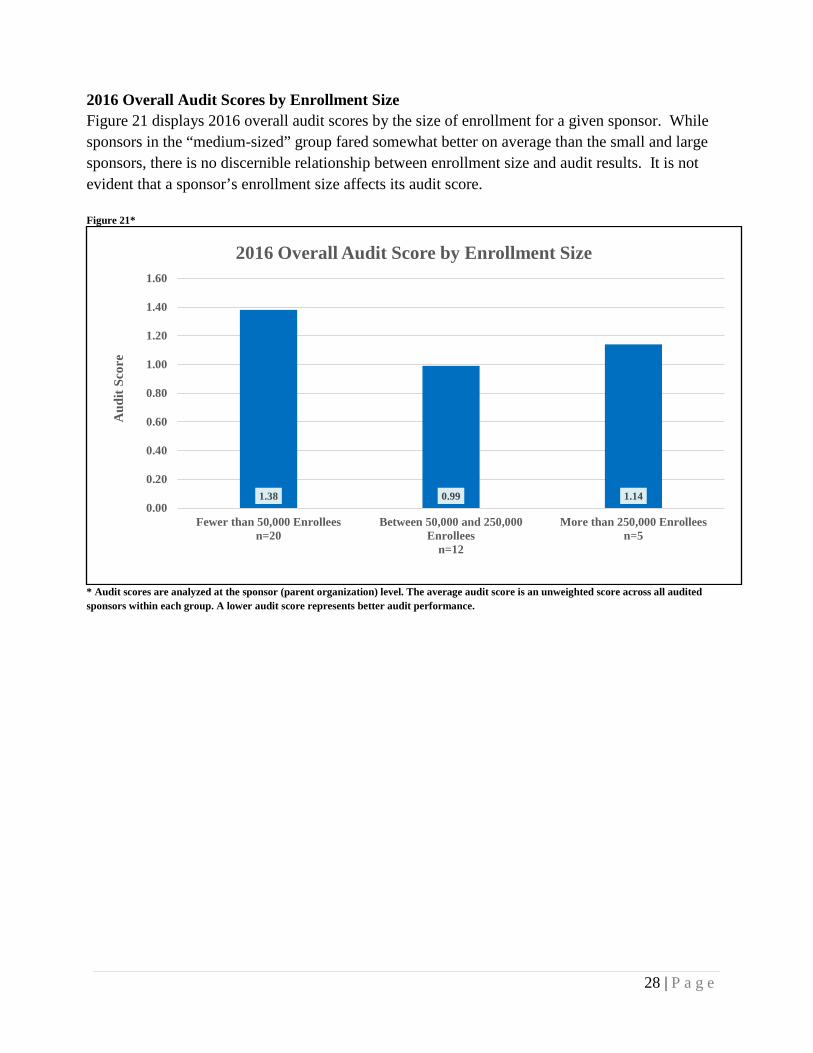
2016 Overall Audit Scores by Enrollment Size Figure 21 displays 2016 overall audit scores by the size of enrollment for a given sponsor. While sponsors in the “medium-sized” group fared somewhat better on average than the small and large sponsors, there is no discernible relationship between enrollment size and audit results. It is not evident that a sponsor’s enrollment size affects its audit score. Figure 21*
* Audit scores are analyzed at the sponsor (parent organization) level. The average audit score is an unweighted score across all audited sponsors within each group. A lower audit score represents better audit performance.
1.38 0.99 1.140.00
0.20
0.40
0.60
0.80
1.00
1.20
1.40
1.60
Fewer than 50,000 Enrolleesn=20
Between 50,000 and 250,000Enrollees
n=12
More than 250,000 Enrolleesn=5
Aud
it Sc
ore
2016 Overall Audit Score by Enrollment Size

29 | P a g e
2016 Overall Audit Scores by Low Income Subsidy (LIS) Enrollment Percentage Figure 22 compares average overall audit scores broken down by the percentage of a sponsor’s LIS enrollment. Most sponsors (27 out of 37) have overall enrollments comprised of fewer than 50% LIS beneficiaries, but 10 sponsors operate contracts where LIS beneficiaries are the majority. Across the first three groups of sponsors (i.e., <25%, between 25% and 50%, and between 50% and 75%), the audit scores increase and then slightly decrease (i.e., go from 1.05 to 1.51 to 1.39.). The group of sponsors with the largest percentage of LIS beneficiaries (i.e., more than 75%) had average audit scores roughly consistent with the two groups with LIS beneficiary levels between 25% and 75% of their total enrollment. These findings are inconsistent with those from 2015 audits. In the 2015 Annual Report, the group of sponsors with enrollments of more than 75% LIS beneficiaries fared the best on audit. These differing results suggest that LIS enrollment does not drive audit scores. Figure 22*
* Audit scores are analyzed at the sponsor (parent organization) level. The average audit score is an unweighted score across all audited sponsors within each group. A lower audit score represents better audit performance.
1.05 1.51 1.39 1.410.00
0.20
0.40
0.60
0.80
1.00
1.20
1.40
1.60
Less than 25%n=21
Between 25% and 50%n=6
Between 50% and 75%n=4
More than 75%n=6
Aud
it Sc
ore
2016 Overall Audit Score by LIS Enrollment as Percentage of Total Enrollment

30 | P a g e
2016 MOST COMMON CONDITIONS Tables 2-6 on pages 31-33 list the five most commonly cited conditions in 2016 in each of the five program areas. Several conditions have been a Top-5 condition in each of the common conditions lists since 2011. In 2016, CMS audited 37 sponsors for FA and CDAG, 35 for ODAG, 31 for CPE, and 18 for SNP-MOC. We calculated the percentage of sponsors affected using these respective numbers as the denominator for each given program area.
“Citation frequency” indicates the number of times a given condition appears in the common conditions lists compiled (e.g., 4/6) starting in 2011. CMS made all common conditions lists public, with the exception of the list from the 2014 audits. It is important to note that SNP-MOC and ODAG became active as program areas in 2013 and 2011 respectively, and therefore were included in fewer lists. Consequently, a SNP-MOC condition could appear up to four times, an ODAG condition could appear up to six times, and CPE, FA, and CDAG common conditions could appear up to seven times.
SPONSOR TIP: Please pay close attention to the common audit deficiencies listed by program area on the following pages. Understanding the failures of other organizations that operate in the Medicare Advantage and Prescription Drug programs can inform your internal auditing and monitoring efforts. Reviewing these common conditions can identify areas of potential weakness in your own operation. By evaluating your own organization’s compliance around these most common audit deficiencies, you may prevent them from being reflected in your audit report and negatively affecting your Star Ratings!

31 | P a g e
CPE Most Common Conditions: Table 2
Condition Language Citation
Frequency 2011-Present
Percentage of Sponsors
Affected in 2016
Sponsor did not review Office of Inspector General (OIG) and General Services Administration (GSA) exclusion lists for any new employee, temporary employee, volunteer, consultant, or governing body member prior to hiring or contracting and monthly thereafter.
4 out of 7 32%
Sponsor did not provide evidence that it audits the effectiveness of the compliance program at least annually and that the results are shared with the governing body. 4 out of 7 26%
Sponsor did not establish, implement, and provide timely and effective compliance and fraud, waste and abuse (FWA) training and education for its employees, including the CEO, senior administrators and managers and for its governing body members involved in the administration or delivery of Parts C and D benefits.
3 out of 7 26%
Sponsor did not establish and implement effective methods and lines of communication for confidential and anonymous reporting of potential compliance and fraud, waste and abuse (FWA) issues as they are identified.
1 out of 7 16%
Sponsor did not conduct monitoring and/or auditing of first tier entities to ensure they fulfill compliance requirements. 3 out of 7 13%
FA Most Common Conditions: Table 3
Condition Language Citation
Frequency 2011-Present
Percentage of Sponsors
Affected in 2016
Sponsor failed to properly administer the CMS transition policy. 7 out of 7 46%
Sponsor improperly effectuated prior authorizations or exception requests. 7 out of 7 38% Sponsor failed to properly administer its CMS-approved formulary by applying unapproved quantity limits. 7 out of 7 22%
Sponsor failed to properly administer its CMS-approved formulary by applying unapproved utilization management practices. 6 out of 7 19%
Sponsor failed to properly administer its CMS-approved formulary by applying unapproved prior authorization edits. 4 out of 7 16%
32 | P a g e
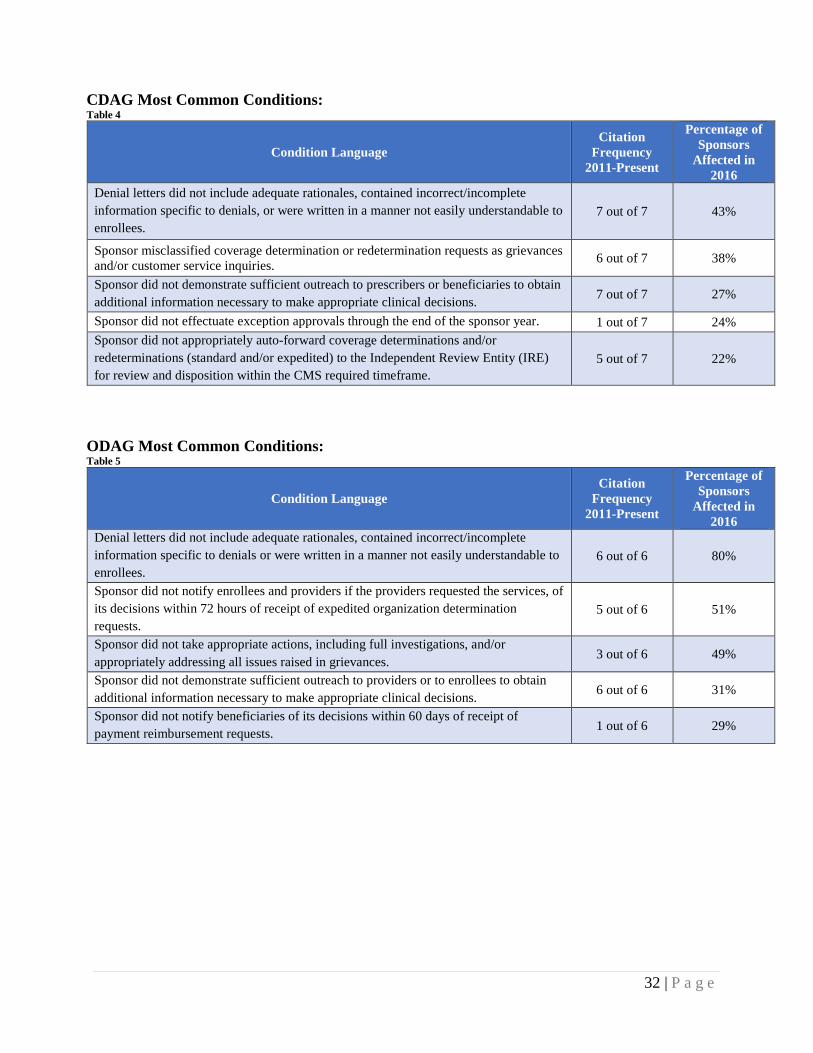
CDAG Most Common Conditions: Table 4
Condition Language Citation
Frequency 2011-Present
Percentage of Sponsors
Affected in 2016
Denial letters did not include adequate rationales, contained incorrect/incomplete information specific to denials, or were written in a manner not easily understandable to enrollees.
7 out of 7 43%
Sponsor misclassified coverage determination or redetermination requests as grievances and/or customer service inquiries. 6 out of 7 38%
Sponsor did not demonstrate sufficient outreach to prescribers or beneficiaries to obtain additional information necessary to make appropriate clinical decisions. 7 out of 7 27%
Sponsor did not effectuate exception approvals through the end of the sponsor year. 1 out of 7 24% Sponsor did not appropriately auto-forward coverage determinations and/or redeterminations (standard and/or expedited) to the Independent Review Entity (IRE) for review and disposition within the CMS required timeframe.
5 out of 7 22%
ODAG Most Common Conditions: Table 5
Condition Language Citation
Frequency 2011-Present
Percentage of Sponsors
Affected in 2016
Denial letters did not include adequate rationales, contained incorrect/incomplete information specific to denials or were written in a manner not easily understandable to enrollees.
6 out of 6 80%
Sponsor did not notify enrollees and providers if the providers requested the services, of its decisions within 72 hours of receipt of expedited organization determination requests.
5 out of 6 51%
Sponsor did not take appropriate actions, including full investigations, and/or appropriately addressing all issues raised in grievances. 3 out of 6 49%
Sponsor did not demonstrate sufficient outreach to providers or to enrollees to obtain additional information necessary to make appropriate clinical decisions. 6 out of 6 31%
Sponsor did not notify beneficiaries of its decisions within 60 days of receipt of payment reimbursement requests. 1 out of 6 29%
33 | P a g e
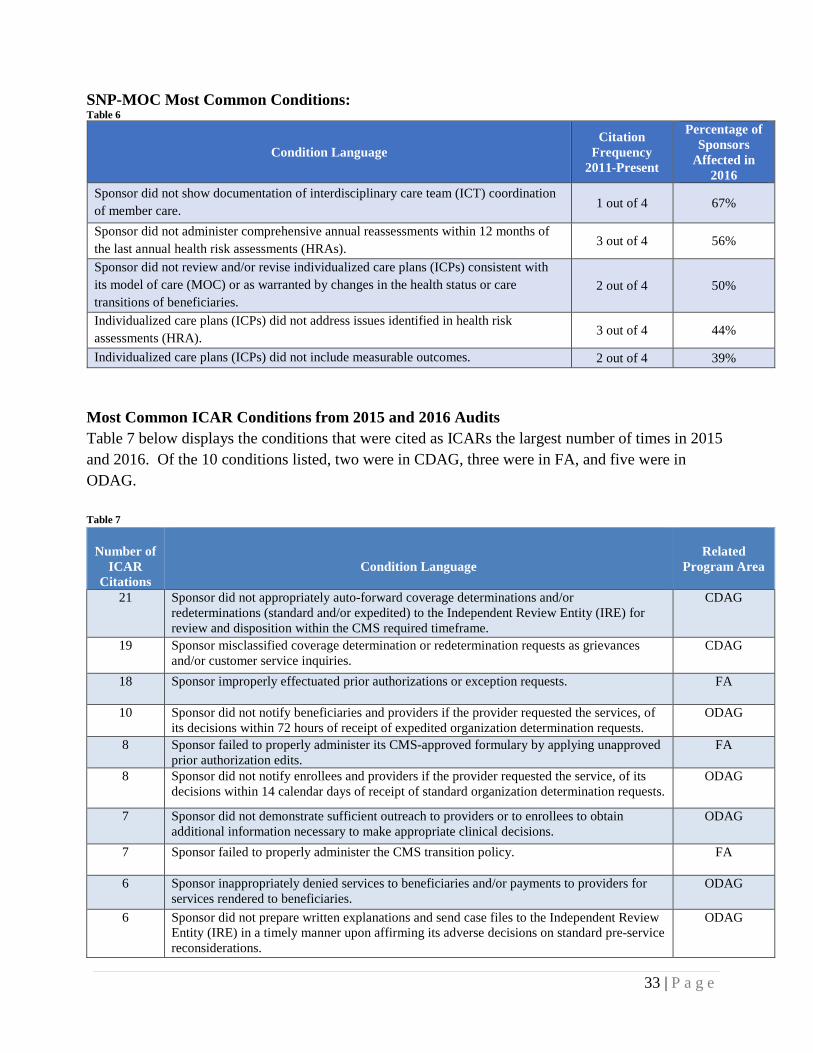
SNP-MOC Most Common Conditions: Table 6
Condition Language Citation
Frequency 2011-Present
Percentage of Sponsors
Affected in 2016
Sponsor did not show documentation of interdisciplinary care team (ICT) coordination of member care. 1 out of 4 67%
Sponsor did not administer comprehensive annual reassessments within 12 months of the last annual health risk assessments (HRAs). 3 out of 4 56%
Sponsor did not review and/or revise individualized care plans (ICPs) consistent with its model of care (MOC) or as warranted by changes in the health status or care transitions of beneficiaries.
2 out of 4 50%
Individualized care plans (ICPs) did not address issues identified in health risk assessments (HRA). 3 out of 4 44%
Individualized care plans (ICPs) did not include measurable outcomes. 2 out of 4 39% Most Common ICAR Conditions from 2015 and 2016 Audits Table 7 below displays the conditions that were cited as ICARs the largest number of times in 2015 and 2016. Of the 10 conditions listed, two were in CDAG, three were in FA, and five were in ODAG. Table 7
Number of
ICAR Citations
Condition Language
Related
Program Area
21
Sponsor did not appropriately auto-forward coverage determinations and/or redeterminations (standard and/or expedited) to the Independent Review Entity (IRE) for review and disposition within the CMS required timeframe.
CDAG
19
Sponsor misclassified coverage determination or redetermination requests as grievances and/or customer service inquiries.
CDAG
18
Sponsor improperly effectuated prior authorizations or exception requests. FA
10
Sponsor did not notify beneficiaries and providers if the provider requested the services, of its decisions within 72 hours of receipt of expedited organization determination requests.
ODAG
8
Sponsor failed to properly administer its CMS-approved formulary by applying unapproved prior authorization edits.
FA
8
Sponsor did not notify enrollees and providers if the provider requested the service, of its decisions within 14 calendar days of receipt of standard organization determination requests.
ODAG
7
Sponsor did not demonstrate sufficient outreach to providers or to enrollees to obtain additional information necessary to make appropriate clinical decisions.
ODAG
7
Sponsor failed to properly administer the CMS transition policy. FA
6
Sponsor inappropriately denied services to beneficiaries and/or payments to providers for services rendered to beneficiaries.
ODAG
6
Sponsor did not prepare written explanations and send case files to the Independent Review Entity (IRE) in a timely manner upon affirming its adverse decisions on standard pre-service reconsiderations.
ODAG

34 | P a g e
ENFORCEMENT ACTIONS In 2016, the imposition of various enforcement actions resulted because of program audit violations and other incidences of non-compliance. This section details the number and types of violations, the basis for those actions, and provides additional information about sponsors sanctioned and the amount of CMPs issued. CMS has the authority to impose CMPs, intermediate sanctions, and for-cause terminations against Medicare Advantage plans, PDPs, PACE Organizations, and Cost Plans. MOEG is responsible for imposing these types of enforcement actions when a sponsor is substantially non-compliant with CMS contract requirements. Sponsors that significantly fail to comply with Medicare Parts C and D requirements receive an enforcement action. Sponsors may appeal all enforcement actions either to the Departmental Appeals Board (CMPs) or to a CMS hearing officer (intermediate sanctions and terminations). In collaboration with the Department of Health and Human Services Office of General Counsel, the Office of Inspector General, and the Department of Justice all enforcement actions receive clearance prior to issuance. Enforcement actions are publicly posted on the Part C and Part D Compliance and Audits website.1 When referrals involve suspected fraud, waste, and abuse, information is immediately referred to CPI for investigation.
ENFORCEMENT ACTIONS IMPOSED BASED ON 2016 REFERRALS This section provides information on enforcement actions taken in calendar year 2016 and early 2017 due to non-compliance detected in 2016 program audits or through other compliance violations. There were 21 CMPs imposed in 2016, but no intermediate sanctions or for-cause terminations resulted from non-compliance identified in 2016. Referrals occur for non-compliance based on a variety of reasons. Approximately 81% of the referrals were for non-compliance found during program audits. Other non-compliance that resulted in enforcement referrals include erroneous or late Annual Notice of Change/Evidence of Coverage documents (ANOC/EOCs) and marketing violations that affect an enrollee’s ability to make informed decisions when selecting a Medicare plan. Figure 23 on the next page displays the number of enforcement actions by referral type.
1 http://www.cms.gov/Medicare/Compliance-and-Audits/Part-C-and-Part-D-Compliance-and- Audits/PartCandPartDEnforcementActions-.html

35 | P a g e
Figure 23
CIVIL MONEY PENALTIES (CMPs) CMPs imposed totaled $7.5 million, with an average of $357,756 per CMP. The highest CMP imposed was $2,498,850 and the lowest CMP imposed was $3,325. The following table shows the sponsors that received a CMP based on 2016 referrals:2
Table 8
Date of Imposition
Organization Name Basis for Referral CMP Amount
05/26/2016 Clover Health Marketing Misrepresentation $106,095
08/09/2016 Blue Cross of Idaho Care Plus, Inc. Inaccurate ANOC/EOC $102,820
08/09/2016 AgeWell New York, LLC Late and Inaccurate
ANOC/EOC $3,325
09/08/2016 Express Scripts Medicare Late ANOC/EOC $5,325 10/11/2016 Health Care Service Corporation 2016 Program Audit $115,625 10/11/2016 Healthfirst, Inc. 2016 Program Audit $38,125 10/11/2016 Fallon Community Health Plan 2016 Program Audit $348,900 11/21/2016 Caidan Enterprises, Inc. 2016 Program Audit $57,715 11/21/2016 Health Plan of San Mateo 2016 Program Audit $49,725 11/21/2016 Health Partners Plans, Inc. 2016 Program Audit $32,600 11/22/2016 UnitedHealth Group, Inc. 2016 Program Audit $2,498,850 01/12/2017 AvMed, Inc. 2016 Program Audit $764,375
2 DCE received a referral for one of the 2016 enforcement actions at the end of 2015.
17 3 10
2
4
6
8
10
12
14
16
18
2016 Program Audit Innaccurate or Late ANOC/EOC Marketing Misrepresentation
Number of Enforcement Actions by ReferralTypeN
umbe
r of
Enf
orce
men
t Act
ions

36 | P a g e
Date of Imposition
Organization Name Basis for Referral CMP Amount
01/12/2017 Presbyterian Healthcare Services 2016 Program Audit $775,375 01/12/2017 Centene Corporation 2016 Program Audit $31,950
02/23/2017 FirstHealth of the Carolinas, Inc. 2016 Focused Program Audit $28,975 02/23/2017 Independent Care Health Plan, Inc. 2016 Focused Program Audit $321,900 02/23/2017 MVP Health Care, Inc. 2016 Program Audit $85,200 02/23/2017 WellCare Health Plans, Inc. 2016 Program Audit $1,174,300
02/24/2017 CommunityCare Managed Healthcare
Plans of OK, Inc. 2016 Program Audit $760,500 02/24/2017 PH Holdings, LLC 2016 Program Audit $83,250 02/24/2017 SCAN Health Plan 2016 Program Audit $127,950
The average CMP amount, broken down by enrollment size of the parent organization’s audited contracts, is as follows:
• For organizations with < 10,000 enrollees, the average CMP was $114,578 • For organizations with 10,000 – 50,000 enrollees, the average CMP was $452,283 • For organizations with 50,000 – 200,000, the average CMP was $83,631 • For organizations with 200,000 or more, the average CMP was $1,262,925
The amount of the CMP does not automatically reflect the overall performance of a sponsor. As discussed below, the majority of CMPs are based on the number of enrollees impacted by certain violations. Consequently, the amount of a CMP may be higher for sponsors with larger enrollment or where a violation affects a higher number of enrollees. The nature and scope of the violation(s) determines the total CMP a sponsor receives. A standard CMP amount applies for each deficiency cited in a CMP notice, based on either a per-enrollee or a per-determination basis. A sponsor’s CMP is increased or decreased if aggravating or mitigating factors apply to certain deficiencies:
• Aggravating Factors: The standard penalty for a deficiency for a contract may increase if the violation involves drugs where treatment should not be delayed, expedited cases, a prevalence of failed audit samples, existence of a Top-5 common findings condition, and/or a history of prior offense.
• Mitigating Factors: The standard CMP amount for a violation may decrease if a
beneficiary received the drug on the same day (after an initial rejection at the point of sale) or the enrollment-based penalty cap per condition of non-compliance was reached.

37 | P a g e
There were 21 CMPs imposed for 62 violations:3 • 59 on a per-enrollee basis resulting in $7,497,880 (95% of the total CMP amount). • 3 on a per-determination basis resulting in $15,000 (5% of the total CMP amount).
For CMPs taken in 2016 and early 2017, Figure 24 and Figure 25 show the total number of violations and dollar amount of violations by calculation type. Notably, in 2016, there were only three violations penalized on a per-determination basis, all of which involved marketing misrepresentations. Figure 24 Figure 25
INTERMEDIATE SANCTIONS Intermediate sanctions suspend a sponsor’s ability to market to or enroll new beneficiaries or to receive payment for new enrollees. In 2016, there were no intermediate sanctions imposed because of 2016 program audit failures or other referral types. The following sponsors were under intermediate sanctions during 2016 based on 2015 audit failures:
3 These numbers include CMPs from program audits, but also CMPs for late or erroneous ANOC/EOCs and marketing violations that adversely affect an enrollee or have the substantial likelihood of adversely affecting an enrollee.
3(5%)
59(95%)
Number of CMP Related Violations Per Calculation Type
(All Referrals)Per Determination Per Enrollee
$15,000 (0.2%)
$7,497,880 (99.8%)
Dollar Amount of CMP Related Violations Per Calculation Type
(All Referrals)Per Determination Per Enrollee

38 | P a g e
Table 9
Date of Imposition
Organization Name
Basis for Referral
Type of
Intermediate Sanction
Date the Limited
Marketing & Enrollment
Period (LMEP) Began
Date of
Intermediate Sanction Release
07/17/2015
Torchmark Corporation
2015 Program
Audit
Non- Immediate
Suspension of Enrollment &
Marketing
--------
265 days – released
4/7/2016
11/17/2015
Alexian Brothers Community
Services
2015 Focused Audit Results
Immediate Suspension of
Enrollment
Not Eligible
Unilateral termination
effective 4/30/2016
01/21/2016
Cigna-
HealthSpring
2015 Program
Audit
Immediate Suspension of Enrollment &
Marketing
--------
TBD
02/26/2016
Ultimate Health
Plans, Inc.
2015 Program
Audit
Immediate Suspension of Enrollment &
Marketing
--------
201 days – released
9/13/2016
Torchmark Corporation and Ultimate Health Plans, Inc. corrected the operational deficiencies that were the basis for their sanctions and were able to demonstrate compliance by successfully passing CMS-directed validation exercises. Alexian Brothers Community Services requested to unilaterally terminate PACE contract number H2609 and cease all operations by April 30, 2016. Although Alexian Brothers chose to end their contract with CMS, the enrollment sanction remained effective until the final date of the unilateral termination. CIGNA-HealthSpring remains under intermediate enrollment and marketing sanctions and is working to remediate its deficiencies. Independent Auditor Validation Each sponsor under intermediate sanctions is required to select and hire an independent auditor to conduct a validation audit at the sponsor’s expense. CMS recommends sponsors hire an independent auditor early in the sanction process. The independent auditor audits the sponsor using CMS’ audit protocols, drafts a report that details the findings from their independent audit, and submits the report to CMS. The information gathered during the sanction process and the results of the independent audit validation are used to determine if the sponsor is released from intermediate sanctions. Limited Marketing and Enrollment Period Sponsors under intermediate sanctions may request to engage in a test period of accepting enrollments or marketing for a limited period. When the sponsor fully implements its corrective action plan, demonstrates the effectiveness of the corrections through self-

39 | P a g e
monitoring and regular status reporting, and attests to the correction of its deficiencies this request can be granted. Sponsors are also required to submit the Independent Auditor’s validation work plan, which must receive approval prior to granting the limited marketing and enrollment period. No sponsor under intermediate sanctions during 2016 (see Table 9) requested to engage in this test period. ENFORCEMENT ACTIONS RELATED SPECIFICALLY TO 2016 PROGRAM AUDITS This section provides additional details on the enforcement actions taken related to the 2016 program audits and compares these enforcement actions to those from the 2015 program audits. For full details of the enforcement actions taken related to 2015 program audits, please see the 2015 Part C and Part D Program Audit and Enforcement Report. Of the 37 organizations audited during 2016, 17 (46%) received an enforcement action.4 Figure 26 compares the cumulative CMP amounts and types of enforcement actions imposed on sponsors for 2015 and 2016 program audits. Figure 26
Five more CMPs were imposed based on 2016 program audits in comparison to the number of CMPs for 2015 program audits (i.e., 17 in 2016 vs. 12 in 2015). However, in 2016, we conducted a larger number of full-scope program audits (in addition to focused audits) compared to 2015. While the issuance of CMPs increased in 2016, the combined dollar amount of the CMPs decreased. This decrease is attributable to a smaller number of violations per CMP and the smaller enrollment size per sponsor (average enrollment size of sponsors that received a CMP in
4 In total, MOEG conducted 37 audits in 2016; however, only 31 were full scope, routine audits. The enforcement section discusses targeted audits insofar as they resulted in a civil money penalty.
12
17
3
02468
1012141618
Program Audit Year- 2015 $8,484,900
Program Audit Year- 2016$7,295,315
Enforcement Action Comparison2015 vs. 2016 Program Audits
Civil Money Penalty (CMP) Intermediate Sanctions
Num
ber
of E
nfor
cem
entA
ctio
ns

40 | P a g e
2016 was 656,650 compared to 1,018,737 in 2015). Most sponsors received CMPs for non-compliance in the program areas of FA, CDAG, and ODAG since their actions adversely affected (or had the substantial likelihood of adversely affecting) one or more enrollees. Figure 27 compares the number of conditions cited in FA, CDAG, and ODAG from 2015 and 2016 program audits to the number of violations that were included in the basis for taking CMPs. Twenty-nine percent of FA (25), CDAG (27), and ODAG (21) conditions were cited in CMPs for 2015 program audits. Twenty-one percent of FA (13), CDAG, (19), and ODAG (22) conditions were cited in CMPs for 2016 program audits. Figure 27
For 2016 program audits, CMS imposed all CMP violations (54) on a per-enrollee basis (total CMP amount of $7,295,315). Figure 28 shows the average number of CMP violations by program area for 2015 and 2016 program audits. The number of FA, CDAG, and ODAG violations decreased between program audit years 2015 and 2016.
253 25573 540
50
100
150
200
250
300
Program Audit Year- 2015 Program Audit Year- 2016
FA, CDAG and ODAG Audit Conditions vs. CMP Related Violations
Program Audit Conditions Enforcement Violations
Num
ber o
f Con
ditio
ns/V
iola
tions

41 | P a g e
Figure 28
CMS also continued to reduce the timeframe to issue CMPs. By improving the referral process and the process for analyzing enforcement cases, we saw a 12% reduction in the number of days for issuing a CMP following the release of the final audit report (50 days in 2015 to 44 days in 2016).
PROGRAM AUDIT INTERMEDIATE SANCTIONS There were no intermediate sanctions imposed as a result of 2016 program audits. APPEALS Sponsors have the right to appeal CMPs, intermediate sanctions, and termination actions by CMS. For CMPs, sponsors must file appeal requests no later than 60 days after receiving the CMP notice. If the sponsor does not appeal, the CMP is final and due for payment. For intermediate sanctions and terminations, sponsors must file appeals no later than 15 days after receiving the enforcement or termination notice. An appeal does not delay the imposition of the sanction, but it will delay the imposition of a termination unless there is imminent and serious risk to the health of the enrollees.
2.10 2.25 1.700.76 1.12 1.290.00
0.50
1.00
1.50
2.00
2.50
Formulary and BenefitAdministration
CDAG ODAG
Average Number of CMP Violations by Program Area
Program Audit Year- 2015 Program Audit Year- 2016
Ave
rage
Num
ber
of V
iola
tions
42 | P a g e
2017 AUDIT PROCESS IMPROVEMENTS The goal in 2017 remains to continue enhancing the consistency among audits and to strengthen the expertise of audit teams. All audit findings undergo review and evaluation by consistency teams to ensure a fair and consistent outcome across all audits. We believe that by continuing to build auditor expertise, we are better suited to collaborate with and provide technical assistance to the industry, and aid in improving performance. The following is a list of implemented initiatives and process improvements and activities planned for later this year:
• Developed two Medicare-Medicaid Plan (MMP)-specific protocols we will use to evaluate sponsors’ MMP contracts
• Improved written communications by posting the 2017 Program Audit Process Overview documents on our website, remodeling the engagement letter, and providing an audit submission checklist with the engagement letter as a tool for organizations to use to track submissions
• Enhanced HPMS Audit Module capabilities to allow the submission of all universes and content directly into the Module
• Simplified the purpose and scope of the Pre-Audit Issue Summary document request • Extended due dates to provide critical audit documentation like root-cause statements and
impact analyses • Further enhanced our CPE protocols by streamlining the CPE audit protocol from 7 to 3
elements, providing written questionnaires in advance of interviews, providing sponsors with flexibility in presenting tracer samples, and providing samples to sponsors two weeks before fieldwork. We made these changes to reduce burden on sponsors
• Released our 2017 audit protocols for two public comment periods in 2016 pursuant to the Paperwork Reduction Act (PRA). These comment periods gave the industry an opportunity to share with us questions and concerns they had which resulted in us making various revisions to our protocols
• Plan to hold a listening session with the industry to obtain feedback and comments on the independent auditor selection and process
CONCLUSION We continue to strive for increased transparency in relation to audit materials, performance, results and enforcement actions. The focus on program audits (and the resulting consequences of possible enforcement actions) continues to drive improvements in the industry. This assists in increasing sponsors’ compliance with core program functions in the MA and Part D programs. We hope sponsors will utilize the information contained in this report to inform their internal auditing, monitoring, and compliance activities. We encourage feedback and look forward to continued collaboration with the industry in developing new approaches to assist in achieving compliance.


![FOIAIPA NO: 2016-0014 RECORDS BEING RELEASED IN PART · E--]PII of third parties referenced in records compiled for law enforcement purposes Lx. 7(D):D-]Witnesses' and Allegers' PII](https://static.fdocuments.us/doc/165x107/5e6eae7778aa834c5556e0aa/foiaipa-no-2016-0014-records-being-released-in-part-e-pii-of-third-parties-referenced.jpg)