2016 ECONOMIC BACKGROUND
198
Transcript of 2016 ECONOMIC BACKGROUND


2016 ECONOMIC BACKGROUND AND
2017 PROSPECTS
ECONOMIC ANALYSIS DIVISION ECONOMIC ANALYSIS AND BUSINESS FACILITATION UNIT
FINANCIAL SECRETARY’S OFFICE GOVERNMENT OF THE
HONG KONG SPECIAL ADMINISTRATIVE REGION
February 2017
CONTENTS
Paragraphs CHAPTER 1 : OVERVIEW OF ECONOMIC PERFORMANCE IN 2016
Overall situation 1.1 - 1.2 The external sector 1.3 - 1.5 The domestic sector 1.6 - 1.7 The labour sector 1.8 The asset markets 1.9 - 1.10 Inflation 1.11 - 1.12 GDP by major economic sector 1.13 - 1.15 Other economic developments 1.16 - 1.24 Box 1.1 Change in dissemination of the Hong Kong’s gross domestic product (GDP) statistics
Box 1.2 Diffusion indices on small and medium-sized enterprises (an update)
CHAPTER 2 : ECONOMIC OUTLOOK FOR 2017 AND THE MEDIUM TERM
Major external developments 2.1 - 2.2 Global economic outlook 2.3 - 2.9 Monetary conditions 2.10 - 2.11 Exchange rates and price competitiveness 2.12 - 2.14 World inflation and global commodity prices 2.15 - 2.17 Major sources of uncertainty 2.18 - 2.20 Outlook for the Hong Kong economy in 2017 2.21 - 2.26 Medium-term outlook for the Hong Kong economy 2.27 - 2.34 Box 2.1 US fiscal policy developments after the Great Recession of 2009
Box 2.2 Economic performance of the Mainland in 2016 CHAPTER 3 : THE EXTERNAL SECTOR
Goods trade Total exports of goods 3.1 - 3.6 Imports of goods 3.7 Services trade Exports of services 3.8 Imports of services 3.9 Goods and services balance 3.10 Other developments 3.11 - 3.15 Box 3.1 The performance of financial and business services trade in Asia in recent years
CHAPTER 4 : DEVELOPMENTS IN SELECTED SECTORS
Property 4.1 - 4.13 Land and planning 4.14 - 4.15 Tourism 4.16 - 4.18 Logistics 4.19 - 4.20 Transport 4.21 - 4.22 Innovation and technology 4.23 Environment 4.24
CHAPTER 5 : THE FINANCIAL SECTOR
Interest rates and exchange rates 5.1 - 5.5 Money supply and banking sector 5.6 - 5.10 The debt market 5.11 - 5.12 The stock and derivatives markets 5.13 - 5.16 Fund management and investment funds 5.17 Insurance sector 5.18 Highlights of policy and market developments 5.19
CHAPTER 6 : THE LABOUR SECTOR
Overall labour market situation 6.1 Labour force and total employment 6.2 - 6.3 Profile of unemployment 6.4 - 6.7 Profile of underemployment 6.8 Profile of employment in establishments 6.9 - 6.10 Vacancies 6.11 - 6.15 Wages and earnings 6.16 - 6.20 Highlights of labour-related measures and policy developments in 2016
6.21 - 6.23
Box 6.1 Elderly employment
CHAPTER 7 : PRICES
Consumer prices 7.1 - 7.3 Costs of factor inputs and import prices 7.4 - 7.5 Output prices 7.6 GDP deflator 7.7 Box 7.1 Recent movements of food and commodity prices in the international markets
CALENDAR OF EVENTS OF SIGNIFICANCE FOR THE HONG KONGECONOMY IN 2016 STATISTICAL APPENDIX

1
CHAPTER 1 : OVERVIEW OF ECONOMIC PERFORMANCE IN 2016 Summary
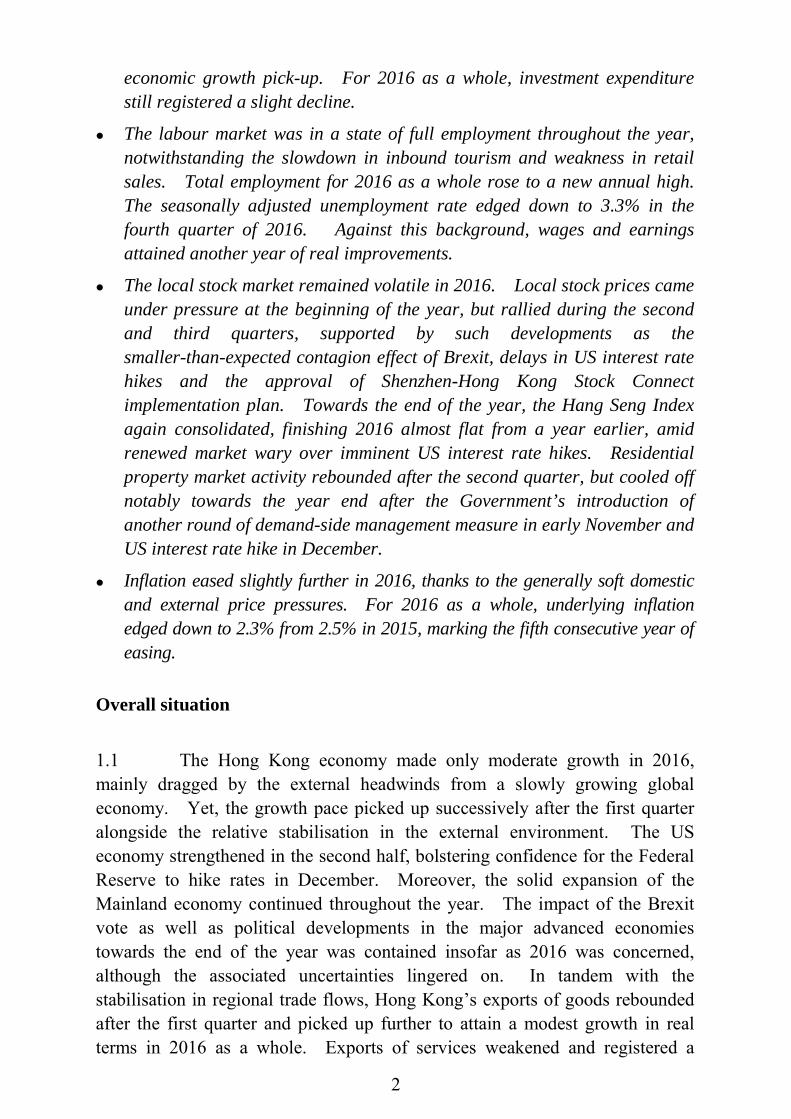
The Hong Kong economy expanded at a slower pace in 2016 as global economic growth pace weakened to its lowest level since 2009. Yet, after a notable slackening in the first quarter of 2016, the economy regained momentum, picking up successively in growth to 3.1% in the fourth quarter, riding on the improvement in external economic environment. For 2016 as a whole, the economy grew by 1.9%, somewhat slower than the 2.4% growth in 2015.
The economic performance during 2016 was characterised by resilience in domestic demand and a low start in external demand with a subsequent visible rebound. The labour market was in a state of full employment all through 2016, while inflation eased for the fifth consecutive year.
The external trading environment was particularly difficult in early 2016, but staged some improvement subsequently, led by stronger US demand and steady growth in the Mainland economy. The UK vote in June to leave the EU caught the markets by surprise, but the contagion impact remained largely contained till end 2016. Along with the general recuperation of Asia’s trade flows, Hong Kong’s total exports of goods revived after a distinct fall-off in the first quarter, with a particularly impressive growth in the fourth quarter, yielding a modest growth for 2016 as a whole.
Exports of services slackened in 2016, posting the first annual decline since 1998, dragged mainly by notable fall-off in inbound tourism. Yet, as the global economic environment turned more benign and as visitor arrivals bottomed out, exports of services generally improved during the year, reverting to growth by the fourth quarter. Amongst the key components, the fall in exports of travel services posed a significant drag, being affected by subpar regional growth, strong currency and the effect of the “one trip per week” Individual Visit Endorsements. Exports of financial services and exports of business and other services were likewise sluggish, though faring better towards the year-end. Exports of transport services were the brighter spot, benefitting from improved regional trade flows during the year.
The domestic sector stayed resilient in 2016 despite the various external uncertainties. Private consumption expenditure registered further growth, buttressed by continued favourable employment and labour income conditions. Investment expenditure fell off consequential to the economic slowdown in early 2016, but rose again in the second half on the back of the
2
economic growth pick-up. For 2016 as a whole, investment expenditure still registered a slight decline.
The labour market was in a state of full employment throughout the year, notwithstanding the slowdown in inbound tourism and weakness in retail sales. Total employment for 2016 as a whole rose to a new annual high. The seasonally adjusted unemployment rate edged down to 3.3% in the fourth quarter of 2016. Against this background, wages and earnings attained another year of real improvements.
The local stock market remained volatile in 2016. Local stock prices came under pressure at the beginning of the year, but rallied during the second and third quarters, supported by such developments as the smaller-than-expected contagion effect of Brexit, delays in US interest rate hikes and the approval of Shenzhen-Hong Kong Stock Connect implementation plan. Towards the end of the year, the Hang Seng Index again consolidated, finishing 2016 almost flat from a year earlier, amid renewed market wary over imminent US interest rate hikes. Residential property market activity rebounded after the second quarter, but cooled off notably towards the year end after the Government’s introduction of another round of demand-side management measure in early November and US interest rate hike in December.
Inflation eased slightly further in 2016, thanks to the generally soft domestic and external price pressures. For 2016 as a whole, underlying inflation edged down to 2.3% from 2.5% in 2015, marking the fifth consecutive year of easing.
Overall situation
1.1 The Hong Kong economy made only moderate growth in 2016, mainly dragged by the external headwinds from a slowly growing global economy. Yet, the growth pace picked up successively after the first quarter alongside the relative stabilisation in the external environment. The US economy strengthened in the second half, bolstering confidence for the Federal Reserve to hike rates in December. Moreover, the solid expansion of the Mainland economy continued throughout the year. The impact of the Brexit vote as well as political developments in the major advanced economies towards the end of the year was contained insofar as 2016 was concerned, although the associated uncertainties lingered on. In tandem with the stabilisation in regional trade flows, Hong Kong’s exports of goods rebounded after the first quarter and picked up further to attain a modest growth in real terms in 2016 as a whole. Exports of services weakened and registered a

3
decline, dragged mainly by the subdued inbound tourism, though also seeing a recovery in the fourth quarter. The domestic sector showed remarkable resilience. Favourable employment and labour income conditions supported further private consumption growth, while investment spending also bounced back strongly in the second half. The underlying inflation rate eased slightly, marking the fifth consecutive year of declines. 1.2 For 2016 as a whole, Gross Domestic Product (GDP)(1) grew moderately by 1.9% in real terms, slower than the 2.4% growth in 2015. In terms of the quarterly profile, the year-on-year growth rate of real GDP picked up from 1.0% in the first quarter to 1.7% and 2.0% respectively in the second and third quarters, and reached 3.1% in the fourth quarter on the back of improving external sector and strengthening domestic demand. On a seasonally adjusted quarter-to-quarter comparison(2), real GDP fell by 0.3% in the first quarter, and then rebounded markedly by 1.4% in the second quarter, before growing further by 0.8% and 1.2% respectively in third and fourth quarters.
-4
-2
0
2
4
6
8
10
2007 2008 2009 2010 2011 2012 2013 2014 2015 2016
Rate of change in real terms
Diagram 1.1 : The Hong Kong economy continued to grow moderately in 2016
Percent(a) Annual profile
4
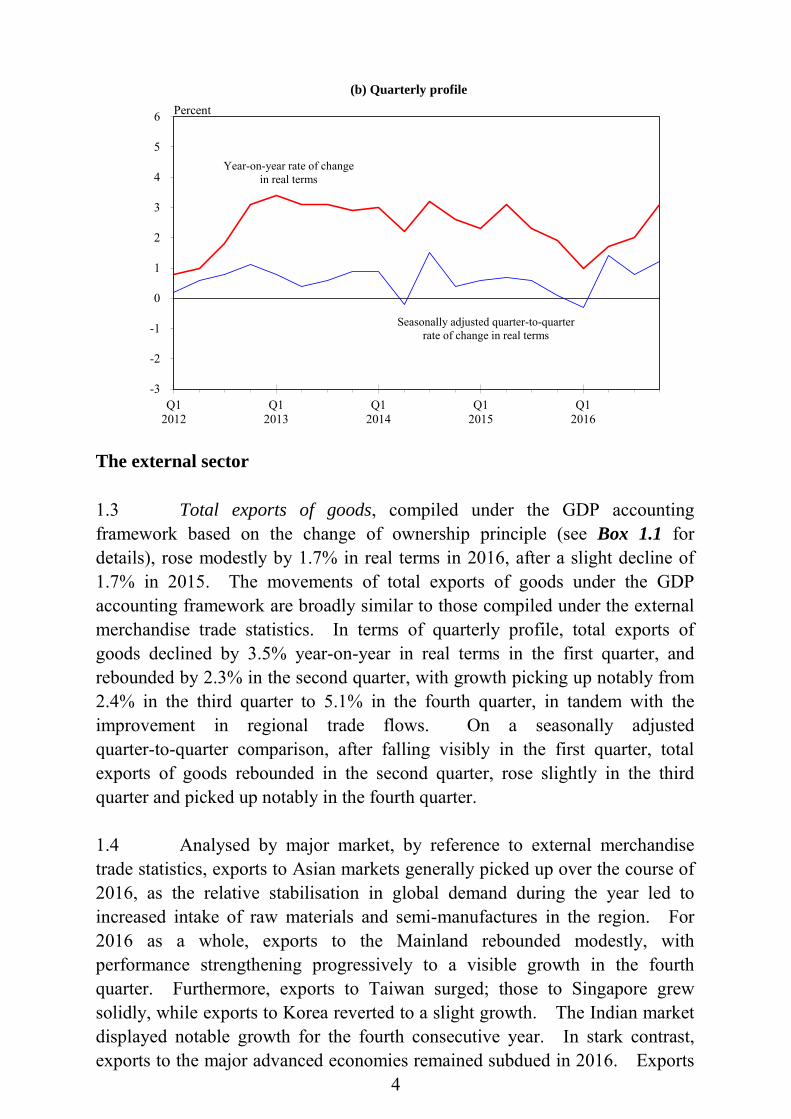
The external sector 1.3 Total exports of goods, compiled under the GDP accounting framework based on the change of ownership principle (see Box 1.1 for details), rose modestly by 1.7% in real terms in 2016, after a slight decline of 1.7% in 2015. The movements of total exports of goods under the GDP accounting framework are broadly similar to those compiled under the external merchandise trade statistics. In terms of quarterly profile, total exports of goods declined by 3.5% year-on-year in real terms in the first quarter, and rebounded by 2.3% in the second quarter, with growth picking up notably from 2.4% in the third quarter to 5.1% in the fourth quarter, in tandem with the improvement in regional trade flows. On a seasonally adjusted quarter-to-quarter comparison, after falling visibly in the first quarter, total exports of goods rebounded in the second quarter, rose slightly in the third quarter and picked up notably in the fourth quarter. 1.4 Analysed by major market, by reference to external merchandise trade statistics, exports to Asian markets generally picked up over the course of 2016, as the relative stabilisation in global demand during the year led to increased intake of raw materials and semi-manufactures in the region. For 2016 as a whole, exports to the Mainland rebounded modestly, with performance strengthening progressively to a visible growth in the fourth quarter. Furthermore, exports to Taiwan surged; those to Singapore grew solidly, while exports to Korea reverted to a slight growth. The Indian market displayed notable growth for the fourth consecutive year. In stark contrast, exports to the major advanced economies remained subdued in 2016. Exports
Q12012
Q12013
Q12014
Q12015
Q12016
-3
-2
-1
0
1
2
3
4
5
6
Year-on-year rate of changein real terms
Percent
Seasonally adjusted quarter-to-quarterrate of change in real terms
(b) Quarterly profile
5
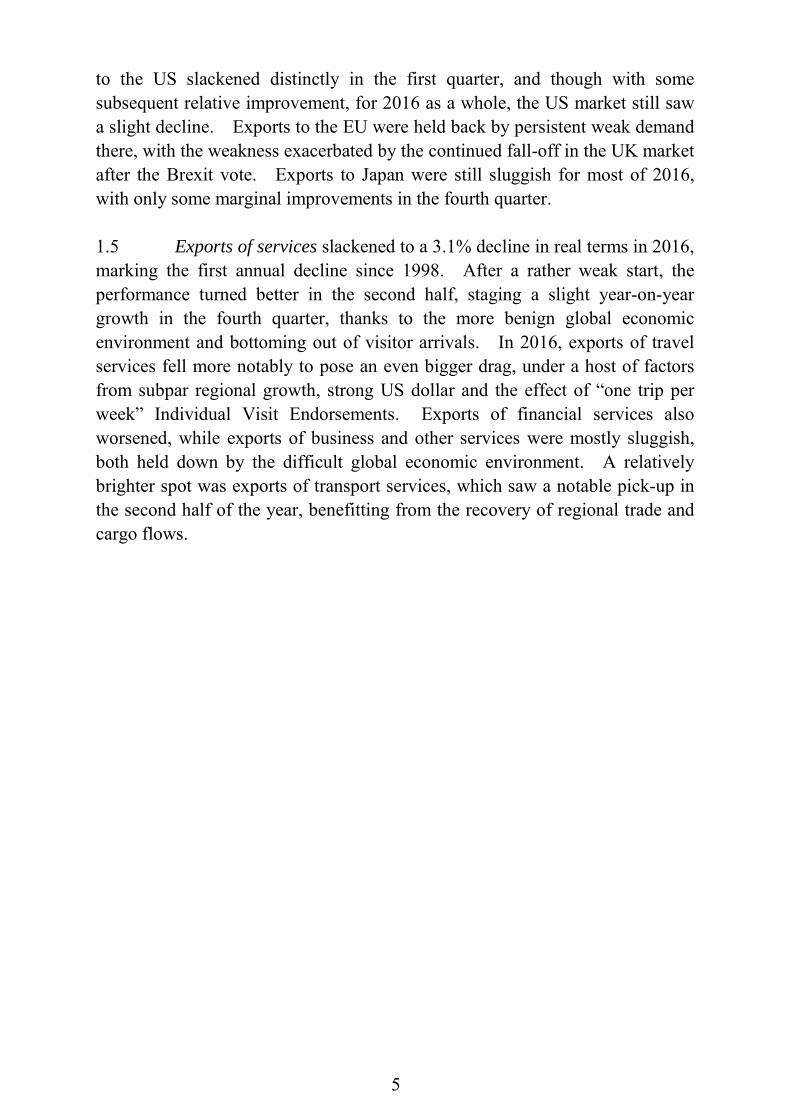
to the US slackened distinctly in the first quarter, and though with some subsequent relative improvement, for 2016 as a whole, the US market still saw a slight decline. Exports to the EU were held back by persistent weak demand there, with the weakness exacerbated by the continued fall-off in the UK market after the Brexit vote. Exports to Japan were still sluggish for most of 2016, with only some marginal improvements in the fourth quarter. 1.5 Exports of services slackened to a 3.1% decline in real terms in 2016, marking the first annual decline since 1998. After a rather weak start, the performance turned better in the second half, staging a slight year-on-year growth in the fourth quarter, thanks to the more benign global economic environment and bottoming out of visitor arrivals. In 2016, exports of travel services fell more notably to pose an even bigger drag, under a host of factors from subpar regional growth, strong US dollar and the effect of “one trip per week” Individual Visit Endorsements. Exports of financial services also worsened, while exports of business and other services were mostly sluggish, both held down by the difficult global economic environment. A relatively brighter spot was exports of transport services, which saw a notable pick-up in the second half of the year, benefitting from the recovery of regional trade and cargo flows.
6
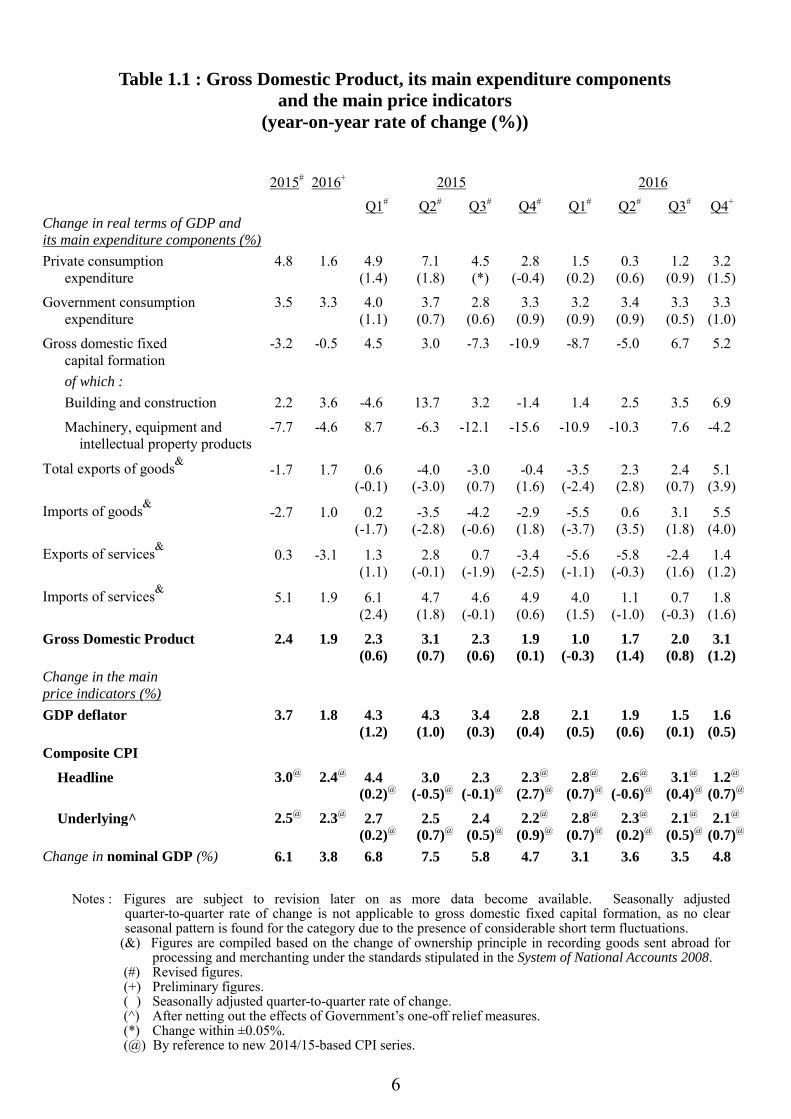
Table 1.1 : Gross Domestic Product, its main expenditure components and the main price indicators
(year-on-year rate of change (%))
2015# 2016+ 2015 2016
Q1# Q2# Q3# Q4# Q1# Q2# Q3# Q4+
Change in real terms of GDP and its main expenditure components (%)
Private consumption 4.8 1.6 4.9 7.1 4.5 2.8 1.5 0.3 1.2 3.2 expenditure (1.4) (1.8) (*) (-0.4) (0.2) (0.6) (0.9) (1.5)
Government consumption 3.5 3.3 4.0 3.7 2.8 3.3 3.2 3.4 3.3 3.3 expenditure (1.1) (0.7) (0.6) (0.9) (0.9) (0.9) (0.5) (1.0)
Gross domestic fixed -3.2 -0.5 4.5 3.0 -7.3 -10.9 -8.7 -5.0 6.7 5.2 capital formation of which : Building and construction 2.2 3.6 -4.6 13.7 3.2 -1.4 1.4 2.5 3.5 6.9
Machinery, equipment and -7.7 -4.6 8.7 -6.3 -12.1 -15.6 -10.9 -10.3 7.6 -4.2 intellectual property products
Total exports of goods& -1.7 1.7 0.6 -4.0 -3.0 -0.4 -3.5 2.3 2.4 5.1 (-0.1) (-3.0) (0.7) (1.6) (-2.4) (2.8) (0.7) (3.9)
Imports of goods& -2.7 1.0 0.2 -3.5 -4.2 -2.9 -5.5 0.6 3.1 5.5 (-1.7) (-2.8) (-0.6) (1.8) (-3.7) (3.5) (1.8) (4.0)
Exports of services& 0.3 -3.1 1.3 2.8 0.7 -3.4 -5.6 -5.8 -2.4 1.4 (1.1) (-0.1) (-1.9) (-2.5) (-1.1) (-0.3) (1.6) (1.2)
Imports of services& 5.1 1.9 6.1 4.7 4.6 4.9 4.0 1.1 0.7 1.8 (2.4) (1.8) (-0.1) (0.6) (1.5) (-1.0) (-0.3) (1.6)
Gross Domestic Product 2.4 1.9 2.3 3.1 2.3 1.9 1.0 1.7 2.0 3.1 (0.6) (0.7) (0.6) (0.1) (-0.3) (1.4) (0.8) (1.2) Change in the main price indicators (%)
GDP deflator 3.7 1.8 4.3 4.3 3.4 2.8 2.1 1.9 1.5 1.6 (1.2) (1.0) (0.3) (0.4) (0.5) (0.6) (0.1) (0.5) Composite CPI
Headline 3.0@ 2.4@ 4.4 3.0 2.3 2.3@ 2.8@ 2.6@ 3.1@ 1.2@ (0.2)@ (-0.5)@ (-0.1)@ (2.7)@ (0.7)@ (-0.6)@ (0.4)@ (0.7)@
Underlying^ 2.5@ 2.3@ 2.7 2.5 2.4 2.2@ 2.8@ 2.3@ 2.1@ 2.1@ (0.2)@ (0.7)@ (0.5)@ (0.9)@ (0.7)@ (0.2)@ (0.5)@ (0.7)@ Change in nominal GDP (%) 6.1 3.8 6.8 7.5 5.8 4.7 3.1 3.6 3.5 4.8
Notes : Figures are subject to revision later on as more data become available. Seasonally adjusted
quarter-to-quarter rate of change is not applicable to gross domestic fixed capital formation, as no clear seasonal pattern is found for the category due to the presence of considerable short term fluctuations.
(&) Figures are compiled based on the change of ownership principle in recording goods sent abroad for processing and merchanting under the standards stipulated in the System of National Accounts 2008.
(#) Revised figures. (+) Preliminary figures. (+) Seasonally adjusted quarter-to-quarter rate of change. (^) After netting out the effects of Government’s one-off relief measures. (*) Change within ±0.05%. (@) By reference to new 2014/15-based CPI series.

7
Box 1.1
Change in dissemination of the Hong Kong’s gross domestic product (GDP) statistics
Starting from February 2017, the Census and Statistics Department (C&SD) will present the statistics on trade in goods and services compiled based on the change of ownership principle in the main statistical tables of C&SD’s regular report on Hong Kong’s Gross Domestic Product (GDP). These trade statistics were previously presented in the supplementary tables of C&SD’s reports on GDP. The adoption of the change of ownership principle in compiling trade statistics within the GDP framework follows closely the prevailing international standards given in the System of National Accounts 2008, which is the latest version of the international statistical manual on the compilation of national accounts statistics. This short article attempts to recap the key features of the trade statistics based on the change of ownership principle. More details can be found in C&SD’s Special Report on Gross Domestic Product – September 2012.
Simply put, the adoption of the change of ownership principle is a technical amendment to the ways of recording trade in goods (TIG) and services (TIS) related to (i) goods sent abroad for processing (outward processing); and (ii) merchanting(1). Following this principle, goods sent abroad for processing and subsequently returned to Hong Kong will no longer be recorded as TIG. Instead, the fees paid to the processing units will be recorded as imports of services. Meanwhile, merchanting will be re-classified as TIG, instead of TIS(2).
Adopting the change of ownership principle can better reflect the latest trend in globalisation and the genuine trade flows irrespective of the goods’ physical movements and locations. This is particularly relevant since outward processing and merchanting activities feature prominently in Hong Kong’s trade structure with our traders’ extensive trading network of buyers and sellers in the global market.
Based on the above re-classification, the trade deficit in goods would be smaller, due to the exclusion of trade in goods for processing and the inclusion of the net value of goods under merchanting. Similarly, the trade surplus in services would likewise be smaller, after the exclusion of exports of merchanting services and the inclusion of imports of manufacturing services (Charts 1 and 2). The ratio of total trade to GDP compiled according to the change of ownership principle is also slightly lower than before. For instance, such a ratio in 2016 was 372.8%, compared to 382.2% compiled according to the previous standards.
-800
-600
-400
-200
0
200
400
2006
2007
2008
2009
2010
2011
2012
2013
2014
2015
2016
Before After
HK$Bn
Chart 1 : Balance of trade in goods
-100
0
100
200
300
400
500
600
700
800
2006
2007
2008
2009
2010
2011
2012
2013
2014
2015
2016
Before After
HK$Bn
Chart 2 : Balance of trade in services
8
Box 1.1 (Cont’d)
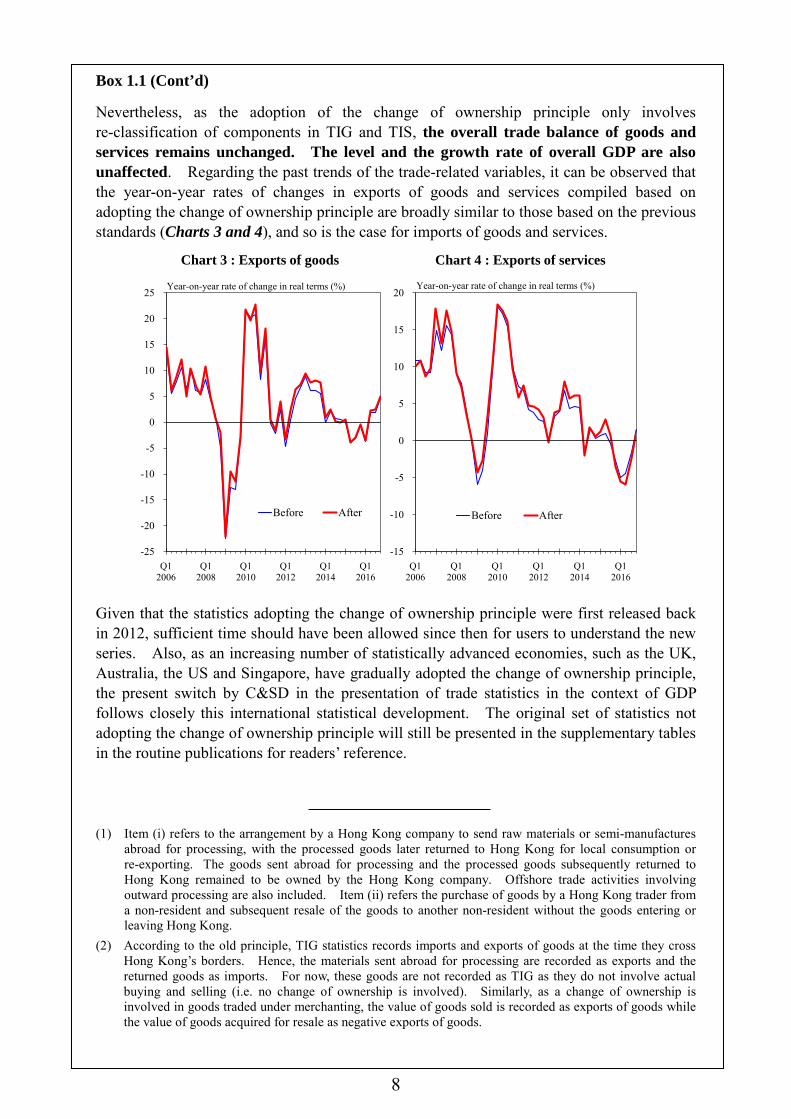
Nevertheless, as the adoption of the change of ownership principle only involves re-classification of components in TIG and TIS, the overall trade balance of goods and services remains unchanged. The level and the growth rate of overall GDP are also unaffected. Regarding the past trends of the trade-related variables, it can be observed that the year-on-year rates of changes in exports of goods and services compiled based on adopting the change of ownership principle are broadly similar to those based on the previous standards (Charts 3 and 4), and so is the case for imports of goods and services.
Given that the statistics adopting the change of ownership principle were first released back in 2012, sufficient time should have been allowed since then for users to understand the new series. Also, as an increasing number of statistically advanced economies, such as the UK, Australia, the US and Singapore, have gradually adopted the change of ownership principle, the present switch by C&SD in the presentation of trade statistics in the context of GDP follows closely this international statistical development. The original set of statistics not adopting the change of ownership principle will still be presented in the supplementary tables in the routine publications for readers’ reference.
(1) Item (i) refers to the arrangement by a Hong Kong company to send raw materials or semi-manufactures
abroad for processing, with the processed goods later returned to Hong Kong for local consumption or re-exporting. The goods sent abroad for processing and the processed goods subsequently returned to Hong Kong remained to be owned by the Hong Kong company. Offshore trade activities involving outward processing are also included. Item (ii) refers the purchase of goods by a Hong Kong trader from a non-resident and subsequent resale of the goods to another non-resident without the goods entering or leaving Hong Kong.
(2) According to the old principle, TIG statistics records imports and exports of goods at the time they cross Hong Kong’s borders. Hence, the materials sent abroad for processing are recorded as exports and the returned goods as imports. For now, these goods are not recorded as TIG as they do not involve actual buying and selling (i.e. no change of ownership is involved). Similarly, as a change of ownership is involved in goods traded under merchanting, the value of goods sold is recorded as exports of goods while the value of goods acquired for resale as negative exports of goods.
Q12006
Q12008
Q12010
Q12012
Q12014
Q12016
-25
-20
-15
-10
-5
0
5
10
15
20
25
Before After
Year-on-year rate of change in real terms (%)
Chart 3 : Exports of goods
Q12006
Q12008
Q12010
Q12012
Q12014
Q12016
-15
-10
-5
0
5
10
15
20
Before After
Year-on-year rate of change in real terms (%)
Chart 4 : Exports of services

9
The domestic sector 1.6 Domestic demand displayed much resilience in 2016, marked also by a progressive strengthening during the year. Private consumption expenditure was a key growth driver, expanding by 1.6% in real terms in 2016, after the 4.8% growth in 2015. Private consumption turned stronger gradually in the latter half of the year, as sustained rises in employment and labour earnings supported local consumption sentiment. Meanwhile, government consumption expenditure sustained steady growth of 3.3% in real terms in 2016, similar to those in the preceding years.
Table 1.2 : Consumer spending by major component(a) (year-on-year rate of change in real terms (%))
Of which :
Total consumer
spending in the domestic
market(a) Food Durables Non-
durables Services
Residents’ expenditure
abroad Visitor
spending
Private consumption expenditure(b)
2015 Annual 2.7 1.9 5.9 0.7 3.1 13.1 -3.2 4.8
H1 4.1 3.1 11.7 1.7 3.9 12.5 -1.5 6.0
H2 1.3 0.6 0.7 -0.2 2.3 13.6 -4.7 3.6
Q1 2.9 3.7 7.1 1.3 2.7 11.6 -2.7 4.9 Q2 5.4 2.7 18.7 2.1 5.1 13.4 -0.2 7.1 Q3 2.2 0.7 5.0 0.8 2.5 14.8 -3.2 4.5 Q4 0.4 0.6 -2.4 -1.2 2.1 12.4 -6.1 2.8 2016 Annual -0.6 0.9 -15.3 -0.7 2.1 6.9 -8.5 1.6
H1 -1.8 0.6 -18.5 -2.5 1.2 9.0 -11.1 0.9
H2 0.6 1.2 -12.1 1.0 2.9 4.8 -5.8 2.2
Q1 -2.4 -1.8 -18.7 -3.4 1.9 16.3 -13.2 1.5 Q2 -1.3 2.7 -18.1 -1.5 0.6 2.2 -8.8 0.3 Q3 -0.6 0.3 -11.4 -3.7 2.4 3.9 -7.9 1.2 Q4 1.8 2.0 -12.6 5.2 3.5 5.8 -3.8 3.2
Notes : (a) Consumer spending in the domestic market comprises both local consumer and visitor spending, which are not separable from the survey data.
(b) Private consumption expenditure is obtained by deducting visitor spending from the total consumer spending in the domestic market, and adding back residents’ expenditure abroad.
10
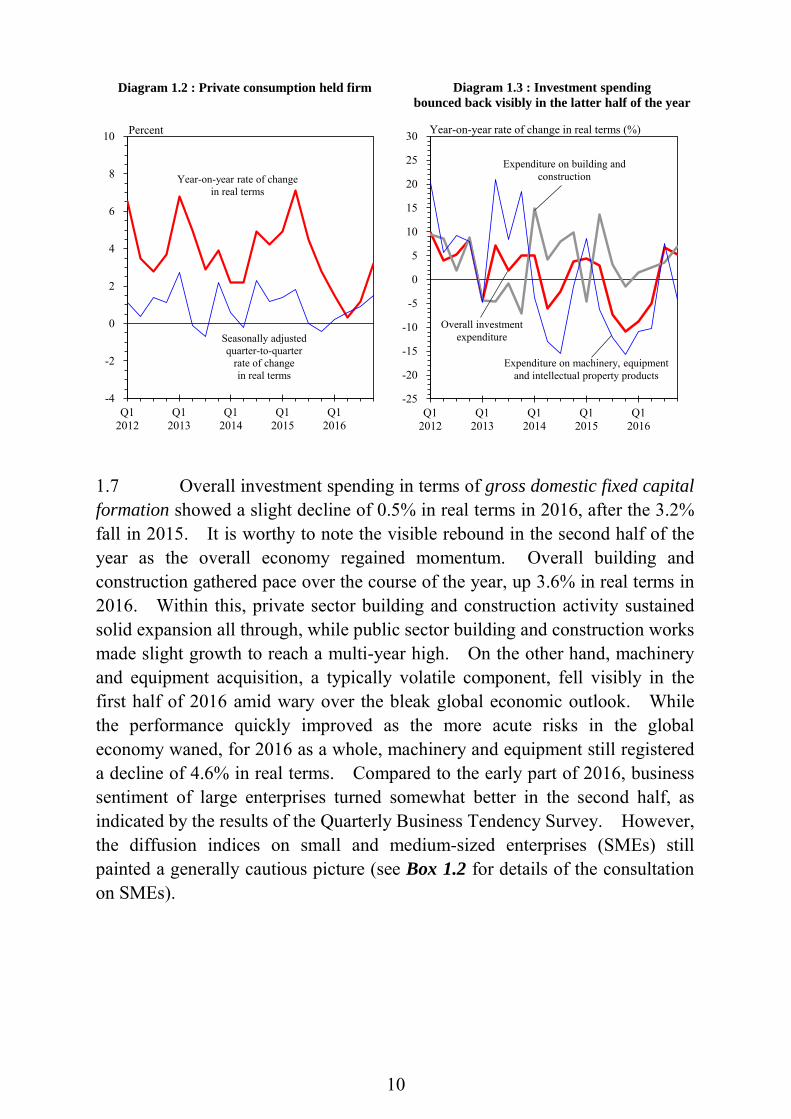
1.7 Overall investment spending in terms of gross domestic fixed capital formation showed a slight decline of 0.5% in real terms in 2016, after the 3.2% fall in 2015. It is worthy to note the visible rebound in the second half of the year as the overall economy regained momentum. Overall building and construction gathered pace over the course of the year, up 3.6% in real terms in 2016. Within this, private sector building and construction activity sustained solid expansion all through, while public sector building and construction works made slight growth to reach a multi-year high. On the other hand, machinery and equipment acquisition, a typically volatile component, fell visibly in the first half of 2016 amid wary over the bleak global economic outlook. While the performance quickly improved as the more acute risks in the global economy waned, for 2016 as a whole, machinery and equipment still registered a decline of 4.6% in real terms. Compared to the early part of 2016, business sentiment of large enterprises turned somewhat better in the second half, as indicated by the results of the Quarterly Business Tendency Survey. However, the diffusion indices on small and medium-sized enterprises (SMEs) still painted a generally cautious picture (see Box 1.2 for details of the consultation on SMEs).
Q12012
Q12013
Q12014
Q12015
Q12016
-4
-2
0
2
4
6
8
10
Year-on-year rate of change in real terms
Seasonally adjusted quarter-to-quarter
rate of change in real terms
Q12012
Q12013
Q12014
Q12015
Q12016
-25
-20
-15
-10
-5
0
5
10
15
20
25
30
Expenditure on machinery, equipmentand intellectual property products
Expenditure on building and construction
Year-on-year rate of change in real terms (%)
Overall investment expenditure
Diagram 1.2 : Private consumption held firm Diagram 1.3 : Investment spendingbounced back visibly in the latter half of the year
Percent

11
Box 1.2
Diffusion indices on small and medium-sized enterprises (an update)
To gain a better understanding of the current situation of business receipts, employment and credit access for small and medium-sized enterprises (SMEs)(1), an ad-hoc consultation exercise has been conducted by the Census and Statistics Department on behalf of the Economic Analysis and Business Facilitation Unit since late November 2008. In the recent past, the exercise has been conducted on a sample panel of over 500 SMEs. This note provides a further update of the results reported in Box 1.1 in the Third Quarter Economic Report 2016.
A set of diffusion indices is compiled to indicate the general directions of change in the respondents’ views on business receipts, employment and new export orders versus the preceding month. From the June 2016 round onwards, SMEs are asked to report whether they have credit need, in addition to whether the access to credit is tight. While the findings should be interpreted with considerable caution given the coverage and nature of the consultation exercise, they can serve as a rough indicator to enable high frequency monitoring of SMEs’ situation.
Business receipts of the SMEs consulted, as measured by the set of diffusion indices, suggested that the overall situation generally remained stable, but enterprises surveyed were still cautious about the outlook (Table 1). The overall index hovered below the boom-bust threshold of 50.0, dipping from 46.4 in November 2016 to 45.2 in December, before improving slightly to 46.0 in January 2017. Analysed by sector, the readings for retail and wholesale trades and restaurants showed some relative improvements in January 2017 from the preceding month amid the recent recovery in inbound tourism. The diffusion index for real estate stabilised somewhat in January 2017, after some visible deterioration in late 2016 conceivably due to the introduction of the latest round of demand-side management measures in November last year. Meanwhile, the business services sector fared better, with its reading staying steadily above the 50.0 boom-bust line in the past three months. As for the external segments, the diffusion indices for the import/export trade and logistics sectors were still rather weak, notwithstanding the recent improvements in global and regional trade flows. As to the employment situation, the feedback from SMEs suggested a broadly steady development in recent months in most sectors (Table 2).
For the import/export trade sector in particular, SMEs’ views on new export orders were sought separately to help gauge the likely export performance in the near term. The diffusion index on new export orders moved slightly lower from 48.6 in November 2016 to 47.3 in January 2017, plausibly affected by the lingering uncertainties in the external environment (Table 3).
The overall credit situation remained highly accommodative in recent months. In January 2017, 8.4% of SMEs reported current need for credit, and only 0.2% reported tight access to credit, thanks to the generally accommodative monetary conditions and the Government’s continued efforts to support SMEs through various loan guarantee schemes (Table 4). (1) Manufacturing enterprises with fewer than 100 employees and non-manufacturing enterprises with fewer
than 50 employees are regarded as SMEs in Hong Kong.

12
Box 1.2 (Cont’d) Table 1 : Diffusion indices^ on business receipts
Notes : (^) The diffusion index is computed by adding the percentage of SMEs reporting “up” to one half of
the percentage of SMEs reporting “same”. A diffusion index reading above 50 indicates that the business condition is generally favourable, whereas an index below 50 indicates otherwise. Respondents were requested to exclude seasonal effects in reporting their views.
(*) Weighted average using total number of SMEs in individual sectors as weights. Table 2 : Diffusion indices on employment situation
Note : (*) Weighted average using total number of SMEs in individual sectors as weights.
Table 3 : Diffusion index on current new export orders
Table 4 : Percentage of SMEs with current credit need and reporting tight credit access&
Notes : (&) The questions on access to credit have been enhanced for better understanding of the current
credit need and credit access situation of SMEs. It should be noted that the assessment of credit access situation might display great fluctuations from month to month given the small number of SMEs involved, as a great majority of SMEs reported “no credit need”. Thus the results should be interpreted with caution.
(*) Weighted average using total number of SMEs in individual sectors as weights.
2016 2017Jan Feb Mar Apr May Jun Jul Aug Sep Oct Nov Dec Jan
Local segments Restaurants 41.5 45.7 46.6 44.0 41.4 40.2 49.2 45.0 47.5 44.1 41.9 42.4 45.1 Real estate 41.4 50.0 55.2 46.6 53.4 43.8 50.0 47.4 55.3 42.1 33.3 40.4 45.2 Retail trade 42.2 48.5 41.9 38.8 44.2 37.2 39.7 43.3 45.3 47.9 47.1 43.2 45.2 Wholesale trade 38.9 44.4 32.4 32.4 35.3 38.9 41.7 50.0 47.2 41.7 48.1 41.1 46.4 Business services 45.2 51.7 51.7 50.0 51.8 48.5 45.6 48.5 47.1 47.2 51.2 51.1 51.1
External segments Import/export trade 46.4 45.0 49.1 50.9 46.3 41.4 44.0 45.2 45.2 46.9 47.2 47.2 45.2 Logistics 50.0 50.0 46.7 46.7 46.4 37.5 39.5 47.4 50.0 47.1 45.7 38.3 43.5
All the above sectors* 44.2 47.2 46.8 45.7 45.9 41.0 43.6 45.7 46.6 46.3 46.4 45.2 46.0
2016 2017Jan Feb Mar Apr May Jun Jul Aug Sep Oct Nov Dec Jan
Local segments Restaurants 50.0 47.4 50.0 50.9 48.3 45.9 50.0 51.7 48.3 51.7 46.3 48.2 50.0 Real estate 43.1 50.0 51.7 50.0 50.0 50.0 46.1 50.0 51.3 51.3 44.8 47.1 47.1 Retail trade 51.0 48.5 50.0 47.4 49.5 48.7 48.3 49.6 49.6 49.6 50.0 49.1 49.4 Wholesale trade 50.0 50.0 50.0 50.0 50.0 50.0 50.0 50.0 50.0 50.0 50.0 50.0 50.0 Business services 48.4 48.3 50.0 50.0 50.0 48.5 48.5 48.5 48.6 50.0 50.0 50.0 50.0
External segments Import/export trade 49.1 48.2 49.5 50.5 49.5 48.8 48.7 49.1 48.2 48.2 50.7 49.1 50.0 Logistics 50.0 50.0 46.7 43.3 50.0 50.0 44.7 50.0 44.4 47.1 52.2 51.7 51.6
All the above sectors* 49.2 48.6 49.8 49.4 49.6 48.8 48.4 49.5 48.8 49.3 49.8 49.2 49.7
2016 2017Jan Feb Mar Apr May Jun Jul Aug Sep Oct Nov Dec Jan
Import/export trade 46.8 46.8 49.5 48.6 47.7 41.4 44.9 46.9 46.5 47.4 48.6 48.1 47.3
2016 2017Jun Jul Aug Sep Oct Nov Dec Jan
All selected sectors* With current credit need 13.0 8.9 8.4 9.3 9.2 9.4 9.8 8.4 Reported tight access to credit 1.2 0.8 0.3 0.9 0.7 0.6 0.5 0.2

13
The labour sector
1.8 The labour market in overall terms remained remarkably resilient in 2016, sustaining full employment all through, notwithstanding a slowdown in inbound tourism and the weak retail sales performance. The seasonally adjusted unemployment rate edged down to 3.3% in the fourth quarter, while the underemployment rate stayed low at 1.4%. Both total employment and the labour force sustained further growth to new annual highs. Against this background, nominal wages and earnings sustained broad-based increases in 2016.
The asset markets
1.9 The local stock market remained volatile in 2016. In tandem with overseas markets, the Hang Seng Index (HSI) extended declines in the early part of the year and fell to a four-year low of 18 320 on 12 February, due to increasing risk aversion amid concerns about the bleak global economic outlook. Subsequently, favourable developments such as slower-than-expected US interest rate hikes, and the approval of Shenzhen-Hong Kong Stock Connect implementation plan helped revive market sentiment, sending the HSI to the year-high level of 24 100 on 9 September. The surprise result of UK referendum in June only spurred short-lived jitters, and the local stock market followed the overseas counterparts to bounce back swiftly. Yet, as US interest rate hike fears returned towards the end of the year, HSI lost some ground again, closing the year at 22 001, only 0.4% higher than at end-2015. The average daily turnover fell to $66.9 billion in 2016. Nevertheless, fund-raising activity stayed relatively buoyant in 2016. The amount of total initial public offering (IPO) funds raised, at $195.3 billion in 2016, though lower than the high level of $263.1 billion in 2015, still made Hong Kong as the world’s largest IPO centre for the second consecutive year. 1.10 Amid a still tight demand-supply balance, the residential property market showed renewed signs of exuberance during the year, only cooled off notably after the Government’s introduction of a further round of demand-side management measure in early November 2016 and US interest rate hike in December 2016. However, given the increases cumulated earlier, overall flat prices in December 2016 were still 8% higher than a year earlier and exceeded the 1997 peak by 77%. The housing affordability ratio worsened to around 63% in the fourth quarter of 2016, well above the long-term average of 46% over 1996 to 2015. Flat rentals were somewhat more stable, with a cumulative gain of 1% during 2016. As regards commercial property, shop rentals retreated by 2% during 2016, amid a weak retail market. On the other hand, office rentals edged up by 3% during 2016.

14
Inflation 1.11 Consumer price inflation eased further in 2016, as domestic price pressures remained benign and imported inflation was largely absent. External price pressures were muted, thanks to the relatively low inflation of Hong Kong’s major import sources and to some extent the persisted strength of the US dollar. Food inflation, despite a temporary surge in the first quarter under bad weather, was moderate for the year as a whole. Locally, the moderate expansion of the local economy kept rises in domestic costs at bay. Rental inflation eased further. The price-setting power of the retailers was also constrained by the slowdown in inbound tourism as well as the slower growth in local consumption. Headline consumer price inflation moderated to 2.4% in 2016 from 3.0% in 2015. Netting out the effects of the Government’s one-off relief measures, underlying consumer price inflation eased to 2.3% in 2016 from 2.5% in 2015, marking the lowest since 2010. 1.12 The GDP deflator increased by 1.8% in 2016, down from the 3.7% increase in 2015, mainly reflecting further moderation in domestic demand deflator, mirroring the trend in consumer price inflation. Meanwhile, the terms of trade was almost flat, with both import and export prices showing modest falls.
Note : The year-on-year rates of change of the Composite Consumer Price Index from
the fourth quarter of 2015 onwards are computed from the new 2014/15-based series, and those before are from the old 2009/10-based series.
Q12012
Q12013
Q12014
Q12015
Q12016
-2
0
2
4
6
8 Year-on-year rate of change (%)
Underlying Composite Consumer Price Index
Diagram 1.4 : Underlying consumer price inflation eased further in 2016
Domesticdemand deflator
GDP deflator

15
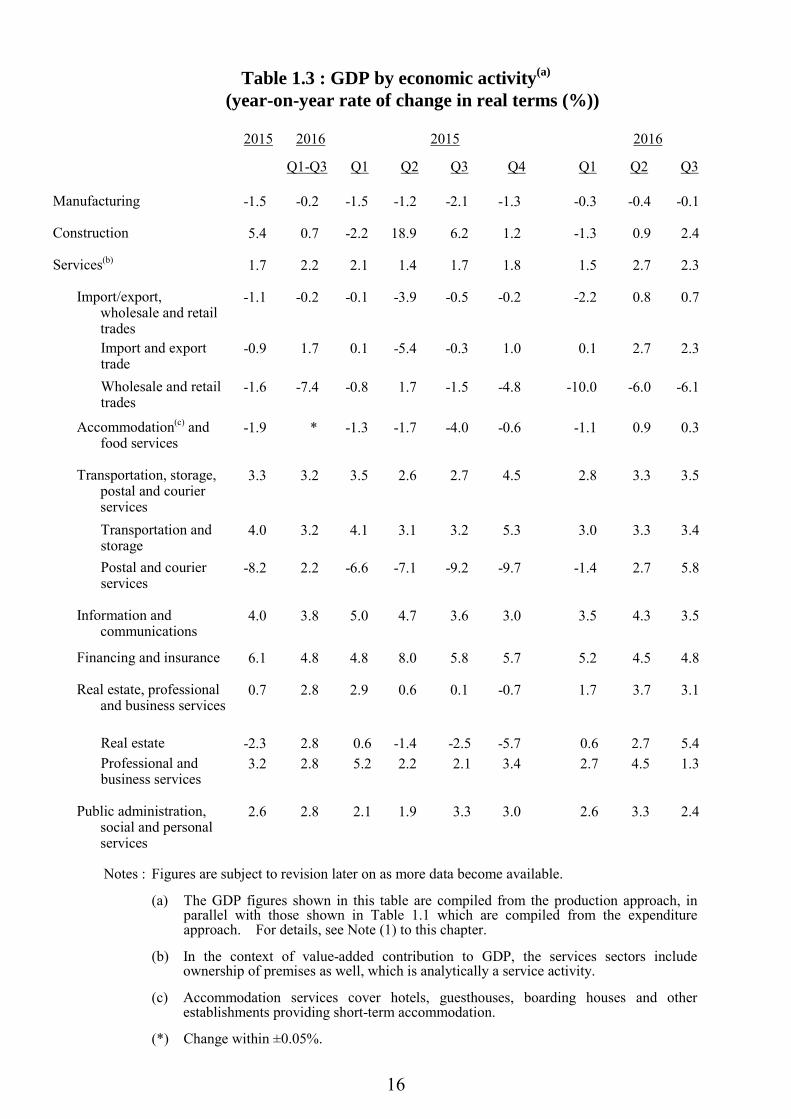
GDP by major economic sector 1.13 The services sector grew modestly in the first three quarters of 2016, in line with the overall economic performance. Net output of the services sector grew in real terms by 1.5%, 2.7% and 2.3% respectively in the first three quarters of 2016 over a year earlier. 1.14 Among the major services sectors, net output of wholesale and retail trades was the worst performer, falling distinctly in the first three quarters of 2016 combined amid the slowdown in inbound tourism. Net output of accommodation and food services was virtually unchanged over a year earlier. Net output of other service sectors registered varying degrees of growth in the first three quarters of 2016. Net output of import/export trade rose modestly while those of transportation, storage, postal and courier services expanded steadily further, mirroring the improving regional trade flows. Financing and insurance grew at a more visible pace comparatively in the first three quarters. Professional and business services, information and communications, as well as public administration, social and personal services continued to grow moderately. Net output of real estate (mainly reflecting activity of private sector developers and property agency) rebounded in the first three quarters, led by more active property market over the period. As for the secondary sector, net output in the manufacturing sector fell slightly in the first three quarters of 2016, while that in the construction sector grew further.
16
Table 1.3 : GDP by economic activity(a) (year-on-year rate of change in real terms (%))
2015 2016 2015 2016
Q1-Q3 Q1
Q2 Q3 Q4 Q1 Q2 Q3
Manufacturing
-1.5 -0.2 -1.5 -1.2 -2.1 -1.3 -0.3 -0.4 -0.1
Construction
5.4 0.7 -2.2 18.9 6.2 1.2 -1.3 0.9 2.4
Services(b)
1.7 2.2 2.1 1.4 1.7 1.8 1.5 2.7 2.3
Import/export, wholesale and retail trades
-1.1 -0.2 -0.1 -3.9 -0.5 -0.2 -2.2 0.8 0.7
Import and export trade
-0.9 1.7 0.1 -5.4 -0.3 1.0 0.1 2.7 2.3
Wholesale and retail trades
-1.6 -7.4 -0.8 1.7 -1.5 -4.8 -10.0 -6.0 -6.1
Accommodation(c) and food services
-1.9 * -1.3 -1.7 -4.0 -0.6 -1.1 0.9 0.3
Transportation, storage, postal and courier services
3.3 3.2 3.5 2.6 2.7 4.5 2.8 3.3 3.5
Transportation and storage
4.0 3.2 4.1 3.1 3.2 5.3 3.0 3.3 3.4
Postal and courier services
-8.2 2.2 -6.6 -7.1 -9.2 -9.7 -1.4 2.7 5.8
Information and communications
4.0 3.8 5.0 4.7 3.6 3.0 3.5 4.3 3.5
Financing and insurance
6.1 4.8 4.8 8.0 5.8 5.7 5.2 4.5 4.8
Real estate, professional and business services
0.7 2.8 2.9 0.6 0.1 -0.7 1.7 3.7 3.1
Real estate -2.3 2.8 0.6 -1.4 -2.5 -5.7 0.6 2.7 5.4 Professional and business services
3.2 2.8 5.2 2.2 2.1 3.4 2.7 4.5 1.3
Public administration, social and personal services
2.6 2.8 2.1 1.9 3.3 3.0 2.6 3.3 2.4
Notes : Figures are subject to revision later on as more data become available.
(a) The GDP figures shown in this table are compiled from the production approach, in parallel with those shown in Table 1.1 which are compiled from the expenditure approach. For details, see Note (1) to this chapter.
(b) In the context of value-added contribution to GDP, the services sectors include ownership of premises as well, which is analytically a service activity.
(c) Accommodation services cover hotels, guesthouses, boarding houses and other establishments providing short-term accommodation.
(*) Change within ±0.05%.

17
1.15 The services sector is the mainstay of the Hong Kong economy, accounting for 92.6% of GDP in 2015 and providing 88.3% of total employment in the first three quarters of 2016. Given the Mainland’s further opening-up and deepening reforms and its continued rebalancing of the economy to services and consumption, Hong Kong’s services sector should be able to leverage on our competitive strengths to contribute to the nation’s economic development. Moreover, the promising market potential of Asian and other emerging economies along the Belt and Road, with vast population and ever-growing purchasing power, will also provide significant opportunities. Hong Kong will continue to keep up its leading position as an international financial and business hub, by consolidating the strength of the traditional pillar industries, developing new industries with growth potential, encouraging innovation and technology, and investing heavily in education, training and infrastructure to nurture talents and improve connectivity. It is worth noting that the proportion of the local workforce with tertiary education attainment increased steadily from 33.4% in 2011 to 38.0% in 2016.
Manufacturing1.2%
Construction4.7%
Import/export, wholesale and retail trades
22.7%
Accommodation and food services
3.4%
Transportation, storage, postal and
courier services6.5% Information and
communications3.5%
Financing and insurance, real estate,
professional and business services
28.5%
Public administration, social and personal services
17.5%
Others12.2% Manufacturing
2.6%
Construction8.6%
Import/export trade and wholesale
14.7%
Retail trade8.4%
Accommodation and food services
7.2% Transportation, storage, postal and
courier services8.2%
Information and communications
2.9%
Financing and insurance, real estate,
professional and business services
20.2%Public administration,
social and personal services26.8%
Others0.5%
Diagram 1.5 : The services sector remains the key driver of the economy
GDP by economic activity2015
Total employment *2016 Q1-Q3
Figures refer to the Composite Employment Estimates, which are compiled based on results of the General Household Survey and the Quarterly Survey of Employment and Vacancies. Figures for 2016 are averages for the first three quarters of the year.
Note : (*)

18
Other economic developments 1.16 The Hong Kong economy faced considerable challenges on both external and domestic fronts in 2016. In anticipation of an unsteady global economic environment, the Government introduced a package of relief measures amounting to some $39 billion in the 2016-17 Budget, which help alleviate the financial burden of the public, stimulate local consumption, preserve economic stability and safeguard employment. 1.17 The Government attaches great importance to sustain macroeconomic stability and promote economic development. On economic integration with the Mainland, the National 13th Five-Year Plan was promulgated officially in March 2016. A chapter continues to be dedicated to Hong Kong and Macao (the Dedicated Chapter), acknowledging their significant functions and positioning in the national development. The Dedicated Chapter expressed clear support for Hong Kong in consolidating and enhancing our status as international financial, transportation and trade centres, and in participating in our country’s two-way opening up and in Belt and Road Initiative. In September 2016, the 19th Plenary of Hong Kong/Guangdong Co-operation Joint Conference was held, in which both sides exchanged views on areas where Hong Kong-Guangdong co-operation could be strengthened as set out in the Dedicated Chapter. 1.18 The Government continued to strengthen and broaden economic ties with overseas markets. Hong Kong signed comprehensive agreements for the avoidance of double taxation with Russia and Latvia in January and April 2016 respectively. In May 2016, the Government signed a Memorandum of Understanding (MoU) pledging mutual co-operation on investment promotion exchanges and best practices with Indonesia. Moreover, investment agreement with Canada entered into force in September 2016, and investment agreement with Chile was signed in November 2016 to increase confidence of investors and expand investment flows. 1.19 The Belt and Road Initiative offers huge opportunities to Hong Kong given the vast market potential of the economies it covers. In July 2016, the Hong Kong Monetary Authority launched the Infrastructure Financing Facilitation Office to promote development of Hong Kong as an infrastructure financing hub, helping facilitate investment in infrastructure projects in countries along the Belt and Road. A Belt and Road Office was established in August 2016 to capitalise on the opportunities brought to Hong Kong and liaise with government departments and various sectors of the community.
19
1.20 On deepening financial linkages with the Mainland, under the support of the Central Government, the Shenzhen-Hong Kong Stock Connect was officially launched in December 2016 with no aggregate quota. The Shanghai-Hong Kong Stock Connect was also enhanced through the abolishment of the aggregate quota in August 2016. These initiatives reinforced Hong Kong’s position as an international financial centre and a premier RMB offshore hub, and deepened mutual access of capital markets in Hong Kong and the Mainland. 1.21 On innovation and technology, a MoU with Austria was signed to strengthen bilateral co-operation in technology start-up ecosystems in May 2016. To stimulate private investments in local innovation and technology start-ups and to increase deal flows, the Government announced in July 2016 to launch a HK$2 billion Innovation and Technology Venture Fund (ITVF). The ITVF should help fill the funding gap encountered by local start-ups in the growth stage. In January 2017, a MoU with Shenzhen was signed on development of a Hong Kong/Shenzhen Innovation and Technology Park in the Lok Ma Chau Loop in Hong Kong. 1.22 Hong Kong’s institutional strength continues to be well recognised, ranking as the world’s freest economy by the Heritage Foundation for 22 years in a row. Also, Hong Kong was ranked as the world’s most competitive economy by the International Institute for Management Development World Competitiveness Yearbook 2016, moving up from the second place in the preceding year. Moreover, Hong Kong’s ranking by the World Bank in ease of doing business also rose one place to the fourth position, a recognition of our continuous efforts in enhancing the business-friendly environment. Separately, according to the United Nations Conference on Trade and Development World Investment Report 2016, Hong Kong was ranked the world’s second largest recipient of foreign direct investment flows, the second year in a row, reflecting our prominent position as an international business hub. 1.23 To forestall a further build-up in housing market bubble risks, the Government introduced a new round of demand-side management measure in November 2016, while continuing its efforts in increasing land supply. The measure was necessary to safeguard macroeconomic and financial sector stability. Along with the US interest rate hike in December 2016, the property market cooled off visibly towards the end of the year. 1.24 The Chief Executive delivered the 2017 Policy Address on 18 January 2017, outlining plan to develop the economy and improve people’s livelihood. The more salient points are highlighted below.

20
On economic development, the Government will make the best use of
opportunities rendered by the National 13th Five-Year Plan and the Belt and Road Initiative. The Government is exploring further with the Mainland the expansion and enhancement of the Mainland and Hong Kong Closer Economic Partnership Arrangement (CEPA) in the areas of investment, economic and technical co-operation, etc. and will seize new opportunities through Guangdong-Hong Kong-Macao co-operation platform.
On financial development, the Government will actively consider the
recommendations by the Financial Services Development Council, and take forward the feasible measures. The Government will also strive to complete by mid-2017 the procedures for Hong Kong to join the Asian Infrastructure Investment Bank, while taking advantage of the demand arising from the Belt and Road Initiative and the Mainland-Hong Kong Mutual Recognition of Funds Arrangement to further expand Hong Kong’s RMB business.
On innovation and technology, the Government will continue its efforts in promoting re-industrialisation, encouraging universities to conduct impactful and translational research projects to meet Hong Kong’s needs, and supporting start-ups. Apart from supply of hardware, the Government will consider policy support measures such as offering tax and financial concessions to attract innovation and technology enterprises from Hong Kong, the Mainland and overseas.
On housing, the Government will continue to adopt a multi-pronged approach to increase land and housing supply, in the short-, medium- and long-term.
A raft of measures to help the elderly, enhance retirement protection and improve healthcare services are announced, while the support to education and youth development will continue. The Old Age Living Allowance scheme and the Elderly Health Care Vouchers will be enhanced. Moreover, the Government proposed to progressively abolish the “offsetting” of severance payments or long service payments with Mandatory Provident Fund contributions. Additional recurrent funding will be provided to the Hospital Authority in 2017-18 to meet increasing service demand.
21
Notes : (1) The Gross Domestic Product (GDP) is an overall measure of net output produced
within an economy in a specified period, such as a calendar year or a quarter, before deducting the consumption of fixed capital. In accordance with the expenditure approach to its estimation, GDP is compiled as total final expenditures on goods and services (including private consumption expenditure, government consumption expenditure, gross domestic fixed capital formation, changes in inventories, and exports of goods and services), less imports of goods and services.
(2) The seasonally adjusted quarter-to-quarter GDP series, by removing the variations that
occur at about the same time and in about the same magnitude each year, provides another perspective for discerning the trend, particularly in regard to turning points. A detailed examination reveals the presence of seasonality in the overall GDP and in some of its main components, including private consumption expenditure, government consumption expenditure, exports of goods, imports of goods, exports of services, and imports of services. However, due to the presence of considerable short-term fluctuations, no clear seasonal pattern is found in gross domestic fixed capital formation. Therefore, the seasonally adjusted series of GDP is compiled separately at the overall level, rather than summing up from its main components.

22
CHAPTER 2 : ECONOMIC OUTLOOK FOR 2017 AND THE MEDIUM TERM
Summary
• In 2016, global economic growth was the weakest since the global financial crisis, yet it showed some encouraging signs of improvement in the latter half of the year. International organisations generally expect a moderate recovery of global economic growth in 2017, with the US economy gathering further momentum and the Mainland economy maintaining solid growth. With the rebound of major commodity prices, some commodity-exporting emerging market economies, including Russia and Brazil, should also see better prospects this year.
• Uncertainties, however, still abound, particularly those related to political events are apparently rising. First, while recent indicators for the US economy have remained relatively strong, any protectionist policy that might be adopted by the new US administration would pose an inevitable threat to global trade and economic growth, hitting Asia in particular. Second, economic growth in Europe could be hindered not only by the lingering structural issues but also by various political risks, including Brexit-related developments and the upcoming general elections in several major European economies. Third, the risks of renewed global financial volatility are still notable, given the uncertain pace of interest rate normalisation in the US, increasing monetary policy divergence among major central banks, and other fluid economic and political developments. Emerging market economies relying on external financing would likely be more vulnerable to a tightening of global financial conditions and swings in exchange rate movements. Heightened geopolitical pressures and the possible rise in protectionist sentiment are also causes for concern.
• Barring abrupt negative shocks to the global economic, financial and
trading environment, the Hong Kong economy should stage some relative pick-up in 2017, after the weak growth last year. The externally-oriented sectors are poised to benefit from improving trade and investment flows if global economic growth can indeed gain more traction in 2017. As for exports of services, the recent rebounds in visitor arrivals and in regional trade flows should help pave the way for a recovery this year. Moreover, the solid growth of the Mainland economy will also lend support to cross-border financing and fund-raising activities.

23
• Domestic demand should stay resilient this year, as private consumption expenditure is likely to see further growth on the back of a stable labour market and improving household income conditions. On the other hand, investment will still be rather volatile, given the lingering uncertainties in the external environment. In particular, if the US interest rate upcycle proceeds at a faster pace than expected, the resultant asset market fluctuations could swing economic sentiment. Nevertheless, building and construction works are expected to expand further, rendering some support to overall investment.
• Barring any significant external shocks which would derail the current
recovery of global trade, the Hong Kong economy is projected to grow by 2-3% in 2017, representing a relative improvement from the 1.9% growth in 2016, though may still be a notch lower than the average annual growth of 2.9% achieved in the past ten years.
• On inflation, consumer price pressures will likely stay moderate this year.
Imported inflation is expected to remain contained at least in the near term, as inflation in Hong Kong’s major import sources stays modest and the US dollar remains strong. Locally, the moderate economic growth and the gradual feed-through of softer rentals in earlier periods should continue to keep cost pressures at bay. Overall, the underlying Composite Consumer Price Index (CPI) is forecast to increase by an average of 2% in 2017, down slightly from 2.3% in 2016.
• The medium-term outlook for the Hong Kong economy remains positive. However, many advanced economies are facing structural, demographic and political challenges, which will inevitably limit their future growth. This underscores the importance of enhancing economic co-operation with the Mainland and economies along the Belt and Road. Hong Kong is well positioned to leverage on the opportunities arising from the eastward shift of the world’s economic centre of gravity. The Government will continue to invest in education, training and infrastructure to raise Hong Kong’s productivity and growth potential. This will help meet the challenge from population ageing, as the size of our labour force is expected to peak in 2018. The trend GDP growth rate in real terms is forecast at 3% per annum from 2018 to 2021. The trend rate of underlying consumer price inflation is forecast at 2.5% per annum.
24
Major external developments 2.1 The global economy has returned to a modest expansion path after experiencing a disappointing performance in the first quarter of 2016, characterised by faltering trade flows and heightened financial volatility amid concerns about the global economic outlook and the monetary policy directions in major economies. With the US economy steadily regaining momentum after the first quarter and the Mainland economy continuing its solid expansion, the external environment soon stabilised and gradually improved in the subsequent quarters. Regional trade flows also showed some improvements in tandem. If these positive trends continue into 2017, global economic activity should hopefully pick up further, rendering a firmer support to international trade and investment flows. As an open economy and an international trading and business hub, Hong Kong stands to benefit from such a development. 2.2 Several key external uncertainties, however, still warrant close monitoring, as they could significantly alter the global economic outlook in the near term. These include the economic policy directions of the new US administration and their impacts on the US economic and interest rate outlook; risks related to Brexit and the general elections in several major European economies; and increasing monetary policy divergence among major central banks amid the uneven recovery in the advanced economies and the US interest rate upcycle. Elevated geopolitical tensions and possible changes in the political situations around the world could also give rise to an increase in protectionist and anti-trade sentiments. How these economic and political events will unfold is still subject to an exceptionally large degree of uncertainty at the present juncture. Any abrupt unfavourable turn could dent global economic sentiment and disrupt the current momentum of the global economy.

25
Global economic outlook 2.3 The US economy has picked up gradually after hitting a soft patch in the beginning months of 2016. On the back of solid consumption growth and improving labour market conditions, the Federal Reserve (Fed), after some repeated delays, raised interest rates in December 2016, the second increase since it kick-started the interest rate upcycle in December 2015. While recent indicators have generally pointed to a more sanguine outlook for the US economy in 2017, the lack of details about the new administration’s economic policy agenda has created much uncertainty. The expected increase in infrastructure spending, if materialised, would help support a faster expansion of economic activity, thereby possibly quickening the pace of interest rate normalisation. However, the lack of sufficient clarity regarding its other economic policies, particularly on the trade front, remains a primary concern. Any significant changes in fiscal, trade and other economic policies in the US, the largest economy in the world, would inevitably carry notable ramifications for global trade, investment and financial flows. 2.4 The EU economy maintained modest growth in 2016. Although the contagion effects of Brexit generally have been contained so far, the event, including the uncertainties relating to the future negotiations between the UK and the EU, continues to cast a shadow over the outlook for the region in 2017. In Italy, the health of its banking system is also a concern. Deep-seated structural issues in some member states of the euro area, including the overhang of private and public debts, unsustainable fiscal positions and market rigidities, are yet to be resolved and will remain a key drag on the region’s economic recovery. Moreover, on the political side, general elections will be held in several major European economies this year, constituting another prominent source of uncertainty. The outcomes of these elections could have significant consequences for the political and economic developments in the EU. Other non-economic factors, including heightened geopolitical tensions in Eastern Europe and the Middle East, the influx of refugees and the threats of terrorist attacks, could also dampen the region’s growth. The European Central Bank (ECB) may be inclined to keep a highly accommodative monetary policy stance this year, given the still-low inflation and all these uncertain developments.

26
2.5 Japan’s economic performance remained weak in 2016, although its growth momentum picked up slightly in the latter part of the year. In the face of the fragile economic situation, the sales tax hike was further postponed from 2017 to 2019 and a new fiscal stimulus package was launched. In addition, the Bank of Japan (BOJ) introduced a new monetary policy framework to fend off deflation risks, but the effectiveness is yet to be seen. The challenges from such structural issues as market rigidities, elevated debt levels and an ageing population are persisting despite the Japanese government’s efforts to initiate structural reforms. Against this background, Japan’s economic growth is likely to remain modest in 2017. 2.6 Supported mainly by the expected strengthening of the US economy, the advanced economies as a whole should see some improvement in growth prospects, provided that the more acute risks associated with Brexit and other political and geopolitical developments do not materialise. The International Monetary Fund (IMF) in January 2017 projected the advanced economies as a whole to grow by 1.9% in 2017, representing a slight pick-up from the 1.6% growth in 2016. 2.7 Emerging market economies as a whole has displayed a more resilient performance recently. The downturns of Russia and Brazil, the two major emerging market economies, showed signs of bottoming out over the course of 2016, partly helped by the rebound of international commodity and energy prices. Meanwhile, Asian emerging market economies remained the key driving force of the global economy, underpinned by solid domestic demand expansion and relatively sound economic fundamentals. Barring any significant financial market disruptions and sizeable reversals in capital flows, emerging market economies should continue to expand steadily this year. Moreover, if the recovery of import demand in the advanced economies gathers further pace, it will bolster Asia’s production and trading activities going forward. Still, the potential negative repercussions on export-dependent economies arising from the possible rise in protectionism and shifts towards more inward-looking trade policies need to be closely watched. According to the IMF’s latest projections, emerging market and developing economies as a whole would grow by 4.5% this year, up from 4.1% in 2016. Within this, emerging and developing Asia was projected to grow even more notably by 6.4% in 2017, compared to the 6.3% expansion in 2016.
27
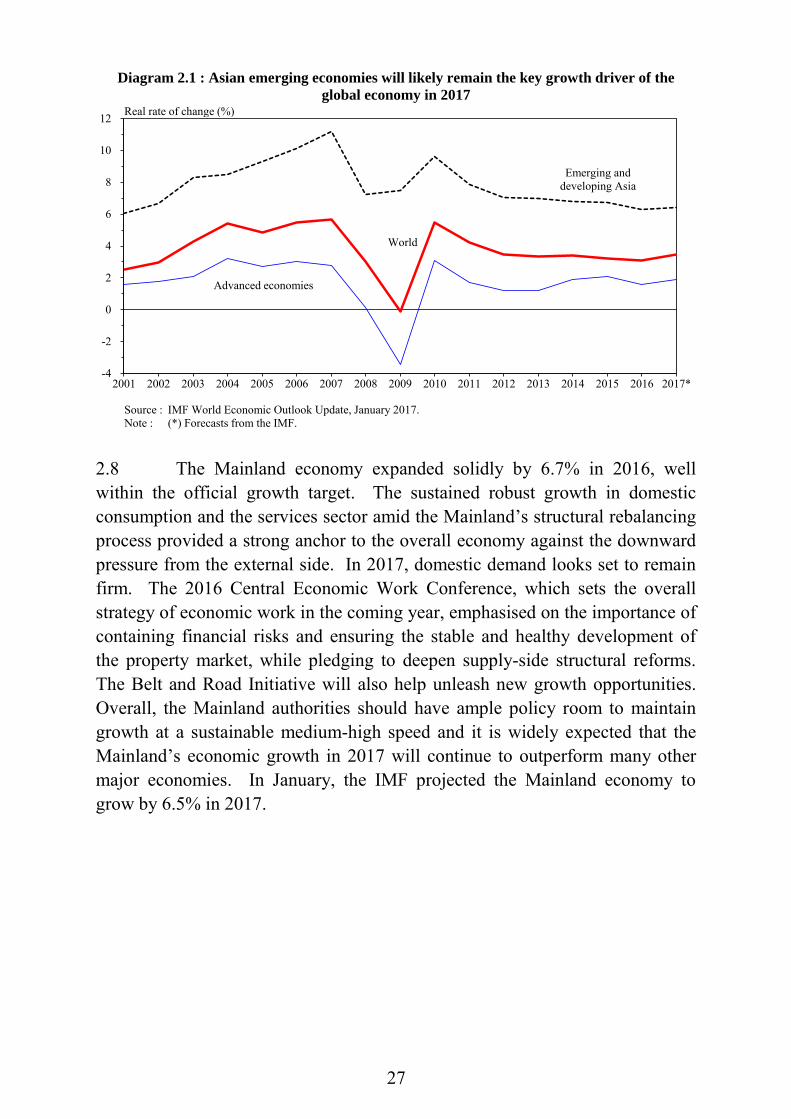
2.8 The Mainland economy expanded solidly by 6.7% in 2016, well within the official growth target. The sustained robust growth in domestic consumption and the services sector amid the Mainland’s structural rebalancing process provided a strong anchor to the overall economy against the downward pressure from the external side. In 2017, domestic demand looks set to remain firm. The 2016 Central Economic Work Conference, which sets the overall strategy of economic work in the coming year, emphasised on the importance of containing financial risks and ensuring the stable and healthy development of the property market, while pledging to deepen supply-side structural reforms. The Belt and Road Initiative will also help unleash new growth opportunities. Overall, the Mainland authorities should have ample policy room to maintain growth at a sustainable medium-high speed and it is widely expected that the Mainland’s economic growth in 2017 will continue to outperform many other major economies. In January, the IMF projected the Mainland economy to grow by 6.5% in 2017.
-4
-2
0
2
4
6
8
10
12
2001 2002 2003 2004 2005 2006 2007 2008 2009 2010 2011 2012 2013 2014 2015 2016 2017*
World
Source : Note :
Advanced economies
Emerging and developing Asia
Diagram 2.1 : Asian emerging economies will likely remain the key growth driver of the global economy in 2017
Real rate of change (%)
IMF World Economic Outlook Update, January 2017.(*) Forecasts from the IMF.
28
2.9 Overall, the IMF in January projected that the global economy would expand by 3.4% in 2017, after the weak 3.1% growth in 2016, with the support primarily coming from emerging market and developing economies. The moderate recovery in global economic growth from its post-crisis low in 2016 was based on certain benign assumptions, including some near-term fiscal stimulus in the US, a less gradual monetary policy normalisation process by the Fed without causing a sharper-than-expected tightening in global financial conditions, and a firming of oil prices. Given the uncertainty associated with the policy stance of the new US administration and its global ramifications, the IMF also pointed out the wide dispersion of possible outcomes regarding its projections. While the IMF deemed that the balance of risks are skewed towards the downside, particularly those related to a possible shift toward more inward-looking policies and protectionism amid fraying consensus about the benefits of cross-border economic integration, and secular stagnation in advanced economies, there could also be upsides to global activity should there be larger-than-projected policy stimulus in the US and the Mainland.
Table 2.1 : Growth forecasts for major economies in 2017
2016*
(%)
2017
IMF*
(%)
Private sector forecast^
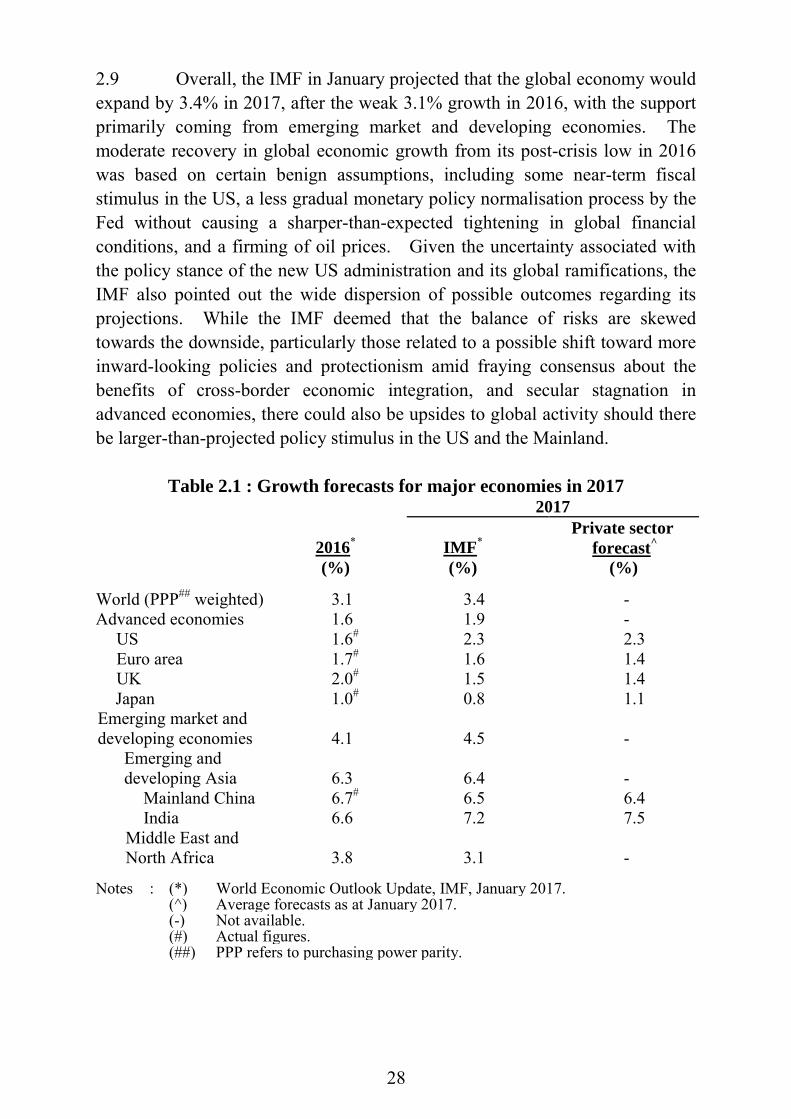
(%) World (PPP## weighted) 3.1 3.4 - Advanced economies 1.6 1.9 -
US 1.6# 2.3 2.3 Euro area 1.7# 1.6 1.4 UK 2.0# 1.5 1.4
Japan 1.0# 0.8 1.1 Emerging market and developing economies
4.1 4.5 -
Emerging and developing Asia 6.3 6.4 -
Mainland China 6.7# 6.5 6.4 India 6.6 7.2 7.5
Middle East and North Africa
3.8
3.1
-
Notes : (*) World Economic Outlook Update, IMF, January 2017. (^) Average forecasts as at January 2017. (-) Not available. (#) Actual figures. (##) PPP refers to purchasing power parity.

29
Box 2.1
US fiscal policy developments after the Great Recession of 2009
US fiscal landscape has undergone significant changes over the past decade, reflecting the far-reaching impacts of the Great Recession during 2008 and 2009 and the ensuing efforts to fix the public finance. Moreover, the influences of demographic shifts in the US will likely become increasingly visible in the longer term. This article reviews the changes in US federal fiscal balance and debt position after 2008, and analyses their possible implications for the US economy.
In late 2008 and 2009, the US economy suffered the worst recession since the Great Depression, with millions of people losing their jobs. To avert the economic crisis, bold fiscal packages were rolled out, with attendant surge in discretionary spending. Unemployment benefits also rose in tandem with the marked deterioration in the US labour market. Over the same period, government revenue dropped amid economic contraction, and tax cuts exacerbated the declines. Consequently, federal fiscal deficit leapt to 9.8% of GDP in Fiscal Year (FY) 2009(1), the highest in the post-Second World War era (Chart 1). The deficit continued to hover above 8% in the subsequent two years, despite some recovery of the US economy during the period.
The high fiscal deficits resulted in a notable jump in the US government debt. By end-FY2011, federal debt held by the public(2) reached US$10.1 trillion, amounting to 66% of GDP and representing the double of the debt level at end-FY2007.
Persistently high fiscal deficit and ballooning government debt aroused concern, triggering intensive debate about how to contain it in the US Congress. Yet, the road to action was bumpy, as the Republican lawmakers then controlled the House of Representative only, while the Senate was led by the Democrats. The two parties had very divergent stances on the deficit reduction strategy and wider fiscal reform issues. The confrontation between the two parties had heightened market concerns, cumulating in a downgrade on US sovereign credit
Chart 1: Federal fiscal deficit surged after the outbreak of Global Financial Crisis
Note: (*) Deficit is inverted in scale for easier comprehension. Source: Congressional Budget Office.
(1) Federal budget related statistics are compiled on a fiscal year basis, referring to the period from 1 October to
30 September, unless otherwise specified. Fiscal year 2009 refers to 1 October 2008 to 30 September 2009. (2) Federal debt held by the public is made up of public debt securities issued by the US Treasury and a small
amount of securities issued by government agencies, excluding the portion of the debt that is held by the government accounts.
0
20
40
60
80
100
120
-10.0
-5.0
0.0
5.0
10.0
15.0
20.0
25.0
30.0
1940
1942
1944
1946
1948
1950
1952
1954
1956
1958
1960
1962
1964
1966
1968
1970
1972
1974
1976
1978
1980
1982
1984
1986
1988
1990
1992
1994
1996
1998
2000
2002
2004
2006
2008
2010
2012
2014
2016
% of GDP% of GDP
Federal fiscal deficit (-ve) or surplus (+ve) * (LHS)
Federal debt held by the public (RHS)
0
-30
-25
-20
-10
-5
10
5
-15

30
Box 2.1 (Cont’d) rating by Standard and Poor’s in 2011 and global financial market turbulence. In the end, the fiscal issues were temporarily resolved by sequestration, which set caps on government spending and additional reductions to reduce fiscal deficit over US$1 trillion in ten years.
The targeted reduction in discretionary government spending mandated by sequestration was rather visible, resulting in a corresponding fall of US$84 billion in FY2013. Moreover, some of the Bush era tax cuts were no longer extended. Together with some revival in government revenue amid continued US economic expansion, the federal fiscal deficit shrank distinctly, to 4.1% of GDP in FY2013 and further to 2.8% and 2.4% respectively in FY2014 and FY2015, before rising slightly to 3.2% in FY2016.
While the fiscal deficit fell to a level closer to the average picture between 2002 and 2007, the debt position facing the federal government was radically different. With continued deficit and moderate economic growth, federal debt held by the public increased further, albeit at a moderated pace, reaching 77% of GDP by the end of FY2016. In the past few years, the net interest outlay did not rise, as the aggressive unconventional monetary policy has pressed Treasury bond yield to extra-ordinarily low level. The US 10-year Treasury Notes yield stood at a low level of around 2% in 2016, much less than that of around 4% in 2007. But if US interest rate normalisation continues, the interest payment burden by the federal government will rise.
The long-term budget outlook also looks less sanguine than a decade ago given the gradual shift in demographic structure. As population ages, the ensuing rises in health care and social security spending would contribute to an increase in fiscal deficit over time. According to Congressional Budget Office’s (CBO) Budget and Economic Outlook Report released in January 2017, even assuming that current laws governing taxes and spending generally remaining unchanged, the federal fiscal deficit was projected to increase to 4.5% of GDP in FY2025, and the federal debt held by the public is estimated to rise to over 80% of GDP in end-FY2022.
Recent changes in US political situation have put US fiscal policy in the coming years in the market spotlight. In particular, the newly-elected US president has advocated for radical tax cuts and massive infrastructure investment plan to bolster the US economy. With Republican lawmakers controlling both the House and Senates in Congress, a smoother legislative process in support of the Republican president is now possible in the period ahead. In addition, there are worries that financial risks could become more threatening the longer the unconventional monetary easing measures are extended, thereby justifying the shift to the use of fiscal policy tools to boost economic growth.
Fiscal stimuli, if finally rolled out, would bring support to US economic growth, despite the fact that fiscal stimulus could have implementation time lag. However, there are still considerable uncertainties about US fiscal policy and its possible impacts on the US economy. Obviously, it will depend on the scale and duration of the fiscal stimuli. The US government would have to strike a balance between stimulating the US economy while taking account of the long-term fiscal sustainability, particularly in light of the likely increases in government spending in social security and health care in the period ahead and the relatively high US federal government debt. The legislative process in Congress could still be bumpy and lengthy, especially when touching on wider fiscal reform matters.
31
Box 2.1 (Cont’d) The effects of US fiscal policy on US economic growth would also depend on the monetary policy response. As the minutes of the Federal Open Market Committee meeting in December 2016 rightly pointed out, fiscal stimuli might raise aggregate demand above sustainable level, necessitating a faster rate hike pace. In this scenario, a tighter monetary policy would in turn offset the positive impacts of fiscal stimuli on US economic growth.
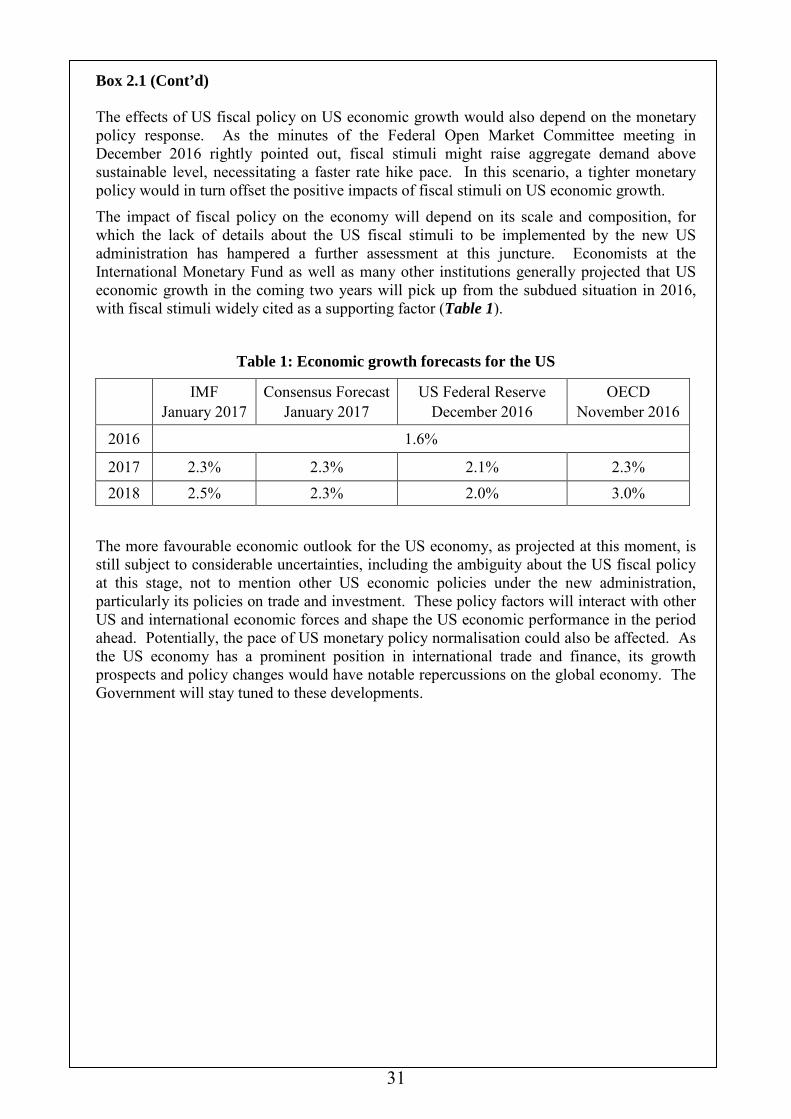
The impact of fiscal policy on the economy will depend on its scale and composition, for which the lack of details about the US fiscal stimuli to be implemented by the new US administration has hampered a further assessment at this juncture. Economists at the International Monetary Fund as well as many other institutions generally projected that US economic growth in the coming two years will pick up from the subdued situation in 2016, with fiscal stimuli widely cited as a supporting factor (Table 1).
Table 1: Economic growth forecasts for the US
IMF January 2017
Consensus Forecast January 2017
US Federal Reserve December 2016
OECD November 2016
2016 1.6%
2017 2.3% 2.3% 2.1% 2.3% 2018 2.5% 2.3% 2.0% 3.0%
The more favourable economic outlook for the US economy, as projected at this moment, is still subject to considerable uncertainties, including the ambiguity about the US fiscal policy at this stage, not to mention other US economic policies under the new administration, particularly its policies on trade and investment. These policy factors will interact with other US and international economic forces and shape the US economic performance in the period ahead. Potentially, the pace of US monetary policy normalisation could also be affected. As the US economy has a prominent position in international trade and finance, its growth prospects and policy changes would have notable repercussions on the global economy. The Government will stay tuned to these developments.
32
Box 2.2
Economic performance of the Mainland in 2016 Given its close economic ties with Hong Kong, the Mainland’s economic development is highly important to our economy. This article briefly reviews the Mainland’s macroeconomic performance in 2016, and some salient developments in its structural reform over the year.
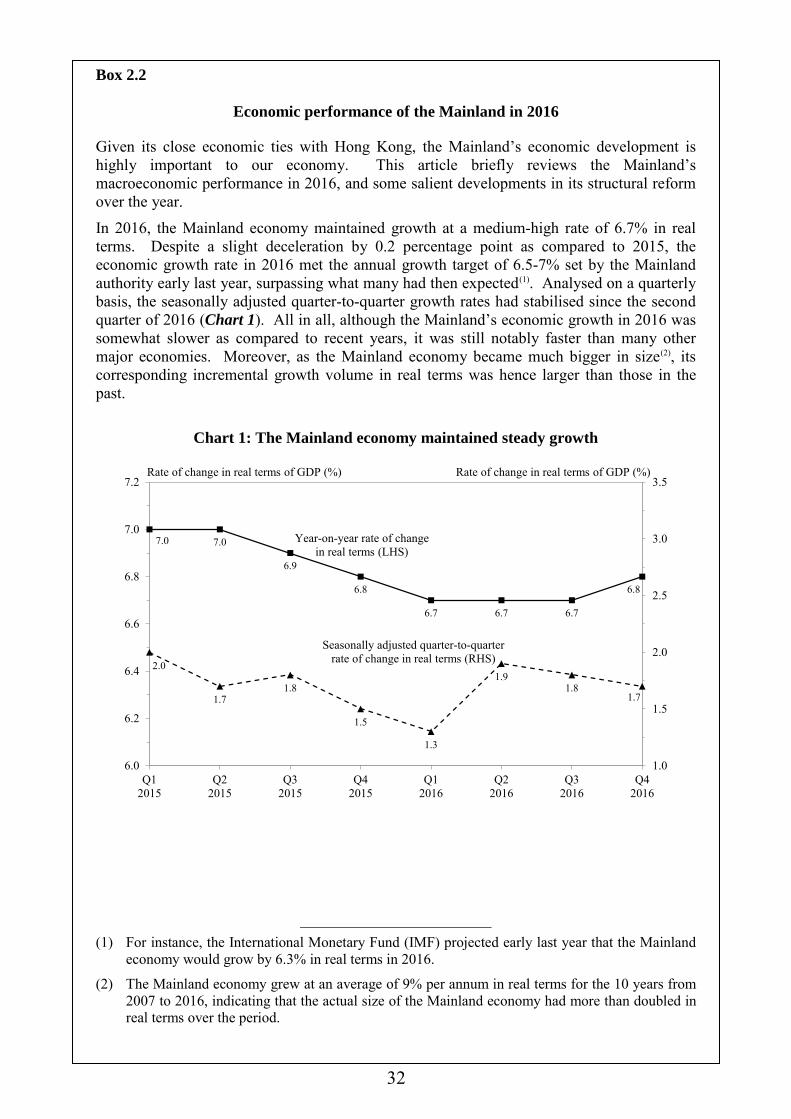
In 2016, the Mainland economy maintained growth at a medium-high rate of 6.7% in real terms. Despite a slight deceleration by 0.2 percentage point as compared to 2015, the economic growth rate in 2016 met the annual growth target of 6.5-7% set by the Mainland authority early last year, surpassing what many had then expected(1). Analysed on a quarterly basis, the seasonally adjusted quarter-to-quarter growth rates had stabilised since the second quarter of 2016 (Chart 1). All in all, although the Mainland’s economic growth in 2016 was somewhat slower as compared to recent years, it was still notably faster than many other major economies. Moreover, as the Mainland economy became much bigger in size(2), its corresponding incremental growth volume in real terms was hence larger than those in the past.
Chart 1: The Mainland economy maintained steady growth
(1) For instance, the International Monetary Fund (IMF) projected early last year that the Mainland
economy would grow by 6.3% in real terms in 2016.
(2) The Mainland economy grew at an average of 9% per annum in real terms for the 10 years from 2007 to 2016, indicating that the actual size of the Mainland economy had more than doubled in real terms over the period.
7.0 7.0
6.9
6.8
6.7 6.7 6.7
6.8
2.0
1.71.8
1.5
1.3
1.91.8
1.7
1.0
1.5
2.0
2.5
3.0
3.5
6.0
6.2
6.4
6.6
6.8
7.0
7.2
Q12015
Q22015
Q32015
Q42015
Q12016
Q22016
Q32016
Q42016
Year-on-year rate of change in real terms (LHS)
Seasonally adjusted quarter-to-quarter rate of change in real terms (RHS)
Rate of change in real terms of GDP (%) Rate of change in real terms of GDP (%)
33
Box 2.2 (Cont’d) Important structural changes in the Mainland economy were evidenced by the diverse developments in different economic segments. On the front of retail sales, the consumption demand in the Mainland remained resilient. Total retail sales of consumer goods recorded a real growth of 9.6% last year, slightly lower than that of 2015 but exceeding the overall economic growth rate notably. This shows that the overall economy of the Mainland was underpinned by the sustained resilience of its domestic demand. The enhanced role of consumption in economic growth also tied in with the Mainland’s broad direction of enhancing its economic structure (see below for details).
On investment, affected by factors such as excess capacity in some traditional industries and high inventory in property markets outside the first- and second-tier cities, investment in fixed assets increased by 8.8% in real terms last year, decelerated from the 12.0% increase in 2015. Nevertheless, investment in infrastructure continued to grow at a faster pace. The growth of investment was particularly notable in such industries as “management of water conservancy, environment and public facilities”, “education”, “health and social work” and “culture, sports and entertainment”. All these contributed to the further enhancement of the long-term economic development potential of various Mainland regions.
Relatively speaking, external demand remained weak, imposing greater downward pressure on the Mainland’s external sector in 2016. Total goods exports in US dollar terms declined by 7.7%, a drop widened by 4.8 percentage points as compared with that in 2015. Export performance, however, stabilised in the late months of last year. Total goods exports in the fourth quarter of 2016 declined year-on-year by 5.2%, slightly narrower than the 8.6% drop in the first three quarters, indicating that the relevant downward pressure had eased slightly(3). In fact, a similar trend was observed in the total value of goods re-exported through Hong Kong from the Mainland, which registered a 0.8% year-on-year increase in the fourth quarter of 2016, a reverse from the 5.1% year-on-year decline in the first three quarters.
While maintaining a medium-high growth pace, the Mainland economy continued with its structural transformation and enhancement, and progressed steadily towards a development model based on domestic consumption and services, driven by innovation and technological upgrading. First of all, the role played by consumption in economic growth became more prominent. In 2016, the contribution of final consumption expenditure to GDP growth was 64.6%, 4.7 percentage points higher than that in 2015. The services industry also played a more vital role in the Mainland’s economic development. The value added of the tertiary industry accounted for 51.6% of GDP in 2016, 1.4 percentage points higher as compared with last year( 4 ) (Chart 2). The tertiary industry grew by 7.8% in 2016, a rate faster than the overall economic growth. Moreover, the Mainland’s industrial sector was moving towards high-tech-oriented development in 2016. The value added of the high-tech industry grew by 10.8% in real terms, 0.6 percentage point faster than in 2015 and visibly higher than the 6.0% real growth of the total value added of the industrial enterprises above the designated size over the same period. This indicated a development trend of industrial upgrading and transformation with more emphasis on technological enhancement. Investment relating to the high-tech industry also maintained double-digit growth last year, a sign of continuous improvement of investment structure conducive to the further upgrading of production technology.
(3) When denominated in Renminbi (RMB), the Mainland’s exports even recorded year-on-year
growth in certain late months of 2016. The exports in November, for example, increased year-on-year by 4.2% in RMB terms.
(4) Almost 12 percentage points higher than the 39.8% growth in 2000.

34
Box 2.2 (Cont’d)
Chart 2: Tertiary industry took up an increasing share of GDP
As for prices, the Mainland’s consumer price inflation remained steady throughout 2016. The Consumer Price Index (CPI) rose modestly, at an average annual rate of 2.0%. Some service components such as health care, education services and housing rental saw faster price increases, an indication of continuous transformation towards a service-based economy. As regards industrial prices, with a marked rise in prices of commodities such as coal and steel due to the cutting of excess capacity by individual sectors, the Producer Price Index for the Industrial Sector reverted to a year-on-year increase since September last year after registering year-on-year declines for 54 consecutive months. The index registered greater increases towards the end of the year, despite an average annual decline of 1.4% for the whole of 2016.
On promoting the supply-side structural reform, the main objectives of the Central Government in 2016 included cutting the excess capacity in certain industries, reducing inventory in the property market, preventing and controlling financial risks, lowering business costs and enhancing effective supply. These initiatives were gradually yielding results. On cutting excess capacity, substantive progress was made in the steel and coal industries, attaining the target set at the beginning of the year. On reducing property market inventory, the floor space of commercial buildings for sale decreased in 2016, while the inventory of residential buildings even recorded a double-digit decline. Besides, relevant authorities including the People’s Bank of China, China Banking Regulatory Commission, China Securities Regulatory Commission and China Insurance Regulatory Commission stepped up prevention and control of financial risks, and further enhanced the risk surveillance and regulatory system on financial institutions. Furthermore, by adopting diversified monetary policy instruments, the People’s Bank of China adjusted the liquidity of the financial markets with greater flexibility and precision. Separately, a market-oriented debt-for-equity swap programme was also implemented to reduce the debt leverage of certain enterprises. These initiatives also began to bear fruit. In 2016, the RMB broad money supply increased by 11.3%, a drop of 2.0 percentage points from 2015, while the increase in the stock of loans of non-financial enterprises also moderated.
44.1% 44.2% 45.3% 46.7% 47.8%50.2%
51.6%
46.4% 46.4% 45.3% 44.0% 43.1% 40.9% 39.8%
9.5% 9.4% 9.4% 9.3% 9.1% 8.8% 8.6%
0%
10%
20%
30%
40%
50%
60%
70%
80%
90%
100%
2010 2011 2012 2013 2014 2015 2016
PrimaryIndustry
SecondaryIndustry
TertiaryIndustry
Share of value added of various industries in GDP
35
Box 2.2 (Cont’d) During the Central Economic Work Conference held in December last year, it was clearly stated that the Mainland government would continue to deepen the supply-side structural reform in 2017 so as to further enhance the Mainland’s economic structure. Besides, in view of the exuberance in the property market of the first- and second-tier cities in the Mainland last year, it was also emphasised in the Conference that stable and healthy development of the property market should be promoted to fend off asset market bubble risks. On the other hand, it was also reiterated that efforts should be made to support the real economy, to raise the quality of economic development and to strengthen core competitiveness. Support was also pledged to foster strategic emerging industries and to upgrade the traditional industries by adopting new technologies.
Looking into 2017, it is expected that the Mainland economy, with the support of solid fundamentals, will continue to attain medium-high speed growth. Although external uncertainties will continue to put pressure on the Mainland’s external sector, the resilient and robust domestic demand will provide significant anchor to the overall economy. Also, there are ample policy room and tools for the relevant Mainland authorities to stabilise economic development. In January 2017, the IMF projected that the Mainland economy would grow by 6.5% this year. With the continuous implementation of the aforementioned initiatives under the supply-side structural reform, the structural transformation and upgrading of the Mainland economy will advance, yielding an economic development with better quality and greater sustainability. Throughout this process, more development opportunities will also be created for various sectors of Hong Kong, to the benefit of its long-term economic development.

36
Monetary conditions 2.10 The global monetary and financial conditions are still subject to notable risks of heightened volatility, as the world economy continues to navigate in uncharted waters. The Fed is poised to proceed further with the US interest rate upcycle in 2017, against the background of the continuation of the exceptionally accommodative monetary policy stances among other major central banks and the looming political uncertainties in some major advanced economies. The Fed raised interest rates in December last year, while both the ECB and the BOJ signalled readiness to roll out additional monetary easing measures to support growth if needed. Monetary policy divergence is expected to persist or even deepen during 2017, and its impact on global monetary conditions and hence the global economy is hard to predict. 2.11 Furthermore, the Fed’s timing and pace of interest rate normalisation, determined by the US economic performance under the new administration, are still uncertain. Any unanticipated move by the Fed to raise interest rates or abrupt changes in the market’s risk sentiment could spark unusually large reactions across international financial markets and possibly accelerate capital outflows from emerging market economies, including those in Asia. Those economies with a large accumulation of dollar-denominated external debts, less resilient financial systems, weaker economic fundamentals and asset bubble risks would be more vulnerable. Therefore, the potential disruptive impacts of a rapidly evolving and complicated global monetary landscape should not be taken lightly. Exchange rates and price competitiveness 2.12 The US dollar rallied strongly against other major currencies since August 2016, as the US regained growth momentum and as the proposed fiscal stimulus under the new US administration raised market expectations for the Fed to further normalise its monetary policy. The appreciations against the Japanese yen and some emerging market currencies were particularly notable. In December 2016, the nominal trade-weighted US dollar index reached a multi-year high, though stabilising somewhat in January 2017. The Hong Kong dollar, which mirrors closely the movements of the US dollar, also strengthened against many other currencies. For 2016 as a whole, the nominal trade-weighted effective exchange rate index of the Hong Kong dollar rose by an average of 3%, after the 6% increase in 2015.
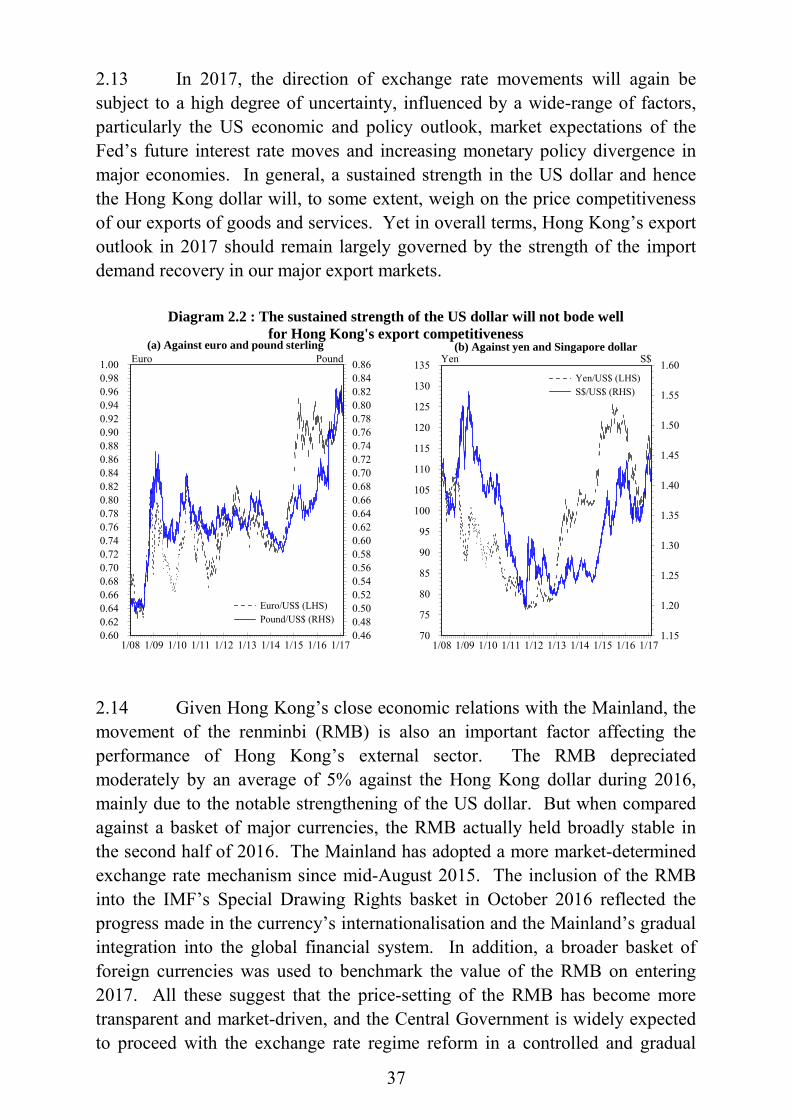
37
2.13 In 2017, the direction of exchange rate movements will again be subject to a high degree of uncertainty, influenced by a wide-range of factors, particularly the US economic and policy outlook, market expectations of the Fed’s future interest rate moves and increasing monetary policy divergence in major economies. In general, a sustained strength in the US dollar and hence the Hong Kong dollar will, to some extent, weigh on the price competitiveness of our exports of goods and services. Yet in overall terms, Hong Kong’s export outlook in 2017 should remain largely governed by the strength of the import demand recovery in our major export markets.
2.14 Given Hong Kong’s close economic relations with the Mainland, the movement of the renminbi (RMB) is also an important factor affecting the performance of Hong Kong’s external sector. The RMB depreciated moderately by an average of 5% against the Hong Kong dollar during 2016, mainly due to the notable strengthening of the US dollar. But when compared against a basket of major currencies, the RMB actually held broadly stable in the second half of 2016. The Mainland has adopted a more market-determined exchange rate mechanism since mid-August 2015. The inclusion of the RMB into the IMF’s Special Drawing Rights basket in October 2016 reflected the progress made in the currency’s internationalisation and the Mainland’s gradual integration into the global financial system. In addition, a broader basket of foreign currencies was used to benchmark the value of the RMB on entering 2017. All these suggest that the price-setting of the RMB has become more transparent and market-driven, and the Central Government is widely expected to proceed with the exchange rate regime reform in a controlled and gradual
0.460.480.500.520.540.560.580.600.620.640.660.680.700.720.740.760.780.800.820.840.86
0.600.620.640.660.680.700.720.740.760.780.800.820.840.860.880.900.920.940.960.981.00
1/08 1/09 1/10 1/11 1/12 1/13 1/14 1/15 1/16 1/17
Euro/US$ (LHS) Pound/US$ (RHS)
1.15
1.20
1.25
1.30
1.35
1.40
1.45
1.50
1.55
1.60
70
75
80
85
90
95
100
105
110
115
120
125
130
135
1/08 1/09 1/10 1/11 1/12 1/13 1/14 1/15 1/16 1/17
Yen/US$ (LHS) S$/US$ (RHS)
Diagram 2.2 : The sustained strength of the US dollar will not bode well for Hong Kong's export competitiveness
(a) Against euro and pound sterling (b) Against yen and Singapore dollarPound S$YenEuro
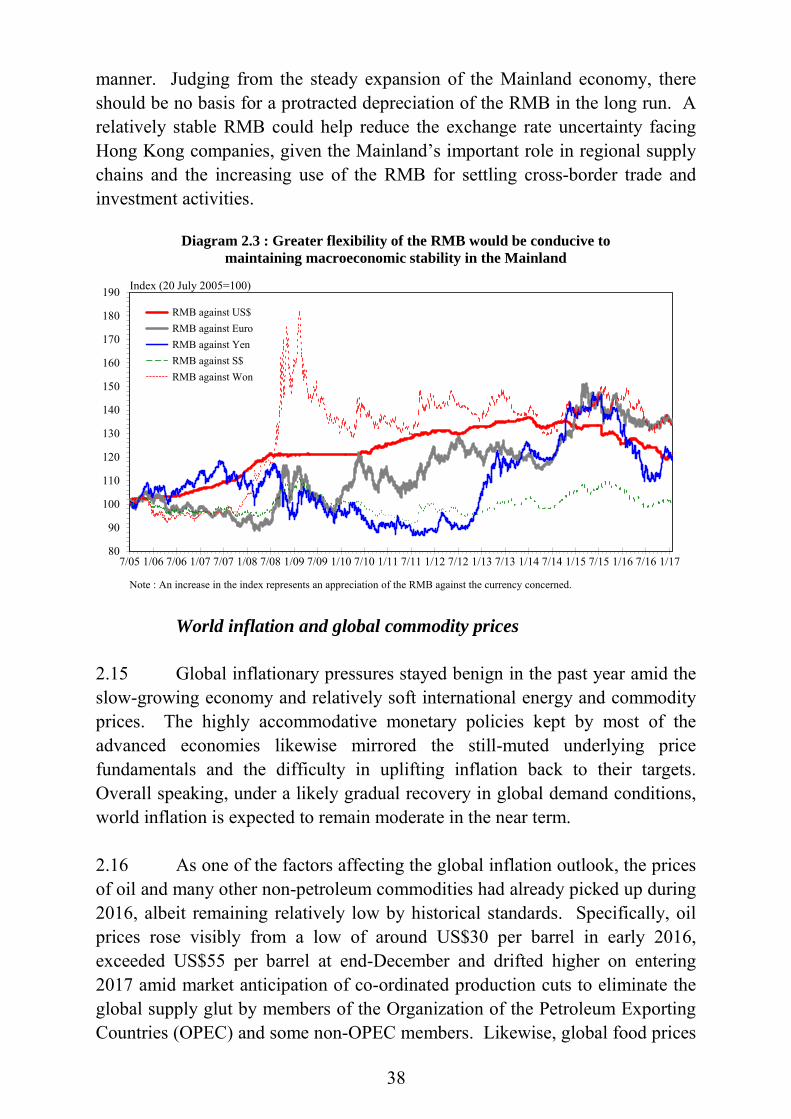
38
manner. Judging from the steady expansion of the Mainland economy, there should be no basis for a protracted depreciation of the RMB in the long run. A relatively stable RMB could help reduce the exchange rate uncertainty facing Hong Kong companies, given the Mainland’s important role in regional supply chains and the increasing use of the RMB for settling cross-border trade and investment activities.
World inflation and global commodity prices 2.15 Global inflationary pressures stayed benign in the past year amid the slow-growing economy and relatively soft international energy and commodity prices. The highly accommodative monetary policies kept by most of the advanced economies likewise mirrored the still-muted underlying price fundamentals and the difficulty in uplifting inflation back to their targets. Overall speaking, under a likely gradual recovery in global demand conditions, world inflation is expected to remain moderate in the near term. 2.16 As one of the factors affecting the global inflation outlook, the prices of oil and many other non-petroleum commodities had already picked up during 2016, albeit remaining relatively low by historical standards. Specifically, oil prices rose visibly from a low of around US$30 per barrel in early 2016, exceeded US$55 per barrel at end-December and drifted higher on entering 2017 amid market anticipation of co-ordinated production cuts to eliminate the global supply glut by members of the Organization of the Petroleum Exporting Countries (OPEC) and some non-OPEC members. Likewise, global food prices
80
90
100
110
120
130
140
150
160
170
180
190
7/05 1/06 7/06 1/07 7/07 1/08 7/08 1/09 7/09 1/10 7/10 1/11 7/11 1/12 7/12 1/13 7/13 1/14 7/14 1/15 7/15 1/16 7/16 1/17
RMB against US$ RMB against Euro RMB against Yen RMB against S$ RMB against Won
Index (20 July 2005=100)
Diagram 2.3 : Greater flexibility of the RMB would be conducive to maintaining macroeconomic stability in the Mainland
Note : An increase in the index represents an appreciation of the RMB against the currency concerned.

39
rose above their year-ago levels in the second half of 2016, partially reversing the notable declines during 2015, according to the Food and Agriculture Organization of the United Nations. Similarly, the prices of many manufacturing-related commodities, such as agricultural raw materials and metals, resumed year-on-year growth in the fourth quarter of 2016. 2.17 While the downward pressures from earlier declines in international energy and commodity prices on headline inflation will gradually diminish if the aforementioned price recovery firms up, the upsides will be counterbalanced by the generally sub-par economic conditions, slow-closing output gaps and still-weak inflation expectations. Indeed, the core inflation rates of many major economies, which exclude the price effects of energy and major commodities, have remained relatively low, notwithstanding some recent pick-up in their headline inflation rates. Also, the movements of international energy and commodity prices could still be volatile amid the various economic and political uncertainties and possible disruptions to the demand-supply situations. Oil prices may come under pressure again if the earlier pledge to cut production by OPEC members and some other oil-producing countries fails to materialise.
20
40
60
80
100
120
140
160
180
200
220
240
260
280
1/03 7/03 1/04 7/04 1/05 7/05 1/06 7/06 1/07 7/07 1/08 7/08 1/09 7/09 1/10 7/10 1/11 7/11 1/12 7/12 1/13 7/13 1/14 7/14 1/15 7/15 1/16 7/16 1/17
Index (2005=100)
Diagram 2.4 : International commodity prices picked up last year, albeit remaining low by historical standards, and risks of large fluctuations remain
FoodAgricultural raw materials
Fuel (energy)
Note : Indices as depicted refer to IMF's commodity price indices.
Metal

40
Major sources of uncertainty 2.18 The global economic outlook is still surrounded by considerable uncertainties in 2017. First and foremost, how well the US economic conditions will hold up under the new administration is the key source of uncertainty, which will have implications for the Fed’s timing and pace of interest rate normalisation. Global economic recovery will face some headwinds if the growth in the US is hurt by unconstructive shifts in economic and trade policies, the Fed’s interest rate hikes or unfavourable international developments. 2.19 Second, various political uncertainties, in addition to the persisting structural issues and the still rather fragile economic fundamentals of some individual economies, will put the economic recovery in Europe to test. The risks of a hard Brexit cannot be taken lightly, which could have wider implications beyond the UK and the EU. The upcoming general elections in several major European economies may also create new hurdles for economic development in the region. The impaired balance sheets of Italian banks, with their potential negative spill-over effects, are another cause for concern. Third, there could be disruptions to global financial markets arising from an increase in the policy divergence among major central banks and other economic and political uncertainties. The resulting capital flow reversals and exchange rate fluctuations could be hugely destabilising for those emerging market economies with weaker fundamentals and large external debts. Fourth, intensified geopolitical tensions in many regions of the world and a rise in protectionist and anti-trade sentiments will definitely be harmful for the international trading environment. 2.20 That said, there is also some upside potential to the global economic outlook. If the US growth momentum strengthens more than expected and along a path that supports a more predictable course of policy actions by the Fed, global financial and monetary conditions should hopefully be more stable during the US interest rate upcycle. A reduction in Europe’s political uncertainty will be conducive to a steadier economic expansion in the region. Structural reforms in Europe and Japan, if pushed through effectively, would help improve the growth potential for these economies. Also, better-than-expected economic performance of the Mainland and other emerging market economies in Asia will provide a stronger support for regional trade flows, to the benefit of Hong Kong.

41
Outlook for the Hong Kong economy in 2017 2.21 Given the small and highly externally-oriented nature of our economy, Hong Kong’s economic outlook for 2017 will continue to depend predominantly on how global economic and financial conditions will evolve. After a rather weak start in early 2016, Hong Kong’s economic growth picked up steadily as the year progressed, alongside a generally stabilising external environment. Regional trade flows have continued to revive amid the relative improvement in external demand, and in tandem, our merchandise export growth staged a visible rebound in the fourth quarter of 2016. Should this positive trend extend into 2017 and barring abrupt negative shocks to the global economic, financial and trading environment, Hong Kong’s exports of goods will likely see a stronger performance this year, especially if the demand recovery in the advanced markets can gain further traction, rendering firmer support to Asia’s production and trading activities. However, a downside factor to watch out is the possibility of a distinct strengthening of the US dollar, which could pose a cap to the upside potential of the current export recovery.
-16
-12
-8
-4
0
4
8
12
16
20
24
-4
-2
0
2
4
6
2000 2002 2004 2006 2008 2010 2012 2014 2016 2017*-30
-20
-10
0
10
20
30
40
38
42
46
50
54
58
62
66
2006 2007 2008 2009 2010 2011 2012 2013 2014 2015 2016 2017
Index
World economic growth (LHS)
Hong Kong's PMI shiftedforward by two months
(LHS)
Hong Kong'stotal exports
(RHS)
Hong Kong's total exports (RHS)
Real rate of change (%)
Diagram 2.5 : The outlook for Hong Kong’s goods exports should hopefully improve in 2017
Year-on-year rate of change (%)Real rate of change (%)
Note : (*) Forecast from the IMF World Economic Outlook Update, January 2017.
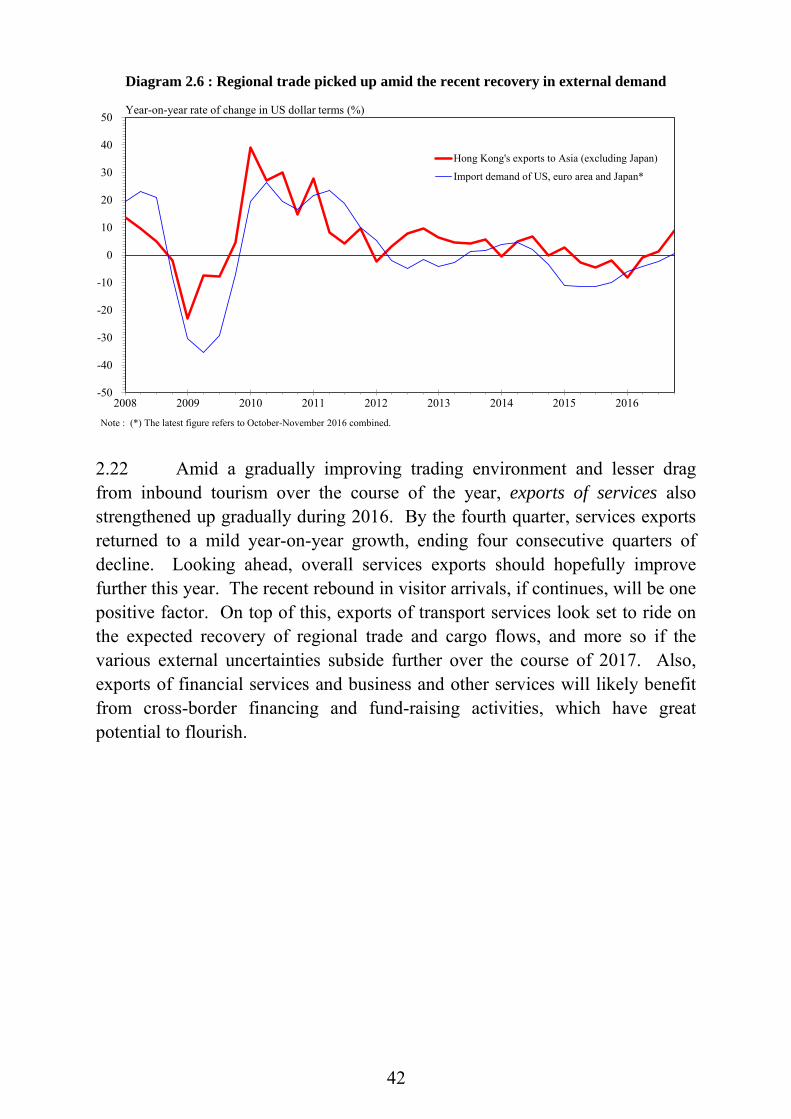
42
2.22 Amid a gradually improving trading environment and lesser drag from inbound tourism over the course of the year, exports of services also strengthened up gradually during 2016. By the fourth quarter, services exports returned to a mild year-on-year growth, ending four consecutive quarters of decline. Looking ahead, overall services exports should hopefully improve further this year. The recent rebound in visitor arrivals, if continues, will be one positive factor. On top of this, exports of transport services look set to ride on the expected recovery of regional trade and cargo flows, and more so if the various external uncertainties subside further over the course of 2017. Also, exports of financial services and business and other services will likely benefit from cross-border financing and fund-raising activities, which have great potential to flourish.
-50
-40
-30
-20
-10
0
10
20
30
40
50
2008 2009 2010 2011 2012 2013 2014 2015 2016
Hong Kong's exports to Asia (excluding Japan)
Import demand of US, euro area and Japan*
Diagram 2.6 : Regional trade picked up amid the recent recovery in external demand
Year-on-year rate of change in US dollar terms (%)
Note : (*) The latest figure refers to October-November 2016 combined.
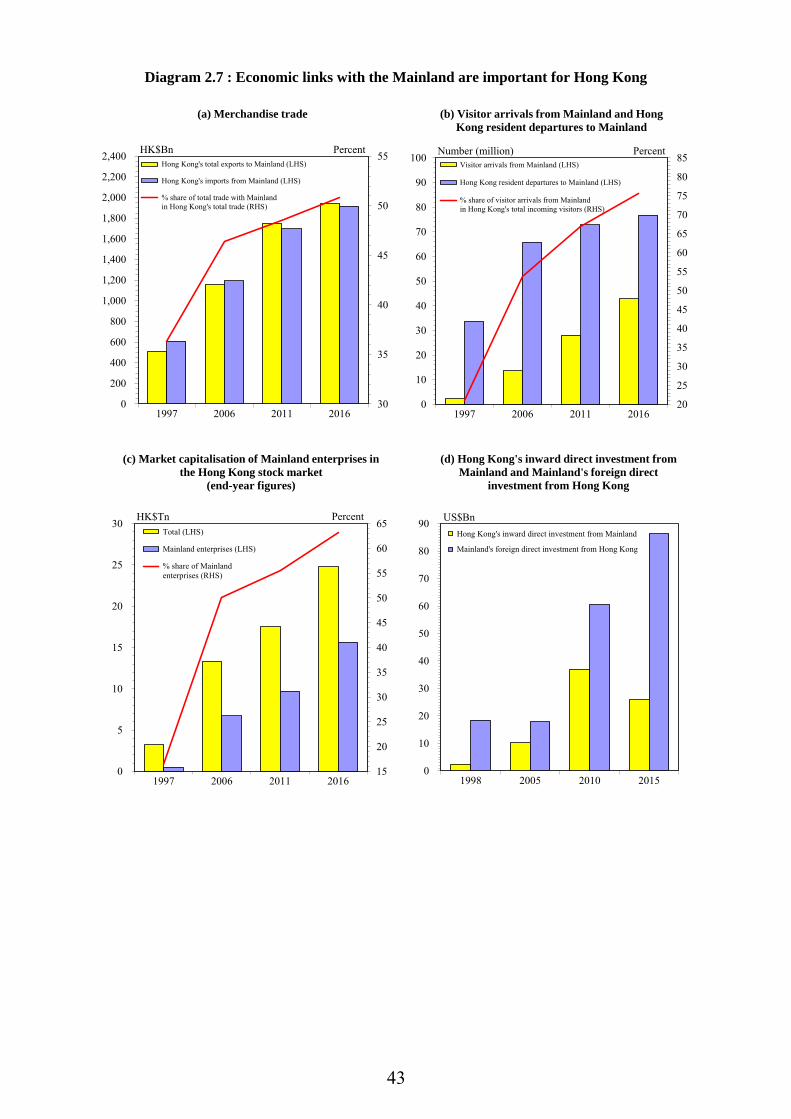
43
30
35
40
45
50
55
0
200
400
600
800
1,000
1,200
1,400
1,600
1,800
2,000
2,200
2,400
1997 2006 2011 2016
Hong Kong's total exports to Mainland (LHS)
Hong Kong's imports from Mainland (LHS)
% share of total trade with Mainland in Hong Kong's total trade (RHS)
(a) Merchandise trade
HK$Bn Percent
20
25
30
35
40
45
50
55
60
65
70
75
80
85
0
10
20
30
40
50
60
70
80
90
100
1997 2006 2011 2016
Visitor arrivals from Mainland (LHS)
Hong Kong resident departures to Mainland (LHS)
% share of visitor arrivals from Mainland in Hong Kong's total incoming visitors (RHS)
(b) Visitor arrivals from Mainland and HongKong resident departures to Mainland
PercentNumber (million)
Diagram 2.7 : Economic links with the Mainland are important for Hong Kong
15
20
25
30
35
40
45
50
55
60
65
0
5
10
15
20
25
30
1997 2006 2011 2016
Total (LHS)
Mainland enterprises (LHS)
% share of Mainland enterprises (RHS)
(c) Market capitalisation of Mainland enterprises in
the Hong Kong stock market(end-year figures)
HK$Tn Percent
0
10
20
30
40
50
60
70
80
90
1998 2005 2010 2015
Hong Kong's inward direct investment from Mainland
Mainland's foreign direct investment from Hong Kong
(d) Hong Kong's inward direct investment from Mainland and Mainland's foreign direct
investment from Hong Kong
US$Bn
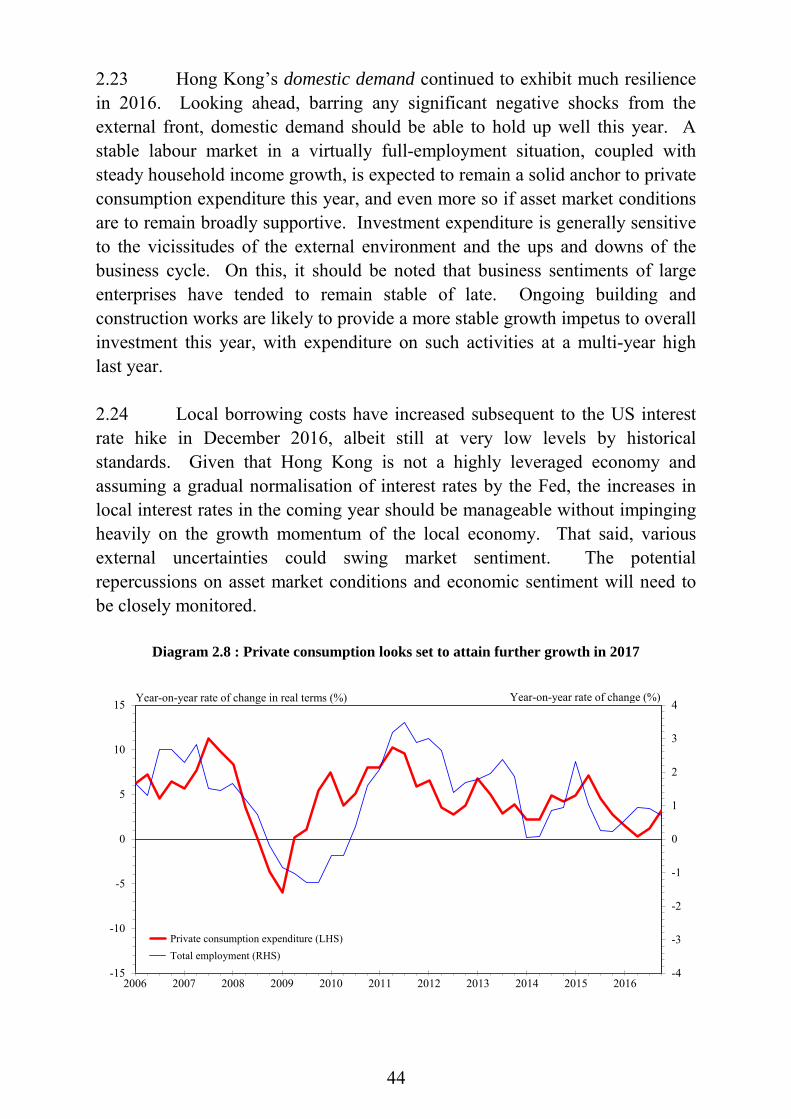
44
2.23 Hong Kong’s domestic demand continued to exhibit much resilience in 2016. Looking ahead, barring any significant negative shocks from the external front, domestic demand should be able to hold up well this year. A stable labour market in a virtually full-employment situation, coupled with steady household income growth, is expected to remain a solid anchor to private consumption expenditure this year, and even more so if asset market conditions are to remain broadly supportive. Investment expenditure is generally sensitive to the vicissitudes of the external environment and the ups and downs of the business cycle. On this, it should be noted that business sentiments of large enterprises have tended to remain stable of late. Ongoing building and construction works are likely to provide a more stable growth impetus to overall investment this year, with expenditure on such activities at a multi-year high last year. 2.24 Local borrowing costs have increased subsequent to the US interest rate hike in December 2016, albeit still at very low levels by historical standards. Given that Hong Kong is not a highly leveraged economy and assuming a gradual normalisation of interest rates by the Fed, the increases in local interest rates in the coming year should be manageable without impinging heavily on the growth momentum of the local economy. That said, various external uncertainties could swing market sentiment. The potential repercussions on asset market conditions and economic sentiment will need to be closely monitored.
-4
-3
-2
-1
0
1
2
3
4
-15
-10
-5
0
5
10
15
2006 2007 2008 2009 2010 2011 2012 2013 2014 2015 2016
Private consumption expenditure (LHS) Total employment (RHS)
Diagram 2.8 : Private consumption looks set to attain further growth in 2017
Year-on-year rate of change in real terms (%) Year-on-year rate of change (%)

45
-30
-24
-18
-12
-6
0
6
12
18
24
30
36
-8
-6
-4
-2
0
2
4
6
8
10
12
14
2006 2007 2008 2009 2010 2011 2012 2013 2014 2015 2016
PCE (LHS)
Residential flat price(RHS)
-80
-60
-40
-20
0
20
40
60
80
100
120
-10
-5
0
5
10
15
2006 2007 2008 2009 2010 2011 2012 2013 2014 2015 2016
Diagram 2.9 : Consumer sentiment should hold up if asset market conditions remain broadly supportive
(a) Housing wealth (b) Equity wealth
Equity wealth(RHS)
Year-on-year rate of changein real terms (%)
Year-on-yearrate of change (%)
Year-on-year rate of changein real terms (%)
Year-on-yearrate of change (%)
PCE (LHS)
-18
-15
-12
-9
-6
-3
0
3
6
9
12
15
18
-60
-50
-40
-30
-20
-10
0
10
20
30
40
50
60
2008 2009 2010 2011 2012 2013 2014 2015 2016 2017
Expected change in business situation (LHS)
Net balance indicates the direction of expected change in business situation versus the preceding quarter. It refersto the difference in percentage points between the proportion of establishments choosing "better" over that choosing"worse". A positive sign indicates a likely upward trend while a negative sign, a likely downward trend.
Note : (*)
Net balance* (% points)
Domestic demand growth (RHS)
Diagram 2.10 : Business sentiments of large enterprises have tended to remain stable of late
Year-on-year rate of change in real terms (%)
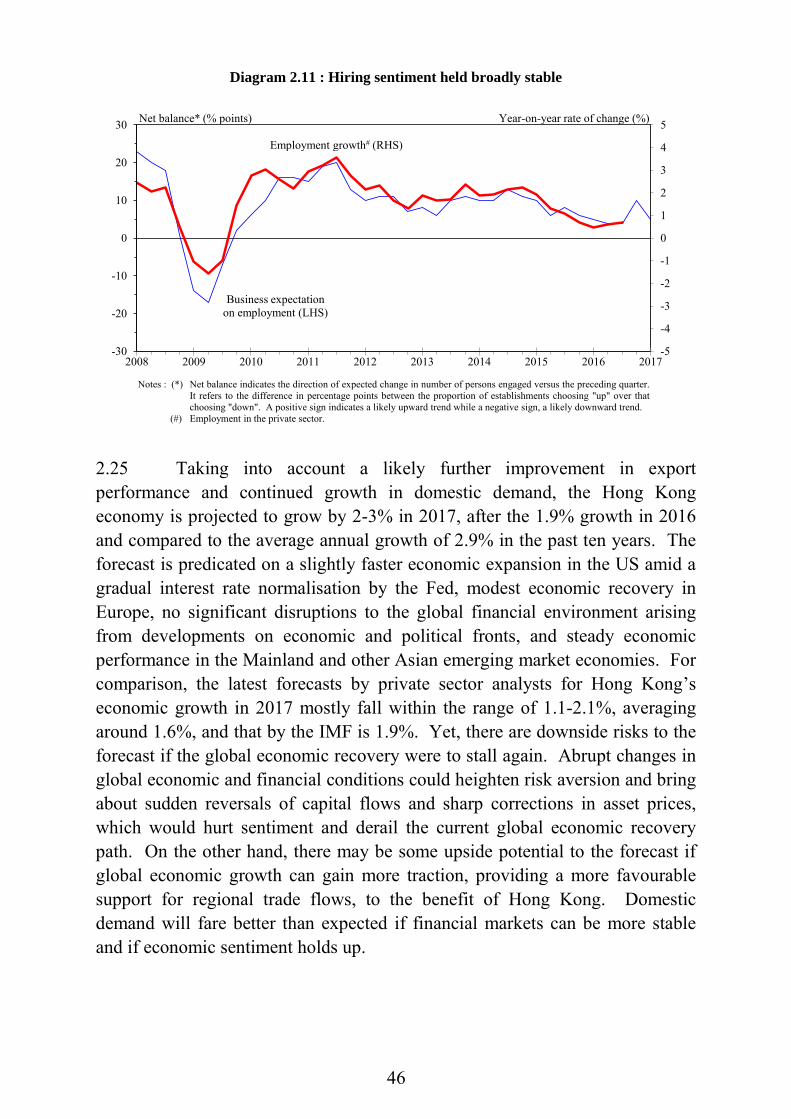
46
2.25 Taking into account a likely further improvement in export performance and continued growth in domestic demand, the Hong Kong economy is projected to grow by 2-3% in 2017, after the 1.9% growth in 2016 and compared to the average annual growth of 2.9% in the past ten years. The forecast is predicated on a slightly faster economic expansion in the US amid a gradual interest rate normalisation by the Fed, modest economic recovery in Europe, no significant disruptions to the global financial environment arising from developments on economic and political fronts, and steady economic performance in the Mainland and other Asian emerging market economies. For comparison, the latest forecasts by private sector analysts for Hong Kong’s economic growth in 2017 mostly fall within the range of 1.1-2.1%, averaging around 1.6%, and that by the IMF is 1.9%. Yet, there are downside risks to the forecast if the global economic recovery were to stall again. Abrupt changes in global economic and financial conditions could heighten risk aversion and bring about sudden reversals of capital flows and sharp corrections in asset prices, which would hurt sentiment and derail the current global economic recovery path. On the other hand, there may be some upside potential to the forecast if global economic growth can gain more traction, providing a more favourable support for regional trade flows, to the benefit of Hong Kong. Domestic demand will fare better than expected if financial markets can be more stable and if economic sentiment holds up.
-5
-4
-3
-2
-1
0
1
2
3
4
5
-30
-20
-10
0
10
20
30
2008 2009 2010 2011 2012 2013 2014 2015 2016 2017
Business expectation on employment (LHS)
Notes : (*)
(#)
Net balance* (% points)
Employment growth# (RHS)
Diagram 2.11 : Hiring sentiment held broadly stable
Net balance indicates the direction of expected change in number of persons engaged versus the preceding quarter.It refers to the difference in percentage points between the proportion of establishments choosing "up" over thatchoosing "down". A positive sign indicates a likely upward trend while a negative sign, a likely downward trend.Employment in the private sector.
Year-on-year rate of change (%)

47
2.26 Underlying inflation in Hong Kong edged down from 2.5% in 2015 to 2.3% in 2016, marking the fifth consecutive year of easing. On the external front, slow growth in the advanced economies and the still-tame inflation outlook for Hong Kong’s major trading partners should ease some of the upward pressures from commodity prices and help keep imported inflation in check. On the domestic front, local cost pressures should remain at bay, considering the likely moderate economic growth and the continued feed-through of the earlier softening in rentals. The underlying Composite CPI is forecast to increase by 2% for 2017 as a whole, compared to the 2.3% increase in 2016. Taking into account the effects of the Government’s one-off measures, the headline Composite CPI is forecast to increase by 1.8% in 2017, compared to 2.4% in 2016. The GDP deflator is forecast to rise by 2%, in light of the anticipated mild price pressures from both the local and external fronts.
-6
-4
-2
0
2
4
6
8
10
2007 2008 2009 2010 2011 2012 2013 2014 2015 2016 2017
GDP
10-year trend growth (2007-2016)
Diagram 2.12 : Hong Kong economy is expected to fare better in 2017, but uncertainties prevail
Real rate of change (%)
Note : (*) Mid-point of the range forecast.(Forecast)
*
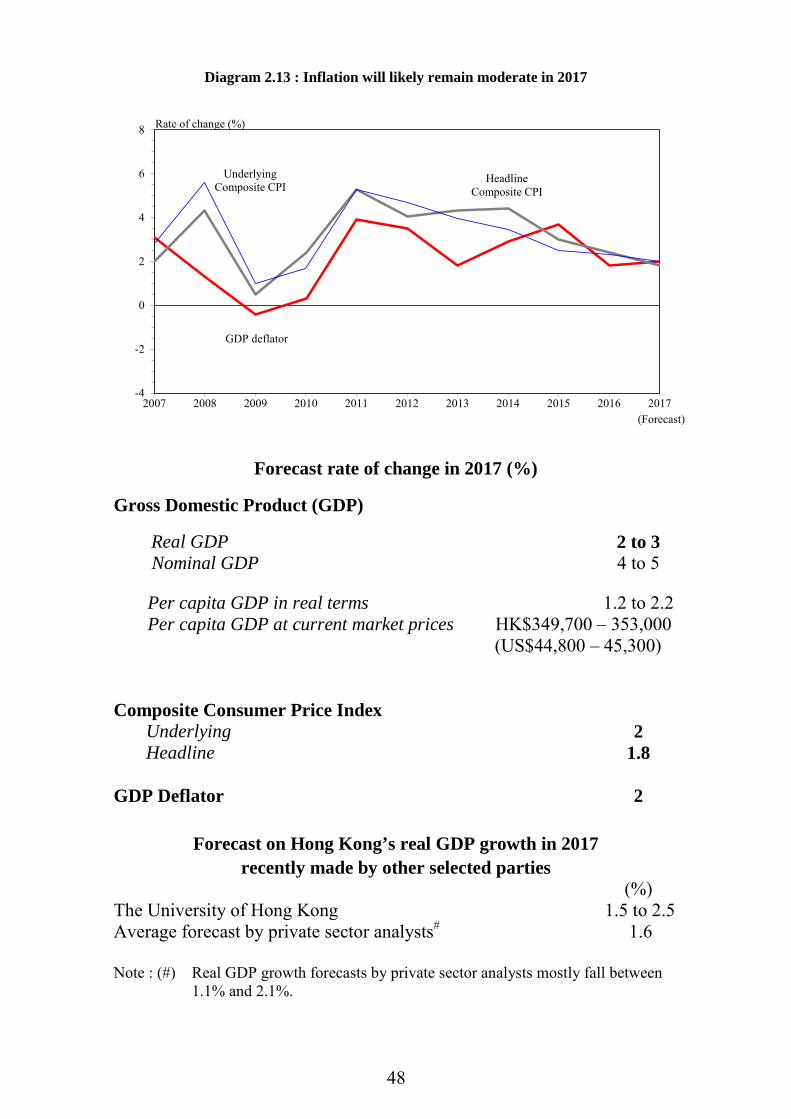
48
Forecast rate of change in 2017 (%) Gross Domestic Product (GDP) Real GDP 2 to 3 Nominal GDP 4 to 5 Per capita GDP in real terms 1.2 to 2.2 Per capita GDP at current market prices HK$349,700 – 353,000
(US$44,800 – 45,300) Composite Consumer Price Index Underlying Headline
2
1.8
GDP Deflator 2
Forecast on Hong Kong’s real GDP growth in 2017 recently made by other selected parties
(%) The University of Hong Kong 1.5 to 2.5 Average forecast by private sector analysts#
1.6
Note : (#) Real GDP growth forecasts by private sector analysts mostly fall between 1.1% and 2.1%.
-4
-2
0
2
4
6
8
2007 2008 2009 2010 2011 2012 2013 2014 2015 2016 2017
HeadlineComposite CPI
Diagram 2.13 : Inflation will likely remain moderate in 2017
Rate of change (%)
(Forecast)
GDP deflator
UnderlyingComposite CPI
49
Medium-term outlook for the Hong Kong economy 2.27 Over the medium term, the outlook for the Hong Kong economy remains positive, though external uncertainties still abound on the economic, political and policy fronts. Global economic growth will likely stay modest for an extended period under the “new normal” with unresolved structural issues, while new risks have emerged. 2.28 Among the advanced economies, the US economic outlook is more promising, but will hinge on whether the intended effects of the new US administration’s growth-enhancing policies will be materialised, and how they may affect the Fed’s course of interest rate normalisation and global growth prospects. Meanwhile, many economies in the euro area and Japan are still troubled by lingering structural problems. Apart from the lack of clarity about the trade policy direction of the US, the unfolding of Brexit could also affect future developments in global trade and investment flows. The negotiation process between the UK and the EU is likely to extend beyond 2017. Whether anti-globalisation and protectionist sentiments will spread and result in a change towards more inward-oriented policies in the major economies in the coming years warrant a close watch. Moreover, the potential output growth of many advanced economies beyond the near term looks set to slow amid the absence of a strong demand-side recovery, a protracted period of underinvestment, a slowdown in productivity growth and the intensification of population ageing over time. 2.29 Emerging market economies, in contrast, will remain the main propellers of global economic growth over the medium term. Many emerging market economies have devoted considerable efforts to reduce vulnerabilities and enhance resilience against external shocks, and this should hopefully bear fruit. In particular, Asian economies will likely continue to shine in the global economic arena, underpinned by their stronger economic fundamentals and resilient domestic demand.
2.30 Given Asia’s rising prominence in the global economy, strengthening economic co-operation with the Mainland and our neighbouring economies is vital to Hong Kong’s economic development over the longer run. The Mainland’s economic reorientation towards domestic consumption and the services sector and a further opening up of its market will likely raise the demand for Hong Kong’s higher-end services, especially in the areas of finance and professional services. Closer linkages with the Mainland’s financial markets, the internationalisation of the RMB, the “going-out” of Mainland

50
enterprises, as well as the Belt and Road Initiative, will continue to bring forth extensive opportunities, enabling Hong Kong to serve as a fund-raising and financial management platform, a trade and logistics hub, as well as an investment springboard. CEPA and other co-operation platforms will help deepen our economic integration with the Mainland and consolidate our status as the world’s leading offshore RMB business centre and premier asset management hub. Separately, the Government will strive to explore ways to expand trade and investment flows with neighbouring economies and emerging markets that have promising growth prospects. 2.31 In order to make Hong Kong stand out in the midst of the intense global competition, the Government has made continuous efforts to promote Hong Kong’s transformation into a high value-added and knowledge-based economy. The Government will further enhance the competitiveness of our pillar industries and promote new growth areas, including riding on the global wave of Fintech and the applications of other innovative technologies. The Government is also committed to raising productivity growth and uplifting our competitiveness through improving the quality of human and physical capital. 2.32 Hong Kong has long been a staunch supporter of free trade, achieving remarkable economic success by leveraging on the opportunities arising from globalisation over the past decades. In face of lingering external uncertainties, the Government will continue to uphold institutional strengths and to make the most out of the free market mechanism, which form the cornerstone of our economy. These include an open market with free movement of goods, capital and people, a low and simple tax regime, a level-playing field for all businesses, the rule of law, an independent judiciary, and the protection of intellectual property rights. All these important institutions will continue to support a favourable business environment for attracting companies, start-ups and entrepreneurs from overseas and the Mainland to invest and expand their business activities in Hong Kong. 2.33 Meanwhile, population ageing, a common phenomenon across advanced economies, has become a more visible challenge to Hong Kong’s economic growth, as the labour force could peak as early as in 2018. In response to an ageing population, the Government has adopted a multi-pronged approach by encouraging labour force participation, enhancing the quality of workforce through education and training, attracting talent from outside Hong Kong and creating a family- and age-friendly environment. An ageing society will have profound impacts on public expenses, particularly in the areas of healthcare and social welfare. Yet, the Government will strive to maintain the

51
health of our public finances such that sufficient public resources can be ensured to foster economic development and to build an inclusive society, through tackling the various needs of our economy, including investments in education, training and infrastructure for raising productivity growth, and addressing social issues through different programmes. Taking into account the developments on the external and domestic fronts, the economy is expected to attain a trend growth of 3% per annum in real terms from 2018 to 2021. 2.34 Inflationary pressures are expected to remain moderate over the medium term. Externally, modest global economic growth will likely keep world inflation at a relatively low level. Locally, productivity gains should play a part in alleviating some of the local cost pressures. The Government’s incessant efforts to increase land and housing supply will improve the demand-supply situation in the property market, helping to contain rental cost pressures in the years ahead. Taking all these developments into account, the trend rate of change in the underlying Composite CPI in Hong Kong from 2018 to 2021 is forecast at 2.5% per annum. There are, however, upside risks to Hong Kong’s inflation outlook, if international food and energy prices accelerate sharply due to adverse supply shocks, or if the global economic recovery is stronger than expected and leads to more rapid increases in inflationary pressures.
4.7
2.6
3
0
1
2
3
4
5
6
1999-2008 2009-2016 2018-2021
Diagram 2.14 : Medium-term trend growth forecast at 3% per annum
Trend real GDP growth rate (%, per annum)

52
CHAPTER 3 : THE EXTERNAL SECTOR Summary
The global economy, after a weak start in 2016, improved gradually over the course of the year. Despite so, the pace of global economic expansion in 2016 was still the slowest since 2009. The Mainland economy maintained steady and solid growth throughout the year. The US economy regained strength in the second half of 2016, paving the way for a further interest rate hike near the year-end. With the impact of Brexit largely contained, the EU economy managed to stay on a modest growth path. Consequential to the relative stabilisation in global demand, Asia’s trading and manufacturing activities generally picked up in the latter part of 2016.
Hong Kong’s merchandise exports(1) grew slightly by 1.4% in real terms in 2016, reversing from a modest decline in 2015. After suffering a further fall in the first quarter of 2016, merchandise exports revived in the second and third quarters, and gathered further strength in the fourth quarter. The revival was largely underpinned by the better performance of the Mainland and other major Asian markets, amid the gradual resumption in regional trade flows.
Exports of services slackened in 2016. The weakness was particularly noticeable in the first half of the year. With the more acute risks receding in the global economy and as inbound tourism gradually stabilised, services exports reversed the decline in the latter part of the year. Exports of travel services still recorded a notable decline and remained a visible drag, as such headwinds as subpar regional growth, strong currency and the effect of the “one trip per week” Individual Visit Endorsements weighed on the performance. Amid a difficult global economic environment during most of the year, exports of financial services relapsed to a modest decline, and those of business and other services were likewise mostly sluggish. Exports of transport services slightly outperformed the others, benefiting from the revival of regional trade and cargo flows during the year.
Hong Kong continues to actively foster closer trade and investment ties with its economic partners, including the Mainland and emerging market economies along the Belt and Road. Separately, Hong Kong’s foreign direct investment inflows ranked the second largest among the world economies in 2015 for two years in a row, signifying the important status of Hong Kong as a business hub for foreign and Mainland companies.

53
Goods trade Total exports of goods 3.1 The global trading environment, following an austere start, showed some improvement during the course of 2016, in turn rendering growth impetus to Asia’s trading and manufacturing activities in the latter part of the year. In tandem, Hong Kong’s merchandise exports (comprising re-exports and domestic exports) reverted to a slight growth of 1.4% in real terms in 2016, from a 1.7% decline in the preceding year. In the first quarter of 2016, merchandise exports dropped by 4.2% year-on-year, as the strong external headwinds weighed heavily on global trade flows. With the more acute risks waning and global demand reviving modestly, merchandise exports picked up successively in the rest of the year, growing by 1.4% and 1.8% respectively from a year earlier in the second and third quarters. The growth in the fourth quarter was particularly visible, reaching 5.9% over a year earlier amid the broad-based improvement in regional trade flows. On a seasonally adjusted quarter-to-quarter basis, having fallen by 4.7% in the first quarter, merchandise exports rebounded notably by 6.1% in the second quarter, and grew further by 1.0% and 3.8% respectively in the third and fourth quarters. 3.2 With the global economy expanding at the slowest pace since 2009, the external trading environment remained challenging in 2016. The situation was particularly grim in the first quarter of 2016, as the US economy slowed visibly, and as financial markets turned more volatile amid heightened concerns about deflation risks and growth prospects which prompted additional monetary stimuli from the central banks in the euro area and Japan. Trading activities in Asia went down in tandem. However, as the acute risks in the external environment receded, the global demand conditions saw some stabilisation. The US economy was a bright spot amongst the advanced economies, with growth gaining traction in the subsequent quarters, bolstering the Federal Reserve’s confidence to raise interest rates again in December. The Mainland economy grew steadily further, on the back of the sustained strength in the domestic segments. At the same time, the rebound in energy and raw material prices helped lessen the downdrag on commodity-dependent emerging economies. Also noteworthy were the surprise outcome of the UK referendum in favour of leaving the EU in June and other political developments towards the end of 2016, which caused brief periods of financial jitters. While adding uncertainty to economic outlook, the contagion effects of these events on global economic activity were largely contained insofar as 2016 was concerned.

54
3.3 In tandem with the stabilisation of the global economy, exports in Asian economies generally improved, with many reverting from double-digit year-on-year declines in the first quarter of 2016 to varying degrees of growth in US dollar terms towards the end of the year. The recuperations in exports and manufacturing activities in the region boosted intra-regional trade in the latter part of the year to the benefit of Hong Kong’s export performance.
Table 3.1 : Total exports of goods, re-exports and domestic exports (year-on-year rate of change (%))
Total exports of goods
Re-exports Domestic exports
In value terms
In real terms(a)
Change in prices
In value terms
In real terms(a)
Change in prices
In value terms
In real terms(a)
Change in prices
2015 Annual -1.8 -1.7 0.1 -1.6 -1.6 0.1 -15.2 -12.8 -3.0
Q1 2.3 0.7 (0.5) 2.0 2.5 0.8 (0.5) 2.1 -10.1 -8.7 (-1.0) -1.5 Q2 -1.9 -3.0 (-1.7) 1.3 -1.7 -2.8 (-1.7) 1.4 -15.6 -13.8 (-1.6) -2.7 Q3 -4.1 -3.8 (-0.5) -0.4 -3.9 -3.6 (-0.4) -0.4 -18.3 -15.7 (-9.2) -4.3 Q4
-2.9 -0.5 (1.3) -2.1 -2.7 -0.3 (1.3) -2.1 -16.4 -12.6 (-0.6) -3.3
2016 Annual -0.5 1.4 -1.7 -0.4 1.5 -1.7 -8.5 -7.0 -1.4 Q1 -6.8 -4.2 (-4.7) -2.6 -6.7 -4.0 (-4.7) -2.6 -15.2 -12.1 (-2.4) -3.2 Q2 -1.2 1.4 (6.1) -2.2 -0.9 1.6 (6.3) -2.2 -16.8 -14.7 (-2.7) -2.1 Q3 -0.2 1.8 (1.0) -1.6 -0.2 1.8 (0.9) -1.6 -2.0 -0.1 (8.2) -1.1 Q4 5.5 5.9 (3.8) -0.5 5.6 6.0 (3.9) -0.5 0.9 -0.7 (-3.8) 0.9
Notes : ( ) Seasonally adjusted quarter-to-quarter rate of change. (a) The growth rates here are not strictly comparable with those in the GDP accounts in
Table 1.1. Figures in Table 1.1 are compiled based on the change of ownership principle in recording goods sent abroad for processing and merchanting under the standards stipulated in the System of National Accounts 2008.
3.4 Re-exports(2), the mainstay of overall merchandise exports and accounting for 98.8% of total exports by value, reverted to a modest growth of 1.5% in real terms in 2016, from a decline of 1.6% in 2015. Domestic exports, constituting the remaining 1.2% of total exports, showed a decline of 7.0% in real terms in 2016, narrowed from that of 12.8% in 2015.

55
Notes : Total exports of goods as depicted refer to the year-on-year rate of change in real terms, while total import demand in Hong Kong’s major markets as depicted refers to the year-on-year rate of change in US dollar terms in the aggregate import demand in Asia, the United States and the European Union taken together.
(#) Import demand figure for the fourth quarter of 2016 is based on statistics for October and
November 2016.
-16
-12
-8
-4
0
4
8
12
16
Q12012
Q12013
Q12014
Q12015
Q12016
-9
-6
-3
0
3
6
9
Total import demand inHong Kongʼs
major markets #(RHS)
Hong Kongʼs total exports
of goods (LHS)
Diagram 3.1 : Merchandise exports showed successive improvements after a setback in the first quarter of 2016
Year-on-year rate of change (%) Year-on-year rate of change (%)
Q12009
Q12010
Q12011
Q12012
Q12013
Q12014
Q12015
Q12016
-40
-30
-20
-10
0
10
20
30
40
50
60Year-on-year rate of change (%) in US dollar terms
Singapore
Korea
Taiwan
Hong Kong
Diagram 3.2 : Merchandise exports among higher-income Asian economies resumed growth by the fourth quarter of 2016
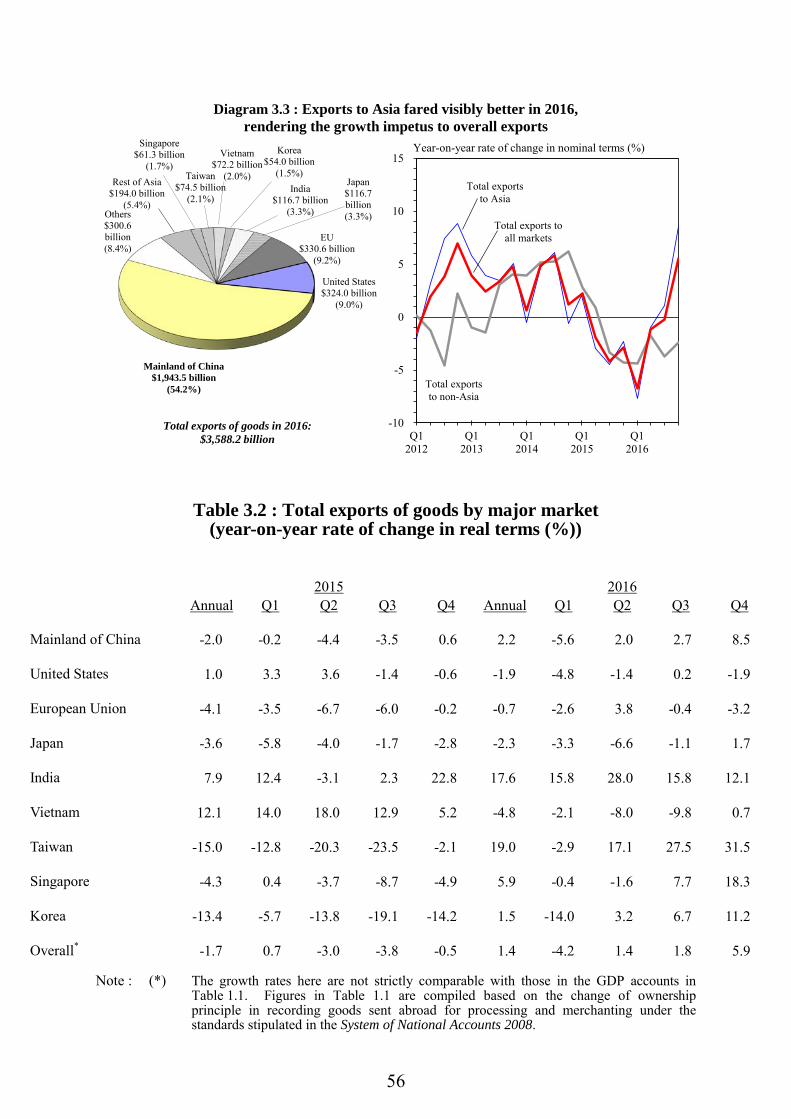
56
Table 3.2 : Total exports of goods by major market (year-on-year rate of change in real terms (%))
2015 2016 Annual Q1 Q2 Q3 Q4 Annual Q1 Q2 Q3 Q4 Mainland of China -2.0 -0.2 -4.4 -3.5 0.6 2.2 -5.6 2.0 2.7 8.5 United States 1.0 3.3 3.6 -1.4 -0.6 -1.9 -4.8 -1.4 0.2 -1.9 European Union -4.1 -3.5 -6.7 -6.0 -0.2 -0.7 -2.6 3.8 -0.4 -3.2 Japan -3.6 -5.8 -4.0 -1.7 -2.8 -2.3 -3.3 -6.6 -1.1 1.7 India 7.9 12.4 -3.1 2.3 22.8 17.6 15.8 28.0 15.8 12.1 Vietnam 12.1 14.0 18.0 12.9 5.2 -4.8 -2.1 -8.0 -9.8 0.7 Taiwan -15.0 -12.8 -20.3 -23.5 -2.1 19.0 -2.9 17.1 27.5 31.5 Singapore -4.3 0.4 -3.7 -8.7 -4.9 5.9 -0.4 -1.6 7.7 18.3 Korea -13.4 -5.7 -13.8 -19.1 -14.2 1.5 -14.0 3.2 6.7 11.2 Overall* -1.7 0.7 -3.0 -3.8 -0.5 1.4 -4.2 1.4 1.8 5.9
Note : (*) The growth rates here are not strictly comparable with those in the GDP accounts in
Table 1.1. Figures in Table 1.1 are compiled based on the change of ownership principle in recording goods sent abroad for processing and merchanting under the standards stipulated in the System of National Accounts 2008.
India$116.7 billion
(3.3%)
Singapore$61.3 billion
(1.7%)Taiwan
$74.5 billion(2.1%)
Korea$54.0 billion
(1.5%)Japan$116.7 billion(3.3%)
EU$330.6 billion
(9.2%)
United States$324.0 billion
(9.0%)
Vietnam$72.2 billion
(2.0%)Rest of Asia$194.0 billion
(5.4%)
Q12012
Q12013
Q12014
Q12015
Q12016
-10
-5
0
5
10
15
Total exports to Asia
Total exports to non-Asia
Total exports toall markets
Year-on-year rate of change in nominal terms (%)
Diagram 3.3 : Exports to Asia fared visibly better in 2016, rendering the growth impetus to overall exports
Others$300.6 billion(8.4%)
Mainland of China$1,943.5 billion
(54.2%)
Total exports of goods in 2016: $3,588.2 billion
57
3.5 Analysed by major market, exports to major Asian markets fared generally better in 2016, as the relative stabilisation in global demand after the first quarter boosted exports of raw materials and semi-manufactures to these markets and rendered growth impetus. The improvements gained more traction in the fourth quarter. Exports to the Mainland rebounded modestly in 2016, with performance improving progressively during the year, attaining near double-digit growth in the fourth quarter. Elsewhere, among the higher-income Asian economies, exports to Taiwan rebounded markedly to record double-digit growth. Similarly, exports to Singapore and Korea picked up notably during the year. Exports to India grew robustly further. On the other hand, exports to other emerging ASEAN economies were weak in most of 2016, though also with visible improvement in the fourth quarter. 3.6 Exports to major advanced economies in overall terms remained subdued. Exports to the US relapsed to a slight contraction in 2016, with a notable fall in the first quarter when the US economy slowed visibly. The drag was only partially offset by the relative improvements in the subsequent quarters. Exports to the EU fell mildly in 2016, held back by the only modest economic expansion there. The decline was further dragged by the continued fall-off in exports to the UK after the Brexit vote. Exports to Japan still contracted for 2016 as a whole. Yet, having suffered a prolonged period of setback and aided by the general improvement in regional trade, exports to Japan also reverted to a slight growth in the fourth quarter.
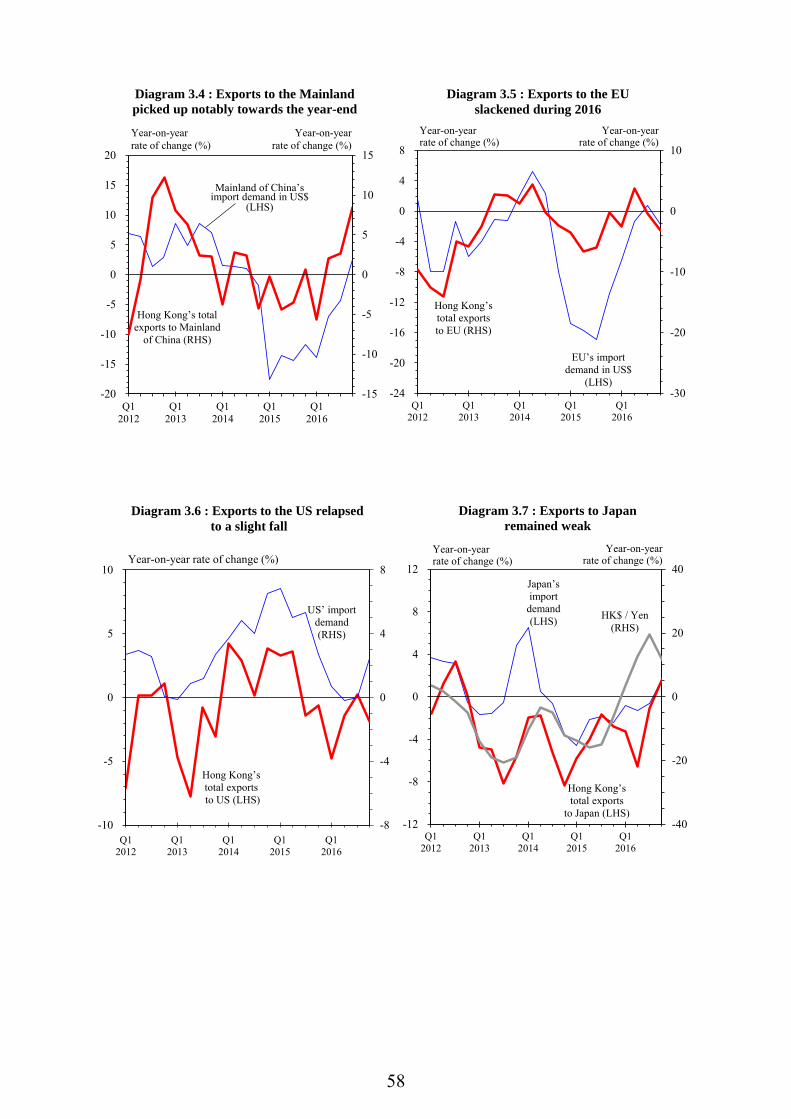
58
-30
-20
-10
0
10
Q12012
Q12013
Q12014
Q12015
Q12016
-24
-20
-16
-12
-8
-4
0
4
8
Year-on-year rate of change (%)
Hong Kongʼs total exports to EU (RHS)
Year-on-year rate of change (%)
-15
-10
-5
0
5
10
15
Q12012
Q12013
Q12014
Q12015
Q12016
-20
-15
-10
-5
0
5
10
15
20
Hong Kongʼs total exports to Mainland
of China (RHS)
Year-on-year rate of change (%)
Mainland of Chinaʼsimport demand in US$
(LHS)
Year-on-year rate of change (%)
Diagram 3.4 : Exports to the Mainland picked up notably towards the year-end
EUʼs import demand in US$
(LHS)
Diagram 3.5 : Exports to the EU slackened during 2016
-8
-4
0
4
8
Q12012
Q12013
Q12014
Q12015
Q12016
-10
-5
0
5
10Year-on-year rate of change (%)
Hong Kongʼstotal exportsto US (LHS)
USʼ import demand (RHS)
-40
-20
0
20
40
Q12012
Q12013
Q12014
Q12015
Q12016
-12
-8
-4
0
4
8
12
Year-on-year rate of change (%)
HK$ / Yen(RHS)
Hong Kongʼs total exports
to Japan (LHS)
Year-on-year rate of change (%)
Diagram 3.7 : Exports to Japanremained weak
Diagram 3.6 : Exports to the US relapsedto a slight fall
Japanʼsimport demand(LHS)
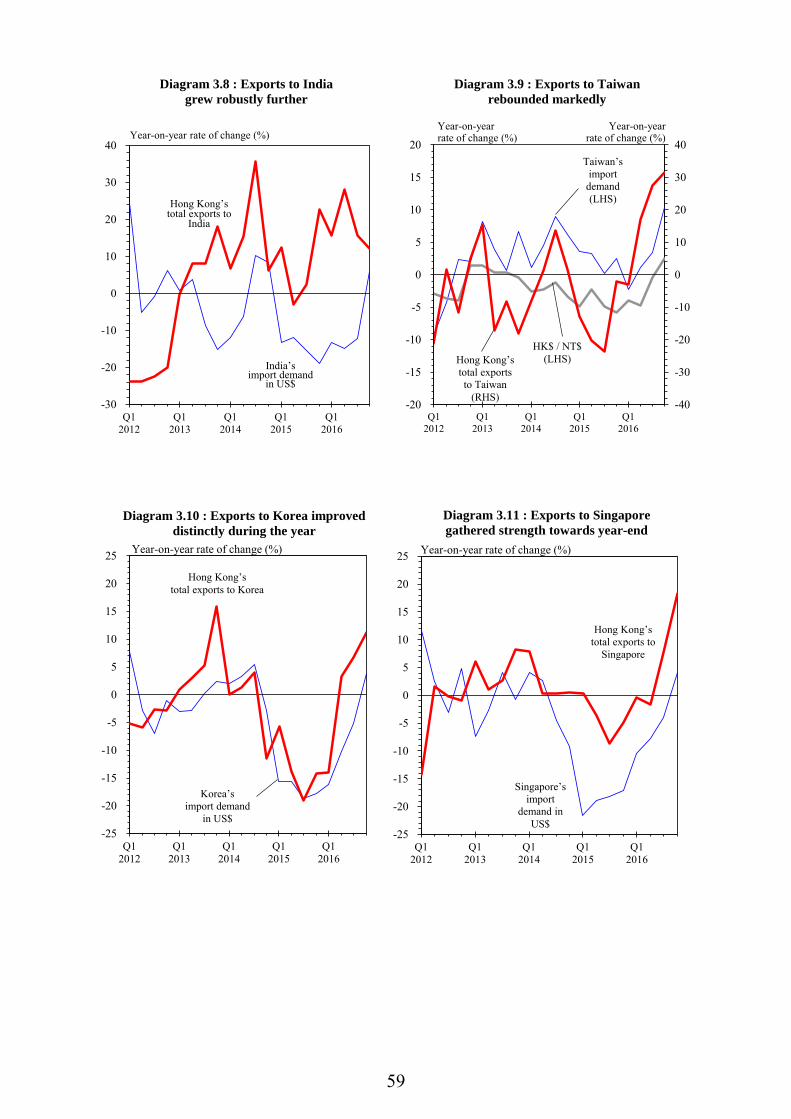
59
Q12012
Q12013
Q12014
Q12015
Q12016
-30
-20
-10
0
10
20
30
40
Hong Kongʼstotal exports to
India
Year-on-year rate of change (%)
Indiaʼsimport demand
in US$
-40
-30
-20
-10
0
10
20
30
40
Q12012
Q12013
Q12014
Q12015
Q12016
-20
-15
-10
-5
0
5
10
15
20Year-on-year rate of change (%)
Hong Kongʼs total exports to Taiwan
(RHS)
Year-on-year rate of change (%)
Taiwanʼsimport
demand(LHS)
Diagram 3.8 : Exports to India grew robustly further
Diagram 3.9 : Exports to Taiwan rebounded markedly
HK$ / NT$(LHS)
Q12012
Q12013
Q12014
Q12015
Q12016
-25
-20
-15
-10
-5
0
5
10
15
20
25 Year-on-year rate of change (%)
Hong Kongʼstotal exports to Korea
Koreaʼs import demand
in US$
Diagram 3.10 : Exports to Korea improved distinctly during the year
Q12012
Q12013
Q12014
Q12015
Q12016
-25
-20
-15
-10
-5
0
5
10
15
20
25 Year-on-year rate of change (%)
Hong Kongʼstotal exports to
Singapore
Singaporeʼsimport
demand in US$
Diagram 3.11 : Exports to Singapore gathered strength towards year-end

60
Imports of goods 3.7 Imports of goods grew marginally by 1.0% in real terms in 2016, reversing the 3.2% decline in 2015, on the back of the improvement in re-export trade and a much smaller decline in retained imports. Retained imports, referring to the imports for domestic use, which accounted for around one-quarter of total imports, bounced back visibly in the second half of the year, leading to only a marginal decline of 0.6% in real terms for 2016 as a whole, much smaller than that of 7.4% in 2015. Retained imports fell in the first half of 2016 from a year earlier amid the weakness in local investment spending and retail sales during the period, which reduced the related intake in imports. The upturn in retained imports in the second half of 2016 went in tandem with the visible pick-up in domestic demand and the relative improvement in the retail market.
Table 3.3 : Imports of goods and retained imports (year-on-year rate of change (%))
Imports of goods
Retained imports(a)
In value terms
In real terms(+)
Change in prices
In value terms
In real terms
Change in prices
2015 Annual
-4.1 -3.2 -0.4 -10.4 -7.4 -1.8
Q1 1.4 1.1 (-0.1) 0.9 -1.2 1.9 (-1.6) -1.9 Q2 -3.2 -3.1 (-3.4) 0.6 -6.8 -3.9 (-7.9) -1.3 Q3 -6.7 -5.5 (-2.1) -0.7 -14.3 -11.2 (-6.6) -1.6 Q4
-7.0 -4.5 (1.1) -2.1 -17.6 -14.7 (0.4) -2.4
2016 Annual -0.9 1.0 -1.7 -2.6 -0.6 -1.6 Q1 -8.2 -5.4 (-2.4) -2.8 -12.2 -8.9 (4.3) -3.6 Q2 -3.2 -0.5 (3.6) -2.6 -9.2 -6.0 (-3.4) -3.7 Q3 1.2 2.9 (2.6) -1.4 5.8 6.3 (7.5) -0.5 Q4
5.6 6.2 (2.4) -0.1 5.7 6.6 (-1.7) 1.0
Notes : (a) Based on the results of the Annual Survey of Re-export Trade conducted by the Census and Statistics Department, re-export margins by individual end-use category are estimated and adopted for deriving the value of imports retained for use in Hong Kong.
(+) The growth rates here are not strictly comparable with those in the GDP accounts in Table 1.1. Figures in Table 1.1 are compiled based on the change of ownership principle in recording goods sent abroad for processing and merchanting under the standards stipulated in the System of National Accounts 2008.
( ) Seasonally adjusted quarter-to-quarter rate of change.
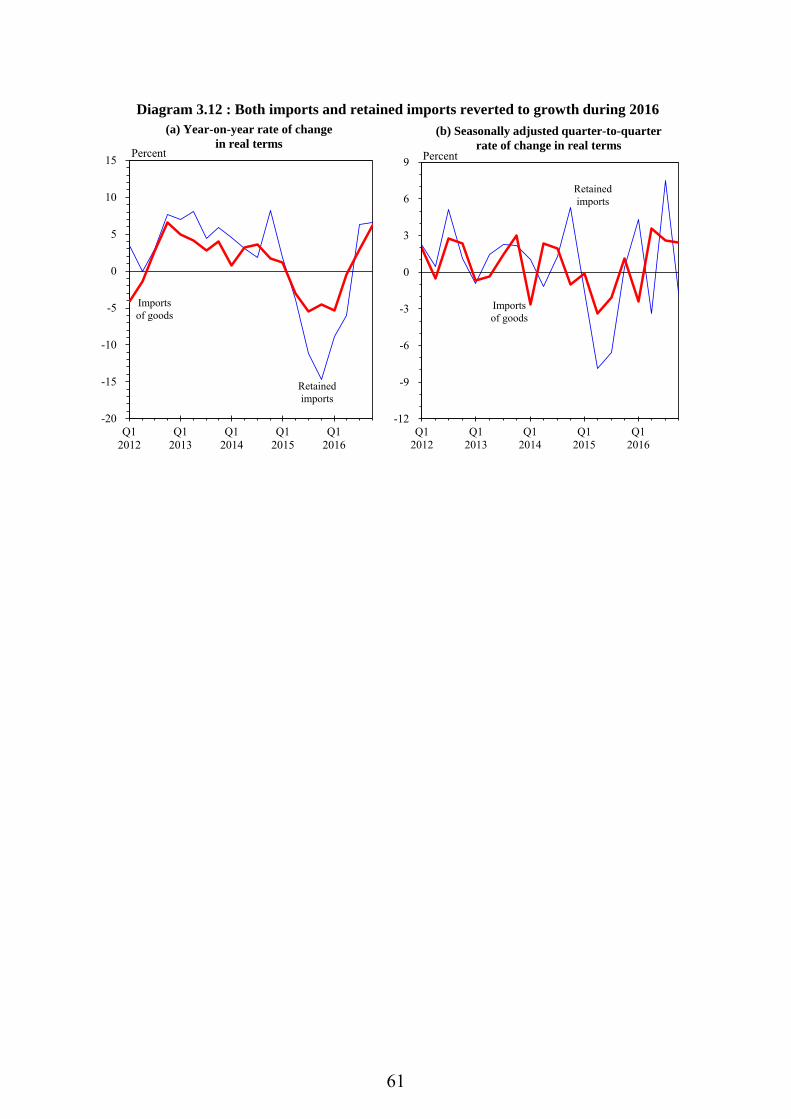
61
Q12012
Q12013
Q12014
Q12015
Q12016
-20
-15
-10
-5
0
5
10
15 Percent
Retainedimports
Importsof goods
(a) Year-on-year rate of changein real terms
Q12012
Q12013
Q12014
Q12015
Q12016
-12
-9
-6
-3
0
3
6
9 Percent
(b) Seasonally adjusted quarter-to-quarterrate of change in real terms
Retainedimports
Importsof goods
Diagram 3.12 : Both imports and retained imports reverted to growth during 2016
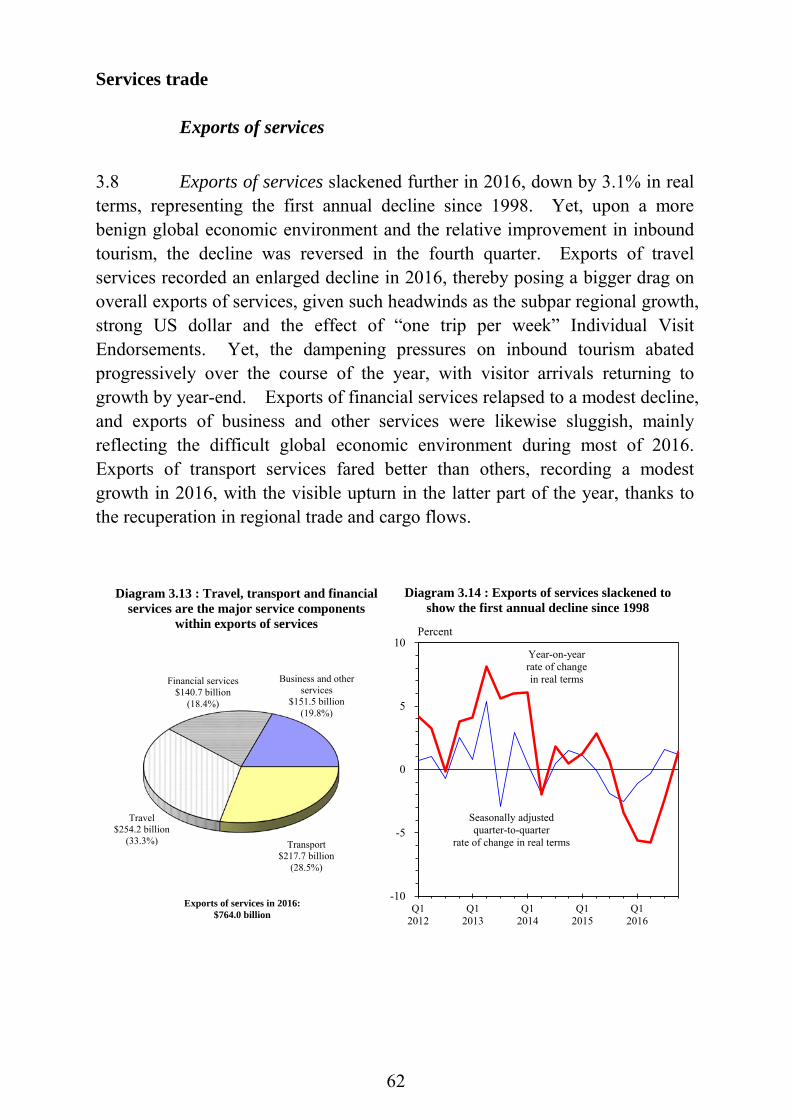
62
Services trade Exports of services
3.8 Exports of services slackened further in 2016, down by 3.1% in real terms, representing the first annual decline since 1998. Yet, upon a more benign global economic environment and the relative improvement in inbound tourism, the decline was reversed in the fourth quarter. Exports of travel services recorded an enlarged decline in 2016, thereby posing a bigger drag on overall exports of services, given such headwinds as the subpar regional growth, strong US dollar and the effect of “one trip per week” Individual Visit Endorsements. Yet, the dampening pressures on inbound tourism abated progressively over the course of the year, with visitor arrivals returning to growth by year-end. Exports of financial services relapsed to a modest decline, and exports of business and other services were likewise sluggish, mainly reflecting the difficult global economic environment during most of 2016. Exports of transport services fared better than others, recording a modest growth in 2016, with the visible upturn in the latter part of the year, thanks to the recuperation in regional trade and cargo flows.
Financial services $140.7 billion
(18.4%)
Business and other services
$151.5 billion(19.8%)
Q12012
Q12013
Q12014
Q12015
Q12016
-10
-5
0
5
10Percent
Diagram 3.14 : Exports of services slackened to show the first annual decline since 1998
Diagram 3.13 : Travel, transport and financial services are the major service components
within exports of services
Exports of services in 2016:$764.0 billion
Transport $217.7 billion
(28.5%)
Seasonally adjustedquarter-to-quarter
rate of change in real terms
Travel $254.2 billion
(33.3%)
Year-on-yearrate of changein real terms

63
Table 3.4 : Exports of services by major service group (year-on-year rate of change in real terms (%))
Exports of services
Of which :
Transport
Travel(a)
Financial services
Business and other services
2015 Annual
0.3 0.6 -3.5 9.4 -0.9
Q1 1.3 (1.1) 2.0 -3.1 7.9 2.1 Q2 2.8 (-0.1) 1.0 -0.6 21.8 -1.5 Q3 0.7 (-1.9) 1.6 -3.6 10.5 -1.9 Q4
-3.4 (-2.5) -2.3 -6.5 -0.1 -2.0
2016 Annual -3.1 2.1 -8.9 -3.5 -0.3 Q1 -5.6 (-1.1) -1.8 -13.3 -0.3 -1.9 Q2 -5.8 (-0.3) -1.3 -8.9 -14.8 * Q3 -2.4 (1.6) 2.4 -8.5 -1.8 -0.4 Q4 1.4 (1.2) 9.4 -4.7 1.4 1.1
Notes : Figures are compiled based on the change of ownership principle in recording goods sent
abroad for processing and merchanting under the standards stipulated in the System of National Accounts 2008.
(a) Comprising mainly inbound tourism receipts. ( ) Seasonally adjusted quarter-to-quarter rate of change. (*) Change within ±0.05%.
Imports of services 3.9 Imports of services grew modestly by 1.9% in real terms in 2016, much decelerated from the 5.1% growth in 2015. Performance varied notably amongst different components. Imports of travel services held firm all through, underpinned by the keen interest of local residents in overseas travel amid resilient job and income conditions. In contrast, imports of transport services were weak, though with some relative improvement in the fourth quarter, in tandem with the return of regional trade and cargo flows. Imports of manufacturing services slackened and recorded a decline in 2016, as outward processing activities fell amid weak global demand. Imports of business and other services also saw weaker growth in 2016 amid the bumpy global economic recovery.

64
Table 3.5 : Imports of services by major service group (year-on-year rate of change in real terms (%))
Of which :
Imports of services
Travel(+)
Transport
Manufacturing
services(^)
Business and other services
2015 Annual
5.1 12.4 -1.6 3.2 4.3
Q1 6.1 (2.4) 13.3 * 2.1 5.8 Q2 4.7 (1.8) 11.2 -3.8 4.6 5.7 Q3 4.6 (-0.1) 13.0 -2.8 1.7 4.5 Q4
4.9 (0.6) 12.2 0.6 4.4 1.6
2016 Annual
1.9 5.8 -0.3 -2.7 1.8
Q1 4.0 (1.5) 12.8 -0.4 -0.1 0.5 Q2 1.1 (-1.0) 2.8 -1.0 -1.6 2.6 Q3 0.7 (-0.3) 3.7 -1.1 -3.8 1.5 Q4 1.8 (1.6) 4.6 1.4 -4.4 2.7
Notes : Figures are compiled based on the change of ownership principle in recording goods sent
abroad for processing and merchanting under the standards stipulated in the System of National Accounts 2008.
(+) Comprising mainly outbound travel spending. (^) This includes the value of processing fees paid by Hong Kong to the processing units
outside Hong Kong and raw materials / semi-manufactures directly procured by these processing units.
( ) Seasonally adjusted quarter-to-quarter rate of change.
(*) Change within ±0.05%.
Travel $187.3 billion
(32.4%)
Diagram 3.15 : Travel services had the largest share in imports of services
Q12012
Q12013
Q12014
Q12015
Q12016
-10
-5
0
5
10 Percent
Diagram 3.16 : Imports of services grew modestly in 2016
Year-on-yearrate of changein real terms
Imports of services in 2016:$578.0 billion
Seasonally adjustedquarter-to-quarter
rate of change in real terms
Business and other services
$170.8 billion(29.5%)
Transport $133.0 billion
(23.0%)
Manufacturing services
$86.9 billion(15.0%)
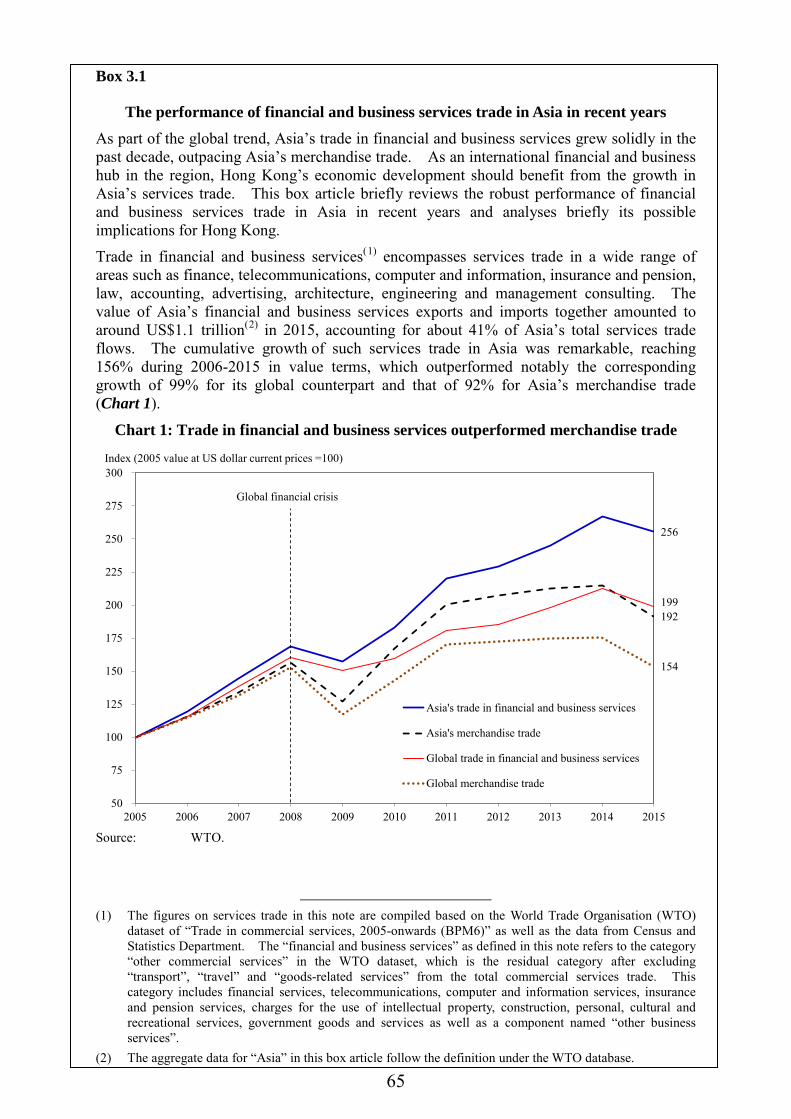
65
Box 3.1
The performance of financial and business services trade in Asia in recent years As part of the global trend, Asia’s trade in financial and business services grew solidly in the past decade, outpacing Asia’s merchandise trade. As an international financial and business hub in the region, Hong Kong’s economic development should benefit from the growth in Asia’s services trade. This box article briefly reviews the robust performance of financial and business services trade in Asia in recent years and analyses briefly its possible implications for Hong Kong.
Trade in financial and business services(1) encompasses services trade in a wide range of areas such as finance, telecommunications, computer and information, insurance and pension, law, accounting, advertising, architecture, engineering and management consulting. The value of Asia’s financial and business services exports and imports together amounted to around US$1.1 trillion(2) in 2015, accounting for about 41% of Asia’s total services trade flows. The cumulative growth of such services trade in Asia was remarkable, reaching 156% during 2006-2015 in value terms, which outperformed notably the corresponding growth of 99% for its global counterpart and that of 92% for Asia’s merchandise trade (Chart 1).
Chart 1: Trade in financial and business services outperformed merchandise trade
Source: WTO.
(1) The figures on services trade in this note are compiled based on the World Trade Organisation (WTO)
dataset of “Trade in commercial services, 2005-onwards (BPM6)” as well as the data from Census and Statistics Department. The “financial and business services” as defined in this note refers to the category “other commercial services” in the WTO dataset, which is the residual category after excluding “transport”, “travel” and “goods-related services” from the total commercial services trade. This category includes financial services, telecommunications, computer and information services, insurance and pension services, charges for the use of intellectual property, construction, personal, cultural and recreational services, government goods and services as well as a component named “other business services”.
(2) The aggregate data for “Asia” in this box article follow the definition under the WTO database.
256
192 199
154
50
75
100
125
150
175
200
225
250
275
300
2005 2006 2007 2008 2009 2010 2011 2012 2013 2014 2015
Asia's trade in financial and business services
Asia's merchandise trade
Global trade in financial and business services
Global merchandise trade
Index (2005 value at US dollar current prices =100)
Global financial crisis

66
Box 3.1 (Cont’d) From the broader macro perspective, Asian economies as a whole gained importance in the past decade as a main source of imports of financial and business services, accounting for 24% of the global total in 2015, up from 20% in 2005. The scale of imports of these services varies across Asian economies, depending on such factors as economic size and stage of developments. Japan and the Mainland are the biggest importers, accounting for 20% and 18% respectively of Asia’s total in 2015. Other emerging markets economies are also important. ASEAN’s and India’s imports together accounted for roughly 37% of the total and experienced notable growth in the recent past.
Chart 2: Increasing service orientation and improved connectivity in Asia were favourable for growth in trade in financial and business services
Note: (^) For Japan and the US, the latest data for “value added of services as a percentage of GDP”
from the World Bank are as of 2014. Sources: World Bank, the International Monetary Fund and Census and Statistics Department.
The growing demand for financial and business services in Asia was driven by a variety of factors, in part an embodiment of the increasing service orientation in the region as their economies become more mature. As shown in Chart 2a, the share of GDP contributed by the services sector generally showed positive correlation with the stage of developments. Along with solidly rising income levels, the share of services sector in GDP rose in many Asian economies between 2000 and 2015. Specifically, according to World Bank’s figures, the value added of services accounted for around 50% of GDP in 2015 in the Mainland, visibly higher than that of 40% in 2000. Even for the more developed economies such as Singapore, the share of services also grew from 65% in 2000 to 74% in 2015. Rising income and continued economic rebalancing towards the services sector in Asia present growing opportunities for services trade and division of labour in the region.
Other favourable factors have also been at play. For instance, massive investments in infrastructure in transports and communication in Asia enhanced connectivity in the region, making provision of business services over a long distance at reasonable costs and speed plausible. As an illustration, internet accessibility in emerging markets in Asia rose notably in the recent past, a fundamental trend propelling the prosperity of e-commerce (Chart 2b).
The Mainland
Hong Kong
Indonesia
India
Japan
KoreaMalaysia
Philippines
Singapore
Thailand
Vietnam
USUK
30
40
50
60
70
80
90
100
- 20,000 40,000 60,000Per-capita GDP at current prices
in US dollar, 2015
Value added of services as a percentage of GDP, 2015^
Chart 2a: The share of services in GDPgenerally showed positive correlation
with per-capita income
Chart 2b: Internet accessibility has increased visiblyamong Asian economies in the past decade
57 61
49
13 9
5
15
2 4
85 82
71
53 50
41 39
26 22
-
10
20
30
40
50
60
70
80
90
100
Hon
g K
ong
Sing
apor
e
Mal
aysi
a
Vie
tnam
Mai
nlan
d o
f Chi
na
Phili
ppin
es
Thai
land
Indi
a
Indo
nesi
a
20052015
Internet users per 100 people
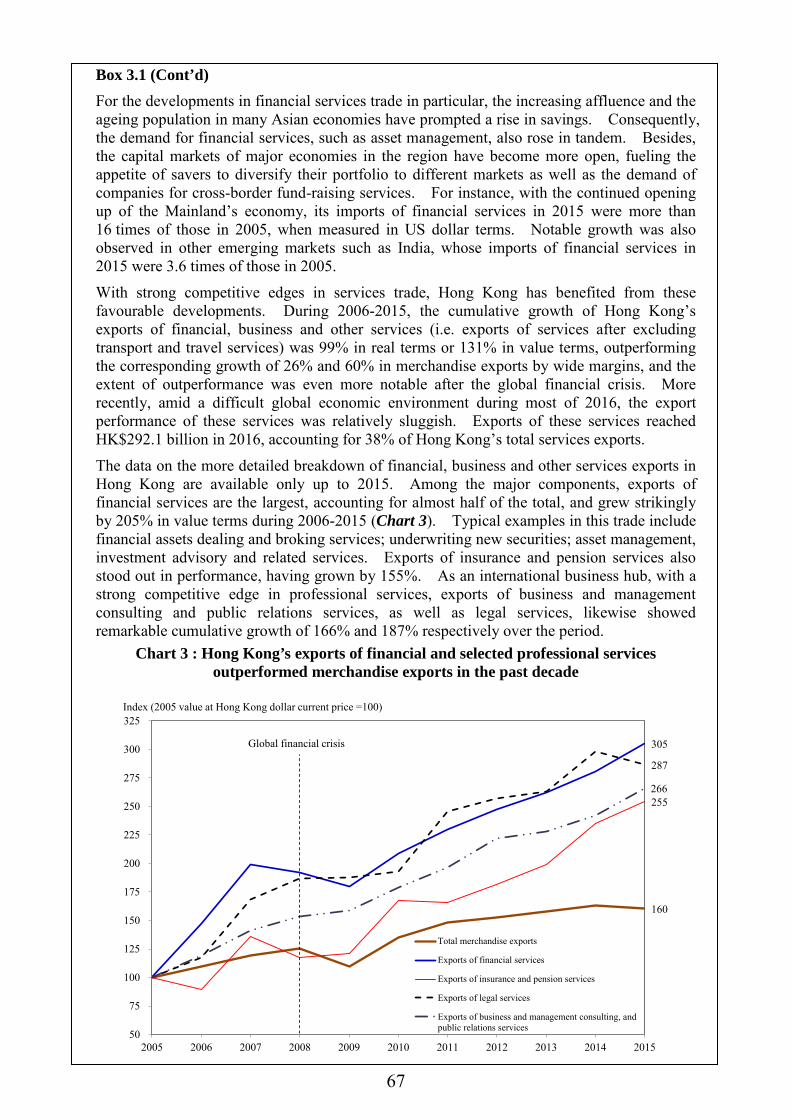
67
Box 3.1 (Cont’d) For the developments in financial services trade in particular, the increasing affluence and the ageing population in many Asian economies have prompted a rise in savings. Consequently, the demand for financial services, such as asset management, also rose in tandem. Besides, the capital markets of major economies in the region have become more open, fueling the appetite of savers to diversify their portfolio to different markets as well as the demand of companies for cross-border fund-raising services. For instance, with the continued opening up of the Mainland’s economy, its imports of financial services in 2015 were more than 16 times of those in 2005, when measured in US dollar terms. Notable growth was also observed in other emerging markets such as India, whose imports of financial services in 2015 were 3.6 times of those in 2005.
With strong competitive edges in services trade, Hong Kong has benefited from these favourable developments. During 2006-2015, the cumulative growth of Hong Kong’s exports of financial, business and other services (i.e. exports of services after excluding transport and travel services) was 99% in real terms or 131% in value terms, outperforming the corresponding growth of 26% and 60% in merchandise exports by wide margins, and the extent of outperformance was even more notable after the global financial crisis. More recently, amid a difficult global economic environment during most of 2016, the export performance of these services was relatively sluggish. Exports of these services reached HK$292.1 billion in 2016, accounting for 38% of Hong Kong’s total services exports.
The data on the more detailed breakdown of financial, business and other services exports in Hong Kong are available only up to 2015. Among the major components, exports of financial services are the largest, accounting for almost half of the total, and grew strikingly by 205% in value terms during 2006-2015 (Chart 3). Typical examples in this trade include financial assets dealing and broking services; underwriting new securities; asset management, investment advisory and related services. Exports of insurance and pension services also stood out in performance, having grown by 155%. As an international business hub, with a strong competitive edge in professional services, exports of business and management consulting and public relations services, as well as legal services, likewise showed remarkable cumulative growth of 166% and 187% respectively over the period.
Chart 3 : Hong Kong’s exports of financial and selected professional services outperformed merchandise exports in the past decade
160
305
255
287
266
50
75
100
125
150
175
200
225
250
275
300
325
2005 2006 2007 2008 2009 2010 2011 2012 2013 2014 2015
Total merchandise exports
Exports of financial services
Exports of insurance and pension services
Exports of legal services
Exports of business and management consulting, andpublic relations services
Index (2005 value at Hong Kong dollar current price =100)
Global financial crisis
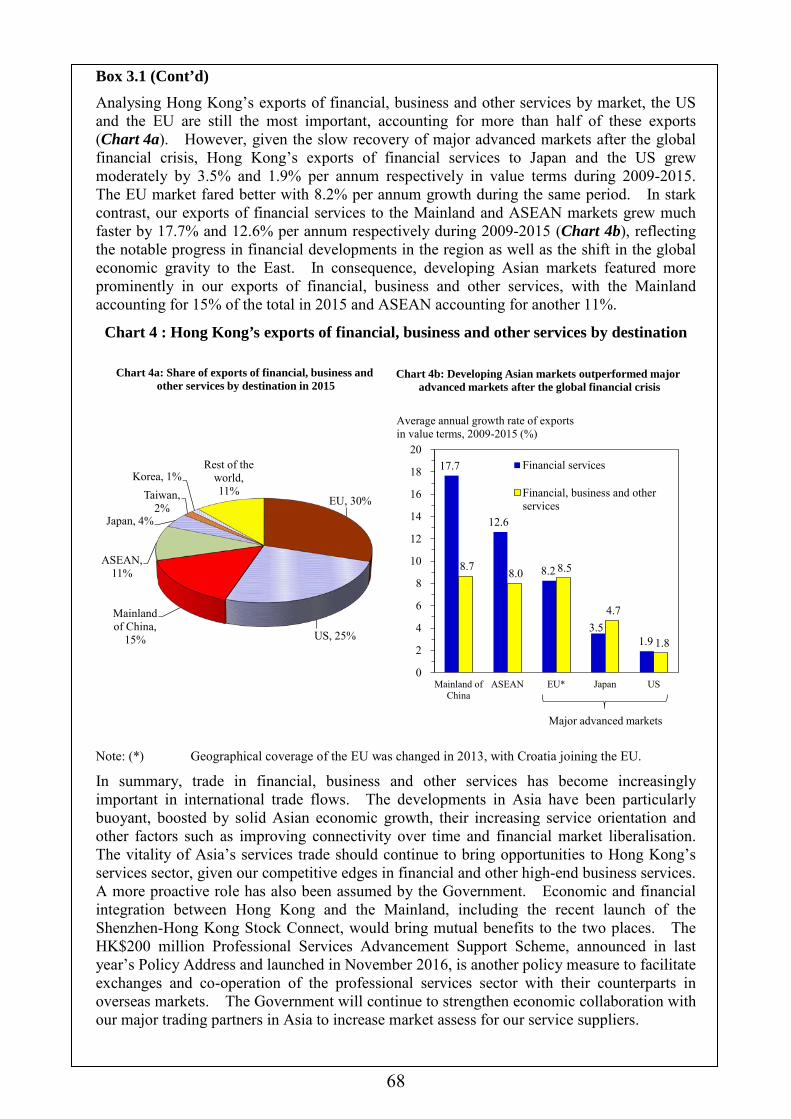
68
Box 3.1 (Cont’d) Analysing Hong Kong’s exports of financial, business and other services by market, the US and the EU are still the most important, accounting for more than half of these exports (Chart 4a). However, given the slow recovery of major advanced markets after the global financial crisis, Hong Kong’s exports of financial services to Japan and the US grew moderately by 3.5% and 1.9% per annum respectively in value terms during 2009-2015. The EU market fared better with 8.2% per annum growth during the same period. In stark contrast, our exports of financial services to the Mainland and ASEAN markets grew much faster by 17.7% and 12.6% per annum respectively during 2009-2015 (Chart 4b), reflecting the notable progress in financial developments in the region as well as the shift in the global economic gravity to the East. In consequence, developing Asian markets featured more prominently in our exports of financial, business and other services, with the Mainland accounting for 15% of the total in 2015 and ASEAN accounting for another 11%.
Chart 4 : Hong Kong’s exports of financial, business and other services by destination
Note: (*) Geographical coverage of the EU was changed in 2013, with Croatia joining the EU.
In summary, trade in financial, business and other services has become increasingly important in international trade flows. The developments in Asia have been particularly buoyant, boosted by solid Asian economic growth, their increasing service orientation and other factors such as improving connectivity over time and financial market liberalisation. The vitality of Asia’s services trade should continue to bring opportunities to Hong Kong’s services sector, given our competitive edges in financial and other high-end business services. A more proactive role has also been assumed by the Government. Economic and financial integration between Hong Kong and the Mainland, including the recent launch of the Shenzhen-Hong Kong Stock Connect, would bring mutual benefits to the two places. The HK$200 million Professional Services Advancement Support Scheme, announced in last year’s Policy Address and launched in November 2016, is another policy measure to facilitate exchanges and co-operation of the professional services sector with their counterparts in overseas markets. The Government will continue to strengthen economic collaboration with our major trading partners in Asia to increase market assess for our service suppliers.
17.7
12.6
8.2
3.5 1.9
8.7 8.0 8.5
4.7
1.8
0
2
4
6
8
10
12
14
16
18
20
Mainland ofChina
ASEAN EU* Japan US
Financial services
Financial, business and otherservices
Chart 4b: Developing Asian markets outperformed major advanced markets after the global financial crisis
Chart 4a: Share of exports of financial, business and other services by destination in 2015
Average annual growth rate of exportsin value terms, 2009-2015 (%)
EU, 30%
US, 25%
Mainland of China,
15%
ASEAN, 11%
Japan, 4%
Taiwan, 2%
Korea, 1%Rest of the
world, 11%
Major advanced markets
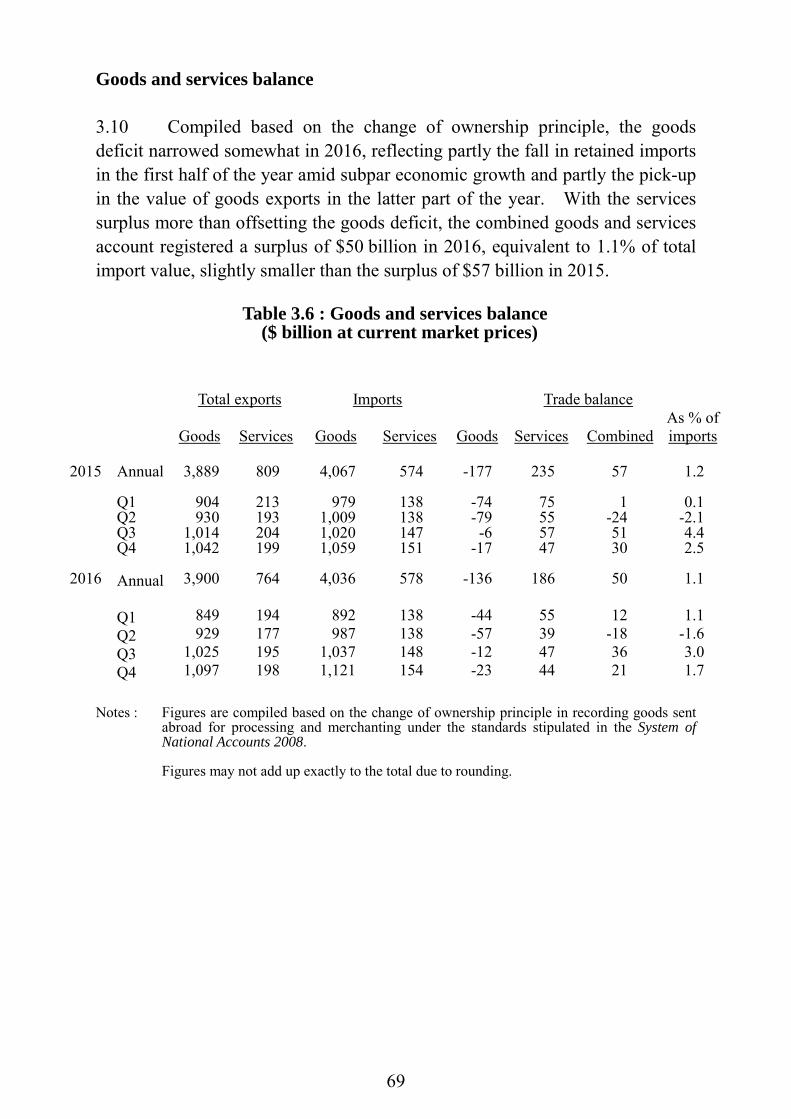
69
Goods and services balance 3.10 Compiled based on the change of ownership principle, the goods deficit narrowed somewhat in 2016, reflecting partly the fall in retained imports in the first half of the year amid subpar economic growth and partly the pick-up in the value of goods exports in the latter part of the year. With the services surplus more than offsetting the goods deficit, the combined goods and services account registered a surplus of $50 billion in 2016, equivalent to 1.1% of total import value, slightly smaller than the surplus of $57 billion in 2015.
Table 3.6 : Goods and services balance
($ billion at current market prices)
Total exports Imports Trade balance
Goods Services
Goods
Services
Goods
Services
Combined
As % of imports
2015 Annual 3,889 809 4,067 574 -177 235 57 1.2 Q1 904 213 979 138 -74 75 1 0.1 Q2 930 193 1,009 138 -79 55 -24 -2.1 Q3 1,014 204 1,020 147 -6 57 51 4.4 Q4
1,042 199 1,059 151 -17 47 30 2.5
2016 Annual 3,900 764 4,036 578 -136 186 50 1.1 Q1 849 194 892 138 -44 55 12 1.1 Q2 929 177 987 138 -57 39 -18 -1.6 Q3 1,025 195 1,037 148 -12 47 36 3.0 Q4 1,097 198 1,121 154 -23 44 21 1.7
Notes : Figures are compiled based on the change of ownership principle in recording goods sent
abroad for processing and merchanting under the standards stipulated in the System of National Accounts 2008.
Figures may not add up exactly to the total due to rounding.
70
Other developments 3.11 Hong Kong attaches great importance to deepening economic ties with the Mainland, our largest trading partner. Strengthening the economic collaborations with the Mainland is a prominent strategy for our economic development. In 2016, the Government made further progress on this front. In March, the 21st Working Meeting of the Hong Kong/Guangdong Co-operation Joint Conference was held, formulating the 2016 Work Plan covering 92 co-operation items. In June, an agreement between Hong Kong and Shanghai was signed, to further the financial co-operation between the two places. The Ninth Hong Kong-Macao Co-operation High Level Meeting was held in July. A Working Group on Enhancing Hong Kong/Macao Economic Co-operation has been set up to strengthen co-operation between the two places. Separately, in September, the 19th Plenary of the Hong Kong/Guangdong Co-operation Joint Conference was held, with the signing of nine co-operation agreements. 3.12 The Belt and Road Initiative, as a principal development strategy adopted by the Mainland, will also bring about vast economic opportunities to Hong Kong, particularly considering our important role as an international business hub for overseas and Mainland companies. Indeed, according to the United Nations Conference on Trade and Development’s World Investment Report 2016, Hong Kong’s foreign direct investment inflows ranked the second largest among the world economies in 2015 for the second consecutive year. 3.13 In light of the huge market potential of the emerging market economies along the route, the inaugural Belt and Road Summit, jointly organised by the Government and Hong Kong Trade Development Council, was held in Hong Kong in May 2016. In June, the Government announced that a steering committee would be set up to formulate strategies and policies for Hong Kong’s participation in the Belt and Road Initiative. In August, a Belt and Road Office was also established to take forward related studies and co-ordinate work among the Government and other organisations. Besides, the Hong Kong Monetary Authority launched the Infrastructure Financing Facilitation Office in July, with a view to providing a platform for pooling the efforts of investors, banks and the financial sector to offer financial services and facilitate investment in infrastructure projects in economies along the Belt and Road. 3.14 To further enhance Hong Kong’s competitive edge as an international commercial and financial centre, the Government actively strengthened
71
relations with our economic partners along the Belt and Road routes. In May 2016, a memorandum of understanding (MoU) was signed with Indonesia, the largest and most populous economy in ASEAN, pledging mutual co-operation on investment promotion exchanges and best practices. In 2016, a new Economic and Trade Office also began operations in Jakarta, Indonesia. In November, a MoU on Economic Co-operation between Hong Kong and Iran was signed, providing a framework for enhancing co-operation in various fields, including trade and tourism. 3.15 As an international business hub, the Government has also been fostering closer economic relationships with economic partners on the other side of the Pacific. In September 2016, the investment agreement with Canada entered into force. The agreement provides additional assurance to investors so as to expand the bilateral investment flows. In November, an investment agreement between Chile and Hong Kong was signed. The investment agreement is an addition to the free trade agreement between Hong Kong and Chile signed in 2012, which will help expand investment flows and further strengthen the economic and trade ties between the two places. Notes : (1) Changes in merchandise exports and imports in real terms are derived by discounting
the effect of price changes from changes in the value of the trade aggregates. Estimates of price changes for the trade aggregates are based on changes in unit values, which do not take into account changes in the composition or quality of the goods traded, except for some selected commodities for which specific price indices are available. The real growth figures reported here are based on the external trade quantum index series compiled using the chain linking approach, which were first released in March 2015 to replace the previous trade index numbers compiled using the Laspeyres method with a fixed base year. The series are not comparable with the real trade aggregates under GDP (reported in Chapter 1) which are compiled based on the change of ownership principle in recording goods sent abroad for processing and merchanting under the standards stipulated in the System of National Accounts 2008. Apart from this, non-monetary gold is recorded as a separate item in the statistics of merchandise trade and not included in the trade aggregates reported in Chapter 3, but is included in the trade aggregates under GDP in accordance to the international compilation standard.
(2) Re-exports are those goods which have previously been imported into Hong Kong and are subsequently exported without having undergone in Hong Kong any manufacturing processes which change permanently the shape, nature, form or utility of the goods.
72
CHAPTER 4 : DEVELOPMENTS IN SELECTED SECTORS Summary Following the brief consolidation in late 2015 and early 2016, the
residential property market rebounded in the second quarter and turned exuberant in the third quarter amid a still tight demand-supply situation. Yet the market cooled down visibly after the Government introduced the latest round of demand-side management measure in early November, with trading activities turning very quiet and the upward momentum in flat prices moderating noticeably. Overall flat prices rose by a cumulative 8% during the full-year 2016.
The Government’s sustained efforts to increase land and flat supply have
yielded results. Total flat supply in the coming three to four years rose to a new record high of 94 000 units. Meanwhile, as the various demand-side management measures yielded the intended results, speculative activities remained subdued and non-local demand stayed low in 2016, while investment activities also quietened down markedly towards the end of the year.
The commercial and industrial property markets remained lacklustre in
2016, despite some relative firm-up in the latter part of the year. Trading activities were very quiet, while prices and rentals generally showed modest performance.
Inbound tourism remained in a consolidation mode during most of 2016,
but there was some relative improvement since the second quarter as the effect of the “one trip per week” Individual Visit Endorsements gradually faded. Overall visitor arrivals reverted to a marginal year-on-year increase in the fourth quarter, though for 2016 as a whole they still fell by 4.5% to 56.7 million, representing the second consecutive year of annual decline.
The logistics sector showed some pick-up over the course of 2016 along
with the gradual improvement of the external trade environment. Total container throughput declined by a narrowed 2.5% to 19.6 million twenty-foot equivalent units, while air freight throughput rose by 3.2%.
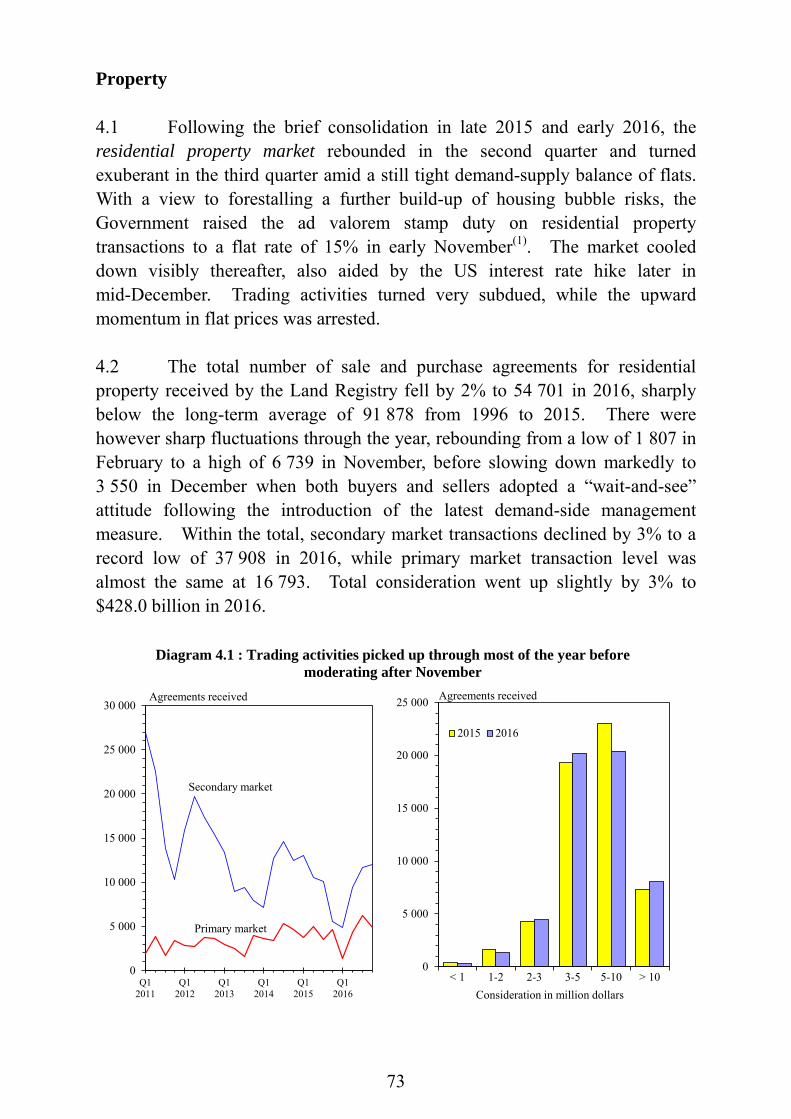
73
Property 4.1 Following the brief consolidation in late 2015 and early 2016, the residential property market rebounded in the second quarter and turned exuberant in the third quarter amid a still tight demand-supply balance of flats. With a view to forestalling a further build-up of housing bubble risks, the Government raised the ad valorem stamp duty on residential property transactions to a flat rate of 15% in early November(1). The market cooled down visibly thereafter, also aided by the US interest rate hike later in mid-December. Trading activities turned very subdued, while the upward momentum in flat prices was arrested. 4.2 The total number of sale and purchase agreements for residential property received by the Land Registry fell by 2% to 54 701 in 2016, sharply below the long-term average of 91 878 from 1996 to 2015. There were however sharp fluctuations through the year, rebounding from a low of 1 807 in February to a high of 6 739 in November, before slowing down markedly to 3 550 in December when both buyers and sellers adopted a “wait-and-see” attitude following the introduction of the latest demand-side management measure. Within the total, secondary market transactions declined by 3% to a record low of 37 908 in 2016, while primary market transaction level was almost the same at 16 793. Total consideration went up slightly by 3% to $428.0 billion in 2016.
0
5 000
10 000
15 000
20 000
25 000
< 1 1-2 2-3 3-5 5-10 > 10
2015 2016
Agreements received
Primary market
Consideration in million dollarsQ1
2011Q1
2012Q1
2013Q1
2014Q1
2015Q1
2016
0
5 000
10 000
15 000
20 000
25 000
30 000Agreements received
Secondary market
Primary market
Diagram 4.1 : Trading activities picked up through most of the year beforemoderating after November

74
4.3 Flat prices also exhibited sharp volatilities over the course of the year. Overall flat prices switched from a fall of 5% during the first quarter to an increase of 2% during the second quarter and 7% during the third quarter, but the increase moderated to 4% during the fourth quarter reflecting the sharp deceleration after the latest hike in ad valorem stamp duty. For the year as a whole, overall flat prices in December 2016 still went up by 8% over December 2015. Analysed by size, prices of small/medium-sized flats and large flats leaped by 8% and 7% respectively. 4.4 In parallel, the leasing market also revived since the second quarter before cooling down again in the fourth quarter. Overall flat rentals in December 2016 inched up by 1% over December 2015, but were still 3% below the peak in September 2015. Analysed by size, rentals of small/medium-sized flats rose by 1% during 2016, while rentals of large flats declined by 1%. Reflecting the relative movements of flat prices and rentals, the average rental yield for residential property edged down from 2.8% in December 2015 to 2.6% in December 2016.
2011 2012 2013 2014 2015 201650
60
70
80
90
100
110
120
130
140
150
160
Large flats All flats Small/medium-sized flats
Index (Oct 1997=100)(b) Rentals
Introduction ofBSD
Introduction of DSD
Ad valoremstamp duty hike
2011 2012 2013 2014 2015 201650
60
70
80
90
100
110
120
130
140
150
160
170
180
190
Large flats All flats Small/medium-sized flats
Index (Oct 1997=100)(a) Prices
Introduction of Buyer's Stamp
Duty (BSD)
Introduction of Double Stamp Duty (DSD)
Ad valorem stamp duty hike
Diagram 4.2 : Flat prices and rentals showed decelerated growth in the fourth quarter
Note : Residential property price index pertains to secondary market transactions only. Large flats refer to those with a saleable area of atleast 100 m2, and small/medium-sized flats with a saleable area of less than 100 m2.
4.5 As a result of the surge over the past several years, overall flat prices in December 2016 exceeded the 1997 peak by 77%. The home purchase affordability (i.e. the ratio of mortgage payment for a 45-square metre flat to median income of households, excluding those living in public housing) worsened to around 63% in the fourth quarter, significantly above the long-term average of 46% over 1996-2015. Should interest rates rise by three percentage points to a more normal level, the ratio would soar to 82%.
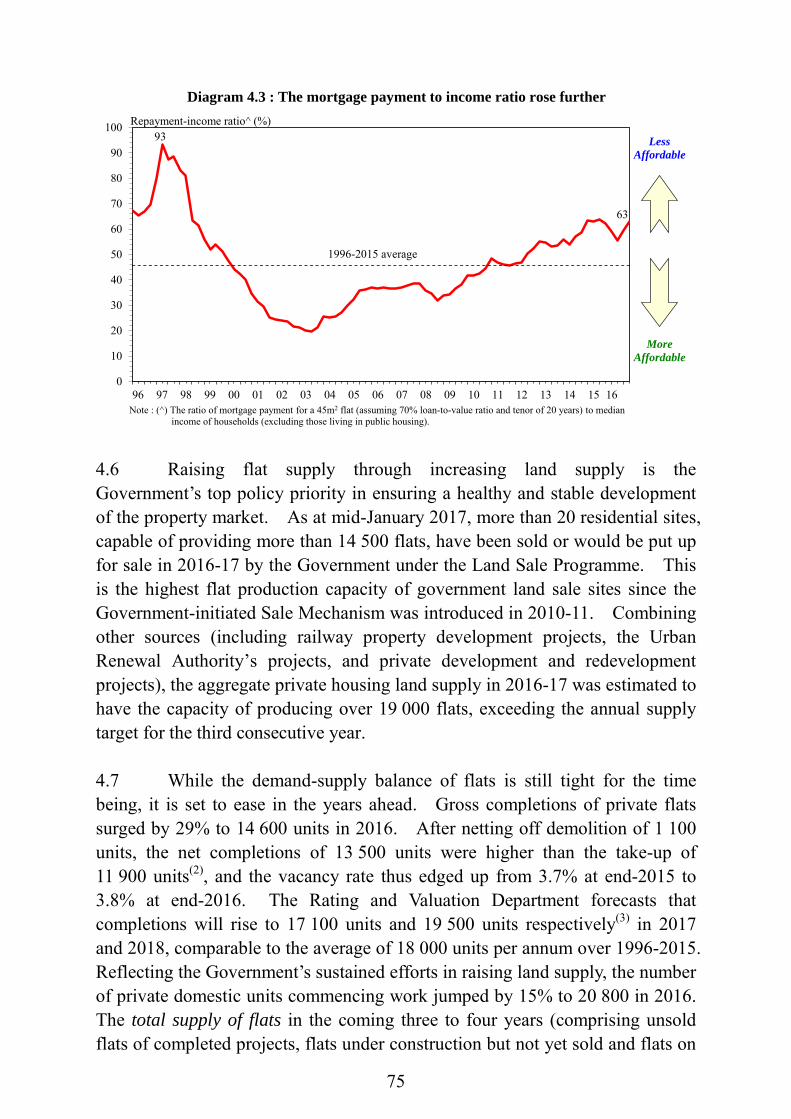
75
96 97 98 99 00 01 02 03 04 05 06 07 08 09 10 11 12 13 14 15 160
10
20
30
40
50
60
70
80
90
100 Repayment-income ratio^ (%)
Diagram 4.3 : The mortgage payment to income ratio rose further
93
1996-2015 average
63
Note : (^) The ratio of mortgage payment for a 45m2 flat (assuming 70% loan-to-value ratio and tenor of 20 years) to median income of households (excluding those living in public housing).
MoreAffordable
LessAffordable
4.6 Raising flat supply through increasing land supply is the Government’s top policy priority in ensuring a healthy and stable development of the property market. As at mid-January 2017, more than 20 residential sites, capable of providing more than 14 500 flats, have been sold or would be put up for sale in 2016-17 by the Government under the Land Sale Programme. This is the highest flat production capacity of government land sale sites since the Government-initiated Sale Mechanism was introduced in 2010-11. Combining other sources (including railway property development projects, the Urban Renewal Authority’s projects, and private development and redevelopment projects), the aggregate private housing land supply in 2016-17 was estimated to have the capacity of producing over 19 000 flats, exceeding the annual supply target for the third consecutive year. 4.7 While the demand-supply balance of flats is still tight for the time being, it is set to ease in the years ahead. Gross completions of private flats surged by 29% to 14 600 units in 2016. After netting off demolition of 1 100 units, the net completions of 13 500 units were higher than the take-up of 11 900 units(2), and the vacancy rate thus edged up from 3.7% at end-2015 to 3.8% at end-2016. The Rating and Valuation Department forecasts that completions will rise to 17 100 units and 19 500 units respectively(3) in 2017 and 2018, comparable to the average of 18 000 units per annum over 1996-2015. Reflecting the Government’s sustained efforts in raising land supply, the number of private domestic units commencing work jumped by 15% to 20 800 in 2016. The total supply of flats in the coming three to four years (comprising unsold flats of completed projects, flats under construction but not yet sold and flats on

76
disposed sites where construction can start any time) rose to a new record high of 94 000 units as estimated at end-2016. An additional 7 300 units could also be added to the total supply after the conversion of a number of residential sites into “disposed sites”. 4.8 The Government has also put in significant efforts to manage demand and reduce the possible risks to financial stability arising from an exuberant property market(4). These measures have yielded notable results. On speculative activities, the number of short-term resale (comprising confirmor transactions and resale within 24 months after assignment) remained subdued at an average of 28 cases per month or 0.5% of total transactions in 2016, well below the monthly average of 2 661 cases or 20.0% in January to November 2010 (i.e. the period before the introduction of the Special Stamp Duty). Reflecting the effects of the Buyer’s Stamp Duty, purchases by non-local individuals and non-local companies also stayed low at 94 cases per month or 1.8% of total transactions in 2016, much lower than the monthly average of 365 cases or 4.5% in January to October 2012 (i.e. the period before the introduction of the Buyer’s Stamp Duty). As an indicator of investment activities, purchases by Hong Kong Permanent Residents (HKPRs) who owned at least one residential property plunged to 225 cases or 6.3% of total transactions in December 2016, sharply below the monthly average of 1 181 cases or 22.1% in January to November 2016 before the latest hike in ad valorem stamp duty. For mortgage lending, the average loan-to-value ratio of new mortgages was 52% in 2016, likewise considerably below the average of 64% in January to October 2009 before the first round of macro-prudential measures for residential property mortgage lending was introduced by the Hong Kong Monetary Authority.

77
0
5
10
15
20
25
30
0
1 000
2 000
3 000
4 000
5 000
6 000
7 000
8 000
9 000
10 000
11 000
12 000
Q12010
Q12011
Q12012
Q12013
Q12014
Q12015
Q12016
Number
Diagram 4.4 : Speculative activities stayed subdued
Share of total transactions (%)
Resale within 24 months after assignment (LHS)
Confirmor transactions (LHS)
Confirmor transactions and short-term resale cases within 24 months as a share of total transactions (RHS)
Note : Confirmor transactions refer to resale before assignment.
Introduction of SSD
0
1
2
3
4
5
6
7
8
0
100
200
300
400
500
600
700
800
900
1 000
1 100
1 200
1 2 3 4 5 6 7 8 9 101112 1 2 3 4 5 6 7 8 9 101112 1 2 3 4 5 6 7 8 9 101112 1 2 3 4 5 6 7 8 9 101112 1 2 3 4 5 6 7 8 9 101112
2012 2013 2014 2015 2016
Purchases by non-local individuals and non-localcompanies as a share of total transactions (RHS)
Purchases by non-local individuals (LHS)
Purchases by non-local companies (LHS)
Number Share of total transactions (%)
Diagram 4.5 : Purchases by non-local buyers remained low
Introduction of DSD
Introductionof BSD
Ad valoremstamp duty hike

78
0
5
10
15
20
25
30
35
40
45
50
0
200
400
600
800
1 000
1 200
1 400
1 600
1 800
2 000
2 200
2 400
2 600
3 4 5 6 7 8 9 101112 1 2 3 4 5 6 7 8 9 101112 1 2 3 4 5 6 7 8 9 101112 1 2 3 4 5 6 7 8 9 101112
2013 2014 2015 2016
Diagram 4.6 : Investment activities quietened down after the latest hike in ad valorem stamp duty
Number Share of total transactions (%)
Average over Apr 2012-Feb 2013 (RHS)
Purchases by HKPRs with at least one residential property (LHS) Purchases by HKPRs with at
least one residential property as a share of total transactions (RHS)
Ad valoremstamp duty hike
4.9 Looking forward, the uncertain global and local economic conditions as well as the pace of US interest rate normalisation will continue to be the major factors affecting the residential property market this year. In the medium term, as and when the increased land supply over the past few years turns into actual production of flats, the demand-supply balance of flats will gradually ease thereby leading to a more stable and healthy market. 4.10 The commercial and industrial property markets remained lacklustre in 2016, despite some relative firm-up in the latter part of the year. Trading activities were very quiet, while prices and rentals generally showed modest performance. 4.11 Overall prices of office space fell by 2% between December 2015 and December 2016. Within the total, prices of Grade A office space stayed virtually unchanged, while prices of Grade B and C office space fell by 3% and 4% respectively. Over the period, overall rentals rose by 3%, with those of Grade A, B and C office space rising by 3%, 2% and 2% respectively. As a result, the average rental yield of Grade A, B and C office space rose to 3.0%, 3.1% and 3.1% respectively in December 2016, from 2.9%, 3.0% and 2.9% a year earlier. Transactions plunged by 25% to a historic low of 1 100 cases in 2016. As the take-up of 98 100 m2 was lower than the completion of 153 100 m2, the vacancy rate edged up from 8.0% at end-2015 to 8.2% at end-2016, but was still below the long-term average of 10.0% over 1996-2015.
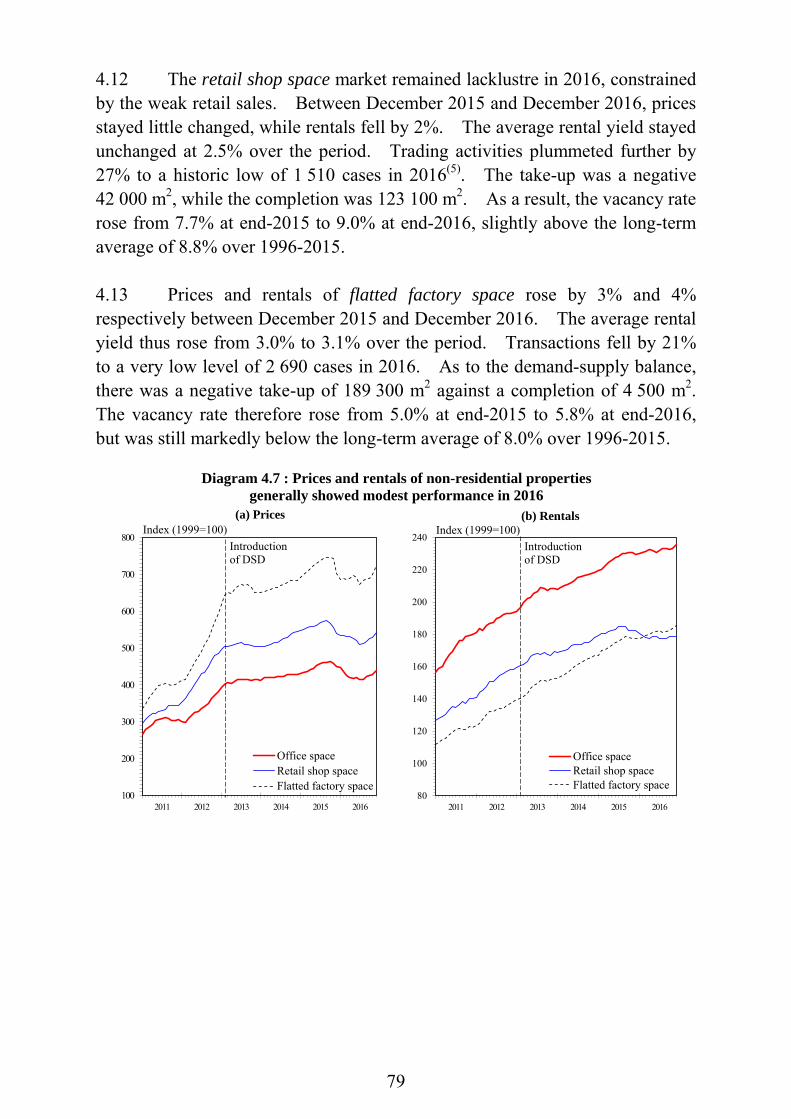
79
4.12 The retail shop space market remained lacklustre in 2016, constrained by the weak retail sales. Between December 2015 and December 2016, prices stayed little changed, while rentals fell by 2%. The average rental yield stayed unchanged at 2.5% over the period. Trading activities plummeted further by 27% to a historic low of 1 510 cases in 2016(5). The take-up was a negative 42 000 m2, while the completion was 123 100 m2. As a result, the vacancy rate rose from 7.7% at end-2015 to 9.0% at end-2016, slightly above the long-term average of 8.8% over 1996-2015. 4.13 Prices and rentals of flatted factory space rose by 3% and 4% respectively between December 2015 and December 2016. The average rental yield thus rose from 3.0% to 3.1% over the period. Transactions fell by 21% to a very low level of 2 690 cases in 2016. As to the demand-supply balance, there was a negative take-up of 189 300 m2 against a completion of 4 500 m2. The vacancy rate therefore rose from 5.0% at end-2015 to 5.8% at end-2016, but was still markedly below the long-term average of 8.0% over 1996-2015.
2011 2012 2013 2014 2015 2016100
200
300
400
500
600
700
800
Office spaceRetail shop spaceFlatted factory space
Index (1999=100)(a) Prices
Introductionof DSD
2011 2012 2013 2014 2015 201680
100
120
140
160
180
200
220
240
Office spaceRetail shop spaceFlatted factory space
Index (1999=100)(b) Rentals
Introductionof DSD
Diagram 4.7 : Prices and rentals of non-residential properties generally showed modest performance in 2016
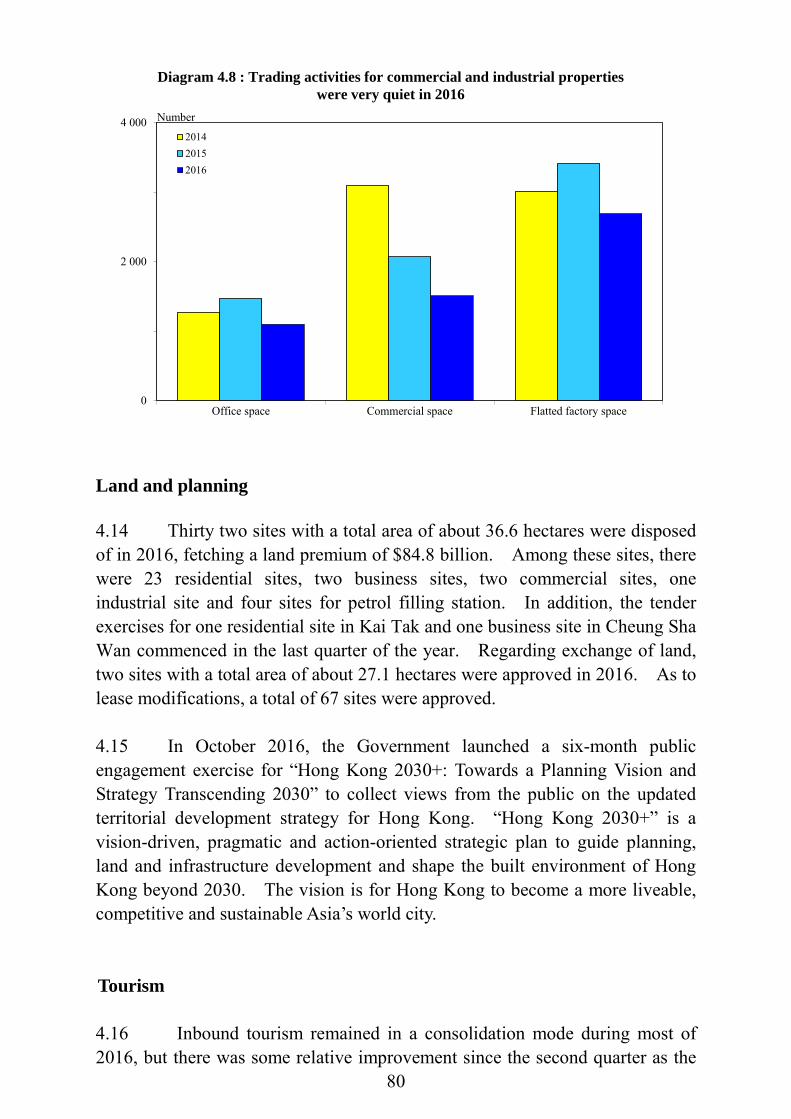
80
0
2 000
4 000
Office space Commercial space Flatted factory space
201420152016
Number
Diagram 4.8 : Trading activities for commercial and industrial propertieswere very quiet in 2016
Land and planning 4.14 Thirty two sites with a total area of about 36.6 hectares were disposed of in 2016, fetching a land premium of $84.8 billion. Among these sites, there were 23 residential sites, two business sites, two commercial sites, one industrial site and four sites for petrol filling station. In addition, the tender exercises for one residential site in Kai Tak and one business site in Cheung Sha Wan commenced in the last quarter of the year. Regarding exchange of land, two sites with a total area of about 27.1 hectares were approved in 2016. As to lease modifications, a total of 67 sites were approved. 4.15 In October 2016, the Government launched a six-month public engagement exercise for “Hong Kong 2030+: Towards a Planning Vision and Strategy Transcending 2030” to collect views from the public on the updated territorial development strategy for Hong Kong. “Hong Kong 2030+” is a vision-driven, pragmatic and action-oriented strategic plan to guide planning, land and infrastructure development and shape the built environment of Hong Kong beyond 2030. The vision is for Hong Kong to become a more liveable, competitive and sustainable Asia’s world city. Tourism 4.16 Inbound tourism remained in a consolidation mode during most of 2016, but there was some relative improvement since the second quarter as the
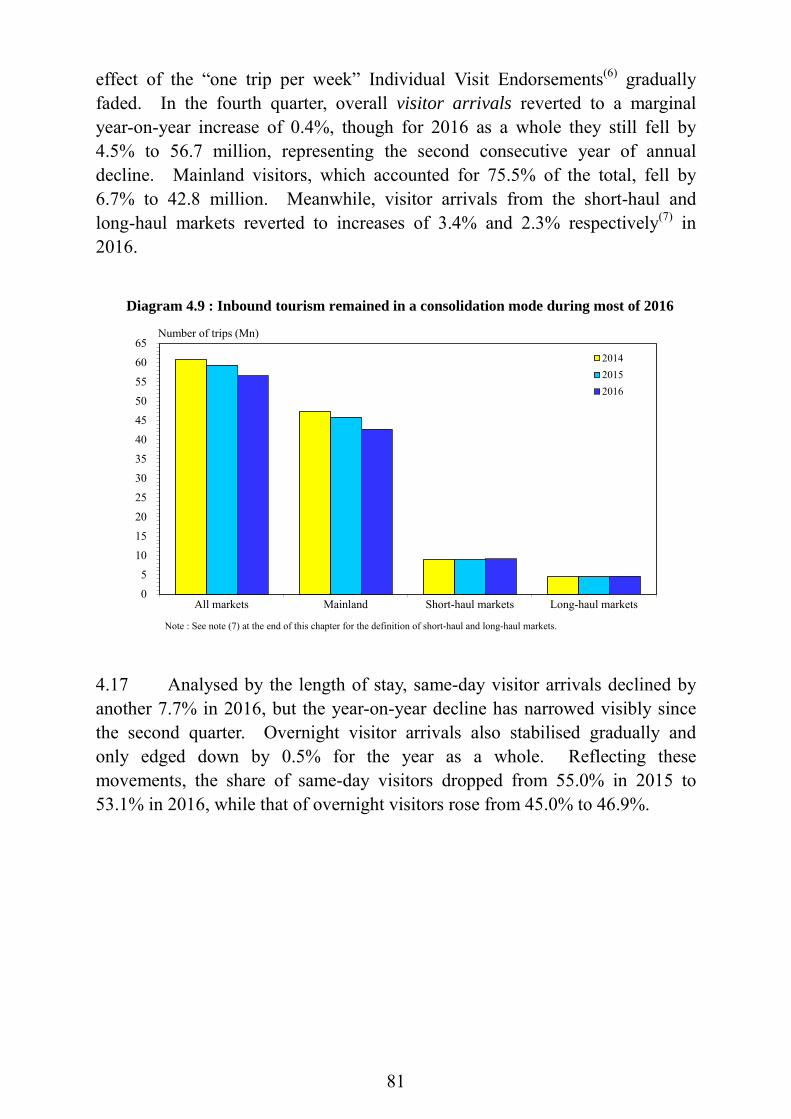
81
effect of the “one trip per week” Individual Visit Endorsements(6) gradually faded. In the fourth quarter, overall visitor arrivals reverted to a marginal year-on-year increase of 0.4%, though for 2016 as a whole they still fell by 4.5% to 56.7 million, representing the second consecutive year of annual decline. Mainland visitors, which accounted for 75.5% of the total, fell by 6.7% to 42.8 million. Meanwhile, visitor arrivals from the short-haul and long-haul markets reverted to increases of 3.4% and 2.3% respectively(7) in 2016.
0
5
10
15
20
25
30
35
40
45
50
55
60
65
All markets Mainland Short-haul markets Long-haul markets
201420152016
Number of trips (Mn)
Diagram 4.9 : Inbound tourism remained in a consolidation mode during most of 2016
Note : See note (7) at the end of this chapter for the definition of short-haul and long-haul markets.
4.17 Analysed by the length of stay, same-day visitor arrivals declined by another 7.7% in 2016, but the year-on-year decline has narrowed visibly since the second quarter. Overnight visitor arrivals also stabilised gradually and only edged down by 0.5% for the year as a whole. Reflecting these movements, the share of same-day visitors dropped from 55.0% in 2015 to 53.1% in 2016, while that of overnight visitors rose from 45.0% to 46.9%.

82
Q12011
Q12012
Q12013
Q12014
Q12015
Q12016
-20
-15
-10
-5
0
5
10
15
20
25
30
35
40Overnight visitors Same-day visitors
Year-on-year rate of change (%)
Diagram 4.10 : Both overnight and same-day visitors declined in 2016,but there has been some relative improvement since the second quarter
4.18 Supported by the stabilisation of overnight visitor arrivals, the average hotel room occupancy rate edged up from 86% in 2015 to 87% in 2016. The average achieved hotel room rate also declined by a less rapid 3.7%, to $1,287(8). Logistics 4.19 The logistics sector showed some pick-up over the course of 2016 along with the gradual improvement of the external trade environment. Total container throughput declined at a narrowed rate of 2.5% to 19.6 million twenty-foot equivalent units (TEUs) for the year as a whole, with the year-on-year change improving steadily from a drop of 12.1% in the first quarter to a gain of 12.7% in the fourth quarter. Within the laden container throughput, the declines in both direct shipment and transhipment narrowed, to 1.5% and 2.3% respectively. In parallel, the value of trade handled at the Hong Kong port fell by 8.7%, and its share in total trade shrank further from 20.5% in 2015 to 18.8% in 2016.

83
0
5
10
15
20
25
30
2012 2013 2014 2015 2016
River vessels Ocean vessels
(a) Total container throughputby mode of transport
0
5
10
15
20
25
30
2012 2013 2014 2015 2016
Transhipment Direct shipment
(b) Laden container throughputby mode of shipment
Diagram 4.11 : Container throughput showed some pick-up over the course of 2016
TEUs (Mn)TEUs (Mn)
* *
Note : (*) Total container throughput for 2016 is the preliminary estimate by Hong Kong Port Development Council. Its breakdown by mode of transport and the laden container throughput by mode of shipment are crudely estimated from the profile in the first ten months of 2016.
4.20 Air freight throughput fared better and rose by 3.2% to 4.5 million tonnes in 2016. Likewise, the value of trade by air rose by 1.9%, with its share in total trade increasing from 39.5% to 40.5%.
0
400
800
1,200
1,600
2,000
2,400
2,800
3,200
3,600
2012 2013 2014 2015 2016
(b) Value of trade handled by air*
0
800
1 600
2 400
3 200
4 000
4 800
2012 2013 2014 2015 2016
(a) Air cargo volume
Diagram 4.12 : Air cargo throughput and the value of trade handled by air rose in 2016
Tonne ('000) $Bn
Note : (*) Not including transhipment. Transport 4.21 Traffic flows for the different major modes of transport showed mixed performances in 2016. Air passenger traffic increased further, by 2.9% to
84
70.5 million, while water-borne passenger trips fell by another 3.4% to 26.7 million. As to land-based cross-boundary traffic, passenger trips edged down by 0.6% to 221.3 million, while average daily vehicle movements rose slightly by 2.0% to 42 328. 4.22 The extension of the Kwun Tong Line and the South Island Line of the Mass Transit Railway (MTR) commenced operation in October and December 2016 respectively. With the addition of six new stations (namely Ho Man Tin station, Whampoa station, Ocean Park station, Wong Chuk Hang station, Lei Tung station and South Horizons station), the extended MTR network now reaches all 18 districts of Hong Kong. The extension would reduce travelling time for commuters and further strengthen the efficiency and connectivity of the public transport network of Hong Kong. Innovation and technology 4.23 In January 2017, the HKSAR Government and the Shenzhen Municipal Government signed a memorandum of understanding on the development of a Hong Kong/Shenzhen Innovation and Technology Park in the Lok Ma Chau Loop in Hong Kong. The park, with a site area quadruple that of the Science Park, will be a key base for co-operation between Hong Kong and the Mainland in innovation and technology research. Environment 4.24 In the 2017 Policy Address, the Chief Executive announced that he accepted the proposals recommended by the Steering Committee on Climate Change, to reduce carbon intensity from the 2005 level by 65% to 70% by 2030. On air quality, the HKSAR Government signed an agreement with the Mainland to jointly promote the establishment of a domestic emission control area in the Pearl River Delta waters to regulate emissions from marine vessels. Separately, the Government also plans to introduce the bill for implementing quantity-based municipal solid waste charging in the current legislative year.
85
Notes : (1) On 4 November 2016, the Government announced to increase the ad valorem stamp
duty rates for residential property transactions to a flat rate of 15% with effect from 5 November 2016, in lieu of the ad valorem stamp duty rates at Scale 1 (commonly known as “doubled ad valorem stamp duty”). The exemptions and exceptions introduced through the Stamp Duty (Amendment) (No. 2) Ordinance 2014 will not be affected. Thus, a Hong Kong Permanent Resident acquiring a residential property where he/she is acting on his/her own behalf and does not own any other residential property in Hong Kong at the time of acquisition will continue to be subject to the existing ad valorem stamp duty rates at Scale 2.
(2) Take-up figures represent the net increase in the number of units occupied. The
figures are arrived at by adding the completions in that year to the vacancy figures at the beginning of the year, then subtracting the year’s demolition and the year-end vacancy figures. Take-up should not be confused with the sales of new developments, and it bears no direct relationship to the number of units sold by developers. Negative take-up means that there is a decrease in the number of units occupied (i.e. property previously occupied was released during the year and remained vacant at the year-end). Also, take-up, demolition, completion and vacancy figures on residential and non-residential properties are preliminary figures from the Rating and Valuation Department, and are subject to revision.
(3) Forecast completions in 2017 and 2018 are preliminary figures only, and are subject to
revision upon the availability of more data. (4) For details of the measures promulgated in 2010, see Box 3.1 in the First Quarter
Economic Report 2010, Box 3.1 in the Third Quarter Economic Report 2010 and note (2) at the end of Chapter 4 in the 2010 Economic Background and 2011 Prospects. For details of the measures promulgated in 2011, see note (2) at the end of Chapter 3 in the Half-yearly Economic Report 2011 and Box 3.1 in the Third Quarter Economic Report 2011. For details of the measures promulgated in 2012, see Box 3.1 in the Third Quarter Economic Report 2012 and Box 4.1 in the 2012 Economic Background and 2013 Prospects. For details of the measures promulgated in 2013, see Box 4.2 in the 2012 Economic Background and 2013 Prospects and Box 3.1 in the First Quarter Economic Report 2013. For details of the measures promulgated in 2014, see Box 4.1 in the 2013 Economic Background and 2014 Prospects. For details of the measures promulgated in 2015, see Box 3.1 of the First Quarter Economic Report 2015.
(5) The figures on transaction and vacancy rate refer to commercial space, which
comprises retail premises and other premises designed or adapted for commercial use but excludes purpose-built office space.
(6) For details of the change in Individual Visit Endorsements policy in April 2015, see
paragraph 3.17 in the Half-yearly Economic Report 2015. (7) Short-haul markets refer to North Asia, South and Southeast Asia, Taiwan and Macao,
but excluding the Mainland, while long-haul markets refer to the Americas, Europe, Africa, the Middle East, Australia, New Zealand and South Pacific. In 2016, visitor arrivals from the Mainland, short-haul and long-haul markets accounted for respective shares of 76%, 16% and 8% of total visitors.
(8) The figures on hotel room occupancy and achieved room rate do not include
guesthouses.
86
CHAPTER 5 : THE FINANCIAL SECTOR# Summary The low interest rate environment in Hong Kong continued in 2016, though
there was an uptick in interbank rates towards the end of the year amid a rate hike in the United States. After the US Fed raised the Federal Funds Rate in December, the Hong Kong Monetary Authority also adjusted the Base Rate upward.
After weakening visibly against the US dollar in January, the Hong Kong dollar spot exchange rate rebounded in February, and traded within a narrow range near the strong-side Convertibility Undertaking for the rest of 2016.
As the US dollar strengthened against most major currencies including the euro, pound sterling and renminbi, the trade-weighted Hong Kong dollar Nominal and Real Effective Exchange Rate Indices rose further during 2016.
Total loans and advances have resumed expansion since the second quarter of 2016 amid the relative improvement in the domestic economy. Loans for use in Hong Kong grew by 7.4% during the full year 2016, while loans for use outside Hong Kong increased by 4.5%.
The local stock market exhibited considerable volatility in 2016, with
sentiment swinging along with various developments in the financial market as well as in the global political and economic arena. The Hang Seng Index fluctuated in a wide range of 18 320 to 24 100, and ended the year at 22 001, a meagre 0.4% higher than at end-2015. Although both trading and fund raising activities moderated from the hectic levels in the preceding year, Hong Kong retained its top global position in terms of funds raised through IPO activity in 2016.
__________ (#) This chapter is jointly prepared by the Hong Kong Monetary Authority (HKMA) and
the Economic Analysis Division.

87
Interest rates and exchange rates 5.1 The low interest rate environment in Hong Kong continued in 2016, though there was an uptick in interbank rates towards the end of the year amid a rate hike in the United States. The US Federal Open Market Committee raised the target range for the Federal Funds Rate from 0.25-0.5% to 0.5-0.75% in December. Consequentially, the HKMA adjusted upward the Base Rate under the Discount Window from 0.75% to 1.00%(1). As to Hong Kong dollar interbank interest rates, mainly reflecting the increases in November and December, the overnight HIBOR rose from 0.05% at end-2015 to 0.66% at end-2016 and the three-month HIBOR from 0.39% to 1.02%. Yet these were still low by historical standards. 5.2 Both the US dollar and Hong Kong dollar yield curves shifted upward in 2016. Reflecting the larger increases in Hong Kong dollar yields, the yield spread between 6-month Exchange Fund Bills and 6-month US Treasury Bills turned from negative 41 basis points at end-2015 to positive 13 basis points at end-2016. The negative yield spread between 10-year Hong Kong Government Bonds and 10-year US Treasury Notes also narrowed from 61 basis points to 52 basis points.
0.0
0.5
1.0
1.5
2.0
2.5
3.0
3.5
1M 3M 6M 1Y 2Y 3Y* 5Y* 10Y*
Diagram 5.1 : Both US dollar and Hong Kong dollar yield curves shifted upward in 2016
Percent per annum
Spread of yield between Exchange Fund Bills & Notes / HK Government Bonds and US Treasuries at end-2016 :6-month Time to Maturity : 13 basis points5-year Time to Maturity : -34 basis points10-year Time to Maturity : -52 basis points
Time to Maturity
US Treasuries (end-2015)
Exchange FundBills & Notes / HK Government Bonds
(end-2016)
US Treasuries(end-2016)
Exchange FundBills & Notes / HK Government Bonds
(end-2015)
Note : (*) With the HKMA stopping new issuance of Exchange Fund Notes of tenors of three years or above since January 2015, the Hong Kong dollar yields for tenor of 3 years and above refer to those for Hong Kong Government Bonds.
5.3 Interest rates on the retail front stayed at low levels. The Best Lending Rates remained unchanged at 5.00% or 5.25% throughout 2016, while the average savings deposit rate and the one-year time deposit rate quoted by

88
the major banks for deposits of less than $100,000 stayed low at 0.01% and 0.15% respectively at end-2016. The composite interest rate(2), which indicates the average funding cost for retail banks, edged up from 0.26% a year earlier to 0.31% at end-2016.
0
40
80
120
160
200
240
280
320
360
400
440
0
1
2
3
4
5
6
1/14 4/14 7/14 10/14 1/15 4/15 7/15 10/15 1/16 4/16 7/16 10/16
Diagram 5.2 : Hong Kong dollar interest rates remained low (end for the week)
Percent per annum $Bn
Best Lending Rate
Three-monthHIBOR
Aggregate Balance (RHS)
Overnight HIBOR
Base Rate under the Discount Window
5.4 After weakening visibly to 7.821 in January, the Hong Kong dollar spot exchange rate against the US dollar rebounded in February, and traded within a narrow range near the strong-side Convertibility Undertaking for the rest of 2016. It closed the year at 7.754, little changed from the 7.751 a year earlier. As regards the Hong Kong dollar forward rates, the differential between the 12-month Hong Kong dollar forward rate and spot rate soared from -125 pips (each pip is equivalent to HK$0.0001) at end-2015 to +650 pips in January 2016, before falling back to +145 pips at end-2016. The differential between the 3-month forward rate and spot rate moved within a narrower range, and closed at -25 pips at end-2016, compared with -51 pips at end-2015.
5.5 Under the Linked Exchange Rate System, movements in the Hong Kong dollar exchange rate against other currencies closely followed that of the US dollar. During 2016, the US dollar strengthened against most major currencies including the euro, pound sterling and renminbi (RMB). As a result, the trade-weighted Hong Kong dollar Nominal and Real Effective Exchange Rate Indices(3) rose further, both by 3.5% during 2016.
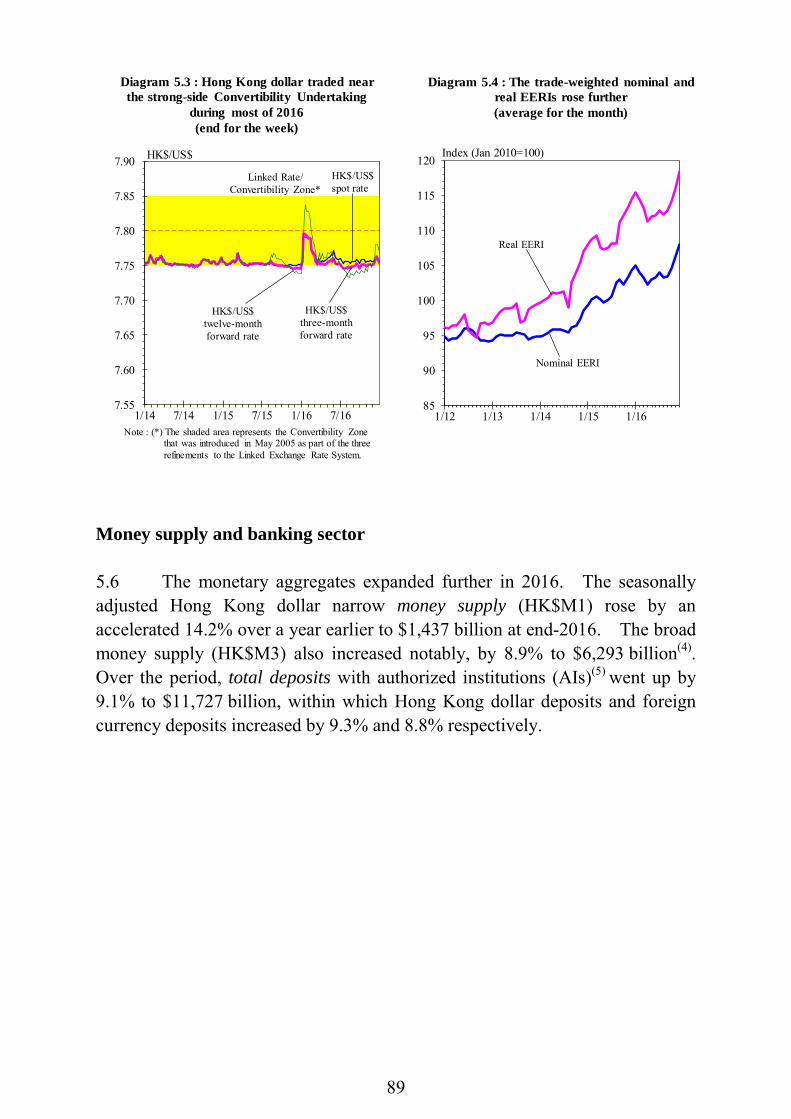
89
7.55
7.60
7.65
7.70
7.75
7.80
7.85
7.90
1/14 7/14 1/15 7/15 1/16 7/16
HK$/US$spot rate
HK$/US$twelve-month forward rate
HK$/US$three-month forward rate
HK$/US$
85
90
95
100
105
110
115
120
1/12 1/13 1/14 1/15 1/16
Index (Jan 2010=100)
Nominal EERI
Real EERI
Diagram 5.3 : Hong Kong dollar traded near the strong-side Convertibility Undertaking
during most of 2016 (end for the week)
Diagram 5.4 : The trade-weighted nominal and real EERIs rose further(average for the month)
Linked Rate/Convertibility Zone*
Note : (*) The shaded area represents the Convertibility Zonethat was introduced in May 2005 as part of the threerefinements to the Linked Exchange Rate System.
Money supply and banking sector 5.6 The monetary aggregates expanded further in 2016. The seasonally adjusted Hong Kong dollar narrow money supply (HK$M1) rose by an accelerated 14.2% over a year earlier to $1,437 billion at end-2016. The broad money supply (HK$M3) also increased notably, by 8.9% to $6,293 billion(4). Over the period, total deposits with authorized institutions (AIs)(5) went up by 9.1% to $11,727 billion, within which Hong Kong dollar deposits and foreign currency deposits increased by 9.3% and 8.8% respectively.

90
Q12012
Q12013
Q12014
Q12015
Q12016
-20
-10
0
10
20
30Percent
Position at end-2016 :$1,437 billion
Year-on-yearrate of change
Quarter-to-quarterrate of change
(a) HK$M1^(seasonally adjusted)
Diagram 5.5 : The monetary aggregates expanded further in 2016
Q12012
Q12013
Q12014
Q12015
Q12016
-20
-10
0
10
20
30
(b) HK$M3#^
Percent
Year-on-yearrate of change
Quarter-to-quarterrate of change
Position at end-2016 :$6,293 billion
Notes : (^) Figures refer to the positions at end of period. Notes : (#) Adjusted to include foreign currency swap deposits.
Table 5.1 : Hong Kong dollar money supply and total money supply
M1 M2 M3 % change during the quarter HK$^ Total HK$(a) Total HK$(a) Total 2015 Q1 -1.6 13.6 7.2 3.0 7.2 3.0 Q2 15.2 -1.3 3.1 0.8 3.1 0.8 Q3 -1.6 5.3 -0.6 0.1 -0.7 0.1 Q4 0.7 -2.4 0.5 1.5 0.5 1.5 2016 Q1 2.9 5.4 0.6 1.1 0.6 1.1 Q2 3.0 0.6 1.7 0.4 1.7 0.4 Q3 4.7 6.9 4.9 5.1 4.9 5.1 Q4 2.9 -0.9 1.5 1.0 1.5 1.0 Total amount at end-2016 ($Bn) 1,437 2,214 6,280 12,508 6,293 12,551
% change over a year earlier 14.2 12.3 8.9 7.7 8.9 7.7
Notes : (^) Seasonally adjusted.
(a) Adjusted to include foreign currency swap deposits. 5.7 Total loans and advances have resumed expansion since the second quarter of 2016 amid the relative improvement in the domestic economy. Total loans and advances grew by 6.5% over a year earlier to $8,023 billion at end-2016. Within the total, Hong Kong dollar loans and foreign currency loans rose by 7.9% and 4.8% respectively. Reflecting the corresponding movements in loans and deposits, the loan-to-deposit ratio for Hong Kong
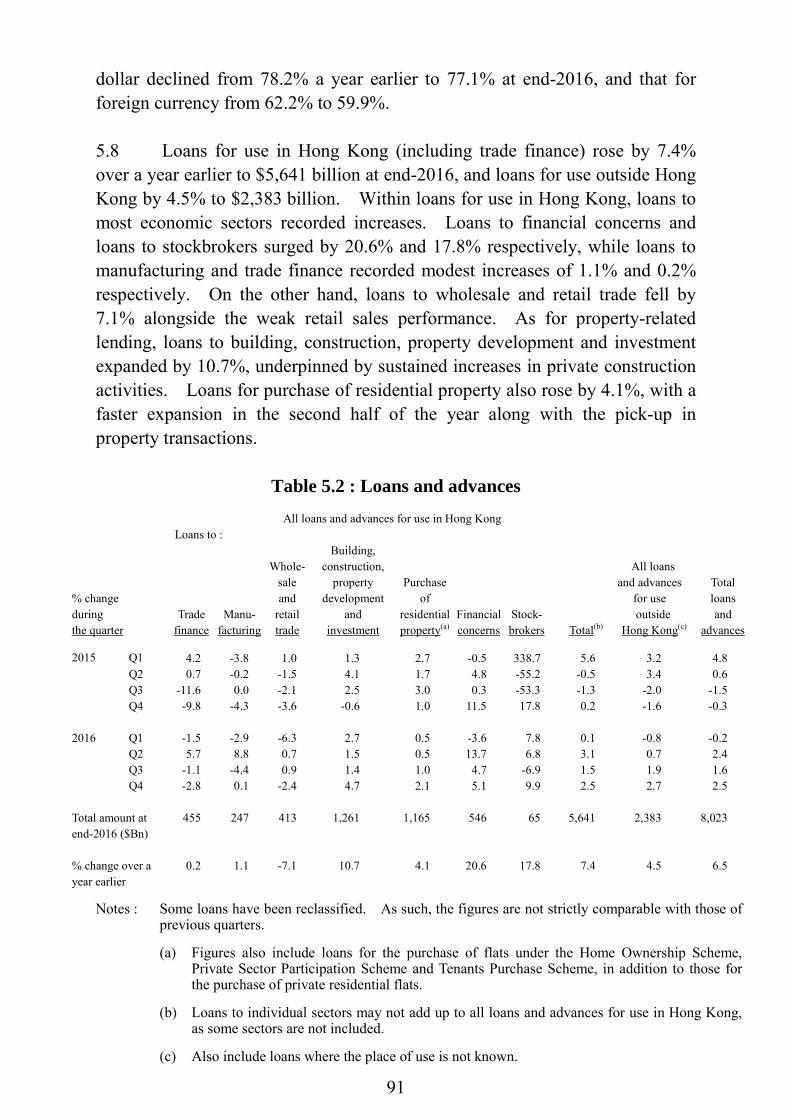
91
dollar declined from 78.2% a year earlier to 77.1% at end-2016, and that for foreign currency from 62.2% to 59.9%. 5.8 Loans for use in Hong Kong (including trade finance) rose by 7.4% over a year earlier to $5,641 billion at end-2016, and loans for use outside Hong Kong by 4.5% to $2,383 billion. Within loans for use in Hong Kong, loans to most economic sectors recorded increases. Loans to financial concerns and loans to stockbrokers surged by 20.6% and 17.8% respectively, while loans to manufacturing and trade finance recorded modest increases of 1.1% and 0.2% respectively. On the other hand, loans to wholesale and retail trade fell by 7.1% alongside the weak retail sales performance. As for property-related lending, loans to building, construction, property development and investment expanded by 10.7%, underpinned by sustained increases in private construction activities. Loans for purchase of residential property also rose by 4.1%, with a faster expansion in the second half of the year along with the pick-up in property transactions.
Table 5.2 : Loans and advances
All loans and advances for use in Hong Kong Loans to :
Building, Whole- construction, All loans sale property Purchase and advances Total
% change and development of for use loans during Trade Manu- retail and residential Financial Stock- outside and the quarter finance facturing trade investment property(a) concerns brokers Total(b) Hong Kong(c) advances 2015 Q1 4.2 -3.8 1.0 1.3 2.7 -0.5 338.7 5.6 3.2 4.8
Q2 0.7 -0.2 -1.5 4.1 1.7 4.8 -55.2 -0.5 3.4 0.6 Q3 -11.6 0.0 -2.1 2.5 3.0 0.3 -53.3 -1.3 -2.0 -1.5 Q4 -9.8 -4.3 -3.6 -0.6 1.0 11.5 17.8 0.2 -1.6 -0.3
2016 Q1 -1.5 -2.9 -6.3 2.7 0.5 -3.6 7.8 0.1 -0.8 -0.2
Q2 5.7 8.8 0.7 1.5 0.5 13.7 6.8 3.1 0.7 2.4 Q3 -1.1 -4.4 0.9 1.4 1.0 4.7 -6.9 1.5 1.9 1.6 Q4 -2.8 0.1 -2.4 4.7 2.1 5.1 9.9 2.5 2.7 2.5
Total amount at end-2016 ($Bn)
455 247 413 1,261 1,165 546 65 5,641 2,383 8,023
% change over a year earlier
0.2 1.1 -7.1 10.7 4.1 20.6 17.8 7.4 4.5 6.5
Notes : Some loans have been reclassified. As such, the figures are not strictly comparable with those of previous quarters.
(a) Figures also include loans for the purchase of flats under the Home Ownership Scheme, Private Sector Participation Scheme and Tenants Purchase Scheme, in addition to those for the purchase of private residential flats.
(b) Loans to individual sectors may not add up to all loans and advances for use in Hong Kong, as some sectors are not included.
(c) Also include loans where the place of use is not known.
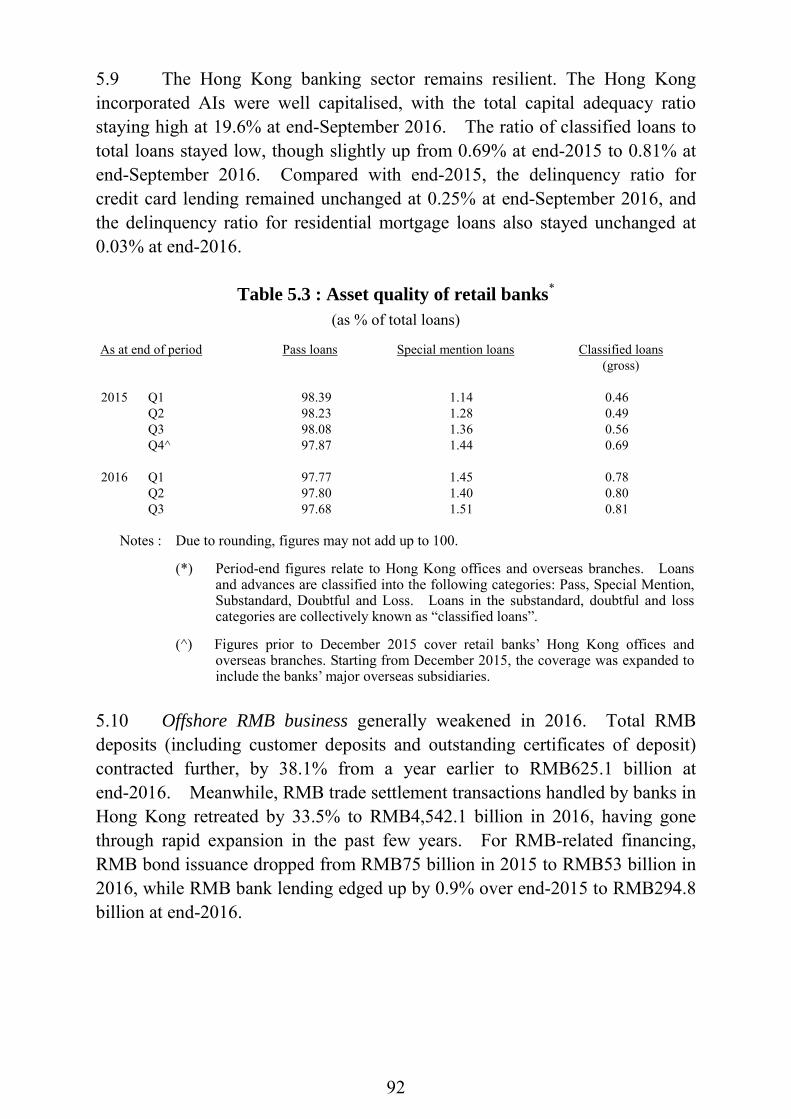
92
5.9 The Hong Kong banking sector remains resilient. The Hong Kong incorporated AIs were well capitalised, with the total capital adequacy ratio staying high at 19.6% at end-September 2016. The ratio of classified loans to total loans stayed low, though slightly up from 0.69% at end-2015 to 0.81% at end-September 2016. Compared with end-2015, the delinquency ratio for credit card lending remained unchanged at 0.25% at end-September 2016, and the delinquency ratio for residential mortgage loans also stayed unchanged at 0.03% at end-2016.
Table 5.3 : Asset quality of retail banks* (as % of total loans)
As at end of period Pass loans Special mention loans Classified loans
(gross)
2015 Q1 98.39 1.14 0.46 Q2 98.23 1.28 0.49 Q3 98.08 1.36 0.56 Q4^ 97.87 1.44 0.69 2016 Q1 97.77 1.45 0.78 Q2 97.80 1.40 0.80 Q3 97.68 1.51 0.81
Notes : Due to rounding, figures may not add up to 100.
(*) Period-end figures relate to Hong Kong offices and overseas branches. Loans and advances are classified into the following categories: Pass, Special Mention, Substandard, Doubtful and Loss. Loans in the substandard, doubtful and loss categories are collectively known as “classified loans”.
(^) Figures prior to December 2015 cover retail banks’ Hong Kong offices and overseas branches. Starting from December 2015, the coverage was expanded to include the banks’ major overseas subsidiaries.
5.10 Offshore RMB business generally weakened in 2016. Total RMB deposits (including customer deposits and outstanding certificates of deposit) contracted further, by 38.1% from a year earlier to RMB625.1 billion at end-2016. Meanwhile, RMB trade settlement transactions handled by banks in Hong Kong retreated by 33.5% to RMB4,542.1 billion in 2016, having gone through rapid expansion in the past few years. For RMB-related financing, RMB bond issuance dropped from RMB75 billion in 2015 to RMB53 billion in 2016, while RMB bank lending edged up by 0.9% over end-2015 to RMB294.8 billion at end-2016.

93
Table 5.4 : Renminbi deposits and cross-border renminbi trade settlement
in Hong Kong
Interest rates on(a)
Number of AIs
engaged in RMB business
Amount of cross-border RMB trade settlement(c) As at end of period
Demand and savings
deposits Time
deposits Total
deposits Savings deposits(b)
Three-month time deposits(b)
(RMB Mn) (RMB Mn) (RMB Mn) (%) (%) (RMB Mn) 2015 Q1 157,444 794,550 951,994 0.25 0.53 147 1,626,122 Q2 180,445 812,479 992,924 0.25 0.53 146 1,569,670 Q3 165,849 729,516 895,365 0.25 0.53 145 2,050,107 Q4 160,908 690,198 851,106 0.25 0.53 145 1,587,184 2016 Q1 187,124 572,302 759,425 0.25 0.53 145 1,130,645 Q2 204,282 507,266 711,549 0.25 0.53 146 1,234,587 Q3 201,829 463,671 665,500 0.25 0.53 145 1,189,244 Q4 135,520 411,187 546,707 0.25 0.53 144 987,651 % change over a year earlier
-15.8% -40.4% -35.8% N.A. N.A. N.A. -37.8%
Notes : (a) The interest rates are based on a survey conducted by the HKMA.
(b) Period average figures.
(c) Figures during the period.
N.A. Not available. The debt market 5.11 The Hong Kong dollar debt market continued to expand in 2016, with total gross issuance growing by 22.3% to $3,052.6 billion. Public sector debt issuance recorded a notable growth of 19.9% to $2,739.9 billion, due mainly to the increase in issuance of Exchange Fund paper, which accounted for 98.2% of public sector issuance or 88.1% of total issuance. Private sector debt issuance surged by 46.7% to $307.1 billion, with issuance by AIs, local corporations and non-Multilateral Development Banks overseas borrowers all registering significant increase(6). As a result, the total outstanding balance of Hong Kong dollar debt securities grew by 14.1% over a year earlier to a record high of $1,730.6 billion at end-2016, equivalent to 27.5% of HK$M3 or 22.7% of Hong Kong dollar-denominated assets of the entire banking sector(7). 5.12 As to the Government Bond (“GB”) programme, a total of $16.4 billion institutional GBs were issued through tenders in 2016. Meanwhile, another batch of iBonds with a size of $10.0 billion and the inaugural Silver Bonds (for residents aged 65 or above) with a size of $3.0 billion were issued in the second and third quarter respectively. At
94
end-2016, the total outstanding amount of Hong Kong dollar bonds under the GB Programme was $101.3 billion, comprising 12 institutional issues totaling $68.3 billion and four retail issues (three iBonds and one Silver Bond) totaling $33.0 billion. In addition, two US dollar sukuks, each with an issuance size of US$1.0 billion, were outstanding under the Programme.
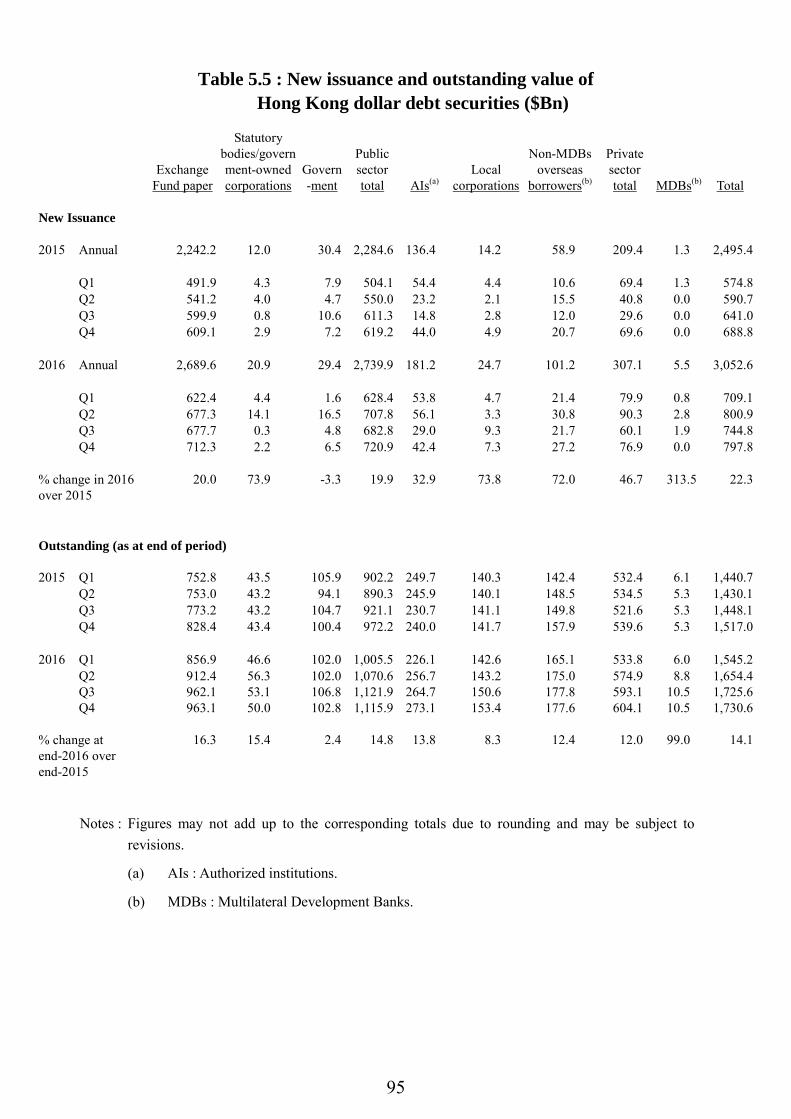
95
Table 5.5 : New issuance and outstanding value of Hong Kong dollar debt securities ($Bn)
Exchange
Fund paper
Statutory bodies/government-owned corporations
Govern-ment
Public sector total AIs(a)
Local corporations
Non-MDBs overseas
borrowers(b)
Private sector total MDBs(b) Total
New Issuance
2015 Annual 2,242.2 12.0 30.4 2,284.6 136.4 14.2 58.9 209.4 1.3 2,495.4 Q1 491.9 4.3 7.9 504.1 54.4 4.4 10.6 69.4 1.3 574.8 Q2 541.2 4.0 4.7 550.0 23.2 2.1 15.5 40.8 0.0 590.7 Q3 599.9 0.8 10.6 611.3 14.8 2.8 12.0 29.6 0.0 641.0 Q4 609.1 2.9 7.2 619.2 44.0 4.9 20.7 69.6 0.0 688.8 2016 Annual 2,689.6 20.9 29.4 2,739.9 181.2 24.7 101.2 307.1 5.5 3,052.6 Q1 622.4 4.4 1.6 628.4 53.8 4.7 21.4 79.9 0.8 709.1 Q2 677.3 14.1 16.5 707.8 56.1 3.3 30.8 90.3 2.8 800.9 Q3 677.7 0.3 4.8 682.8 29.0 9.3 21.7 60.1 1.9 744.8 Q4 712.3 2.2 6.5 720.9 42.4 7.3 27.2 76.9 0.0 797.8 % change in 2016 over 2015
20.0 73.9 -3.3 19.9 32.9 73.8 72.0 46.7 313.5 22.3
Outstanding (as at end of period)
2015 Q1 752.8 43.5 105.9 902.2 249.7 140.3 142.4 532.4 6.1 1,440.7 Q2 753.0 43.2 94.1 890.3 245.9 140.1 148.5 534.5 5.3 1,430.1 Q3 773.2 43.2 104.7 921.1 230.7 141.1 149.8 521.6 5.3 1,448.1 Q4 828.4 43.4 100.4 972.2 240.0 141.7 157.9 539.6 5.3 1,517.0 2016 Q1 856.9 46.6 102.0 1,005.5 226.1 142.6 165.1 533.8 6.0 1,545.2 Q2 912.4 56.3 102.0 1,070.6 256.7 143.2 175.0 574.9 8.8 1,654.4 Q3 962.1 53.1 106.8 1,121.9 264.7 150.6 177.8 593.1 10.5 1,725.6 Q4 963.1 50.0 102.8 1,115.9 273.1 153.4 177.6 604.1 10.5 1,730.6 % change at end-2016 over end-2015
16.3 15.4 2.4 14.8 13.8 8.3 12.4 12.0 99.0 14.1
Notes : Figures may not add up to the corresponding totals due to rounding and may be subject to revisions.
(a) AIs : Authorized institutions.
(b) MDBs : Multilateral Development Banks.

96
The stock and derivatives markets 5.13 The local stock market exhibited considerable volatility in 2016. Market sentiment was first dented by concerns over further interest rate hike in the US at the start of the year and then the referendum result of the UK to leave the European Union in late June. While the market staged a strong rally in the third quarter amid easing concerns over these downside factors and the announcement of the Shenzhen-Hong Kong Stock Connect, it corrected again towards the end of the year as concerns over a US interest rate rise re-surfaced. The Hang Seng Index (HSI) fluctuated in a wide range of 18 320 to 24 100 during 2016, and ended the year at 22 001, a meagre 0.4% higher than at end-2015. In parallel, the market capitalisation edged up by 0.3% to $24.8 trillion. The local stock market was the eighth largest in the world and the fourth largest in Asia(8). 5.14 Trading activities moderated in 2016 from the hectic level in the preceding year. Average daily turnover in the securities market plunged by 36.6% from the record high to $66.9 billion. Within the total, the average daily trading value of unit trusts (including Exchange-Traded Funds), derivative warrants, equities and callable bull/bear contracts(9) fell by 50.7%, 39.0%, 35.6% and 24.7% respectively. As to futures and options(10), the average daily trading volume edged down by 0.9%. Within the total, trading of stock options and H-shares Index futures declined by 20.4% and 1.0% respectively, while that of HSI futures and HSI options rose by 52.1% and 24.5% respectively.
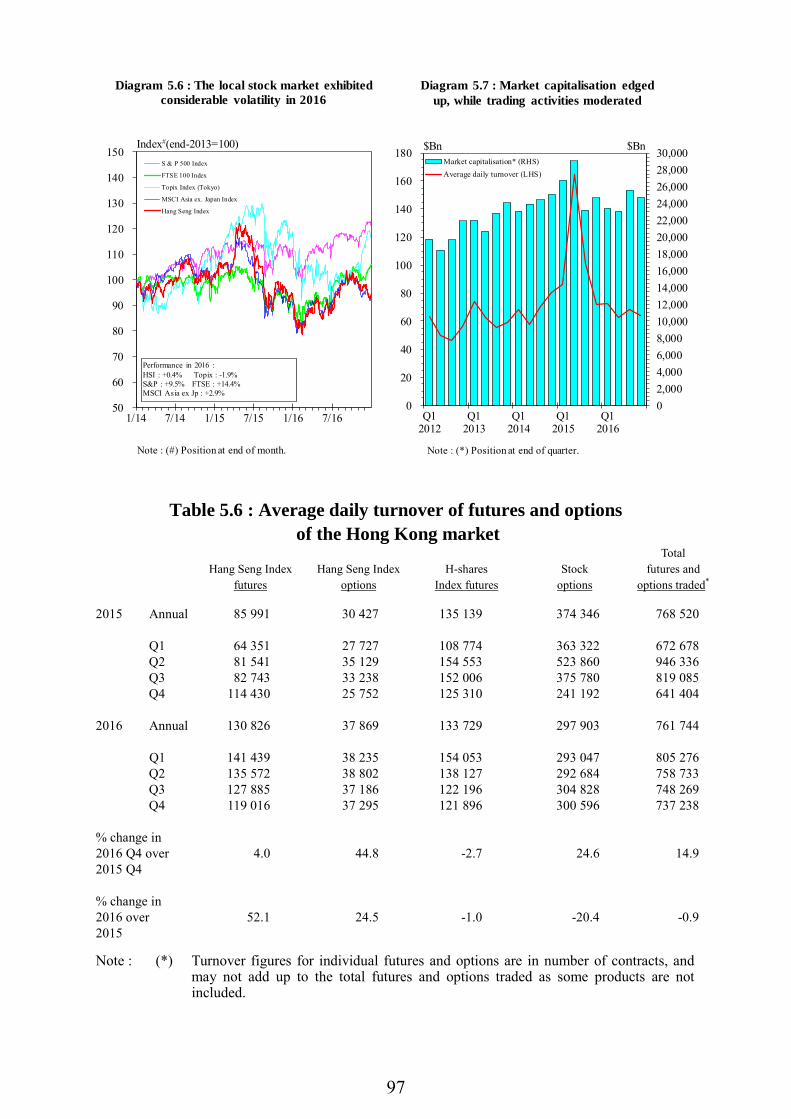
97
02,0004,0006,0008,00010,00012,00014,00016,00018,00020,00022,00024,00026,00028,00030,000
0
20
40
60
80
100
120
140
160
180
Q12012
Q12013
Q12014
Q12015
Q12016
Market capitalisation* (RHS)Average daily turnover (LHS)
Diagram 5.7 : Market capitalisation edged up, while trading activities moderated
50
60
70
80
90
100
110
120
130
140
150
1/14 7/14 1/15 7/15 1/16 7/16
S & P 500 Index
FTSE 100 Index
Topix Index (Tokyo)
MSCI Asia ex. Japan Index
Hang Seng Index
Performance in 2016 :HSI : +0.4% Topix : -1.9% S&P : +9.5% FTSE : +14.4%MSCI Asia ex Jp : +2.9%
Index#(end-2013=100)
Diagram 5.6 : The local stock market exhibited considerable volatility in 2016
$Bn $Bn
Note : (#) Position at end of month. Note : (*) Position at end of quarter.
Table 5.6 : Average daily turnover of futures and options of the Hong Kong market
Hang Seng Index
futures Hang Seng Index
options H-shares
Index futures Stock
options
Total futures and
options traded* 2015 Annual 85 991 30 427 135 139 374 346 768 520 Q1 64 351 27 727 108 774 363 322 672 678 Q2 81 541 35 129 154 553 523 860 946 336 Q3 82 743 33 238 152 006 375 780 819 085 Q4 114 430 25 752 125 310 241 192 641 404 2016 Annual 130 826 37 869 133 729 297 903 761 744
Q1 141 439 38 235 154 053 293 047 805 276 Q2 135 572 38 802 138 127 292 684 758 733 Q3 127 885 37 186 122 196 304 828 748 269 Q4 119 016 37 295 121 896 300 596 737 238 % change in 2016 Q4 over 2015 Q4
4.0 44.8 -2.7 24.6 14.9
% change in 2016 over 2015
52.1 24.5 -1.0 -20.4 -0.9
Note : (*) Turnover figures for individual futures and options are in number of contracts, and may not add up to the total futures and options traded as some products are not included.

98
5.15 Fund raising activities were subdued in 2016 though there was some relative improvement in the second half. For the year as a whole, total equity capital raised, comprising new share floatation and post-listing arrangements on the Main Board and the Growth Enterprise Market (GEM)(11), plunged by 56.1% from the record high in the preceding year to $490.1 billion. Within the total, the amount of funds raised through Initial Public Offerings (IPOs) shrank by 25.8% to $195.3 billion. Yet Hong Kong still ranked the first globally in terms of the amount of funds raised through IPOs in 2016. 5.16 Mainland enterprises continued to play a dominant role in the Hong Kong stock market. At end-2016, a total of 1 002 Mainland enterprises (including 241 H-share companies, 153 “Red Chip” companies and 608 private enterprises) were listed on the Main Board and the GEM, accounting for 51% of the total number of listed companies and 63% of total market capitalisation. Mainland-related stocks accounted for 71% both of equity turnover and also of total equity fund raised in the Hong Kong stock exchange in 2016. Fund management and investment funds 5.17 Different segments of the fund management business showed varied performance. The aggregate net asset value of the approved constituent funds under the Mandatory Provident Fund (MPF) schemes(12) rose by another 9.3% over a year earlier to $646.3 billion at end-2016. Meanwhile, the gross retail sales of mutual funds dropped by 8.8% to US$65.9 billion(13) in 2016. The amount of net assets managed by retail hedge funds shrank further(14).
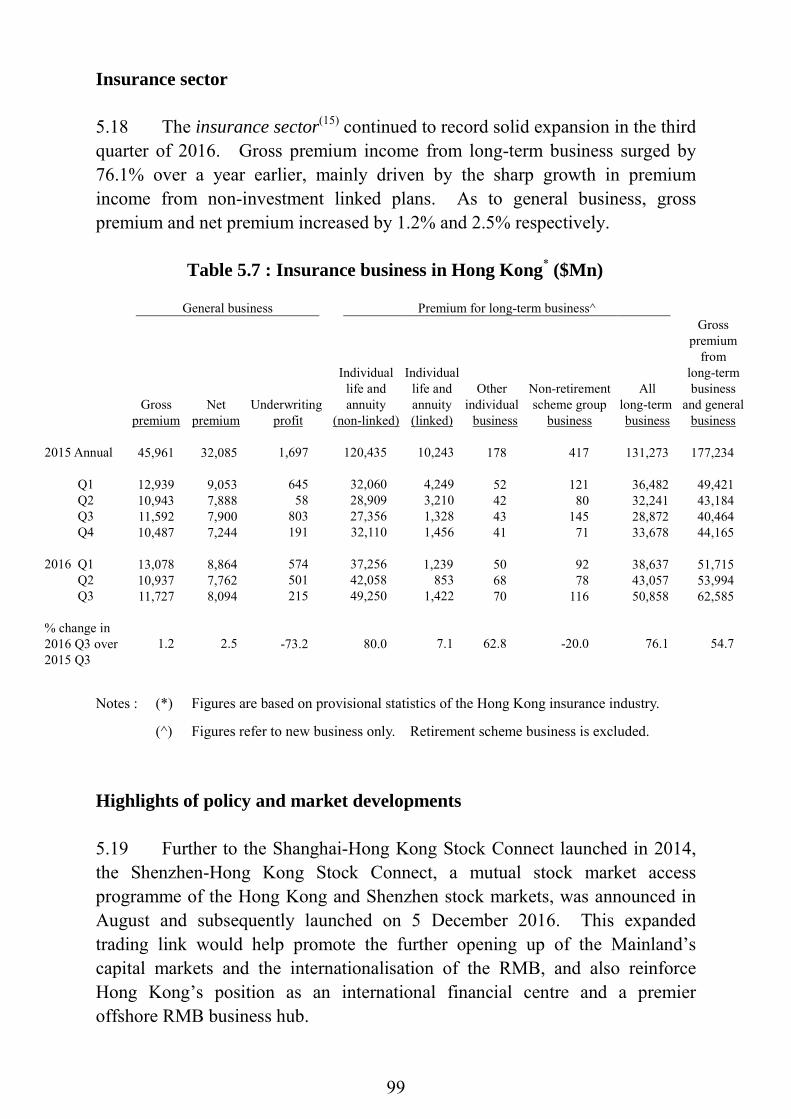
99
Insurance sector 5.18 The insurance sector(15) continued to record solid expansion in the third quarter of 2016. Gross premium income from long-term business surged by 76.1% over a year earlier, mainly driven by the sharp growth in premium income from non-investment linked plans. As to general business, gross premium and net premium increased by 1.2% and 2.5% respectively.
Table 5.7 : Insurance business in Hong Kong* ($Mn)
General business Premium for long-term business^
Gross
premium Net
premium Underwriting
profit
Individual life and annuity
(non-linked)
Individual life and annuity (linked)
Other individual business
Non-retirement scheme group
business
All long-term business
Gross premium
from long-term business
and general business
2015 Annual 45,961 32,085 1,697 120,435 10,243 178 417 131,273 177,234 Q1 12,939 9,053 645 32,060 4,249 52 121 36,482 49,421 Q2 10,943 7,888 58 28,909 3,210 42 80 32,241 43,184 Q3 11,592 7,900 803 27,356 1,328 43 145 28,872 40,464 Q4 10,487 7,244 191 32,110 1,456 41 71 33,678 44,165 2016 Q1 13,078 8,864 574 37,256 1,239 50 92 38,637 51,715 Q2 10,937 7,762 501 42,058 853 68 78 43,057 53,994 Q3 11,727 8,094 215 49,250 1,422 70 116 50,858 62,585 % change in 2016 Q3 over 2015 Q3
1.2 2.5 -73.2 80.0 7.1 62.8 -20.0 76.1 54.7
Notes : (*) Figures are based on provisional statistics of the Hong Kong insurance industry.
(^) Figures refer to new business only. Retirement scheme business is excluded. Highlights of policy and market developments 5.19 Further to the Shanghai-Hong Kong Stock Connect launched in 2014, the Shenzhen-Hong Kong Stock Connect, a mutual stock market access programme of the Hong Kong and Shenzhen stock markets, was announced in August and subsequently launched on 5 December 2016. This expanded trading link would help promote the further opening up of the Mainland’s capital markets and the internationalisation of the RMB, and also reinforce Hong Kong’s position as an international financial centre and a premier offshore RMB business hub.
100
Notes : (1) Prior to 9 October 2008, the Base Rate was set at either 150 basis points above the
prevailing US Federal Funds Target Rate (FFTR) or the average of the five-day moving averages of the overnight and one-month HIBORs, whichever was higher. Between 9 October 2008 and 31 March 2009, this formula for determination of the Base Rate was temporarily changed by reducing the spread of 150 basis points above the prevailing FFTR to 50 basis points and by removing the other leg relating to the moving averages of the relevant interbank interest rates. After a review of the appropriateness of the new Base Rate formula, the narrower 50 basis point spread over the FFTR was retained while the HIBOR leg was re-instated in the calculation of the Base Rate after 31 March 2009.
(2) In December 2005, the HKMA published a new data series on composite interest rate,
reflecting movement in various deposit rates, interbank and other interest rates to closely track the average cost of funds for banks. The published data enable the banks to keep track of changes in funding cost and thus help improve interest rate risk management in the banking sector.
(3) The trade-weighted Nominal Effective Exchange Rate Index (EERI) is an indicator of
the overall exchange value of the Hong Kong dollar against a fixed basket of other currencies. Specifically, it is a weighted average of the exchange rates of the Hong Kong dollar against some 15 currencies of its major trading partners, with the weights adopted being the respective shares of these trading partners in the total value of merchandise trade for Hong Kong during 2009 and 2010.
The Real EERI of the Hong Kong dollar is obtained by adjusting the Nominal EERI
for relative movements in the seasonally adjusted consumer price indices of the respective trading partners.
(4) The various definitions of the money supply are as follows: M1 : Notes and coins with the public, plus customers’ demand deposits with
licensed banks.
M2 : M1 plus customers’ savings and time deposits with licensed banks, plus negotiable certificates of deposit (NCDs) issued by licensed banks, held outside the monetary sector as well as short-term Exchange Fund placements of less than one month.
M3 : M2 plus customers’ deposits with restricted licence banks and deposit-taking
companies, plus NCDs issued by such institutions and held outside the monetary sector.
Among the various monetary aggregates, more apparent seasonal patterns are found in
HK$M1, currency held by the public, and demand deposits. (5) AIs include licensed banks, restricted licence banks and deposit-taking companies.
At end-2016, there were 156 licensed banks, 22 restricted licence banks and 17 deposit-taking companies in Hong Kong. Altogether, 195 AIs (excluding representative offices) from 30 countries and territories (including Hong Kong) had a presence in Hong Kong.
(6) The figures for private sector debt may not represent a full coverage of all the
Hong Kong dollar debt paper issued.

101
(7) Assets of the banking sector include notes and coins, amount due from AIs in Hong Kong as well as from banks abroad, loans and advances to customers, negotiable certificates of deposit (NCDs) held, negotiable debt instruments other than NCDs held, and other assets. Certificates of indebtedness issued by Exchange Fund and the counterpart bank notes issued are nevertheless excluded.
(8) The ranking is based on the figures compiled by the World Federation of Exchanges
and the London Stock Exchanges Group. (9) Given the relatively small share (less than 0.5% of the daily turnover in the securities
market), trading of debt securities and its movements were not analysed. (10) At end-2016, there were 84 classes of stock options contracts and 74 classes of stock
futures contracts. (11) At end-2016, there were 1 713 and 260 companies listed on the Main Board and GEM
respectively. (12) At end-2016, there were 18 approved trustees. On MPF products, 33 master trust
schemes, two industry schemes and one employer sponsored scheme, comprising altogether 484 constituent funds, were approved by the Mandatory Provident Fund Schemes Authority. A total of 277 000 employers, 2.58 million employees and 202 000 self-employed persons have participated in MPF schemes.
(13) These figures are obtained from the Sales and Redemptions Survey conducted by the
Hong Kong Investment Funds Association on their members, and cover only the active authorised funds that have responded to the survey. At end-2016, the survey covered a total of 1 138 active authorised funds.
(14) At end-2016, there were two SFC-authorised retail hedge funds with combined net
asset size of US$29 million. The amount of net assets under management represented a 65.9% decrease over a year earlier, and a 81.9% decrease from end-2002, the year when the hedge funds guidelines were first issued.
(15) At end-2016, there were 160 authorised insurers in Hong Kong. Within this total, 47
were engaged in long-term insurance business, 94 in general insurance business, and 19 in composite insurance business. These authorised insurers came from 24 countries and territories (including Hong Kong).

102
CHAPTER 6 : THE LABOUR SECTOR
Summary • The labour market stayed resilient and held largely stable in overall terms
in 2016, with the unemployment rate staying low throughout the year. Alongside the relative improvement of both inbound tourism and domestic demand, the softness in labour demand in the early part of the year ameliorated towards the year-end.
• The labour force and total employment expanded further at a broadly similar pace in 2016. As such, the unemployment rate hovered at a low level of 3.3-3.4% during the year, averaging at 3.4% for the year as a whole, signifying another year of full employment.
• On the back of a resilient labour market, nominal wages and earnings continued to see broad-based increases in 2016, though at a slightly slower pace in tandem with lower inflation. Meanwhile, earnings of grassroots workers sustained solid growth.
Overall labour market situation(1) 6.1 The labour market displayed resilience and remained largely stable in overall terms in 2016. For 2016 as a whole, the labour force and total employment expanded further, with total employment reaching a new annual high of 3 812 400. The unemployment rate(2) hovered at a low level during the year, averaging at 3.4% for the year as a whole, while the underemployment rate(3) held steady at 1.4%. Although data collected from private sector establishments pointed to a slower year-on-year employment growth and a further decline in the number of vacancies in the first three quarters of 2016 combined, the easing trend of private sector labour demand showed some stabilisation in the latter part of 2016 along with the relative improvement of inbound tourism and domestic demand. Amid the broadly stable labour market, overall wages and earnings posted further across-the-board increases, though at a somewhat slower pace in line with easing inflation. Meanwhile, grassroots workers continued to see solid income growth.

103
Note : # Provisional figure.
Labour force and total employment 6.2 On the supply side, the labour force(4) expanded by 0.9% in 2016 to 3 944 600. With the labour force participation rate holding steady at 61.2%, the labour force growth largely reflected the increase in working-age population (i.e. land-based non-institutional population aged 15 and above). 6.3 On the demand side, total employment(5) grew by 0.8% to reach a new annual high of 3 812 400 in 2016. In terms of the quarterly profile, the year-on-year growth pace was more muted in the first quarter but picked up somewhat since the second quarter. In particular, employment in the consumption- and tourism-related segment reverted to a modest year-on-year growth in the fourth quarter, alongside the progressive improvement of inbound tourism in the latter part of the year.
Q1 Q2 Q3 Q4 Q1 Q2 Q3 Q4 Q1 Q2 Q3 Q4 Q1 Q2 Q3 Q4 Q1 Q2 Q3 Q4 Q1 Q2 Q3 Q42011 2012 2013 2014 2015 2016
Seasonally adjustedunemployment rate 3.5 3.6 3.2 3.3 3.4 3.2 3.3 3.2 3.5 3.3 3.4 3.2 3.1 3.2 3.3 3.3 3.3 3.3 3.3 3.3 3.4 3.4 3.4 3.3
Underemploymentrate 1.8 1.8 1.8 1.4 1.6 1.4 1.6 1.5 1.6 1.6 1.5 1.4 1.3 1.5 1.5 1.6 1.4 1.4 1.3 1.4 1.4 1.4 1.4 1.4
Long-termunemployment rate 0.9 0.9 0.8 0.7 0.8 0.8 0.8 0.7 0.9 0.7 0.7 0.7 0.6 0.6 0.6 0.6 0.7 0.6 0.6 0.6 0.6 0.6 0.7 0.7
0
1
2
3
4
5
Diagram 6.1 : The labour market stayed resilient and held largely stable in 2016Percent
Seasonally adjustedunemployment rate
Underemployment rate
Long-term unemployment rate
UnderemploymentrateLong-termunemployment rateAnnual unemployment rate 3.4 3.3 3.4 3.3 3.3 3.4#
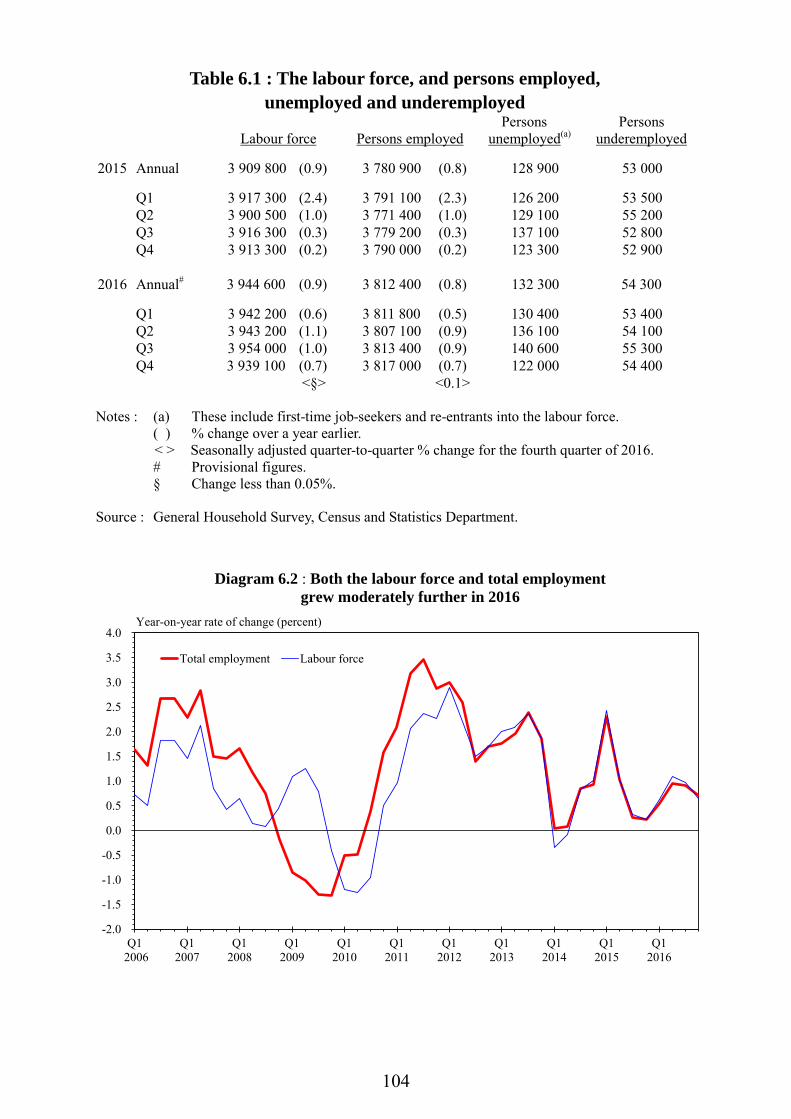
104
Table 6.1 : The labour force, and persons employed, unemployed and underemployed
Labour force
Persons employed
Persons unemployed(a)
Persons underemployed
2015 Annual 3 909 800 (0.9) 3 780 900 (0.8) 128 900 53 000 Q1 3 917 300 (2.4) 3 791 100 (2.3) 126 200 53 500 Q2 3 900 500 (1.0) 3 771 400 (1.0) 129 100 55 200 Q3 3 916 300 (0.3) 3 779 200 (0.3) 137 100 52 800 Q4 3 913 300 (0.2) 3 790 000 (0.2) 123 300 52 900 2016 Annual# 3 944 600 (0.9) 3 812 400 (0.8) 132 300 54 300 Q1 3 942 200 (0.6) 3 811 800 (0.5) 130 400 53 400 Q2 3 943 200 (1.1) 3 807 100 (0.9) 136 100 54 100 Q3 3 954 000 (1.0) 3 813 400 (0.9) 140 600 55 300 Q4 3 939 100 (0.7) 3 817 000 (0.7) 122 000 54 400 <§> <0.1> Notes : (a) These include first-time job-seekers and re-entrants into the labour force. ( ) % change over a year earlier.
< > Seasonally adjusted quarter-to-quarter % change for the fourth quarter of 2016. # Provisional figures. § Change less than 0.05%. Source : General Household Survey, Census and Statistics Department.
Q1 2006
Q12007
Q12008
Q12009
Q12010
Q12011
Q12012
Q12013
Q12014
Q12015
Q12016
-2.0
-1.5
-1.0
-0.5
0.0
0.5
1.0
1.5
2.0
2.5
3.0
3.5
4.0
Total employment Labour force
Year-on-year rate of change (percent)
Diagram 6.2 : Both the labour force and total employment grew moderately further in 2016

105
Table 6.2 : Labour force participation rates by gender and by age group (%)
2011 2012 2013 2014 2015 2016#
Male 15-24 35.7 36.4 37.8 37.8 39.0 39.2 of which:
15-19 9.9 10.5 11.0 11.1 11.6 12.6 20-24 61.1 61.1 62.5 61.5 61.9 61.5
25-29 93.9 94.5 93.8 93.4 93.6 92.6 30-39 96.5 96.8 96.9 96.5 96.5 96.2 40-49 95.1 95.3 95.5 94.7 95.0 95.0 50-59 84.9 85.1 86.8 86.7 86.7 86.4 ≥ 60 23.4 25.6 26.9 27.8 28.4 30.0 Overall 68.4 68.7 69.1 68.8 68.8 68.6 Female 15-24 37.0 37.5 40.0 39.3 41.5 41.2 of which:
15-19 9.1 9.7 11.5 12.5 12.8 11.8 20-24 62.1 62.0 64.2 61.4 63.7 63.8
25-29 87.5 87.2 86.6 86.3 85.8 86.3 30-39 76.8 77.5 78.5 79.0 78.5 78.9 40-49 69.9 70.8 72.8 73.1 73.8 74.0 50-59 51.6 53.8 56.1 57.1 58.2 59.4 ≥ 60 8.1 8.8 9.6 10.6 11.4 12.3 Overall 53.0 53.6 54.5 54.6 54.8 55.0 Both genders combined 15-24 36.4 37.0 38.9 38.6 40.2 40.2 of which:
15-19 9.5 10.1 11.2 11.8 12.2 12.2 20-24 61.6 61.6 63.4 61.4 62.8 62.7
25-29 90.2 90.3 89.7 89.4 89.2 89.1 30-39 84.9 85.4 85.9 86.0 85.7 85.8 40-49 81.0 81.4 82.5 82.3 82.7 82.7 50-59 68.0 69.2 71.0 71.4 71.8 72.2 ≥ 60 15.5 16.9 17.9 18.9 19.6 20.8 Overall 60.1 60.5 61.2 61.1 61.2 61.2 Note : # Provisional figures. Source : General Household Survey, Census and Statistics Department.
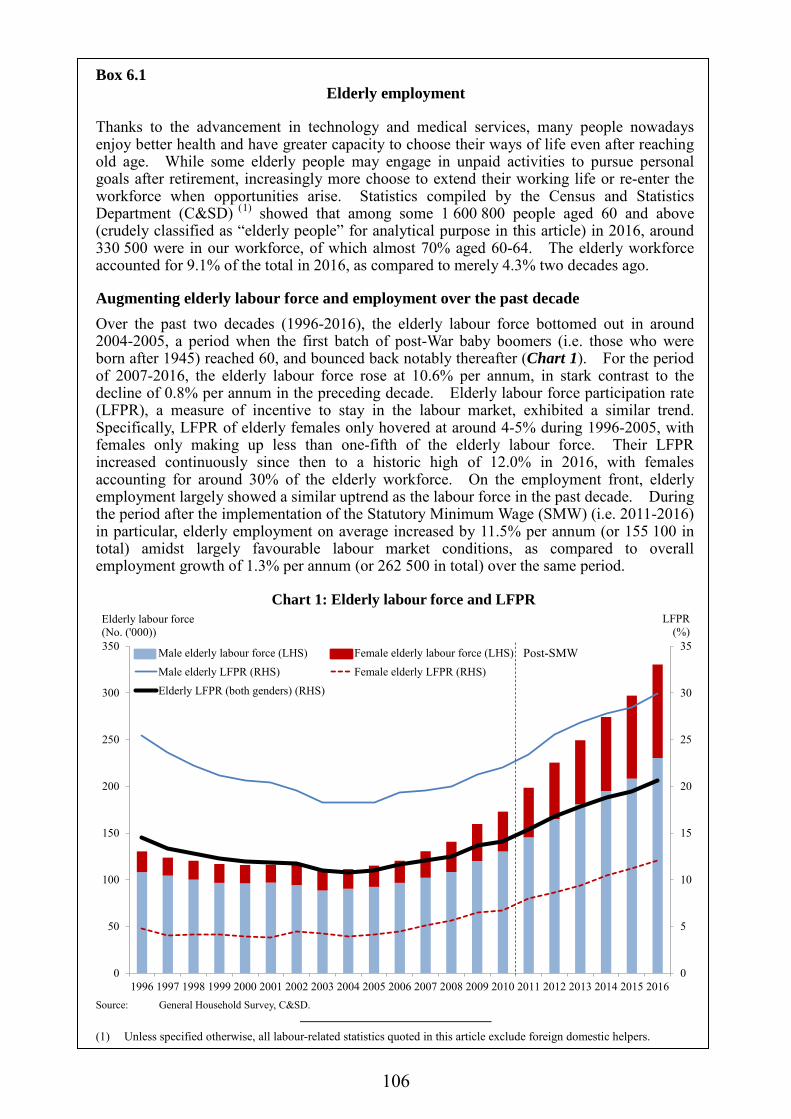
106
Box 6.1 Elderly employment
Thanks to the advancement in technology and medical services, many people nowadays enjoy better health and have greater capacity to choose their ways of life even after reaching old age. While some elderly people may engage in unpaid activities to pursue personal goals after retirement, increasingly more choose to extend their working life or re-enter the workforce when opportunities arise. Statistics compiled by the Census and Statistics Department (C&SD) (1) showed that among some 1 600 800 people aged 60 and above (crudely classified as “elderly people” for analytical purpose in this article) in 2016, around 330 500 were in our workforce, of which almost 70% aged 60-64. The elderly workforce accounted for 9.1% of the total in 2016, as compared to merely 4.3% two decades ago.
Augmenting elderly labour force and employment over the past decade Over the past two decades (1996-2016), the elderly labour force bottomed out in around 2004-2005, a period when the first batch of post-War baby boomers (i.e. those who were born after 1945) reached 60, and bounced back notably thereafter (Chart 1). For the period of 2007-2016, the elderly labour force rose at 10.6% per annum, in stark contrast to the decline of 0.8% per annum in the preceding decade. Elderly labour force participation rate (LFPR), a measure of incentive to stay in the labour market, exhibited a similar trend. Specifically, LFPR of elderly females only hovered at around 4-5% during 1996-2005, with females only making up less than one-fifth of the elderly labour force. Their LFPR increased continuously since then to a historic high of 12.0% in 2016, with females accounting for around 30% of the elderly workforce. On the employment front, elderly employment largely showed a similar uptrend as the labour force in the past decade. During the period after the implementation of the Statutory Minimum Wage (SMW) (i.e. 2011-2016) in particular, elderly employment on average increased by 11.5% per annum (or 155 100 in total) amidst largely favourable labour market conditions, as compared to overall employment growth of 1.3% per annum (or 262 500 in total) over the same period.
Chart 1: Elderly labour force and LFPR
Source: General Household Survey, C&SD.
(1) Unless specified otherwise, all labour-related statistics quoted in this article exclude foreign domestic helpers.
0
5
10
15
20
25
30
35
0
50
100
150
200
250
300
350
1996 1997 1998 1999 2000 2001 2002 2003 2004 2005 2006 2007 2008 2009 2010 2011 2012 2013 2014 2015 2016
Male elderly labour force (LHS) Female elderly labour force (LHS)Male elderly LFPR (RHS) Female elderly LFPR (RHS)Elderly LFPR (both genders) (RHS)
Post-SMW
Elderly labour force (No. ('000))
LFPR (%)

107
Box 6.1 (Cont’d) Improved income prospects and job quality for the elderly
The rising elderly LFPR over the past decade in some way reflects the more favourable income and job prospects which have conceivably helped entice elderly people to enter / stay in the workforce. Apart from cyclical factors, elderly people nowadays are generally better educated, thereby allowing them to have more career options, including jobs which are less physically demanding. Specifically, the share of employed elderlies with upper secondary and above almost doubled from 21.0% in 1996 to 39.1% in 2016. Echoing the improved educational profile, around 27% of employed elderlies was in the higher-skilled segment in 2016, as compared to only 19% in 1996 (Chart 2a). Also, when comparing to their counterparts in 1996, the average employment earnings of full-time elderly employed persons rose by some 53% in real terms (i.e. after discounting inflation) in 2016, as against some 34% increase for all employed persons over the same period.
Chart 2a: Elderly employment Chart 2b: Part-time(*) ratio by occupation of elderly employed persons
Notes: (*) Part-time employed persons are those working less than 35 hours during the seven days before enumeration due to reasons
other than vacation. Voluntary part-time employed persons exclude those part-time employed persons who were underemployed.
(#) Include other occupations. Source: General Household Survey, C&SD.
Over the past two decades, the share of part-timers among elderly employed persons more than doubled, from 9.4% in 1996 to 19.9% in 2016 (Chart 2b). It is worth noting that more than 90% of these part-timers actually engaged in part-time jobs voluntarily in 2016. In fact, the elderly underemployment rate in 2016, at 1.5%, was at the lowest level since 1997. Even for full-time elderly workers, the average weekly working hours(2) also dropped from 52 hours in 1996 to 47 hours in 2016. All these suggested that the elderly workers these days generally had greater autonomy in shaping their mode of working that met their circumstances, while also with both pay and working conditions improved in overall terms when comparing with their counterparts of previous birth cohorts.
(2) Based on General Household Survey, weekly hours of work refer to hours of work during the seven days before
enumeration.
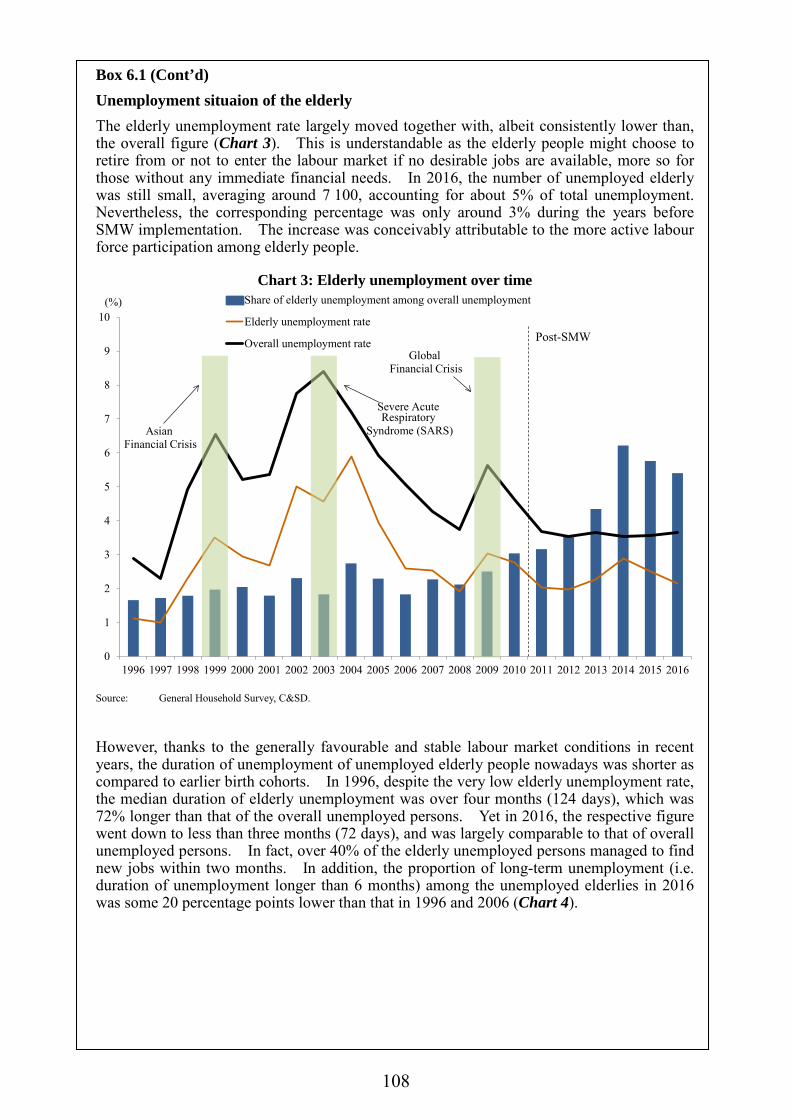
108
Box 6.1 (Cont’d) Unemployment situaion of the elderly The elderly unemployment rate largely moved together with, albeit consistently lower than, the overall figure (Chart 3). This is understandable as the elderly people might choose to retire from or not to enter the labour market if no desirable jobs are available, more so for those without any immediate financial needs. In 2016, the number of unemployed elderly was still small, averaging around 7 100, accounting for about 5% of total unemployment. Nevertheless, the corresponding percentage was only around 3% during the years before SMW implementation. The increase was conceivably attributable to the more active labour force participation among elderly people.
Chart 3: Elderly unemployment over time
Source: General Household Survey, C&SD.
However, thanks to the generally favourable and stable labour market conditions in recent years, the duration of unemployment of unemployed elderly people nowadays was shorter as compared to earlier birth cohorts. In 1996, despite the very low elderly unemployment rate, the median duration of elderly unemployment was over four months (124 days), which was 72% longer than that of the overall unemployed persons. Yet in 2016, the respective figure went down to less than three months (72 days), and was largely comparable to that of overall unemployed persons. In fact, over 40% of the elderly unemployed persons managed to find new jobs within two months. In addition, the proportion of long-term unemployment (i.e. duration of unemployment longer than 6 months) among the unemployed elderlies in 2016 was some 20 percentage points lower than that in 1996 and 2006 (Chart 4).
0
1
2
3
4
5
6
7
8
9
10
1996 1997 1998 1999 2000 2001 2002 2003 2004 2005 2006 2007 2008 2009 2010 2011 2012 2013 2014 2015 2016
Share of elderly unemployment among overall unemployment
Elderly unemployment rate
Overall unemployment rate
(%)
Asian Financial Crisis
Severe Acute Respiratory
Syndrome (SARS)
Global Financial Crisis
Post-SMW
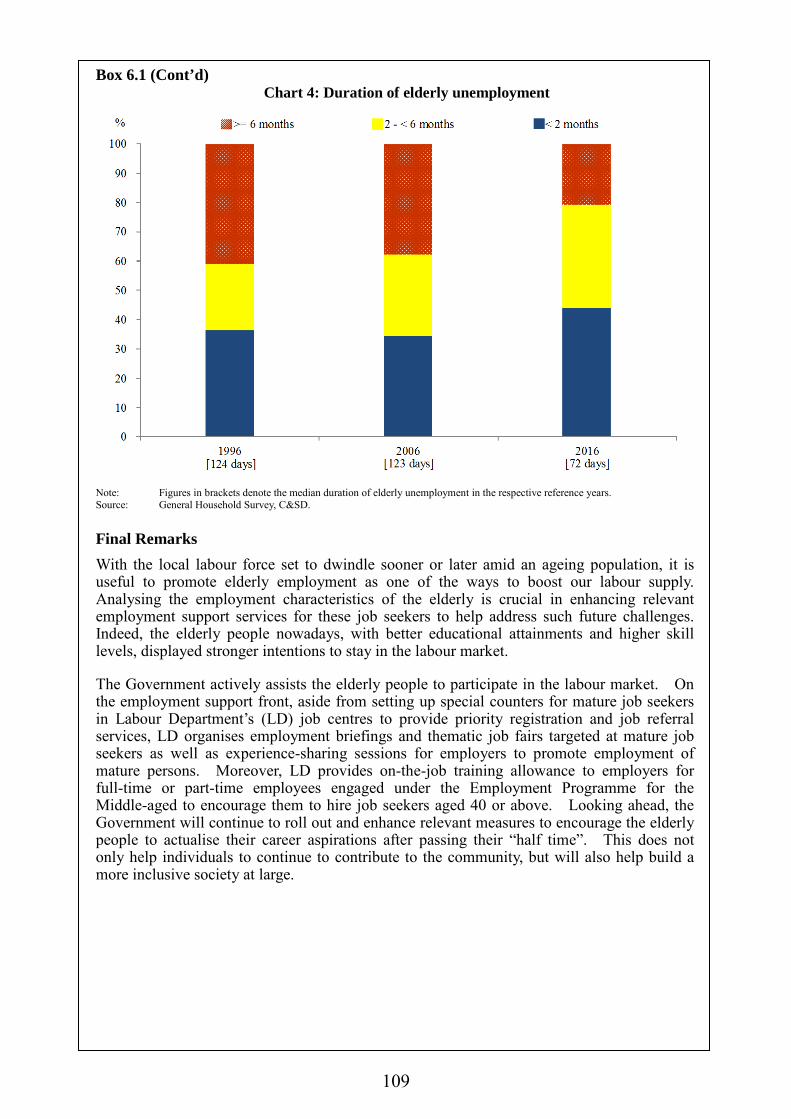
109
Box 6.1 (Cont’d) Chart 4: Duration of elderly unemployment
Note: Figures in brackets denote the median duration of elderly unemployment in the respective reference years. Source: General Household Survey, C&SD. Final Remarks With the local labour force set to dwindle sooner or later amid an ageing population, it is useful to promote elderly employment as one of the ways to boost our labour supply. Analysing the employment characteristics of the elderly is crucial in enhancing relevant employment support services for these job seekers to help address such future challenges. Indeed, the elderly people nowadays, with better educational attainments and higher skill levels, displayed stronger intentions to stay in the labour market.
The Government actively assists the elderly people to participate in the labour market. On the employment support front, aside from setting up special counters for mature job seekers in Labour Department’s (LD) job centres to provide priority registration and job referral services, LD organises employment briefings and thematic job fairs targeted at mature job seekers as well as experience-sharing sessions for employers to promote employment of mature persons. Moreover, LD provides on-the-job training allowance to employers for full-time or part-time employees engaged under the Employment Programme for the Middle-aged to encourage them to hire job seekers aged 40 or above. Looking ahead, the Government will continue to roll out and enhance relevant measures to encourage the elderly people to actualise their career aspirations after passing their “half time”. This does not only help individuals to continue to contribute to the community, but will also help build a more inclusive society at large.

110
Profile of unemployment 6.4 With labour force growth slightly outpacing employment growth, the number of unemployed persons rose slightly by 3 400 over 2015 to 132 300 in 2016. The unemployment rate inched up by 0.1 percentage point to 3.4% in 2016, still a relatively low level that signified a state of full employment. 6.5 Comparing 2016 with 2015, dragged by the slowdown in inbound tourism during most of 2016, as well as the sluggish trade flows, heightened financial volatilities, and slower growth in local consumption in the early part of 2016, many major economic sectors recorded a rise in the unemployment rate, notably retail (up 0.8 percentage point), accommodation services (up 0.6 percentage point), professional and business services (up 0.4 percentage point), financing and insurance (up 0.3 percentage point), and import and export trade (up 0.3 percentage point). On the other hand, slight declines in the unemployment rate were recorded in such sectors as social and personal services, and information and communications (both down by 0.1 percentage point). For the low paying sectors(6) as a whole, the unemployment rate inched up from 3.3% in 2015 to 3.4% in 2016, still a very low level. Analysed by skill segment, the unemployment rate for the higher- and lower-skilled segments both stayed relatively low, albeit up slightly by 0.2 and 0.1 percentage point respectively to 2.0% and 3.6%. Analysed by age, a more notable rise in unemployment rate was found among persons aged 25-29, while that of persons aged 15-24 fell visibly. 6.6 In terms of the quarterly profile, mirroring the noticeable slackening in the consumption- and tourism-related segment in early 2016 and its subsequent stabilisation in the latter part of the year, the seasonally adjusted unemployment rate inched up from 3.3% in the fourth quarter of 2015 to 3.4% in the first quarter of 2016, and held at this level in the subsequent two quarters, before falling back to 3.3% in the fourth quarter. Comparing the fourth quarter of 2016 with a year earlier, more visible declines in the unemployment rate were noted in the professional and business services, construction, and information and communications sectors, while that of retail, accommodation and food services as a whole saw a visibly narrower increase compared to the mid-year. Analysed by occupational category, a more discernible increase in the unemployment rate was seen among craft and related workers, while a more notable decrease was observed among plant and machine operators and assemblers. As for other socio-economic attributes, more visible rises in the unemployment rate were observed among persons aged 15-24, and those with secondary education, offsetting the declines seen among workers aged 40 and above, and those with post-secondary education.

111
Q12011
Q12012
Q12013
Q12014
Q12015
Q12016
2
3
4
5
6
7Retail
Construction
Accommodation and food services
Percent
0
Diagram 5.3 : Increases in the unemployment rate were observed in many economic sectors
Percent
0
Diagram 6.3 : Unemployment rates in most major economic sectors saw varied movements but generally stayed low in 2016
Q12011
Q12012
Q12013
Q12014
Q12015
Q12016
0
1
2
3
4
5Import/export trade and wholesaleFinancing, insurance, real estate, and professional and business servicesTransportation, storage, postal and courier services, and information and communicationsPublic administration, social and personal services
PercentPercent
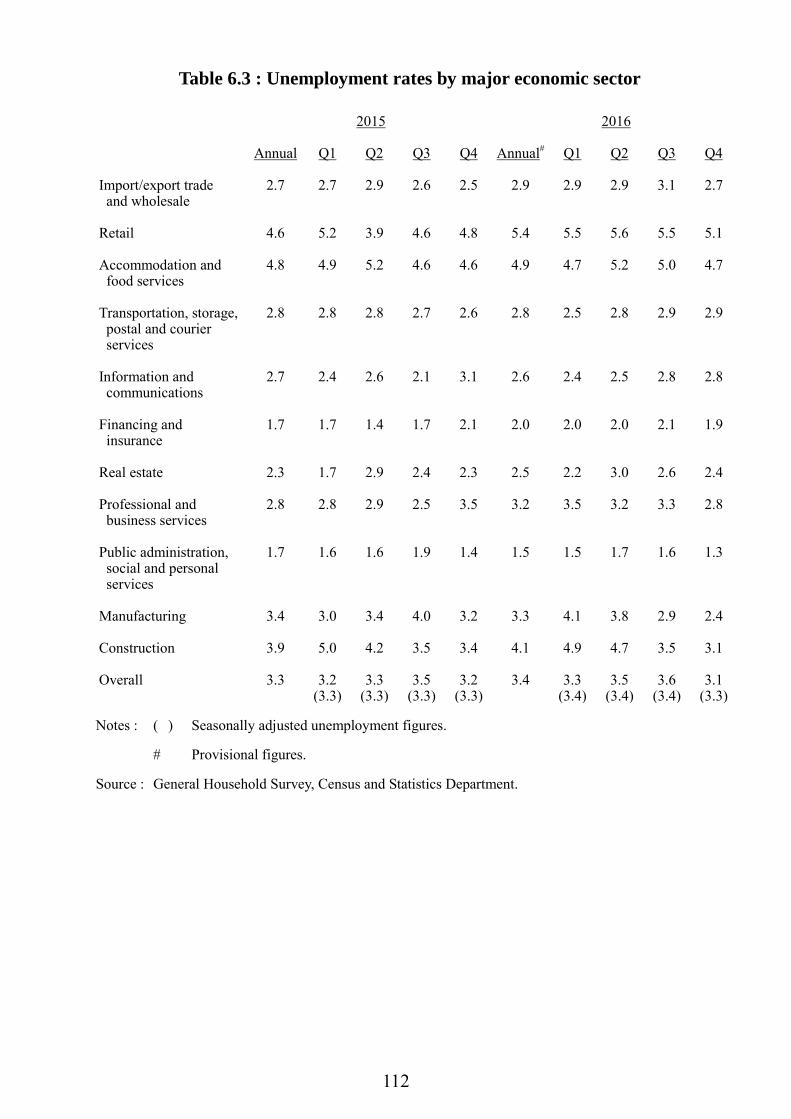
112
Table 6.3 : Unemployment rates by major economic sector 2015 2016 Annual Q1 Q2 Q3 Q4 Annual# Q1 Q2 Q3 Q4 Import/export trade and wholesale
2.7 2.7 2.9 2.6 2.5 2.9 2.9 2.9 3.1 2.7
Retail 4.6 5.2 3.9 4.6 4.8 5.4 5.5 5.6 5.5 5.1 Accommodation and food services
4.8 4.9 5.2 4.6 4.6 4.9 4.7 5.2 5.0 4.7
Transportation, storage, postal and courier services
2.8 2.8 2.8 2.7 2.6 2.8 2.5 2.8 2.9 2.9
Information and communications
2.7 2.4 2.6 2.1 3.1 2.6 2.4 2.5 2.8 2.8
Financing and insurance
1.7 1.7 1.4 1.7 2.1 2.0 2.0 2.0 2.1 1.9
Real estate 2.3 1.7 2.9 2.4 2.3 2.5 2.2 3.0 2.6 2.4 Professional and business services
2.8 2.8 2.9 2.5 3.5 3.2 3.5 3.2 3.3 2.8
Public administration, social and personal services
1.7 1.6 1.6 1.9 1.4 1.5 1.5 1.7 1.6 1.3
Manufacturing 3.4 3.0 3.4 4.0 3.2 3.3 4.1 3.8 2.9 2.4 Construction 3.9 5.0 4.2 3.5 3.4 4.1 4.9 4.7 3.5 3.1 Overall 3.3 3.2 3.3 3.5 3.2 3.4 3.3 3.5 3.6 3.1 (3.3) (3.3) (3.3) (3.3) (3.4) (3.4) (3.4) (3.3) Notes : ( ) Seasonally adjusted unemployment figures. # Provisional figures. Source : General Household Survey, Census and Statistics Department.
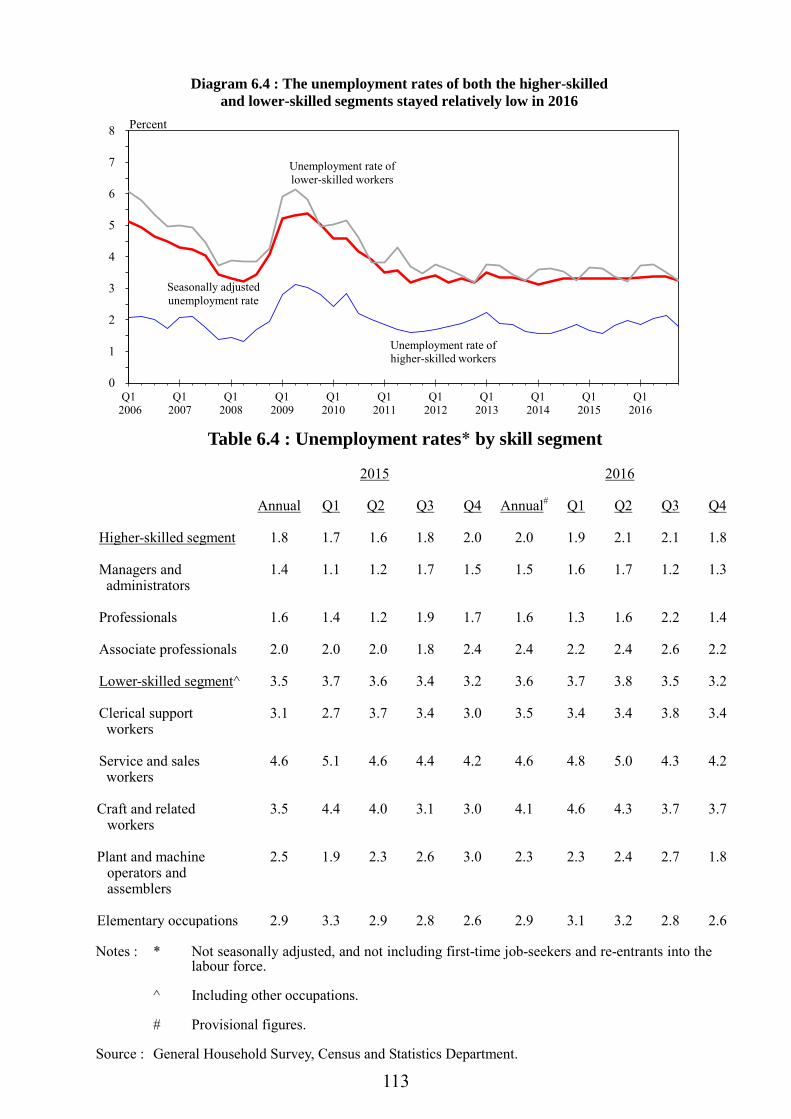
113
Table 6.4 : Unemployment rates* by skill segment
2015 2016 Annual Q1 Q2 Q3 Q4 Annual# Q1 Q2 Q3 Q4 Higher-skilled segment 1.8 1.7 1.6 1.8 2.0 2.0 1.9 2.1 2.1 1.8 Managers and administrators
1.4 1.1 1.2 1.7 1.5 1.5 1.6 1.7 1.2 1.3
Professionals 1.6 1.4 1.2 1.9 1.7 1.6 1.3 1.6 2.2 1.4 Associate professionals 2.0 2.0 2.0 1.8 2.4 2.4 2.2 2.4 2.6 2.2 Lower-skilled segment^ 3.5 3.7 3.6 3.4 3.2 3.6 3.7 3.8 3.5 3.2 Clerical support workers
3.1 2.7 3.7 3.4 3.0 3.5 3.4 3.4 3.8 3.4
Service and sales workers
4.6 5.1 4.6 4.4 4.2 4.6 4.8 5.0 4.3 4.2
Craft and related
workers 3.5 4.4 4.0 3.1 3.0 4.1 4.6 4.3 3.7 3.7
Plant and machine
operators and assemblers
2.5 1.9 2.3 2.6 3.0 2.3 2.3 2.4 2.7 1.8
Elementary occupations 2.9 3.3 2.9 2.8 2.6 2.9 3.1 3.2 2.8 2.6
Notes : * Not seasonally adjusted, and not including first-time job-seekers and re-entrants into the
labour force. ^ Including other occupations. # Provisional figures. Source : General Household Survey, Census and Statistics Department.
Q1 2006
Q12007
Q12008
Q12009
Q12010
Q12011
Q12012
Q12013
Q12014
Q12015
Q12016
0
1
2
3
4
5
6
7
8
Diagram 6.4 : The unemployment rates of both the higher-skilled and lower-skilled segments stayed relatively low in 2016
Percent
Unemployment rate of lower-skilled workers
Unemployment rate of higher-skilled workers
Seasonally adjustedunemployment rate
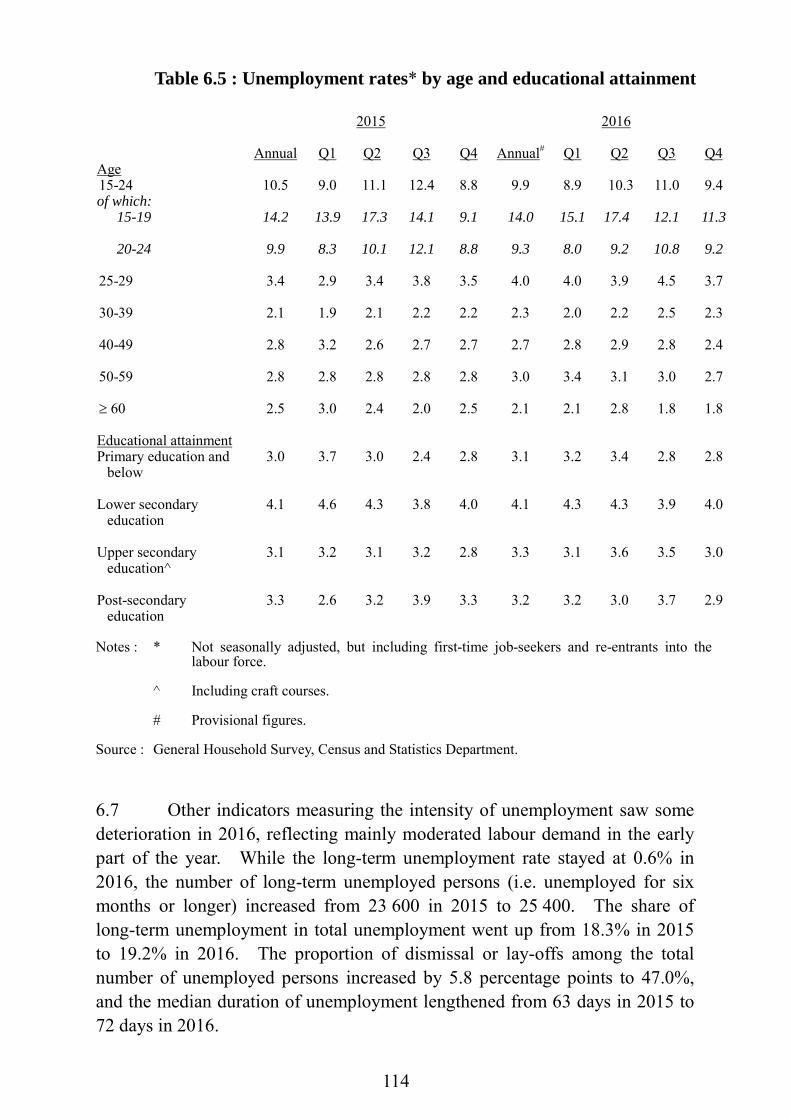
114
Table 6.5 : Unemployment rates* by age and educational attainment 2015 2016 Annual Q1 Q2 Q3 Q4 Annual# Q1 Q2 Q3 Q4 Age 15-24 10.5 9.0 11.1 12.4 8.8 9.9 8.9 10.3 11.0 9.4 of which:
15-19 14.2 13.9 17.3 14.1 9.1 14.0 15.1 17.4 12.1 11.3 20-24 9.9 8.3 10.1 12.1 8.8 9.3 8.0 9.2 10.8 9.2
25-29 3.4 2.9 3.4 3.8 3.5 4.0 4.0 3.9 4.5 3.7 30-39 2.1 1.9 2.1 2.2 2.2 2.3 2.0 2.2 2.5 2.3 40-49 2.8 3.2 2.6 2.7 2.7 2.7 2.8 2.9 2.8 2.4 50-59 2.8 2.8 2.8 2.8 2.8 3.0 3.4 3.1 3.0 2.7 ≥ 60 2.5 3.0 2.4 2.0 2.5 2.1 2.1 2.8 1.8 1.8 Educational attainment
Primary education and below
3.0 3.7 3.0 2.4 2.8 3.1 3.2 3.4 2.8 2.8
Lower secondary
education 4.1 4.6 4.3 3.8 4.0 4.1 4.3 4.3 3.9 4.0
Upper secondary
education^ 3.1 3.2 3.1 3.2 2.8 3.3 3.1 3.6 3.5 3.0
Post-secondary
education 3.3 2.6 3.2 3.9 3.3 3.2 3.2 3.0 3.7 2.9
Notes : * Not seasonally adjusted, but including first-time job-seekers and re-entrants into the
labour force. ^ Including craft courses. # Provisional figures. Source : General Household Survey, Census and Statistics Department. 6.7 Other indicators measuring the intensity of unemployment saw some deterioration in 2016, reflecting mainly moderated labour demand in the early part of the year. While the long-term unemployment rate stayed at 0.6% in 2016, the number of long-term unemployed persons (i.e. unemployed for six months or longer) increased from 23 600 in 2015 to 25 400. The share of long-term unemployment in total unemployment went up from 18.3% in 2015 to 19.2% in 2016. The proportion of dismissal or lay-offs among the total number of unemployed persons increased by 5.8 percentage points to 47.0%, and the median duration of unemployment lengthened from 63 days in 2015 to 72 days in 2016.
115
Profile of underemployment 6.8 The underemployment situation remained broadly stable in 2016. While the number of underemployed persons increased slightly by 1 300 over 2015 to 54 300, the underemployment rate remained unchanged at a low annual level of 1.4%. On the quarterly profile, the underemployment rate held stable at 1.4% throughout the four quarters of 2016. For the latest trend, in the fourth quarter of 2016, more noticeable year-on-year increases in the underemployment rate were seen in the foundation and superstructure, and cleaning and similar activities sectors, while more notable year-on-year declines were observed in arts, entertainment and recreation, retail, and food and beverage service activities sectors. Analysed by occupational category, the underemployment rate for the higher-skilled segment was little changed from a year earlier at a low level of 0.5% in the fourth quarter, while that of the lower-skilled segment edged up by 0.1 percentage point to 2.0%, dragged mainly by craft and related workers. Profile of employment in establishments 6.9 The quarterly statistics collected from private sector establishments on employment, vacancies, wages and payroll are available up to September 2016. To bring the analysis more up-to-date, attempts have been made wherever possible by drawing reference to information from supplementary sources. 6.10 Total employment in private sector establishments grew moderately by 0.7% in September 2016 over a year earlier to 2 814 500. More visible job gains were observed in construction sites (covering manual workers only) (up 15.0% year-on-year), human health services (up 4.3%), and residential care and social work services (up 3.2%), while more noticeable declines were seen in manufacturing amid its secular downtrend (down 4.4%), and arts, entertainment and recreation (down 3.6%). For the tourism- and consumption-related sectors in particular, in tandem with the relative stabilisation of inbound tourism, both the retail and accommodation and food services sectors recorded narrower declines (down 0.9% and 0.1% respectively). Analysed by establishment size, employment in large enterprises grew by 2.7% year-on-year, more than offsetting the decline of 1.6% in small and medium-sized enterprises (SMEs)(7). Taking the first nine months of 2016 together, total employment in private sector establishments increased by 0.6% year-on-year, slower than the 1.2% growth for 2015 as a whole. As for the civil service, employment increased by 1.1% in September and by 1.2% in the first nine months of 2016 combined over the same periods a year earlier.
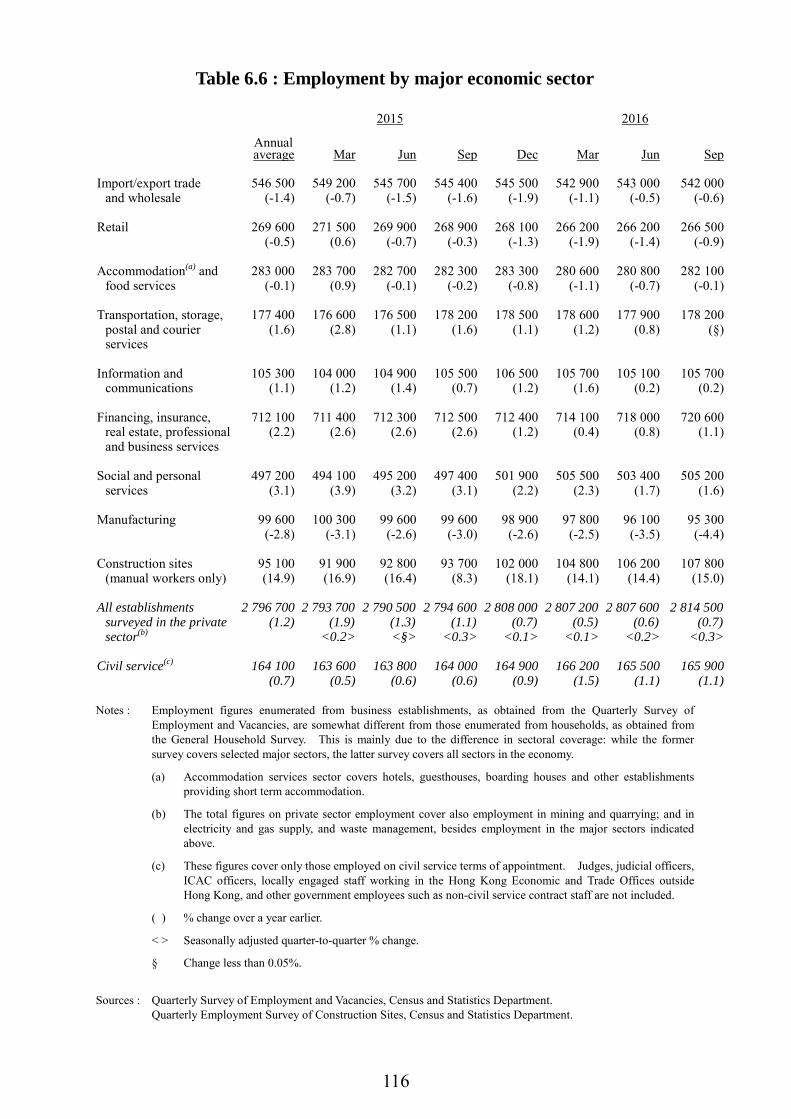
116
Table 6.6 : Employment by major economic sector 2015 2016 Annual average Mar Jun Sep Dec Mar Jun Sep Import/export trade
and wholesale 546 500
(-1.4) 549 200
(-0.7) 545 700
(-1.5) 545 400
(-1.6) 545 500
(-1.9) 542 900
(-1.1) 543 000
(-0.5) 542 000
(-0.6) Retail 269 600
(-0.5) 271 500
(0.6) 269 900
(-0.7) 268 900
(-0.3) 268 100
(-1.3) 266 200
(-1.9) 266 200
(-1.4) 266 500
(-0.9) Accommodation(a) and
food services 283 000
(-0.1) 283 700
(0.9) 282 700
(-0.1) 282 300
(-0.2) 283 300
(-0.8) 280 600
(-1.1) 280 800
(-0.7) 282 100
(-0.1) Transportation, storage,
postal and courier services
177 400 (1.6)
176 600 (2.8)
176 500 (1.1)
178 200 (1.6)
178 500 (1.1)
178 600 (1.2)
177 900 (0.8)
178 200 (§)
Information and
communications 105 300
(1.1) 104 000
(1.2) 104 900
(1.4) 105 500
(0.7) 106 500
(1.2) 105 700
(1.6) 105 100
(0.2) 105 700
(0.2) Financing, insurance,
real estate, professional and business services
712 100 (2.2)
711 400 (2.6)
712 300 (2.6)
712 500 (2.6)
712 400 (1.2)
714 100 (0.4)
718 000 (0.8)
720 600 (1.1)
Social and personal
services 497 200
(3.1) 494 100
(3.9) 495 200
(3.2) 497 400
(3.1) 501 900
(2.2) 505 500
(2.3) 503 400
(1.7) 505 200
(1.6) Manufacturing 99 600
(-2.8) 100 300
(-3.1) 99 600
(-2.6) 99 600
(-3.0) 98 900
(-2.6) 97 800
(-2.5) 96 100
(-3.5) 95 300
(-4.4) Construction sites
(manual workers only) 95 100 (14.9)
91 900 (16.9)
92 800 (16.4)
93 700 (8.3)
102 000 (18.1)
104 800 (14.1)
106 200 (14.4)
107 800 (15.0)
All establishments
surveyed in the private sector(b)
2 796 700 (1.2)
2 793 700 (1.9)
<0.2>
2 790 500 (1.3) <§>
2 794 600 (1.1)
<0.3>
2 808 000 (0.7)
<0.1>
2 807 200 (0.5)
<0.1>
2 807 600 (0.6)
<0.2>
2 814 500 (0.7)
<0.3> Civil service(c) 164 100
(0.7) 163 600
(0.5) 163 800
(0.6) 164 000
(0.6) 164 900
(0.9) 166 200
(1.5) 165 500
(1.1) 165 900
(1.1)
Notes : Employment figures enumerated from business establishments, as obtained from the Quarterly Survey of Employment and Vacancies, are somewhat different from those enumerated from households, as obtained from the General Household Survey. This is mainly due to the difference in sectoral coverage: while the former survey covers selected major sectors, the latter survey covers all sectors in the economy.
(a) Accommodation services sector covers hotels, guesthouses, boarding houses and other establishments providing short term accommodation.
(b) The total figures on private sector employment cover also employment in mining and quarrying; and in electricity and gas supply, and waste management, besides employment in the major sectors indicated above.
(c) These figures cover only those employed on civil service terms of appointment. Judges, judicial officers, ICAC officers, locally engaged staff working in the Hong Kong Economic and Trade Offices outside Hong Kong, and other government employees such as non-civil service contract staff are not included.
( ) % change over a year earlier.
< > Seasonally adjusted quarter-to-quarter % change.
§ Change less than 0.05%.
Sources : Quarterly Survey of Employment and Vacancies, Census and Statistics Department. Quarterly Employment Survey of Construction Sites, Census and Statistics Department.
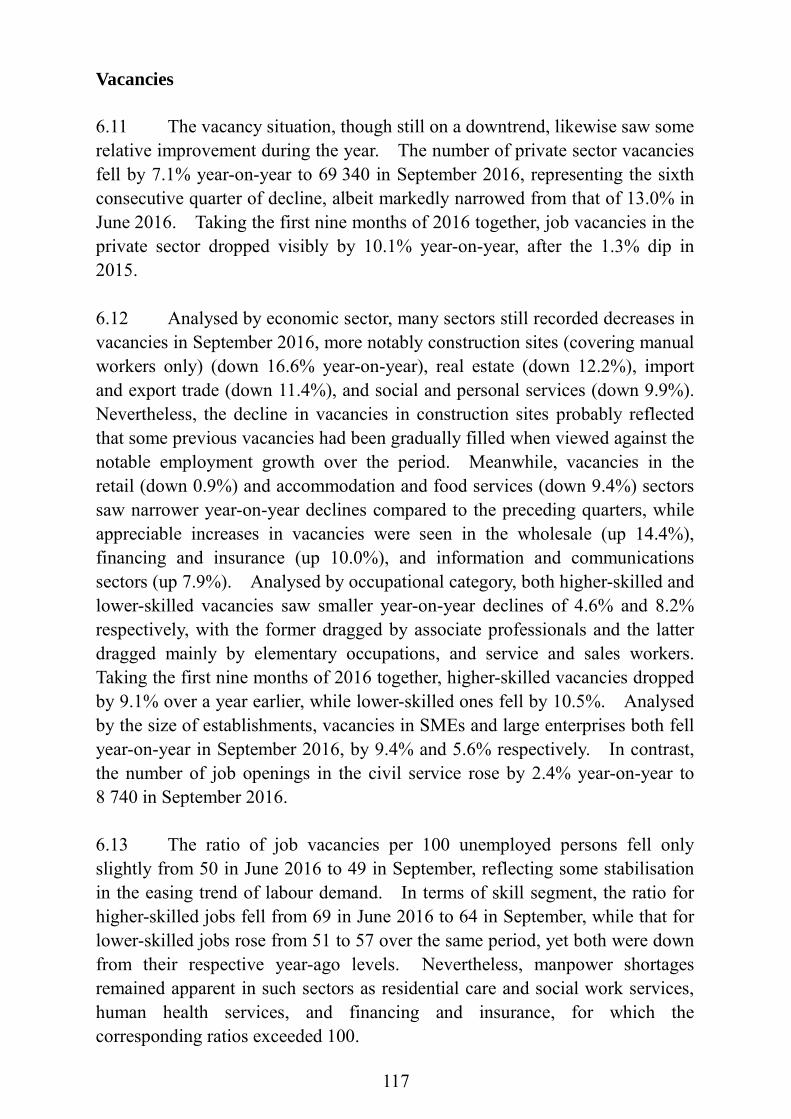
117
Vacancies 6.11 The vacancy situation, though still on a downtrend, likewise saw some relative improvement during the year. The number of private sector vacancies fell by 7.1% year-on-year to 69 340 in September 2016, representing the sixth consecutive quarter of decline, albeit markedly narrowed from that of 13.0% in June 2016. Taking the first nine months of 2016 together, job vacancies in the private sector dropped visibly by 10.1% year-on-year, after the 1.3% dip in 2015. 6.12 Analysed by economic sector, many sectors still recorded decreases in vacancies in September 2016, more notably construction sites (covering manual workers only) (down 16.6% year-on-year), real estate (down 12.2%), import and export trade (down 11.4%), and social and personal services (down 9.9%). Nevertheless, the decline in vacancies in construction sites probably reflected that some previous vacancies had been gradually filled when viewed against the notable employment growth over the period. Meanwhile, vacancies in the retail (down 0.9%) and accommodation and food services (down 9.4%) sectors saw narrower year-on-year declines compared to the preceding quarters, while appreciable increases in vacancies were seen in the wholesale (up 14.4%), financing and insurance (up 10.0%), and information and communications sectors (up 7.9%). Analysed by occupational category, both higher-skilled and lower-skilled vacancies saw smaller year-on-year declines of 4.6% and 8.2% respectively, with the former dragged by associate professionals and the latter dragged mainly by elementary occupations, and service and sales workers. Taking the first nine months of 2016 together, higher-skilled vacancies dropped by 9.1% over a year earlier, while lower-skilled ones fell by 10.5%. Analysed by the size of establishments, vacancies in SMEs and large enterprises both fell year-on-year in September 2016, by 9.4% and 5.6% respectively. In contrast, the number of job openings in the civil service rose by 2.4% year-on-year to 8 740 in September 2016. 6.13 The ratio of job vacancies per 100 unemployed persons fell only slightly from 50 in June 2016 to 49 in September, reflecting some stabilisation in the easing trend of labour demand. In terms of skill segment, the ratio for higher-skilled jobs fell from 69 in June 2016 to 64 in September, while that for lower-skilled jobs rose from 51 to 57 over the same period, yet both were down from their respective year-ago levels. Nevertheless, manpower shortages remained apparent in such sectors as residential care and social work services, human health services, and financing and insurance, for which the corresponding ratios exceeded 100.

118
6.14 The vacancy rate for private sector establishments, measured in terms of the percentage of job vacancies to total employment opportunities, remained unchanged at 2.4% in September 2016 compared with June 2016, but was down by 0.2 percentage point from 2.6% a year earlier. Year-on-year decreases in the vacancy rate were observed in many sectors, including notably accommodation and food services, real estate, and social and personal services.
Table 6.7 : Vacancies by major economic sector Number of vacancies 2015 2016 Vacancy
rate in Sep 2016
Annual average Mar Jun Sep Dec Mar Jun Sep
(%) Import/export trade
and wholesale 7 810 (-7.7)
9 000 (-2.3)
8 200 (0.6)
7 610 (-10.0)
6 450 (-19.8)
6 920 (-23.1)
6 940 (-15.4)
7 030 (-7.5)
1.3
Retail 8 320
(-8.6) 8 550
(-11.7) 8 440 (-4.2)
8 350 (-9.6)
7 950 (-8.7)
7 660 (-10.5)
7 100 (-15.9)
8 280 (-0.9)
3.0
Accommodation(a) and
food services 14 610
(-9.1) 15 470 (-12.1)
15 150 (-4.1)
14 600 (-6.1)
13 200 (-13.7)
12 930 (-16.4)
13 040 (-13.9)
13 230 (-9.4)
4.5
Transportation, storage,
postal and courier services
3 640 (-1.1)
3 960 (-5.4)
4 060 (0.6)
3 440 (1.7)
3 100 (-0.4)
3 440 (-13.2)
3 290 (-19.1)
3 210 (-6.8)
1.8
Information and
communications 2 800 (9.3)
2 930 (14.3)
2 480 (-6.5)
2 620 (11.3)
3 160 (18.3)
2 550 (-13.0)
2 470 (-0.3)
2 830 (7.9)
2.6
Financing, insurance,
real estate, professional and business services
18 790 (4.9)
18 360 (3.0)
18 780 (3.1)
18 590 (4.4)
19 440 (9.2)
18 400 (0.2)
18 020 (-4.1)
17 670 (-4.9)
2.4
Social and personal
services 15 800 (12.0)
15 620 (34.3)
17 290 (4.1)
15 760 (13.2)
14 540 (1.9)
14 280 (-8.6)
14 260 (-17.5)
14 210 (-9.9)
2.7
Manufacturing 2 720
(-10.6) 2 990 (-6.6)
2 730 (-23.9)
2 700 (-6.4)
2 470 (-1.2)
2 880 (-3.5)
2 280 (-16.2)
2 100 (-22.1)
2.2
Construction sites
(manual workers only) 800
(-42.6) 880 (-45.8)
940 (-39.1)
710 (-53.7)
650 (-22.7)
960 (8.8)
550 (-41.6)
590 (-16.6)
0.5
All establishments
surveyed in the private sector(b)
75 590 (-1.3)
78 070 (0.4)
<-2.3>
78 380 (-1.7)
<0.1>
74 670 (-0.9)
<-1.9>
71 240 (-3.1)
<0.5>
70 300 (-10.0) <-8.4>
68 200 (-13.0) <-3.8>
69 340 (-7.1)
<4.9>
2.4
Civil service(c) 8 250
(15.1) 7 820 (23.3)
8 030 (10.4)
8 540 (14.9)
8 590 (13.0)
8 090 (3.3)
8 900 (10.8)
8 740 (2.4)
5.0
Notes : Vacancy rate refers to the ratio of vacancies to total employment opportunities (actual employment plus vacancies).
(a) Accommodation services sector covers hotels, guesthouses, boarding houses and other establishments providing short term accommodation.
(b) The total figures on private sector vacancies cover also vacancies in mining and quarrying; and in electricity and gas supply, and waste management, besides vacancies in the major sectors indicated above.
(c) These figures cover only vacancies for those staff to be employed on civil service terms of appointment.
( ) % change over a year earlier.
< > Seasonally adjusted quarter-to-quarter % change.
Sources : Quarterly Survey of Employment and Vacancies, Census and Statistics Department. Quarterly Employment Survey of Construction Sites, Census and Statistics Department.
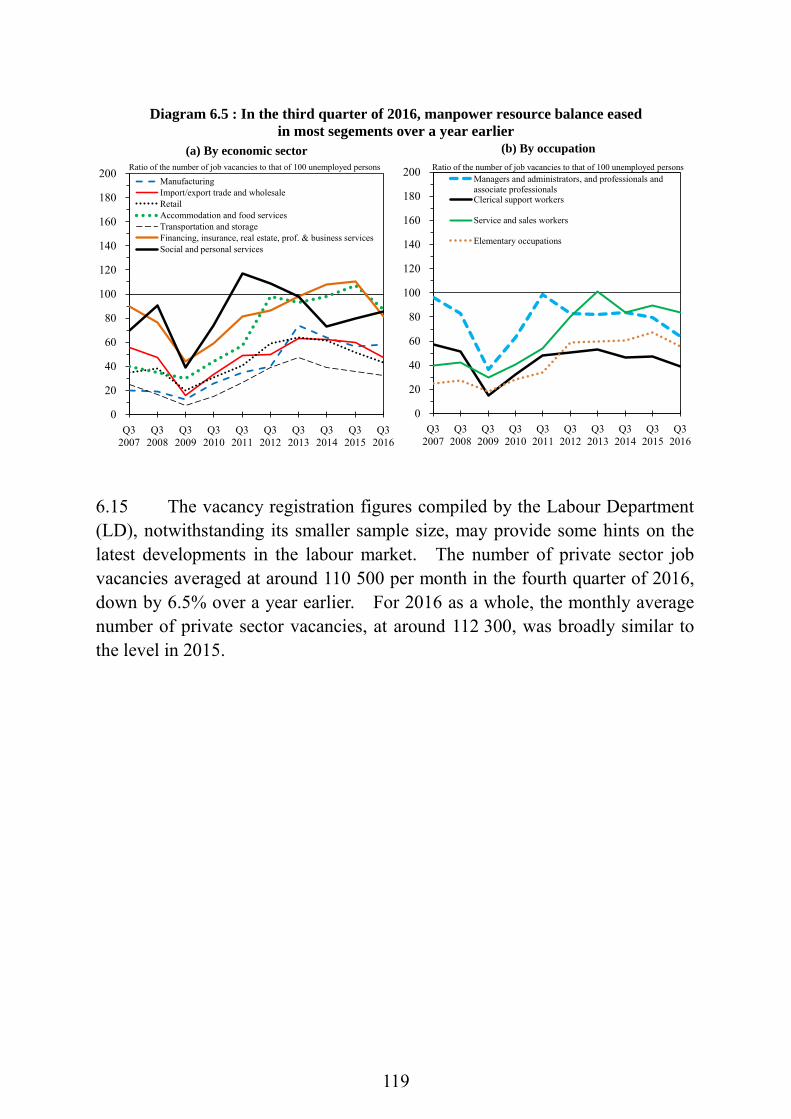
119
6.15 The vacancy registration figures compiled by the Labour Department (LD), notwithstanding its smaller sample size, may provide some hints on the latest developments in the labour market. The number of private sector job vacancies averaged at around 110 500 per month in the fourth quarter of 2016, down by 6.5% over a year earlier. For 2016 as a whole, the monthly average number of private sector vacancies, at around 112 300, was broadly similar to the level in 2015.
Q32007
Q32008
Q32009
Q32010
Q32011
Q32012
Q32013
Q32014
Q32015
Q32016
0
20
40
60
80
100
120
140
160
180
200
(a) By economic sector
ManufacturingImport/export trade and wholesaleRetailAccommodation and food servicesTransportation and storageFinancing, insurance, real estate, prof. & business servicesSocial and personal services
Ratio of the number of job vacancies to that of 100 unemployed persons
Q32007
Q32008
Q32009
Q32010
Q32011
Q32012
Q32013
Q32014
Q32015
Q32016
0
20
40
60
80
100
120
140
160
180
200
(b) By occupation
Managers and administrators, and professionals andassociate professionalsClerical support workers
Service and sales workers
Elementary occupations
Ratio of the number of job vacancies to that of 100 unemployed persons
Diagram 6.5 : In the third quarter of 2016, manpower resource balance easedin most segements over a year earlier
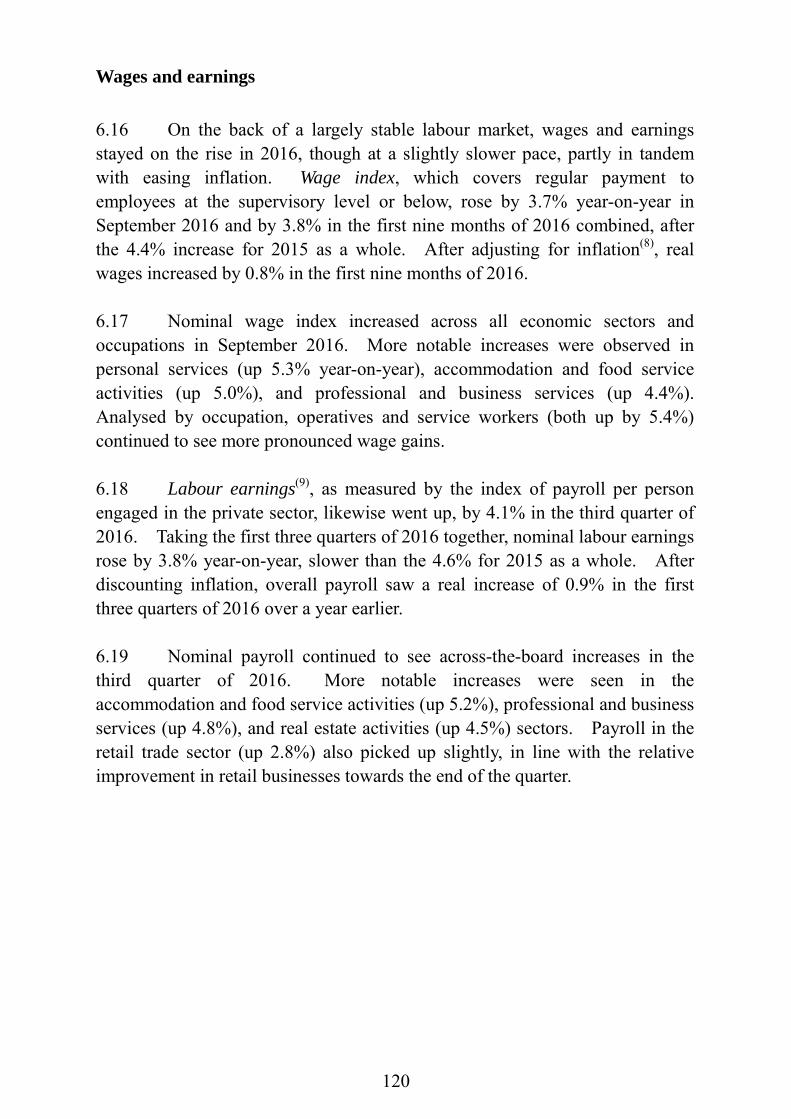
120
Wages and earnings 6.16 On the back of a largely stable labour market, wages and earnings stayed on the rise in 2016, though at a slightly slower pace, partly in tandem with easing inflation. Wage index, which covers regular payment to employees at the supervisory level or below, rose by 3.7% year-on-year in September 2016 and by 3.8% in the first nine months of 2016 combined, after the 4.4% increase for 2015 as a whole. After adjusting for inflation(8), real wages increased by 0.8% in the first nine months of 2016. 6.17 Nominal wage index increased across all economic sectors and occupations in September 2016. More notable increases were observed in personal services (up 5.3% year-on-year), accommodation and food service activities (up 5.0%), and professional and business services (up 4.4%). Analysed by occupation, operatives and service workers (both up by 5.4%) continued to see more pronounced wage gains. 6.18 Labour earnings(9), as measured by the index of payroll per person engaged in the private sector, likewise went up, by 4.1% in the third quarter of 2016. Taking the first three quarters of 2016 together, nominal labour earnings rose by 3.8% year-on-year, slower than the 4.6% for 2015 as a whole. After discounting inflation, overall payroll saw a real increase of 0.9% in the first three quarters of 2016 over a year earlier. 6.19 Nominal payroll continued to see across-the-board increases in the third quarter of 2016. More notable increases were seen in the accommodation and food service activities (up 5.2%), professional and business services (up 4.8%), and real estate activities (up 4.5%) sectors. Payroll in the retail trade sector (up 2.8%) also picked up slightly, in line with the relative improvement in retail businesses towards the end of the quarter.
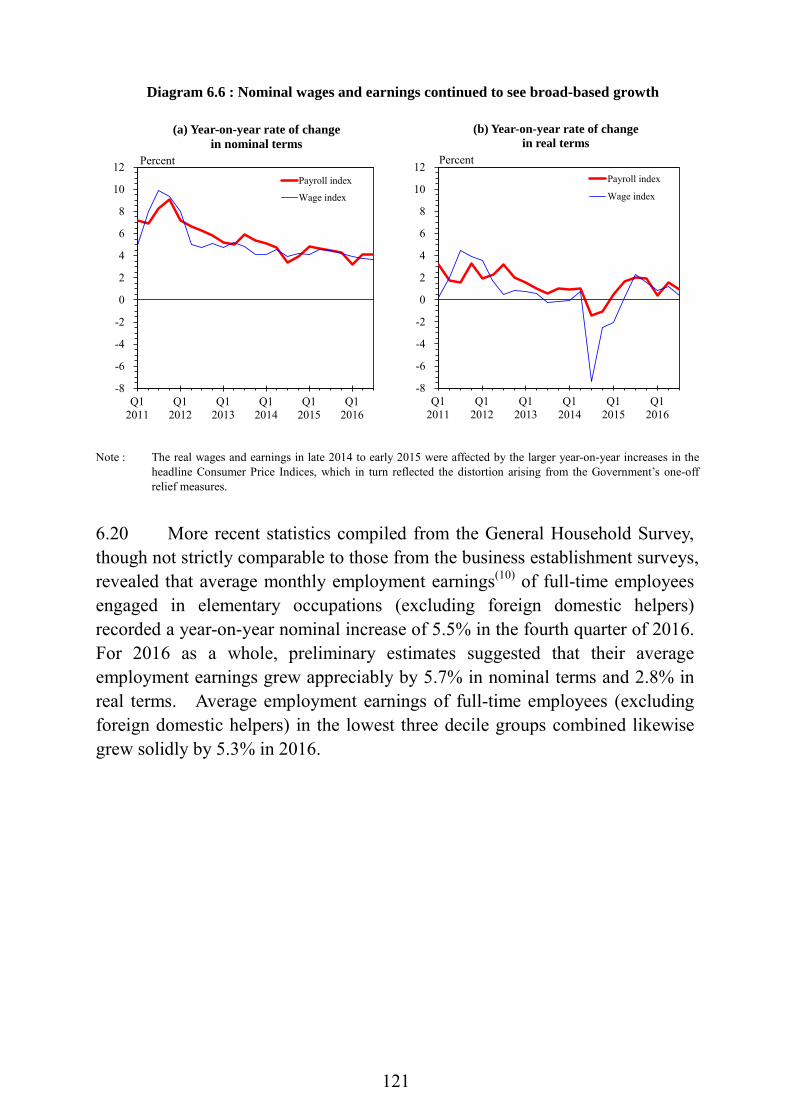
121
Note : The real wages and earnings in late 2014 to early 2015 were affected by the larger year-on-year increases in the
headline Consumer Price Indices, which in turn reflected the distortion arising from the Government’s one-off relief measures.
6.20 More recent statistics compiled from the General Household Survey, though not strictly comparable to those from the business establishment surveys, revealed that average monthly employment earnings(10) of full-time employees engaged in elementary occupations (excluding foreign domestic helpers) recorded a year-on-year nominal increase of 5.5% in the fourth quarter of 2016. For 2016 as a whole, preliminary estimates suggested that their average employment earnings grew appreciably by 5.7% in nominal terms and 2.8% in real terms. Average employment earnings of full-time employees (excluding foreign domestic helpers) in the lowest three decile groups combined likewise grew solidly by 5.3% in 2016.
Q12011
Q12012
Q12013
Q12014
Q12015
Q12016
-8
-6
-4
-2
0
2
4
6
8
10
12
(a) Year-on-year rate of changein nominal terms
Payroll index
Wage index
Percent
Q12011
Q12012
Q12013
Q12014
Q12015
Q12016
-8
-6
-4
-2
0
2
4
6
8
10
12
(b) Year-on-year rate of changein real terms
Payroll index
Wage index
Percent
Diagram 6.6 : Nominal wages and earnings continued to see broad-based growth
122
Highlights of labour-related measures and policy developments in 2016 6.21 LD regularly organises large-scale job fairs in different locations, canvassing vacancies from various industries for application by job-seekers on the spot. In 2016, LD organised 19 large-scale job fairs in North District, Cheung Sha Wan, Wan Chai, Tsuen Wan, Sha Tin, Tuen Mun and Yau Tong. 519 participating organisations offered over 34 300 vacancies from the retail, catering, property management, transport and other industries. There were also 15 training bodies joining the job fairs to introduce job training courses and receive applications on the spot. Apart from large-scale job fairs, district-based job fairs are organised at LD’s Job Centres from time to time to assist job-seekers in finding employment. Recruitment activities are also staged by catering, retail and construction employers at the three industry-based recruitment centres regularly for interviewing job-seekers on the spot. 6.22 On completion of a new round of review of the Statutory Minimum Wage (SMW) rate, the Minimum Wage Commission (MWC) submitted its recommendation report on 31 October 2016. The Chief Executive in Council has adopted the recommendation of MWC to raise the SMW rate from its prevailing level of $32.5 per hour by 6.2% to $34.5 per hour. Subject to approval by the Legislative Council, the revised SMW rate will be implemented from 1 May 2017. 6.23 The Standard Working Hours Committee (SWHC) submitted its report to the Government on 27 January 2017. The Government will take full account of the report of SWHC and the views of various sectors of the community, and strive to map out within the term of the current Government the working hours policy direction that suits Hong Kong’s socio-economic situation.

123
Notes : (1) Labour force statistics enumerated from the General Household Survey are statistics
which involve the use of the population figures in the compilation process. The statistics of the three-month periods of November 2014 – January 2015 to October – December 2015 have been revised to take into account the final end-2015 population estimates.
The classification of occupation adopted by the Census and Statistics Department
follows the International Standard Classification of Occupations (ISCO), which is used to classify the occupation of an employed person or the previous occupation of an unemployed person. After the implementation of the new ISCO, 2008 (ISCO-08), the General Household Survey has been enhanced to adopt the ISCO-08 in compiling labour force statistics by occupation, with statistics backcasted to the quarter of January to March 2011. Starting from the reference quarter of January to March 2011, all the labour force statistics by occupation, unless otherwise specified, are compiled based on the ISCO-08.
(2) For a person aged 15 or above to be classified as unemployed, he or she should:
(a) not have a job and not be performing any work for pay or profit during the reference period (i.e. seven days before enumeration); and (b) be available for work during the reference period; and (c) be seeking work during the 30 days before enumeration.
Notwithstanding the above, the following types of persons are also considered
unemployed: (a) persons without a job, having sought work but not available for work because of temporary sickness; (b) persons without a job, available for work but not having sought work because they will take up new jobs or start business at a subsequent date, or expect to return to their original jobs; and (c) discouraged workers not having sought work because they believe work is not available to them.
Even at full employment, some frictional unemployment is bound to exist as workers
move between jobs in order to obtain better terms of employment. The precise level of unemployment which can be described as purely frictional varies amongst economies, depending on the structure and characteristics of their labour markets.
The seasonally adjusted series is compiled using the X-12 ARIMA method, which is a
standard method applied in compiling seasonally adjusted statistical data series. (3) The main criteria for an employed person aged 15 or above to be classified as
underemployed are: involuntarily working less than 35 hours during the reference period (i.e. seven days before enumeration), and either available for additional work during the reference period or seeking additional work during the 30 days before enumeration.
Following these criteria, employed persons taking no-pay leave due to slack work
during the reference period are also classified as underemployed if they had worked less than 35 hours or were on leave for the entire reference period.
(4) The labour force, or the economically active population, is defined to include all
persons aged 15 or above who either were engaged in productive work during the reference period (i.e. seven days before enumeration) or would otherwise have been engaged in productive work but were unemployed.
124
(5) Figures enumerated from household data. The employed population is defined here to include those persons aged 15 or above who performed work for pay or profit or had a formal job attachment during the reference period (i.e. seven days before enumeration).
(6) The low paying sectors as identified by the Minimum Wage Commission include:
(i) retail (including supermarkets and convenience stores, and other retail stores); (ii) restaurants (including Chinese restaurants, non-Chinese restaurants, fast food cafes, and Hong Kong style tea cafes); (iii) estate management, security and cleaning services (including real estate maintenance management, security services, cleaning services and membership organisations); (iv) other low paying sectors, including - elderly homes; - laundry and dry cleaning services; - hairdressing and other personal services; - local courier services; and - food processing and production.
(7) Manufacturing enterprises with fewer than 100 employees and non-manufacturing enterprises with fewer than 50 employees are regarded as small and medium-sized enterprises (SMEs) in Hong Kong. Yet, establishments with the same main business registration number (BRN) and engaging in activities of the same industry sector are grouped into one business unit for the purpose of calculating the number of SMEs. Thus, a business with a lot of small chain stores each employing a small number of employees will be considered as a single large enterprise, instead of separate SMEs.
(8) Different consumer price indices are used for compiling the real indices of labour
earnings and wages, taking into account their relevance to the respective occupation coverage. Specifically, the Composite CPI, being an indicator of overall consumer prices, is taken as the price deflator for earnings received by employees at all levels of the occupational hierarchy. The CPI(A), being an indicator of consumer prices for the relatively low expenditure group, is taken as the price deflator for wages in respect of employees engaged in occupations up to the supervisory level.
(9) In addition to wages, which include all regular and guaranteed payments like basic pay
and stipulated bonuses and allowances, earnings also cover overtime pay and other non-guaranteed or irregular bonuses and allowances, except severance pay and long service payment. Because of this difference, as well as the difference in sectoral and occupational coverage, the movements in average earnings, as measured by payroll per person engaged, do not necessarily match closely with those in wage rates.
(10) The average (mean) monthly employment earnings are easily affected by extreme
values in the survey sample, more so when reckoned for higher-end workers. They should therefore be interpreted with caution, in particular when they are compared over time.

125
CHAPTER 7 : PRICES
Summary
Inflationary pressures eased slightly further in 2016, thanks to the generally soft domestic and external price pressures during most of the period. The increase in underlying Composite Consumer Price Index (Composite CPI)(1), which nets out the effects of the Government’s one-off relief measures to more accurately reflect the underlying inflation trend, edged down to 2.3% in 2016 from 2.5% in 2015, extending the downtrend for five years in a row. In a similar vein, the headline Composite CPI inflation eased to 2.4% in 2016, down from 3.0% in 2015.
Domestic cost pressures were largely kept at bay throughout 2016. The increases in labour costs were steady against the backdrop of a stable labour market. Rental inflation also moderated as the softer residential and commercial rentals gradually filtered through. The sluggishness in inbound tourism and slower local consumption growth also weighed on the pricing power of the retail segment.
External price pressures were virtually absent in 2016, given the benign inflation in our major import sources and the strength of the US dollar. The lower international food and commodity prices as compared to their year-ago levels during most of 2016 were also relevant, notwithstanding clearer signs of stabilisation towards year-end.
In the near term, the upside risks to CPI inflation should still be contained, given that economic growth, both locally and globally, is likely to stay moderate amid various external uncertainties, and that the softer rentals in 2016 should continue to feed through into the CPI components at least for some time into 2017. Nevertheless, international food and commodity prices could exhibit fluctuations this year amid the increasingly complicated global monetary and economic landscape, casting some uncertainty around the inflation outlook.

126
Consumer prices 7.1 Underlying inflation continued its easing trend for the fifth consecutive year in 2016, thanks to the still benign price pressures from both domestic and external fronts during most of the period. Locally, the broadly stable labour market conditions have helped keep labour cost pressures in check over the course of the year. Rental inflation likewise eased further, due to the gradual feed-through of the earlier softening in fresh-letting residential and commercial rentals. The price-setting power of the retailers was also constrained by the slowdown in inbound tourism as well as the slower growth in local consumption. Externally, imported inflation was virtually absent in 2016, thanks to the relatively low inflation in our major trading partners(2) and the persisted strength of the US dollar. Also relevant were the muted international food and commodity price pressures during most of 2016, notwithstanding their emerging signs of stabilisation in the latter part of the year.
Note : The year-on-year rates of change of the CPIs from the fourth quarter of 2015 onwards are
computed from the new 2014/15-based series, and those before are from the old 2009/10-based series.
Q12012
Q12013
Q12014
Q12015
Q12016
0
2
4
6
8
10Composite CPI
Underlying Composite CPI
Year-on-year rate of change (%)
Diagram 7.1 : Underlying inflation extended its easing trend to 2016
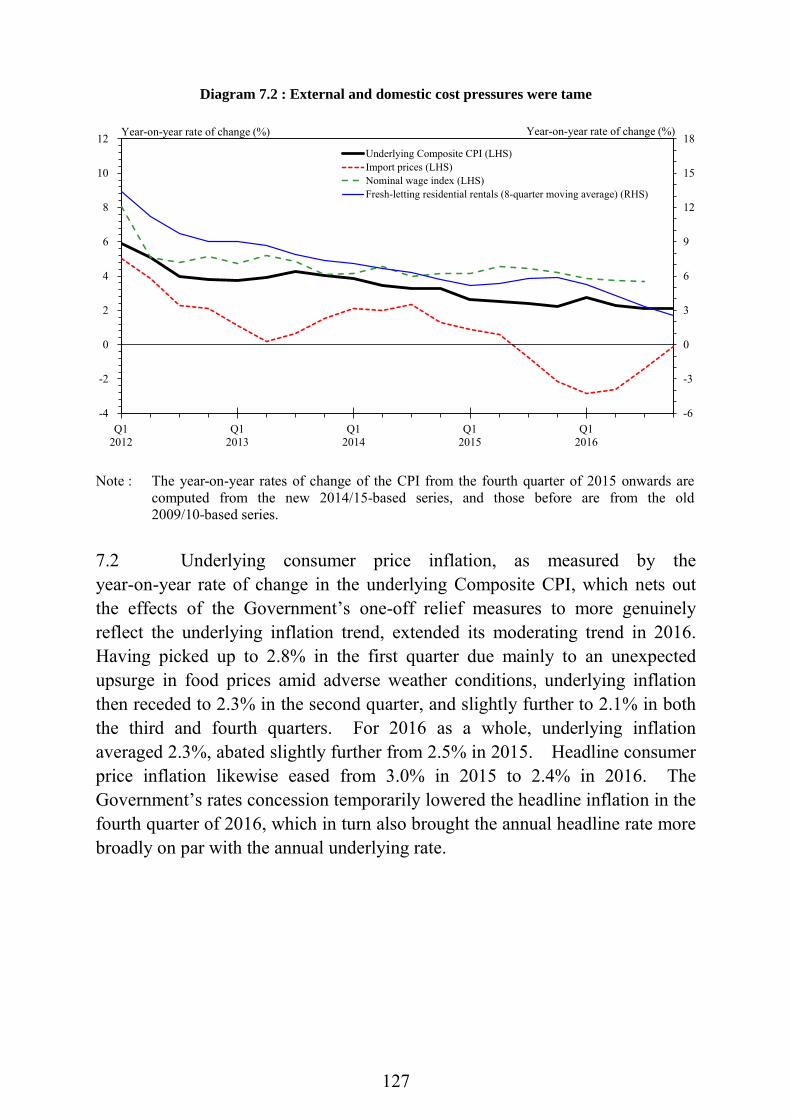
127
Note : The year-on-year rates of change of the CPI from the fourth quarter of 2015 onwards are
computed from the new 2014/15-based series, and those before are from the old 2009/10-based series.
7.2 Underlying consumer price inflation, as measured by the year-on-year rate of change in the underlying Composite CPI, which nets out the effects of the Government’s one-off relief measures to more genuinely reflect the underlying inflation trend, extended its moderating trend in 2016. Having picked up to 2.8% in the first quarter due mainly to an unexpected upsurge in food prices amid adverse weather conditions, underlying inflation then receded to 2.3% in the second quarter, and slightly further to 2.1% in both the third and fourth quarters. For 2016 as a whole, underlying inflation averaged 2.3%, abated slightly further from 2.5% in 2015. Headline consumer price inflation likewise eased from 3.0% in 2015 to 2.4% in 2016. The Government’s rates concession temporarily lowered the headline inflation in the fourth quarter of 2016, which in turn also brought the annual headline rate more broadly on par with the annual underlying rate.
-6
-3
0
3
6
9
12
15
18
Q12012
Q12013
Q12014
Q12015
Q12016
-4
-2
0
2
4
6
8
10
12Underlying Composite CPI (LHS)Import prices (LHS)Nominal wage index (LHS)Fresh-letting residential rentals (8-quarter moving average) (RHS)
Year-on-year rate of change (%) Year-on-year rate of change (%)
Diagram 7.2 : External and domestic cost pressures were tame

128
Table 7.1 : Consumer Price Indices (year-on-year rate of change (%))
Composite CPI CPI(A) CPI(B) CPI(C)
Underlying(a) Headline
2015 Annual 2.5(b) 3.0(b) 4.0(b) 2.9(b) 2.1(b)
H1 2.6 3.7 5.3 3.3 2.3
H2 2.3(b) 2.3(b) 2.7(b) 2.3(b) 1.9(b)
Q1 2.7 4.4 6.5 3.9 2.6
Q2 2.5 3.0 4.2 2.7 1.9
Q3 2.4 2.3 2.8 2.3 1.8
Q4 2.2 2.3 2.5 2.4 2.0
2016 Annual 2.3 2.4 2.8 2.3 2.1
H1 2.5 2.7 2.9 2.7 2.5
H2 2.1 2.1 2.8 1.9 1.7
Q1 2.8 2.8 3.1 2.8 2.5
Q2 2.3 2.6 2.7 2.7 2.4
Q3 2.1 3.1 4.5 2.6 2.2
Q4 2.1 1.2 1.1 1.2 1.3
(seasonally adjusted quarter-to-quarter rate of change (%))
2015 Q1 0.2 0.2 0.4 0.2 0.1
Q2 0.7 -0.5 -1.1 -0.5 *
Q3 0.5 -0.1 -1.1 0.5 0.4
Q4 0.9 2.7 4.4 2.1 1.5
2016 Q1 0.7 0.7 0.9 0.6 0.6
Q2 0.2 -0.6 -1.4 -0.5 -0.1
Q3 0.5 0.4 0.6 0.5 0.2
Q4 0.7 0.7 1.0 0.6 0.6 Notes : (a) Underlying consumer price inflation is calculated by netting out the effects of all
relevant one-off measures introduced since 2007, including the waiver and Government’s payment of public housing rentals, rates concession, suspension and subsequent abolition of Employees Retraining Levy, and subsidies for household electricity charges.
(b) The year-on-year rates of change of the CPIs from the fourth quarter of 2015
onwards are computed from the new 2014/15-based series, and those before are from the old 2009/10-based series. Splicing has been applied to the indices in order to obtain better estimates of the rates of change for the year 2015 and H2 of 2015.
(*) Change within ±0.05%.
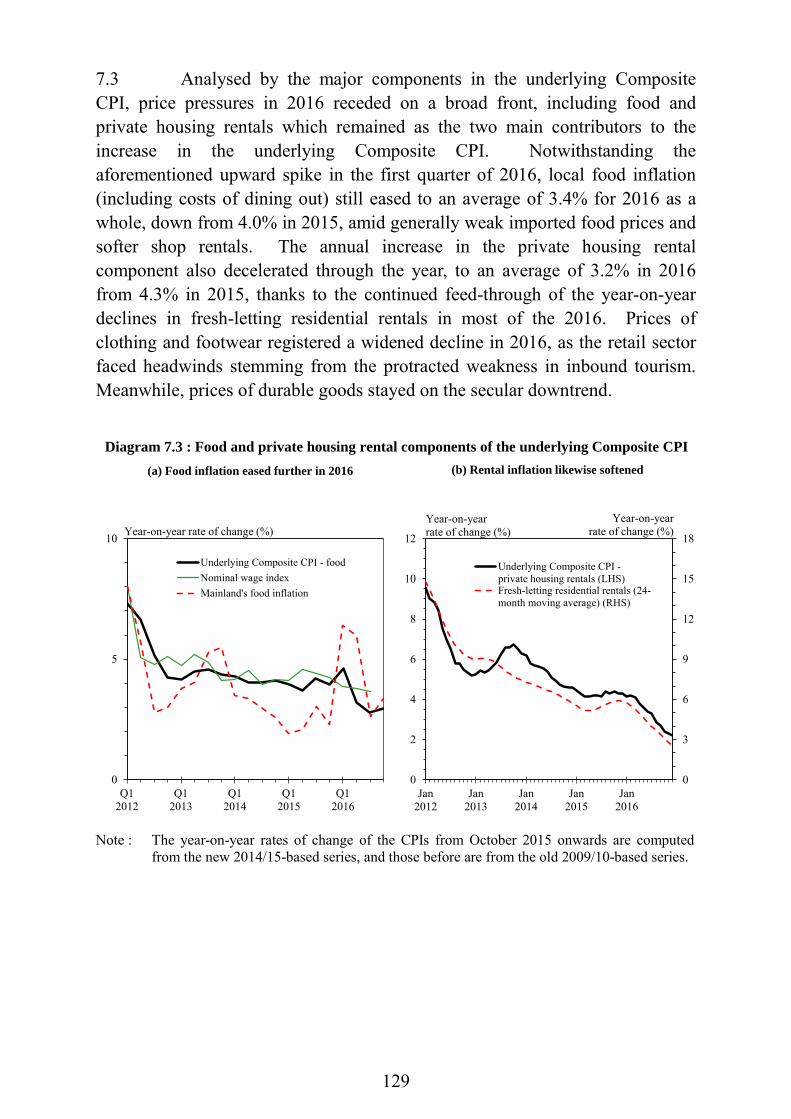
129
7.3 Analysed by the major components in the underlying Composite CPI, price pressures in 2016 receded on a broad front, including food and private housing rentals which remained as the two main contributors to the increase in the underlying Composite CPI. Notwithstanding the aforementioned upward spike in the first quarter of 2016, local food inflation (including costs of dining out) still eased to an average of 3.4% for 2016 as a whole, down from 4.0% in 2015, amid generally weak imported food prices and softer shop rentals. The annual increase in the private housing rental component also decelerated through the year, to an average of 3.2% in 2016 from 4.3% in 2015, thanks to the continued feed-through of the year-on-year declines in fresh-letting residential rentals in most of the 2016. Prices of clothing and footwear registered a widened decline in 2016, as the retail sector faced headwinds stemming from the protracted weakness in inbound tourism. Meanwhile, prices of durable goods stayed on the secular downtrend.
Note : The year-on-year rates of change of the CPIs from October 2015 onwards are computed
from the new 2014/15-based series, and those before are from the old 2009/10-based series.
0
3
6
9
12
15
18
Jan2012
Jan2013
Jan2014
Jan2015
Jan2016
0
2
4
6
8
10
12
Underlying Composite CPI -private housing rentals (LHS)Fresh-letting residential rentals (24-month moving average) (RHS)
Q12012
Q12013
Q12014
Q12015
Q12016
0
5
10
Underlying Composite CPI - foodNominal wage indexMainland's food inflation
Year-on-year rate of change (%)Year-on-year rate of change (%)
Year-on-year rate of change (%)
Diagram 7.3 : Food and private housing rental components of the underlying Composite CPI(a) Food inflation eased further in 2016 (b) Rental inflation likewise softened
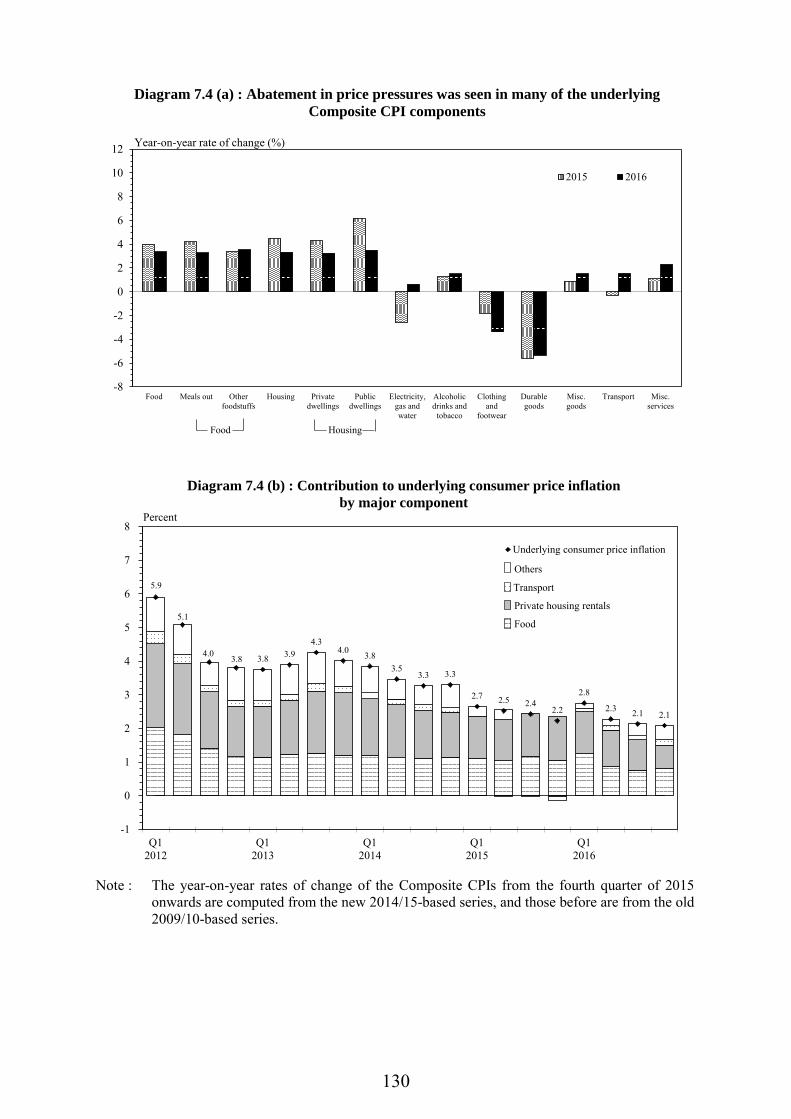
130
Note : The year-on-year rates of change of the Composite CPIs from the fourth quarter of 2015
onwards are computed from the new 2014/15-based series, and those before are from the old 2009/10-based series.
-8
-6
-4
-2
0
2
4
6
8
10
12
Food Meals out Otherfoodstuffs
Housing Privatedwellings
Publicdwellings
Electricity,gas andwater
Alcoholicdrinks and
tobacco
Clothingand
footwear
Durablegoods
Misc.goods
Transport Misc.services
2015 2016
Diagram 7.4 (a) : Abatement in price pressures was seen in many of the underlying Composite CPI components
Year-on-year rate of change (%)
Food Housing
5.9
5.1
4.0 3.8 3.8 3.9 4.3
4.0 3.8 3.5
3.3 3.3
2.7 2.5 2.4 2.2
2.8
2.3 2.1 2.1
-1
0
1
2
3
4
5
6
7
8
Q12012
Q12013
Q12014
Q12015
Q12016
Diagram 7.4 (b) : Contribution to underlying consumer price inflationby major component
Underlying consumer price inflation
Percent
Food
Private housing rentals
Transport
Others
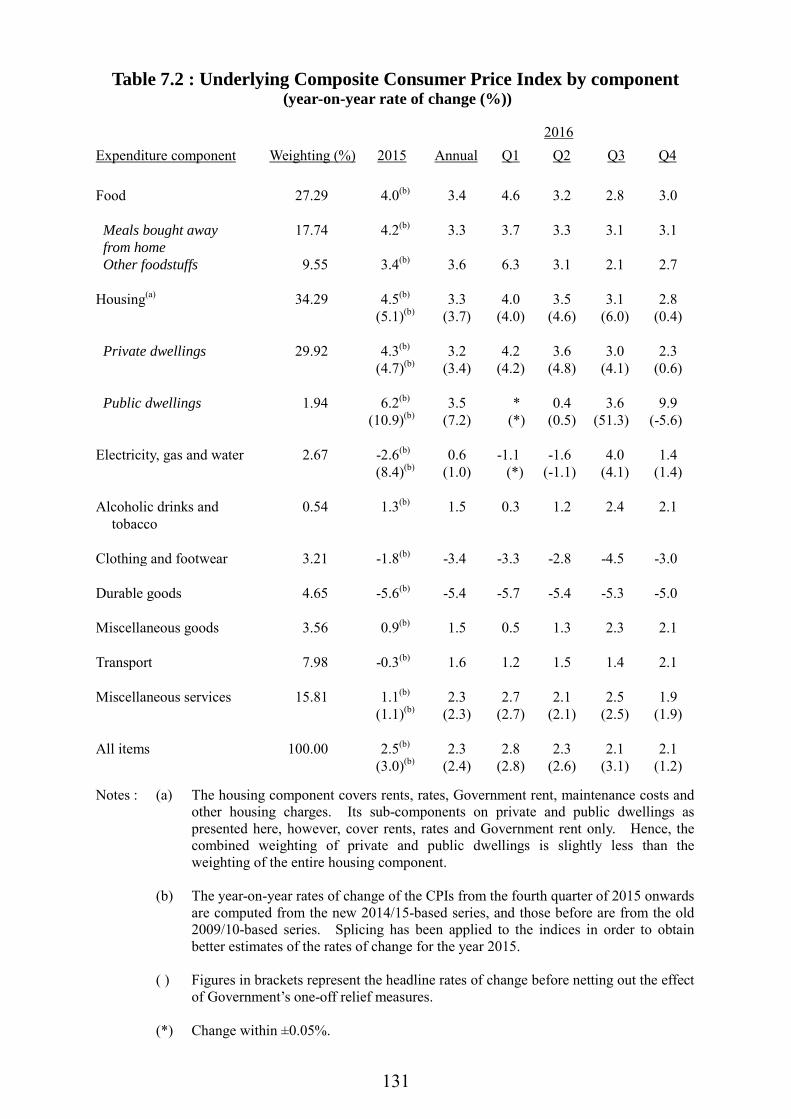
131
Table 7.2 : Underlying Composite Consumer Price Index by component (year-on-year rate of change (%))
2016 Expenditure component Weighting (%) 2015 Annual Q1 Q2 Q3 Q4 Food 27.29 4.0(b) 3.4 4.6 3.2 2.8 3.0 Meals bought away from home
17.74 4.2(b) 3.3 3.7 3.3 3.1 3.1
Other foodstuffs 9.55 3.4(b) 3.6 6.3 3.1 2.1 2.7 Housing(a) 34.29 4.5(b) 3.3 4.0 3.5 3.1 2.8 (5.1)(b) (3.7) (4.0) (4.6) (6.0) (0.4) Private dwellings 29.92 4.3(b) 3.2 4.2 3.6 3.0 2.3 (4.7)(b) (3.4) (4.2) (4.8) (4.1) (0.6) Public dwellings 1.94 6.2(b) 3.5 * 0.4 3.6 9.9
(10.9)(b) (7.2) (*) (0.5) (51.3) (-5.6) Electricity, gas and water 2.67 -2.6(b) 0.6 -1.1 -1.6 4.0 1.4 (8.4)(b) (1.0) (*) (-1.1) (4.1) (1.4) Alcoholic drinks and
tobacco 0.54 1.3(b) 1.5 0.3 1.2 2.4 2.1
Clothing and footwear 3.21 -1.8(b) -3.4 -3.3 -2.8 -4.5 -3.0 Durable goods 4.65 -5.6(b) -5.4 -5.7 -5.4 -5.3 -5.0 Miscellaneous goods 3.56 0.9(b) 1.5 0.5 1.3 2.3 2.1 Transport 7.98 -0.3(b) 1.6 1.2 1.5 1.4 2.1 Miscellaneous services 15.81 1.1(b) 2.3 2.7 2.1 2.5 1.9
(1.1)(b) (2.3) (2.7) (2.1) (2.5) (1.9)
All items 100.00 2.5(b) 2.3 2.8 2.3 2.1 2.1 (3.0)(b) (2.4) (2.8) (2.6) (3.1) (1.2)
Notes : (a) The housing component covers rents, rates, Government rent, maintenance costs and
other housing charges. Its sub-components on private and public dwellings as presented here, however, cover rents, rates and Government rent only. Hence, the combined weighting of private and public dwellings is slightly less than the weighting of the entire housing component.
(b) The year-on-year rates of change of the CPIs from the fourth quarter of 2015 onwards
are computed from the new 2014/15-based series, and those before are from the old 2009/10-based series. Splicing has been applied to the indices in order to obtain better estimates of the rates of change for the year 2015.
( ) Figures in brackets represent the headline rates of change before netting out the effect
of Government’s one-off relief measures. (*) Change within ±0.05%.
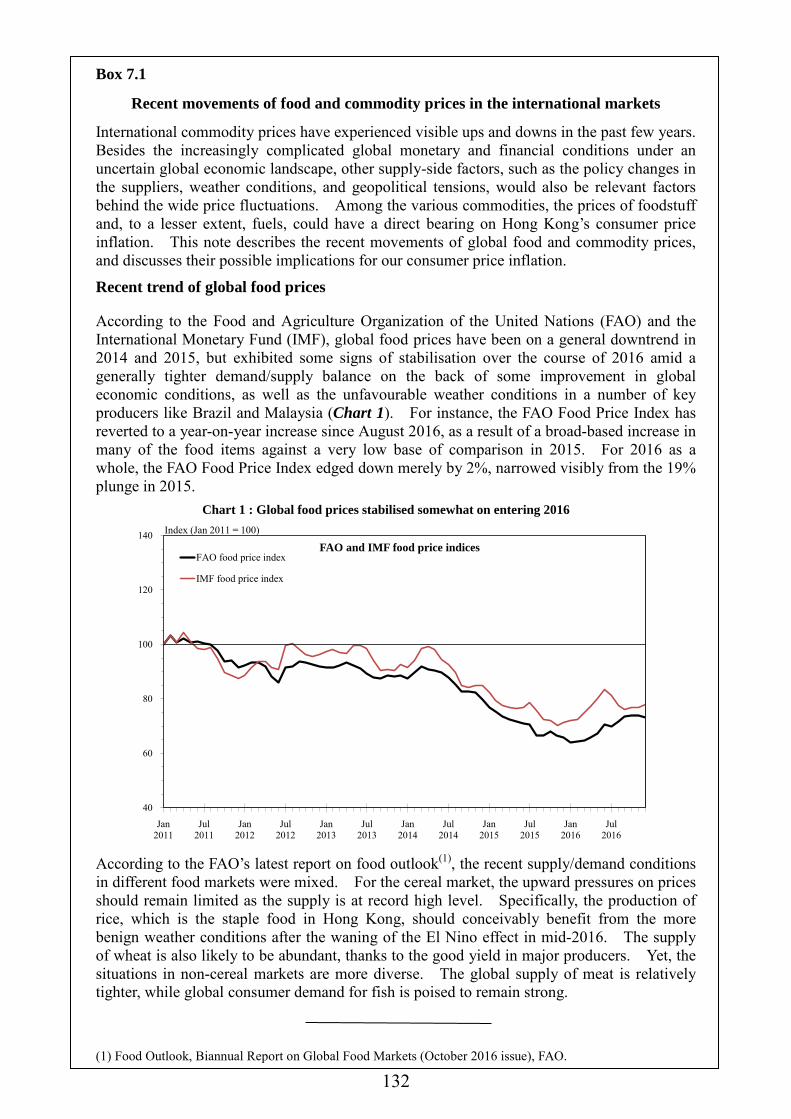
132
Box 7.1
Recent movements of food and commodity prices in the international markets
International commodity prices have experienced visible ups and downs in the past few years. Besides the increasingly complicated global monetary and financial conditions under an uncertain global economic landscape, other supply-side factors, such as the policy changes in the suppliers, weather conditions, and geopolitical tensions, would also be relevant factors behind the wide price fluctuations. Among the various commodities, the prices of foodstuff and, to a lesser extent, fuels, could have a direct bearing on Hong Kong’s consumer price inflation. This note describes the recent movements of global food and commodity prices, and discusses their possible implications for our consumer price inflation.
Recent trend of global food prices
According to the Food and Agriculture Organization of the United Nations (FAO) and the International Monetary Fund (IMF), global food prices have been on a general downtrend in 2014 and 2015, but exhibited some signs of stabilisation over the course of 2016 amid a generally tighter demand/supply balance on the back of some improvement in global economic conditions, as well as the unfavourable weather conditions in a number of key producers like Brazil and Malaysia (Chart 1). For instance, the FAO Food Price Index has reverted to a year-on-year increase since August 2016, as a result of a broad-based increase in many of the food items against a very low base of comparison in 2015. For 2016 as a whole, the FAO Food Price Index edged down merely by 2%, narrowed visibly from the 19% plunge in 2015.
According to the FAO’s latest report on food outlook(1), the recent supply/demand conditions in different food markets were mixed. For the cereal market, the upward pressures on prices should remain limited as the supply is at record high level. Specifically, the production of rice, which is the staple food in Hong Kong, should conceivably benefit from the more benign weather conditions after the waning of the El Nino effect in mid-2016. The supply of wheat is also likely to be abundant, thanks to the good yield in major producers. Yet, the situations in non-cereal markets are more diverse. The global supply of meat is relatively tighter, while global consumer demand for fish is poised to remain strong.
(1) Food Outlook, Biannual Report on Global Food Markets (October 2016 issue), FAO.
Jan2011
Jul2011
Jan2012
Jul2012
Jan2013
Jul2013
Jan2014
Jul2014
Jan2015
Jul2015
Jan2016
Jul2016
40
60
80
100
120
140FAO and IMF food price indices
FAO food price index
IMF food price index
Chart 1 : Global food prices stabilised somewhat on entering 2016Index (Jan 2011 = 100)
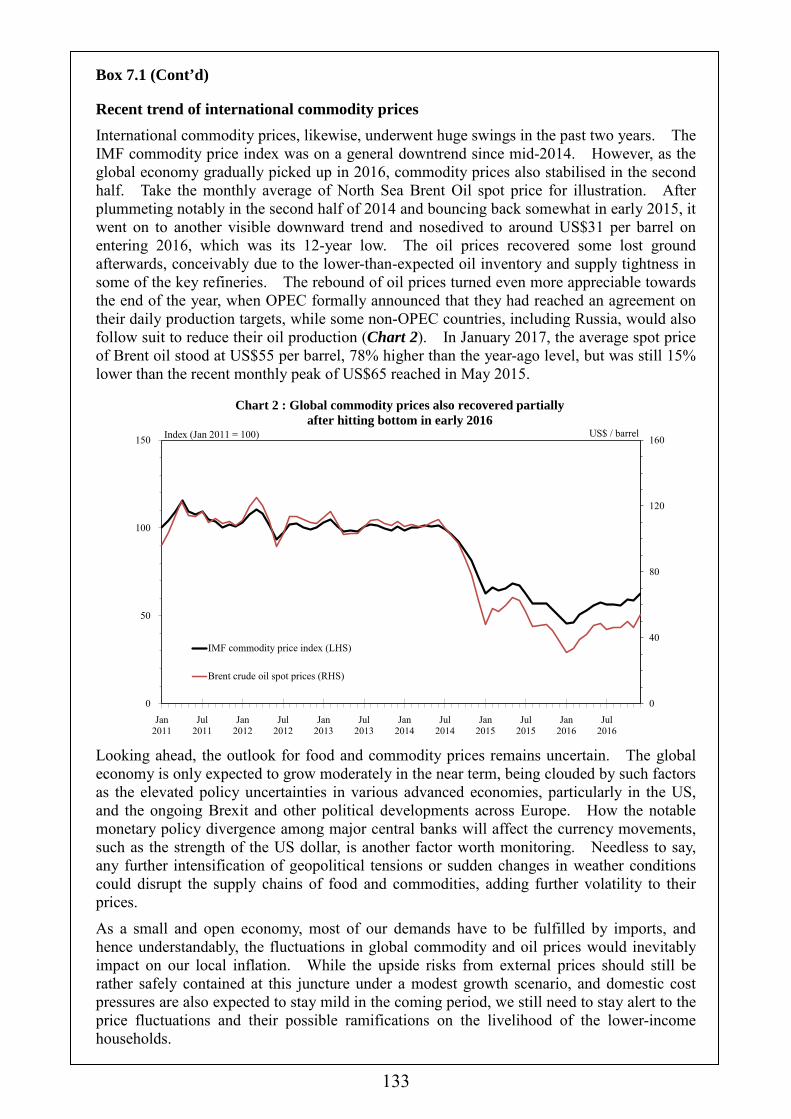
133
Box 7.1 (Cont’d)
Recent trend of international commodity prices International commodity prices, likewise, underwent huge swings in the past two years. The IMF commodity price index was on a general downtrend since mid-2014. However, as the global economy gradually picked up in 2016, commodity prices also stabilised in the second half. Take the monthly average of North Sea Brent Oil spot price for illustration. After plummeting notably in the second half of 2014 and bouncing back somewhat in early 2015, it went on to another visible downward trend and nosedived to around US$31 per barrel on entering 2016, which was its 12-year low. The oil prices recovered some lost ground afterwards, conceivably due to the lower-than-expected oil inventory and supply tightness in some of the key refineries. The rebound of oil prices turned even more appreciable towards the end of the year, when OPEC formally announced that they had reached an agreement on their daily production targets, while some non-OPEC countries, including Russia, would also follow suit to reduce their oil production (Chart 2). In January 2017, the average spot price of Brent oil stood at US$55 per barrel, 78% higher than the year-ago level, but was still 15% lower than the recent monthly peak of US$65 reached in May 2015.
Looking ahead, the outlook for food and commodity prices remains uncertain. The global economy is only expected to grow moderately in the near term, being clouded by such factors as the elevated policy uncertainties in various advanced economies, particularly in the US, and the ongoing Brexit and other political developments across Europe. How the notable monetary policy divergence among major central banks will affect the currency movements, such as the strength of the US dollar, is another factor worth monitoring. Needless to say, any further intensification of geopolitical tensions or sudden changes in weather conditions could disrupt the supply chains of food and commodities, adding further volatility to their prices.
As a small and open economy, most of our demands have to be fulfilled by imports, and hence understandably, the fluctuations in global commodity and oil prices would inevitably impact on our local inflation. While the upside risks from external prices should still be rather safely contained at this juncture under a modest growth scenario, and domestic cost pressures are also expected to stay mild in the coming period, we still need to stay alert to the price fluctuations and their possible ramifications on the livelihood of the lower-income households.
0
40
80
120
160
Jan2011
Jul2011
Jan2012
Jul2012
Jan2013
Jul2013
Jan2014
Jul2014
Jan2015
Jul2015
Jan2016
Jul2016
0
50
100
150
IMF commodity price index (LHS)
Brent crude oil spot prices (RHS)
Index (Jan 2011 = 100) US$ / barrel
Chart 2 : Global commodity prices also recovered partially after hitting bottom in early 2016

134
Costs of factor inputs and import prices
7.4 Domestic cost pressures were largely kept at bay in 2016, a natural consequence of a modestly-expanding local economy. On labour costs, wages and earnings posted steady growth in recent quarters in face of the broadly stable labour market conditions. Meanwhile, commercial rental costs only saw mild upward pressures, conceivably due to the less sanguine business sentiment amid the slowdown in inbound tourism and an uncertain external environment in 2016. The year-on-year increases in commercial rentals, when analysed on an eight-quarter moving-average basis, stayed on a moderating trend throughout the year.
Q12012
Q12013
Q12014
Q12015
Q12016
-5
0
5
10
15Overall import pricesImport prices of foodstuffsImport prices of capital goodsImport prices of consumer goodsImport prices of raw materials
Year-on-year rate of change (%)
and semi-manufactures
Diagram 7.5 : Local cost pressures moderated, while external price pressures remained tame
(a) Commercial rentals and labour cost (b) Import prices by selected end-use category
Q12012
Q12013
Q12014
Q12015
Q12016
-5
0
5
10
15
20
25Nominal wage indexOffice rental index (8-quarter moving average)Shop rental index (8-quarter moving average)
Year-on-year rate of change (%)

135
7.5 With the weaknesses in international food and commodity prices prevailing in most of the 2016, inflation in major import sources staying modest, and the US dollar strengthening against many major currencies, import price pressures were virtually absent throughout the year. Although overall import prices started to stabilise in the second half, it still declined by an average of 1.7% in 2016, widened from the 0.4% fall in 2015. The import price trends of individual end-use categories were broadly in line with the overall one, with most of them showing more visible pick-ups towards the end of the year. Yet, most of their annual averages were still lower than their respective levels in 2015. For 2016 as a whole, import prices of foodstuffs and fuels fell by 1.8% and 21.4% respectively. Import prices of capital goods and consumer goods also declined, by 2.6% and 0.7% respectively in 2016, while the import prices of raw materials and semi-manufactures held flat.
Table 7.3 : Prices of imports by end-use category (year-on-year rate of change (%))
Foodstuffs
Consumer
goods
Raw materials and
semi-manufactures
Fuels
Capital goods
All
2015 Annual 0.3 0.8 1.2 -34.8 -0.1 -0.4 H1 3.0 2.3 2.0 -32.0 1.1 0.7 H2 -2.2 -0.5 0.5 -38.0 -1.0 -1.4 Q1 4.6 2.0 2.0 -32.8 1.6 0.9 Q2 1.4 2.6 2.0 -31.2 0.6 0.6 Q3 -0.4 0.6 1.0 -39.2 -0.1 -0.7 Q4 -3.7 -1.6 * -37.2 -1.9 -2.1 2016 Annual -1.8 -0.7 * -21.4 -2.6 -1.7 H1 -2.9 -1.8 -0.9 -33.7 -2.8 -2.7 H2 -0.7 0.3 0.8 -6.7 -2.4 -0.7 Q1 -2.7 -1.4 -1.2 -39.2 -2.8 -2.8 Q2 -2.9 -2.1 -0.7 -28.5 -2.9 -2.6 Q3 -1.5 -0.5 0.8 -15.5 -3.0 -1.4 Q4 * 1.2 0.8 3.1 -1.8 -0.1 Note : (*) Change within ±0.05%.
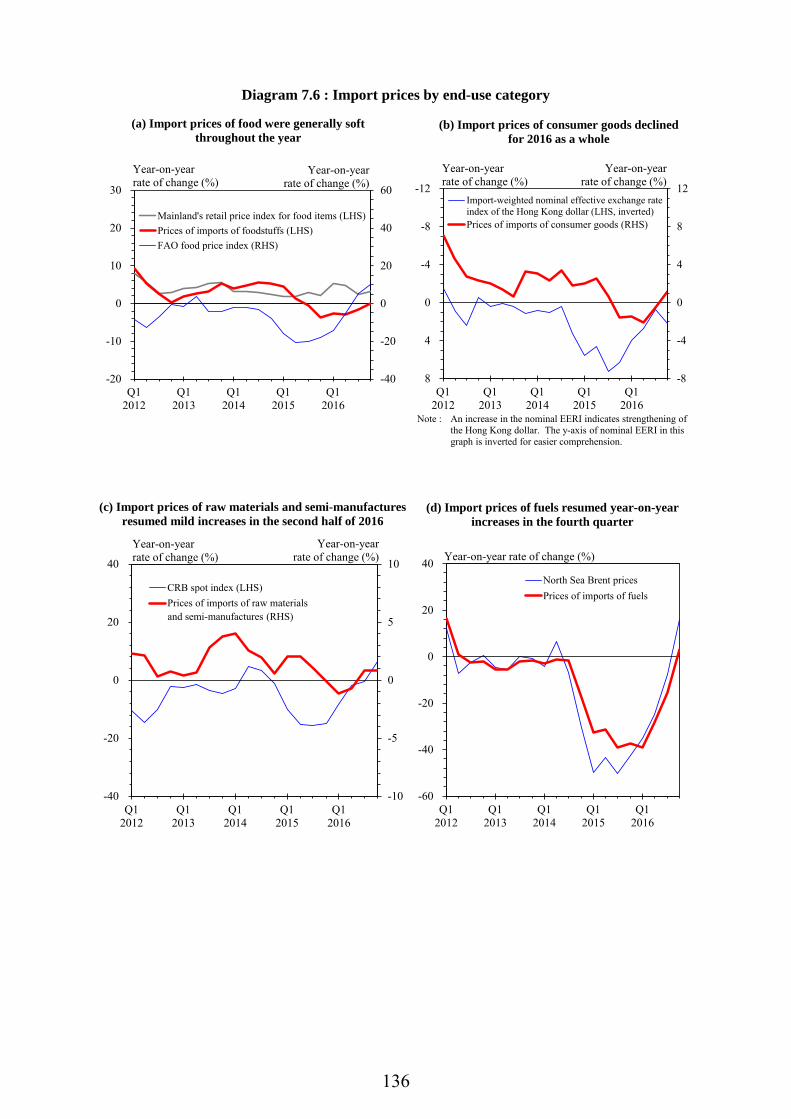
136
-8
-4
0
4
8
12
Q12012
Q12013
Q12014
Q12015
Q12016
-12
-8
-4
0
4
8
Import-weighted nominal effective exchange rateindex of the Hong Kong dollar (LHS, inverted)Prices of imports of consumer goods (RHS)
Year-on-year rate of change (%)
Year-on-year rate of change (%)
-40
-20
0
20
40
60
Q12012
Q12013
Q12014
Q12015
Q12016
-20
-10
0
10
20
30
Mainland's retail price index for food items (LHS)Prices of imports of foodstuffs (LHS)FAO food price index (RHS)
Year-on-yearrate of change (%)
Diagram 7.6 : Import prices by end-use category
Year-on-yearrate of change (%)
(a) Import prices of food were generally soft throughout the year
(b) Import prices of consumer goods declined for 2016 as a whole
An increase in the nominal EERI indicates strengthening of the Hong Kong dollar. The y-axis of nominal EERI in this graph is inverted for easier comprehension.
Note :
-10
-5
0
5
10
Q12012
Q12013
Q12014
Q12015
Q12016
-40
-20
0
20
40
CRB spot index (LHS)Prices of imports of raw materials
Year-on-year rate of change (%)
and semi-manufactures (RHS)
Year-on-year rate of change (%)
Q12012
Q12013
Q12014
Q12015
Q12016
-60
-40
-20
0
20
40North Sea Brent pricesPrices of imports of fuels
Year-on-year rate of change (%)
(c) Import prices of raw materials and semi-manufactures resumed mild increases in the second half of 2016
(d) Import prices of fuels resumed year-on-year increases in the fourth quarter

137
Output prices
7.6 Output prices, as measured by the Producer Price Indices(3), mostly stayed soft in the first three quarters of 2016. Specifically, while the year-on-year rise in output prices for the manufacturing sector picked up further in the third quarter of 2016, such increase was still rather moderate when taking the first three quarters of 2016 combined. Among the selected service sectors, the output prices for water and air transport in the first three quarters were visibly lower than a year ago amid the still-unsteady trading environment. The year-on-year increases in output prices for land transport and courier services remained modest. The output prices for accommodation services declined further in the first three quarters of 2016, reflecting the continued slowdown in inbound tourism with visitor arrivals declining during most of the year. Meanwhile, mirroring the keen competition in the sector, output prices for telecommunications continued the secular downtrend.
Table 7.4 : Producer Price Indices for the manufacturing sector and selected service sectors
(year-on-year rate of change (%))
2015
2016
Industry group
Annual Q1 Q2 Q3 Q4 Q1-Q3 Q1 Q2 Q3
Manufacturing
-2.7 -0.6 -2.8 -4.4 -3.2 0.5 -2.8 0.4 3.9
Selected service sectors(a)
Accommodation services
-3.6 -1.6 -5.4 -4.8 -2.6 -2.9 -4.7 -1.9 -2.2
Land transport
2.3 2.9 2.3 2.1 2.0 1.8 2.6 2.1 0.9
Water transport
-7.0 -0.2 -3.5 -10.4 -13.5 -14.1 -15.8 -14.8 -11.6
Air transport
-7.8 -3.4 -7.9 -9.2 -10.8 -11.3 -12.1 -10.9 -10.9
Telecommunications
-4.3 -3.9 -4.4 -4.7 -4.2 -3.1 -3.6 -3.1 -2.3
Courier services 4.5 4.2 4.8 4.7 4.3 2.3 1.8 2.3 2.8 Note : (a) Producer Price Indices for other service sectors are not available, due to the
difficulties involved in defining and delineating the various types of services and hence in measuring their respective price changes. This is particularly so for such sectors as banking and insurance, where the producers often do not charge their customers explicitly.

138
GDP deflator 7.7 As a broad measure of the overall change in prices in the economy, the increase in GDP deflator(4) receded along with that in underlying Composite CPI, decelerating from an annual average of 3.7% in 2015 to 1.8% in 2016. The terms of trade(5), after improving in the first half of 2016, relapsed to a mild deterioration in the second half given a more visible stabilisation in import prices relative to export prices. Taking out the external trade components, the increase in the domestic demand deflator likewise abated from 2.2% in 2015 to 1.6% in 2016.
Q12012
Q12013
Q12014
Q12015
Q12016
-4
-2
0
2
4
6
GDP deflatorDomestic demand deflator
Year-on-year rate of change (%)
(a) GDP deflator generally trended down over the course of 2016
Q12012
Q12013
Q12014
Q12015
Q12016
-4
-2
0
2
4
6
GDP deflatorTerms of trade in goods and services
Year-on-year rate of change (%)
Diagram 7.7 : GDP deflator
(b) Terms of trade registered mild deterioration in the second half of 2016

139
Table 7.5 : GDP deflator and the main expenditure component deflators (year-on-year rate of change (%))
2015 2016 Annual# Q1# Q2# Q3# Q4# Annual+ Q1# Q2# Q3# Q4+
Private consumption expenditure
1.2 1.9 1.2 0.6 1.0 1.7 1.1 1.6 2.1 2.0
Government consumption expenditure
4.3 4.7 4.3 4.5 4.0 3.8 3.8 3.9 3.9 3.8
Gross domestic fixed capital formation
4.5 4.7 4.6 5.6 3.6 0.2 -0.2 -0.7 -0.2 1.7
Total exports of goods&
-0.7 0.8 0.3 -1.2 -2.4 -1.4 -2.8 -2.3 -1.2 0.2
Imports of goods&
-1.4 0.1 -0.7 -2.1 -2.8 -1.8 -3.5 -2.8 -1.3 0.3
Exports of services&
-2.7 -1.3 -2.3 -4.2 -3.1 -2.5 -3.8 -2.8 -1.8 -1.7
Imports of services&
-4.7 -4.4 -3.8 -5.4 -5.1 -1.2 -3.3 -1.5 0.2 -0.3
Gross Domestic Product
3.7 4.3 <1.2>
4.3 <1.0>
3.4 <0.3>
2.8 <0.4>
1.8 2.1 <0.5>
1.9 <0.6>
1.5 <0.1>
1.6 <0.5>
Total final demand&
* 1.1 0.6 -0.5 -1.1 -0.5 -1.5 -1.1 -0.2 0.7
Domestic demand
2.2 2.7 2.2 2.1 1.9 1.6 1.1 1.3 1.9 2.1
Terms of trade in goods and services&
0.8 0.8 1.0 0.8 0.6 0.1 0.6 0.2 -0.1 -0.3
Notes : Figures are derived based on the series of chain volume measures of GDP. They are subject to revision later on as more data become available.
(&) Figures are compiled based on the change of ownership principle in recording goods
sent abroad for processing and merchanting under the standards stipulated in the System of National Accounts 2008.
(#) Revised figures. (+) Preliminary figures.
< > Seasonally adjusted quarter-to-quarter rate of change. (*) Change within ±0.05%.
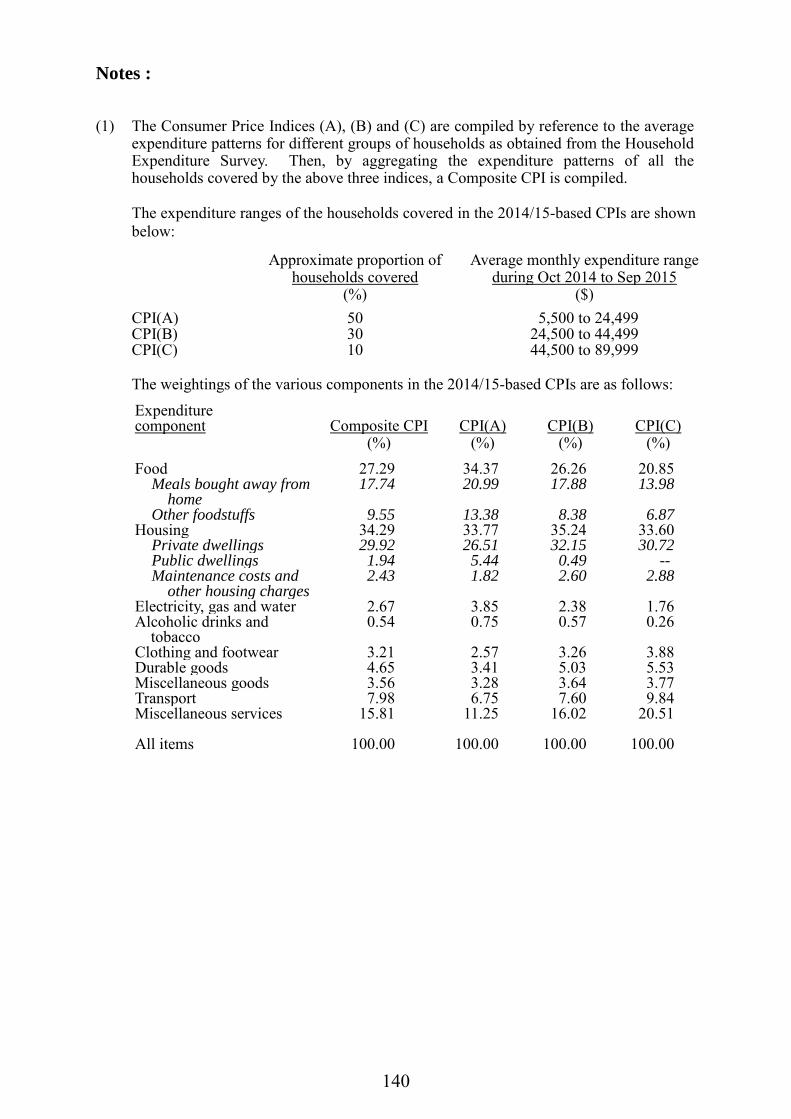
140
Notes : (1) The Consumer Price Indices (A), (B) and (C) are compiled by reference to the average
expenditure patterns for different groups of households as obtained from the Household Expenditure Survey. Then, by aggregating the expenditure patterns of all the households covered by the above three indices, a Composite CPI is compiled.
The expenditure ranges of the households covered in the 2014/15-based CPIs are shown
below:
Approximate proportion of households covered
Average monthly expenditure range during Oct 2014 to Sep 2015
(%) ($) CPI(A) 50 5,500 to 24,499 CPI(B) 30 24,500 to 44,499 CPI(C) 10 44,500 to 89,999
The weightings of the various components in the 2014/15-based CPIs are as follows:
Expenditure component
Composite CPI
CPI(A)
CPI(B)
CPI(C)
(%) (%) (%) (%) Food 27.29 34.37 26.26 20.85 Meals bought away from
home 17.74 20.99 17.88 13.98
Other foodstuffs 9.55 13.38 8.38 6.87 Housing 34.29 33.77 35.24 33.60 Private dwellings 29.92 26.51 32.15 30.72 Public dwellings 1.94 5.44 0.49 -- Maintenance costs and
other housing charges 2.43 1.82 2.60 2.88
Electricity, gas and water 2.67 3.85 2.38 1.76 Alcoholic drinks and
tobacco 0.54 0.75 0.57 0.26
Clothing and footwear 3.21 2.57 3.26 3.88 Durable goods 4.65 3.41 5.03 5.53 Miscellaneous goods 3.56 3.28 3.64 3.77 Transport 7.98 6.75 7.60 9.84 Miscellaneous services
15.81 11.25 16.02 20.51
All items 100.00 100.00 100.00 100.00
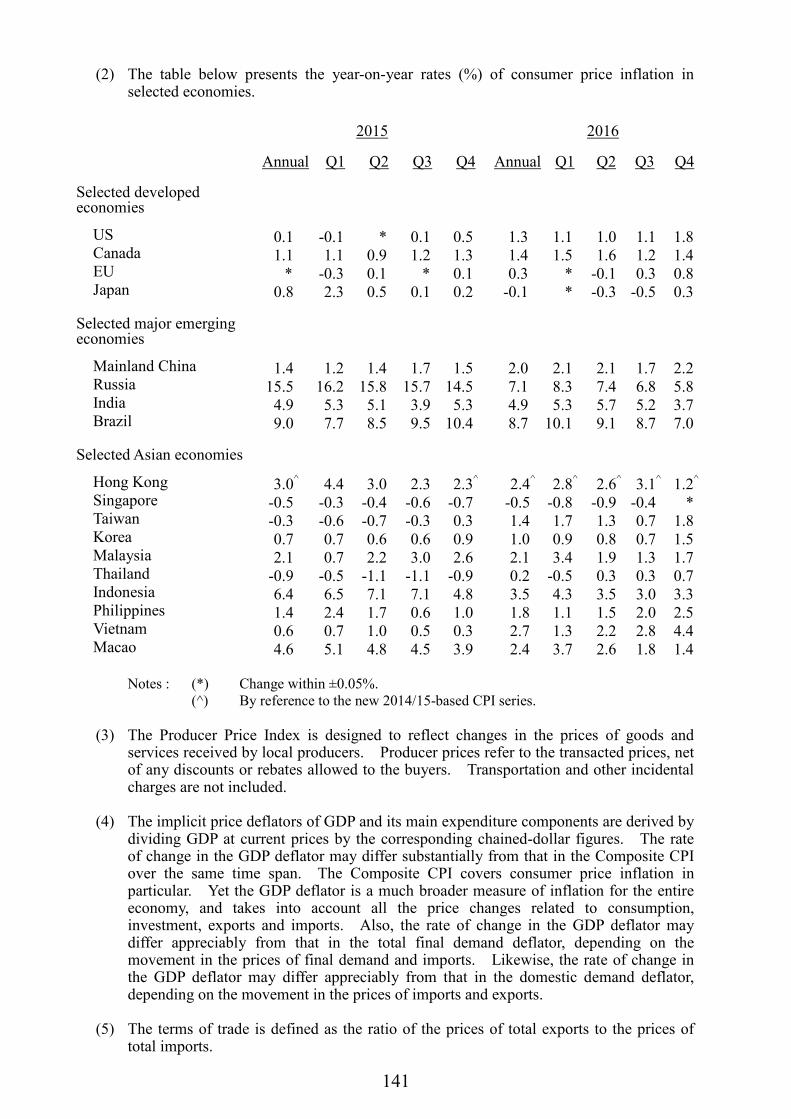
141
(2) The table below presents the year-on-year rates (%) of consumer price inflation in selected economies.
2015 2016
Annual Q1 Q2 Q3 Q4 Annual Q1 Q2 Q3 Q4
Selected developed economies
US 0.1 -0.1 * 0.1 0.5 1.3 1.1 1.0 1.1 1.8 Canada 1.1 1.1 0.9 1.2 1.3 1.4 1.5 1.6 1.2 1.4 EU * -0.3 0.1 * 0.1 0.3 * -0.1 0.3 0.8 Japan 0.8 2.3 0.5 0.1 0.2 -0.1 * -0.3 -0.5 0.3
Selected major emerging economies
Mainland China 1.4 1.2 1.4 1.7 1.5 2.0 2.1 2.1 1.7 2.2 Russia 15.5 16.2 15.8 15.7 14.5 7.1 8.3 7.4 6.8 5.8 India 4.9 5.3 5.1 3.9 5.3 4.9 5.3 5.7 5.2 3.7 Brazil 9.0 7.7 8.5 9.5 10.4 8.7 10.1 9.1 8.7 7.0
Selected Asian economies
Hong Kong 3.0^ 4.4 3.0 2.3 2.3^ 2.4^ 2.8^ 2.6^ 3.1^ 1.2^ Singapore -0.5 -0.3 -0.4 -0.6 -0.7 -0.5 -0.8 -0.9 -0.4 * Taiwan -0.3 -0.6 -0.7 -0.3 0.3 1.4 1.7 1.3 0.7 1.8 Korea 0.7 0.7 0.6 0.6 0.9 1.0 0.9 0.8 0.7 1.5 Malaysia 2.1 0.7 2.2 3.0 2.6 2.1 3.4 1.9 1.3 1.7 Thailand -0.9 -0.5 -1.1 -1.1 -0.9 0.2 -0.5 0.3 0.3 0.7 Indonesia 6.4 6.5 7.1 7.1 4.8 3.5 4.3 3.5 3.0 3.3 Philippines 1.4 2.4 1.7 0.6 1.0 1.8 1.1 1.5 2.0 2.5 Vietnam 0.6 0.7 1.0 0.5 0.3 2.7 1.3 2.2 2.8 4.4 Macao 4.6 5.1 4.8 4.5 3.9 2.4 3.7 2.6 1.8 1.4
Notes : (*) Change within ±0.05%. (^) By reference to the new 2014/15-based CPI series.
(3) The Producer Price Index is designed to reflect changes in the prices of goods and
services received by local producers. Producer prices refer to the transacted prices, net of any discounts or rebates allowed to the buyers. Transportation and other incidental charges are not included.
(4) The implicit price deflators of GDP and its main expenditure components are derived by
dividing GDP at current prices by the corresponding chained-dollar figures. The rate of change in the GDP deflator may differ substantially from that in the Composite CPI over the same time span. The Composite CPI covers consumer price inflation in particular. Yet the GDP deflator is a much broader measure of inflation for the entire economy, and takes into account all the price changes related to consumption, investment, exports and imports. Also, the rate of change in the GDP deflator may differ appreciably from that in the total final demand deflator, depending on the movement in the prices of final demand and imports. Likewise, the rate of change in the GDP deflator may differ appreciably from that in the domestic demand deflator, depending on the movement in the prices of imports and exports.
(5) The terms of trade is defined as the ratio of the prices of total exports to the prices of
total imports.
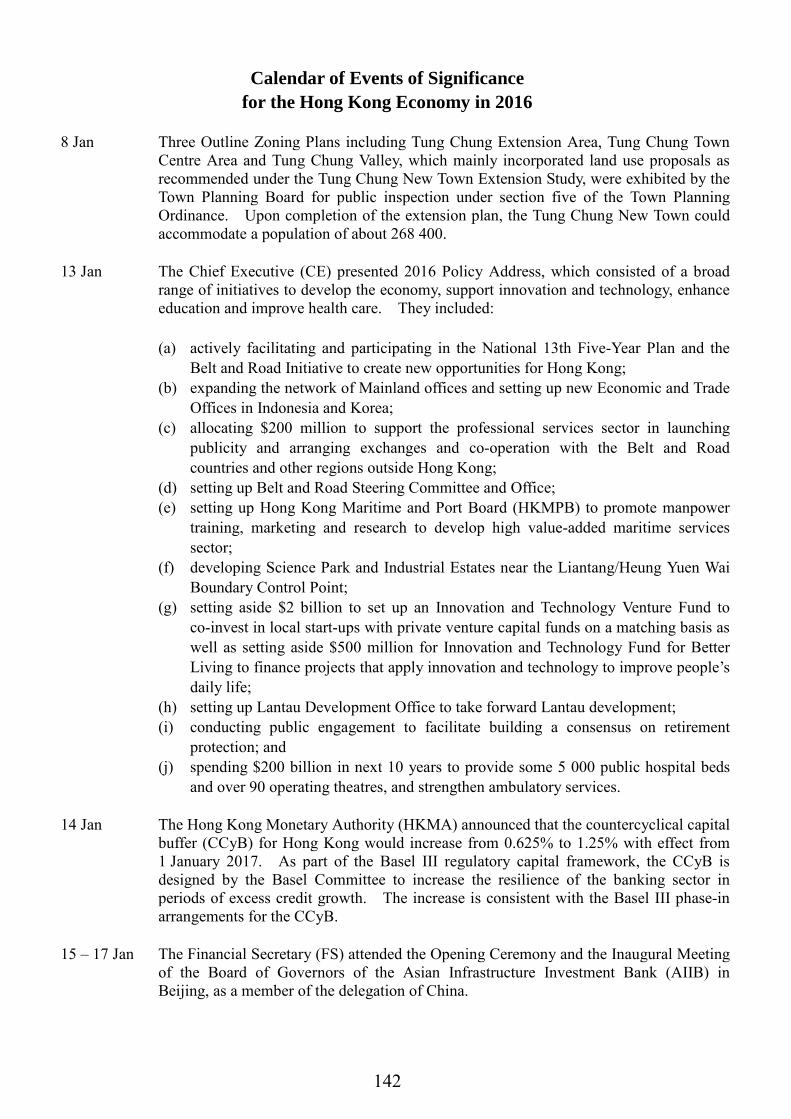
142
Calendar of Events of Significance for the Hong Kong Economy in 2016
8 Jan Three Outline Zoning Plans including Tung Chung Extension Area, Tung Chung Town
Centre Area and Tung Chung Valley, which mainly incorporated land use proposals as recommended under the Tung Chung New Town Extension Study, were exhibited by the Town Planning Board for public inspection under section five of the Town Planning Ordinance. Upon completion of the extension plan, the Tung Chung New Town could accommodate a population of about 268 400.
13 Jan The Chief Executive (CE) presented 2016 Policy Address, which consisted of a broad range of initiatives to develop the economy, support innovation and technology, enhance education and improve health care. They included: (a) actively facilitating and participating in the National 13th Five-Year Plan and the
Belt and Road Initiative to create new opportunities for Hong Kong; (b) expanding the network of Mainland offices and setting up new Economic and Trade
Offices in Indonesia and Korea; (c) allocating $200 million to support the professional services sector in launching
publicity and arranging exchanges and co-operation with the Belt and Road countries and other regions outside Hong Kong;
(d) setting up Belt and Road Steering Committee and Office; (e) setting up Hong Kong Maritime and Port Board (HKMPB) to promote manpower
training, marketing and research to develop high value-added maritime services sector;
(f) developing Science Park and Industrial Estates near the Liantang/Heung Yuen Wai Boundary Control Point;
(g) setting aside $2 billion to set up an Innovation and Technology Venture Fund to co-invest in local start-ups with private venture capital funds on a matching basis as well as setting aside $500 million for Innovation and Technology Fund for Better Living to finance projects that apply innovation and technology to improve people’s daily life;
(h) setting up Lantau Development Office to take forward Lantau development; (i) conducting public engagement to facilitate building a consensus on retirement
protection; and (j) spending $200 billion in next 10 years to provide some 5 000 public hospital beds
and over 90 operating theatres, and strengthen ambulatory services.
14 Jan The Hong Kong Monetary Authority (HKMA) announced that the countercyclical capital buffer (CCyB) for Hong Kong would increase from 0.625% to 1.25% with effect from 1 January 2017. As part of the Basel III regulatory capital framework, the CCyB is designed by the Basel Committee to increase the resilience of the banking sector in periods of excess credit growth. The increase is consistent with the Basel III phase-in arrangements for the CCyB.
15 – 17 Jan The Financial Secretary (FS) attended the Opening Ceremony and the Inaugural Meeting of the Board of Governors of the Asian Infrastructure Investment Bank (AIIB) in Beijing, as a member of the delegation of China.
143
18 Jan The Hong Kong Special Administrative Region (HKSAR) Government and the Government of Russian Federation signed an Agreement for the Avoidance of Double Taxation and the Prevention of Fiscal Evasion with respect to Taxes on Income. The agreement sets out clearly the allocation of taxing rights between the two jurisdictions and thus will help investors better assess their potential tax liabilities from cross-border economic activities.
18 – 19 Jan The Government and the Hong Kong Trade Development Council (HKTDC) co-organised the ninth Asian Financial Forum, with the theme “Asia: Shaping the New Paradigm for Growth”, providing a high-level platform for more than 2 800 members of the global financial community to tap the investment opportunities of the evolving Asian and global economies.
31 Jan The Development Bureau launched a three-month public engagement on the proposed development strategies of Lantau covering aspects of planning, conservation, economic and social development, recreation and tourism.
2 Feb The Heritage Foundation and the Wall Street Journal released the 2016 Index of Economic Freedom. Hong Kong was rated the freest economy in the world for the 22nd consecutive year.
2 – 4 Feb CE visited Mumbai and New Delhi, India to foster closer bilateral economic and trade relations.
5 Feb Six pieces of subsidiary legislation were gazetted to implement the second stage of the over-the-counter derivatives regulatory regime, including the introduction of mandatory clearing of dealer-to-dealer trades of certain interest rate swaps (commenced on 1 September 2016) and the expansion of mandatory reporting to cover all five main asset classes (to commence on 1 July 2017).
15 Feb Hong Kong International Airport (HKIA) was named “Airport of the Year” by Air Transport World.
24 Feb FS delivered the Budget for the financial year 2016-17 and announced a host of initiatives to consolidate Hong Kong’s strengths and seize development opportunities under the global “new economic order”, including:
On nurturing innovation, the Budget proposed allocating additional resources to promote research and development (R&D) and application of technology, in order to develop Hong Kong into a smart city, boost economic development and enhance the quality of life. The Government would also encourage financial institutions and professionals from around the world to drive the development and application of Fintech in Hong Kong; improve the ecosystem for start-ups; and support the growth of creative industries. To seize the opportunities brought by the Proposal on Formulating the National 13th Five-Year Plan as well as the Belt and Road Initiative, the Government is committed to developing more markets for Hong Kong enterprises, and pursuing trade and investment agreements to create more favourable conditions for the business community. On financial services, the Budget proposed continuing to explore with the Mainland authorities ways to open up more channels for two-way cross-boundary Renminbi (RMB) fund flow, and encouraging the financial sector to develop green financial products. Fostering talent and increasing land resources are important for Hong Kong to stay
144
competitive under the “new economic order”. Apart from ongoing efforts to enhance the quality of education, the Government would also offer more internship and exchange opportunities to students and encourage the workforce to pursue continuing education. Substantial resources continued to be allocated for education, social welfare, healthcare services and other aspects in the Budget. Relevant initiatives were also announced, including allocating funds to implement Low-income Working Family Allowance Scheme, providing more subsidised residential care places for the elderly, and to explore extending Reverse Mortgage Programme to cover subsidised sale flats with unpaid premium. The Government would also continue to increase land supply to meet Hong Kong’s needs in terms of housing, economic and social development for maintaining our long-term competitiveness. Maintaining healthy public finances is of utmost significance to Hong Kong. The Government would continue to adopt measures to contain expenditure, preserve our revenue base and manage fiscal reserves. The Future Fund was also established to achieve greater returns by way of long-term investment. In addition, FS also proposed a series of relief measures, including: (a) reducing salaries tax, tax under personal assessment and profits tax for Year of
Assessment 2015-16 by 75%, subject to a ceiling of $20,000 per case; (b) waiving rates for four quarters of 2016-17, subject to a ceiling of $1,000 per quarter
for each rateable property; and (c) from Year of Assessment 2016-17 onwards, increasing the basic allowance and
single parent allowance from $120,000 to $132,000; the married person’s allowance from $240,000 to $264,000; the dependent parent/grandparent allowance and the additional dependent parent/grandparent allowance for each eligible parent/grandparent from $40,000 to $46,000 (for aged 60 or above) and from $20,000 to $23,000 (for aged 55 or above but below 60); and the deduction ceiling for elderly residential care expenses for each eligible parent/grandparent from $80,000 to $92,000.
The 2015 Economic Background and 2016 Prospects were published along with the 2016-17 Budget. Hong Kong’s real Gross Domestic Product (GDP) growth in 2016 was forecast to be 1-2%, while the underlying and headline Composite Consumer Price Index (CCPI) inflation rates were forecast to average 2% and 2.3% respectively.
25 Feb The Government announced the 2016-17 Land Sale Programme (LSP). The LSP included 29 residential sites (with an aggregate capacity to produce about 19 200 flats), eight commercial/business sites and three hotel sites.
29 Feb The Chief Secretary for Administration (CS) and the Mayor of Shenzhen Municipal Government co-chaired the Hong Kong/Shenzhen Co-operation Meeting in Hong Kong. At the meeting, both sides reviewed the achievements made in the past year and set out the direction for co-operation for the coming year in key areas including innovation and technology, creative industries, financial services, professional services and youth co-operation.
The Hong Kong Housing Authority (HA) and the Hong Kong Housing Society (HKHS) launched a joint application exercise for the pre-sale of the HA’s 2 657 new Home Ownership Scheme flats located in Ka Shun Court, Sha Tin and Ping Yan Court, Ping
145
Shan, Yuen Long, and HKHS’s 1 020 subsidised sale flats located in Greenhill Villa, Sha Tin, and seven rescinded subsidised sale flats in Greenview Villa, Tsing Yi. Some 52 800 applications were received and all flats were sold by the end of October 2016.
The Development Bureau, the Authority of Qianhai Shenzhen-Hong Kong Modern Service Industry Co-operation Zone and the Housing and Construction Bureau of Shenzhen Municipal Government signed and promulgated the Co-operation Arrangement for Trial Implementation of Hong Kong Construction Model in Qianhai Shenzhen-Hong Kong Modern Service Industry Co-operation Zone of Shenzhen, which included allowing Hong Kong’s firms and professionals in the construction sector to provide professional services for construction projects in Qianhai wholly or principally funded by Hong Kong businesses.
13 Mar The territory-wide Electronic Health Record Sharing System was launched. The new system provides an essential infrastructure for access and sharing of participating patients’ health data by authorised healthcare providers in the public and private sectors with patients’ consent. The objective is to enhance continuity of care, promote public/private sector collaboration and improve quality of healthcare delivery.
16 Mar The Immigration Department was awarded the Skytrax Award for Best Airport Immigration Service two years in a row, based on over 13 million survey questionnaires from air passengers, covering 550 airports worldwide.
17 Mar The National 13th Five-Year Plan was officially promulgated. A chapter is again dedicated to Hong Kong and Macao (the Dedicated Chapter), which acknowledges the significant functions and positioning of Hong Kong in the overall development of the country, as well as the scope and opportunities for development in a number of key areas. The Dedicated Chapter expresses support for Hong Kong and Macao in enhancing economic competitiveness, including supporting Hong Kong in consolidating and enhancing its status as an international financial, transportation and trade centre, strengthening its status as a global offshore RMB business hub and an international asset management centre, and promoting such areas as financing services, business and commerce, logistics and professional services towards high-end and high value-added developments. The Dedicated Chapter also expresses support for Hong Kong in developing innovation and technology industry, nurturing emerging industries as well as establishing itself as a centre for international legal and dispute resolution services in the Asia-Pacific region. The Dedicated Chapter emphasises deepening co-operation between the Mainland and Hong Kong/Macao, supporting Hong Kong in participating in the country’s two-way opening up and in the Belt and Road Initiative.
23 Mar CS and the Vice-Governor of Guangdong Province co-chaired the 21st Working Meeting of the Hong Kong/Guangdong Co-operation Joint Conference in Hong Kong. The meeting decided to implement the 2016 Work Plan of the Framework Agreement on Hong Kong/Guangdong Co-operation which covers 92 co-operation items on various areas, including the Belt and Road Initiative, liberalisation of trade in services, innovation and technology, financial services, youth, education, professional services and environmental protection.
23 – 24 Mar CE attended the Boao Forum for Asia Annual Conference 2016 in Hainan.
24 Mar The Government gazetted the Deposit Protection Scheme (Amendment) Ordinance 2016. With the commencement of this amendment ordinance on the same day, a gross payout approach is adopted for the determination of compensation under the Deposit Protection Scheme in case the scheme is triggered. Under this approach, any compensation paid to

146
depositors is determined on the basis of their aggregate protected deposits held with a failed bank without deducting the amount of liabilities owed by those depositors to the same bank.
30 Mar
The Government announced the extension of the concessionary scheme to encourage the development of data centres by conversion of existing industrial buildings and lease modification of industrial lots.
31 Mar Midfield Concourse at the HKIA commenced full operation, increasing HKIA’s passenger handling capacity by 10 million a year.
1 Apr The Government established the HKMPB for closer co-operation between the Government and the industry to set the direction for development of Hong Kong’s port and maritime services and to enhance Hong Kong’s status as an international maritime centre.
11 – 23 Apr The two-week “International IT Fest 2016” was staged in Hong Kong, featuring 43 events to showcase Hong Kong’s achievements in information and communications technology (ICT). Within it, the inaugural Internet Economy Summit brought together renowned ICT experts and leaders from around the world to explore future development and opportunities of the internet economy.
13 Apr The HKSAR Government and the Government of the Republic of Latvia signed an Agreement for the Avoidance of Double Taxation and the Prevention of Fiscal Evasion with respect to Taxes on Income.
15 Apr CS and the Vice-Governor of Fujian Province co-chaired the Second Hong Kong/Fujian Co-operation Conference in Hong Kong. Both sides agreed to further enhance co-operation in economic and trade, finance, innovation and technology, youth exchange, as well as exchanges on cultural and creative industries.
17 Apr CE visited Huizhou and Shenzhen to learn more about the achievements by Hong Kong industrialists in developing the innovation and technology industry in the Mainland.
25 Apr The European Commission published its 18th annual report on Hong Kong, which continued to affirm the co-operation between the European Union (EU) and Hong Kong in areas including trade, investment, and dialogue on issues of mutual interest, and recognise Hong Kong’s strategic importance as a trading and investment partner for the EU.
26 Apr CE in Council approved the Chek Lap Kok Outline Zoning Plan for the development of the new third runway project of the HKIA.
3 May The Low-income Working Family Allowance Scheme was open for application. The Scheme aims to encourage self-reliance and ease inter-generational poverty.
Hong Kong and Mexico commenced negotiations on an Investment Promotion and Protection Agreement.
12 May The Chief Executive Officer of the Securities and Futures Commission of Hong Kong (SFC) became the Chair of the Board of the International Organization of Securities Commissions.

147
13 May The Government released the preliminary GDP figures for the first quarter of 2016. The Hong Kong economy grew meagrely by 0.8% in real terms over a year earlier. The external environment deteriorated during the quarter, leading to a deeper setback in both goods and services trade. In the May review of the economic forecast for 2016, the forecast growth rate in real terms of GDP was maintained at 1-2%. The forecast rates of underlying and headline CCPI inflation were maintained at 2% and 2.3% respectively.
18 May The Government and the HKTDC organised the inaugural Belt and Road Summit, successfully bringing together more than 2 400 government and business leaders from the Mainland, Belt and Road countries and other regions to explore opportunities under the Belt and Road Initiative.
Hong Kong and Indonesia signed a Memorandum of Understanding (MoU), pledging mutual co-operation on investment promotion exchanges and best practices.
19 May Hong Kong’s first self-sustained sludge treatment facility, T·PARK, came into full operation. This facility combines a variety of advanced technologies into a single complex, bringing together sludge incinerators with a treatment capacity of up to 2 000 tonnes of sludge per day, as well as power generation, sea water desalination, educational and ecological facilities.
24 May Hong Kong and Austria signed a MoU to strengthen the co-operation between technology start-ups, incubators, early-stage investors like business angels and venture capital funds, start-up promotion agencies and spin-off centres of both places. They also agreed to collaborate in exchange of expertise and knowledge of the local markets.
31 May Hong Kong was ranked the world’s most competitive economy by the Institute for Management Development World Competitiveness Yearbook 2016, up from the second place last year, and continued to be ranked first globally in government efficiency and business efficiency. The ranking in economic performance climbed four places from ninth to fifth.
1 Jun The liberalisation measures of the Agreement on Trade in Services under the Closer Economic Partnership Arrangement (CEPA) framework were implemented. Under the agreement, there are 153 sectors which the Mainland would fully or partially open up to Hong Kong services industry, accounting for 95.6% of all the 160 services trade sectors. The agreement, marking a new milestone, basically achieves liberalisation of trade in services between the Mainland and Hong Kong.
2 Jun
The Legislative Council enacted the Patents (Amendment) Ordinance 2016 which provides for the legal framework for establishing an “original grant” patent system in Hong Kong in its bid to develop into a regional innovation and technology hub.
3 Jun The Government gazetted the Inland Revenue (Amendment) (No. 2) Ordinance 2016. This amendment ordinance enables, under specified conditions, the deduction of interest payable on money borrowed by a corporation carrying on in Hong Kong an intra-group financing business. It further set a concessionary profits tax rate at 8.25% for qualifying corporate treasury centres, and also clarifies profits tax and stamp duty treatments in respect of regulatory capital securities issued by banks to comply with the Basel III capital adequacy requirements.
148
The Companies (Winding Up and Miscellaneous Provisions) (Amendment) Ordinance 2016 was gazetted. This amendment ordinance seeks to improve and modernise Hong Kong’s corporate winding-up regime by providing measures to increase protection of creditors as well as to streamline and further enhance the integrity of the winding-up process. This will help enhance Hong Kong’s business environment.
6 Jun Diamond Hill Station extension of the Shatin to Central Link was topped-out.
7 Jun The Massachusetts Institute of Technology launched the first overseas Innovation Node in Hong Kong.
7 – 10 Jun CE conducted a visit to France and met with political and business leaders there.
10 Jun The Securities and Futures (Amendment) Ordinance 2016 was gazetted. It provides a legal framework for a new fund structure, which is open-ended fund company structure, in Hong Kong.
13 Jun Hong Kong and Shanghai signed an agreement to further co-operation on various fronts including financial markets, institutions, operation and products, talents, regulation, and financial technologies.
16 Jun The Government announced the subscription and allocation results of the sixth inflation-linked retail bond, or iBond, under the retail part of the Government Bond Programme. A total of 507 978 valid applications were received for a total of $22.5 billion in principal amount of bonds. The final issue amount was $10 billion with a tenor of three years.
17 Jun HKIA received the “Top Asian Airport Efficiency Excellence Award” from the Air Transport Research Society.
20 Jun Hong Kong indicated to the Organisation for Economic Co-operation and Development (OECD) its commitment to the package of measures to tackle “base erosion and profit shifting” (BEPS) and its consistent implementation, and joined the inclusive framework set up by OECD for implementing the BEPS package.
21 Jun The six-month “Retirement Protection Forging Ahead” public engagement exercise ended.
22 Jun Hong Kong continued to rank the world’s second largest recipient of foreign direct investment flows in 2015, according to the World Investment Report 2016 released by the United Nations Conference on Trade and Development.
24 Jun HKIA was crowned the “Best Global Airport” at the 2016 Asian Freight, Logistics and Supply Chain Awards by Asia Cargo News.
24 – 26 Jun FS attended the First Annual Meeting of the Board of Governors of AIIB in Beijing, as a member of the delegation of China.
28 Jun The Finance Committee of the Legislative Council approved the 2016-17 Civil Service Pay Adjustment. The adjustment rates ranged from 4.19% to 4.68%, and took retrospective effect from 1 April 2016.

149
29 Jun The Ministry of Finance of the People’s Republic of China announced the issuance in Hong Kong to institutional investors of a total of RMB14 billion RMB Sovereign Bonds of the Central People’s Government with tenors ranging from 3 to 20 years.
30 Jun The Government published in the gazette the Financial Institutions (Resolution) Ordinance which establishes a cross-sector resolution regime in Hong Kong. The regime is in compliance with the prevailing international standards and seeks to mitigate the risks posed by the non-viability of systemically important financial institutions to the stability and effective working of the financial system of Hong Kong.
The Inland Revenue (Amendment) (No. 3) Ordinance 2016 came into effect. The ordinance put in place a legal framework for the implementation of the international standard for automatic exchange of financial account information in tax matters (AEOI) in Hong Kong.
4 Jul
The HKMA launched the Infrastructure Financing Facilitation Office (IFFO) to promote the development of Hong Kong as an infrastructure financing hub.
The International Finance Corporation (IFC), a member of the World Bank Group, and the HKMA, signed a MoU to establish a strategic framework of co-operation with a view to strengthening the ability of investors, banks and the financial sector to facilitate investment in infrastructure projects in Asia.
The Global Infrastructure Hub and the HKMA signed a MoU with respect to establishing a strategic framework of co-operation to facilitate the financing of infrastructure projects.
15 Jul FS led a HKSAR Government delegation to attend the Ninth Hong Kong Macao Co-operation High Level Meeting in Macao. The two sides reviewed the progress of co-operation work and achievements made in the past year, as well as discussed and decided on the directions of co-operation for the coming year. Hong Kong and Macao also initialled the draft main text of a free trade agreement (FTA), namely Hong Kong and Macao Closer Economic Partnership Arrangement (HK-Macao CEPA).
1 Aug The Government established the Belt and Road Office, to capitalise on the opportunities brought to Hong Kong by the Belt and Road Initiative and to liaise with government departments and various sectors of the community.
The Airport Authority (AA) commenced construction works for the three-runway system at the HKIA.
10 Aug The Government announced the subscription and allocation results of the first Silver Bond under the retail part of the Government Bond Programme. The Silver Bond targets Hong Kong residents aged 65 or above. A total of about 76 000 valid applications were received for a total of $8.9 billion in principal amount of bonds. The final issue amount was $3 billion with a tenor of three years.
12 Aug The Government released the preliminary GDP figures for the second quarter of 2016. The Hong Kong economy grew modestly by 1.7% year-on-year in real terms, largely underpinned by a pick-up in goods exports. In the August update of the economic forecast for 2016, the forecast growth rate in real terms of GDP was maintained at 1-2%. The rates of underlying and headline CCPI inflation for 2016 were forecast at 2.2% and 2.3% respectively.
150
25 Aug The 11th Pan-Pearl River Delta Regional Co-operation and Development Forum and Trade Fair (PPRD Forum) was held in Guangzhou, Guangdong Province. The Secretary for Commerce and Economic Development attended the PPRD Forum on behalf of the HKSAR Government.
The HKMA granted the first batch of five licences to the stored value facilities (SVF) issuers under the Payment Systems and Stored Value Facilities Ordinance.
2 – 6 Sep FS attended the Business 20 Summit, as well as the Group of Twenty Leaders’ Summit in Hangzhou, as a member of the delegation of China.
5 Sep The Government announced the Hung Shui Kiu New Development Area (NDA) Revised Recommended Outline Development Plan prepared under the Hung Shui Kiu New Development Area Planning and Engineering Study, proposing the development of the NDA as the “Regional Economic and Civic Hub” which will accommodate a population of 218 000 and provide about 150 000 new employment opportunities.
6 Sep
The Treasury Markets Summit 2016, jointly organised by the HKMA and the Treasury Markets Association, was held in Hong Kong. The Summit’s panels focused on various facets of Hong Kong’s financial and treasury markets, including how to sharpen Hong Kong’s unique edge in the Belt and Road Initiative, the new normal of treasury markets, and the opportunities and challenges brought about by Fintech to treasury operations.
The HKMA launched a Fintech Supervisory Sandbox to facilitate the pilot trials of Fintech and other technology initiatives of authorised institutions before they are launched on a fuller scale.
The Investment Promotion and Protection Agreement between Hong Kong and Canada entered into force. The agreement will give additional assurance to investors, facilitate investment flows between Hong Kong and Canada, and further strengthen the economic and trade ties between both places.
12 and 28 Sep
Hong Kong commenced FTA negotiations with Georgia and Maldives respectively. Entering into FTAs with Georgia, which is on the “land route”, and Maldives, which is on the “maritime route”, will help expand Hong Kong’s FTA network in regions along the Belt and Road.
13 Sep The Government commenced a consultancy study to formulate a blueprint for developing Hong Kong into a smart city. A dedicated portal (www.smartcity.gov.hk) was set up in November 2016 to collect ideas on smart city development from the industry, stakeholders and the public.
13 – 17 Sep FS led a business mission to Kazakhstan to strengthen business and economic ties between Hong Kong and economies along the Belt and Road.
14 Sep CE and the Governor of Guangdong Province co-chaired the 19th Plenary of the Hong Kong/Guangdong Co-operation Joint Conference in Guangzhou. At the meeting, the two sides reviewed the progress of Hong Kong/Guangdong co-operation over the past year and set the direction for co-operation for the coming year in areas including the Belt and Road Initiative, environmental protection, financial services, professional services, co-operation in key regions, education and tourism.
151
15 Sep Hong Kong remained the freest economy in the world, according to the 2016 Annual Report on the Economic Freedom of the World jointly released by the Fraser Institute of Canada and the CATO Institute of the US.
29 Sep HKIA was named Payload Asia’s “Asia Pacific Airport of the Year – Industry Choice” Award for the third consecutive year.
5 – 18 Oct FS attended the Annual Meetings of the International Monetary Fund (IMF) and the World Bank Group in Washington, DC, as a member of the delegation of China. FS also represented Hong Kong to attend the Asia-Pacific Economic Co-operation Finance Ministers’ Meeting in Lima, Peru and visited San Francisco and New York, the US and the Hague, the Netherlands to strengthen bilateral economic and trade ties between Hong Kong and these places.
13 Oct The Hong Kong Mortgage Corporation Limited extended the Reverse Mortgage Programme to HA and HKHS’s subsidised sale flats with premium not yet paid, in order to enable more eligible elderly owners to improve their quality of life via the programme.
13 – 14 Oct CE attended the 2016 Pan-Pearl River Delta Regional Co-operation Chief Executive Joint Conference in Jiangxi.
14 Oct The Mandatory Provident Fund Schemes (Amendment) Ordinance 2016 (Commencement) Notice was gazetted to specify that the Mandatory Provident Fund Default Investment Strategy (DIS) would commence operation on 1 April 2017. The DIS is a highly standardised, fee-controlled investment strategy designed to be consistent with the objective of building up long-term retirement savings for scheme members. The fee control mechanism consists of two caps, namely a fee cap of 0.75% and an out-of-pocket expenses cap of 0.2%, both calculated as a percentage of the net asset value of the constituent funds under the DIS.
15 Oct The Commission on Poverty announced at the Poverty Summit the updated poverty line and poverty situation in Hong Kong in 2015. In 2015, on the back of moderate economic growth, the poverty line thresholds were raised along with the increase in household incomes. Compared with 2014, the poverty rate after recurrent cash policy intervention remained at 14.3% in 2015, with the size of the poor population up slightly to 0.97 million, staying below one million for the third consecutive year.
17 Oct The AA announced its plan for SKYCITY, a major integrated retail, dining and entertainment development situated in the Airport North Commercial District.
20 Oct The HA launched the pre-sale of Green Form Subsidised Home Ownership Pilot Scheme project in San Po Kong. About 16 200 applications were received. The project provides a total of 857 flats which are expected to be ready for occupation in mid-2017.
23 Oct Kwun Tong Line Extension was commissioned. The passenger service of the Kwun Tong Line was extended to Ho Man Tin and Whampoa.
26 Oct The World Bank released Doing Business Report 2017. Hong Kong’s ranking in ease of doing business rose one place to the fourth position.
The Government announced that Hong Kong had signed agreements with Japan and the United Kingdom with a view to commencing AEOI with these two tax jurisdictions in 2018, and that it would seek to expand Hong Kong’s AEOI network with its tax treaty
152
partners.
26 – 28 Oct IFFO hosted its first executive workshop co-organised with IFC and Eastspring Investments at the HKMA, with the theme of “Private Participation in Infrastructure Project Finance in Emerging Markets”, to kick off IFFO’s capacity building efforts. The IFFO also announced that 13 more organisations had joined IFFO as partners.
26 – 29 Oct The Environment Bureau co-organised the Eco Expo Asia 2016 with the HKTDC. The fair is an international trading platform showcasing the innovations of products and services in environmental protection industries from around the world. The main theme of the Expo was “Green Solutions for a Changing Climate”. It attracted 325 exhibitors from 19 countries and regions.
27 Oct The Government launched the six-month public engagement for “Hong Kong 2030+ : Towards a Planning Vision and Strategy Transcending 2030”, which serves to update the territorial development strategy to guide planning, land and infrastructure development and the shaping of the built environment of Hong Kong beyond 2030. Two strategic growth areas, namely New Territories North and East Lantau Metropolis, are proposed to help Hong Kong embrace the future challenges and opportunities.
The HKMA announced that it had designated nine banks as Primary Liquidity Providers (PLPs) for offshore RMB market in Hong Kong, following the expiry of the first term of designation to seven PLPs.
29 Oct – 6 Nov
“InnoCarnival 2016” was held in Hong Kong Science Park. Local universities, R&D centres, professional bodies and technology institutions showcased their creative inventions and research achievements at the event. It attracted over 220 000 visits.
31 Oct The Minimum Wage Commission submitted its recommendation report to the CE in Council on completion of a new round of review of the Statutory Minimum Wage rate.
1 Nov The Bankruptcy (Amendment) Ordinance 2016 came into operation. This amendment ordinance introduces new arrangements to encourage bankrupts to fulfil their obligations to co-operate with the trustee-in-bankruptcy in respect of the administration of bankruptcy estate and to better protect the interests of creditors.
4 Nov As the residential property market showed renewed signs of exuberance in the third quarter of 2016, the Government announced the introduction of a new round of demand-side management measures, i.e. to increase the ad valorem stamp duty (AVD) rates to 15% across different value bands for residential property transactions, in lieu of the existing AVD rates at Scale 1 (commonly known as doubled ad valorem stamp duty (DSD)). The new measure has taken effect from 5 November 2016. The new measure will continue to adopt the exemptions provided for under the existing DSD regime, such that a Hong Kong Permanent Resident-buyer who does not own any other residential property in Hong Kong at the time of acquiring residential property will continue to pay AVD under the lower rates at Scale 2.
The HKMA granted the second batch of eight SVF licences to the SVF issuers under the Payment Systems and Stored Value Facilities Ordinance, adding the total number of licensees in the local SVF market to 13.
5 – 11 Nov FS led a business mission to Dubai, the United Arab Emirates, and Tehran, Iran to strengthen business and economic ties between Hong Kong and economies along the Belt and Road. On behalf of the HKSAR Government, FS signed a MoU on economic
153
co-operation with the Government of Iran.
10 Nov The MTR Corporation Limited established the MTR Academy to offer railway programmes for people in Hong Kong as well as the Mainland and overseas cities. The MTR Academy will further the development of the railway profession and support the Belt and Road Initiative.
11 Nov The Government released the preliminary GDP figures for the third quarter of 2016. The Hong Kong economy picked up slightly to a 1.9% growth in real terms over a year earlier. Domestic demand gathered further pace, while external demand also saw relative improvements. In the November update of the economic forecast for 2016, the forecast growth rate in real terms of GDP was revised to 1.5%. The forecast rates of underlying and headline CCPI inflation were revised slightly to 2.3% and 2.4% respectively.
14 Nov The new Air Traffic Control System of the Civil Aviation Department was fully commissioned to cope with the projected air traffic growth, including that to be brought about by the development of the three-runway system of the HKIA.
17 Nov
The 10th annual Structured Dialogue meeting between the HKSAR Government and the EU was held in Brussels. The two sides conducted fruitful discussions on a wide range of subjects, reviewed the positive results of recent collaborations and identified areas for further co-operation.
17 – 20 Nov CE attended the Asia-Pacific Economic Co-operation 2016 Leaders’ Week and related meetings in Peru.
18 Nov Hong Kong and Chile signed an Investment Agreement, which is an addition to the FTA between the two sides signed in 2012. The Investment Agreement is expected to enhance investors’ confidence, expand investment flows, and further strengthen the economic and trade ties between the two places.
20 – 27 Nov HKMPB organised the first-ever Hong Kong Maritime Industry Week. The eight-day Maritime Industry Week comprised 29 events, attracting about 4 600 participants from maritime and port industries and the public.
21 Nov The Government launched the $500 million “Technology Voucher Programme” to subsidise local small and medium enterprises in using technological services and solutions to improve their productivity.
22 Nov The ground breaking ceremony of Hong Kong Science Park Expansion Programme was held. Stage 1 of the Expansion Programme consists of the construction of two buildings with completion expected in 2020. The total floor space of Science Park will then be increased by about 22% to 400 000 square metres.
22 – 23 Nov The Government and HKTDC jointly hosted the Sixth Asian Logistics and Maritime Conference, attracting some 2 000 business leaders and industry practitioners from 34 countries and regions.
24 Nov The $200 million Professional Services Advancement Support Scheme was formally launched to support the Hong Kong professional services sector in its exchanges and co-operation with their counterparts in external markets and related publicity activities.

154
27 – 30 Nov FS led a government delegation to visit Beijing and met with Central Government officials responsible for financial and monetary matters to discuss issues of mutual concern.
28 Nov – 3 Dec
“Business of Design Week 2016”, the largest annual design event in Asia and one of the leading design events in the world, was held in Hong Kong. Chicago was the partner city for the event in 2016. Over 140 000 persons participated in “Business of Design Week 2016” and its concurrent events.
2 Dec The Ministry of Finance of the People’s Republic of China announced the tendering of a total of RMB14 billion RMB Sovereign Bonds of the Central People’s Government with tenors ranging from 3 to 30 years, of which RMB12 billion was issued to institutional investors, central banks and monetary authorities outside Mainland China and RMB2 billion issued to Hong Kong residents.
The SFC and the Swiss Financial Market Supervisory Authority launched the Switzerland-Hong Kong Mutual Recognition of Funds scheme to enable the distribution of eligible public funds of one market in the other’s market through a streamlined vetting process.
5 Dec Shenzhen-Hong Kong Stock Connect was launched officially. Hong Kong and overseas institutional and retail investors can invest directly in eligible A-shares listed in Shenzhen through stock market in Hong Kong. Eligible Mainland investors can also invest in eligible stocks listed in Hong Kong through the Shenzhen market.
6 Dec Led by the private sector and facilitated by the HKMA and the United Kingdom HM Treasury, the London-Hong Kong Financial Services Forum was convened in London. The forum expanded its scope to cover not only RMB business but also infrastructure financing, green finance and the Belt and Road Initiative, and FinTech in 2016, with a view to deepening and broadening financial co-operation between London and Hong Kong across a number of areas in the coming years.
7 Dec Following the 2016 Article IV Consultation with the HKSAR, an assessment was made by the IMF in the Concluding Statement of the IMF Mission. The assessment commended the HKSAR for its strong policy frameworks, robust oversight of the financial system and ample buffers, which stand the economy in good stead to meet challenges ahead.
9 Dec CE attended the 15th Hong Kong-Pearl River Delta Industrial and Commercial Circle Goodwill Gathering 2016 in Shenzhen.
The ground breaking ceremony for the Tseung Kwan O – Lam Tin Tunnel Project (TKO-LTT) was held. With expected completion in 2021, TKO-LTT will become an additional major road link between Tseung Kwan O and East Kowloon, effectively relieving the traffic load of Tseung Kwan O and Tseung Kwan O Tunnel.
15 Dec The HKMA announced an upward adjustment of the Base Rate by 25 basis points to 1.00%, according to a pre-set formula. The increase in the Base Rate followed the 25-basis-point upward shift in the target range for the US federal funds rate on 14 December in the US.
16 Dec The Hong Kong International Aviation Academy and the Ecole Nationale de l’Aviation Civile of France signed a MoU to jointly develop programmes targeting practitioners from the local and regional aviation industry, including countries and regions along the

155
Belt and Road.
20 Dec The Government released the Long Term Housing Strategy Annual Progress Report 2016. The updated total housing supply target for the ten-year period from 2017-18 to 2026-27 is 460 000 units.
The HKMA and the China Development Bank Corporation signed a MoU with respect to establishing a strategic framework of co-operation to facilitate the financing of infrastructure projects via the IFFO platform.
The HKMA and the Export-Import Bank of China signed a MoU on co-operation in the facilitation of the investment and financing of infrastructure projects via the IFFO platform.
21 Dec The Environment Bureau announced a three-step plan to phase out the local trade in ivory by the end of 2021, and proposed to impose heavier penalties on smuggling and illegal trading of endangered species to combat illicit wildlife trade.
23 Dec The Government launched the “Midstream Research Programme for Universities” to encourage local universities to conduct more inter-disciplinary or multi-institution collaboration research, such that more research outcomes could be made available for further downstream research work or commercialisation.
28 Dec The South Island Line (East) was commissioned, providing convenient railway services for passengers travelling to and from the Southern District of Hong Kong Island.
Through the “Public Sector Information Portal” (data.gov.hk), the Government released some 200 new application programming interfaces, covering different policy areas. It provides the community with more convenient access to government open data to develop innovative applications and services.
29 Dec HKIA welcomed its 70 millionth passenger of the year, the first time HKIA’s annual passenger throughput surpassed this milestone.
30 Dec The Banking (Disclosure) (Amendment) Rules 2016 and the Banking (Specification of Class of Exempted Charges) (Amendment) Notice 2016 were gazetted to implement, or facilitate the implementation of, recent international standards for banking regulation in Hong Kong.
31 Dec The number of visitors to Hong Kong in 2016 was 56.65 million.
The stock market of Hong Kong ranked first globally in terms of the amount of funds raised through initial public offerings in 2016.


157
Table Page
1. Gross Domestic Product by expenditure component (at current market prices) 158-159
2. 160-161
3. Gross Domestic Product by economic activity (at current prices) 162
4. 163
5. 164-165
6. Balance of Payments by major component (at current prices) 166
7. 167
7a. 168
8. Total exports of goods by market (in value terms) 169
9. Imports of goods by source (in value terms) 170
10. Exports and imports of services by component (at current market prices) 171
10a. 172
11. Incoming visitors by source 173
12. Property market 174-175
13. 176-177
14. Monetary aggregates 178-179
15. Rates of change in business receipts indices for services industries/domains 180
16. Labour force characteristics 181
17. Employment in selected major industries 182
18. Number of manual workers engaged at building and construction sites 183
19. Rates of change in indices of payroll per person engaged by selected industry section 184
20. Rates of change in wage indices by selected industry section 185
21. 186
22. 187
23. Rates of change in prices 188-189
24. Rates of change in Composite Consumer Price Index 190-191
25. 192-193
Monthly wage level and distribution analysed by industry section : all employees
Hourly wage level and distribution analysed by industry section : all employees
Goods and services trade (at current market prices)
Rates of change in implicit price deflators of GDP and its main expenditurecomponents
Value added and employment statistics of the Four Key Industries and other selectedindustries
Statistical Appendix
Property prices and rentals
Rates of change in chain volume measures of Gross Domestic Product byexpenditure component (in real terms)
Rates of change in chain volume measures of Gross Domestic Product by economicactivity (in real terms)
Goods and services trade based on the standards stipulated in the System of NationalAccounts 2008 , other than the change of ownership principle
Exports and imports of services by component based on the standards stipulated inthe System of National Accounts 2008 , other than the change of ownership principle(at current market prices)

158
($Mn)
2007 2008 2009 2010 2011 2012
Private consumption expenditure 982,368 1,026,482 1,013,615 1,090,234 1,224,402 1,314,969Government consumption expenditure 138,967 148,017 152,512 157,371 168,517 185,310Gross domestic fixed capital formation 340,356 350,796 339,552 386,852 455,294 517,411
of which:
Building and construction 111,776 127,312 123,746 139,249 179,341 204,860 Machinery, equipment and intellectual property products 204,083 198,633 191,568 209,568 239,854 278,477
Changes in inventories 12,841 8,480 22,941 37,522 11,739 -3,662
Total exports of goods& 2,574,439 2,758,181 2,454,394 3,021,492 3,406,765 3,632,957
Imports of goods& 2,364,930 2,563,428 2,351,386 2,995,928 3,464,968 3,779,686
Exports of services& 502,775 544,358 501,303 625,719 710,716 764,026
Imports of services& 536,060 565,399 473,686 546,930 578,035 594,266
GDP 1,650,756 1,707,487 1,659,245 1,776,332 1,934,430 2,037,059
Per capita GDP ($) 238,676 245,406 237,960 252,887 273,549 284,720
GNI 1,703,567 1,807,994 1,709,007 1,813,928 1,987,256 2,066,514
Per capita GNI ($) 246,312 259,851 245,096 258,240 281,019 288,837
Total final demand 4,551,746 4,836,314 4,484,317 5,319,190 5,977,433 6,411,011Total final demand excluding re-exports(a) 2,823,914 3,001,538 2,823,844 3,235,971 3,604,705 3,828,055
Domestic demand 1,474,532 1,533,775 1,528,620 1,671,979 1,859,952 2,014,028 Private 1,297,607 1,342,889 1,327,688 1,449,592 1,614,010 1,737,274 Public 176,925 190,886 200,932 222,387 245,942 276,754
External demand 3,077,214 3,302,539 2,955,697 3,647,211 4,117,481 4,396,983
Table 1 : Gross Domestic Product by expenditure component(at current market prices)
Definition of Terms :
Total final demand = private consumption expenditure + government consumption expenditure + gross domestic fixed capital formation + changes in inventories + total exports of goods + exports of services
Private sector domestic demand = private consumption expenditure + gross domestic fixed capital formation by the private sector + changes in inventories
Public sector domestic demand = government consumption expenditure + gross domestic fixed capital formation by the public sector
Domestic demand = private sector domestic demand + public sector domestic demand
External demand = total exports of goods + exports of services

159
($Mn)
2013 2014 2015# 2016# 2016Q1# Q2# Q3# Q4#
Private consumption expenditure 1,413,058 1,502,768 1,593,217 1,645,935 397,701 414,430 399,047 434,757Government consumption expenditure 198,572 214,216 231,251 248,055 63,320 59,718 62,081 62,936Gross domestic fixed capital formation 515,516 530,916 537,219 535,916 119,271 128,495 135,306 152,844
of which:
Building and construction 211,130 244,047 262,782 278,274 66,047 67,936 68,346 75,945 Machinery, equipment and intellectual property products 264,997 242,902 228,591 212,515 46,875 51,280 54,679 59,681
Changes in inventories -1,673 7,473 -20,580 9,140 -1,864 1,932 3,796 5,276
Total exports of goods& 3,926,059 3,986,769 3,889,225 3,900,235 848,551 929,204 1,025,086 1,097,394
Imports of goods& 4,142,651 4,237,700 4,066,527 4,036,243 892,092 986,624 1,036,803 1,120,724
Exports of services& 812,640 829,085 808,948 764,035 193,645 176,822 195,449 198,119
Imports of services& 583,216 573,522 574,345 577,964 138,477 137,727 148,096 153,664
GDP 2,138,305 2,260,005 2,398,408 2,489,109 590,055 586,250 635,866 676,938
Per capita GDP ($) 297,503 312,082 328,293 338,806 -- -- -- --
GNI 2,178,824 2,306,612 2,442,784 N.A. 600,979 624,672 651,189 N.A.
Per capita GNI ($) 303,141 318,518 334,367 N.A. -- -- -- --
Total final demand 6,864,172 7,071,227 7,039,280 7,103,316 1,620,624 1,710,601 1,820,765 1,951,326Total final demand excluding re-exports(a) 4,025,243 4,116,670 4,139,914 4,205,909 994,689 1,008,402 1,060,617 1,142,200
Domestic demand 2,125,473 2,255,373 2,341,107 2,439,046 578,428 604,575 600,230 655,813 Private 1,827,460 1,929,514 1,991,558 2,066,584 484,788 515,118 510,412 556,266 Public 298,013 325,859 349,549 372,462 93,640 89,457 89,818 99,547
External demand 4,738,699 4,815,854 4,698,173 4,664,270 1,042,196 1,106,026 1,220,535 1,295,513
Table 1 : Gross Domestic Product by expenditure component(at current market prices) (Cont'd)
Notes: (a) Re-export margin is nevertheless retained in the total final demand.
(#) Figures are subject to revision later on as more data become available.
(&) Figures are compiled based on the change of ownership principle in recording goods sent abroad for processing and merchanting under the standards stipulated in the System of National Accounts 2008.
(--) Not applicable.
N.A. Not yet available.

160
(%)
2007 2008 2009 2010 2011 2012
Private consumption expenditure 8.6 1.9 0.2 6.1 8.4 4.1Government consumption expenditure 3.2 2.0 2.3 3.4 2.5 3.6Gross domestic fixed capital formation 3.2 1.4 -3.5 7.7 10.2 6.8 of which:
Building and construction -0.3 6.8 -5.5 5.7 15.7 7.2 Machinery, equipment and intellectual property products 2.5 * -2.2 6.5 12.3 10.2
Total exports of goods& 6.9 3.2 -11.2 18.0 4.6 3.3
Imports of goods& 9.9 3.7 -7.0 19.9 6.7 4.6
Exports of services& 15.9 4.9 1.7 15.3 5.7 2.7
Imports of services& 5.7 1.1 -12.9 10.0 -0.2 2.2
GDP 6.5 2.1 -2.5 6.8 4.8 1.7
Per capita GDP 5.6 1.5 -2.7 6.0 4.1 0.5
RGNI 8.2 3.3 -4.6 3.7 4.8 -0.2
Per capita RGNI 7.3 2.7 -4.8 2.9 4.1 -1.4
Total final demand 8.1 2.8 -6.1 14.0 5.3 3.4Total final demand excluding re-exports(a) 8.2 2.9 -3.5 11.0 4.7 3.2
Domestic demand 7.8 1.4 0.5 7.1 6.5 3.9 Private 8.9 1.2 -0.1 6.6 6.7 3.6 Public 0.6 3.2 4.5 10.2 5.5 5.8
External demand 8.2 3.5 -9.1 17.6 4.8 3.2
Table 2 : Rates of change in chain volume measures of Gross Domestic Productby expenditure component (in real terms)
Notes: (a) Re-export margin is nevertheless retained in the total final demand.
(#) Figures are subject to revision later on as more data become available.
(&) Figures are compiled based on the change of ownership principle in recording goods sent abroad for processing and merchanting under the standards stipulated in the System of National Accounts 2008.
(--) Not applicable.
(*) Change within ±0.05%.
N.A. Not yet available.
(^) Average annual rate of change for the 10-year period 2005-2015.
(~) Average annual rate of change for the 5-year period 2010-2015.

161
(%)
2013 2014 2015# 2016# 2016
Q1# Q2# Q3# Q4#
10 years2006 to
2016#
5 years2011 to
2016#
Private consumption expenditure 4.6 3.3 4.8 1.6 1.5 0.3 1.2 3.2 4.3 3.7Government consumption expenditure 2.7 3.1 3.5 3.3 3.2 3.4 3.3 3.3 2.9 3.2Gross domestic fixed capital formation 2.6 -0.1 -3.2 -0.5 -8.7 -5.0 6.7 5.2 2.4 1.1 of which:
Building and construction -4.3 9.3 2.2 3.6 1.4 2.5 3.5 6.9 3.9 3.5 Machinery, equipment and intellectual property products 11.3 -8.7 -7.7 -4.6 -10.9 -10.3 7.6 -4.2 1.7 -0.3
Total exports of goods& 8.2 0.8 -1.7 1.7 -3.5 2.3 2.4 5.1 2.7 2.4
Imports of goods& 9.9 1.5 -2.7 1.0 -5.5 0.6 3.1 5.5 2.6 2.8
Exports of services& 6.0 1.6 0.3 -3.1 -5.6 -5.8 -2.4 1.4 1.7 1.5
Imports of services& -2.1 -2.2 5.1 1.9 4.0 1.1 0.7 1.8 5.7 0.9
GDP 3.1 2.8 2.4 1.9 1.0 1.7 2.0 3.1 2.9 2.4
Per capita GDP 2.6 2.0 1.5 1.4 -- -- -- -- 2.2 1.6
RGNI 4.0 2.7 3.8 N.A. 2.8 3.4 3.3 N.A. 3.2^ 3.0~
Per capita RGNI 3.5 1.9 2.9 N.A. -- -- -- -- 2.5^ 2.2 ~
Total final demand 6.6 1.6 -0.4 1.4 -2.5 1.0 2.5 4.4 2.9 2.5Total final demand excluding re-exports(a) 4.2 0.6 0.1 1.5 -0.5 0.1 2.7 3.4 3.7 1.9
Domestic demand 4.1 2.9 1.6 2.5 0.1 1.1 4.5 4.2 3.8 3.0
Private 4.1 2.6 1.4 2.4 0.1 0.9 5.0 3.6 3.7 2.8 Public 3.7 4.6 2.9 3.0 0.1 2.3 1.9 8.0 4.4 4.0External demand 7.8 1.0 -1.4 0.9 -3.9 0.9 1.6 4.5 2.5 2.3
Table 2 : Rates of change in chain volume measures of Gross Domestic Productby expenditure component (in real terms) (Cont'd)
Average annualrate of change:
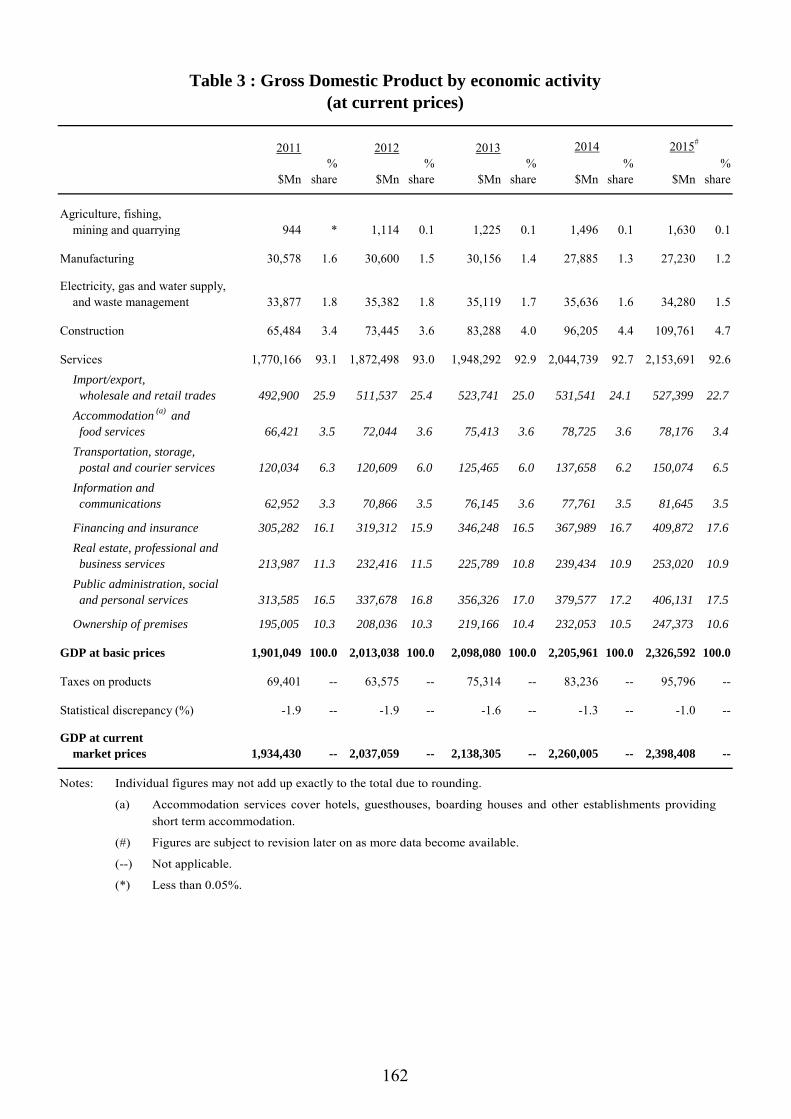
162
2011 2012 2013
$Mn%
share $Mn%
share $Mn%
share $Mn%
share $Mn%
share
Agriculture, fishing, mining and quarrying 944 * 1,114 0.1 1,225 0.1 1,496 0.1 1,630 0.1
Manufacturing 30,578 1.6 30,600 1.5 30,156 1.4 27,885 1.3 27,230 1.2
Electricity, gas and water supply, and waste management 33,877 1.8 35,382 1.8 35,119 1.7 35,636 1.6 34,280 1.5
Construction 65,484 3.4 73,445 3.6 83,288 4.0 96,205 4.4 109,761 4.7
Services 1,770,166 93.1 1,872,498 93.0 1,948,292 92.9 2,044,739 92.7 2,153,691 92.6Import/export, wholesale and retail trades 492,900 25.9 511,537 25.4 523,741 25.0 531,541 24.1 527,399 22.7Accommodation (a) and food services 66,421 3.5 72,044 3.6 75,413 3.6 78,725 3.6 78,176 3.4Transportation, storage, postal and courier services 120,034 6.3 120,609 6.0 125,465 6.0 137,658 6.2 150,074 6.5Information and communications 62,952 3.3 70,866 3.5 76,145 3.6 77,761 3.5 81,645 3.5
Financing and insurance 305,282 16.1 319,312 15.9 346,248 16.5 367,989 16.7 409,872 17.6Real estate, professional and business services 213,987 11.3 232,416 11.5 225,789 10.8 239,434 10.9 253,020 10.9Public administration, social and personal services 313,585 16.5 337,678 16.8 356,326 17.0 379,577 17.2 406,131 17.5
Ownership of premises 195,005 10.3 208,036 10.3 219,166 10.4 232,053 10.5 247,373 10.6
GDP at basic prices 1,901,049 100.0 2,013,038 100.0 2,098,080 100.0 2,205,961 100.0 2,326,592 100.0
Taxes on products 69,401 -- 63,575 -- 75,314 -- 83,236 -- 95,796 --
Statistical discrepancy (%) -1.9 -- -1.9 -- -1.6 -- -1.3 -- -1.0 --
GDP at current market prices 1,934,430 -- 2,037,059 -- 2,138,305 -- 2,260,005 -- 2,398,408 --
Table 3 : Gross Domestic Product by economic activity(at current prices)
2015#2014
Notes: Individual figures may not add up exactly to the total due to rounding.
(a) Accommodation services cover hotels, guesthouses, boarding houses and other establishments providing short term accommodation.
(#) Figures are subject to revision later on as more data become available.
(--) Not applicable.
(*) Less than 0.05%.

163
(%)
2010 2011 2012 2013 2014 2015# 2015 2016
Q4# Q1# Q2# Q3#
Agriculture, fishing, mining and quarrying 3.9 0.8 -3.2 4.9 -6.0 -6.8 -8.8 -8.4 -0.5 -3.1
Manufacturing 3.3 0.7 -0.8 0.1 -0.4 -1.5 -1.3 -0.3 -0.4 -0.1
Electricity, gas and water supply, and waste management -0.2 0.6 1.4 -2.9 0.8 -2.6 -0.8 1.9 0.1 0.7
Construction 15.6 18.3 8.3 4.2 13.0 5.4 1.2 -1.3 0.9 2.4
Services 6.9 5.2 1.8 2.7 2.5 1.7 1.8 1.5 2.7 2.3Import/export, wholesale and retail trades 16.7 9.1 1.9 3.3 1.2 -1.1 -0.2 -2.2 0.8 0.7Accommodation (a) and food services 9.5 8.3 1.8 3.6 2.2 -1.9 -0.6 -1.1 0.9 0.3Transportation, storage, postal and courier services 6.0 7.2 0.9 4.1 2.9 3.3 4.5 2.8 3.3 3.5Information and communications 1.5 2.8 2.8 4.0 3.9 4.0 3.0 3.5 4.3 3.5
Financing and insurance 6.3 6.5 0.8 7.7 5.3 6.1 5.7 5.2 4.5 4.8Real estate, professional and business services 2.5 2.6 3.1 -4.0 1.9 0.7 -0.7 1.7 3.7 3.1Public administration, social and personal services 2.2 1.8 2.1 2.5 2.4 2.6 3.0 2.6 3.3 2.4
Ownership of premises 0.8 0.7 1.1 0.3 0.8 0.6 0.6 0.7 0.8 0.8
Taxes on products 6.3 -6.8 -10.4 -6.4 6.7 7.1 -13.9 -20.6 -25.5 -6.5
GDP in chained (2014) dollars 6.8 4.8 1.7 3.1 2.8 2.4 1.9 1.0 1.7 2.0
Table 4 : Rates of change in chain volume measures of Gross Domestic Productby economic activity (in real terms)
Notes: (#) Figures are subject to revision later on as more data become available. (a) Accommodation services cover hotels, guesthouses, boarding houses and other establishments providing
short term accommodation.

164
$Bn% share
in total(1) $Bn% share
in total(1) $Bn% share
in total(1) $Bn% share
in total(1) 2013 2014 2015#
Value added at current prices
Four Key Industries 1,166.8 58.0 1,212.8 57.8 1,269.3 57.5 1,331.3 57.2 3.9 4.7 4.9
Financial services 319.3 15.9 346.2 16.5 368.0 16.7 409.9 17.6 8.4 6.3 11.4
Tourism 94.6 4.7 105.9 5.0 112.5 5.1 116.4 5.0 11.9 6.2 3.4
Trading and logistics 495.4 24.6 500.5 23.9 515.7 23.4 517.1 22.2 1.0 3.0 0.3Professional services and other producer services(2) 257.6 12.8 260.2 12.4 273.2 12.4 288.0 12.4 1.0 5.0 5.4
Other selected industries (3) 175.9 8.7 190.6 9.1 202.0 9.2 207.3 8.9 8.3 6.0 2.6Cultural and creative industries 97.8 4.9 106.1 5.1 109.7 5.0 108.8 4.7 8.4 3.4 -0.8
Medical services 29.5 1.5 32.4 1.5 36.2 1.6 38.7 1.7 10.1 11.6 6.9
Education services 22.6 1.1 24.2 1.2 26.1 1.2 28.0 1.2 7.2 7.7 7.2Innovation and technology 13.4 0.7 14.7 0.7 15.8 0.7 16.9 0.7 9.8 7.1 7.1Testing and certification services 5.8 0.3 6.0 0.3 6.5 0.3 7.0 0.3 3.2 8.0 8.0
Environmental industries 6.8 0.3 7.1 0.3 7.8 0.4 7.9 0.3 5.2 9.8 1.1Nominal GDP at basic prices 2,013.0 100.0 2,098.1 100.0 2,206.0 100.0 2,326.6 100.0 4.2 5.1 5.5
Table 5 : Value added and employment statistics of the Four Key Industriesand other selected industries
2012 2013 2014 2015#Annual percentage
change (%)
Notes: Individual figures may not add up exactly to the total due to rounding.
(1) Refers to percentage share in nominal GDP at basic prices. Such GDP figure is slightly different from the commonly used one, i.e. valued at current market prices, in which taxes on products are included.
(2) Other producer services refer to producer services other than financial services, tourism, trading and logistics and professional services.
(3) The other selected industries reflect the direct contribution of these industries in the private sector only. Some of them are service domains straddling across different industries. For example, “innovation and technology” activities may exist in any industry and organisation. The term “industry” is used to denote the aggregate of the economic activities concerned for easy general understanding.
(4) Since innovation and technology involves significant non-routine activities, persons engaged in these activities are measured by the volume of labour input to innovation and technology in full-time equivalent terms (in terms of man-years).
(5) Figures refer to Composite Employment Estimates.
(#) Figures are subject to revision later on as more data become available.
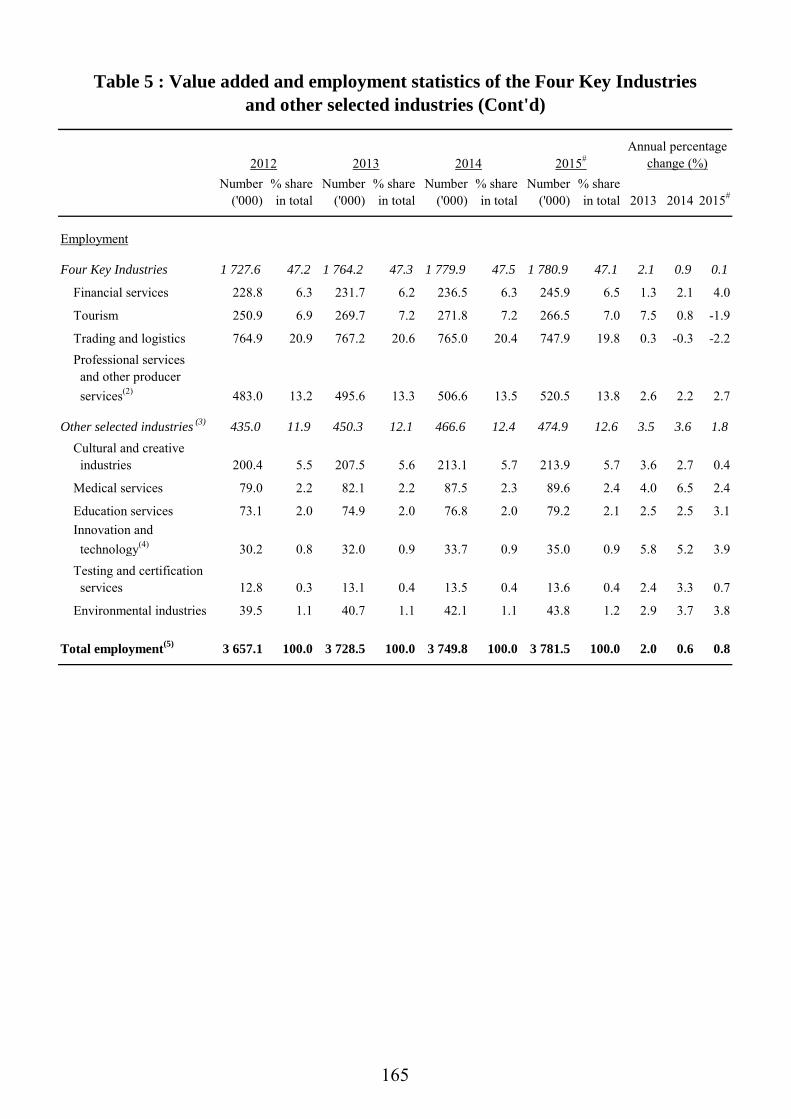
165
Number('000)
% sharein total
Number('000)
% sharein total
Number('000)
% sharein total
Number('000)
% sharein total 2013 2014 2015#
Employment
Four Key Industries 1 727.6 47.2 1 764.2 47.3 1 779.9 47.5 1 780.9 47.1 2.1 0.9 0.1
Financial services 228.8 6.3 231.7 6.2 236.5 6.3 245.9 6.5 1.3 2.1 4.0
Tourism 250.9 6.9 269.7 7.2 271.8 7.2 266.5 7.0 7.5 0.8 -1.9
Trading and logistics 764.9 20.9 767.2 20.6 765.0 20.4 747.9 19.8 0.3 -0.3 -2.2Professional services and other producer services(2) 483.0 13.2 495.6 13.3 506.6 13.5 520.5 13.8 2.6 2.2 2.7
Other selected industries (3) 435.0 11.9 450.3 12.1 466.6 12.4 474.9 12.6 3.5 3.6 1.8Cultural and creative industries 200.4 5.5 207.5 5.6 213.1 5.7 213.9 5.7 3.6 2.7 0.4
Medical services 79.0 2.2 82.1 2.2 87.5 2.3 89.6 2.4 4.0 6.5 2.4
Education services 73.1 2.0 74.9 2.0 76.8 2.0 79.2 2.1 2.5 2.5 3.1Innovation and technology(4) 30.2 0.8 32.0 0.9 33.7 0.9 35.0 0.9 5.8 5.2 3.9Testing and certification services 12.8 0.3 13.1 0.4 13.5 0.4 13.6 0.4 2.4 3.3 0.7
Environmental industries 39.5 1.1 40.7 1.1 42.1 1.1 43.8 1.2 2.9 3.7 3.8
Total employment(5) 3 657.1 100.0 3 728.5 100.0 3 749.8 100.0 3 781.5 100.0 2.0 0.6 0.8
Table 5 : Value added and employment statistics of the Four Key Industriesand other selected industries (Cont'd)
2012 2013 2014 2015#Annual percentage
change (%)

166
($Mn)
2011 2012 2013 2014 2015# 2015 2016
Q4# Q1# Q2# Q3#
Current account(a) 107,513 32,151 32,475 31,453 79,553 27,432 17,205 14,761 45,738
Goods -58,203 -146,729 -216,592 -250,931 -177,302 -17,309 -43,541 -57,420 -11,717
Services 132,681 169,760 229,424 255,563 234,603 47,164 55,168 39,095 47,353
Primary income 52,826 29,455 40,519 46,607 44,376 2,857 10,924 38,422 15,323
Secondary income -19,791 -20,336 -20,876 -19,786 -22,124 -5,280 -5,346 -5,337 -5,221
Capital and financial account(a) -113,242 -67,664 -86,308 -73,785 -128,642 -53,479 10,251 8,918 -75,890
Capital account -2,021 -1,433 -1,609 -748 -216 -97 -72 -57 -48
Financial account -111,220 -66,231 -84,699 -73,037 -128,426 -53,382 10,323 8,975 -75,842 Financial non-reserve assets -24,437 122,658 -26,810 66,052 153,570 44,153 15,570 -7,116 -77,793
Direct investment 1,868 -102,623 -50,250 -85,718 794,800 189,196 -7,598 31,738 157,441
Portfolio investment -10,979 -31,592 -386,077 -64,384 -970,938 -301,331 84,715 -18,862 -213,675
Financial derivatives 20,884 15,208 54,661 118,359 99,178 19,025 11,804 6,712 6,174
Other investment -36,210 241,665 354,856 97,795 230,531 137,263 -73,352 -26,704 -27,733
Reserve assets -86,783 -188,889 -57,890 -139,089 -281,996 -97,535 -5,246 16,092 1,951
Net errors and omissions 5,729 35,513 53,833 42,332 49,089 26,047 -27,456 -23,679 30,152
Overall Balance of Payments 86,783 188,889 57,890 139,089 281,996 97,535 5,246 -16,092 -1,951
Table 6 : Balance of Payments by major component(at current prices)
Notes: Individual figures may not add up exactly to the total due to rounding.
(a) In accordance with the accounting rules adopted in compiling Balance of Payments, a positive value for the balance figure in the current account represents a surplus whereas a negative value represents a deficit. In the capital and financial account, a positive value indicates a net financial inflow while a negative value indicates a net outflow. As increases in external assets are debit entries and decreases are credit entries, a negative value for the reserve assets represents a net increase while a positive value represents a net decrease.
(#) Figures are subject to revision later on as more data become available.

167
($Mn)
2012 2013 2014 2015# 2016# 2016
Q1# Q2# Q3# Q4#
Total exports of goods 3,632,957 3,926,059 3,986,769 3,889,225 3,900,235 848,551 929,204 1,025,086 1,097,394
Imports of goods 3,779,686 4,142,651 4,237,700 4,066,527 4,036,243 892,092 986,624 1,036,803 1,120,724
Goods trade balance -146,729 -216,592 -250,931 -177,302 -136,008 -43,541 -57,420 -11,717 -23,330(-3.9) (-5.2) (-5.9) (-4.4) (-3.4) (-4.9) (-5.8) (-1.1) (-2.1)
Exports of services 764,026 812,640 829,085 808,948 764,035 193,645 176,822 195,449 198,119
Imports of services 594,266 583,216 573,522 574,345 577,964 138,477 137,727 148,096 153,664
Services trade balance 169,760 229,424 255,563 234,603 186,071 55,168 39,095 47,353 44,455(28.6) (39.3) (44.6) (40.8) (32.2) (39.8) (28.4) (32.0) (28.9)
Exports of goods and services 4,396,983 4,738,699 4,815,854 4,698,173 4,664,270 1,042,196 1,106,026 1,220,535 1,295,513Imports of goods and services 4,373,952 4,725,867 4,811,222 4,640,872 4,614,207 1,030,569 1,124,351 1,184,899 1,274,388Goods and services trade balance 23,031 12,832 4,632 57,301 50,063 11,627 -18,325 35,636 21,125
<0.5> <0.3> <0.1> <1.2> <1.1> <1.1> <-1.6> <3.0> <1.7>
Table 7 : Goods and services trade(at current market prices)
Notes: Figures in this table are compiled based on the change of ownership principle in recording goods sent abroad for processing and merchanting under the standards stipulated in the System of National Accounts 2008.
(#) Figures are subject to revision later on as more data become available.
( ) As a percentage of the total value of imports of goods/services.
< > As a percentage of the total value of imports of goods and services.

168
2012 2013 2014 2015# 2016# 2016
Q1# Q2# Q3# Q4#
At current market prices ($Mn)
Total exports of goods 3,591,776 3,816,390 3,877,458 3,779,263 3,776,745 823,429 912,362 989,270 1,051,684
Imports of goods 4,116,410 4,394,928 4,471,810 4,289,991 4,240,000 937,677 1,039,442 1,088,649 1,174,232
Goods trade balance -524,634 -578,538 -594,352 -510,728 -463,255 -114,248 -127,080 -99,379 -122,548(-12.7) (-13.2) (-13.3) (-11.9) (-10.9) (-12.2) (-12.2) (-9.1) (-10.4)
Exports of services 1,003,047 1,058,584 1,079,989 1,052,355 1,004,421 245,260 226,029 260,411 272,721
Imports of services 455,382 467,214 481,005 484,326 491,103 119,385 117,274 125,396 129,048
Services trade balance 547,665 591,370 598,984 568,029 513,318 125,875 108,755 135,015 143,673(120.3) (126.6) (124.5) (117.3) (104.5) (105.4) (92.7) (107.7) (111.3)
Exports of goods and services 4,594,823 4,874,974 4,957,447 4,831,618 4,781,166 1,068,689 1,138,391 1,249,681 1,324,405
Imports of goods and services 4,571,792 4,862,142 4,952,815 4,774,317 4,731,103 1,057,062 1,156,716 1,214,045 1,303,280
Goods and services trade balance 23,031 12,832 4,632 57,301 50,063 11,627 -18,325 35,636 21,125
<0.5> <0.3> <0.1> <1.2> <1.1> <1.1> <-1.6> <2.9> <1.6>
Rates of change in real terms (%)
Total exports of goods 1.9 6.5 0.8 -1.9 1.4 -3.6 2.0 1.9 4.7
Imports of goods 3.0 7.2 0.9 -2.7 0.6 -5.4 0.2 2.4 4.7
Exports of services 2.2 4.9 1.2 -0.4 -2.3 -5.0 -4.4 -1.6 1.5
Imports of services 1.9 1.5 1.8 5.4 2.7 4.6 1.6 1.6 3.1
Table 7a : Goods and services trade based on the standards stipulated in the System ofNational Accounts 2008 , other than the change of ownership principle
Notes: (#) Figures are subject to revision later on as more data become available.
( ) As a percentage of the total value of imports of goods/services.
< > As a percentage of the total value of imports of goods and services.
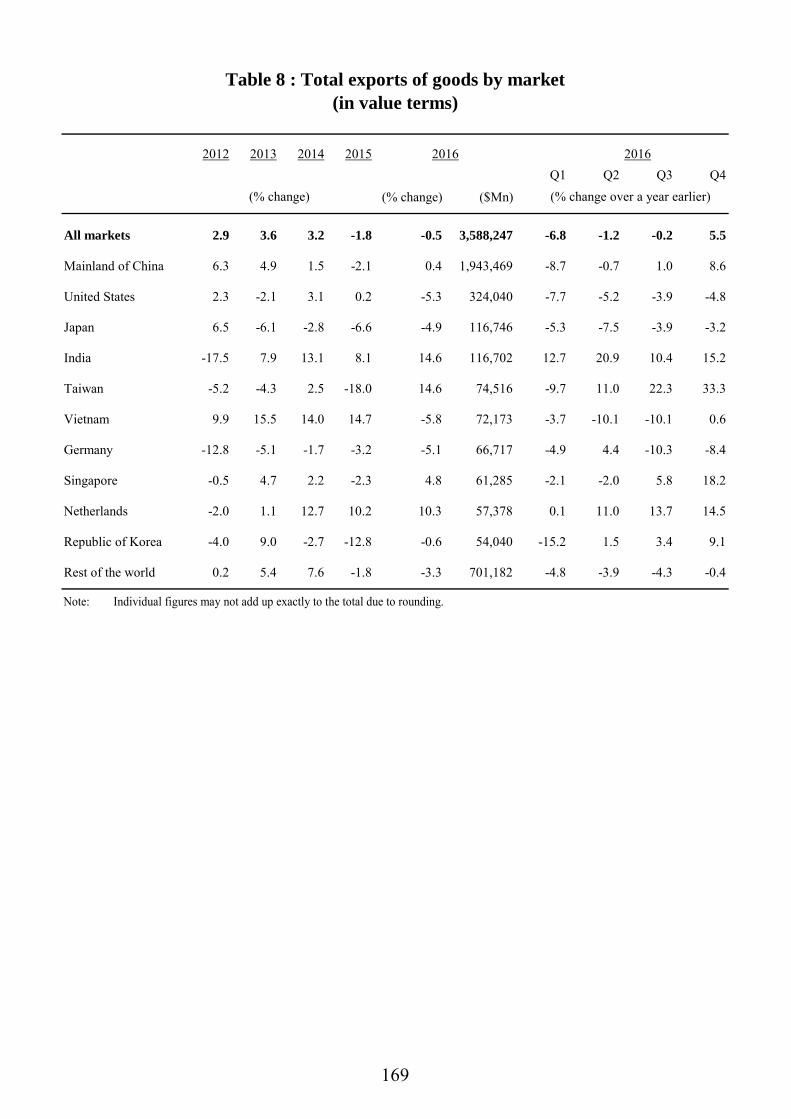
169
2012 2013 2014 2015 2016Q1 Q2 Q3 Q4
(% change) ($Mn)
All markets 2.9 3.6 3.2 -1.8 -0.5 3,588,247 -6.8 -1.2 -0.2 5.5
Mainland of China 6.3 4.9 1.5 -2.1 0.4 1,943,469 -8.7 -0.7 1.0 8.6
United States 2.3 -2.1 3.1 0.2 -5.3 324,040 -7.7 -5.2 -3.9 -4.8
Japan 6.5 -6.1 -2.8 -6.6 -4.9 116,746 -5.3 -7.5 -3.9 -3.2
India -17.5 7.9 13.1 8.1 14.6 116,702 12.7 20.9 10.4 15.2
Taiwan -5.2 -4.3 2.5 -18.0 14.6 74,516 -9.7 11.0 22.3 33.3
Vietnam 9.9 15.5 14.0 14.7 -5.8 72,173 -3.7 -10.1 -10.1 0.6
Germany -12.8 -5.1 -1.7 -3.2 -5.1 66,717 -4.9 4.4 -10.3 -8.4
Singapore -0.5 4.7 2.2 -2.3 4.8 61,285 -2.1 -2.0 5.8 18.2
Netherlands -2.0 1.1 12.7 10.2 10.3 57,378 0.1 11.0 13.7 14.5
Republic of Korea -4.0 9.0 -2.7 -12.8 -0.6 54,040 -15.2 1.5 3.4 9.1
Rest of the world 0.2 5.4 7.6 -1.8 -3.3 701,182 -4.8 -3.9 -4.3 -0.4
Table 8 : Total exports of goods by market(in value terms)
2016
(% change over a year earlier)(% change)
Note: Individual figures may not add up exactly to the total due to rounding.
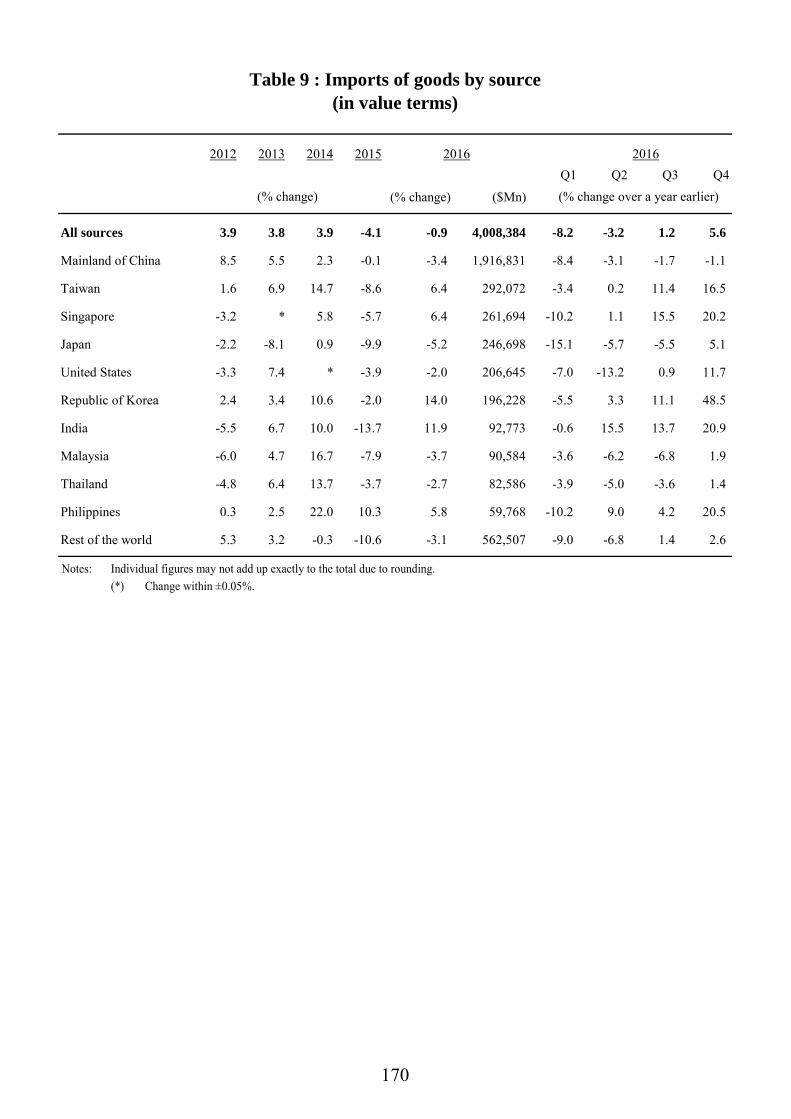
170
2012 2013 2014 2015 2016Q1 Q2 Q3 Q4
(% change) ($Mn)
All sources 3.9 3.8 3.9 -4.1 -0.9 4,008,384 -8.2 -3.2 1.2 5.6
Mainland of China 8.5 5.5 2.3 -0.1 -3.4 1,916,831 -8.4 -3.1 -1.7 -1.1
Taiwan 1.6 6.9 14.7 -8.6 6.4 292,072 -3.4 0.2 11.4 16.5
Singapore -3.2 * 5.8 -5.7 6.4 261,694 -10.2 1.1 15.5 20.2
Japan -2.2 -8.1 0.9 -9.9 -5.2 246,698 -15.1 -5.7 -5.5 5.1
United States -3.3 7.4 * -3.9 -2.0 206,645 -7.0 -13.2 0.9 11.7
Republic of Korea 2.4 3.4 10.6 -2.0 14.0 196,228 -5.5 3.3 11.1 48.5
India -5.5 6.7 10.0 -13.7 11.9 92,773 -0.6 15.5 13.7 20.9
Malaysia -6.0 4.7 16.7 -7.9 -3.7 90,584 -3.6 -6.2 -6.8 1.9
Thailand -4.8 6.4 13.7 -3.7 -2.7 82,586 -3.9 -5.0 -3.6 1.4
Philippines 0.3 2.5 22.0 10.3 5.8 59,768 -10.2 9.0 4.2 20.5
Rest of the world 5.3 3.2 -0.3 -10.6 -3.1 562,507 -9.0 -6.8 1.4 2.6
(% change)
Table 9 : Imports of goods by source(in value terms)
2016
(% change over a year earlier)
Notes: Individual figures may not add up exactly to the total due to rounding. (*) Change within ±0.05%.

171
2012 2013 2014 2015# 2016
Q1# Q2# Q3# Q4#
(% change) ($Mn)
Exports of services 7.5 6.4 2.0 -2.4 -5.6 764,035 -9.1 -8.5 -4.2 -0.2
Transport -0.6 -2.5 2.2 -6.8 -5.7 217,720 -11.0 -8.3 -4.7 1.7
Travel 15.8 17.7 -1.5 -5.8 -9.3 254,197 -15.1 -9.4 -8.3 -4.2
Financial services 7.8 6.1 7.0 8.5 -5.4 140,665 -4.6 -18.0 -1.5 1.6
Other services 8.7 1.4 4.7 1.6 1.5 151,453 0.1 2.0 1.2 2.8
Imports of services 2.8 -1.9 -1.7 0.1 0.6 577,964 0.5 -0.4 0.8 1.5
Transport 2.3 -1.4 1.5 -5.9 -0.9 133,040 -2.8 -2.3 0.1 1.5
Travel 5.2 5.7 3.7 4.7 4.8 187,290 9.4 1.9 4.5 3.8
Manufacturing^ -0.4 -16.5 -20.2 -2.7 -3.5 86,861 -4.9 -3.9 -4.2 -1.4
Other services 4.0 3.2 3.5 2.2 -0.3 170,773 -2.8 0.7 0.1 0.8
(% change)
Table 10 : Exports and imports of services by component(at current market prices)
2016#
(% change over a year earlier)
Notes: Individual figures may not add up exactly to the total due to rounding. Figures in this table are compiled based on the change of ownership principle in recording goods sent abroad for
processing and merchanting under the standards stipulated in the System of National Accounts 2008.
(#) Figures are subject to revision later on as more data become available.
(^) This includes the value of processing fees paid by Hong Kong to the processing units outside Hong Kong and raw materials / semi-manufactures directly procured by these processing units.

172
2012 2013 2014 2015# 2016
Q1# Q2# Q3# Q4#
(% change) ($Mn)
Exports of services 6.6 5.5 2.0 -2.6 -4.6 1,004,421 -8.3 -6.9 -3.3 0.1
Transport -0.6 -2.5 2.2 -6.8 -5.7 217,720 -11.0 -8.3 -4.7 1.7
Travel 15.8 17.7 -1.5 -5.8 -9.3 254,197 -15.1 -9.4 -8.3 -4.2
Trade-related 3.9 2.1 1.9 -3.0 -1.2 280,213 -5.2 -0.8 -0.7 0.9
Other services 9.0 4.7 6.6 6.4 -2.0 252,291 -2.0 -8.8 -0.1 2.6
Imports of services 3.8 2.6 3.0 0.7 1.4 491,103 1.5 0.3 1.8 2.0
Transport 2.3 -1.4 1.5 -5.9 -0.9 133,040 -2.8 -2.3 0.1 1.5
Travel 5.2 5.7 3.7 4.7 4.8 187,290 9.4 1.9 4.5 3.8
Trade-related 1.7 -2.7 2.8 0.1 -0.6 33,552 -3.2 -0.4 -0.5 1.4
Other services 4.6 4.8 3.6 2.7 -0.3 137,221 -2.8 0.9 0.3 0.6
(% change over a year earlier)(% change)
Table 10a : Exports and imports of services by component based on the standardsstipulated in the System of National Accounts 2008 , other than the change of
ownership principle(at current market prices)
2016#
Notes: Individual figures may not add up exactly to the total due to rounding.
(#) Figures are subject to revision later on as more data become available.

173
2012 2013 2014 2015 2016 2016Q1 Q2 Q3 Q4
('000)
All sources 48 615.1 54 298.8 60 838.8 59 307.6 56 654.9 13 735.1 13 425.2 14 558.0 14 936.7
Mainland of China 34 911.4 40 745.3 47 247.7 45 842.4 42 778.1 10 427.9 9 987.8 11 301.2 11 061.3
South and Southeast Asia 3 651.8 3 718.0 3 614.8 3 559.1 3 701.8 828.4 992.4 793.3 1 087.7
Taiwan 2 088.7 2 100.1 2 031.9 2 015.8 2 011.4 484.2 502.8 527.7 496.8
Europe 1 867.7 1 893.7 1 863.3 1 829.4 1 904.9 481.4 451.6 411.1 560.8
United States 1 184.8 1 109.8 1 130.6 1 181.0 1 211.5 279.3 312.3 268.4 351.5
Japan 1 254.6 1 057.0 1 078.8 1 049.3 1 092.3 264.4 235.1 283.8 309.1
Others 3 656.1 3 674.9 3 871.9 3 830.7 3 954.8 969.5 943.3 972.4 1 069.5
(% change over a year earlier)
All sources 16.0 11.7 12.0 -2.5 -4.5 -10.9 -3.5 -3.6 0.4
Mainland of China 24.2 16.7 16.0 -3.0 -6.7 -15.1 -5.4 -5.1 -0.3
South and Southeast Asia -2.6 1.8 -2.8 -1.5 4.0 12.4 5.5 -0.3 0.1
Taiwan -2.8 0.5 -3.2 -0.8 -0.2 3.9 2.4 -2.8 -3.7
Europe 3.7 1.4 -1.6 -1.8 4.1 6.8 3.0 3.6 3.2
United States -2.3 -6.3 1.9 4.5 2.6 1.8 1.1 1.7 5.3
Japan -2.3 -15.7 2.1 -2.7 4.1 6.5 -1.0 1.6 8.8
Others 0.9 0.5 5.4 -1.1 3.2 0.8 1.8 6.4 4.0
Table 11 : Incoming visitors by source
Note: Individual figures may not add up exactly to the total due to rounding.

174
2007 2008 2009 2010 2011 2012 2013
Residential property(a) (in units) 10 471 8 776 7 157 13 405 9 449 10 149 8 254Commercial property 368 390 235 189 197 226 161
of which :Office space 320 341 151 124 155 136 123Other commercial premises(b) 48 49 84 65 42 90 39
Industrial property(c) 16 78 3 21 105 170 85of which :Industrial-cum-office premises 0 4 0 0 0 0 0Conventional flatted factory space 16 70 3 21 32 46 85Storage premises(d) 0 4 0 0 73 123 0
Production of public housing(in units)Rental housing flats(e) 5 667 22 759 19 021 6 385 17 787 9 778 20 898Subsidised sales flats(e) 2 010 2 200 370 1 110 0 0 0
Residential property 900.0 530.0 546.8 570.5 580.6 796.4 816.0Commercial property 327.5 147.7 178.3 158.4 133.6 210.2 309.5Industrial property(f) 103.5 106.6 97.1 34.3 109.3 70.7 138.1Other properties 207.7 212.8 253.2 459.2 232.7 428.9 136.4Total 1 538.6 997.1 1 075.4 1 222.4 1 056.2 1 506.1 1 400.1
Residential property(g) 123 575 95 931 115 092 135 778 84 462 81 333 50 676Primary market 20 123 11 046 16 161 13 646 10 880 12 968 11 046Secondary market 103 452 84 885 98 931 122 132 73 582 68 365 39 630
Selected types of non-residential properties(h)
Office space 4 129 2 845 2 521 3 591 3 071 3 269 1 685Other commerical premises 5 490 4 149 5 359 7 639 5 980 7 282 4 305Flatted factory space 9 072 5 741 5 554 8 206 7 619 9 731 4 271
Table 12 : Property market
Completion of new property by the private sector('000 m2 of internal floor area)
Building plans with consent to commence work in the private sector('000 m2 of usable floor area)
Agreements for sale and purchase of property(Number)
Notes: Individual figures may not add up exactly to the total due to rounding. (a) Figures before 2002 cover all completed residential premises to which either temporary or full
Occupation Permits have been granted, as well as village type houses issued with Letters of Compliance. Property developments subject to a Consent Scheme need a Certificate of Compliance, Consent to Assign or Consent to Lease in addition to an Occupation Permit before the premises can be individually assigned. Village-type housing units are excluded as from 2002 and units issued with temporary Occupation Permits are also excluded as from 2004 onwards.
Residential premises here pertain to private residential units, excluding units built under the Private Sector Participation Scheme (PSPS), Home Ownership Scheme (HOS), Buy or Rent Option, Mortgage Subsidy Scheme, Sandwich Class Housing Scheme, Urban Improvement Scheme (UIS) and Flat-for-Sale Scheme. Figures from 2004 onwards also cover those private flats converted from subsidised flats.
(b) These include retail premises and other premises designed or adapted for commercial use, with the exception of purpose-built offices. Car-parking space and commercial premises built by the Hong Kong Housing Authority and the Hong Kong Housing Society are excluded.
(c) These include industrial-cum-office premises, but exclude specialised factory buildings which are developed mainly for own use.
(d) These include storage premises at the container terminals and the airport.

175
2014 2015 2016 2016Q1 Q2 Q3 Q4
Residential property(a) (in units) 15 719 11 280 14 595 1 803 5 614 3 339 3 839Commercial property 161 233 276 81 83 10 101
of which :Office space 104 164 153 46 55 0 53Other commercial premises(b) 57 69 123 35 29 10 49
Industrial property(c) 116 30 78 73 0 0 5of which :Industrial-cum-office premises 0 0 0 0 0 0 0Conventional flatted factory space 36 30 5 0 0 0 5Storage premises(d) 80 0 73 73 0 0 0
Production of public housing(in units)Rental housing flats(e) 5 634 10 147 N.A. 11 987 187 4 697 N.A.Subsidised sales flats(e) 0 1 326 N.A. 0 0 0 N.A.
Residential property 647.1 893.3 N.A. 211.1 57.2 271.1 N.A.Commercial property 290.3 319.0 N.A. 115.4 79.5 76.9 N.A.Industrial property(f) 105.9 225.3 N.A. 15.1 28.0 16.6 N.A.Other properties 217.1 555.4 N.A. 57.7 42.3 13.3 N.A.Total 1 260.4 1 993.0 N.A. 399.2 207.0 377.9 N.A.
Residential property(g) 63 807 55 982 54 701 6 221 13 700 17 890 16 890Primary market 16 857 16 826 16 793 1 325 4 308 6 244 4 916Secondary market 46 950 39 156 37 908 4 896 9 392 11 646 11 974
Selected types of non-residential properties(h)
Office space 1 271 1 470 1 099 141 258 289 411Other commerical premises 3 092 2 067 1 511 319 270 392 530Flatted factory space 3 016 3 407 2 692 450 587 620 1 035
Table 12 : Property market (Cont'd)
Completion of new property by the private sector('000 m2 of internal floor area)
Building plans with consent to commence work in the private sector('000 m2 of usable floor area)
Agreements for sale and purchase of property(Number)
Notes: (e) The series, sourced from the Housing Authority's housing production figures, exhaustively cover all housing production and to count projects (including surplus HOS projects) which undergo transfer of usage at the time of disposal and according to their actual usage. Moreover, surplus HOS courts and blocks pending disposal are excluded from production statistics until they are disposed. Rental and sales flats projects of the Housing Society are included.
(f) These include multi-purpose industrial premises designed also for office use. (g) The figures are derived from sale and purchase agreements of domestic units received for registration
for the relevant periods. They generally relate to transactions executed up to four weeks prior to their submission for registration. Sales of domestic units refer to sale and purchase agreements with payment of stamp duty. These statistics do not include sales of units under the Home Ownership Scheme, the Private Sector Participation Scheme and the Tenants Purchase Scheme except those after payment of premium. Primary sales generally refer to sales from developers. Secondary sales refer to sales from parties other than developers.
(h) Timing of the figures for non-residential properties is based on the date on which the sale and purchase agreement is signed, which may differ from the date on which the agreement is received for registration.
N.A. Not yet available.
(cont'd)
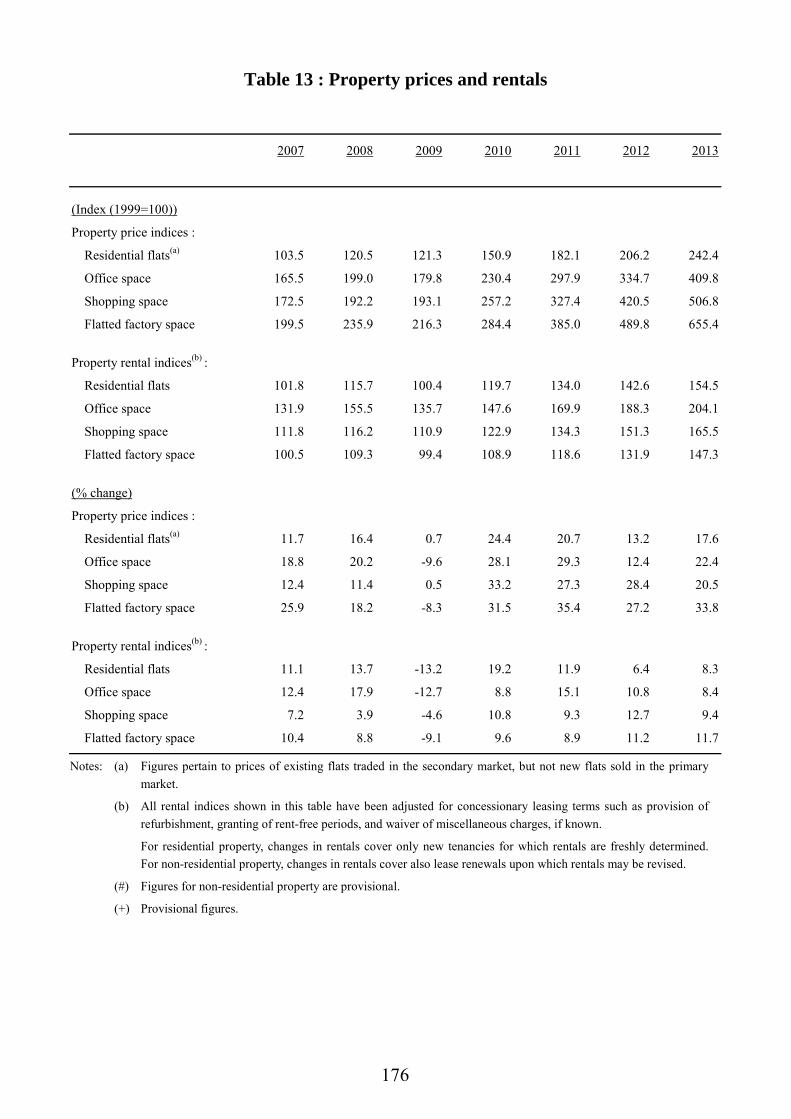
176
2007 2008 2009 2010 2011 2012 2013
(Index (1999=100))
Property price indices :
Residential flats(a) 103.5 120.5 121.3 150.9 182.1 206.2 242.4
Office space 165.5 199.0 179.8 230.4 297.9 334.7 409.8
Shopping space 172.5 192.2 193.1 257.2 327.4 420.5 506.8
Flatted factory space 199.5 235.9 216.3 284.4 385.0 489.8 655.4
Property rental indices(b) :
Residential flats 101.8 115.7 100.4 119.7 134.0 142.6 154.5
Office space 131.9 155.5 135.7 147.6 169.9 188.3 204.1
Shopping space 111.8 116.2 110.9 122.9 134.3 151.3 165.5
Flatted factory space 100.5 109.3 99.4 108.9 118.6 131.9 147.3
(% change)
Property price indices :
Residential flats(a) 11.7 16.4 0.7 24.4 20.7 13.2 17.6
Office space 18.8 20.2 -9.6 28.1 29.3 12.4 22.4
Shopping space 12.4 11.4 0.5 33.2 27.3 28.4 20.5
Flatted factory space 25.9 18.2 -8.3 31.5 35.4 27.2 33.8
Property rental indices(b) :
Residential flats 11.1 13.7 -13.2 19.2 11.9 6.4 8.3
Office space 12.4 17.9 -12.7 8.8 15.1 10.8 8.4
Shopping space 7.2 3.9 -4.6 10.8 9.3 12.7 9.4
Flatted factory space 10.4 8.8 -9.1 9.6 8.9 11.2 11.7
Table 13 : Property prices and rentals
Notes: (a) Figures pertain to prices of existing flats traded in the secondary market, but not new flats sold in the primary market.
(b) All rental indices shown in this table have been adjusted for concessionary leasing terms such as provision of refurbishment, granting of rent-free periods, and waiver of miscellaneous charges, if known.
For residential property, changes in rentals cover only new tenancies for which rentals are freshly determined. For non-residential property, changes in rentals cover also lease renewals upon which rentals may be revised.
(#) Figures for non-residential property are provisional.
(+) Provisional figures.

177
2014 2015 2016 2016Q1 Q2 Q3# Q4+
(Index (1999=100))
Property price indices :
Residential flats(a) 256.9 296.8 286.1 274.7 275.2 288.4 305.9
Office space 423.0 448.9 426.1 437.1 418.3 417.8 431.2
Shopping space 521.2 559.2 526.0 533.5 525.7 512.9 532.0
Flatted factory space 668.0 723.9 691.4 687.0 692.6 681.0 704.8
Property rental indices(b) :
Residential flats 159.5 172.8 168.0 165.4 164.8 169.8 172.1
Office space 213.7 226.7 232.3 230.7 231.7 232.8 233.8
Shopping space 173.1 182.5 178.4 179.3 178.1 177.4 178.6
Flatted factory space 160.1 174.4 181.3 178.4 181.0 181.9 183.7
(% change over a year earlier)
Property price indices :
Residential flats(a) 6.0 15.5 -3.6 -5.0 -8.0 -5.5 4.2
Office space 3.2 6.1 -5.1 0.8 -6.0 -9.1 -5.6
Shopping space 2.8 7.3 -5.9 -3.3 -6.0 -10.2 -4.1
Flatted factory space 1.9 8.4 -4.5 -1.7 -4.2 -8.2 -3.6
Property rental indices(b) :
Residential flats 3.2 8.3 -2.8 -1.8 -4.6 -3.9 -0.8
Office space 4.7 6.1 2.5 4.5 2.5 1.4 1.6
Shopping space 4.6 5.4 -2.2 -0.5 -2.4 -4.1 -2.1
Flatted factory space 8.7 8.9 4.0 5.4 4.5 2.6 3.4
Table 13 : Property prices and rentals (Cont'd)

178
2007 2008 2009 2010 2011 2012 2013
(as at end of period)Hong Kong dollar money supply ($Mn)
M1 454,342 491,115 671,241 730,093 794,726 920,920 1,000,344M2(a) 3,281,017 3,239,857 3,587,717 3,866,788 4,046,216 4,537,384 4,795,130M3(a) 3,300,500 3,261,306 3,604,843 3,878,193 4,055,404 4,545,590 4,806,012
Total money supply ($Mn)M1 616,709 645,833 901,819 1,017,227 1,127,320 1,377,359 1,510,895M2 6,106,348 6,268,058 6,602,310 7,136,271 8,057,530 8,950,005 10,056,437M3 6,139,758 6,300,751 6,626,843 7,156,260 8,081,079 8,970,396 10,085,243
Deposit ($Mn)HK$ 3,075,042 3,033,980 3,373,595 3,617,183 3,740,240 4,176,200 4,390,953Foreign currency 2,793,856 3,024,004 3,007,445 3,245,081 3,851,020 4,120,234 4,789,109Total 5,868,898 6,057,984 6,381,040 6,862,265 7,591,260 8,296,434 9,180,062
Loans and advances ($Mn)HK$ 2,184,705 2,354,755 2,401,323 2,824,445 3,160,002 3,333,059 3,606,018Foreign currency 776,971 930,883 887,160 1,403,281 1,920,659 2,233,751 2,850,795Total 2,961,676 3,285,638 3,288,483 4,227,726 5,080,661 5,566,810 6,456,813
Trade-weighted 106.3 100.7 101.9 99.5 94.6 94.9 94.9Import-weighted 107.6 101.3 102.2 99.2 93.9 94.2 94.7Export-weighted 104.8 100.1 101.6 99.8 95.4 95.6 95.1
(% change)Hong Kong dollar money supply
M1 17.1 8.1 36.7 8.8 8.9 15.9 8.6M2(a) 18.1 -1.3 10.7 7.8 4.6 12.1 5.7M3(a) 18.1 -1.2 10.5 7.6 4.6 12.1 5.7
Total money supplyM1 25.4 4.7 39.6 12.8 10.8 22.2 9.7M2 20.8 2.6 5.3 8.1 12.9 11.1 12.4M3 20.6 2.6 5.2 8.0 12.9 11.0 12.4
DepositHK$ 19.7 -1.3 11.2 7.2 3.4 11.7 5.1Foreign currency 27.6 8.2 -0.5 7.9 18.7 7.0 16.2Total 23.4 3.2 5.3 7.5 10.6 9.3 10.7
Loans and advancesHK$ 13.9 7.8 2.0 17.6 11.9 5.5 8.2Foreign currency 41.2 19.8 -4.7 58.2 36.9 16.3 27.6Total 20.0 10.9 0.1 28.6 20.2 9.6 16.0
Trade-weighted -4.3 -5.3 1.2 -2.4 -4.9 0.3 0.0Import-weighted -4.4 -5.9 0.9 -2.9 -5.3 0.3 0.5Export-weighted -4.4 -4.5 1.5 -1.8 -4.4 0.2 -0.5
Table 14 : Monetary aggregates
Nominal Effective Exchange Rate Indices(Jan 2010 =100)(b)
Nominal Effective Exchange Rate Indices(Jan 2010 =100)(b)
Definition of Terms : The Hong Kong Dollar Money Supply is the Hong Kong dollar component of the respective monetary aggregate.
Total Money Supply: M1: Legal tender notes and coins with the public, plus customers’ demand deposits with licensed banks.
M2: M1 plus customers’ savings and time deposits with licensed banks, plus negotiable certificates of deposit issued by licensed banks and held outside the monetary sector.
M3: M2 plus customers’ deposits with restricted licence banks and deposit-taking companies, plus negotiable certificates of deposit issued by such institutions and held outside the monetary sector.

179
2014 2015 2016 2016Q1 Q2 Q3 Q4
(as at end of period)Hong Kong dollar money supply ($Mn)
M1 1,116,675 1,253,380 1,428,775 1,306,062 1,329,267 1,417,126 1,428,775M2(a) 5,225,773 5,765,549 6,280,156 5,801,800 5,899,348 6,187,842 6,280,156M3(a) 5,236,188 5,778,772 6,292,591 5,814,479 5,911,089 6,200,545 6,292,591
Total money supply ($Mn)M1 1,708,724 1,971,146 2,213,970 2,076,634 2,089,932 2,234,444 2,213,970M2 11,011,372 11,618,441 12,507,980 11,747,635 11,791,318 12,390,203 12,507,980M3 11,048,944 11,655,019 12,551,184 11,783,190 11,828,214 12,431,638 12,551,184
Deposit ($Mn)HK$ 4,800,330 5,312,403 5,808,986 5,353,361 5,450,475 5,733,148 5,808,986Foreign currency 5,272,804 5,437,346 5,918,168 5,617,954 5,597,236 5,894,377 5,918,168Total 10,073,135 10,749,749 11,727,154 10,971,315 11,047,711 11,627,525 11,727,154
Loans and advances ($Mn)HK$ 4,000,361 4,152,589 4,479,107 4,187,120 4,264,170 4,331,398 4,479,107Foreign currency 3,275,910 3,381,951 3,544,283 3,335,255 3,435,335 3,492,673 3,544,283Total 7,276,271 7,534,540 8,023,390 7,522,375 7,699,505 7,824,071 8,023,390
Trade-weighted 96.0 101.3 104.1 104.0 102.8 103.5 106.3Import-weighted 96.0 101.7 104.2 104.4 102.9 103.3 106.2Export-weighted 95.9 100.9 104.1 103.6 102.7 103.8 106.4
(% change over a year earlier)Hong Kong dollar money supply
M1 11.6 12.2 14.0 -0.3 3.2 12.0 14.0M2(a) 9.0 10.3 8.9 3.6 2.2 7.8 8.9M3(a) 9.0 10.4 8.9 3.6 2.1 7.8 8.9
Total money supplyM1 13.1 15.4 12.3 7.0 9.0 10.7 12.3M2 9.5 5.5 7.7 3.5 3.1 8.3 7.7M3 9.6 5.5 7.7 3.6 3.1 8.3 7.7
DepositHK$ 9.3 10.7 9.3 3.8 2.1 8.1 9.3Foreign currency 10.1 3.1 8.8 7.1 7.3 10.1 8.8Total 9.7 6.7 9.1 5.5 4.7 9.1 9.1
Loans and advancesHK$ 10.9 3.8 7.9 -2.3 * 4.2 7.9Foreign currency 14.9 3.2 4.8 -0.2 0.7 2.6 4.8Total 12.7 3.5 6.5 -1.4 0.3 3.5 6.5
Trade-weighted 1.2 5.5 2.8 3.9 2.8 1.5 2.9Import-weighted 1.4 5.9 2.5 4.0 2.7 0.8 2.2Export-weighted 0.8 5.2 3.2 3.9 3.1 2.4 3.6
Table 14 : Monetary aggregates (Cont'd)
Nominal Effective Exchange Rate Indices(Jan 2010 =100)(b)
Nominal Effective Exchange Rate Indices(Jan 2010 =100)(b)
Notes: (a) Adjusted to include foreign currency swap deposits.
(b) Period average.
(*) Change within ±0.05%.

180
Table 15 : Rates of change in business receipts indices forservices industries/domains
(%)
2012 2013 2014 2015 2015 2016
Q4 Q1 Q2 Q3
Services Industry
Import and export trade -1.3 -0.3 0.1 -3.9 -7.3 -10.7 -2.9 0.1
Wholesale 3.2 4.3 1.5 -4.9 -10.5 -7.8 -1.7 3.2
Retail 9.8 11.0 -0.2 -3.7 -6.6 -12.5 -8.2 -7.5
Transportation 0.9 1.4 6.1 -4.3 -7.3 -8.5 -9.0 -6.8within which :Land transport 11.9 8.0 6.9 5.4 8.4 5.9 3.9 4.4Water transport -2.4 -2.9 6.8 -7.7 -15.6 -16.3 -16.1 -12.7Air transport 0.3 2.4 5.3 -5.1 -6.9 -8.2 -8.7 -6.9
Warehousing and storage 25.2 8.2 11.9 12.7 13.4 14.8 16.3 10.6
Courier 16.1 26.1 5.4 -5.9 -8.9 -3.1 6.8 12.6
Accommodation services(a) 13.8 5.6 6.5 -6.6 -0.3 -4.6 -0.5 -0.5
Food services 5.0 3.5 3.5 3.9 3.6 1.9 3.0 2.6
Information and communications 9.3 6.0 5.9 10.8 9.0 6.9 6.5 -3.7within which :Telecommunications 14.7 8.0 10.7 19.6 14.4 8.6 7.5 -6.4Film entertainment 1.9 -4.3 -11.7 -3.1 -5.0 3.0 -8.4 -5.2
Banking 9.4 16.8 5.9 8.3 -2.0 -9.6 28.1 3.9
Financing (except banking) 1.6 2.6 6.7 19.0 6.5 -10.7 -15.6 5.1within which :Financial markets and asset management 1.7 1.0 8.9 19.0 3.8 -12.5 -18.6 0.8
within which : Asset management -5.4 14.9 11.0 7.0 -2.1 * 2.1 8.7
Insurance 13.6 15.1 18.2 11.7 12.2 10.5 21.7 29.9
Real estate 11.8 0.1 17.0 8.1 0.1 6.9 10.9 21.3
Professional, scientific and technical services -0.5 7.2 7.6 5.3 4.3 2.1 3.8 2.7
Administrative and support services 8.2 9.5 7.3 7.4 8.4 2.9 0.5 0.1
Services Domain
Tourism, convention and exhibition services 15.1 17.8 -0.9 -5.0 -7.1 -13.3+ -8.1+ -6.6+
Computer and information technology services 15.1 2.1 -1.8 -4.2 -1.9 -4.7 -5.7 -4.4
Notes: Upon the implementation of the new HSIC Version 2.0 by the C&SD in October 2008, the new classification has been adopted in compiling the quarterly business receipts indices. Starting from the first quarter of 2009, all business receipts indices are compiled based on the HSIC Version 2.0, and the base period of the indices has been changed to 2008 (i.e. with the quarterly average of the indices in 2008 taken as 100). The series of business receipts indices under the HSIC Version 2.0 has also been backcasted to the first quarter of 2005.
(a) Accommodation services covers hotels, guesthouses, boarding houses and other establishments providing short term accommodation.
(+) Provisional figures.
(*) Change within ±0.05%.

181
2012 2013 2014 2015 2016+ 2016
Q1 Q2 Q3 Q4
(%)Labour force participation rate 60.5 61.2 61.1 61.2 61.2 61.4 61.2 61.2 60.9
Seasonally adjusted unemployment rate(a) 3.3 3.4 3.3 3.3 3.4 3.4 3.4 3.4 3.3
Underemployment rate 1.5 1.5 1.5 1.4 1.4 1.4 1.4 1.4 1.4
('000)Population of working age 6 253.4 6 304.6 6 349.2 6 392.2 6 448.4 6 421.4 6 444.7 6 458.0 6 469.4
Labour force 3 785.2 3 858.8 3 876.4 3 909.8 3 944.6 3 942.2 3 943.2 3 954.0 3 939.1
Persons employed 3 660.7 3 728.0 3 749.2 3 780.9 3 812.4 3 811.8 3 807.1 3 813.4 3 817.0
Persons unemployed 124.5 130.8 127.2 128.9 132.3 130.4 136.1 140.6 122.0
Persons underemployed 57.6 58.2 56.5 53.0 54.3 53.4 54.1 55.3 54.4
(% change over a year earlier)Population of working age 1.4 0.8 0.7 0.7 0.9 0.6 0.9 0.8 0.8
Labour force 2.2 1.9 0.5 0.9 0.9 0.6 1.1 1.0 0.7
Persons employed 2.4 1.8 0.6 0.8 0.8 0.5 0.9 0.9 0.7
Persons unemployed -1.8 5.1 -2.7 1.3 2.6 3.3 5.4 2.6 -1.0
Persons underemployed -9.0 1.1 -3.0 -6.1 2.4 -0.2 -2.0 4.7 2.7
Table 16 : Labour force characteristics
Notes: (a) Seasonal adjustment is not applicable to annual unemployment rates. (+) Provisional figures.
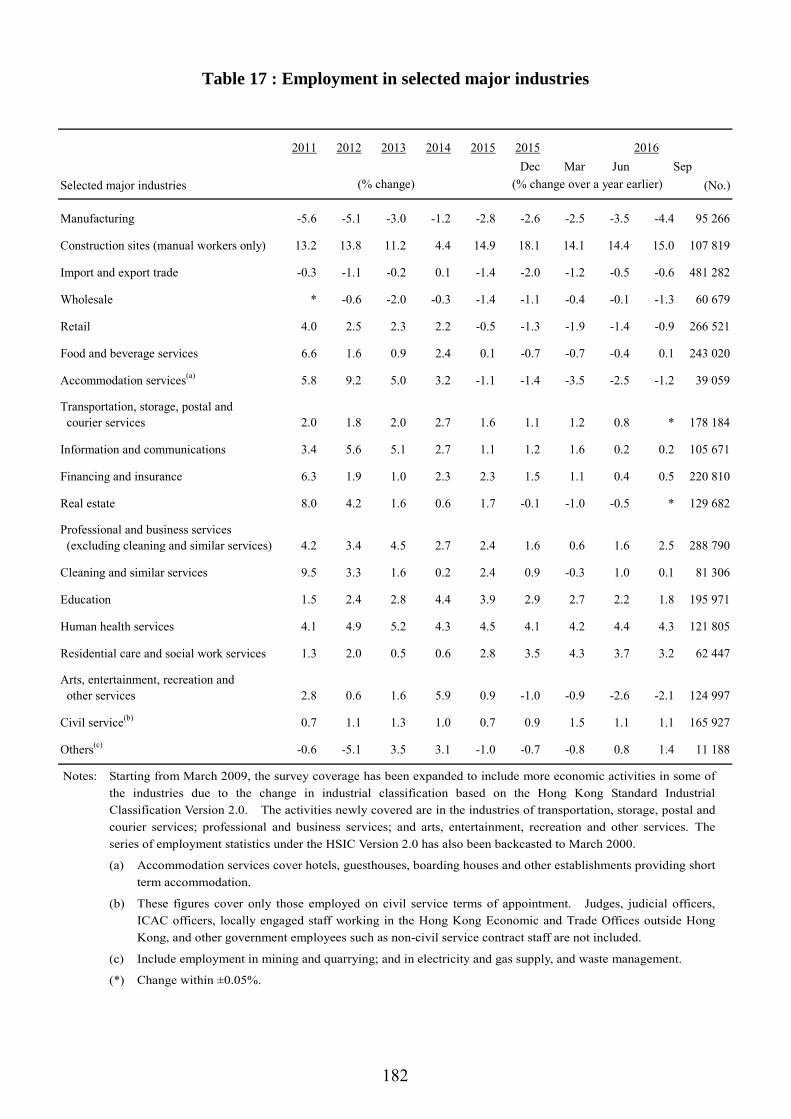
182
2011 2012 2013 2014 2015 2015Dec Mar Jun
Selected major industries (No.)
Manufacturing -5.6 -5.1 -3.0 -1.2 -2.8 -2.6 -2.5 -3.5 -4.4 95 266
Construction sites (manual workers only) 13.2 13.8 11.2 4.4 14.9 18.1 14.1 14.4 15.0 107 819
Import and export trade -0.3 -1.1 -0.2 0.1 -1.4 -2.0 -1.2 -0.5 -0.6 481 282
Wholesale * -0.6 -2.0 -0.3 -1.4 -1.1 -0.4 -0.1 -1.3 60 679
Retail 4.0 2.5 2.3 2.2 -0.5 -1.3 -1.9 -1.4 -0.9 266 521
Food and beverage services 6.6 1.6 0.9 2.4 0.1 -0.7 -0.7 -0.4 0.1 243 020
Accommodation services(a) 5.8 9.2 5.0 3.2 -1.1 -1.4 -3.5 -2.5 -1.2 39 059
Transportation, storage, postal and courier services 2.0 1.8 2.0 2.7 1.6 1.1 1.2 0.8 * 178 184
Information and communications 3.4 5.6 5.1 2.7 1.1 1.2 1.6 0.2 0.2 105 671
Financing and insurance 6.3 1.9 1.0 2.3 2.3 1.5 1.1 0.4 0.5 220 810
Real estate 8.0 4.2 1.6 0.6 1.7 -0.1 -1.0 -0.5 * 129 682
Professional and business services (excluding cleaning and similar services) 4.2 3.4 4.5 2.7 2.4 1.6 0.6 1.6 2.5 288 790
Cleaning and similar services 9.5 3.3 1.6 0.2 2.4 0.9 -0.3 1.0 0.1 81 306
Education 1.5 2.4 2.8 4.4 3.9 2.9 2.7 2.2 1.8 195 971
Human health services 4.1 4.9 5.2 4.3 4.5 4.1 4.2 4.4 4.3 121 805
Residential care and social work services 1.3 2.0 0.5 0.6 2.8 3.5 4.3 3.7 3.2 62 447
Arts, entertainment, recreation and other services 2.8 0.6 1.6 5.9 0.9 -1.0 -0.9 -2.6 -2.1 124 997
Civil service(b) 0.7 1.1 1.3 1.0 0.7 0.9 1.5 1.1 1.1 165 927
Others(c) -0.6 -5.1 3.5 3.1 -1.0 -0.7 -0.8 0.8 1.4 11 188
2016
Table 17 : Employment in selected major industries
(% change over a year earlier)Sep
(% change)
Notes: Starting from March 2009, the survey coverage has been expanded to include more economic activities in some of the industries due to the change in industrial classification based on the Hong Kong Standard Industrial Classification Version 2.0. The activities newly covered are in the industries of transportation, storage, postal and courier services; professional and business services; and arts, entertainment, recreation and other services. The series of employment statistics under the HSIC Version 2.0 has also been backcasted to March 2000.
(a) Accommodation services cover hotels, guesthouses, boarding houses and other establishments providing short term accommodation.
(b) These figures cover only those employed on civil service terms of appointment. Judges, judicial officers, ICAC officers, locally engaged staff working in the Hong Kong Economic and Trade Offices outside Hong Kong, and other government employees such as non-civil service contract staff are not included.
(c) Include employment in mining and quarrying; and in electricity and gas supply, and waste management.
(*) Change within ±0.05%.
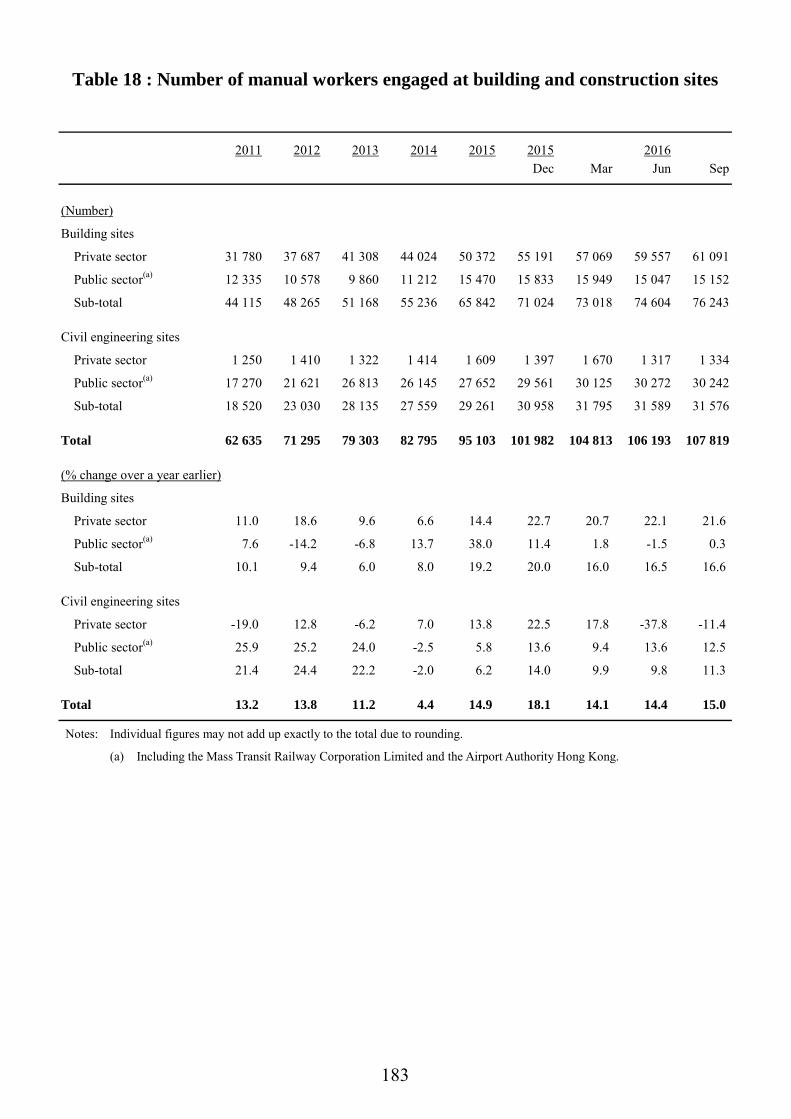
183
2011 2012 2013 2014 2015 2015 2016Dec Mar Jun Sep
(Number)
Building sites
Private sector 31 780 37 687 41 308 44 024 50 372 55 191 57 069 59 557 61 091
Public sector(a) 12 335 10 578 9 860 11 212 15 470 15 833 15 949 15 047 15 152
Sub-total 44 115 48 265 51 168 55 236 65 842 71 024 73 018 74 604 76 243
Civil engineering sites
Private sector 1 250 1 410 1 322 1 414 1 609 1 397 1 670 1 317 1 334
Public sector(a) 17 270 21 621 26 813 26 145 27 652 29 561 30 125 30 272 30 242
Sub-total 18 520 23 030 28 135 27 559 29 261 30 958 31 795 31 589 31 576
Total 62 635 71 295 79 303 82 795 95 103 101 982 104 813 106 193 107 819
(% change over a year earlier)
Building sites
Private sector 11.0 18.6 9.6 6.6 14.4 22.7 20.7 22.1 21.6
Public sector(a) 7.6 -14.2 -6.8 13.7 38.0 11.4 1.8 -1.5 0.3
Sub-total 10.1 9.4 6.0 8.0 19.2 20.0 16.0 16.5 16.6
Civil engineering sites
Private sector -19.0 12.8 -6.2 7.0 13.8 22.5 17.8 -37.8 -11.4
Public sector(a) 25.9 25.2 24.0 -2.5 5.8 13.6 9.4 13.6 12.5
Sub-total 21.4 24.4 22.2 -2.0 6.2 14.0 9.9 9.8 11.3
Total 13.2 13.8 11.2 4.4 14.9 18.1 14.1 14.4 15.0
Table 18 : Number of manual workers engaged at building and construction sites
Notes: Individual figures may not add up exactly to the total due to rounding.
(a) Including the Mass Transit Railway Corporation Limited and the Airport Authority Hong Kong.

184
(%)
2011 2012 2013 2014 2015 2015 2016
Selected industry section Q4 Q1 Q2 Q3
(in nominal terms)Manufacturing 7.7 8.2 3.3 5.3 5.2 4.2 3.9 4.0 3.9Import/export and wholesale trade 12.8 4.6 3.3 2.8 3.7 2.9 2.6 2.3 1.9Retail trade 12.0 10.1 6.7 4.2 3.5 3.3 2.0 2.2 2.8Transportation, storage, postal and courier services 4.1 1.2 5.4 3.3 4.3 3.9 3.8 3.6 2.4Accommodation(a) and food service activities 9.5 6.2 6.7 5.2 5.8 5.9 5.0 5.1 5.2Information and communications 7.5 8.2 5.4 5.1 4.4 2.4 3.2 3.0 3.6Financial and insurance activities 12.4 4.7 4.6 6.3 4.0 3.5 2.5 3.0 2.9Real estate activities 10.8 7.7 5.9 4.7 5.1 5.1 4.0 4.1 4.5Professional and business services 2.1 4.7 7.1 6.9 5.8 6.4 5.8 5.0 4.8Social and personal services 3.2 7.6 3.6 1.6 6.7 5.1 -1.2 3.7 4.1All selected industry sections surveyed 7.8 6.5 5.4 4.3 4.6 4.3 3.2 4.2 4.1
(in real terms)Manufacturing 2.1 3.9 -0.9 0.9 2.1 1.9 1.1 1.4 0.7Import/export and wholesale trade 7.2 0.5 -1.0 -1.5 0.7 0.6 -0.2 -0.3 -1.2Retail trade 6.3 5.7 2.3 -0.1 0.5 0.9 -0.8 -0.3 -0.3Transportation, storage, postal and courier services -1.2 -2.7 1.0 -1.0 1.3 1.5 1.0 1.0 -0.7Accommodation(a) and food service activities 4.0 2.0 2.3 0.8 2.7 3.5 2.1 2.5 2.0Information and communications 2.2 4.0 1.0 0.7 1.4 0.1 0.3 0.4 0.5Financial and insurance activities 7.0 0.5 0.4 1.9 0.7 1.1 -0.3 0.4 -0.2Real estate activities 5.2 3.6 1.4 0.2 2.0 2.7 1.1 1.4 1.3Professional and business services -3.1 0.7 2.6 2.3 2.8 4.0 2.9 2.4 1.6Social and personal services -2.1 3.6 -0.8 -2.7 3.6 2.7 -3.9 1.1 0.9All selected industry sections surveyed 2.4 2.3 1.1 -0.1 1.5 1.9 0.4 1.5 1.0
Table 19 : Rates of change in indices of payroll per person engagedby selected industry section
Notes: The rates of change in real terms are compiled from the Real Indices of Payroll per Person Engaged. The Indices are derived by deflating the Nominal Indices of Payroll per Person Engaged by the 2014/15-based Composite CPI.
In addition to wages, which include all regular and guaranteed payments like basic pay and stipulated bonuses and allowances, payroll also covers overtime pay and other non-guaranteed or irregular bonuses and allowances, except severance pay and long service payment. Because of this difference, as well as the difference in industrial and occupational coverage, the movements in payroll per person engaged, do not necessarily match closely with those in wage rates.
(a) Accommodation services cover hotels, guesthouses, boarding houses and other establishments providing short term accommodation.
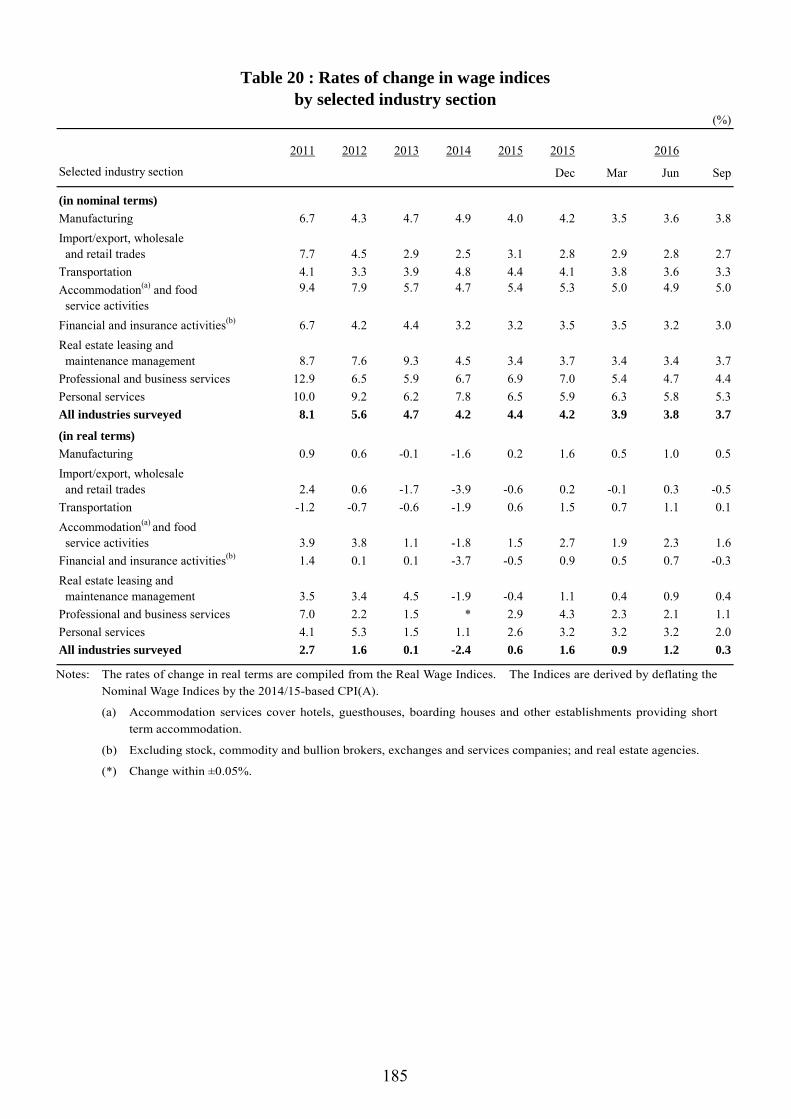
185
(%)
2011 2012 2013 2014 2015 2015 2016
Dec Mar Jun Sep
(in nominal terms)Manufacturing 6.7 4.3 4.7 4.9 4.0 4.2 3.5 3.6 3.8Import/export, wholesale and retail trades 7.7 4.5 2.9 2.5 3.1 2.8 2.9 2.8 2.7Transportation 4.1 3.3 3.9 4.8 4.4 4.1 3.8 3.6 3.3Accommodation(a) and food service activities
9.4 7.9 5.7 4.7 5.4 5.3 5.0 4.9 5.0
Financial and insurance activities(b) 6.7 4.2 4.4 3.2 3.2 3.5 3.5 3.2 3.0Real estate leasing and maintenance management 8.7 7.6 9.3 4.5 3.4 3.7 3.4 3.4 3.7Professional and business services 12.9 6.5 5.9 6.7 6.9 7.0 5.4 4.7 4.4Personal services 10.0 9.2 6.2 7.8 6.5 5.9 6.3 5.8 5.3All industries surveyed 8.1 5.6 4.7 4.2 4.4 4.2 3.9 3.8 3.7
(in real terms)Manufacturing 0.9 0.6 -0.1 -1.6 0.2 1.6 0.5 1.0 0.5Import/export, wholesale and retail trades 2.4 0.6 -1.7 -3.9 -0.6 0.2 -0.1 0.3 -0.5Transportation -1.2 -0.7 -0.6 -1.9 0.6 1.5 0.7 1.1 0.1Accommodation(a) and food service activities 3.9 3.8 1.1 -1.8 1.5 2.7 1.9 2.3 1.6Financial and insurance activities(b) 1.4 0.1 0.1 -3.7 -0.5 0.9 0.5 0.7 -0.3Real estate leasing and maintenance management 3.5 3.4 4.5 -1.9 -0.4 1.1 0.4 0.9 0.4Professional and business services 7.0 2.2 1.5 * 2.9 4.3 2.3 2.1 1.1Personal services 4.1 5.3 1.5 1.1 2.6 3.2 3.2 3.2 2.0All industries surveyed 2.7 1.6 0.1 -2.4 0.6 1.6 0.9 1.2 0.3
Table 20 : Rates of change in wage indicesby selected industry section
Selected industry section
Notes: The rates of change in real terms are compiled from the Real Wage Indices. The Indices are derived by deflating the Nominal Wage Indices by the 2014/15-based CPI(A).
(a) Accommodation services cover hotels, guesthouses, boarding houses and other establishments providing short term accommodation.
(b) Excluding stock, commodity and bullion brokers, exchanges and services companies; and real estate agencies.
(*) Change within ±0.05%.

186
(HK$)
25thpercentile
50thpercentile
75thpercentile
25thpercentile
50thpercentile
75thpercentile
Manufacturing(a) 11,600 14,300 21,600 12,100 14,900 22,300Electricity and gas supply; sewerage, waste management and remediation activities 18,000 24,500 37,500 18,800 25,000 39,500Construction 14,500 18,300 23,300 15,700 20,000 24,700Import and export trade 11,500 16,000 24,800 12,000 16,500 25,500Wholesale 10,100 13,000 18,000 10,300 13,300 18,000Retail trade 9,000 11,500 15,400 9,500 12,000 16,100 within which: Supermarkets and convenience stores 5,900 10,100 12,200 6,300 10,300 12,700 Other retail stores 9,300 11,600 16,000 9,700 12,200 16,700Land transport 12,200 16,000 23,800 13,000 16,800 24,500Other transportation, storage, postal and courier services(b) 11,800 15,400 21,000 12,300 16,200 21,600Restaurants 8,200 10,500 14,000 9,000 11,100 15,000 within which: Hong Kong style tea cafes 8,700 10,200 13,500 9,400 11,000 14,400 Chinese restaurants 9,700 11,900 16,000 10,500 12,600 17,000 Restaurants, other than Chinese 9,200 11,000 14,300 9,900 11,700 15,100 Fast food cafes(c) 3,600 7,800 10,100 3,900 8,300 10,800Accommodation(d) and other food service activities 10,900 13,600 17,200 11,000 13,800 18,000Information and communications 13,300 19,400 30,000 13,600 20,000 30,500Financing and insurance 15,200 23,800 40,300 16,000 25,100 42,500Real estate activities(e) 12,000 19,000 28,000 12,500 20,000 29,800Estate management, security and cleaning services 8,000 10,000 12,400 8,500 10,600 13,200 within which: Real estate maintenance management 9,700 11,100 13,700 10,600 11,900 14,500 Security services(f) 8,900 10,500 12,300 9,800 11,400 13,400 Cleaning services 6,500 7,800 8,900 7,100 8,300 9,300 Membership organisations(g) 7,800 11,000 17,600 8,500 11,800 18,300Professional, scientific and technical services 12,600 20,000 30,600 13,400 20,500 32,000Administrative and support services activities 10,600 14,500 22,600 11,100 15,100 23,500Travel agency, reservation service and related activities 10,400 12,600 18,000 10,800 13,100 18,600Education and public administration (excluding the Government) 12,300 24,500 43,100 13,000 25,400 45,400Human health activities; and beauty and body prettifying treatment 12,000 16,400 41,300 12,200 16,700 36,200Miscellaneous activities 8,800 10,200 13,500 9,300 11,000 14,500 within which: Elderly homes 9,800 11,400 14,000 10,300 12,000 14,600 Laundry and dry cleaning services 7,300 9,800 12,300 7,800 10,400 13,700 Hairdressing and other personal services 8,500 10,000 13,000 9,000 10,500 14,000 Local courier services 7,100 8,600 12,000 7,600 9,200 13,000 Food processing and production 8,300 10,500 15,000 8,900 11,000 15,900Other activities not classified above 10,100 13,600 21,300 10,400 14,000 21,600
All industry sections above 10,500 14,800 23,000 11,000 15,500 24,400
Table 21 : Monthly wage level and distribution analysedby industry section : all employees
Industry Section
May – Jun 2014 May – Jun 2015
Notes: Monthly wages are rounded to the nearest hundred of Hong Kong dollar. (a) Excluding food processing and production. (b) Excluding local courier services. (c) Including takeaway shops. (d) Accommodation services cover hotels, guesthouses, boarding houses and other establishments providing short
term accommodation. (e) Excluding real estate maintenance management. (f) Including investigation activities and services to buildings and landscape care activities. (g) Including incorporated owners/tenants committees, kaifong welfare associations, etc.

187
(HK$)
25thpercentile
50thpercentile
75thpercentile
25thpercentile
50thpercentile
75thpercentile
Manufacturing(a) 45.2 58.4 88.0 46.9 60.7 90.0Electricity and gas supply; sewerage, waste management and remediation activities 65.5 90.0 136.0 69.2 96.6 146.1Construction 60.2 76.2 96.3 65.1 83.0 103.0Import and export trade 49.8 68.5 104.7 51.1 70.4 108.0Wholesale 42.7 53.8 71.8 45.3 57.4 76.6Retail trade 36.1 44.0 57.8 37.8 45.3 60.5 within which: Supermarkets and convenience stores 34.5 37.1 43.5 35.8 39.1 45.5 Other retail stores 37.1 45.4 60.8 38.5 46.7 62.5Land transport 46.6 67.0 105.1 49.5 70.6 108.9Other transportation, storage, postal and courier services(b) 44.3 58.1 79.1 45.5 59.4 81.0Restaurants 35.0 39.9 50.9 38.0 42.3 53.8 within which: Hong Kong style tea cafes 35.9 39.9 50.0 38.7 42.3 52.5 Chinese restaurants 36.0 42.0 57.0 38.6 44.4 60.5 Restaurants, other than Chinese 37.3 42.5 53.0 39.4 45.1 55.6 Fast food cafes(c) 33.0 35.3 39.8 35.8 38.1 42.1Accommodation(d) and other food service activities 39.3 48.3 63.3 40.2 49.5 64.9Information and communications 53.2 77.2 118.5 54.9 78.6 121.0Financing and insurance 60.7 93.0 169.4 63.9 98.5 167.6Real estate activities(e) 53.5 75.0 122.6 56.8 79.9 128.4Estate management, security and cleaning services 32.0 35.4 46.8 34.0 38.1 49.3 within which: Real estate maintenance management 32.0 35.7 51.8 34.0 37.7 54.4 Security services(f) 32.0 34.6 42.0 34.5 37.5 45.1 Cleaning services 31.0 34.4 39.4 33.6 37.4 42.2 Membership organisations(g) 33.0 44.2 73.8 36.3 48.4 75.3Professional, scientific and technical services 53.4 77.8 130.7 56.5 83.1 137.8Administrative and support services activities 41.0 59.2 92.6 43.0 62.1 96.4Travel agency, reservation service and related activities 40.8 54.3 74.1 43.4 57.7 78.7Education and public administration (excluding the Government) 60.3 114.7 194.3 60.9 119.5 200.0Human health activities; and beauty and body prettifying treatment 54.0 75.8 177.5 55.3 78.2 145.2Miscellaneous activities 35.8 42.1 56.7 37.5 43.8 58.8 within which: Elderly homes 33.1 41.0 56.0 35.6 43.5 58.0 Laundry and dry cleaning services 34.0 39.2 49.4 37.0 42.9 54.1 Hairdressing and other personal services 38.0 42.6 56.7 39.6 45.1 60.7 Local courier services 34.0 41.6 49.7 37.0 44.1 54.0 Food processing and production 35.0 41.1 58.5 37.4 42.8 60.0Other activities not classified above 43.4 55.4 86.5 45.2 57.8 90.4
All industry sections above 42.0 60.0 94.7 44.2 62.9 100.0
Table 22 : Hourly wage level and distribution analysedby industry section : all employees
Industry Section
May – Jun 2014 May – Jun 2015
Notes: Hourly wages are rounded to the nearest ten cents of Hong Kong dollar. (a) Excluding food processing and production. (b) Excluding local courier services. (c) Including takeaway shops. (d) Accommodation services cover hotels, guesthouses, boarding houses and other establishments providing short
term accommodation. (e) Excluding real estate maintenance management. (f) Including investigation activities and services to buildings and landscape care activities. (g) Including incorporated owners/tenants committees, kaifong welfare associations, etc.
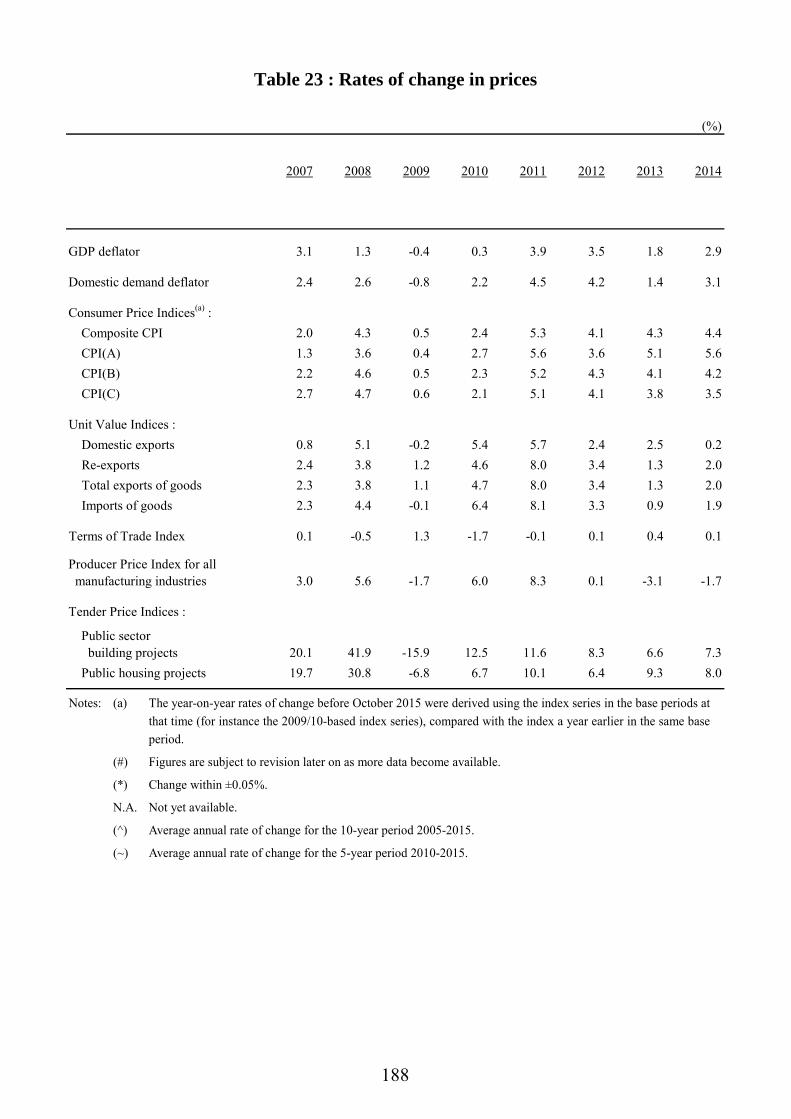
188
(%)
2007 2008 2009 2010 2011 2012 2013 2014
GDP deflator 3.1 1.3 -0.4 0.3 3.9 3.5 1.8 2.9
Domestic demand deflator 2.4 2.6 -0.8 2.2 4.5 4.2 1.4 3.1
Consumer Price Indices(a) :Composite CPI 2.0 4.3 0.5 2.4 5.3 4.1 4.3 4.4CPI(A) 1.3 3.6 0.4 2.7 5.6 3.6 5.1 5.6CPI(B) 2.2 4.6 0.5 2.3 5.2 4.3 4.1 4.2CPI(C) 2.7 4.7 0.6 2.1 5.1 4.1 3.8 3.5
Unit Value Indices :Domestic exports 0.8 5.1 -0.2 5.4 5.7 2.4 2.5 0.2Re-exports 2.4 3.8 1.2 4.6 8.0 3.4 1.3 2.0Total exports of goods 2.3 3.8 1.1 4.7 8.0 3.4 1.3 2.0Imports of goods 2.3 4.4 -0.1 6.4 8.1 3.3 0.9 1.9
Terms of Trade Index 0.1 -0.5 1.3 -1.7 -0.1 0.1 0.4 0.1
Producer Price Index for all manufacturing industries 3.0 5.6 -1.7 6.0 8.3 0.1 -3.1 -1.7
Tender Price Indices :
Public sector building projects 20.1 41.9 -15.9 12.5 11.6 8.3 6.6 7.3Public housing projects 19.7 30.8 -6.8 6.7 10.1 6.4 9.3 8.0
Table 23 : Rates of change in prices
Notes: (a) The year-on-year rates of change before October 2015 were derived using the index series in the base periods at that time (for instance the 2009/10-based index series), compared with the index a year earlier in the same base period.
(#) Figures are subject to revision later on as more data become available.
(*) Change within ±0.05%.
N.A. Not yet available.
(^) Average annual rate of change for the 10-year period 2005-2015.
(~) Average annual rate of change for the 5-year period 2010-2015.
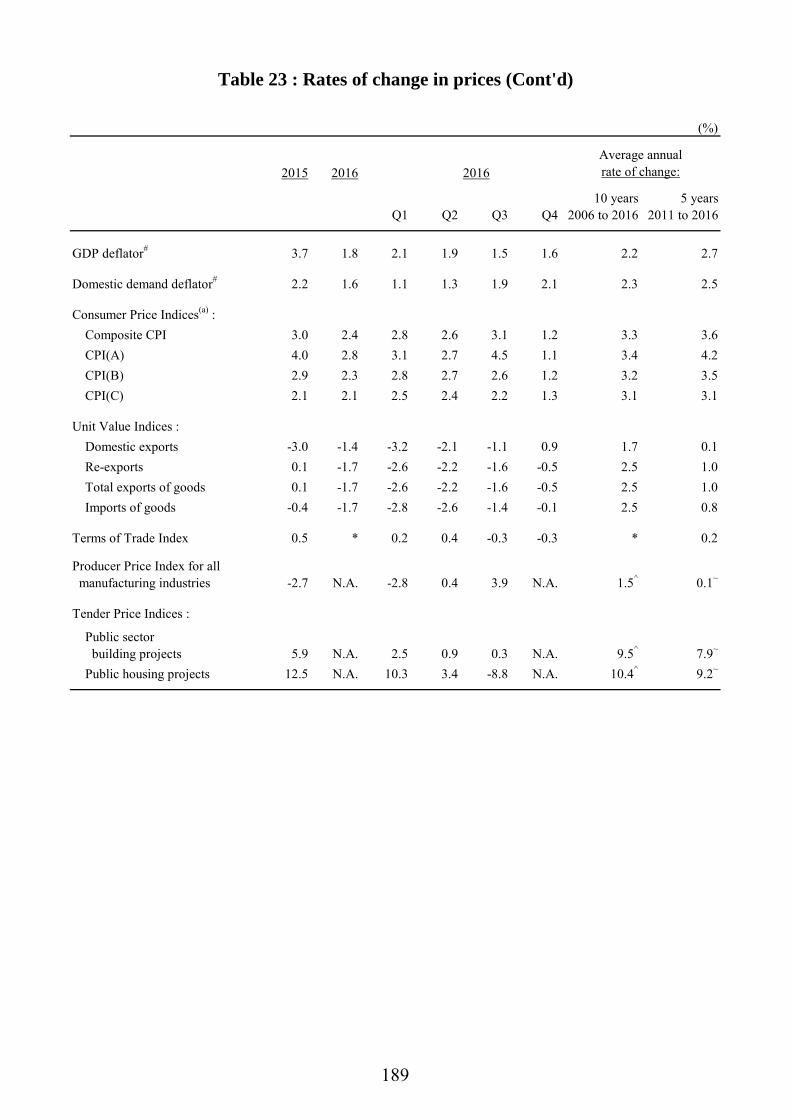
189
(%)
2015 2016 2016
Q1 Q2 Q3 Q410 years
2006 to 20165 years
2011 to 2016
GDP deflator# 3.7 1.8 2.1 1.9 1.5 1.6 2.2 2.7
Domestic demand deflator# 2.2 1.6 1.1 1.3 1.9 2.1 2.3 2.5
Consumer Price Indices(a) :Composite CPI 3.0 2.4 2.8 2.6 3.1 1.2 3.3 3.6CPI(A) 4.0 2.8 3.1 2.7 4.5 1.1 3.4 4.2CPI(B) 2.9 2.3 2.8 2.7 2.6 1.2 3.2 3.5CPI(C) 2.1 2.1 2.5 2.4 2.2 1.3 3.1 3.1
Unit Value Indices :Domestic exports -3.0 -1.4 -3.2 -2.1 -1.1 0.9 1.7 0.1Re-exports 0.1 -1.7 -2.6 -2.2 -1.6 -0.5 2.5 1.0Total exports of goods 0.1 -1.7 -2.6 -2.2 -1.6 -0.5 2.5 1.0Imports of goods -0.4 -1.7 -2.8 -2.6 -1.4 -0.1 2.5 0.8
Terms of Trade Index 0.5 * 0.2 0.4 -0.3 -0.3 * 0.2
Producer Price Index for all manufacturing industries -2.7 N.A. -2.8 0.4 3.9 N.A. 1.5^ 0.1~
Tender Price Indices :
Public sector building projects 5.9 N.A. 2.5 0.9 0.3 N.A. 9.5^ 7.9~
Public housing projects 12.5 N.A. 10.3 3.4 -8.8 N.A. 10.4^ 9.2~
Average annualrate of change:
Table 23 : Rates of change in prices (Cont'd)

190
(%)
Weight 2007 2008 2009 2010 2011 2012 2013
All items 100.00 2.0 4.3 0.5 2.4 5.3 4.1 4.3(2.8) (5.6) (1.0) (1.7) (5.3) (4.7) (4.0)
Food 27.29 4.3 10.1 1.3 2.4 7.0 5.8 4.4
Meals bought away from home 17.74 2.5 5.9 1.6 1.7 5.2 5.4 4.4Food, excluding meals bought away from home 9.55 7.1 16.8 0.9 3.5 9.9 6.5 4.4
Housing(a) 34.29 2.0 4.1 3.7 0.4 7.2 5.6 6.7
Private housing rent 29.92 4.0 6.8 3.6 0.9 7.2 6.8 6.3
Public housing rent 1.94 -17.7 -27.2 9.5 -7.8 11.9 -7.1 16.0
Electricity, gas and water 2.67 -0.7 -6.5 -25.3 43.3 -4.2 -8.2 6.9
Alcoholic drinks and tobacco 0.54 -1.2 0.1 18.7 3.4 17.1 3.0 1.5
Clothing and footwear 3.21 4.1 0.8 2.7 1.8 6.8 3.1 1.7
Durable goods 4.65 -4.7 -2.0 -3.0 -2.7 -3.8 -1.4 -4.3
Miscellaneous goods 3.56 2.5 5.0 2.3 2.4 3.8 2.2 2.2
Transport 7.98 -0.1 2.5 -0.9 2.0 4.4 3.0 2.3
Miscellaneous services 15.81 1.7 0.8 -2.1 2.0 3.5 2.8 3.7
Table 24 : Rates of change in Composite Consumer Price Index
Notes: The year-on-year rates of change before October 2015 were derived using the index series in the base periods at that time (for instance the 2009/10-based index series), compared with the index a year earlier in the same base period. The weights quoted in this table correspond to that in the 2014/15-based index series.
Figures in brackets represent the underlying rate of change after netting out the effects of Government's one-off relief measures.
(a) Apart from "Private housing rent" and "Public housing rent", the "Housing" section also includes "Management fees and other housing charges" and "Materials for house maintenance".
(*) Change within ±0.05%.

191
(%)
Weight 2014 2015 2016 2016
Q1 Q2 Q3 Q4
10 years2006 to
2016
5 years2011 to
2016
All items 100.00 4.4 3.0 2.4 2.8 2.6 3.1 1.2 3.3 3.6(3.5) (2.5) (2.3) (2.8) (2.3) (2.1) (2.1) (3.3) (3.3)
Food 27.29 4.1 4.0 3.4 4.6 3.2 2.8 3.0 4.6 4.3
Meals bought away from home 17.74 4.6 4.2 3.3 3.7 3.3 3.1 3.1 3.9 4.4Food, excluding meals bought away from home 9.55 3.4 3.4 3.6 6.3 3.1 2.1 2.7 5.9 4.3
Housing(a) 34.29 6.7 5.1 3.7 4.0 4.6 6.0 0.4 4.5 5.6
Private housing rent 29.92 6.0 4.7 3.4 4.2 4.8 4.1 0.6 4.9 5.4
Public housing rent 1.94 18.3 10.9 7.2 * 0.5 51.3 -5.6 0.3 8.7
Electricity, gas and water 2.67 14.9 8.4 1.0 * -1.1 4.1 1.4 1.6 4.3
Alcoholic drinks and tobacco 0.54 6.5 1.3 1.5 0.3 1.2 2.4 2.1 5.0 2.7
Clothing and footwear 3.21 0.9 -1.8 -3.4 -3.3 -2.8 -4.5 -3.0 1.6 0.1
Durable goods 4.65 -3.4 -5.6 -5.4 -5.7 -5.4 -5.3 -5.0 -3.6 -4.0
Miscellaneous goods 3.56 2.3 0.9 1.5 0.5 1.3 2.3 2.1 2.5 1.8
Transport 7.98 2.0 -0.3 1.6 1.2 1.5 1.4 2.1 1.6 1.7
Miscellaneous services 15.81 3.0 1.1 2.3 2.7 2.1 2.5 1.9 1.9 2.6
Table 24 : Rates of change in Composite Consumer Price Index (Cont'd)
Average annualrate of change:
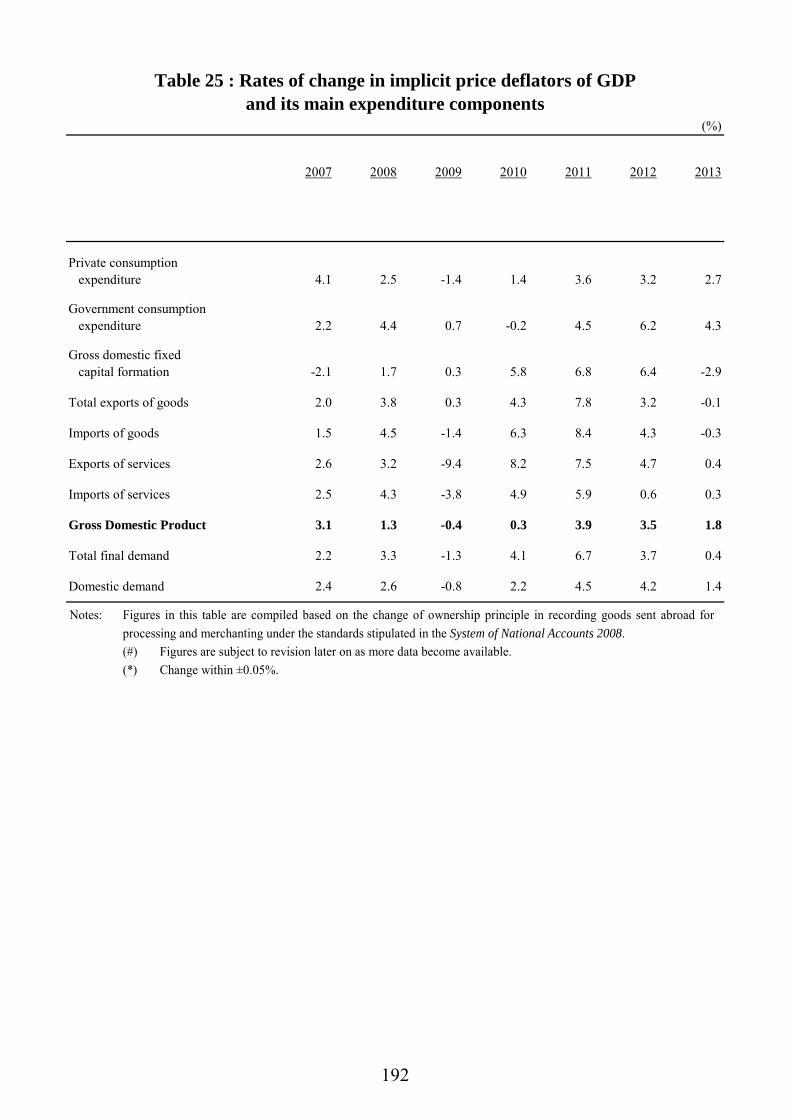
192
(%)
2007 2008 2009 2010 2011 2012 2013
Private consumption expenditure 4.1 2.5 -1.4 1.4 3.6 3.2 2.7
Government consumption expenditure 2.2 4.4 0.7 -0.2 4.5 6.2 4.3
Gross domestic fixed capital formation -2.1 1.7 0.3 5.8 6.8 6.4 -2.9
Total exports of goods 2.0 3.8 0.3 4.3 7.8 3.2 -0.1
Imports of goods 1.5 4.5 -1.4 6.3 8.4 4.3 -0.3
Exports of services 2.6 3.2 -9.4 8.2 7.5 4.7 0.4
Imports of services 2.5 4.3 -3.8 4.9 5.9 0.6 0.3
Gross Domestic Product 3.1 1.3 -0.4 0.3 3.9 3.5 1.8
Total final demand 2.2 3.3 -1.3 4.1 6.7 3.7 0.4
Domestic demand 2.4 2.6 -0.8 2.2 4.5 4.2 1.4
Table 25 : Rates of change in implicit price deflators of GDPand its main expenditure components
Notes: Figures in this table are compiled based on the change of ownership principle in recording goods sent abroad for processing and merchanting under the standards stipulated in the System of National Accounts 2008.
(#) Figures are subject to revision later on as more data become available. (*) Change within ±0.05%.
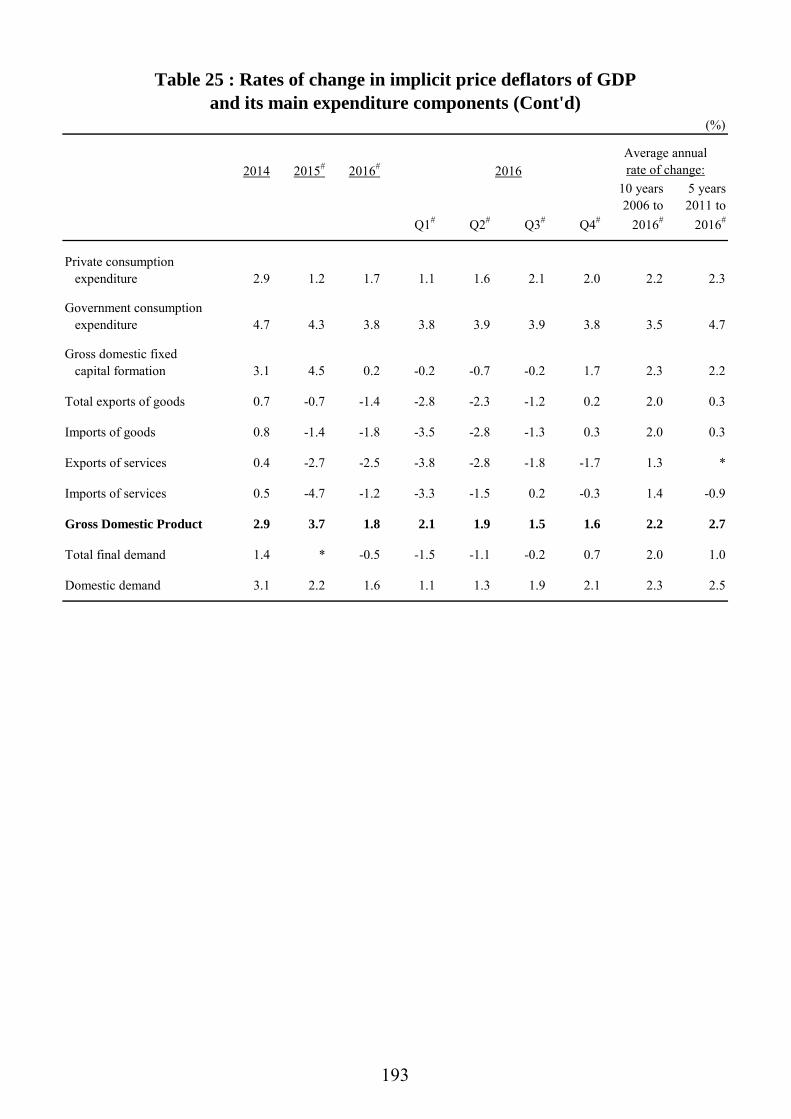
193
(%)
2014 2015# 2016# 2016
Q1# Q2# Q3# Q4#
10 years2006 to
2016#
5 years2011 to
2016#
Private consumption expenditure 2.9 1.2 1.7 1.1 1.6 2.1 2.0 2.2 2.3
Government consumption expenditure 4.7 4.3 3.8 3.8 3.9 3.9 3.8 3.5 4.7
Gross domestic fixed capital formation 3.1 4.5 0.2 -0.2 -0.7 -0.2 1.7 2.3 2.2
Total exports of goods 0.7 -0.7 -1.4 -2.8 -2.3 -1.2 0.2 2.0 0.3
Imports of goods 0.8 -1.4 -1.8 -3.5 -2.8 -1.3 0.3 2.0 0.3
Exports of services 0.4 -2.7 -2.5 -3.8 -2.8 -1.8 -1.7 1.3 *
Imports of services 0.5 -4.7 -1.2 -3.3 -1.5 0.2 -0.3 1.4 -0.9
Gross Domestic Product 2.9 3.7 1.8 2.1 1.9 1.5 1.6 2.2 2.7
Total final demand 1.4 * -0.5 -1.5 -1.1 -0.2 0.7 2.0 1.0
Domestic demand 3.1 2.2 1.6 1.1 1.3 1.9 2.1 2.3 2.5
Average annualrate of change:
Table 25 : Rates of change in implicit price deflators of GDPand its main expenditure components (Cont'd)