
2013 ECONOMIC BACKGROUND
195
Transcript of 2013 ECONOMIC BACKGROUND


2013 ECONOMIC BACKGROUND AND
2014 PROSPECTS
ECONOMIC ANALYSIS DIVISION ECONOMIC ANALYSIS AND BUSINESS FACILITATION UNIT
FINANCIAL SECRETARY’S OFFICE GOVERNMENT OF THE
HONG KONG SPECIAL ADMINISTRATIVE REGION
February 2014

CONTENTS
Paragraphs CHAPTER 1 : OVERVIEW OF ECONOMIC PERFORMANCE IN 2013
Overall situation 1.1 - 1.2 The external sector 1.3 - 1.4 The domestic sector 1.5 - 1.6 The labour sector 1.7 The asset markets 1.8 - 1.9 Inflation 1.10 - 1.11 GDP by major economic sector 1.12 - 1.13 Other economic developments 1.14 - 1.21 Box 1.1 Diffusion indices on small and medium-sized enterprises (an update)
CHAPTER 2 : ECONOMIC OUTLOOK FOR 2014 AND THE MEDIUM TERM
Major external factors 2.1 - 2.4 Global economic outlook 2.5 - 2.11 Monetary conditions, exchange rates and price competitiveness
2.12 - 2.14
World inflation and global commodity prices 2.15 - 2.16 Major sources of uncertainty 2.17 - 2.18 Outlook for the Hong Kong economy in 2014 2.19 - 2.23 Medium-term outlook for the Hong Kong economy 2.24 - 2.29 Box 2.1 Recent performance of the US housing market Box 2.2 The eurozone’s economic recovery in perspective Box 2.3 Medium and long-term growth outlook of major economies
CHAPTER 3 : THE EXTERNAL SECTOR
Visible trade Total exports of goods 3.1 - 3.5 Imports of goods 3.6 Invisible trade Exports of services 3.7 Imports of services 3.8 Visible and invisible trade balance 3.9 Other developments 3.10 - 3.14 CHAPTER 4 : DEVELOPMENTS IN SELECTED SECTORS
Property 4.1 - 4.14 Land 4.15 - 4.16 Tourism 4.17 - 4.18 Logistics 4.19 - 4.20 Transport 4.21 - 4.22 Creativity and innovation 4.23 Telecommunications 4.24 Environment 4.25 Box 4.1 Latest Government measures on land and housing supply

CHAPTER 5 : THE FINANCIAL SECTOR
Interest rates and exchange rates 5.1 - 5.5 Money supply and banking sector 5.6 - 5.18 The debt market 5.19 - 5.21 The stock and derivatives markets 5.22 - 5.26 Fund management and investment funds 5.27 Insurance sector 5.28 - 5.29 Highlights of policy and market developments 5.30 - 5.31 CHAPTER 6 : THE LABOUR SECTOR
Overall labour market situation 6.1 Total employment and labour force 6.2 - 6.5 Profile of unemployment 6.6 - 6.9 Profile of underemployment 6.10 Profile of employment in establishments 6.11 - 6.12 Vacancies 6.13 - 6.16 Wages and earnings 6.17 - 6.21 Highlights of recent labour-related measures and policy developments
6.22 - 6.26
Box 6.1 Labour’s share of national income in Hong Kong CHAPTER 7 : PRICES
Consumer prices 7.1 - 7.3 Costs of factor inputs and import prices 7.4 - 7.5 Output prices 7.6 GDP deflator 7.7 Box 7.1 The relations among global, Mainland and local food inflation
CALENDAR OF EVENTS OF SIGNIFICANCE FOR THE HONG KONGECONOMY IN 2013 STATISTICAL APPENDIX

1
CHAPTER 1 : OVERVIEW OF ECONOMIC PERFORMANCE IN 2013 Summary
Hong Kong’s overall economic performance improved in 2013, with real GDP expanding moderately by 2.9%, up from 1.5% in 2012, keeping the labour market in a state of full employment. The growth pace was nevertheless slower than the average annual growth of 4.5% over the past decade, as global economic performance remained subpar under the drag of sluggishness of advanced economies and the consequential growth slowdown in emerging markets. Domestic demand and exports of services provided the key driving forces for overall economic growth in 2013. In the fourth quarter, the economy showed further moderate growth, at 3.0% year-on-year.
Total exports of goods, after excluding the notable surge in exports of non-monetary gold, grew only modestly during most of 2013, mainly reflecting the weak demand conditions in Europe, fiscal drag on US economic growth, and slower activity expansion in emerging markets amid concerns about the Federal Reserve’s asset purchase tapering. Nevertheless, the advanced markets showed some relative improvements in the second half of the year as the eurozone resumed growth and the US economy gained more traction.
Exports of services attained solid growth in 2013 and provided an important impetus to the economy. Underpinned by vibrant inbound tourism, exports of travel services grew at a double-digit pace and were the standout performer. Exports of financial and other business services also picked up gradually throughout the year amid improved global business sentiment and acceleration in fund-raising activities. Meanwhile, exports of transportation and those of trade-related services remained rather subdued alongside the sluggish regional and international trade flows.
The domestic sector saw steady growth in 2013. Private consumption expenditure grew further, thanks largely to the favourable job and income conditions. Investment rose only moderately, due to relapse in private sector construction activities. Yet infrastructure construction works remained hectic, while investment in machinery and equipment attained another year of double-digit growth.
The labour market was tight, with job vacancies rising to record highs and total employment sustaining notable growth. The seasonally adjusted unemployment rate edged down to 3.2% in the fourth quarter, indicating further tightening in employment situation. Against this background, wages and earnings registered further gains.

2
Local stock prices exhibited considerable fluctuations during the year, and ended the year slightly higher than a year ago. After going lower in the mid-year on jitters about less monetary accommodation in the US and the ensuing volatility in the emerging markets, the stock market regained lost ground in the second half of the year as the advanced economies improved and the Mainland economy displayed its resilience. The local property market turned quiet, with the increases in flat prices slowing and activities down, after the Government’s introduction of further demand-side management measures in late February.
Consumer price inflation was largely contained during 2013, as imported inflation went lower and helped offset the domestic price pressures. For 2013 as a whole, underlying inflation averaged 4.0%, marking the second year of easing from 5.3% in 2011 and 4.7% in 2012.
Overall situation
1.1 The Hong Kong economy attained a moderate growth in 2013 amid a still challenging external environment. The growth pace, while representing a relative improvement over that in 2012, was still slower than the trend in the past ten years. Merchandise exports were held back by the subpar global economic conditions given the weak momentum in the EU market, the fiscal retrenchment in the US, and widespread growth slowdown in emerging markets amid the threat from the Federal Reserve’s talks about asset purchase tapering. In 2013, the Mainland and some other Asian markets provided the main support to Hong Kong’s export growth. Global economic sentiment improved towards the end of the year, along with the improvements in the advanced economies. However, this had yet to translate into a more visible growth in international trade flows. Exports of services performed relatively better, thanks mainly to the vibrant inbound tourism and expansion of financial activity. Amid favourable labour market conditions and further support from infrastructure works, domestic demand expanded solidly and played an important stabilizing role. Underlying inflation held largely stable in 2013, with incipient signs of easing towards the end of the year. 1.2 For 2013 as a whole, Gross Domestic Product (GDP)(1) grew by 2.9% in real terms, improved from the 1.5% growth in 2012, but still below the annual average growth of 4.5% in the past decade. Real GDP growth hovered at around 3% throughout the four quarters, at 2.9%, 3.1%, 2.8% and 3.0% respectively. On a seasonally adjusted quarter-to-quarter comparison(2), real GDP growth picked up successively during the year, at 0.5%, 0.6%, 0.7% and 1.1% respectively in the first, second, third and fourth quarters.

3
-6
-4
-2
0
2
4
6
8
10
2004 2005 2006 2007 2008 2009 2010 2011 2012 2013
Rate of change in real terms
Diagram 1.1 : The Hong Kong economy picked up to moderate growth in 2013
Percent(a) Annual profile
Q12009
Q12010
Q12011
Q12012
Q12013
-10
-8
-6
-4
-2
0
2
4
6
8
10
12
14
Year-on-year rate of changein real terms
Percent
Seasonally adjusted quarter-to-quarterrate of change in real terms
(b) Quarterly profile

4
The external sector 1.3 Total exports of goods compiled under the GDP accounting framework grew by 6.7% in real terms in 2013, after the slight growth of 1.8% in 2012. Excluding the substantial increase in exports of non-monetary gold, exports saw only moderate growth. The performance of the advanced markets remained disappointing, despite some relative improvement in the second half of the year. The US market stayed subdued, only showing moderated decline in the second half of 2013. By comparison, the EU market fared better and returned to modest growth in the second half of the year after nine quarters of contraction alongside the stabilisation in eurozone activity. Meanwhile, exports to the major Asian markets were mixed. Exports to Japan fell notably amid a weaker yen, while those to the Mainland and India grew solidly during most of 2013. In terms of the quarterly profile, the year-on-year growth of merchandise exports after excluding non-monetary gold in real terms decelerated from 4.0% in the first quarter to 2.4% and 2.0% respectively in the second and third quarters, before picking up slightly to 3.1% in the fourth quarter. On a seasonally adjusted quarter-to-quarter comparison, merchandise exports declined in the first and second quarters, yet resumed growth in the third and fourth quarters. 1.4 Exports of services continued to perform better than those of goods, rising by 5.8% in real terms for 2013 as a whole, notably improved from the 2.2% increase in 2012. Thanks to buoyant inbound tourism, exports of travel services grew rapidly, thereby rendering the key impetus to overall exports of services. Exports of financial and other business services also gathered pace gradually during the year, as cross-border financial and fund-raising activities accelerated. Bound by the sluggishness in merchandise trade flows, exports of trade-related and transportation services remained rather subdued in 2013.

5
Table 1.1 : Gross Domestic Product and its main expenditure components and the main price indicators
(year-on-year rate of change (%))
2012# 2013+ 2012 2013
Q1# Q2# Q3# Q4# Q1# Q2# Q3# Q4+ Change in real terms of GDP and its main expenditure components (%)
Private consumption expenditure
4.1 4.2 6.5 (1.1)
3.5 (0.4)
2.7 (1.4)
3.7 (1.1)
6.5 (3.1)
4.6 (-1.1)
2.4 (-0.4)
3.2 (1.7)
Government consumption expenditure
3.6 2.7 3.1 (1.3)
4.2 (0.7)
4.0 (0.8)
3.3 (0.3)
2.2 (0.3)
3.1 (1.5)
2.3 (0.2)
3.2 (1.1)
Gross domestic fixed capital formation
6.8 3.3 9.9 3.9 5.3 8.5 -3.3 7.6 2.8 5.3
of which :
Building and construction 7.2 -1.2 9.5 8.6 2.0 8.9 -2.4 -1.0 3.2 -4.1
Machinery, equipment and intellectual property products
10.2 10.5 20.4 5.7 9.4 8.1 -4.3 19.4 7.3 17.2
Total exports of goods
1.8 6.7 -4.7 (0.8)
0.3 (-0.3)
4.6 (3.2)
6.7 (3.3)
8.8 (1.5)
6.2 (-1.4)
6.2 (3.2)
5.8 (2.1)
Imports of goods
3.0 7.6 -1.8 (3.0)
1.2 (-0.8)
4.7 (2.3)
7.6 (3.7)
9.6 (3.5)
7.6 (-1.8)
6.8 (1.9)
6.5 (2.5)
Exports of services
2.2 5.8 2.8 (0.6)
2.6 (0.6)
0.1 (-0.7)
3.3 (2.9)
5.1 (2.1)
8.0 (3.2)
5.5 (-2.6)
4.9 (2.3)
Imports of services
1.9 1.5 4.5 (1.9)
2.5 (-0.7)
0.1 (-1.9)
0.9 (1.4)
0.5 (1.5)
-1.0 (-1.7)
2.7 (1.7)
3.7 (2.3)
Gross Domestic Product
1.5 2.9 0.7 (0.2)
0.9 (0.3)
1.6 (0.9)
2.9 (1.1)
2.9 (0.5)
3.1 (0.6)
2.8 (0.7)
3.0 (1.1)
Change in the main price indicators (%)
GDP deflator 3.7 1.2 3.6 (1.2)
2.9 (0.9)
4.0 (1.0)
4.1 (0.4)
1.2 (-1.0)
0.4 (0.2)
1.5 (1.7)
1.6 (0.6)
Composite CPI
Headline
4.1 4.3 5.2 (1.2)
4.2 (0.8)
3.1 (-2.0)
3.8 (3.7)
3.7 (1.1)
4.0 (1.3)
5.3 (-0.8)
4.3 (2.7)
Underlying^
4.7 4.0 5.9 (1.2)
5.1 (0.9)
4.0 (0.5)
3.8 (1.1)
3.8 (1.1)
3.9 (1.1)
4.3 (0.8)
4.0 (1.0)
Change in nominal GDP (%) 5.3 4.2 4.4 3.8 5.7 7.1 4.2 3.5 4.4 4.6 Notes : Figures are subject to revision later on as more data become available. Seasonally adjusted
quarter-to-quarter rate of change is not applicable to gross domestic fixed capital formation, as no clear seasonal pattern is found for the category due to the presence of considerable short term fluctuations. Figures of private consumption expenditure, exports of goods, and imports and exports of services were revised back to 2009 as a result of a technical revision exercise conducted by the Census and Statistics Department in mid-2013. For details, please see Note (3) to this chapter.
(#) Revised figures. (+) Preliminary figures. (+) Seasonally adjusted quarter-to-quarter rate of change. (^) After netting out the effects of Government’s one-off relief measures.

6
The domestic sector 1.5 The domestic sector held firm in 2013 and provided buffer against the external headwinds. Thanks to the favourable labour market conditions, private consumption expenditure (PCE) grew by 4.2% in real terms in 2013, similar to the 4.1% growth in the previous year. On a seasonally adjusted quarter-to-quarter comparison, PCE expanded strongly in the first quarter, then fell back in the second and third quarters, before picking up in the fourth quarter. Government consumption expenditure increased steadily further by 2.7% in real terms in 2013, following the 3.6% growth in 2012.
Table 1.2 : Consumer spending by major component(a) (year-on-year rate of change in real terms (%))
Total consumer
spending in the domestic
market(a)
Of
Food
which :
Durables
Non- durables
Services
Residents’ expenditure
abroad
Visitor
spending
Private consumption expenditure(b)
2012 Annual 5.1 3.6 13.2 7.9 2.5 4.6 10.1 4.1
H1 5.6 2.4 20.3 9.0 2.1 6.4 10.1 5.0
H2 4.5 4.8 7.7 6.8 2.9 2.9 10.0 3.3
Q1 6.7 1.0 25.5 11.6 2.5 6.9 8.0 6.5 Q2 4.6 3.7 15.1 6.6 1.7 6.0 12.5 3.5 Q3 3.4 5.4 4.1 5.2 2.1 4.7 7.4 2.7 Q4 5.5 4.2 10.7 8.1 3.6 1.0 12.4 3.7
2013 Annual 6.5 4.6 7.0 14.9 3.2 4.5 17.7 4.2
H1 8.8 3.9 14.5 18.7 4.4 2.5 23.2 5.5
H2 4.4 5.2 0.5 11.4 2.0 6.4 13.1 2.8
Q1 8.7 4.2 28.0 11.4 4.1 5.5 18.5 6.5 Q2 8.8 3.7 * 26.1 4.8 -0.3 28.1 4.6 Q3 4.6 5.2 -0.6 12.6 2.2 4.7 15.6 2.4 Q4 4.3 5.3 1.4 10.5 1.7 8.2 10.8 3.2
Notes : (a) Consumer spending in the domestic market comprises both local consumer and visitor spending. Figures of private consumption expenditure, exports of goods, and imports and exports of services were revised back to 2009 as a result of a technical revision exercise conducted by the Census and Statistics Department in mid-2013. For details, please see Note (3) to this chapter.
(b) Private consumption expenditure is obtained by deducting visitor spending from the total consumer spending in the domestic market, and adding back residents’ expenditure abroad.
(*) Change within ±0.05%

7
Q1
2009Q1
2010Q1
2011Q1
2012Q1
2013
-8
-6
-4
-2
0
2
4
6
8
10
12
14
Year-on-year rate ofchange in real terms
Seasonally adjustedquarter-to-quarter
rate of changein real terms
Percent
Q12009
Q12010
Q12011
Q12012
Q12013
-25
-20
-15
-10
-5
0
5
10
15
20
25
30
35
Expenditure on machinery, equipmentand intellectual property products
Expenditure on building and construction
Year-on-year rate of change in real terms (%)
Overall investment expenditure
Diagram 1.2 : Private consumption expenditure maintained moderate growth in 2013
Diagram 1.3 : Investment spendingexpanded moderately in 2013
1.6 Overall investment spending in terms of gross domestic fixed capital formation posted a modest growth of 3.3% in real terms in 2013, moderating from the growth of 10.2% and 6.8% respectively in 2011 and 2012. Machinery and equipment acquisition grew notably by 10.5% in 2013, largely in line with the positive business sentiment indicated by the results of the Quarterly Business Tendency Survey on large enterprises, even though the diffusion indices on small and medium-sized enterprises (SMEs) revealed a slightly more cautious picture (see Box 1.1 for details of the consultation on SMEs). In 2013, public sector construction works grew solidly further, on the back of continued hectic infrastructure works. Yet, private sector building activity fell back, thereby leading to a slight decline of 1.2% in overall building and construction expenditure in real terms.

8
Box 1.1
Diffusion indices on small and medium-sized enterprises (an update)
To gain a better understanding of the current situation of business receipts, employment and credit access for small and medium-sized enterprises (SMEs)(1), an ad-hoc consultation exercise has been conducted by the Census and Statistics Department on behalf of the Economic Analysis and Business Facilitation Unit since late November 2008 on a sample panel of around 500 SMEs to solicit their feedback. This note provides a further update of the results reported in Box 1.1 in the Third Quarter Economic Report 2013.
From June 2011 onwards, the industry coverage and questionnaire design for the exercise have been modified. Specifically, three sectors (viz. travel agents, financing institutions, and insurance agents and brokers) are dropped from the exercise, while questions on access to credit have been modified to gauge SMEs’ views as to whether the current and expected credit access situation are “easy”, “fair” or “tight”, rather than in respect of a comparison with the normal times. The sample size of the panel has consequently been reduced to around 400.
A set of diffusion indices is compiled to indicate the general directions of change in the respondents’ views on business receipts and employment versus the preceding month. While the findings should be interpreted with considerable caution given the coverage and nature of the consultation exercise, they can serve as a rough indicator to enable high frequency monitoring of SMEs’ situation.
Business receipts of the SMEs consulted, as depicted by the set of diffusion indices, showed that the overall situation remained weak in January 2014, with the readings for all the selected sectors below the boom-bust threshold of 50 (Table 1). Among all the selected sectors, the diffusion indices for retail trade and restaurants performed relatively better, in line with continued solid growth of retail sales. The reading for the real estate sector was still the lowest, reflecting a quiet property market under the influence of the Fed’s tapering and the sustained effects of the Government’s demand-side management measures. As regards the external segment, the diffusion indices for the import/export trades and logistics sectors receded, conceivably indicating the cautiousness among SMEs in these sectors in the face of renewed gyrations in the financial markets at the start of this year. As to the employment situation, the feedback from SMEs indicated broadly stable development in recent months (Table 2).
Specifically for SMEs in the import and export sector, their views on new export orders were sought separately to help gauge the likely export performance in the near term. The diffusion index on new export orders inched lower in January 2014, but was still close to the boom-bust threshold of 50, pointing to broadly stable external demand conditions. However, uncertainties remain, particularly those arising from the US monetary policy and its possible negative impacts on the growth of emerging market economies.
(1) Manufacturing enterprises with fewer than 100 employees and non-manufacturing enterprises with fewer
than 50 employees are regarded as SMEs in Hong Kong.

9
Box 1.1 (Cont’d)
The proportion of SMEs reporting tight credit access, while rising back to 1.5% in January 2014 from 0.6% in the preceding month, was still at a relatively low level, thanks to the generally accommodative monetary conditions and the Government’s continued efforts to support SMEs through various loan guarantee schemes. Nevertheless, whether this rising trend would continue in the coming months still warrants monitoring.
Table 1 : Diffusion indices^ on business receipts
Notes : (^) The diffusion index is computed by adding the percentage of SMEs reporting “up” to one half
of the percentage of SMEs reporting “same”. A diffusion index reading above 50 indicates that the business condition is generally favourable, whereas an index below 50 indicates otherwise. Respondents were requested to exclude seasonal effects in reporting their views.
(*) Weighted average using total number of SMEs in individual sectors as weights. Table 2 : Diffusion indices on employment situation 2013 2014Jan Feb Mar Apr May Jun Jul Aug Sep Oct Nov Dec Jan
Local segments Restaurants 49.2 49.2 49.2 49.2 50.0 48.3 50.0 50.0 49.1 49.1 49.1 48.2 49.1 Real estate 50.0 50.0 50.0 50.0 50.0 48.5 50.0 45.6 48.5 47.1 47.1 47.1 50.0 Retail trade 50.5 50.0 50.0 50.0 50.0 50.0 50.0 50.0 49.5 50.0 50.0 50.0 49.6 Wholesale trade 50.0 50.0 50.0 50.0 50.0 50.0 50.0 47.1 50.0 50.0 50.0 47.1 50.0 Business services 50.0 54.5 53.0 51.5 50.0 50.0 48.5 51.5 48.5 50.0 51.5 50.0 50.0
External segments Import/export trade 49.1 50.0 50.5 50.0 50.5 51.0 49.0 49.5 49.5 50.0 51.0 50.0 50.4 Logistics 50.0 50.0 50.0 50.0 50.0 47.4 47.4 50.0 47.4 47.4 50.0 50.0 50.0
All the above sectors* 49.7 50.4 50.5 50.1 50.2 50.1 49.3 49.5 49.3 49.7 50.3 49.5 50.0 Note : (*) Weighted average using total number of SMEs in individual sectors as weights.
Table 3 : Diffusion index on current new export orders 2013 2014Jan Feb Mar Apr May Jun Jul Aug Sep Oct Nov Dec Jan
Import/export trade 49.1 50.0 50.5 49.0 49.5 49.5 48.5 48.5 48.1 49.5 50.5 49.5 49.2 Table 4 : Percentage of SMEs reporting tight current access to credit
Note : (*) Weighted average using total number of SMEs in individual sectors as weights.
2013 2014Jan Feb Mar Apr May Jun Jul Aug Sep Oct Nov Dec Jan
Local segments Restaurants 49.2 48.4 48.3 45.8 46.7 45.8 48.2 48.2 47.4 47.4 48.2 49.1 48.1 Real estate 51.5 39.7 39.7 38.2 42.6 44.1 44.1 35.3 35.3 41.2 36.8 44.1 42.4 Retail trade 46.3 47.7 48.1 47.6 47.6 47.1 49.0 50.0 49.0 47.5 48.0 49.0 47.4 Wholesale trade 47.2 47.2 47.2 44.4 50.0 47.1 41.2 44.1 47.1 50.0 44.1 47.1 44.7 Business services 50.0 53.0 47.0 43.9 48.5 48.5 45.5 43.9 45.5 50.0 48.5 53.0 47.0
External segments Import/export trade 50.0 49.0 51.0 49.0 50.0 50.0 48.1 47.6 48.5 49.0 49.5 49.0 47.9 Logistics 50.0 44.7 47.4 47.4 44.7 50.0 47.4 44.7 44.7 44.7 52.8 50.0 47.2
All the above sectors* 48.9 48.2 48.6 47.0 48.4 48.3 47.3 46.8 47.3 48.1 48.0 49.0 47.0
2013 2014Jan Feb Mar Apr May Jun Jul Aug Sep Oct Nov Dec Jan
All selected sectors* 1.3 1.2 0.7 0.9 0.6 0.6 0.6 0.7 0.7 0.7 0.4 0.6 1.5
10
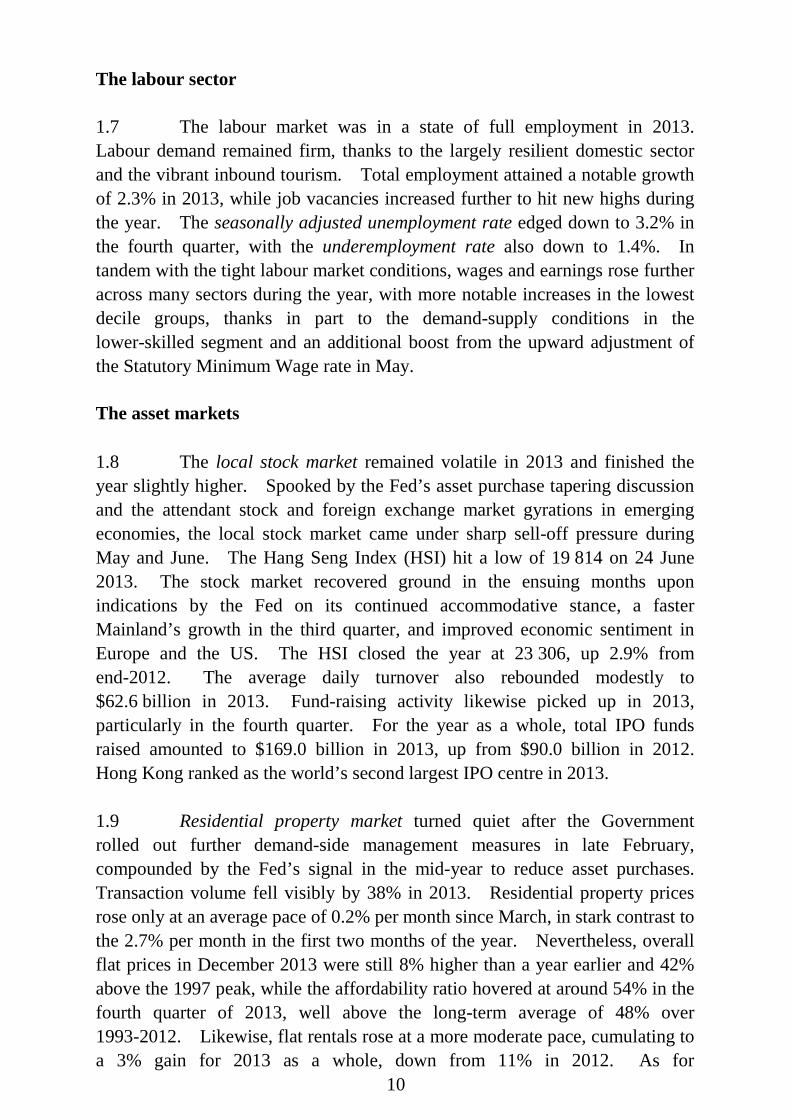
The labour sector 1.7 The labour market was in a state of full employment in 2013. Labour demand remained firm, thanks to the largely resilient domestic sector and the vibrant inbound tourism. Total employment attained a notable growth of 2.3% in 2013, while job vacancies increased further to hit new highs during the year. The seasonally adjusted unemployment rate edged down to 3.2% in the fourth quarter, with the underemployment rate also down to 1.4%. In tandem with the tight labour market conditions, wages and earnings rose further across many sectors during the year, with more notable increases in the lowest decile groups, thanks in part to the demand-supply conditions in the lower-skilled segment and an additional boost from the upward adjustment of the Statutory Minimum Wage rate in May. The asset markets 1.8 The local stock market remained volatile in 2013 and finished the year slightly higher. Spooked by the Fed’s asset purchase tapering discussion and the attendant stock and foreign exchange market gyrations in emerging economies, the local stock market came under sharp sell-off pressure during May and June. The Hang Seng Index (HSI) hit a low of 19 814 on 24 June 2013. The stock market recovered ground in the ensuing months upon indications by the Fed on its continued accommodative stance, a faster Mainland’s growth in the third quarter, and improved economic sentiment in Europe and the US. The HSI closed the year at 23 306, up 2.9% from end-2012. The average daily turnover also rebounded modestly to $62.6 billion in 2013. Fund-raising activity likewise picked up in 2013, particularly in the fourth quarter. For the year as a whole, total IPO funds raised amounted to $169.0 billion in 2013, up from $90.0 billion in 2012. Hong Kong ranked as the world’s second largest IPO centre in 2013. 1.9 Residential property market turned quiet after the Government rolled out further demand-side management measures in late February, compounded by the Fed’s signal in the mid-year to reduce asset purchases. Transaction volume fell visibly by 38% in 2013. Residential property prices rose only at an average pace of 0.2% per month since March, in stark contrast to the 2.7% per month in the first two months of the year. Nevertheless, overall flat prices in December 2013 were still 8% higher than a year earlier and 42% above the 1997 peak, while the affordability ratio hovered at around 54% in the fourth quarter of 2013, well above the long-term average of 48% over 1993-2012. Likewise, flat rentals rose at a more moderate pace, cumulating to a 3% gain for 2013 as a whole, down from 11% in 2012. As for

11
non-residential property market, rentals for shops went up by 6%, visibly slower than the 13% increase during 2012. Office rentals rose by 7% during 2013, also slower than the increase of 8% in the preceding year. Inflation 1.10 Consumer price inflation was largely stable in 2013. Netting out the effects of the Government’s one-off relief measures, underlying consumer price inflation actually retreated to 4.0% in 2013, down from 5.3% and 4.7% respectively in 2011 and 2012. The moderation in the underlying rate mainly reflected the benefits from subdued external price pressure while some notable upward price pressures domestically also tended to stabilise in the latter part of 2013. In particular, increases in the private housing rentals component began to ease at the end of 2013 as the feed-through of milder increases in fresh-letting private residential rentals earlier kicked in. As further signs of easing price pressure, the average monthly rates of change in the underlying Consumer Price Index on a seasonally adjusted basis retreated to 0.2% in the fourth quarter, down from 0.3% in the first half in 2013 and 0.4% in the third quarter. Wage growth in 2013 held at a pace somewhat slower than that in 2012. Headline consumer price inflation, which is influenced by the Government’s relief measures, edged up to 4.3% in 2013 from 4.1% in 2012, reflecting in part the spike in July 2013 caused by a lower base of comparison upon the Government’s payment of public housing rentals the same month in the previous year, and is by no means an indication of a rising underlying inflation trend. 1.11 The GDP deflator increased by 1.2% in 2013, likewise slower than the increase in 2012, amid moderated increase in prices for consumption expenditure, and a visible decline in prices for machinery and equipment.

12
GDP by major economic sector 1.12 The services sector grew moderately in the first three quarters of 2013, in line with the overall economic performance. Net output in real terms grew by 2.7%, 3.8% and 2.5% respectively in the first three quarters of 2013 over a year earlier. Most sectors saw some improvements when compared with the weak 2012 outcomes. Net output of import and export trade showed slightly faster growth in the first two quarters before slowing somewhat in the third quarter, reflecting the still unsteady external trading environment, while that of financing and insurance accelerated markedly in the first three quarters as the global investment climate stabilised. Professional and business services also grew at a faster pace in the second and third quarters amid improved business sentiment. Information and communications, and accommodation and food services both expanded moderately in the first three quarters. Real estate activity, which mainly reflects the net output of private sector developers and property agency activity, contracted in all three quarters amid a quiet property market, while the net output of the construction sector was underpinned by an acceleration of infrastructure works and picked up notably in the third quarter. Meanwhile, net output growth in transportation and storage remained subdued over the period while activity in the manufacturing sector stayed weak, in part related to the sluggish trade and production activity.
Q12009
Q12010
Q12011
Q12012
Q12013
-4
-2
0
2
4
6
8 Year-on-year rate of change (%)
Composite Consumer Price Index
Diagram 1.4 : Consumer price inflation was largely stable in 2013
Domesticdemand deflator
GDP deflator

13
Table 1.3 : GDP by economic activity(a) (year-on-year rate of change in real terms (%))
2012 2013 2012 2013
Q1-Q3 Q1
Q2 Q3 Q4 Q1 Q2 Q3
Manufacturing
-0.8 -0.1 -1.6 -2.9 -0.1 1.3 0.5 0.3 -0.9
Construction
8.3 3.1 10.8 7.2 1.2 13.1 -1.4 2.6 8.8
Services(b)
1.8 3.0 1.4 0.9 2.0 2.7 2.7 3.8 2.5
Import/export, wholesale and retail trades
1.9 3.8 -0.1 0.6 2.1 4.1 5.1 4.8 1.9
Import and export trade
0.6 2.2 -2.4 -0.9 1.5 3.4 3.3 2.7 0.9
Wholesale and retail trades
7.3 10.5 10.2 7.2 4.5 7.6 12.4 13.1 6.4
Accommodation(c) and food services
1.8 4.0 -0.8 0.9 2.8 4.1 4.3 4.3 3.4
Transportation, storage, postal and courier services
0.9 1.5 3.0 -1.7 0.4 1.8 -0.6 3.0 2.4
Transportation and storage
0.7 1.0 3.0 -1.9 0.2 1.2 -0.9 2.8 1.2
Postal and courier services
6.4 14.1 3.2 1.6 7.4 12.5 7.7 6.5 27.9
Information and communications
2.8 4.6 0.7 1.4 4.1 4.5 6.5 2.6 4.6
Financing and insurance
0.8 6.0 2.2 -0.9 1.0 1.1 3.7 7.9 6.4
Real estate, professional and business services
3.1 -0.2 3.4 4.5 3.2 1.7 -0.3 -0.3 -0.2
Real estate 3.9 -4.2 3.3 5.8 4.3 2.5 -2.5 -5.9 -4.3 Professional and business services
2.3 3.8 3.1 3.1 2.2 1.1 2.2 5.4 3.8
Public administration, social and personal services
2.1 2.7 2.1 2.2 2.2 1.8 2.1 3.8 2.3
Notes : Figures are subject to revision later on as more data become available.
(a) The GDP figures shown in this table are compiled from the production approach, in parallel with those shown in Table 1.1 which are compiled from the expenditure approach. For details, see Note (1) to this chapter.
(b) In the context of value-added contribution to GDP, the services sectors include ownership of premises as well, which is analytically a service activity.
(c) Accommodation services cover hotels, guesthouses, boarding houses and other establishments providing short term accommodation.

14
1.13 The services sector is the mainstay of the Hong Kong economy, generating 93.0% of GDP in 2012 and providing 88.2% of the total employment in the first three quarters of 2013. Buttressed by our institutional advantages and a highly effective and professional workforce, the services sector has met the challenges of globalisation, and its focus has increasingly shifted towards the high value-added and knowledge-based activities. With the aid of the competitive service sector, Hong Kong is well-positioned to benefit from the nation’s strategy of rebalancing towards a more consumer-based, service-led economy. The Hong Kong economy will keep up its competitiveness as an international financial centre and a regional business hub, by consolidating the strength of the traditional pillar industries, developing new industries with growth potential, and upgrading its infrastructure and human capital. On the latter, it is worth noting that the proportion of the local workforce with tertiary education attainment increased steadily from 31.4% in 2008 to 34.9% in 2013.
Manufacturing1.5%
Construction3.6%
Public administration, social and personal services
16.8%
Others12.2% Manufacturing
2.9%
Construction8.4%
Others0.5%
Import/export trade and wholesale
15.2%
Information and communications
2.8%
Transportation,storage, postal and
courier services8.8%
Retail trade8.8%
Accommodationand food services
7.4%
Public administration, social and personal services
25.9%
Financing andinsurance, real estate,
professionaland business services
19.3%
Financing and insurance, real
estate, professional and business
services 27.4%
Diagram 1.5 : The services sector is the key driver of the economy
GDP by economic activity2012
Total employment *2013 Q1-Q3
Figures refer to the Composite Employment Estimates, which are compiled based on results of the General Household Survey and the Quarterly Survey of Employment and Vacancies. Figures for 2013 are averages for the first three quarters of the year.
Note : (*)
Information and communications
3.5%
Transportation,storage, postal and
courier services6.0%
Accommodationand food services
3.6%
Import/export, wholesale and retail trades
25.4%
15
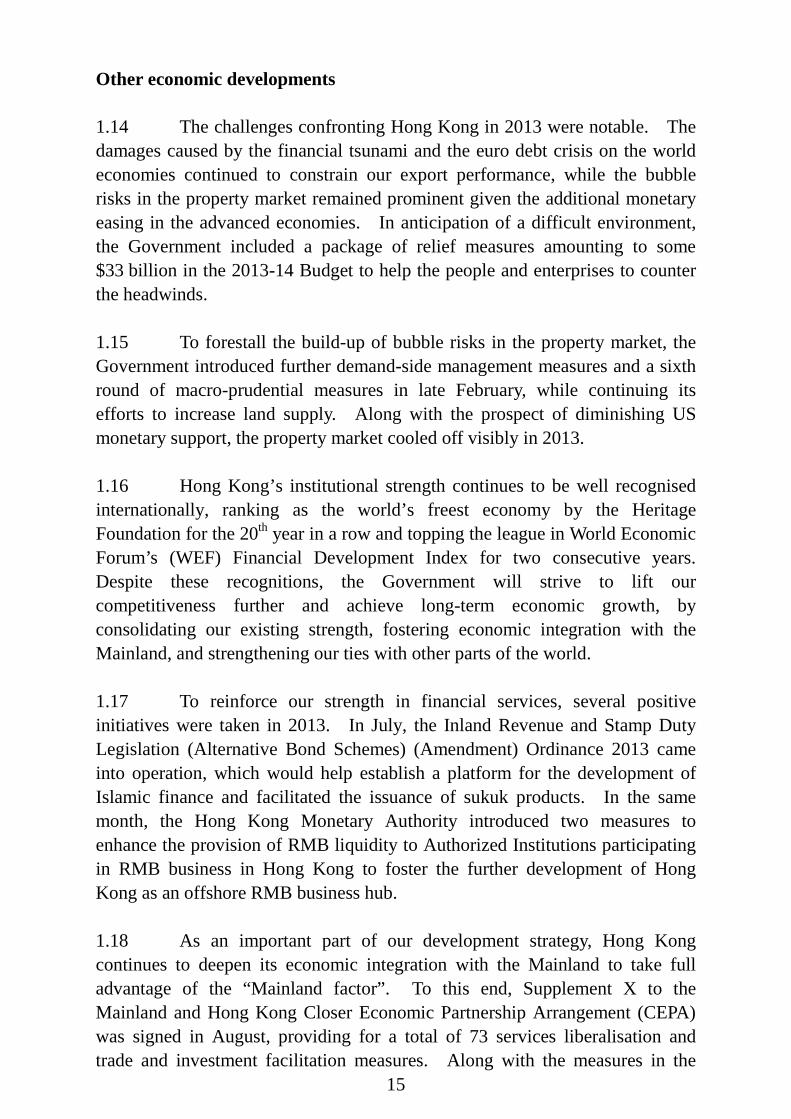
Other economic developments 1.14 The challenges confronting Hong Kong in 2013 were notable. The damages caused by the financial tsunami and the euro debt crisis on the world economies continued to constrain our export performance, while the bubble risks in the property market remained prominent given the additional monetary easing in the advanced economies. In anticipation of a difficult environment, the Government included a package of relief measures amounting to some $33 billion in the 2013-14 Budget to help the people and enterprises to counter the headwinds. 1.15 To forestall the build-up of bubble risks in the property market, the Government introduced further demand-side management measures and a sixth round of macro-prudential measures in late February, while continuing its efforts to increase land supply. Along with the prospect of diminishing US monetary support, the property market cooled off visibly in 2013. 1.16 Hong Kong’s institutional strength continues to be well recognised internationally, ranking as the world’s freest economy by the Heritage Foundation for the 20th year in a row and topping the league in World Economic Forum’s (WEF) Financial Development Index for two consecutive years. Despite these recognitions, the Government will strive to lift our competitiveness further and achieve long-term economic growth, by consolidating our existing strength, fostering economic integration with the Mainland, and strengthening our ties with other parts of the world. 1.17 To reinforce our strength in financial services, several positive initiatives were taken in 2013. In July, the Inland Revenue and Stamp Duty Legislation (Alternative Bond Schemes) (Amendment) Ordinance 2013 came into operation, which would help establish a platform for the development of Islamic finance and facilitated the issuance of sukuk products. In the same month, the Hong Kong Monetary Authority introduced two measures to enhance the provision of RMB liquidity to Authorized Institutions participating in RMB business in Hong Kong to foster the further development of Hong Kong as an offshore RMB business hub. 1.18 As an important part of our development strategy, Hong Kong continues to deepen its economic integration with the Mainland to take full advantage of the “Mainland factor”. To this end, Supplement X to the Mainland and Hong Kong Closer Economic Partnership Arrangement (CEPA) was signed in August, providing for a total of 73 services liberalisation and trade and investment facilitation measures. Along with the measures in the

16
previous rounds, the CEPA and its supplements cover a wide range of service sectors such as financial, tourism, construction, legal, medical and accounting services and offer preferential treatments for Hong Kong service suppliers, in tapping the vast potential of the Mainland market. In addition, further cooperation agreements with the Pan-Pearl River Delta region and Guangdong were signed in September, paving the way for deeper economic collaboration with other provinces in the Mainland. Given the Central Government’s support and our distinctive institutional advantages, Hong Kong is also poised to benefit from the coming wave of deepening economic reforms and opening-up unveiled by the Third Plenary Session of the 18th Communist Party of China Central Committee in November. 1.19 Beyond the Mainland, Hong Kong also constantly explores ways to forge closer trade relations with other economies, especially with emerging markets. In late February, Hong Kong and Thailand signed a cooperation agreement to promote collaborations on merchandise and service trade, investment, and other areas. Meanwhile, facilitative tax agreements were also signed with other trading partners to promote trade and investment flows. The Bali Package concluded at the Ninth Ministerial Conference of the World Trade Organisation in Bali in December represents a significant breakthrough, as the agreement has been a concrete step forward after the Doha Round talks launched in 2001, which may help restore momentum in future multilateral trade negotiations. Amongst the various elements of the Bali Package, the new Agreement on Trade Facilitation should benefit Hong Kong as an international trading hub and related industries, notably trading and logistics. 1.20 To brace for the ageing population and the Government’s other long-term financial commitments, the Working Group on Long-Term Fiscal Planning was established in June to formulate a more comprehensive public finances plan. The Working Group is charged with assessing long-term public expenditure needs and changes in government revenue, and proposing feasible measures with reference to overseas experience. 1.21 The Chief Executive presented the 2014 Policy Address on 15 January 2014, formulating strategic directions and measures to unleash Hong Kong’s growth potential and support the needy while nurturing the next generation to prepare for the transition ahead. On the economic front, the Government will continue its effort to
consolidate our existing competitive advantages, deepen economic links with the Mainland and overseas markets in every aspect, and foster diversity and robust growth in our industries. The Government will,

17
among other things, follow up on recommendations from the Financial Services Development Council to strengthen our position as an international financial centre, increase the number of Economic and Trade Offices in the Mainland and the rest of Asia to enhance our liaison work and tap new markets, and commence formal negotiations for a Hong Kong-ASEAN Free Trade Agreement. By attaining sustained economic growth, the Government will be on a stronger foundation to meet other pressing needs of the community such as housing, education, poverty, an aging society and environmental protection.
To take full advantage of the Hong Kong-Zhuhai-Macao Bridge when it is
completed, a Lantau Development Advisory Committee will be formed to find ways to further develop the eastern waters off Lantau Island and neighbouring areas with a view to transform the areas into an East Lantau Metropolis.
On housing issues, the Government has accepted the recommendation of
the Steering Committee of the Long Term Housing Strategy to increase land and housing supply, with the new housing target set at a total of 470 000 units in the coming ten years, of which 60% coming from the public sector.
The Government is committed to foster young people by devoting
considerable resources to formal education, strengthening vocational education and encouraging whole-person development outside the classroom settings, through which our next generation are better prepared to contribute to the society in future. On poverty alleviation, the Government will roll out new measures to encourage young people and adults in low-income families to become self-reliant through employment while providing a reasonable and sustainable social security and welfare system to help those who cannot provide for themselves.

18
Notes : (1) The Gross Domestic Product (GDP) is an overall measure of net output produced
within an economy in a specified period, such as a calendar year or a quarter, before deducting the consumption of fixed capital. In accordance with the expenditure approach to its estimation, GDP is compiled as total final expenditures on goods and services (including private consumption expenditure, government consumption expenditure, gross domestic fixed capital formation, changes in inventories, and exports of goods and services), less imports of goods and services.
(2) The seasonally adjusted quarter-to-quarter GDP series, by removing the variations that
occur at about the same time and in about the same magnitude each year, provides another perspective for discerning the trend, particularly in regard to turning points. A detailed examination reveals the presence of seasonality in the overall GDP and in some of its main components, including private consumption expenditure, government consumption expenditure, exports of goods, imports of goods, exports of services, and imports of services. However, due to the presence of considerable short-term fluctuations, no clear seasonal pattern is found in gross domestic fixed capital formation. Therefore, the seasonally adjusted series of GDP is compiled separately at the overall level, rather than summing up from its main components.
(3) In mid-2013, Census and Statistics Department conducted a technical revision exercise
to review the estimation method of cross-boundary movements of goods and services in the GDP compilation framework. As a result of the exercise, estimates of private consumption expenditure, exports of goods, and imports and exports of services were revised back to 2009. The levels and growth rates pertaining to the entire series of overall GDP were however not affected by this non-routine revision, as the exercise involved only re-classification of consumption expenditure on goods and services between residents and non-residents.

19
CHAPTER 2 : ECONOMIC OUTLOOK FOR 2014 AND THE MEDIUM TERM
Summary
• Global economic prospects have improved over the recent past, as the eurozone economy emerged from recession and as signs of the US economy gaining traction are gradually accumulating. While the policy risks in the US still need to be watched over, the budget sequestration in 2014 will be much less of a drag than it was in 2013. Moreover, the Mainland economy with its resilient domestic demand, and helped by the momentum released from further economic reforms, should also remain a key pillar to regional economic growth to the benefit of Hong Kong.
• If the latest improvements in the global economy continue and the Federal
Reserve’s tapering proceeds in a measured pace, Hong Kong’s export prospects for 2014 should turn more positive, even though the extent of pick-up may still be limited by the weak fundamentals of the advanced economies. Hong Kong’s exports of services, which used to be relatively resilient, should also extend further gains.
• Domestic demand should be able to hold up in 2014, even though the
momentum may not be as strong as in the past few years. In particular, consumption demand would be underpinned by favourable employment conditions amid a tight labour market. The prevailing positive business confidence should also help sustain investment momentum.
• The key sources of uncertainties for the 2014 outlook come from the US
Federal Reserve’s asset purchase tapering and the consequential impact on the emerging markets in terms of capital flow reversals, exchange rate fluctuations, and asset market gyrations. As such, the risk of setback in exports as well as consumer and investment sentiments in response to any surprise in future US monetary policy still could not be ruled out.
• The Hong Kong economy is projected to expand by 3-4% in 2014,
compared to the 2.9% growth in 2013 and the average annual growth of 4.5% in the past ten years. This growth forecast adopts a one-percentage-point range, instead of a two-percentage-point range as in the previous year, in face of reduced acute risks arising from the euro debt crisis and the US fiscal cliff over the past year.
• Inflationary pressures are likely to be contained in 2014 as imported
inflation is expected to stay subdued, while local rental cost pressures will

20
also likely recede. Nevertheless, the risks arising from possible swings in global food and commodity prices spurred by ample global liquidity linger. Overall, underlying Composite CPI is forecast to increase by 3.7% for 2014 as a whole, slightly lower than the average of 4.0% in 2013.
• Over the medium term, the external environment of Hong Kong will likely
continue to be restrained by the lower growth potential of the advanced economies, slower trend growth in some emerging markets, and the uncertainty arising from the normalisation of US monetary policy. In this setting, the growth spots arising from the sustained solid growth of the Mainland economy and its determination to deepen economic reforms will be of paramount importance, and Hong Kong could grasp these opportunities by strengthening integration between the two places and aligning itself to the nation’s development strategy while continuing efforts to bolster its competitiveness. Given the constraints posed by the external environment as well as the budding demographic challenges, the trend GDP growth rate in real terms is forecast at 3.5% per annum from 2015 to 2018. The trend rate of underlying consumer price inflation is forecast at 3.5% per annum.
Major external factors 2.1 The challenging external environment has taken its toll on Hong Kong’s trade performance in recent years. The pressure should be lessened in 2014 if the progress made by major advanced economies over the course of 2013 sustains and the US Federal Reserve (Fed)’s plan to taper its asset purchases continues at its currently measured pace. However, the uncertain path of future US monetary policy remains a key source of uncertainty to the global economy. Should financial strains re-emerge in various parts of the world due to concerns about US monetary policy shift, the real global economy could be undermined. 2.2 The economic performance of Hong Kong’s major trading partners is an important determinant to our export outlook in 2014. The US economic expansion has shown signs of taking hold of late. The eurozone finally emerged from recession, although the pace of expansion was still anaemic amid structural issues. The Japanese economy has grown further in 2013 on the back of the boost from monetary and fiscal stimulus, but it has to meet the challenge from the sales tax hike scheduled for April 2014. On the whole, there has been improvement in the advanced economies. Apart from this, the Mainland economy, with its resilient domestic demand, should continue to outperform the

21
advanced peers. Many other Asian economies, while showing varying paces of expansion last year, still maintain relatively sound fundamentals. Yet, given their export-oriented nature and the threat from the uncertain US monetary policy, their outlook this year is still contingent on how the global economic conditions evolve. In short, the sustainability and the power of the pick-up in advanced economies in 2014 are crucial to Hong Kong’s economic prospects this year. 2.3 The fluid global monetary environment will be the major source of risks this year. The Fed last December decided to trim its asset purchases, but it also signalled that the ultra-low interest rate environment would likely remain in place for an extended period. The central banks in Europe and Japan also pledged to maintain their highly accommodative policy stances. As such, the Fed’s tapering decision would not amount to a fundamental change to the global liquidity glut in the short term. However, as the world has been accustomed to ample liquidity and extraordinarily low interest rates, the uncertainties surrounding the future course of Fed’s moves will sharpen financial market sensitivity to US economic data, possibly tipping off portfolio reallocation and resulting in a more volatile capital flow environment. In particular for Asian economies that have received substantial capital inflows over the past several years, the risk of capital flow reversal would increase as the Fed reduces the size of the asset purchase program further, and the associated risks of financial strains, currency depreciation, and tighter domestic liquidity conditions cannot be taken lightly. 2.4 Economic and financial factors aside, the geopolitical tensions in some parts of the world may also affect global economic sentiment, especially the unsettling situation in the Middle East given the region’s dominance in oil supply and strategic location in global cargo flows. The following provides a more detailed analysis of the major external factors. Global economic outlook 2.5 The US economy only recovered modestly last year, with real GDP growth decelerating from 2.8% in 2012 to 1.9% in 2013 due mainly to the drag from fiscal entrenchment. Yet, growth momentum accelerated visibly in the second half of 2013 partly on the back of the recovering housing market and stronger private sector activity (Box 2.1). The budget deal at the end of last year that should relieve the fiscal restraints in this year and the next further improved the growth prospect. Yet, as the fiscal drag would only subside rather than reverse, US economic growth this year should continue to be powered by

22
the private sector demand. In this regard, uncertainties remain, as there are still hurdles for consumption to gather further strength given the slow job creation and possible continuation of deleveraging in the household sector. Of greater concern is the further tapering by the Fed which could lead to higher long-term interest rates, possibly dealing a blow to the nascent recovery of the housing market or capital investment. In sum, the dynamic interactions between the private sector recovery and the Fed’s tapering course will be the defining factor to US economic performance this year. To the extent that the housing market recovery as well as business and consumption sentiment could withstand the headwinds from tapering, the US economy should see faster growth in 2014. 2.6 Across the Atlantic, Europe finally emerged from its prolonged recession last year, with the imposing risks coming from the euro debt problems having receded notably following a string of strong actions taken by the European leaders. However, the European Central Bank (ECB) in November 2013 cut its policy interest rate to the historic low of 0.25%, highlighting the mounting economic challenges facing the region. Indeed, economic performances among the member states have been mixed, with Germany providing most of the recovery fuels. Moreover, the repair of eurozone’s economic fundamentals were far from complete, with huge public debt loads, stubbornly high unemployment, and an array of unresolved structural issues relating to further integration of the currency bloc outstanding (Box 2.2). These problems will likely restrain the eurozone for an extended period, keeping the economy on a low gear in 2014. 2.7 The Japanese economy, after posting rather strong performance in the first half of 2013, decelerated somewhat in the second half on a quarter-to-quarter basis, reflecting the waning boost from the aggressive monetary and fiscal stimulus measures. Down the road, it might be increasingly difficult for the Japanese economy to keep up its momentum, not only because of diminishing returns of the measures, but also the expected adverse effects on consumer sentiment due to the sales tax hike scheduled for April. The sizeable budget for the fiscal year 2014 aiming at cushioning the negative impacts of the tax hike may help at the margin, but the sustainability of such positive effects remains to be seen. Short-term challenges aside, the Japanese economy also needs to hammer out reforms to tackle the energy issues, the rapidly ageing population and other structural problems. The difficulties of putting these reforms in place should not be understated. There is also the possibility of Japan expanding its monetary stimulus further if it fails to achieve the inflation target, thereby adding uncertainty to the global monetary environment.
23
Box 2.1
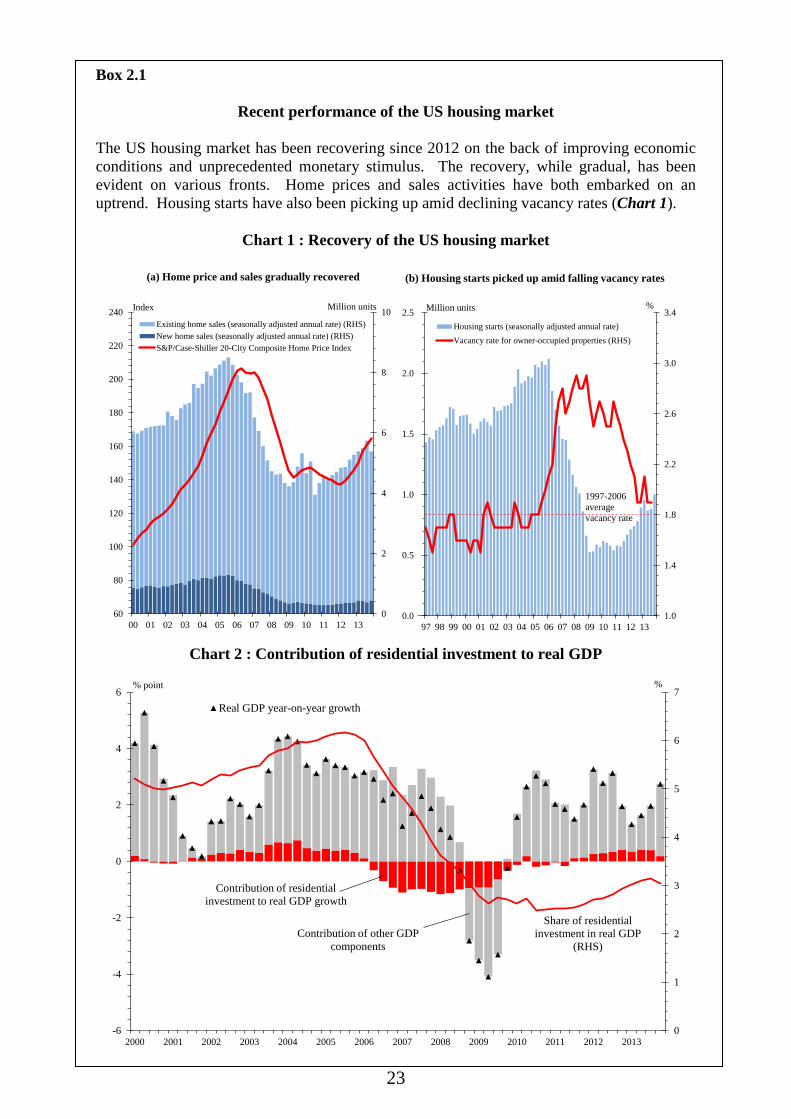
Recent performance of the US housing market The US housing market has been recovering since 2012 on the back of improving economic conditions and unprecedented monetary stimulus. The recovery, while gradual, has been evident on various fronts. Home prices and sales activities have both embarked on an uptrend. Housing starts have also been picking up amid declining vacancy rates (Chart 1).
Chart 1 : Recovery of the US housing market
Chart 2 : Contribution of residential investment to real GDP
0
2
4
6
8
10
60
80
100
120
140
160
180
200
220
240
00 01 02 03 04 05 06 07 08 09 10 11 12 13
Existing home sales (seasonally adjusted annual rate) (RHS)New home sales (seasonally adjusted annual rate) (RHS)S&P/Case-Shiller 20-City Composite Home Price Index
(a) Home price and sales gradually recovered
Index Million units
1.0
1.4
1.8
2.2
2.6
3.0
3.4
0.0
0.5
1.0
1.5
2.0
2.5
97 98 99 00 01 02 03 04 05 06 07 08 09 10 11 12 13
Housing starts (seasonally adjusted annual rate)Vacancy rate for owner-occupied properties (RHS)
(b) Housing starts picked up amid falling vacancy rates
Million units %
1997-2006 average vacancy rate
0
1
2
3
4
5
6
7
-6
-4
-2
0
2
4
6
2000 2001 2002 2003 2004 2005 2006 2007 2008 2009 2010 2011 2012 2013
Real GDP year-on-year growth
% point %
Contribution of residential investment to real GDP growth
Contribution of other GDP components
Share of residential investment in real GDP
(RHS)

24
Box 2.1 (Cont’d) The housing market recovery has contributed to the faster US economic growth in the second half of 2013, both directly and indirectly. The visible pick-up in housing starts since 2012 was directly reflected in the residential investment component of GDP. Its contribution to real GDP growth picked up from 0.01% point in 2011 to 0.32% point in 2012 and 0.33% point in 2013 (Chart 2). Correspondingly, the share of residential investment in real GDP rose from a low of 2.5% in the third quarter of 2010 to 3.0% in the fourth quarter of 2013. This compared with the average of 4.4% in the 1990s, before the housing boom in the 2000s. The housing market recovery should have also helped drive the economy indirectly through wealth effects on consumption. According to the Federal Reserve, owners’ equity in household real estate increased notably by 55% from US$6.2 trillion in the fourth quarter of 2011 to US$9.7 trillion in the third quarter of 2013 (Chart 3). However, it is unclear whether the household deleveraging process is completed. The ratio of outstanding home mortgages to disposable personal income went down from a high of 100% in the third quarter of 2007 to 75% in the third quarter of 2013. Despite the decline, the ratio remained higher than the average of 59% in the 1990s, when the housing market was in a more normal state (Chart 3). Should the deleveraging process continue in 2014, it may still constrain the growth of private consumption, keeping the US economic growth from moving to higher gear.
Chart 3 : Recovering housing wealth amid deleveraging
Also, whether the US housing market recovery could withstand the unwinding of the monetary stimulus is another concern. The Fed’s monetary policy direction has proved to be a deciding factor. The indication by the Fed in mid-2013 on the prospect of asset purchase tapering was soon followed by increases in mortgage rates and slowdown in home sales. Now that the Fed has begun reducing the asset purchases, the dynamics between the monetary policy, housing market and overall economic conditions warrant close watch. Given the tapering, it remains to be seen if the US housing market would continue to gather momentum by riding on improving economic fundamentals and in turn contribute to further economic growth.
4,000
5,000
6,000
7,000
8,000
9,000
10,000
11,000
12,000
13,000
14,000
90 92 94 96 98 00 02 04 06 08 10 12
(a) Housing wealth recovered
US$ billion
50
60
70
80
90
100
110
90 92 94 96 98 00 02 04 06 08 10 12
1990-1999 average
Ratio of outstanding home mortgage to disposable personal income
%
(b) Housing debt remained relatively high
Owner's equity in household real estate

25
Box 2.2
The eurozone’s economic recovery in perspective
Over the past five years or so, the eurozone economy had experienced two recessions – first dented by the acute global financial crisis in 2008-2009 and then a six-quarter recession that began in the fourth quarter of 2011 amid the euro debt crisis. While the eurozone economy has emerged from recession since the second quarter of 2013, its economic fundamentals remain fragile and its recovery severely impeded by structural problems and austerity measures needed to redress the high level of indebtedness. By comparing some of its major macroeconomic indicators before and after the two recessions(1), this note attempts to put the eurozone’s recent economic recovery in perspective. Despite the mild growth recorded in recent quarters, the level of real output for the eurozone as a whole in the fourth quarter of 2013 remained 2.3% lower than the pre-crisis level in the second quarter of 2008 (Chart 1). Also evident was the distinct growth dispersion among member states of the eurozone. While Germany stood out clearly as the outperformer and provided the key impetus to the region, France’s real GDP only marginally surpassed its pre-crises level. Italy and Spain, the third and fourth largest economies in the currency bloc, fared much worse. Member states that requested for bailouts also had considerable slack.
Labour market conditions in the eurozone also remained difficult alongside the widespread economic weakness, with the seasonally adjusted unemployment rate staying elevated at 12.0% in the fourth quarter of 2013, far above the 7.5% recorded in the second quarter of 2008 (Chart 2). In fact, except for Germany, the prevailing unemployment rates in most of the major member states were still notably higher than their respective levels in the second quarter of 2008. More worryingly, youth unemployment (i.e. for workers of less than 25 years old) in the eurozone has been even more acute, shooting up from 15.6% to 23.9% over the same period, which could have serious consequences on Europe’s longer-term growth potential if the situation persists. (1) The collapse of Lehman Brothers took place in September 2008. This is widely considered as the event that marked the
beginning of the global financial crisis, which also eventually triggered the euro debt crisis. Therefore, in this note the second quarter of 2008 is taken as the reference period for the pre-crisis situation.
-2.3
3.4
0.7
-8.5
-7.1
-5.1-6.5
-10
-8
-6
-4
-2
0
2
4
6
Eurozone Germany(28.1%)
France(21.4%)
Italy(16.5%)
Spain(10.9%)
Ireland(1.7%)
Portugal(1.7%)
Change in seasonally adjusted real GDPbetween Q2 2008 and Q4 2013^
Percent
Chart 1 : The eurozone economy has yet to recover to its pre-crisis level
(^) GDP figures of member states in Q4 2013 were calculated based on the flash growth estimates released on 14 February 2014.(*) Refers to the GDP change between Q2 2008 and Q3 2013, the latest period with GDP figure available.Figures in brackets represent the respective member state's % share in eurozone's nominal GDP in 2012.Greece does not publish seasonally adjusted GDP figures after the first quarter of 2011.
Notes :
*

26
Box 2.2 (Cont’d)
Furthermore, the debt burden on most of the member states, after rising rapidly over the past few years, will likely remain monumental in the foreseeable future. According to projections by the IMF in October 2013, the gross government debt to GDP ratio for the eurozone was expected to decline only gradually in the coming few years and remain notably higher than the pre-crisis level (Chart 3). As such, further sustained efforts will still be needed to repair the region’s public finance, thereby continuing to post a drag on growth in the years ahead.
To conclude, while the acute risks of the euro debt crisis have receded notably, the economic outlook for the eurozone remains challenging. The need for fiscal consolidation makes it difficult for the member states to boost growth and bring down unemployment in the near term. While the formation of a banking union has made some progress, the European leaders must also take further strong policy actions to enhance market confidence in the euro by strengthening the various institutions that would make the monetary union sustainable.
7.5 7.7 7.7 6.9
10.5
5.6
8.4 7.5
12.0
5.1
10.8 12.7
26.1
12.3
15.5
28.0
0
5
10
15
20
25
30
Eurozone Germany France Italy Spain Ireland Portugal Greece
Q2 2008
Q4 2013
Chart 2 : Unemployment rate has increased significantly in nearly all member states
Unemployment rate (%), seasonally adjusted
(^) November 2013 figure.Note :
^
20
40
60
80
100
120
140
2007 2008 2009 2010 2011 2012 2013 2014 2015 2016 2017 2018
Eurozone Germany France Italy Spain Portugal Ireland
Chart 3 : Government gross debt to GDP ratioPercent
IMF projections
27
2.8 Granting that the Fed were to taper its monetary stimulus gradually without upsetting the US recovery and global financial stability, and that the huge debt loads in Europe and Japan would not derail their economies, the advanced economies as a whole, led by the US, should be able to achieve faster growth in 2014. In January, the International Monetary Fund (IMF) projected that the real GDP growth of the advanced economies would pick up from a meagre 1.3% in 2013 to 2.2% in 2014, which if achieved, would represent the fastest growth since 2010. 2.9 Many emerging economies, including some of those in Asia, moderated in growth last year amid the sluggishness of the advanced economies, more volatile capital flows and domestic supply-side bottlenecks. While there were some signs of stabilisation towards the end of 2013, an important source of concern this year would be the risks of disruptive capital flows and asset price volatility associated with the Fed’s future moves. The lesson learnt from last summer is that any dramatic action pointing to possible premature withdrawal of US monetary support could lead to sharp gyrations in emerging market currencies and asset prices, including those in Asia. Again, granting no significant shocks brought about by Fed’s policy shifts and that the demand conditions in the advanced economies turn better as expected, the performance of developing Asian economies should hopefully be more stable this year. According to IMF’s latest projection, the developing Asian economies would grow by 6.7% in 2014, slightly up from 6.5% last year. Nonetheless, there is no room for complacency, as the capability to cope with more volatile capital flows vary across economies and the contagion from individual emerging markets with weaker fundamentals could spread quickly to others in an increasingly globalised world.

28
2.10 The Mainland economy has thus far been on track to beat the 7% trend growth target between 2011 and 2015 enshrined in the 12th Five Year Plan. While the external sector is susceptible to the vicissitudes of the demand conditions in the advanced economies, the Mainland’s domestic sector looks set to maintain steady growth on the back of continued urbanisation, further development of the services sector, and the Central Government’s long-standing policy objective of economic re-structuring towards domestic demand. The directives given in the Third Plenary Session of the 18th Central Committee of the Communist Party of China, including deepening rural-urban integration as well as pushing forward fiscal and financial reforms, will also help unleash growth potential and present new business opportunities. Save for any unforeseen negative shocks from the advanced economies, the Mainland should continue to play a key stabilising role in the region, with GDP growth of above 7% in 2014, far outpacing the advanced economies. Specifically, the IMF projected the Mainland economy to grow by 7.5% in 2014, after a 7.7% expansion in 2013. 2.11 With the advanced economies led by the US expected to see further improvement and the emerging markets poised to maintain their growth performance, the global economy should be able to attain a somewhat faster growth in 2014. In recognition of the latest progress in the world economy, the IMF in January projected that the world economy would stage an improvement, with growth picking up somewhat from 3.0% in 2013 to 3.7% in 2014, 0.1 percentage point higher than the October round forecast.
-4
-2
0
2
4
6
8
10
12
1998 1999 2000 2001 2002 2003 2004 2005 2006 2007 2008 2009 2010 2011 2012 2013 2014*
World
Source : Note :
Advanced economies
Developing Asia
Diagram 2.1 : The Asian region is likely to maintain steady growth in 2014, while the advanced economies should see some relative improvement
Real rate of change (%)
IMF World Economic Outlook Update, January 2014.(*) Forecasts from the IMF.

29
Table 2.1 : Growth forecasts for major economies in 2014
2013*
(%)
2014
IMF*
(%)
Private sector forecast^
(%) World (PPP## weighted) 3.0 3.7 - Advanced economies 1.3 2.2 -
US 1.9# 2.8 2.9 Eurozone -0.4# 1.0 1.0
Japan 1.6# 1.7 1.6 Emerging market and
developing economies
4.7 5.1 - Developing Asia 6.5 6.7 -
Mainland China 7.7# 7.5 7.5 India 4.4 5.4 5.4
Middle East and North Africa
2.4 3.3 -
Notes : (*) World Economic Outlook Update, IMF, January 2014. (^) Average forecast as at February 2014. (-) Not available. (#) Actual figures. (##) PPP refers to purchasing power parity. Monetary conditions, exchange rates and price competitiveness 2.12 The evolution of future global monetary conditions remains the largest source of uncertainties in 2014. The global monetary conditions would likely remain exceptionally accommodative in the coming year, as the central banks in US, EU, and Japan all pledged to maintain their exceptionally low interest rate for an extended period. However, the start of Fed’s tapering of monetary stimulus in January marked an important turning point, and created new uncertainties, especially amid an environment of excessive liquidity that could induce notable volatilities in the global financial markets and abrupt changes in capital flows across economies. As far as the Asian economies, including Hong Kong, are concerned, various renditions of quantitative easing by the advanced economies have resulted in a substantial amount of liquidity parked in the region. Even if the Fed continues to stay its hand on its policy rate target, the policy signal sent by the Fed’s further tapering could induce oversized market reactions and capital outflows from Asia, and possibly lead to even more volatile financial conditions, generate strains in foreign exchange markets and pose downward pressure on asset prices in the region.

30
2.13 On the exchange rate front, the Hong Kong dollar appreciated slightly against a basket of major currencies, alongside the US dollar under the linked exchange rate system during 2013. The nominal trade-weighted effective exchange rate index of the Hong Kong dollar strengthened slightly during the first quarter, and then more visibly around mid-2013 against the weakness of the euro, before softening somewhat in the latter part of the year as the global economic environment tended to stabilise. In December 2013, the index rose slightly by 0.7% over a year earlier. The direction of exchange rate movements in 2014 will remain, as it has always been, subject to considerable uncertainty, particularly given the uncertain monetary policy outlook in the major economies and its impacts on the US dollar. Yet as far as Hong Kong is concerned, barring the case of sharp changes in the exchange value of major currencies as with the yen in 2013, the exchange rate is likely to be a less important factor in determining Hong Kong’s export growth prospects.
2.14 Given Hong Kong’s close economic relations with the Mainland, the movement of the renminbi (RMB) is one key factor affecting the performance of Hong Kong’s external sector, including both trade in goods and services. A stronger renminbi could weaken the price competitiveness of Hong Kong’s re-exports of goods of Mainland origin, but at the same time it could also attract Mainland’s demand for Hong Kong’s goods and services exports. The renminbi was on a gradual appreciation path against the US dollar throughout 2013, ending the year by about 3% higher. Going forward, the Mainland authorities are widely expected to proceed with the exchange rate regime reform in a controlled and gradual manner, avoiding significant fluctuations in the exchange
0.440.460.480.500.520.540.560.580.600.620.640.660.680.700.720.740.76
0.60
0.62
0.64
0.66
0.68
0.70
0.72
0.74
0.76
0.78
0.80
0.82
0.84
0.86
0.88
1/07 1/08 1/09 1/10 1/11 1/12 1/13 1/14
euro/US$pound/US$
1.15
1.20
1.25
1.30
1.35
1.40
1.45
1.50
1.55
1.60
75
80
85
90
95
100
105
110
115
120
125
1/07 1/08 1/09 1/10 1/11 1/12 1/13 1/14
Yen/US$S$/US$
Diagram 2.2 : The foreign exchange market is likely to remain volatile in 2014(a) against euro and pound sterling (b) against yen and Singapore dollar
₤ S$Yen€

31
value of the renminbi. A relatively stable renminbi can help reduce the exchange rate uncertainty facing Hong Kong’s companies, given the important role played by the Mainland in the regional supply chains and the increasing use of renminbi for cross-border trade settlements.
World inflation and global commodity prices 2.15 Inflationary pressures moderated somewhat across most major economies over the past year as global economic growth was subpar and international commodity prices held largely stable. With still-pronounced economic slacks in the advanced economies, global inflation, especially in Europe and the US, will likely remain rather mild in the near term. Focusing on Hong Kong’s major import sources in Asia, inflation in the Mainland should be well contained with the People’s Bank of China’s pursuit of a prudent monetary policy, while the notable weakening of the yen over the past year should also help restrain the price rise in goods imported from Japan. Having said that, some Asian emerging economies with looser control over the monetary conditions, sustained external imbalances and domestic supply constraints may still experience relatively high inflation in 2014. 2.16 The movements of international food and commodity prices is a key factor affecting the inflation outlook for Asia. In this regard, many international commodity prices saw little upward pressure in 2013. The prices of agricultural raw materials rose only marginally while those of metals and energy dipped. Global food prices in particular, according to the Food and Agriculture Organisation (FAO) of the United Nations, fell mildly by an average of 1.6% in
80
90
100
110
120
130
140
150
160
170
180
190
7/05 1/06 7/06 1/07 7/07 1/08 7/08 1/09 7/09 1/10 7/10 1/11 7/11 1/12 7/12 1/13 7/13 1/14
RMB against US$RMB against EuroRMB against YenRMB against S$RMB against Won
Index (20 Jul 2005=100)
Diagram 2.3 : A relatively stable renminbi will help reduceuncertainty facing Hong Kong's trading companies
Note : An increase in the index represents an appreciation of renminbi against the currency concerned.

32
2013 after a 7.3% drop in 2012. Meanwhile, it should however be noted that the geopolitical conditions in the Middle East remain rather fluid. An abrupt worsening of the situation could have significant impacts on oil prices given the region’s dominance in global oil supply. The international food prices could also be sensitive to adverse supply shocks arising from unfavourable extreme weather conditions.
Major sources of uncertainty 2.17 Global economic conditions have improved towards the end of 2013, but the outlook for 2014 is still subject to uncertainties. First and foremost, the uncertain path of US monetary policy and its possible spill-over remain the biggest source of concerns. If the US economic recovery falters, the Fed would refrain from tapering or even augment the asset purchase program, but global growth and trade flows would worsen again in this scenario. However, if the US economic performance broadly matches the Fed’s optimistic expectation, the tapering would proceed further throughout 2014, bringing forward the expectation that the Fed would eventually need to return interest rates to more normal levels and inducing volatilities in financial markets worldwide. The emerging and Asian economies that have built up risks of economic imbalance or became increasingly dependent on short-term capital flows in the era of quantitative easing would be particularly vulnerable. Second, there is a risk that the EU economy might be trapped in a slow-growing path for a prolonged period given the severe structural issues in many member states. The huge debt loads, especially in conjunction with weak growth and high unemployment rate,
20
40
60
80
100
120
140
160
180
200
220
240
260
1/02 7/02 1/03 7/03 1/04 7/04 1/05 7/05 1/06 7/06 1/07 7/07 1/08 7/08 1/09 7/09 1/10 7/10 1/11 7/11 1/12 7/12 1/13 7/13 1/14
Index (2005=100)
Diagram 2.4 : Sharp swings in world commodity prices cannot be ruled outamid the global liquidity glut
Food
Agricultural raw materials
Fuel (energy)
Note : Indices as depicted refer to IMF's commodity price indices.

33
will likely persist in some weaker eurozone economies and, as such, the tail risk of the euro debt problem re-intensifying could not be completely ruled out. Third, the Bank of Japan may undertake further easing measures should the Japanese economy fail to attain sustainable growth and inflation, adding volatility in the currency markets. Fourth, some emerging markets, constrained by the weak demand conditions in the advanced economies and their own supply-side impediments, may find it difficult to regain faster growth momentum. Fifth, the still fluid political environment in the Middle East and heightened geopolitical tensions in some parts of the world may pose a threat to oil prices and international trade flows. In sum, there are still downside risks to the global economic outlook for 2014. 2.18 On the positive side, if the Federal Reserve could better communicate its policy intention while the US economy recovering better than expected, the global financial conditions could be more stable during the course of its tapering. This would help minimize the negative impacts on global economic and financial stability. Also, if the US Congress makes use of the time gained by the recently passed budget deal to craft out a credible plan to address long-term fiscal sustainability, another key risk to the global economy would be removed. In a similar vein, if Europe’s policy leaders, building on the progress in creating a banking union over the past year or so, continue to take decisive actions to strengthen the institutions of the monetary union, this would boost global confidence in Europe and help stimulate growth there. There could also be some upside potential if the Mainland and other major emerging market economies turn out to perform better than expected, thereby providing a stronger support to the global economy. Outlook for the Hong Kong economy in 2014 2.19 As a small open economy, Hong Kong’s economic performance will hinge crucially on the global economic and financial conditions. If the global economic expansion gains more traction alongside the pick-up in import demand from the advanced economies, and if the Fed steers the tapering at a measured pace with a clear communication strategy, minimising its impact on the emerging market economies, Hong Kong’s total exports of goods should improve somewhat further in 2014.

34
2.20 Exports of services should extend further gains in 2014. In particular, the inbound tourism will likely maintain rather notable growth, driven by the influx of visitors from the Mainland. Exports of financial and business services should benefit from stronger fund-raising and cross-border financial activities and pick up further. Meanwhile, exports of trade-related services, comprising mostly offshore trade, and exports of transportation services, should also stage some relative improvement, the extent of which hinges on the strength of regional and international trade flows.
-16
-12
-8
-4
0
4
8
12
16
20
24
-4
-2
0
2
4
6
2000 2002 2004 2006 2008 2010 2012 2014*-30
-20
-10
0
10
20
30
40
38
42
46
50
54
58
62
66
2005 2006 2007 2008 2009 2010 2011 2012 2013 2014
IndexWorld economic
growth rate (LHS)
Hong Kong's PMI shiftedforward by two months
(LHS)
Hong Kong'stotal exports
(RHS)
Hong Kong's total exports (RHS)
Real rate of change (%)
Diagram 2.5 : Hong Kong's exports of goods should show modest acceleration in 2014Year-on-year rate of change (%)Real rate of change (%)
Source : IMF World Economic Outlook Update January 2014.(*) Forecast from the IMF.
-6
-4
-2
0
2
4
6
-24
-20
-16
-12
-8
-4
0
4
8
12
16
20
24
2002 2004 2006 2008 2010 2012 2014*
Hong Kong's exports to the US (LHS)US GDP (RHS)
-6
-4
-2
0
2
4
6
8
10
12
14
16
-18
-12
-6
0
6
12
18
24
30
36
42
48
2002 2004 2006 2008 2010 2012 2014*
Hong Kong's exports to Asia (excluding Japan) (LHS)Developing Asia's GDP (RHS)
Diagram 2.6 : Regional trade should continue to be supported by the solid growth of the Mainland economy
(a) United States (b) AsiaReal rate of change (%)% change Real rate of change (%)% change
Note : (*) Forecasts from the IMF World Economic Outlook Update, January 2014.

35
2.21 Domestic demand, a resilient growth driver, should be able to hold up in 2014, even though the pace may not be as fast as in the past few years. Specifically, the positive hiring sentiment reported in the latest Quarterly Business Tendency Survey and the stable employment conditions among the small and medium-sized enterprises (SMEs) should bode well for labour market outlook in the near term, thereby lending support to the local consumption market. As for investment, public infrastructure works are expected to stay hectic. Machinery and equipment acquisition is poised to further growth in tandem with the general pick-up in business activity, though they are typically
30323436384042444648505254565860
0
200
400
600
800
1,000
1,200
1,400
1,600
1,800
2,000
2,200
1997 2003 2008 2013
Hong Kong's total exports to Mainland
Hong Kong's imports from Mainland
% share of total trade with Mainland in Hong Kong's total trade
(a) Merchandise trade
HK$Bn Percent
20
25
30
35
40
45
50
55
60
65
70
75
80
0
10
20
30
40
50
60
70
80
90
100
1997 2003 2008 2013
Visitor arrivals from Mainland
Hong Kong resident departures to Mainland
% share of visitor arrivals from Mainland in total incoming visitors
(b) Visitor arrivals from Mainland and Hong Kong resident departures to Mainland
PercentNumber (million)
Diagram 2.7 : The Mainland factor will continue to support the Hong Kong economy
15
20
25
30
35
40
45
50
55
60
65
70
75
0
5
10
15
20
25
1997 2003 2008 2013
Total Mainland enterprises % share of Mainland enterprises
(c) Market capitalisation of Mainland enterprises in
the Hong Kong stock market(end-year figures)
HK$Tn Percent
05
1015202530354045505560657075
1998 2002 2007 2012
Hong Kong's inward direct investment from Mainland Mainland's foreign direct investment from Hong Kong
(d) Mainland's foreign direct investment from Hong Kong and Hong Kong's inward direct
investment from Mainland
US$Bn

36
volatile and sensitive to swings in the external environment. Indeed, given the uncertain path of US monetary policy and its potential negative impacts on the global economic and financial conditions, it is important to stay vigilant to the possibility of large financial and asset markets fluctuations, which may dampen consumer and business sentiments.
-4
-3
-2
-1
0
1
2
3
4
-15
-10
-5
0
5
10
15
2003 2004 2005 2006 2007 2008 2009 2010 2011 2012 2013
Private consumption expenditure (LHS)Total employment (RHS)
Diagram 2.8 : Private consumption should be supported by the still favourable labour market conditions
Year-on-year rate of change in real terms (%) Year-on-year rate of change (%)
-30
-24
-18
-12
-6
0
6
12
18
24
30
36
-10
-8
-6
-4
-2
0
2
4
6
8
10
12
2003 2004 2005 2006 2007 2008 2009 2010 2011 2012 2013
PCE (LHS)
Residential flat price(RHS)
-80
-60
-40
-20
0
20
40
60
80
100
120
-10
-5
0
5
10
15
2003 2004 2005 2006 2007 2008 2009 2010 2011 2012 2013
Diagram 2.9 : Consumer sentiment may be affected by asset market performance
(a) Housing wealth
PCE (LHS)
(b) Equity wealth
Equity wealth(RHS)
Year-on-year rate of changein real terms (%)
Year-on-yearrate of change (%)
Year-on-year rate of changein real terms (%)
Year-on-yearrate of change (%)

37
2.22 Taking into account the likely improvement in export growth, the Hong Kong economy is projected to expand by 3-4% in 2014, after the 2.9% growth in 2013. This would still be slightly lower than the average growth of 4.5% in the past ten years. Compared with the previous two years, the range of the forecast is reduced back to the normal range of one percentage point, reflecting notably reduced acute risks from the US fiscal and euro debt problems over the past year. The prevailing forecasts by the private sector analysts mostly fall within the range of 3-4%, averaging around 3.6%. The official forecast is built on the assumptions that the US economic recovery
-18-15-12-9-6-30369121518
-60-50-40-30-20-10
0102030405060
2008 2009 2010 2011 2012 2013 2014
Expected change in business situation (LHS)
Net balance indicates the direction of expected change in business situation versus preceding quarter. It refers to thedifference in percentage points between the proprotion of establishments choosing "better" over that choosing"worse". A positive sign indicates a likely upward trend while a negative sign, a likely downward trend.
Note : (*)
Net balance* (% point)
Domestic demand growth (RHS)
Diagram 2.10 : Sanguine business sentiment should help sustain domestic demand growth
Year-on-year rate of change (%)
-5
-4
-3
-2
-1
0
1
2
3
4
5
-30
-20
-10
0
10
20
30
2008 2009 2010 2011 2012 2013 2014
Business expectation on employment (LHS)
Notes : (*)
(#)
Net balance* (% point)
Employment growth# (RHS)
Diagram 2.11 : Hiring sentiment stays positive
Net balance indicates the direction of expected change in number of persons engaged versus preceding quarter. Itrefers to the difference in percentage points between the proportion of establishments choosing "up" over thatchoosing "down". A positive sign indicates a likely upward trend while a negative sign, a likely downward trend.Employment in private sector.
Year-on-year rate of change (%)

38
could make further progress with smooth tapering by the Fed causing no significant disturbance to global financial stability, while the slow eurozone recovery would continue. The major downside would come from the possible volatile global financial conditions, as financial strains arising from shifts in US monetary policy could re-surface again and develop quickly to hamper global real activity. The possibility for the progress of the advanced economies to stall or even set back, though diminishing, also cannot be ruled out. On the other hand, there could be some upside potential to the forecast, should the global economic recovery pick up better than expected and create a more favourable environment, or Asia’s domestic demand provides more powerful support to intra-regional trade to the benefit of Hong Kong.
2.23 Underlying inflation in Hong Kong has declined from 5.3% in 2011 to 4.7% in 2012 and further to 4.0% in 2013. The easing trend will likely continue in 2014. Externally, the still-pronounced excess capacity in the advanced economies and the tame inflation outlook of Hong Kong’s major trading partners should help reduce price pressures from imports. The mild increase in global food prices recently is also a favourable development for our food inflation. Domestically, the movements of private housing rentals, a major contributor to inflation in the previous year, should become more favourable as the much moderated rise in fresh-letting flat rentals in the past few quarters successively feeds through. Barring unforeseen spikes in international commodity prices, underlying Composite CPI is forecast to increase by 3.7% for 2014 as a whole, slightly lower than the average of 4.0% in 2013. Taking into account the effects of the Government’s one-off measures, headline
-6
-4
-2
0
2
4
6
8
10
2003 2004 2005 2006 2007 2008 2009 2010 2011 2012 2013 2014*
GDP
10-year trend growth (2004-2013)
Diagram 2.12 : Economy expected to grow moderately further
Real rate of change (%)
Note : (*) Mid-point of the range forecast. (Forecast)

39
Composite CPI is forecast to increase by 4.6% in 2014, after 4.3% in 2013. The GDP deflator is forecast to rise by 1%, largely on account of the expected modest increase in domestic prices and the likely change in the terms of trade.
Forecast rate of change in 2014 (%)
Gross Domestic Product (GDP) Real GDP 3 to 4 Nominal GDP 4 to 5 Per capita GDP, in real terms 2.1 to 3.1 Per capita GDP at current market prices HK$304,500-307,400 (US$39,000-39,400) Composite Consumer Price Index Headline Underlying
4.6 3.7
GDP Deflator 1
Forecast on Hong Kong’s GDP growth in 2014 recently made by other selected parties
(%) The University of Hong Kong 3.3 to 4.1 Average forecast by private sector analysts#
3.6
Note : (#) Forecast GDP growth rates by private sector analysts mostly fall between 3% and 4%.
-8
-6
-4
-2
0
2
4
6
8
2003 2004 2005 2006 2007 2008 2009 2010 2011 2012 2013 2014*
HeadlineComposite CPI
Diagram 2.13 : Inflation is expected to remain stable in 2014
Rate of change (%)
(Forecast)
GDP deflator
UnderlyingComposite CPI

40
Medium-term outlook for the Hong Kong economy 2.24 Over the medium term, challenges arising from the hangovers of the global financial crisis could stay and continue to evolve (see Box 2.3). Given notable weak fundamentals and continued efforts of fiscal retrenchment, the European and Japanese economies are likely to remain on a slow-growing path with non-negligible risks of setbacks in the coming years. The US economy may perform comparatively better, now that the private sector demand there has been recovering. However, the policy risks arising from the normalisation of the monetary policy and attaining long-term fiscal sustainability will remain, with possible negative spill-over to the rest of the world, especially the emerging markets. Years of underinvestment in infrastructure and persistent high long-term unemployment after the global financial crisis may also have undermined the growth potential of the advanced economies beyond the near term. 2.25 Emerging markets, with their stronger underlying growth potential, should remain the key growth drivers of the world in the coming years. Nonetheless, their growth pace will also likely be more moderate than in the past given the external and domestic constraints. Moreover, those economies with weaker financial systems and larger external imbalances could be more susceptible to the possible shocks brought about by the unwinding of monetary stimulus in the advanced economies. 2.26 Against the lower growth potential of major advanced economies, the Mainland will remain our primary sources of growth opportunities, and the opportunities could be grasped by strengthening economic ties between Hong Kong and the Mainland and by positioning Hong Kong in line with the nation’s economic reform agenda. The Government has constantly sought ways to forge deeper economic integration with the Mainland through the CEPA and other Government-to-Government platforms, via which Hong Kong service providers could tap the ever-growing markets amid the nation’s rebalancing the economy towards consumption and services. The endeavour of developing Hong Kong into a leading offshore RMB business centre and asset management centre has made visible progress and the efforts will continue, realising the role laid out in the dedicated chapter of National 12th Five Year Plan. Sweeping economic reforms and opening-up in the coming years, as set out by various decisions passed by the Third Plenary Session of the 18th Central Committee of the Communist Party of China, will create new demand for high-end services, which our highly efficient service sectors are well-positioned to take advantage of. In sum, the combination of Mainland factor and the qualities of a world-

41
class international financial and business hub offered by the “One Country, Two Systems” will remain our biggest competitive edge to develop our economy in the face of possible extended sluggishness of the advanced economies and other external uncertainties. 2.27 Domestically, the Government will continue its efforts in upgrading human capital and physical infrastructure to maintain Hong Kong’s competitiveness. Large-scale infrastructure construction will continue to proceed intensively in the coming few years, adding impetus to domestic demand growth. However, the working age population has already been growing at a slower pace amid an ageing population, and the effects of the demographic shift will turn more apparent over time and restrain Hong Kong’s medium to longer-term growth. Taking into account the lingering external challenges, the still-bright Mainland’s prospect as well as Hong Kong’s advantages and demographic challenges, the economy is expected to attain a trend growth of 3.5% per annum from 2015 to 2018.
2.28 Productivity growth in Hong Kong will continue to come from the shift of Hong Kong towards higher value added and knowledge-based economy. Although this structural shift is important in sustaining Hong Kong’s competitiveness and hence longer-term development, there are also concerns about the possible implications for income and wealth disparities. While an ageing population will cause the issue of labour shortages to become even more prominent and constrain economic growth, it also has profound implications for our public expenses on healthcare and other social services. In view of all these, it is important to continue to exercise fiscal prudence, so as to preserve our ability and ensure sufficient public resources to invest in infrastructure and human capital to drive the economy and also to tackle the social issues through various programmes.

42
Box 2.3
Medium and long-term growth outlook of major economies
The recovery in major advanced economies have been slow and unstable in the past five years, reflecting the profound legacies of high unemployment levels, excess capacity and weighty debt burdens left by the financial meltdown of 2008. Despite the improved outlook for 2014, activity in many advanced economies further down the road will likely be constrained if these issues are not addressed by fundamental reforms promptly. Besides, the new challenges arising from US monetary policy shifts and slower trend growth of emerging market economies have also surfaced. Coupled with the global population ageing headwinds in the longer term, there are concerns that the more volatile and less growth-supportive external landscape post-financial-tsunami would become a new norm. The journey of recovery in the euro area is still fraught with difficulties, as fiscal retrenchment will likely continue for a few years given that the public debt loads of many member states still exceed targets and as the weak credit dynamics could pose further obstacles to the private demand recovery. Consumers in the region may also stay frugal unless the labour market recuperation accelerates. Further ahead, the labour market rigidity and other structural problems could add friction to the recovery, while the much-needed reforms to rebuild fundamentals could confront notable political resistance amid growth sluggishness. Although the policy initiatives taken by the EU leaders to resolve the debt problems in the past few years are steps in the right direction, the eurozone is still not totally out of the woods, and there is still a long way to go to establish a robust monetary union to avoid renewed financial distress in future. Hence, the EU Commission, the IMF and most private analysts forecast the real GDP to grow by around 1.5% per year between 2015 and 2018, which is lower than the average rate in the decade before 2008 (Chart 1a). By comparison, the US economic recovery has stronger support deriving from improving fundamentals in the housing market, quick adjustments of financial institutions’ balance sheets, and growing benefits from the shale gas revolution. However, the optimism has to be qualified by the still-slow job recovery featured by fits and starts, the possibility of further deleveraging by households and the absence of a medium-term fiscal consolidation plan. Apart from these problems, the US growth potential in the longer term will likely fall due to slower increases in labour force and productivity amidst population ageing, a common formidable challenge to many economies in the next decade. As such, the IMF, the Congressional Budget Office, the Federal Open Market Committee (FOMC) participants and most private analysts generally forecast a further acceleration of US economic growth in the coming two to three years, followed by a gradual convergence to a lower longer-term potential growth rate (Chart 1b). Moreover, the expected acceleration of US economic growth in the near term aforementioned is a mixed blessing, as it would be accompanied by a narrowing output gap and thereby growing risks of monetary stimulus exit and the initiation of the interest rate hikes. At this stage, the Fed seemingly prefers gradualism, but the ultimate exit strategy will actually be contingent on US economic performance as well as price stability. The impacts on global financial conditions and real activity in the coming years over the course of the Fed’s monetary policy normalisation are still uncertain, depending on the speed of the Fed’s exit and the clarity of its communication, the cyclical positions of other economies, and the capability of the emerging markets in contending with capital flow volatility and rising interest rates.

43
Box 2.3 (Cont’d)
Chart 1 : Longer-term GDP growth projections for the US and euro area
Source: (*) World Economic Outlook October 2013 and January 2014 Update; (^) European Commission 2012 Fiscal
Sustainability Report and Autumn 2013 European Economic Forecast; (~) Congressional Budget Office Economic Baseline Projections, February 2013; (@) Consensus Economics October 2013 and February 2014; and (&) FOMC projection materials, December 2013 meeting
-5
-4
-3
-2
-1
0
1
2
3
4
5
1990 1995 2000 2005 2010 2015 2020 2025
IMF*
European Commission^
Private sector Analysts @
Pre-crisis trend(1998-2007)
Financial tsunami and European debt crisis
(2008-2013)
Medium-term trend
(2015-2018)
Longer-term trend
(2019-2025)
-5
-4
-3
-2
-1
0
1
2
3
4
5
1990 1995 2000 2005 2010 2015 2020 2025
IMF*
Congressional Budget Office~
FOMC participants &
Private sector Analysts @
Pre-crisis trend(1998-2007)
Financial tsunami and European debt crisis
(2008-2013)
Medium-term trend
(2015-2018)
Longer-term trend
(2019-2025)
(a) Euro-area growth on balance is expected to stay below the pre-crisis level
(b) US growth is expected to accelerate first before converging to a lower trend growth
Year-on-year rate of change in real terms (%) Year-on-year rate of change in real terms (%)
As the recipients of massive excess liquidity, emerging market economies are exposed to the risks of capital flow reversals, tighter financial conditions and slowdown in real activity during the Fed’s exit to its unconventional monetary easing, with economies having lax financial supervision and large external imbalances being more vulnerable. Apart from global monetary risks, the performance of export-oriented emerging economies, including those in Asia, may still be constrained by the sub-par recovery of many advanced markets. With a more volatile capital flow environment, a less buoyant external demand, compounded by supply-side bottlenecks in individual countries, the trend growth of emerging markets as a group is likely to moderate in the coming years, according to the IMF, to around 5.4% per year between 2015 and 2018, which should still outpace their developed peers and remain the world’s growth pillar. The Mainland should continue to be an important anchor for the world economy. Economic reforms in a wide range of areas will be deepened, aiming at rebalancing the economy towards an intensive growth model propelled by productivity gains. Decisive reform results in important fields are expected to be achieved by 2020, through which the nation’s long-term growth sustainability would be enhanced. Given the strong underlying fundamentals, and the anticipation of new potential unleashed by reforms, the IMF envisaged that the Mainland will grow by around 7 percent per year between 2015 and 2018. Such a solid and robust growth, though lower than the double-digit pace in the past decade, would still be among the highest in the global league, making it a vital stabilising force to the global economy in the medium to longer term.

44
2.29 Over the medium term, the upside risks to inflation still should not be taken lightly in view of the global liquidity glut and substantial uncertainties surrounding global monetary policies and economic performance. Government’s efforts in increasing land and housing supply must continue, so as to expand Hong Kong’s economic growth capacity and also help contain domestic inflation risks in the years to come. In particular, in the unlikely event that the global economic expansion proceeds faster than expected, any delay by central banks in the advanced economies in draining the excess liquidity could lift international commodity prices and worldwide inflation quickly and pose renewed upside risks to Hong Kong’s inflation outlook. Taking these factors together, the trend rate of change in the underlying CCPI in Hong Kong for the four years from 2015 to 2018 is forecast at 3.5% per annum.
5.2
3.2
4.0
3.5
0
1
2
3
4
5
6
7
2002-2005 2006-2009 2010-2013 2015-2018
Diagram 2.14 : Medium term economic prospects slightly below past trend
Trend GDP growth rate (%)
45
CHAPTER 3 : THE EXTERNAL SECTOR Summary
The global trading environment was challenging in 2013, constraining the performance of Hong Kong’s external sector. Five years after the outbreak of the global financial crisis, the growth pace of the advanced economies remained subpar and continued to weigh on Asia’s exports and production activities. While the Mainland economy stayed relatively resilient, other large emerging markets saw notable growth slowdown amid looming internal structural issues exposed by the weak global environment. Discussions about the tapering of the US Fed’s asset purchases also triggered a bout of financial jitters in mid-2013, adversely affecting some emerging markets.
Amid such a weak external environment, Hong Kong’s merchandise exports grew modestly during most of 2013. For the year as a whole, merchandise exports expanded by 2.8% in real terms(1). The US market stayed lacklustre throughout 2013. On the other hand, exports to the EU market ended nine quarters of contraction and returned to modest growth in the second half of the year, as the eurozone economy emerged from recession. Exports to the major Asian markets were mixed. Exports to Japan fell notably amid a weaker yen, while those to the Mainland and India grew solidly during most of 2013.
Exports of services continued to fare better than those of goods in 2013, and also improved visibly in performance when compared to 2012. Exports of travel services maintained double-digit growth throughout the year, buttressed by the brisk expansion of inbound tourism. Exports of financial and other business services also turned better after the first quarter, thanks to improved global business sentiment. However, exports of trade-related services and transportation services remained slack, dragged by sluggish international and regional trade flows.
Hong Kong continued its efforts to forge closer economic relations with traditional as well as new markets in 2013. Supplement X to the Mainland and Hong Kong Closer Economic Partnership Arrangement (CEPA) was signed in August, facilitating market access of Hong Kong service suppliers in the Mainland. In addition, cooperation agreements with the Pan-Pearl River Delta region and Guangdong were signed in September, paving the way for deeper economic collaboration with other provinces in the Mainland. Hong Kong also reached cooperation agreement and facilitative tax agreements with other trading partners. The Ninth

46
Ministerial Conference of the World Trade Organisation in Bali in December made a significant breakthrough by concluding the Bali package, which may provide a fresh impetus to future multilateral trade negotiations. The package provides, inter alia, a deal on trade facilitation, which should promote world trade flows in the longer term to the benefit of trading hubs like Hong Kong.
Visible trade Total exports of goods 3.1 The global trading environment in 2013 remained under the drag of uneven growth in the advanced markets, exacerbated by slower pace of activity expansion in the emerging markets. Merchandise exports (comprising re-exports and domestic exports) maintained only low single-digit year-on-year growth in real terms throughout the four quarters, at 4.0%, 2.4%, 2.0% and 3.1% respectively. For 2013 as a whole, merchandise exports grew only modestly by 2.8% in real terms, yet representing an improvement over the 0.1% contraction in 2012. On a seasonally adjusted quarter-to-quarter basis, merchandise exports shrank by 1.9% in the first quarter and further by 1.2% in the second quarter, before rebounding by 2.2% and 3.6% respectively in the third and fourth quarters. 3.2 The global economic environment was rather difficult at the beginning of 2013 due to the threats from the US budget sequestration and the renewed euro debt concerns originating from the banking issues in Cyprus. The aggressive monetary easing by the Bank of Japan that led to further yen weakening was also worrisome. While the US economy managed to regain momentum in the second half of the year despite the fiscal drag and the eurozone economy crawled out of recession in the second quarter, significant headwinds continued to prevail. The US Fed’s talks about tapering asset purchases led to a bout of global financial jitters in mid-2013, adversely affecting some emerging markets with weaker fundamentals. Then in the fourth quarter, the political gridlock in the US over fiscal issues resurfaced, culminating in a partial shutdown of the US federal government in October and hurting consumer and business sentiments. The US fiscal risks only receded with the passage of the budget deal in December. In the eurozone, the recession has ended but the recovery remained fragile, being held back by the elevated unemployment rate and a myriad of structural problems. The growth pace of emerging market economies, particularly those with internal structural issues, also slackened, hampered by the weak performance of the advanced

47
markets and by the more volatile financial conditions amid US monetary uncertainties. The International Monetary Fund (IMF) in January 2014 estimated that the world economic growth in 2013 remained muted, at 3.0%, 0.1 percentage point below that in 2012. 3.3 Re-exports(2), the mainstay of overall merchandise exports and accounting for 98.5% of total exports by value, grew modestly by 3.0% in real terms in 2013, following a marginal 0.1% growth in 2012. Domestic exports, constituting the remaining 1.5% of total exports, fell by 9.4% in real terms in 2013, further to the 13.0% decline in 2012.
Table 3.1 : Total exports of goods, re-exports and domestic exports (year-on-year rate of change (%))
Total exports of goods
Re-exports Domestic exports
In value terms
In real terms(a)
Change in prices
In value terms
In real terms(a)
Change in prices
In value terms
In real terms(a)
Change in prices
2012 Annual
2.9 -0.1 3.4 3.2 0.1 3.4 -10.4 -13.0 2.5
Q1 -1.5 -7.1 (1.4) 6.2 -1.0 -6.7 (1.4) 6.2 -24.1 -26.9 (2.4) 3.0 Q2 1.9 -2.2 (-0.9) 4.4 2.3 -1.9 (-0.9) 4.4 -14.8 -17.6 (-0.3) 2.6 Q3 3.8 2.5 (2.7) 1.8 3.9 2.6 (2.7) 1.8 0.5 -1.2 (2.2) 1.4 Q4
7.0 6.0 (3.4) 1.4 7.1 6.2 (3.6) 1.3 -1.2 -3.8 (-6.1) 2.7
2013 Annual 3.6 2.8 1.3 3.8 3.0 1.3 -7.6 -9.4 2.2
Q1 4.0 4.0 (-1.9) 0.6 4.0 4.2 (-1.9) 0.5 -0.9 -4.5 (-1.2) 4.2 Q2 2.4 2.4 (-1.2) 0.4 2.6 2.6 (-1.1) 0.4 -7.9 -10.1 (-5.2) 2.3 Q3 3.3 2.0 (2.2) 1.7 3.6 2.2 (2.3) 1.7 -11.9 -12.9 (-1.0) 1.8 Q4 4.8 3.1 (3.6) 2.4 5.0 3.3 (3.7) 2.4 -8.5 -9.4 (-1.7) 0.6
Notes : ( ) Seasonally adjusted quarter-to-quarter rate of change. (a) The growth rates here are not strictly comparable with those in the GDP accounts in
Table 1.1, due to differences in coverage and methodology.

48
Q12009
Q12010
Q12011
Q12012
Q12013
-40
-30
-20
-10
0
10
20
30
40 -8
-6
-4
-2
0
2
6
8
4
Trade-weightedreal EERI *
(RHS)
Total import demand inHong Kong's
major markets #(LHS)
Hong Kong's total exportsof goods (LHS)
Diagram 3.1 : Merchandise export growth remained relatively weak in 2013
Year-on-year rate of change (%) Year-on-year rate of change (%)
Notes : Total exports of goods as depicted refer to the year-on-year rate of change in real terms, while
total import demand in Hong Kong’s major markets as depicted refers to the year-on-year rate of change in US dollar terms in the aggregate import demand in Asia, the United States and the European Union taken together.
(*) The real EERI in this graph is inverted in scale for easier comprehension. A positive
change denotes real appreciation of the Hong Kong dollar.
(#) Import demand figure for the fourth quarter of 2013 is based on statistics for October and November 2013.
Q12009
Q12010
Q12011
Q12012
Q12013
-50
-40
-30
-20
-10
0
10
20
30
40
50Percent
Re-exports
(a) Year-on-year rate of changein real terms
Totalexports
of goods
Q12009
Q12010
Q12011
Q12012
Q12013
-30
-25
-20
-15
-10
-5
0
5
10
15
20
25Percent
(b) Seasonally adjusted quarter-to-quarterrate of change in real terms
Re-exports Totalexports
of goods
Diagram 3.2 : Re-exports grew only modestly while domestic exports remained on a secular decline in 2013
Domestic exports
Domestic exports

India$83.3 billion
(2.3%)Rest of Asia$243.7 billion
(6.8%)
Singapore$58.6 billion
(1.6%)Taiwan
$77.4 billion(2.2%)
Korea$64.1 billion
(1.8%)
Japan$135.2 billion
(3.8%)EU
$334.6 billion(9.4%)
United States$331.3 billion
(9.3%)
Q12009
Q12010
Q12011
Q12012
Q12013
-30-25-20-15-10-505
1015202530354045
Total exports to Asia
Total exports to non-Asia
Total exports toall markets
Year-on-year rate of change in nominal terms (%)
Diagram 3.3 : Asian markets continued to feature prominently in Hong Kong's exports
Others$282.3 billion
(7.9%)
Mainland of China$1,949.2 billion
(54.8%)
Total exports of goods in 2013:$3,559.7 billion
49
Table 3.2 : Total exports of goods by major market
(year-on-year rate of change in real terms (%))
2012 2013 Annual Q1 Q2 Q3 Q4 Annual Q1 Q2 Q3 Q4 Mainland of China 3.4 -7.8 -0.6 9.7 12.1 4.9 8.5 6.3 2.8 2.8 United States -1.3 -7.1 0.1 -0.1 1.4 -4.3 -5.0 -8.0 -1.0 -3.6 European Union -10.4 -9.7 -12.5 -14.1 -4.8 -0.6 -5.4 -2.5 2.7 2.4 Japan 0.9 -1.5 1.5 3.3 0.4 -6.3 -4.9 -5.5 -8.3 -6.2
* India -22.5 -23.8 -23.7 -22.3 -20.0 7.7 0.3 8.0 6.7 16.8 Taiwan -7.9 -21.4 -2.1 -10.7 2.4 -6.1 14.2 -12.1 -7.6 -13.9 Korea -4.0 -5.2 -5.7 -2.2 -2.8 6.3 0.5 2.0 4.5 18.6 Singapore -3.3 -14.1 2.1 -0.3 -0.8 2.5 5.2 0.2 -0.9 6.2
Note : (*) A unit value index specifically compiled for exports to India is available since January 2012. The volume figures for growth in exports to India prior to 2013 are crude estimates.

50
3.4 Analysed by major markets, merchandise exports to the Mainland expanded solidly by 4.9% in real terms in 2013, thanks to the resilience displayed by the Mainland economy over the course of the year. After posting visible year-on-year growth in the first two quarters, merchandise exports to the Mainland decelerated somewhat in the third and fourth quarters against a high base of comparison. Exports to Japan fell notably throughout the year, conceivably held back by the slackened import demand because of the much weakened yen. Meanwhile, the performance of other higher-income Asian markets varied, ranging from a 6.1% decline in exports to Taiwan to a 6.3% growth in exports to Korea. Yet, when viewed in conjunction with the rather low base of comparison in 2012, these reflected the drag from the still-sluggish demand conditions in the advanced markets on Asia’s trading and production activities. 3.5 Exports to the US and the EU showed some relative improvements in the latter part of 2013, although their performance for the year as a whole was still sluggish. Exports to the US fell by 4.3% in real terms in 2013, as the import demand there was constrained by the elevated unemployment rate and fiscal drag. Consumer sentiment in the US was also dented by the uncertainties arising from US fiscal and monetary policies. By comparison, exports to the EU returned to a mild growth in real terms in the second half of 2013 against a low base of comparison, thanks also to the stabilisation of economic activity and improving sentiment there. This ended the nine consecutive quarters of year-on-year contraction that started in the second quarter of 2011. However, weighed by the weak performance in the first half of the year, exports to the EU still registered a slight 0.6% decrease in real terms for 2013 as a whole.

51
-50
-40
-30
-20
-10
0
10
20
30
40
Q12009
Q12010
Q12011
Q12012
Q12013
-25
-20
-15
-10
-5
0
5
10
15
20
Year-on-year rate of change (%)
HK$ / Euro(RHS) Hong Kong's
total exports to EU (RHS)
Year-on-year rate of change (%)
-25
-20
-15
-10
-5
0
5
10
15
20
25
30
35
Q12009
Q12010
Q12011
Q12012
Q12013
-50
-40
-30
-20
-10
0
10
20
30
40
50
60
70
Hong Kong's total exports to Mainland
of China (RHS)
Year-on-year rate of change (%)
Mainland of China'simport demand
(LHS)
HK$ / RMB (RHS)
Year-on-year rate of change (%)
Diagram 3.4 : The Mainland market continued to outperform the major advanced markets
EU's import demand(LHS)
Diagram 3.5 : Exports to the EU resumed growth in the latter part of 2013
Q12009
Q12010
Q12011
Q12012
Q12013
-30
-25
-20
-15
-10
-5
0
5
10
15
20
25 Year-on-year rate of change (%)
Hong Kong'stotal exports
to US
US' import demand
Q12009
Q12010
Q12011
Q12012
Q12013
-25
-20
-15
-10
-5
0
5
10
15
20
25
30Year-on-year rate of change (%)
Hong Kong'stotal exports
to Japan
HK$ / Yen
Diagram 3.7 : Exports to Japan contracted further amid significant yen depreciation
Japan'simport demand
Diagram 3.6 : Exports to the US stayed sluggish

52
Q12009
Q12010
Q12011
Q12012
Q12013
-60
-40
-20
0
20
40
60
80
HK$ / INR
Hong Kong'stotal exports to
India
India'simport demand
Year-on-year rate of change (%)
Q12009
Q12010
Q12011
Q12012
Q12013
-40
-30
-20
-10
0
10
20
30
40
50
60
70Year-on-year rate of change (%)
Hong Kong'stotal exports to
Taiwan
Taiwan'simport demand
Diagram 3.8 : Exports to India grew solidly
Diagram 3.9 : Exports to Taiwan were weak
HK$ / NT$
Q12009
Q12010
Q12011
Q12012
Q12013
-40
-30
-20
-10
0
10
20
30
40Year-on-year rate of change (%)
Hong Kong'stotal exports
to Korea
Korea's importdemand
Diagram 3.10 : Exports to Korea picked up
HK$ / Won
Q12009
Q12010
Q12011
Q12012
Q12013
-40
-30
-20
-10
0
10
20
30 Year-on-year rate of change (%)
HK$ / S$
Hong Kong'stotal exports to
Singapore
Singapore'simport demand
Diagram 3.11 : Exports to Singapore grew modestly in 2013 amid fluctuations

53
Imports of goods 3.6 Imports of goods rose moderately by 3.9% in real terms in 2013, up from 1.0% in 2012, driven by faster growth in both retained imports and import intake related to re-exports. Retained imports, which accounted for over one-quarter of total imports, grew by 6.3% in real terms in 2013, up from the 3.5% increase in the preceding year. Analysed by end-use category, retained imports of foodstuffs expanded visibly while those of consumer goods also saw further increase, largely bolstered by the resilient local consumption market. Meanwhile, retained imports of capital goods maintained an appreciable growth pace, reflecting the largely positive business sentiment and the intensive public works. On the other hand, retained imports of fuels increased only slightly, conceivably reflecting in part continued energy-saving efforts. Retained imports of raw materials and semi-manufactures dropped for the third consecutive year, largely in tandem with the general sluggishness in production activity.
Table 3.3 : Imports of goods and retained imports (year-on-year rate of change (%))
Imports of goods
Retained imports(a)
In value terms
In real terms
Change in prices
In value terms
In real terms
Change in prices
2012 Annual
3.9 1.0 3.3 3.0 3.5 0.2
Q1 0.7 -4.1 (1.9) 5.0 2.4 3.5 (3.3) -1.2 Q2 2.1 -1.3 (-0.7) 3.9 -1.2 * (-0.1) -0.3 Q3 4.5 2.7 (2.9) 2.3 3.1 2.9 (3.3) 0.6 Q4
8.1 6.6 (3.2) 2.1 7.6 7.7 (2.4) 1.3
2013 Annual
3.8 3.9 0.9 3.7 6.3 -0.3
Q1 4.9 5.0 (-1.1) 1.1 7.1 7.1 (1.0) 2.9 Q2 3.5 4.2 (-0.6) 0.2 5.8 8.1 (0.6) -0.4 Q3 2.6 2.8 (1.9) 0.6 -0.1 4.4 (1.0) -2.1 Q4 4.3 4.0 (3.6) 1.5 2.5 5.9 (3.3) -0.8 Notes : (a) Based on the results of the Annual Survey of Re-export Trade conducted by the
Census and Statistics Department, re-export margins by individual end-use category are estimated and adopted for deriving the value of imports retained for use in Hong Kong.
( ) Seasonally adjusted quarter-to-quarter rate of change.
(*) Change within ±0.05%.

54
Q12009
Q12010
Q12011
Q12012
Q12013
-30
-20
-10
0
10
20
30
40
50
60 Percent
Retainedimports
Importsof goods
(a) Year-on-year rate of changein real terms
Q12009
Q12010
Q12011
Q12012
Q12013
-20
-15
-10
-5
0
5
10
15
20
25
30 Percent
(b) Seasonally adjusted quarter-to-quarterrate of change in real terms
Retainedimports
Importsof goods
Diagram 3.12 : Imports grew moderately on solid increase in retained imports
Table 3.4 : Retained imports by end-use category (year-on-year rate of change in real terms (%))
Consumer goods
Foodstuffs
Capital goods
Raw materials and
semi-manufactures
Fuels
2012 Annual
6.4 1.6 21.7 -6.4 -6.6
Q1 16.1 4.8 50.7 -19.8 -6.9 Q2 0.5 2.5 6.6 -5.1 -4.0 Q3 -5.4 -5.6 20.0 1.6 -4.3 Q4
17.1 4.8 19.9 -2.3 -11.2
2013 Annual
2.9 9.3 22.3 -3.3 0.2
Q1 4.7 12.0 -3.1 12.3 7.6 Q2 1.3 1.3 38.7 -0.8 -5.4 Q3 9.5 12.1 16.8 -9.1 -5.9 Q4 -3.0 11.6 32.7 -13.1 5.2

55
Invisible trade Exports of services
3.7 Exports of services fared better than merchandise exports, with a 5.8% growth in real terms in 2013, visibly improved from that of 2.2% in 2012. Exports of travel services, driven by buoyant inbound tourism, continued to stand out as the key driver of growth. Exports of financial and other business services also turned better after the first quarter, in tandem with a pick-up in fund raising and commercial activities. The improvement in global economic sentiment, with acute risks from the euro debt problems and US fiscal standoff abating, also helped. However, exports of trade-related services (comprising mainly offshore trade activities) and exports of transportation services stayed weak, both under the drag of sluggish international and regional trade flows.
Financial andbusiness services
$230.3 billion(21.6%)
Travel services$302.0 billion
(28.3%)
Q12009
Q12010
Q12011
Q12012
Q12013
-10
-5
0
5
10
15
20 Percent
Diagram 3.14 : Exports of servicesattained faster growth in 2013
Diagram 3.13 : Major service groups accounted for similar shares of Hong Kong's service
exports, reflecting a diversified base
Exports of services in 2013:$1,066.0 billion
Transportationservices
$245.1 billion(23.0%)
Seasonally adjustedquarter-to-quarter
rate of change in real terms
Trade-relatedservices
$288.6 billion(27.1%)
Year-on-yearrate of changein real terms

56
Table 3.5 : Exports of services by major service group (year-on-year rate of change in real terms (%))
Exports
of services
Of which :
Trade-related services(a)
Transportation services
Travel services(b)
Financial and
business services
2012 Annual
2.2 0.7 -3.8 10.4 2.6
Q1 2.8 (0.6) -1.6 2.8 8.3 2.9 Q2 2.6 (0.6) 0.7 -4.4 12.9 4.3 Q3 0.1 (-0.7) 1.2 -6.8 7.8 -1.0 Q4
3.3 (2.9) 1.8 -6.0 12.7 4.4
2013 Annual
5.8 1.2 * 18.5 3.6
Q1 5.1 (2.1) 2.8 -2.7 19.4 1.3 Q2 8.0 (3.2) 1.8 -2.0 29.2 3.9 Q3 5.5 (-2.6) 0.3 2.0 16.4 4.4 Q4 4.9 (2.3) 0.5 3.1 11.4 5.3
Notes : (a) Comprising mainly offshore trade. (b) Comprising mainly inbound tourism receipts. ( ) Seasonally adjusted quarter-to-quarter rate of change. (*) Change within ±0.05%.
Imports of services
3.8 Imports of services grew modestly by 1.5% in real terms in 2013, further to a 1.9% growth in 2012. Imports of travel services attained relatively fast growth in 2013, supported by the generally favourable local consumer sentiment and income conditions as well as the weakened yen and some other Asian currencies. Imports of transportation services and trade-related services, however, shrank in 2013 in tandem with sluggish international and regional trade flows. Meanwhile, imports of financial and other business services grew modestly in 2013, at the same pace as that in 2012.

57
Diagram 3.15 : Travel services had the
largest share in imports of services
Trade-relatedservices
$33.7 billion(7.2%)
Q12009
Q12010
Q12011
Q12012
Q12013
-15
-10
-5
0
5
10
15
20 Percent
Diagram 3.16 : Imports of services rose modestly
Year-on-yearrate of changein real terms
Imports of services in 2013:$465.2 billion
Seasonally adjustedquarter-to-quarter
rate of change in real terms
Financial andbusiness services
$126.4 billion(27.2%)
Travel services$163.0 billion
(35.0%)
Transportationservices
$142.0 billion(30.5%)
Table 3.6 : Imports of services by major service group (year-on-year rate of change in real terms (%))
Of which :
Imports of services
Travel
services(+)
Transportation
services
Trade-related s
ervices
Financial and business services
2012 Annual
1.9 3.8 1.3 -1.4 1.3
Q1 4.5 (1.9) 5.7 7.8 -1.4 1.0 Q2 2.5 (-0.7) 4.7 0.8 -2.7 3.3 Q3 0.1 (-1.9) 2.9 -1.0 -2.1 -1.7 Q4
0.9 (1.4) 2.0 -2.0 * 2.9
2013 Annual
1.5 4.6 -1.2 -1.0 1.3
Q1 0.5 (1.5) 6.0 -5.5 2.3 0.1 Q2 -1.0 (-1.7) * -4.2 -1.2 2.2 Q3 2.7 (1.7) 4.7 1.4 -2.4 3.1 Q4 3.7 (2.3) 7.7 4.1 -2.2 0.4 Notes : (+) Comprising mainly outbound travel spending. ( ) Seasonally adjusted quarter-to-quarter rate of change. (*) Change within ±0.05%.

58
Visible and invisible trade balance 3.9 Given that exports were constrained by an unsteady external trading environment while domestic demand stayed resilient, the visible trade deficit widened somewhat in 2013, yet offset by an enlarged surplus in invisible trade. As a result, the combined visible and invisible trade account in 2013 was broadly in balance, with a small surplus of $22 billion (equivalent to 0.5% of the total value of imports of goods and services), which was similar to the combined trade surplus of $23 billion in 2012 (or 0.5% of the total value of imports of goods and services).
Table 3.7 : Visible and invisible trade balance
($ billion at current market prices)
Total exports Imports Trade balance
Goods Services
Goods
Services
Goods
Services
Combined
As % of impor
ts
2012
Annual 3,592 1,003 4,116 455 -525 548 23 0.5
Q1 806 242 933 113 -128 129 2 0.2 Q2 879 232 1,028 107 -149 124 -25 -2.2 Q3 946 257 1,059 115 -113 142 28 2.4 Q4
961 273 1,096 120 -135 152 17 1.4
2013 Annual 3,816 1,066 4,395 465 -579 601 22 0.5 Q1 872 257 1,024 114 -152 143 -10 -0.8 Q2 929 250 1,100 107 -171 143 -28 -2.3 Q3 1,000 272 1,117 119 -117 154 37 3.0 Q4 1,015 287 1,153 125 -138 161 23 1.8
Note : Figures may not add up exactly to the total due to rounding. Other developments 3.10 Hong Kong continued to strengthen economic ties with its major trading partners in 2013, particularly the Mainland. Of particular note was the signing of Supplement X to the Mainland and Hong Kong Closer Economic Partnership Arrangement (CEPA) in August, providing for a total of 73 services liberalisation and trade and investment facilitation measures, including 65 liberalisation measures for trade in services, and 8 measures to strengthen cooperation in areas of finance and trade and investment facilitation of the two places. Along with the measures in the previous rounds, the CEPA and its supplements cover a wide range of service sectors such as financial, tourism, construction, legal, medical and accounting services and offer preferential treatments for Hong Kong service suppliers in tapping the potential of the vast

59
and ever-growing Mainland market. Inclusive of measures in Supplement X, there are 403 liberalisation measures for trade in services under CEPA. 3.11 To help resolve CEPA implementation problems in individual provinces and sectors, an additional Joint Working Group was established following the announcement by the Chief Executive in his 2013 Policy Address. The first and the second meetings of the Joint Working Group were held in June and December respectively, discussing various implementation issues related to CEPA. The representatives from Hong Kong and the Mainland sides agreed to make continuous efforts to promote the effective implementation of CEPA. 3.12 Hong Kong’s economic collaboration with other provinces and cities in the Mainland also deepened further. In September, the “Guizhou Accord” was signed during the Ninth Pan-Pearl River Delta (PPRD) Regional Co-operation and Development Forum in September, which set out the future directions to enhance the economic relationships among the PPRD provinces and cities. In the same month, the Hong Kong and Guangdong Government in their 16th Plenary Co-operation Joint Conference signed eight letters of intent and co-operation agreements on a wide range of issues. 3.13 Hong Kong has been actively fostering trade relations with other economies, especially the emerging markets. In February, Hong Kong and Thailand signed an agreement to promote economic collaborations on various fronts, including trade in goods and services, investment, logistics and transport, and tourism. To facilitate cross-border investment flows, Hong Kong signed avoidance of double taxation agreement with Italy, Guernsey and Qatar, bringing the total number of similar facilitative tax agreements to 29. 3.14 Separately, members of the World Trade Organisation (WTO) made a significant breakthrough at the Ninth Ministerial Conference in December by concluding the Bali package. It has been a concrete step forward after the Doha Round talks launched in 2001, which may help restore momentum in future multilateral trade negotiations. The package included, among others, a new Agreement on Trade Facilitation (ATF) which sets out binding obligations for WTO Members on improving and harmonising their import/export and customs formalities and procedures. By reducing trade barriers, the package is expected to provide a boost to world trade growth in the longer term to the benefit of Hong Kong, particularly in the areas of trading and logistics.
60
Notes : (1) Changes in merchandise exports and imports in real terms are derived by discounting
the effect of price changes from changes in the value of the trade aggregates. Estimates of price changes for the trade aggregates are based on changes in unit values, which do not take into account changes in the composition or quality of the goods traded, except for some selected commodities for which specific price indices are available. The real growth figures reported here are based on the constant price measures adopted for compiling the external trade quantum index numbers. They are not strictly comparable with the real trade aggregates under GDP (reported in Chapter 1) which are based on the chain volume measures using the preceding-year prices as weights for aggregating the components. In addition, non-monetary gold is recorded as a separate item in the statistics of merchandise trade and not included in the trade aggregates reported in Chapter 3, but is included in the trade aggregates under GDP in accordance to the international compilation standard.
(2) Re-exports are those goods which have previously been imported into Hong Kong and
are subsequently exported without having undergone in Hong Kong any manufacturing processes which change permanently the shape, nature, form or utility of the goods.

61
CHAPTER 4 : DEVELOPMENTS IN SELECTED SECTORS Summary The residential property market has cooled off visibly since March 2013.
While the Government’s various counter-cyclical measures have helped manage short-term demand, market sentiment was also dented by expectations of the US Federal Reserve tapering its asset purchases. Trading activities plunged to subdued levels. With the uptrend decelerating noticeably, overall flat prices rose by 8% during 2013, the smallest annual increase in the current property market boom started in 2009.
Raising flat supply through increasing land supply is the Government’s top policy priority in ensuring the healthy and stable development of the property market. Reflecting the Government’s sustained efforts, total flat supply in the coming three to four years increased from 67 000 units at end-2012 to 71 000 units at end-2013. In the 2014 Policy Address, the Chief Executive also announced new initiatives and outlined the latest progress of the various on-going measures to increase the land and housing supply in the short, medium and long terms.
The commercial and industrial property markets have likewise cooled off since March 2013. Trading activities turned very quiet. Prices and rentals recorded moderated increases or even slight declines in the second half of the year.
Inbound tourism maintained strong growth in 2013. Supported by the Mainland market, total visitor arrivals recorded a notable increase of 11.7% to 54.3 million.
Amid the challenging external trade environment, the logistics sector remained generally lacklustre in 2013. Yet there was some improvement in the latter part of the year along with the pick-up in trade flows. Container throughput declined by 3.7%, while air freight throughput grew modestly by 2.4%.

62
Property 4.1 The residential property market has cooled off visibly since March 2013. While the Government’s various counter-cyclical measures, the latest round introduced in late February 2013, have helped manage short-term demand, expectations of the US Federal Reserve tapering asset purchases also dented market sentiment in the second half of the year. Trading activities plunged to subdued levels, and the upward momentum in flat prices decelerated noticeably. In face of the market slowdown, many developers have adopted a conservative pricing strategy when launching new projects since the fourth quarter, offering various discounts and concessions. 4.2 Reflecting the subdued trading since March, the total number of sale and purchase agreements for residential property received by the Land Registry plunged by 38% to 50 676 in 2013, the lowest on record. Within the total, secondary market transactions plummeted by 42%, while primary market transactions declined by a lesser 15% as sales rebounded in the latter part of the year amid offers of substantial concessions by some developers. In tandem, total considerations plunged by 34% to $298.9 billion in 2013. Transactions fell across all consideration ranges.
5 000
10 000
15 000
20 000
25 000
30 000
< 1 1-2 2-3 3-5 5-10 > 10
2012 2013
Agreements received
Diagram 4.1 : Trading activities were quiet in most of 2013
Primary market
Consideration in million dollarsQ1
2008Q1
2009Q1
2010Q1
2011Q1
2012Q1
2013
5 000
10 000
15 000
20 000
25 000
30 000
35 000
40 000Agreements received
Secondary market
Primary market

63
4.3 As buyers turned increasingly cautious, the rise in flat prices moderated noticeably from an average of 2.7% per month in January and February to 0.2% per month during March to December. Comparing December 2013 to December 2012, overall flat prices rose by 8%, the smallest annual increase in the current property market boom started in 2009. Analysed by size, prices of small/medium-sized flats rose by 8% during 2013, while prices of large flats only edged up by 0.4%. Nonetheless, following the rally in the past few years, overall flat prices in December 2013 still surpassed the 1997 peak by a sharp 42%. 4.4 The rise in rentals also decelerated in 2013. Between December 2012 and December 2013, overall flat rentals rose by a modest 3%. Rentals of small/medium-sized flats went up by 4%, while those of large flats declined by 3%. Overall flat rentals in December 2013 were 12% higher than the 1997 peak. Reflecting the faster increase in flat prices than in rentals, the average rental yield for residential property declined further from 3.0% in December 2012 to 2.8% in December 2013.
03 04 05 06 07 08 09 10 11 12 1330
40
50
60
70
80
90
100
110
120
130
140
150
Large flats
All flats
Small/medium-sized flats
Index (Oct 1997=100)(b) Rentals
03 04 05 06 07 08 09 10 11 12 1330
40
50
60
70
80
90
100
110
120
130
140
150 Large flats
All flats
Small/medium-sized flats
Index (Oct 1997=100)(a) Prices
Diagram 4.2 : Uptrend of both flat prices and rentals moderated during 2013
Note : Residential property price index pertains to secondary market transactions only. Large flats refer to those with a saleable area of atleast 100 m2, and small/medium-sized flats with a saleable area of less than 100 m2.

64
4.5 Raising flat supply through increasing land supply is the Government’s top policy priority in ensuring the healthy and stable development of the property market. The Government has abolished the Application Mechanism since 2013-14 to fully resume the lead in selling government land. Besides, the Government has been carrying out various land use reviews, including reviews on government land currently vacant, under Short Term Tenancies or different short-term or government uses, as well as review on Green Belt and industrial land. During the year, it has identified about 80 new sites that can be rezoned for residential use and made available in the next five years (i.e. from 2014-15 to 2018-19). Together with sites identified earlier, upon amendments to the respective statutory Outline Zoning Plans for change of use and/or increase in development intensity, about 150 potential housing sites could be made available for housing development in the coming five years for providing about 210 000 flats. 4.6 As a result of the Government’s sustained efforts, the total supply of flats in the coming few years (comprising unsold flats of completed projects, flats under construction but not yet sold and flats on disposed sites where construction can start any time) continued to increase, from 67 000 units as estimated at end-2012 to 71 000 units as estimated at end-2013. In addition, as at end-2013, another 16 800 units could be added to the total supply after the conversion of a number of residential sites into “disposed sites”. In the 2014 Policy Address, the Chief Executive also announced new initiatives and outlined the latest progress of the various on-going measures to increase the land and housing supply in the short, medium and long terms (Box 4.1). 4.7 Nonetheless, the demand-supply balance of the property market remains tight in the near term. According to the Rating and Valuation Department, the number of gross completions of private residential flats fell by 19% to 8 300 units in 2013. After netting out demolition of 1 600 units, the net completion of 6 700 units fell short of the take-up of 8 100 units(1). The vacancy rate declined from 4.3% at end-2012 to 4.1% at end-2013, the lowest level since 1997 and much below the long-term average of 5.0% over 1993-2012. The Rating and Valuation Department forecast completion at 17 600 units in 2014 and 12 700 units in 2015.

65
Box 4.1
Latest Government measures on land and housing supply
In the 2014 Policy Address, the Chief Executive announced further initiatives and outlined the latest progress of the various on-going measures to increase the land and housing supply, as summarised below.
(I) Land Supply Over the past year, the Government has stepped up its efforts to boost land supply on various fronts. These include identifying through land use reviews about 80 additional sites with the potential to be rezoned for providing for some 89 000 residential units. Including sites identified earlier on, upon amendments to the respective Outline Zoning Plans, about 150 sites could be made available over the next five years (i.e. from 2014-15 to 2018-19) to provide around 210 000 units.
The Government is also taking forward the following new/on-going measures to increase the land supply over the short to medium term:
(1) Streamlining Procedures and Enhancing the Mechanism Continue to rationalise land administration processes, including consolidating the
practice notes on granting approval under lease. Introduce a Pilot Scheme for Arbitration on Land Premium for lease
modification/land exchange applications to facilitate early agreement on land premium payable.
Set up a dedicated cross-disciplinary team to assist the Steering Committee on Land Supply chaired by the Financial Secretary in monitoring land supply and promoting land development.
(2) Increasing Development Intensity and Reducing Development Restrictions Increase the maximum domestic plot ratio currently permitted for some less
densely populated areas by around 20% as appropriate. Increase the plot ratios and number of flats to be built on Kai Tak New
Development Area and Tuen Mun East. Lift the development moratorium at south of Pok Fu Lam to provide about 11 900
additional public rental housing (PRH) and Home Ownership Scheme (HOS) units.
(3) Land Use Reviews, Development of Quarry Sites and Review of Deserted Agricultural Land Continue to carry out land use reviews and rezone suitable sites and, where the
originally intended use is no longer required, convert the land for housing development or other uses that meet the more pressing needs of the community as soon as possible.
Take forward the residential developments at the former Diamond Hill squatter areas and other quarry sites.
Review the deserted agricultural land in North District and Yuen Long. Some sites will be available for housing development as early as 2020.
(4) New Development Areas (NDAs) and Extension of New Town Implement the North East New Territories NDAs project, which would become the
major source of housing supply from 2022 onwards and provide for about 60 000 units in total.

66
Box 4.1 (Cont’d)
The Preliminary Outline Development Plan for the Hung Shui Kiu NDA has been formulated. It can accommodate a new population of 175 000 and provide about 100 000 job opportunities.
Propose to extend the Tung Chung New Town to the east and the west for supplying about 53 000 units.
(5) Other Long Term Land Supply
To ensure a steady and stable long-term land supply, the Government will continue to undertake a number of studies and assessments in several directions to keep developing new land :
Commence the Preliminary Feasibility Study on Developing the New Territories North to facilitate optimal land use planning.
Actively take forward further studies on reclamation outside Victoria Harbour, including strategic studies on artificial islands in central waters for the development of the East Lantau Metropolis, planning and engineering study on the reclamation in Sunny Bay, and preliminary feasibility studies on other near-shore reclamation sites.
Commence the feasibility studies on rock cavern development, including relocating Sai Kung Sewage Treatment Works, Sham Tseng Sewage Treatment Works and Diamond Hill Fresh Water and Salt Water Service Reservoirs to rock caverns. Meanwhile, the feasibility study on relocating the Sha Tin Sewage Treatment Works to caverns is largely completed. The Government plans to carry out the investigation and design work soon.
Continue a study to identify districts with potential for developing urban underground space. A pilot study for four selected strategic districts, i.e. Tsim Sha Tsui West, Causeway Bay, Happy Valley and Admiralty/Wan Chai will also be conducted.
(II) Housing Supply The Government has adopted the recommendation of the Long Term Housing
Strategy Steering Committee to increase housing supply with a target to provide a total of 470 000 units in the coming ten years, of which 60% will be public housing and 40% private housing.
The Government aims at providing an average of about 20 000 PRH units and about 8 000 HOS units per year, and providing land for private housing according to the new target.
These measures would help increase the land and flat supply over the short, medium and long terms, thereby ensuring the stable and healthy development of the property market.

67
4.8 As it takes time to increase supply, the Government has also put in significant efforts to manage demand and reduce the possible risks to financial stability arising from an exuberant property market(2). These measures have yielded notable results. On speculative activities, the number of short-term resale (comprising confirmor transactions and resale within 24 months after assignment) declined to an average of 155 cases per month or 3.2% of total transactions in 2013, markedly below the monthly average of 2 661 cases or 20.0% in January to November 2010 (i.e. the period before the introduction of the Special Stamp Duty). Reflecting the effects of the Buyer’s Stamp Duty, purchases by non-local individuals and non-local companies plunged to an average of 96 cases per month or 2.0% of total transactions in 2013, much lower than the monthly average of 365 cases or 4.5% in January to October 2012. As to mortgage lending, the average loan-to-value ratio of new mortgages in 2013, at 55%, was lower than the average of 64% in January to October 2009 before the first round of macro-prudential measures for residential property mortgage lending was introduced by the Hong Kong Monetary Authority. Separately, the Residential Properties (First-hand Sales) Ordinance, which serves to improve the transparency of the residential property market, came into force on 29 April 2013.
0
5
10
15
20
25
30
1 000
2 000
3 000
4 000
5 000
6 000
7 000
8 000
9 000
10 000
11 000
12 000
Q11998
Q11999
Q12000
Q12001
Q12002
Q12003
Q12004
Q12005
Q12006
Q12007
Q12008
Q12009
Q12010
Q12011
Q12012
Q12013
Number
Diagram 4.3 : Speculative activities stayed subdued
Share of total transactions (%)
Resale within 12 - 24 months after assignment
Resale within 6 - 12 months after assignment
Resale within 0 - 6 months after assignment
Confirmor transactions (LHS) Confirmor transactions and short-term resale cases within 24 months as a share of total transactions (RHS)
Note : Confirmor transactions refer to resale before assignment.

68
0
1
2
3
4
5
6
7
8
9
10
11
12
100
200
300
400
500
600
700
800
900
1 000
1 100
1 200
01 02 03 04 05 06 07 08 09 10 11 12 01 02 03 04 05 06 07 08 09 10 11 12 01 02 03 04 05 06 07 08 09 10 11 12
2011 2012 2013
Purchases by non-local individuals and non-localcompanies as a share of total transactions (RHS)
Purchases by non-local individuals (LHS)
Purchases by non-local companies (LHS)
Number Share of total transactions (%)
Diagram 4.4 : Purchases by non-local buyers remained low
4.9 However, the risks of a property market bubble remained elevated. Home purchase affordability (i.e. the ratio of mortgage payment for a 45-square metre flat to median income of households, excluding those living in public housing) stayed high at around 54% in the fourth quarter of 2013, far exceeding the long-term average of 47.9% over 1993-2012. Should interest rates rise by three percentage points to a more normal level, the ratio would soar to 71%.
93 94 95 96 97 98 99 00 01 02 03 04 05 06 07 08 09 10 11 12 130
10
20
30
40
50
60
70
80
90
100Repayment-income ratio^ (%)
Diagram 4.5 : The mortgage payment to income ratio stayed elevated
93
1993-2012 average
Note : (^) The ratio of mortgage payment for a 45m2 flat (assuming 70% loan-to-value ratio and tenor of 20 years) to median income of households (excluding those living in public housing).
54

69
4.10 While the US Federal Reserve has begun to reduce asset purchases since January 2014, there is still uncertainty about the future path of US monetary policy. This might lead to possible fluctuations in international capital flows and market expectation, with ramifications on asset prices, including flat prices in Hong Kong. The Government will continue to monitor the situation closely, and respond in a prompt and appropriate manner. 4.11 The commercial and industrial property markets likewise have cooled off since March 2013, dampened by the latest demand-side management measures and also the expectations of the US’ gradual exit from the extremely loose monetary policy. Trading activities turned very quiet, while sale prices and rentals generally recorded moderated increases or even modest declines in the second half of the year.
4.12 Transactions for retail shop space shrank by 41% to 4 280 cases in 2013(3). Between December 2012 and December 2013, sale prices of retail shop space rose moderately by 3% and rentals by 6%, with the monthly gains decelerating over the course of the year and reverting to small declines in the latter part of 2013. As the rise in rentals outpaced that in prices, the average rental yield for retail shop space edged up from 2.3% in December 2012 to 2.4% in December 2013, yet still a low level by historical standards. As for demand-supply balance, there was a negative take-up(1) of 14 000 m2 for retail shop space in 2013, while completion was 38 400 m2. As a result, the vacancy rate rose back from 6.9% at end-2012 to 7.2% at end-2013, still below the long-term average of 8.7% over 1993-2012. 4.13 For office space, transactions plummeted by 48% to 1 700 cases in 2013. Between December 2012 and December 2013, overall office prices rose by 9%, yet most of the gain occurred during the first quarter. Prices of Grade A, B and C office space went up by 4%, 11% and 14% respectively. Over the same period, overall office rentals rose by 7%, with Grade A, B and C office space recording gains of 6%, 8% and 11% respectively. Reflecting the relative movements of prices and rentals, the average rental yields for Grade A and B office space, at 2.9% in December 2013, were little changed from a year earlier, while that for Grade C office space edged down to 2.8% from 2.9%. During 2013, office space recorded a negative take-up of 17 100 m2, while completion was 122 700 m2. The vacancy rate thus rose back from 6.0% at end-2012 to 7.0% at end-2013, yet still much below the long-term average of 10.2% over 1993-2012.

70
4.14 Similarly, transactions for flatted factory space plunged by 56% to 4 270 cases in 2013. Sale prices and rentals jumped by 10% and 9% respectively between December 2012 and December 2013, but the increase for rentals tapered towards the end of the year and that for prices even showed a moderate decline. The average rental yield fell further to a low of 2.8% in December 2013 from 2.9% a year earlier. There was a negative take-up of 83 500 m2 for flatted factory space in 2013, while completion was 85 100 m2. The vacancy rate rebounded from 5.0% at end-2012 to 5.8% at end-2013, still much below the long-term average of 8.2% over 1993-2012.
03 04 05 06 07 08 09 10 11 12 1350
100
150
200
250
300
350
400
450
500
550
600
650
700Office spaceRetail shop spaceFlatted factory space
Index (1999=100)(a) Prices
03 04 05 06 07 08 09 10 11 12 1360
80
100
120
140
160
180
200
220Office spaceRetail shop spaceFlatted factory space
Index (1999=100)(b) Rentals
Diagram 4.6 : The non-residential property market quietened down in 2013
2 000
4 000
6 000
8 000
10 000
Office space Commercial space Flatted factory space
201120122013
Number
Diagram 4.7 : Transactions for commercial and industrial properties plummeted

71
Land 4.15 Reflecting the Government’s efforts to increase land supply, 37 sites with a total area of about 38.4 hectares were disposed in 2013, fetching a land premium of about $65.0 billion. Among these sites, there were 27 residential sites, three commercial sites, two hotel sites, one site for logistics development, one site for high-tier data centre, and three sites for other uses. The tender exercises for six residential sites in Sha Tin, Kai Tak and Tuen Mun, and one business site in Kwun Tong also commenced towards the end of the year. 4.16 Regarding exchange of land, four sites with a total area of about 2.0 hectares were approved in 2013, of which two were residential sites. As to lease modifications, a total of 67 sites were approved.
Tourism 4.17 Inbound tourism maintained strong growth in 2013, particularly in the first half of the year. For the year as a whole, overall visitor arrivals rose notably by 11.7% to another record high of 54.3 million. Visitors from the Mainland continued to be the growth driver, surging by 16.7% to 40.7 million, and its share in total visitor arrivals rose further to 75.0%. Yet visitor arrivals from the short-haul and long-haul markets declined modestly by 0.4% and 2.3% respectively(4), reflecting the rather tepid economic conditions in most advanced economies. Analysed by the length of stay, same-day visitors grew by 15.3%, faster than the 8.0% growth in overnight visitors. As a result, the share of same-day visitors rose further from 51.1% in 2012 to 52.7% in 2013, while that of overnight visitors declined from 48.9% to 47.3%.
0
5
10
15
20
25
30
35
40
45
50
55
60
All markets Mainland Short-haul markets Long-haul markets
2011
2012
2013
Number of trips (Mn)
Diagram 4.8 : Mainland market remained the growth driver of inbound tourism
Note : See note (4) at the end of this chapter for the definition of short-haul and long-haul markets.

72
4.18 The average hotel room occupancy rate held at a high level of 89% in 2013. Having risen notably over the past three years, the average achieved hotel room rate declined modestly in 2013, by 2.8% to $1,447(5).
Logistics 4.19 Amid the challenging external trade environment, the logistics sector remained generally lacklustre in 2013. Yet there was some improvement in the fourth quarter along with the pick-up in trade flows. For the year as a whole, total container throughput declined by 3.7% to 22.3 million TEUs. Within the laden container throughput, transhipment fell by 1.7% and direct shipment by a larger 4.2%. In parallel, the value of trade handled at the Hong Kong Port decreased by 2.6%, and its share fell further from 24.6% in 2012 to 23.1% in 2013.
0
5
10
15
20
25
30
2009 2010 2011 2012 2013
River vessels Ocean vessels
(a) Total container throughputby mode of transport
0
5
10
15
20
25
30
2009 2010 2011 2012 2013
Transhipment Direct shipment
(b) Laden container throughputby mode of shipment
Diagram 4.9 : Container throughput declined further
TEUs (Mn)
* *
TEUs (Mn)
* *
Note : (*) Total container throughput for 2013 is the preliminary estimate by Hong Kong Port Development Council. Its breakdown by mode of transport and the laden container throughput by mode of shipment are crudely estimated from the profile in the first eleven months of 2013.
4.20 Air freight throughput fared relatively better, recording a modest growth of 2.4% to 4.1 million tonnes in 2013. The total value of trade by air increased notably by 7.2%, and its share in overall trade value rose from 36.2% to 37.4%.

73
0
500
1,000
1,500
2,000
2,500
3,000
2009 2010 2011 2012 2013
(b) Value of trade handled by air*
500
1 000
1 500
2 000
2 500
3 000
3 500
4 000
4 500
2009 2010 2011 2012 2013
(a) Air cargo volume
Diagram 4.10 : Both air cargo volume and value of trade by air grew further
Tonne ('000) $Bn
Note : (*) Not including transhipment. Transport 4.21 Traffic flows for most major modes of transport recorded growth in 2013. Supported by the further growth in visitor arrivals, air passenger traffic increased by 6.1% to 59.9 million, and water-borne passenger trips by 1.5% to 27.8 million. As for land-based cross-boundary traffic movements, average daily passenger trips rose by 3.3% to 572 000, while average daily vehicular movements were little changed at 42 500. 4.22 The Government has commissioned a consultant to conduct a study for the Review and Update of the “Railway Development Strategy 2000”, with a view to updating the long-term railway development blueprint for Hong Kong to cater for the latest development needs of the society. Two stages of Public Engagement exercise have been conducted in April to July 2012 and February to May 2013 respectively. After considering the recommendations of the consultant, the Government will report to the public the way forward for the new railway projects in 2014. Creativity and innovation 4.23 In January 2013, the Government established the Economic Development Commission which is led personally by the Chief Executive. The Economic Development Commission is underpinned by four working

74
groups, one of which is the Working Group on Manufacturing Industries, Innovative Technology, and Cultural and Creative Industries (MICWG). The MICWG held three meetings in 2013, and has identified some initial possible directions to support the industries under its purview. Relevant Government bureaux and departments are working closely with the MICWG to study and explore the feasibility of the initial directions. The MICWG will make concrete recommendations after the completion of the studies and deliberation. Telecommunications 4.24 In November 2013, the Communications Authority announced that upon the expiry of the existing assignments in October 2016, it would reassign the spectrum currently used for the provision of third generation (“3G”) mobile services using a hybrid approach combining market-based and administrative assignment methods. Under the approach, each of the four incumbent 3G mobile network operators will be given the right of first refusal to be reassigned with two-thirds of the concerned 3G spectrum they currently hold, and the remaining spectrum will be reassigned by open auction. This approach would help ensure customer service continuity while facilitating the efficient use of spectrum, promoting competition, and encouraging investment and innovation services. Environment 4.25 To improve roadside air quality and better protect public health, the Government has adopted an incentive-cum-regulatory approach to phase out some 82 000 pre-Euro IV diesel commercial vehicles including goods vehicles, light buses and non-franchised buses before 2020. For this purpose, the Air Pollution Control (Air Pollutant Emission) (Controlled Vehicles) Regulation has been enacted for commencement on 1 February 2014 and the Government will launch an ex-gratia payment scheme on 1 March 2014. The Regulation also limits the service life of newly registered diesel commercial vehicles to 15 years to help the timely replacement of these vehicles in the long run. Taken together, these measures would help contribute towards the attainment of the new Air Quality Objectives that already took effect on 1 January 2014, so as to protect the public health and foster the sustainable development of Hong Kong.

75
Notes : (1) Take-up figures for residential and non-residential properties represent the net increase
in the number of units occupied. The figures are arrived at by adding the completions in that year to the vacancy figures at the beginning of the year, then subtracting the year’s demolition and the year-end vacancy figures. Take-up should not be confused with the sales of new developments, and it bears no direct relationship to the number of units sold by developers. Negative take-up means that there is a decrease in the number of units occupied (i.e. property previously occupied was released during the year and remained vacant at the year-end).
(2) For details of the measures promulgated in 2010, see Box 3.1 in the First Quarter
Economic Report 2010, Box 3.1 in the Third Quarter Economic Report 2010 and note (2) at the end of Chapter 4 in the 2010 Economic Background and 2011 Prospects. For details of the measures promulgated in 2011, see note (2) at the end of Chapter 3 in the Half-yearly Economic Report 2011 and Box 3.1 in the Third Quarter Economic Report 2011. For details of the measures promulgated in 2012, see Box 3.1 in the Third Quarter Economic Report 2012 and Box 4.1 in the 2012 Economic Background and 2013 Prospects. For details of the measures promulgated in 2013, see Box 4.2 in the 2012 Economic Background and 2013 Prospects and Box 3.1 in the First Quarter Economic Report 2013.
(3) The figures on transaction refer to commercial space, which comprises retail premises
and other premises designed or adapted for commercial use but excludes purpose-built office space.
(4) Short-haul markets refer to North Asia, South and Southeast Asia, Taiwan and Macao,
but excluding the Mainland, while long-haul markets refer to the Americas, Europe, Africa, the Middle East, Australia, New Zealand and South Pacific. In 2013, visitor arrivals from the Mainland, short-haul and long-haul markets accounted for respective shares of 75%, 16% and 9% of total visitors.
(5) The figures on hotel room occupancy and achieved room rate do not include tourist
guesthouses.

76
CHAPTER 5 : THE FINANCIAL SECTOR# Summary The low interest rate environment in Hong Kong continued through 2013
amid the ongoing accommodative monetary policy in the United States. Hong Kong dollar interest rates on both the interbank and retail fronts continued to hover at low levels.
The Hong Kong dollar exchange rate was broadly stable against the US
dollar. The trade-weighted Hong Kong dollar Nominal and Real Effective Exchange Rate Indices rose by 0.7% and 2.4% respectively during 2013, alongside the strengthening of US dollar against the Japanese yen and Australian dollar.
The monetary aggregates continued to expand in 2013. Meanwhile, total
loans and advances grew at a brisk pace, mainly supported by the jump in foreign currency lending.
The local stock market exhibited considerable volatility in 2013. The
Hang Seng index showed a sharp correction in the first half amid concerns over liquidity strains in the Mainland and market expectations of the US Federal Reserve tapering its asset purchases. It recouped the loss in the ensuing months, as sentiment revived upon improved performance of the global economy. Trading activities rebounded from a low base. Fund raising activities were subdued in most of 2013 but staged a sharp rebound in the fourth quarter.
__________ (#) This chapter is jointly prepared by the Hong Kong Monetary Authority (HKMA) and
the Economic Analysis Division.

77
Interest rates and exchange rates 5.1 The low interest rate environment in Hong Kong continued through 2013 amid the ongoing accommodative monetary policy in the United States. With the Federal Funds Target Rate staying at 0-0.25%(1), the Base Rate under the Discount Window operated by the HKMA held unchanged at 0.5% during the year. The Hong Kong dollar interbank interest rates also stayed low, with the overnight and three-month HIBOR fixings edging down from 0.10% and 0.40% at end-2012 to 0.08% and 0.38% at end-2013. 5.2 The US dollar yield curve and Hong Kong dollar yield curve steepened noticeably during 2013, mainly driven by market expectations of the US Federal Reserve tapering its asset purchases. Reflecting the bigger rise in the Hong Kong dollar yields, the yield spread between 6-month Exchange Fund Bills and 6-month US Treasury Bills turned from a negative six basis points at end-2012 to a positive four basis points at end-2013, and the negative spreads between the 10-year Exchange Fund Notes and the 10-year US Treasury Notes narrowed from 118 basis points to 74 basis points.
0.0
0.5
1.0
1.5
2.0
2.5
3.0
3.5
1M 3M 6M 1Y 2Y 3Y 5Y 7Y 10Y
Diagram 5.1 : The US dollar and Hong Kong dollar yield curves steepened noticeably in 2013
Percent per annum
Spread of yield between Exchange Fund Bills/Notesand US Treasuries at end-2013 :6-month Time to Maturity : +4 basis points5-year Time to Maturity : -36 basis points10-year Time to Maturity : -74 basis points
Time to Maturity
US Treasuries (end-2013)
Exchange FundBills/Notes(end-2012)
US Treasuries(end-2012)
Exchange FundBills/Notes(end-2013)

78
5.3 Interest rates on the retail front also hovered at low levels. The Best Lending Rates remained unchanged at 5.00% or 5.25% during the whole of 2013. Meanwhile, the average savings deposit rate and the one-year time deposit rate quoted by the major banks (which are for deposits of less than $100,000) stayed low, at 0.01% and 0.16% respectively at end-2013. The composite interest rate(2), which indicates the average cost of funds for retail banks, edged up from 0.32% to 0.39%, still very low by historical standards.
0
40
80
120
160
200
240
280
320
360
0
1
2
3
4
5
6
1/11 4/11 7/11 10/11 1/12 4/12 7/12 10/12 1/13 4/13 7/13 10/13
Diagram 5.2 : Hong Kong dollar interest rates remained low through 2013(end for the week)
Percent per annum $Bn
Best Lending Rate
Three-monthHIBOR
Aggregate Balance (RHS)
Overnight HIBOR
Base Rate under the Discount Window
5.4 The Hong Kong dollar spot exchange rate was broadly stable in 2013, moving within a narrow range between 7.751 and 7.765 against the US dollar. It closed at 7.754 at end-2013, little changed from 7.751 a year earlier. Meanwhile, the discounts of the 3-month and 12-month Hong Kong dollar forward rates to the spot rates narrowed from 20 and 47 pips (each pip equivalent to HK$0.0001) a year earlier to 8 and 17 pips at end-2013 respectively.

79
5.5 Under the Linked Exchange Rate system, movements in the Hong Kong dollar exchange rate against other currencies closely follow those of the US dollar. During 2013, the US dollar strengthened notably against the Japanese yen and Australian dollar but weakened against most other major currencies. Between end-2012 and end-2013, the trade-weighted Hong Kong dollar Nominal Effective Exchange Rate Index(3) edged up by 0.7% while the Real Effective Exchange Rate Index increased by 2.4%.
7.55
7.60
7.65
7.70
7.75
7.80
7.85
7.90
1/11 7/11 1/12 7/12 1/13 7/13
HK$/US$spot rate
HK$/US$twelve-month forward rate
HK$/US$three-month forward rate
HK$/US$
85
90
95
100
105
110
115
1/09 1/10 1/11 1/12 1/13
Index (Jan 2010=100)
Nominal EERI
Real EERI
Diagram 5.3 : Hong Kong dollar remained stable against the US dollar
(end for the week)
Diagram 5.4 : The trade-weighted nominal and real EERIs rose in 2013(average for the month)
Linked Rate/Convertibility Zone*
Note : (*) The shaded area represents the Convertibility Zonethat was introduced in May 2005 as part of the threerefinements to the Linked Exchange Rate System.
Money supply and banking sector 5.6 The monetary aggregates continued to expand in 2013. The seasonally adjusted Hong Kong dollar narrow money supply (HK$M1) rose by 9.3% over a year earlier to $994 billion at end-2013, and the broad money supply (HK$M3) by 5.7% to $4,806 billion(4). Total deposits with authorised institutions (AIs)(5) increased by 10.6% over the same period, within which Hong Kong dollar deposits and foreign currency deposits recorded respective growth of 5.1% and 16.2%.

80
Q12009
Q12010
Q12011
Q12012
Q12013
-20
-10
0
10
20
30
40
50
60
70Percent
Position at end-2013 :$994 billion
Year-on-yearrate of change
Quarter-to-quarterrate of change
(a) HK$M1^(seasonally adjusted)
Diagram 5.5 : The monetary aggregates continued to expand in 2013
Q12009
Q12010
Q12011
Q12012
Q12013
-20
-10
0
10
20
30
40
50
60
70
(b) HK$M3#^
Percent
Year-on-yearrate of change
Quarter-to-quarterrate of change
Position at end-2013 :$4,806 billion
Notes : ( )̂ Figures refer to the positions at end of period. Notes : (#) Adjusted to include foreign currency swap deposits.
Table 5.1 : Hong Kong dollar money supply and total money supply
M1 M2 M3 % change during the quarter HK$^ Total HK$(a) Total HK$(a) Total 2012 Q1 2.1 4.6 2.8 2.5 2.7 2.4 Q2 3.6 3.2 -0.3 0.7 -0.3 0.7 Q3 3.4 6.4 4.6 3.2 4.6 3.2 Q4 5.8 6.4 4.6 4.3 4.7 4.3 2013 Q1 4.0 1.0 0.1 1.1 0.1 1.1 Q2 3.3 2.7 0.0 1.9 0.1 1.9 Q3 1.2 3.9 4.6 5.5 4.6 5.5 Q4 0.6 1.8 0.9 3.4 0.9 3.4 Total amount at end-2013 ($Bn) 994 1,511 4,795 10,054 4,806 10,083
% change over a year earlier 9.3 9.7 5.7 12.3 5.7 12.4
Notes : (^) Seasonally adjusted.
(a) Adjusted to include foreign currency swap deposits.
5.7 Total loans and advances expanded at a brisk pace of 16.0% over a year earlier to $6,457 billion at end-2013. Among the total, Hong Kong dollar loans increased by 8.2%, while foreign currency loans surged by 27.6%. With loans growing faster than deposits, the Hong Kong dollar loan-to-deposit ratio

81
rose from 79.8% at end-2012 to 82.1% at end-2013, and the foreign currency loan-to-deposit ratio from 54.2% to 59.6%. 5.8 Reflecting strong cross-border liquidity demand, loans for use outside Hong Kong jumped by 21.5% over a year earlier to $1,928 billion at end-2013. Loans for use in Hong Kong also rose by a notable 13.8% to $4,530 billion. Within the latter, trade financing surged by 43.8%, while loans to manufacturing rebounded by a sharp 20.1%. Loans to wholesale and retail trade also recorded a strong growth of 18.0% amid the solid expansion in domestic consumption. Along with the rebound in fund raising activities and the pick-up in stock market trading in the fourth quarter, loans to financial concerns rose by 19.6%. Loans to stockbrokers soared by 56.0%, despite showing wide fluctuations from quarter to quarter. By comparison, loans for purchase of residential properties and loans to building, construction, property development and investment recorded moderate growth of 3.9% and 7.0% respectively amid a quiet property market.
Table 5.2 : Loans and advances
All loans and advances for use in Hong Kong
Loans to :
Building, Whole- construction, All loans sale property Purchase and advances Total
% change and development of for use loans during Trade Manu- retail and residential Financial Stock- outside and the quarter finance facturing (a)trade investment property concerns brokers Total(b) (c)Hong Kong advances 2012 Q1 7.3 -0.1 2.9 -1.5 0.1 3.1 -14.6 1.4 4.5 2.3 Q2 5.0 -2.8 3.0 -0.9 2.3 -3.4 -1.4 1.6 4.4 2.3 Q3 5.6 -1.7 4.4 1.9 2.0 -2.5 -16.1 1.6 2.6 1.9 Q4 -8.2 -0.3 2.0 1.7 2.9 6.5 36.7 2.4 3.6 2.8 2013 Q1 19.3 2.6 1.1 -0.7 1.7 3.2 26.2 2.9 3.3 3.0 Q2 23.9 9.3 8.9 4.2 1.3 3.3 17.2 7.1 4.3 6.3 Q3 7.8 6.2 5.5 4.3 0.5 3.9 125.7 3.6 8.5 5.0 Q4 -9.7 0.8 1.6 -0.8 0.3 7.9 -53.3 -0.3 3.9 0.9 Total amount at end-2013 ($Bn)
550 217 418 993 950 327 31 4,530 1,928 6,457
% change over a 43.8 20.1 18.0 7.0 3.9 19.6 56.0 13.8 21.5 16.0 year earlier
Notes : Some loans have been reclassified. As such, the figures are not strictly comparable with those of previous quarters. Figures might not add up to the corresponding totals due to rounding.
(a) Figures also include loans for the purchase of flats under the Home Ownership Scheme, Private Sector Participation Scheme and Tenants Purchase Scheme, in addition to those for the purchase of private residential flats.
(b) Loans to individual sectors may not add up to all loans and advances for use in Hong Kong, as some sectors are not included.
(c) Also include loans where the place of use is not known.

82
5.9 The Hong Kong banking sector remains resilient, with the capital positions of the Hong Kong incorporated AIs staying strong. The total capital ratio of these AIs stayed high at an average of 16.1% at end-September 2013. Given that all AIs are well capitalised, so far they have no difficulties in complying with the statutory minimum ratios required by the HKMA under Basel III framework(6). 5.10 The HKMA has been implementing the Basel III framework promulgated by the Basel Committee on Banking Supervision in accordance with the transitional timetable set by the Basel Committee, and targets to fully phase in all the standards set out therein by 1 January 2019. The first phase of Basel III standards, which covers revised minimum capital requirements calculated based on a stricter definition of capital base and a wider risk coverage, came into operation with the Banking (Capital) (Amendment) Rules 2012 taking effect on 1 January 2013. 5.11 In December 2013, the HKMA launched the industry consultation on proposals for implementing the counter-cyclical capital buffer in Hong Kong, which aims at designing a Hong Kong specific approach to making buffer decision consistent with the Basel standards. The approach would be based on assessments of appropriate indicators which, in addition to the Basel Committee’s baseline credit-to-GDP ratio gap, may serve as a signal for excessive credit growth with potentially undesirable systemic implications (the condition for activating buffer buildup), or for either acute materialisation or gradual dissipation of latent systemic risk (the condition for triggering buffer release). 5.12 To implement the Basel Committee’s disclosure requirements associated with the first phase of Basel III capital standards, the Banking (Disclosure) (Amendment) Rules 2013 came into force on 30 June 2013. The HKMA will further amend the Banking (Disclosure) Rules, with the aim of implementing other disclosure requirements relating to the leverage ratio and capital buffers in 2015. 5.13 On the liquidity standards, the Basel Committee published a package of revisions to the Liquidity Coverage Ratio (LCR) in January 2013. Taking into account these revisions and the comments received from the two previous consultations, the HKMA subsequently updated its policy proposals for local implementation of the LCR, and launched the industry consultation on the revised proposals in July. Having considered the comments, the HKMA has finalised the liquidity proposals, and will submit a set of Banking (Liquidity) Rules to the Legislative Council in 2014 for implementation on 1 January 2015.

83
5.14 The HKMA continues to participate in the Basel Committee’s implementation monitoring process (IMP) and carry out its local IMP on an expanded sample of AIs to assess both the impact of the Basel III requirements and the implementation progress of AIs. As the Basel III capital standards have taken effect in Hong Kong since 1 January 2013, the scope of the latest local IMP is confined to monitoring implementation of the liquidity standards. Based on the local IMP results to date, AIs in Hong Kong are generally not expected to encounter major difficulties in complying with the new liquidity standards, though some AIs may need to adjust their liquidity profiles or liquid asset composition to satisfy the requirements.
5.15 The HKMA continues to monitor closely AIs’ management of liquidity and credit risks, funding strategy, mortgage lending, Mainland-related business and other areas of supervisory concern to ensure the resilience of the banking sector against any abrupt deterioration in the external macroeconomic environment. In October 2013, the HKMA introduced Stable Funding Requirement to ensure that AIs could maintain stable business operations continuously when market liquidity comes under significant stress. Under the requirement, AIs with loan growth of 20% or above in 2013 are required to maintain specific level of stable funds starting 2014. 5.16 Asset quality of the local banking sector remained good. The ratio of classified loans to total loans stayed at 0.48% at end-September 2013, virtually unchanged from the level at end-2012. The delinquency ratio for credit card lending remained low by historical standards, notwithstanding the marginal rise from 0.20% at end-2012 to 0.22% at end-September 2013. The delinquency ratio for residential mortgage loans also stayed low at 0.02% at end-2013.
Table 5.3 : Asset quality of retail banks* (as % of total loans)
As at end of period Pass loans Special mention loans Classified loans (gross)
2012 Q1 98.17 1.27 0.57 Q2 98.19 1.28 0.52 Q3 98.19 1.31 0.50 Q4 98.16 1.36 0.48 2013 Q1 98.32 1.22 0.46 Q2 98.42 1.11 0.47 Q3 98.25 1.27 0.48
Notes : Due to rounding, figures may not add up to 100.
(*) Period-end figures relate to Hong Kong offices and overseas branches. Loans and advances are classified into the following categories: Pass, Special Mention, Substandard, Doubtful and Loss. Loans in the substandard, doubtful and loss categories are collectively known as “classified loans”.

84
5.17 Offshore renminbi (RMB) business gathered further momentum in 2013. RMB trade settlement handled by banks in Hong Kong surged by 46% to RMB3,841 billion. The total outstanding RMB deposits and certificates of deposit likewise surged, by 46% over a year earlier to RMB1,053 billion at end-2013. Meanwhile, reflecting the buoyant RMB financing activities, the outstanding amount of RMB loans soared from RMB79 billion at end-2012 to RMB116 billion at end-2013, while RMB bond issuance increased from RMB112 billion in 2012 to RMB117 billion in 2013. 5.18 Several policy initiatives introduced by the Central Government in 2013 have contributed to the continued growth of offshore RMB business in Hong Kong. The expansion of the RMB Qualified Foreign Institutional Investor (RQFII) scheme in March, which entails a broader range of eligible institutions and relaxed investment restrictions, has facilitated the launch of more RMB financial products in Hong Kong. In July the Mainland authorities also streamlined the requirements for cross-border RMB transactions, increasing the flexibility for corporates to move RMB funds between the onshore and offshore markets.
Table 5.4 : Renminbi deposits and cross-border renminbi trade settlement in Hong Kong
Interest rates on(a)
Number of AIs engaged in
RMB business
Amount of cross-border RMB trade settlement(c) As at end of period
Demand and
savings deposits
Time deposits
Total deposits
Savings deposits(b)
Three-month time deposits(b)
(RMB Mn) (RMB Mn) (RMB Mn) (%) (%) (RMB Mn) 2012 Q1 156,788 397,528 554,317 0.25 0.52 135 571,176 Q2 136,616 421,094 557,710 0.25 0.52 133 641,907 Q3 118,997 426,703 545,701 0.25 0.52 136 716,946 Q4 123,542 479,453 602,996 0.25 0.52 139 702,474 2013 Q1 144,314 523,744 668,058 0.25 0.52 140 830,955 Q2 127,512 570,447 697,959 0.25 0.53 140 864,366 Q3 135,217 594,801 730,018 0.25 0.53 143 921,282 Q4 151,055 709,417 860,472 0.25 0.53 146 1,224,349 % change over a year earlier 22.3 48.0 42.7 N.A. N.A. N.A. 74.3
Notes : (a) The interest rates are based on a survey conducted by the HKMA.
(b) Period average figures.
(c) Figures during the period.
N.A. Not available.

85
The debt market 5.19 On the back of a rise in public sector issuance, the Hong Kong dollar debt market expanded further in 2013. Total gross issuance of Hong Kong dollar debt securities rose by 10.6% to $2,356.8 billion. Within the total, public sector issuance jumped by 14.5% to $2,164.1 billion, due to the leap in the issuance of Exchange Fund papers, which accounted for 98% of the total public issuance. By contrast, private sector issuance(7) plummeted by 20.1% to $191.7 billion, with the decline in new debt issued by AIs and local corporations more than offsetting the mild increase in that by non-MDBs overseas borrowers. At end-2013, the total outstanding balance of Hong Kong dollar debt securities grew by 8.5% over a year earlier to a record level of $1,419.4 billion, equivalent to 29.5% of HK$M3 or 24.5% of Hong Kong dollar-denominated assets of the entire banking sector(8). 5.20 As to the Government Bond (“GB”) Programme, a total of $20 billion institutional GBs, with tenors ranging from two to ten years, were issued in 2013. For the retail part, in June 2013 the Government issued another $10 billion of inflation-linked retail bonds (i.e. iBonds) in accordance with the 2013-14 Budget. At end-2013, the outstanding size of bonds issued under the GB Programme amounted to $90 billion, including ten institutional issues for $60 billion, and three retail issues (iBonds) for $30 billion. 5.21 The HKMA has devised two liquidity enhancement measures for the institutional GB market, namely the switch tender and bond swap facility, which would be introduced in 2014. These measures will enhance the effectiveness of market-making activities and liquidity management on the part of the Primary Dealers, and facilitate end-investors to trade more efficiently in the market.
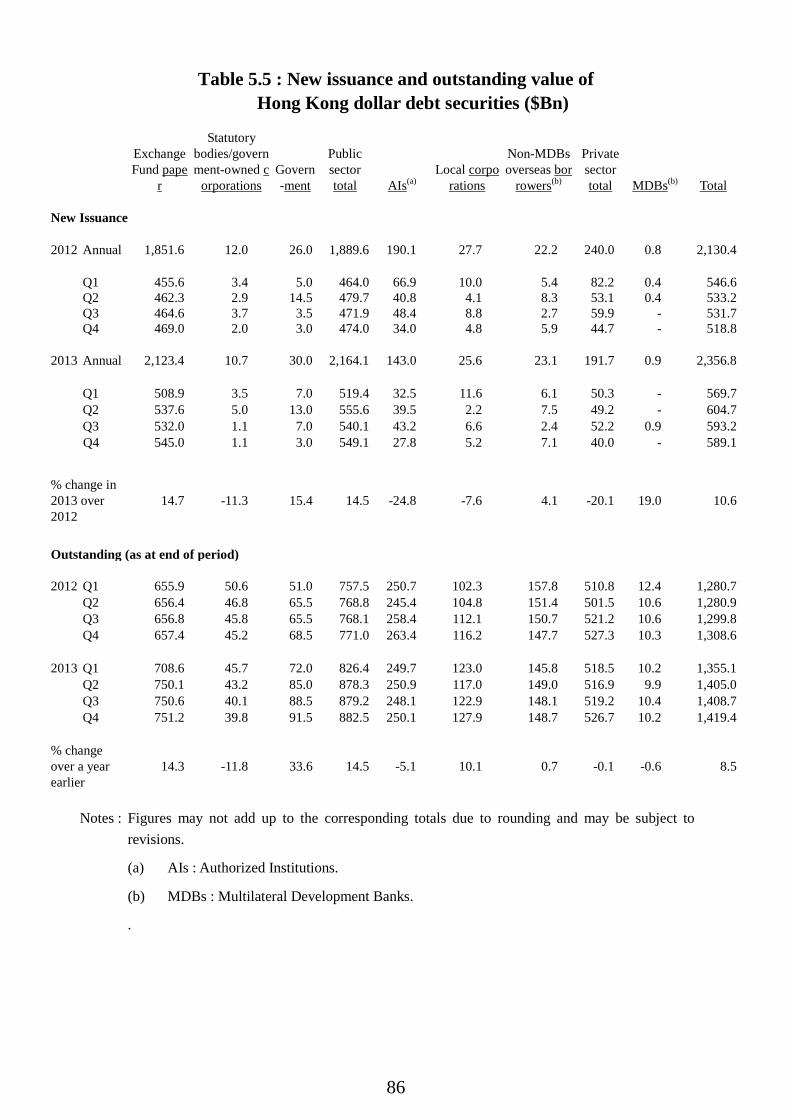
86
Table 5.5 : New issuance and outstanding value of Hong Kong dollar debt securities ($Bn)
Exchange Fund pape
r
Statutory bodies/government-owned c
orporations Govern-ment
Public sector total AIs(a)
Local corporations
Non-MDBs overseas bor
rowers(b)
Private sector total MDBs(b) Total
New Issuance
2012 Annual 1,851.6 12.0 26.0 1,889.6 190.1 27.7 22.2 240.0 0.8 2,130.4 Q1 455.6 3.4 5.0 464.0 66.9 10.0 5.4 82.2 0.4 546.6 Q2 462.3 2.9 14.5 479.7 40.8 4.1 8.3 53.1 0.4 533.2 Q3 464.6 3.7 3.5 471.9 48.4 8.8 2.7 59.9 - 531.7 Q4 469.0 2.0 3.0 474.0 34.0 4.8 5.9 44.7 - 518.8 2013 Annual 2,123.4 10.7 30.0 2,164.1 143.0 25.6 23.1 191.7 0.9 2,356.8 Q1 508.9 3.5 7.0 519.4 32.5 11.6 6.1 50.3 - 569.7 Q2 537.6 5.0 13.0 555.6 39.5 2.2 7.5 49.2 - 604.7 Q3 532.0 1.1 7.0 540.1 43.2 6.6 2.4 52.2 0.9 593.2 Q4 545.0 1.1 3.0 549.1 27.8 5.2 7.1 40.0 - 589.1
% change in 2013 over 2012
14.7 -11.3 15.4 14.5 -24.8 -7.6 4.1 -20.1 19.0 10.6
Outstanding (as at end of period)
2012 Q1 655.9 50.6 51.0 757.5 250.7 102.3 157.8 510.8 12.4 1,280.7 Q2 656.4 46.8 65.5 768.8 245.4 104.8 151.4 501.5 10.6 1,280.9 Q3 656.8 45.8 65.5 768.1 258.4 112.1 150.7 521.2 10.6 1,299.8 Q4 657.4 45.2 68.5 771.0 263.4 116.2 147.7 527.3 10.3 1,308.6 2013 Q1 708.6 45.7 72.0 826.4 249.7 123.0 145.8 518.5 10.2 1,355.1 Q2 750.1 43.2 85.0 878.3 250.9 117.0 149.0 516.9 9.9 1,405.0 Q3 750.6 40.1 88.5 879.2 248.1 122.9 148.1 519.2 10.4 1,408.7 Q4 751.2 39.8 91.5 882.5 250.1 127.9 148.7 526.7 10.2 1,419.4 % change over a year earlier
14.3 -11.8 33.6 14.5 -5.1 10.1 0.7 -0.1 -0.6 8.5
Notes : Figures may not add up to the corresponding totals due to rounding and may be subject to
revisions.
(a) AIs : Authorized Institutions.
(b) MDBs : Multilateral Development Banks.
.

87
The stock and derivatives markets 5.22 The local stock market exhibited considerable volatility in 2013, marked by sharp swings in market sentiment as developments in the external environment unfolded. Concerns over liquidity strains in the Mainland and market expectations of the US Federal Reserve tapering its asset purchases sent the Hang Seng Index (HSI) to a low of 19 814 in June. It recouped the loss in the ensuing months and reached a high of 24 039 in December, mainly supported by the improved performance of the global economy, in particular the United States and the Mainland. The HSI closed the year at 23 306, 2.9% higher than end-2012. In tandem, the market capitalisation of the Hong Kong stock market rose by 9.5% to $24.0 trillion. It remained the sixth largest stock exchange in the world and second largest in Asia according to the World Federation of Exchanges(9). 5.23 After an uptick in the first quarter, trading activities quietened down in the subsequent quarters. For 2013 as a whole, average daily turnover in the securities market rebounded by 16.2% from the low base of last year to $62.6 billion. As to derivatives products, the average daily trading volume of futures and options(10) expanded by 9.2%, with mixed performance across different products. Trading of H-shares Index futures and stock options grew by 31.9% and 9.1% respectively, while that of HSI futures and HSI options fell by 3.2% and 6.2%. By contrast, average daily trading value of securitised derivatives products declined by 2.8%, with the plunge of 16.2% in callable bull/bear contracts more than offsetting the increase of 9.6% in derivative warrants.

88
0
2,000
4,000
6,000
8,000
10,000
12,000
14,000
16,000
18,000
20,000
22,000
24,000
26,000
0
20
40
60
80
100
120
140
160
Q12009
Q12010
Q12011
Q12012
Q12013
Market capitalisation* (RHS)Average daily turnover (LHS)
Diagram 5.7 : Market capitalisation expanded further while trading activities
rebounded from a low base
0
50
100
150
200
1/11 7/11 1/12 7/12 1/13 7/13
Hang Seng Index
S & P 500 Index
FTSE 100 Index
Topix Index (Tokyo)
MSCI Asia ex. Japan Index
Performance in 2013 :HSI : +2.9% Topix : +51.5% S&P : +29.6% FTSE : +14.4%MSCI Asia ex Jp : +0.7%
Index#(end-2010=100)
Diagram 5.6 : The Hang Seng Index exhibited considerable volatility in 2013
$Bn $Bn
Notes : (#) Position at end of month. Note : (*) Position at end of quarter. Table 5.6 : Average daily turnover of derivatives products
of the Hong Kong market
Hang Seng Index futur
es
Hang Seng Index optio
ns
H-shares Index futur
es Stock
options
Total futures and options tra
ded*
Derivative warrants ($Mn)
Callable bull/bear
contracts ($Mn)
Total securitised derivatives traded ($M
n)^ 2012 Annual 82 905 37 597 64 863 228 438 487 994 6,666 6,207 12,873 Q1 84 278 35 475 63 286 238 445 493 555 8,621 7,612 16,234 Q2 88 614 43 634 65 131 225 266 501 374 6,274 6,317 12,590 Q3 77 549 36 050 60 055 211 479 454 782 5,558 5,748 11,307 Q4 81 372 35 255 71 281 239 438 503 888 6,264 5,174 11,438 2013 Annual 80 247 35 252 85 538 249 295 532 905 7,309 5,202 12,510 Q1 82 570 38 464 77 111 278 115 552 686 10,268 6,032 16,301 Q2 91 137 43 304 87 653 256 162 563 658 7,150 5,433 12,583 Q3 78 192 31 109 87 853 217 169 503 305 6,190 5,250 11,441 Q4 69 587 28 614 89 157 247 867 514 398 5,783 4,138 9,920 % change in 2013 Q4 over 2012 Q4
-14.5 -18.8 25.1 3.5 2.1 -7.7 -20.0 -13.3
% change in 2013 over 2012
-3.2 -6.2 31.9 9.1 9.2 9.6 -16.2 -2.8
Notes : (*) Turnover figures for individual futures and options are in number of contracts, and may not add up to the total futures and options traded as some products are not included.
(^) Comprising derivative warrants and callable bull/bear contracts. Figures may not add up to the corresponding totals due to rounding.

89
5.24 Fund raising activities remained subdued in most part of 2013 but staged a sharp rebound in the fourth quarter. Total equity capital raised, comprising new share floatations and post-listing arrangements on the Main Board and the Growth Enterprise Market (GEM)(11), soared by 24.1% over the low base in 2012 to $378.9 billion in 2013. Yet this was still a low level compared with the annual average of $463.6 billion in the past ten years. Within the total, the amount of funds raised through Initial Public Offerings (IPOs) surged by 87.6% to $169.0 billion, $109.1 billion of which took place in the last quarter. In terms of fund raised through IPOs, Hong Kong’s global ranking rose to the second place in 2013. 5.25 Mainland enterprises continued to play a dominant role in the local stock market. At end-2013, a total of 797 Mainland enterprises (including 182 H-share companies, 122 “Red Chips” companies and 493 private enterprises) were listed on the Main Board and GEM, accounting for 49% of the total number of listed companies and 57% of total market capitalisation. In 2013, Mainland-related stocks also accounted for a notable 72% of equity turnover and an even higher 82% of total equity fund raised in the Hong Kong stock exchange.
5.26 Following the launch of the After-Hours Future Trading (AHFT) in April 2013, the Hong Kong Exchanges and Clearing Limited (HKEx) published its review results on market activities in November. The results indicated that trading during the AHFT session was orderly, bid/offer spread was tight, and the clearing and settlement processes were smooth. Considering the development needs of AHFT and feedbacks from the market, subsequently in January 2014 the HKEx introduced Mini HSI Futures, Mini H-shares Index Futures and its Block Trading Facility to the AHFT session, on top of the existing HSI Futures and H-shares Index Futures. This would further enable market participants to hedge or adjust their market positions in response to latest news and events during the European and US business days. HKEx would continue to monitor the development of AHFT, and would consider offering more products and extending the ending time of AHFT as and when appropriate.

90
Fund management and investment funds 5.27 Most segments of the fund management industry showed a robust performance in 2013. Reflecting the upsurge in the first half, gross retail sales of mutual funds soared by 29.6% to a record-high of US$71.1 billion in 2013(12). Aggregate net asset value of the approved constituent funds under the Mandatory Provident Fund (MPF) schemes(13) also leapt by 16.9% over end-2012 to $514.1 billion at end-2013. Yet the amount of net assets managed by retail hedge funds declined further(14). Insurance sector 5.28 The insurance sector(15) expanded further in the first three quarters of 2013. Gross premium income from long-term business soared by 19.8% over a year earlier. Within the total, premium income from non-investment linked and investment-linked plans jumped by 19.7% and 20.7% respectively. As to general business, gross and net premium income grew by 9.1% and 11.3% respectively.
Table 5.7 : Insurance business in Hong Kong* ($Mn)
General business Premium for long-term business^
Gross pre
mium Net premi
um Underwriting
profit
Individual life and
annuity (non-linked)
Individual life and
annuity (linked)
Other individual business
Non-retirement scheme
group business
All long-term business
Gross premium
from long-term business
and general busi
ness
2012 Annual 39,312 27,008 2,215 60,339 17,122 104 279 77,844 117,156 Q1 10,924 7,608 853 15,056 3,961 16 79 19,112 30,036 Q2 9,328 6,593 735 14,697 3,924 28 50 18,699 28,027 Q3 10,264 6,930 464 15,351 3,998 26 115 19,490 29,754 Q4 8,796 5,877 163 15,235 5,239 34 35 20,543 29,339 2013 Q1 12,359 8,759 657 17,527 4,919 36 53 22,535 34,894 Q2 10,428 7,446 864 17,570 5,597 40 61 23,268 33,696 Q3 10,512 7,314 671 18,910 3,831 40 50 22,831 33,343 % change in 2013 Q1-Q3 over 2012 Q1-Q3
9.1 11.3 6.8 19.7 20.7 65.7 -32.8 19.8 16.1
Notes : (*) Figures are based on provisional statistics of the Hong Kong insurance industry.
(^) Figures refer to new business only. Retirement scheme business is excluded.

91
5.29 The Inland Revenue (Amendment) (No.3) Bill 2013 was gazetted in December 2013 and subsequently submitted to the Legislative Council in January 2014. With a view to attracting more enterprises to establish their captive insurers for underwriting risks of companies within the same group to which they belong in Hong Kong, the profits tax on offshore risks insurance business of captive insurers would be reduced by 50%. This would help form a cluster of captive insurers, and thus attract the development of other related business, including reinsurance, legal and actuarial services in Hong Kong. Highlights of policy and market developments 5.30 The Inland Revenue and Stamp Duty Legislation (Alternative Bond Schemes) (Amendment) Ordinance 2013 came into operation on 19 July 2013, providing a comparable taxation framework for some common types of Islamic bonds (sukuk) vis-à-vis conventional bonds. The Loans (Amendment) Bill 2014 was then submitted to the Legislative Council in January 2014 to further promote the development of sukuk market in Hong Kong by enabling the issuance of sukuk under the GB Programme. These would help promote the further development of the local bond market and diversify the financial products and services in the market, thereby enhancing the competitiveness of Hong Kong as an international financial centre and asset management centre. 5.31 In January 2014, the Government and the financial regulators, namely the HKMA, the Securities and Futures Commission and the Insurance Authority, launched a three-month public consultation on proposals for establishing an effective resolution regime to address the systemic and moral hazard risks posed by the failure of systemically important and “too-big-to-fail” financial institutions in Hong Kong. Currently, Hong Kong’s statutory framework does not provide for all of the powers that the Financial Stability Board (FSB) of the Group of Twenty considers necessary for an effective resolution regime. The proposed regime in the public consultation seeks to meet the standards set by the FSB, including in relation to the scope of the regime, governance arrangements, resolution powers and options, safeguards, funding, cross-border co-operation and information sharing. The Government and the financial regulators aimed to conduct the second stage of public consultation later in 2014 on the specific details and operation of the resolution regime, with a view to introducing the legislative proposals into the Legislative Council in 2015.

92
Notes : (1) Prior to 9 October 2008, the Base Rate was set at either 150 basis points above the
prevailing US Federal Funds Target Rate (FFTR) or the average of the five-day moving averages of the overnight and one-month HIBORs, whichever was higher. Between 9 October 2008 and 31 March 2009, this formula for determination of the Base Rate was temporarily changed by reducing the spread of 150 basis points above the prevailing FFTR to 50 basis points and by removing the other leg relating to the moving averages of the relevant interbank interest rates. After a review of the appropriateness of the new Base Rate formula, the narrower 50 basis point spread over the FFTR was retained while the HIBOR leg was re-instated in the calculation of the Base Rate after 31 March 2009.
(2) In December 2005, the HKMA published a new data series on composite interest rate,
reflecting movement in various deposit rates, interbank and other interest rates to closely track the average cost of funds for banks. The published data enable the banks to keep track of changes in funding cost and thus help improve interest rate risk management in the banking sector.
(3) The trade-weighted Nominal Effective Exchange Rate Index (EERI) is an indicator of
the overall exchange value of the Hong Kong dollar against a fixed basket of other currencies. Specifically, it is a weighted average of the exchange rates of the Hong Kong dollar against some 15 currencies of its major trading partners, with the weights adopted being the respective shares of these trading partners in the total value of merchandise trade for Hong Kong during 2009 and 2010.
The Real EERI of the Hong Kong dollar is obtained by adjusting the Nominal EERI
for relative movements in the seasonally adjusted consumer price indices of the respective trading partners.
(4) The various definitions of the money supply are as follows: M1 : Notes and coins with the public, plus customers’ demand deposits with
licensed banks.
M2 : M1 plus customers’ savings and time deposits with licensed banks, plus negotiable certificates of deposit (NCDs) issued by licensed banks, held outside the monetary sector as well as short-term Exchange Fund placements of less than one month.
M3 : M2 plus customers’ deposits with restricted licence banks and deposit-taking
companies, plus NCDs issued by such institutions and held outside the monetary sector.
Among the various monetary aggregates, more apparent seasonal patterns are found in HK$M1, currency held by the public, and demand deposits.
(5) AIs include licensed banks, restricted licence banks and deposit-taking companies.
At end-2013, there were 156 licensed banks, 21 restricted licence banks and 24 deposit-taking companies in Hong Kong. Altogether, 201 AIs (excluding representative offices) from 31 countries and territories (including Hong Kong) had a presence in Hong Kong.
(6) Basel III was introduced by the Basel Committee in December 2010 (and subsequently
revised in June 2011) to strengthen the resilience of banks and banking systems in the

93
light of lessons drawn from the global financial crisis. It tightens the definition of regulatory capital and increases the minimum common equity requirement from 2% to 4.5% of risk-weighted assets and the Tier 1 capital from 4% to 6% (with the total capital ratio remaining at 8%); requires banks to hold a Capital Conservation Buffer of 2.5% during good times and a Countercyclical Capital Buffer in the range of 0% to 2.5% (or higher at national discretion) at times of excessive credit growth, both to be met by common equity. It introduces a supplementary leverage ratio as a backstop to risk-weighted capital measures and enhances the transparency of the capital base. In addition, Basel III introduces two liquidity standards i.e. the Liquidity Coverage Ratio (LCR) to promote short term liquidity resilience and the Net Stable Funding Ratio (NSFR) to encourage more stable funding structures. The LCR is scheduled to take effect from 1 January 2015, starting with a minimum required level of 60% which is to be stepped up by 10 percentage points annually until achieving 100% by 1 January 2019. The NSFR is scheduled to take effect from 1 January 2018.
(7) The figures for private sector debt may not represent a full coverage of all the
Hong Kong dollar debt paper issued. (8) Assets of the banking sector include notes and coins, amount due from AIs in Hong
Kong as well as from banks abroad, loans and advances to customers, negotiable certificates of deposit (NCDs) held, negotiable debt instruments other than NCDs held, and other assets. Certificates of indebtedness issued by Exchange Fund and the counterpart bank notes issued are nevertheless excluded.
(9) The ranking is made by the World Federation of Exchanges, a global trade association
for the securities exchange industry. Its membership comprises 60 securities exchanges, covering almost all globally recognised stock exchanges.
(10) At end-2013, there were 74 classes of stock options contracts and 41 classes of stock
futures contracts. (11) At end-2013, there were 1 451 and 192 companies listed on the Main Board and GEM
respectively. (12) These figures are obtained from the Sales and Redemptions Survey conducted by the
Hong Kong Investment Funds Association on their members, and cover only the active authorised funds that have responded to the survey. At end-2013, the survey covered a total of 1 201 active authorised funds.
(13) At end-2013, there were 19 approved trustees. On MPF products, 38 master trust
schemes, two industry schemes and one employer sponsored scheme, comprising altogether 477 constituent funds, were approved by the Mandatory Provident Fund Schemes Authority. A total of 264 000 employers, 2.49 million employees and 212 000 self-employed persons have participated in MPF schemes.
(14) At end-2013, there were three SFC-authorised retail hedge funds with combined net
asset size of US$257 million. The amount of net assets under management was 59.2% lower than the end-2012 level, though still representing an increase of more than 1.5 times of that at end-2002, the year when the hedge funds guidelines were first issued.
(15) At end-2013, there were 155 authorised insurers in Hong Kong. Within this total, 44
were engaged in long-term insurance business, 92 in general insurance business, and 19 in composite insurance business. These authorised insurers come from 22 countries and territories (including Hong Kong).

94
CHAPTER 6 : THE LABOUR SECTOR
Summary • The labour market remained tight in 2013, on the back of sustained
moderate economic growth and vibrant job creation in the private sector. The unemployment rate stayed at low levels throughout the year, thereby underpinning the sustained improvement in wages and earnings.
• Total employment grew strongly for the third straight year by 2.3% (or 83 200) to a record high of 3 744 000 in 2013, reflecting sturdy labour demand. Labour force likewise expanded notably at a broadly similar pace amid favourable job and income prospects.
• The seasonally adjusted unemployment rate went up somewhat in early 2013, yet progressively edged down thereafter, ending the year at a low level of 3.2% in the fourth quarter. The unemployment rate averaged at 3.3% in 2013, same as that in 2012, signifying another year of full employment.
• Nominal wages and earnings stayed on the rise in 2013. Grassroots workers continued to enjoy more appreciable income growth, thanks in part to the upward adjustment of the Statutory Minimum Wage (SMW) rate in May 2013.
Overall labour market situation(1) 6.1 The labour market stayed firm and remained in full employment throughout 2013. Job creation continued apace in many sectors, especially those hiring a larger proportion of lower-skilled workers, thereby pushing total employment up notably further to a new annual-high in 2013. Job vacancies in the private sector also posted further strong and widespread growth. The ample employment opportunities had in turn lured more job-seekers, leading to a visible expansion in labour force. As a result, the unemployment rate(2) hovered at low levels, averaging at 3.3% for 2013 as a whole, same as that in 2012. The underemployment rate(3) likewise remained unchanged at 1.5%. Nominal wages and earnings continued to see solid improvement, with the lower-paid segment faring better alongside the upward adjustment of the SMW rate in May. Reflecting the persistently tight manpower situation in the past few years, labour shortage was particularly evident in some sectors and occupations.
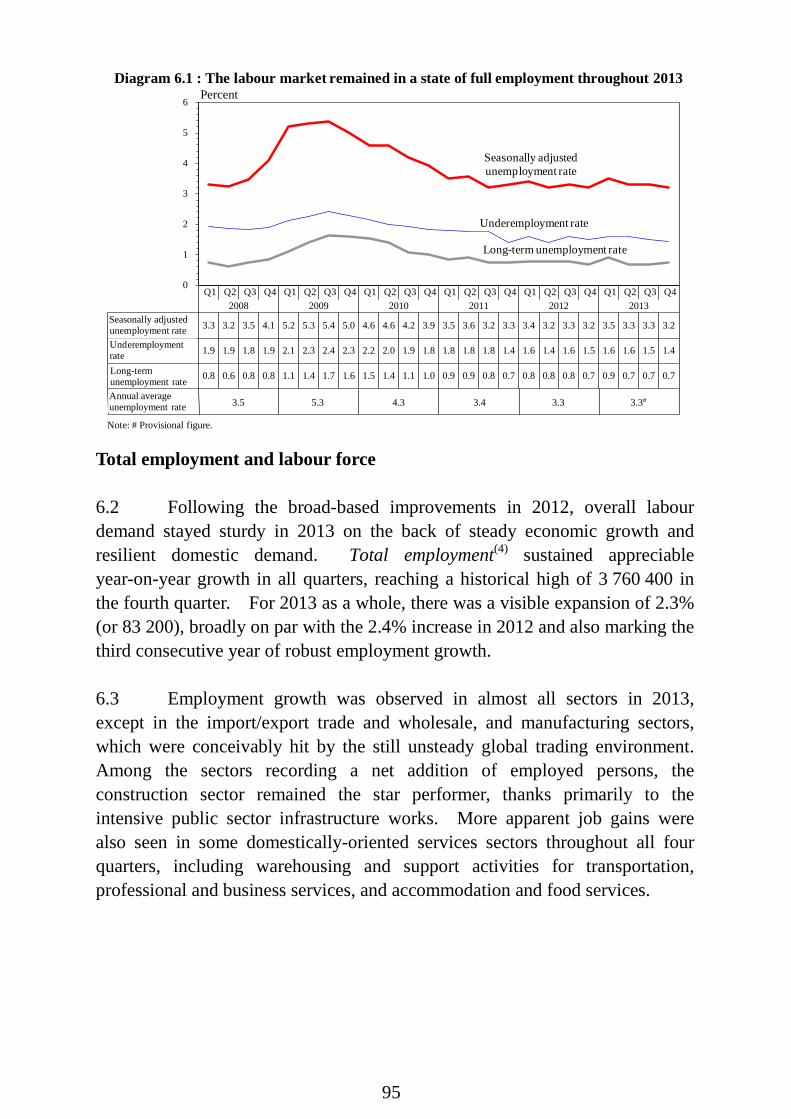
95
Q1 Q2 Q3 Q4 Q1 Q2 Q3 Q4 Q1 Q2 Q3 Q4 Q1 Q2 Q3 Q4 Q1 Q2 Q3 Q4 Q1 Q2 Q3 Q42008 2009 2010 2011 2012 2013
Seasonally adjustedunemployment rate 3.3 3.2 3.5 4.1 5.2 5.3 5.4 5.0 4.6 4.6 4.2 3.9 3.5 3.6 3.2 3.3 3.4 3.2 3.3 3.2 3.5 3.3 3.3 3.2
Underemploymentrate 1.9 1.9 1.8 1.9 2.1 2.3 2.4 2.3 2.2 2.0 1.9 1.8 1.8 1.8 1.8 1.4 1.6 1.4 1.6 1.5 1.6 1.6 1.5 1.4
Long-termunemployment rate 0.8 0.6 0.8 0.8 1.1 1.4 1.7 1.6 1.5 1.4 1.1 1.0 0.9 0.9 0.8 0.7 0.8 0.8 0.8 0.7 0.9 0.7 0.7 0.7
0
1
2
3
4
5
6
Diagram 6.1 : The labour market remained in a state of full employment throughout 2013Percent
Seasonally adjustedunemployment rate
Underemployment rate
Long-term unemployment rate
UnderemploymentrateLong-termunemployment rateAnnual averageunemployment rate 3.5 5.3 4.3 3.4 3.3 3.3#
Note: # Provisional figure. Total employment and labour force 6.2 Following the broad-based improvements in 2012, overall labour demand stayed sturdy in 2013 on the back of steady economic growth and resilient domestic demand. Total employment(4) sustained appreciable year-on-year growth in all quarters, reaching a historical high of 3 760 400 in the fourth quarter. For 2013 as a whole, there was a visible expansion of 2.3% (or 83 200), broadly on par with the 2.4% increase in 2012 and also marking the third consecutive year of robust employment growth. 6.3 Employment growth was observed in almost all sectors in 2013, except in the import/export trade and wholesale, and manufacturing sectors, which were conceivably hit by the still unsteady global trading environment. Among the sectors recording a net addition of employed persons, the construction sector remained the star performer, thanks primarily to the intensive public sector infrastructure works. More apparent job gains were also seen in some domestically-oriented services sectors throughout all four quarters, including warehousing and support activities for transportation, professional and business services, and accommodation and food services.

96
6.4 Analysed by occupational category, employment in the lower-skilled segment posted notable growth throughout 2013, cumulating to a spectacular increase of 4.1% (or 92 300) for the year as a whole. Job gains were particularly visible among craft and related workers, workers engaged in elementary occupations, and service and sales workers. In contrast, higher-skilled employment stayed soft during most of the year, though finally arresting the downtrend in the fourth quarter amid the vibrant job creation for associate professionals. Yet there was still a 0.7% decline for 2013 as a whole. As for other socio-economic characteristics, persons aged 50 or above and those with post-secondary education were the ones benefiting more from the expansion in job opportunities. 6.5 On the supply side, the labour force(5) expanded visibly further by 2.3% for 2013 as a whole, representing a net addition of 88 100 job-seekers over 2012. The abundant job opportunities stemming from sturdy labour demand, as well as better income prospects due in part to the upward adjustment of the SMW rate from $28 to $30 in May 2013, have induced more people to enter the labour market. For instance, the labour force participation rates for persons aged 15-24 and 50-59 both rose visibly by 1.9 percentage points to 38.9% and 71.1% respectively, while that for females went up by 1.0 percentage point to 54.6%. The overall labour force participation rate increased by 0.9 percentage point to 61.4%, the highest level since 2003.
Table 6.1 : The labour force, and persons employed, unemployed and underemployed
Labour force
Persons employed Persons
unemployed(a) Persons
underemployed 2012 Annual 3 785 200 (2.2) 3 660 700 (2.4) 124 500 57 600 Q1 3 762 800 (2.9) 3 639 700 (3.0) 123 100 58 600 Q2 3 784 400 (2.2) 3 658 000 (2.6) 126 500 54 400 Q3 3 781 800 (1.5) 3 650 100 (1.4) 131 700 59 200 Q4 3 794 900 (1.7) 3 678 100 (1.7) 116 800 55 900 2013 Annual# 3 873 300 (2.3) 3 744 000 (2.3) 129 300 58 700 Q1 3 852 700 (2.4) 3 720 200 (2.2) 132 500 61 100 Q2 3 877 200 (2.5) 3 745 100 (2.4) 132 100 61 400 Q3 3 884 300 (2.7) 3 750 100 (2.7) 134 200 57 000 Q4 3 878 800 (2.2) 3 760 400 (2.2) 118 400 55 500 <§> <0.2> Notes : (a) These include first-time job-seekers and re-entrants into the labour force. ( ) % change over a year earlier.
Seasonally adjusted quarter-to-quarter % change for the fourth quarter of 2013. # Provisional figures. § Change less than 0.05%. Source : General Household Survey, Census and Statistics Department.

97
Q12008
Q12009
Q12010
Q12011
Q12012
Q12013
-1.5
-1.0
-0.5
0.0
0.5
1.0
1.5
2.0
2.5
3.0
3.5
4.0
(a) Year-on-year rate of change
Total employment
Labour force
Percent
Q12008
Q12009
Q12010
Q12011
Q12012
Q12013
-1.5
-1.0
-0.5
0.0
0.5
1.0
1.5
2.0
2.5
3.0
3.5
4.0
(b) Quarter-to-quarter rate of change(seasonally adjusted)
Total employment
Labour force
Percent
Diagram 6.2 : Both employment and labour force saw furtherappreciable growth in 2013
Q12008
Q12009
Q12010
Q12011
Q12012
Q12013
-4.0-3.0-2.0-1.00.01.02.03.04.05.06.07.08.09.0
10.0
(a) Year-on-year rate of change
Higher-skilled employment
Lower-skilled employment
Percent
Q12008
Q12009
Q12010
Q12011
Q12012
Q12013
-4.0-3.0-2.0-1.00.01.02.03.04.05.06.07.08.09.0
10.0
(b) Quarter-to-quarter rate of change
Higher-skilled employment
Lower-skilled employment
Percent
Diagram 6.3 : Lower-skilled employment continued to expand strongly while higher-skilled employment gradually recovered to a mild positive year-on-year growth towards end-2013

98
Table 6.2 : Labour force participation rates by gender and by age group (%)
2008 2009 2010 2011 2012 2013#
Male 15-24 38.7 38.1 35.4 35.7 36.4 37.9 of which:
15-19 13.0 12.5 10.2 9.9 10.5 11.2 20-24 65.5 64.1 60.6 61.1 61.1 62.9
25-29 94.2 94.7 94.0 93.9 94.5 93.7 30-39 96.6 96.4 96.5 96.5 96.8 96.9 40-49 95.2 95.1 95.0 95.1 95.3 95.6 50-59 83.9 84.3 84.4 84.9 85.1 87.1 ≥ 60 19.9 21.3 22.0 23.4 25.6 26.9 Overall 69.7 69.4 68.5 68.4 68.7 69.3 Female 15-24 42.4 40.3 36.7 37.0 37.5 39.8 of which:
15-19 12.4 11.3 9.2 9.1 9.7 11.6 20-24 69.3 66.0 61.4 62.1 62.0 64.2
25-29 87.4 87.0 86.6 87.5 87.2 86.3 30-39 77.0 77.3 75.6 76.8 77.5 78.9 40-49 66.6 68.8 68.2 69.9 70.8 72.9 50-59 48.6 48.9 49.0 51.6 53.8 56.0 ≥ 60 5.6 6.6 6.8 8.1 8.8 9.7 Overall 53.1 53.2 51.9 53.0 53.6 54.6 Both genders combined 15-24 40.6 39.2 36.0 36.4 37.0 38.9 of which:
15-19 12.7 11.9 9.7 9.5 10.1 11.4 20-24 67.5 65.1 61.0 61.6 61.6 63.5
25-29 90.4 90.3 89.8 90.2 90.3 89.5 30-39 85.2 85.3 84.3 84.9 85.4 86.2 40-49 79.8 80.8 80.2 81.0 81.4 82.7 50-59 66.1 66.5 66.5 68.0 69.2 71.1 ≥ 60 12.5 13.7 14.1 15.5 16.9 18.0 Overall 60.9 60.8 59.6 60.1 60.5 61.4 Note : # Provisional figures. Source : General Household Survey, Census and Statistics Department.

99
Profile of unemployment 6.6 The labour market remained in a state of full employment in 2013. With total employment growing at roughly the same pace as the labour force for the year as a whole, the unemployment rate averaged at a low level of 3.3%, same as that in 2012. The average number of unemployed persons nevertheless increased slightly by 4 800 over 2012 to 129 300 in 2013, alongside the expansion in labour force. 6.7 Analysed by economic sector and comparing 2013 with 2012, visible decreases in unemployment rates were recorded in some sectors including warehousing and support activities for transportation, and professional and business services (down by 1.0 and 0.5 percentage point respectively), while relatively more notable increases were seen in postal and courier activities, and wholesale (up by 2.1 and 0.6 percentage points respectively). In terms of skill segment, the average unemployment rate of the lower-skilled segment remained unchanged at 3.5%, while that of the high-skilled segment edged up by 0.1 percentage point to 1.9%. The unemployment rate of the low paying sectors(6) as a whole likewise stayed at a low level of 3.1% in 2013, same as that in 2012. As regards age profile, a more notable increase in unemployment rate was seen among persons aged 25-29, offsetting the decline observed for those aged 30-39. 6.8 In terms of the quarterly trend, the seasonally adjusted unemployment rate went up to 3.5% in the first quarter, edged down to 3.3% in the second quarter and held steady at this level in the third quarter, and fell further to 3.2% in the fourth quarter. Both the higher- and lower-skilled segments witnessed a broadly similar quarterly pattern in 2013. During the fourth quarter of 2013, relatively more visible decreases in unemployment rate were observed in insurance and education. As for other socio-economic attributes, the unemployment rates of persons aged 15-24, those with post-secondary education, clerical support workers and associate professionals showed the most noticeable declines in the fourth quarter.
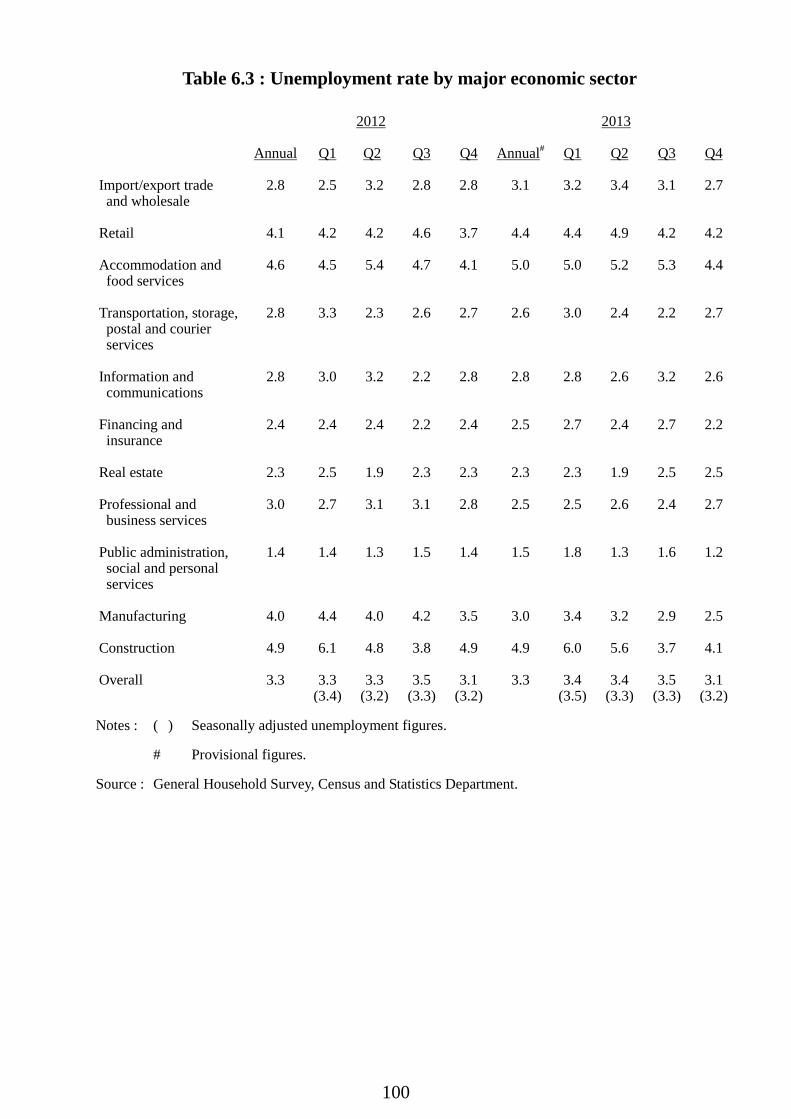
100
Table 6.3 : Unemployment rate by major economic sector 2012 2013 Annual Q1 Q2 Q3 Q4 Annual# Q1 Q2 Q3 Q4 Import/export trade and wholesale
2.8 2.5 3.2 2.8 2.8 3.1 3.2 3.4 3.1 2.7
Retail 4.1 4.2 4.2 4.6 3.7 4.4 4.4 4.9 4.2 4.2 Accommodation and food services
4.6 4.5 5.4 4.7 4.1 5.0 5.0 5.2 5.3 4.4
Transportation, storage, postal and courier services
2.8 3.3 2.3 2.6 2.7 2.6 3.0 2.4 2.2 2.7
Information and communications
2.8 3.0 3.2 2.2 2.8 2.8 2.8 2.6 3.2 2.6
Financing and insurance
2.4 2.4 2.4 2.2 2.4 2.5 2.7 2.4 2.7 2.2
Real estate 2.3 2.5 1.9 2.3 2.3 2.3 2.3 1.9 2.5 2.5 Professional and business services
3.0 2.7 3.1 3.1 2.8 2.5 2.5 2.6 2.4 2.7
Public administration, social and personal services
1.4 1.4 1.3 1.5 1.4 1.5 1.8 1.3 1.6 1.2
Manufacturing 4.0 4.4 4.0 4.2 3.5 3.0 3.4 3.2 2.9 2.5 Construction 4.9 6.1 4.8 3.8 4.9 4.9 6.0 5.6 3.7 4.1 Overall 3.3 3.3 3.3 3.5 3.1 3.3 3.4 3.4 3.5 3.1 (3.4) (3.2) (3.3) (3.2) (3.5) (3.3) (3.3) (3.2) Notes : ( ) Seasonally adjusted unemployment figures. # Provisional figures. Source : General Household Survey, Census and Statistics Department.

101
Q12008
Q12009
Q12010
Q12011
Q12012
Q12013
0
1
2
3
4
5
6
7
Diagram 6.4 : The annual unemployment rates of both higher-skilled and lower-skilled workers remained low in 2013
Percent
Unemployment rate of lower-skilled workers
Unemployment rate of higher-skilled workers
Seasonally adjustedunemployment rate
Table 6.4 : Unemployment rate* by skill segment
2012 2013 Annual Q1 Q2 Q3 Q4 Annual# Q1 Q2 Q3 Q4 Higher-skilled segment 1.8 1.7 1.8 1.9 2.0 1.9 2.2 1.9 1.8 1.6 Managers and administrators
1.4 1.1 1.5 1.4 1.8 1.6 1.9 1.6 1.3 1.6
Professionals 1.5 1.7 1.2 1.5 1.5 1.5 1.9 1.4 1.3 1.4 Associate professionals 2.2 2.0 2.2 2.3 2.3 2.2 2.5 2.2 2.3 1.8 Lower-skilled segment^ 3.5 3.7 3.6 3.4 3.2 3.5 3.7 3.7 3.4 3.2 Clerical support workers
3.1 2.9 3.1 3.5 2.9 3.1 3.0 2.9 3.6 3.0
Service and sales workers
4.0 4.1 4.3 4.4 3.6 4.3 4.5 4.4 4.2 4.0
Craft and related
workers 4.8 6.2 5.0 4.0 4.2 4.6 5.5 5.3 3.5 4.2
Plant and machine
operators and assemblers
2.1 2.6 1.6 1.6 2.2 2.0 1.8 1.8 2.1 2.1
Elementary occupations 3.2 3.5 3.4 2.8 3.0 3.1 3.3 3.4 3.0 2.6 Notes : * Not seasonally adjusted, and not including first-time job-seekers and re-entrants into the
labour force. ^ Including other occupations. # Provisional figures. Source : General Household Survey, Census and Statistics Department.

102
Table 6.5 : Unemployment rate* by age and educational attainment 2012 2013 Annual Q1 Q2 Q3 Q4 Annual# Q1 Q2 Q3 Q4 Age 15-24 9.3 8.1 9.7 11.5 7.8 9.5 8.1 9.6 11.3 8.8 of which:
15-19 13.9 12.2 14.7 15.1 12.3 14.4 13.5 17.8 14.9 11.5 20-24 8.6 7.6 8.9 10.9 7.2 8.7 7.3 8.3 10.7 8.4
25-29 3.3 3.2 3.8 3.2 3.1 3.6 3.3 3.5 3.8 3.7 30-39 2.4 2.4 2.4 2.6 2.1 2.3 2.3 2.5 2.3 1.9 40-49 2.8 2.9 2.9 2.7 2.7 2.8 3.3 2.7 2.6 2.7 50-59 2.9 3.1 2.8 2.9 3.1 3.0 3.5 3.1 2.8 2.7 ≥ 60 2.0 2.7 1.8 1.5 1.8 2.2 2.4 2.6 2.1 1.9 Educational attainment
Primary education and below
3.5 3.8 3.8 3.0 3.2 3.7 4.1 4.1 3.2 3.2
Lower secondary
education 4.2 4.2 4.3 3.7 4.1 4.2 5.1 4.5 3.5 3.9
Upper secondary
education^ 3.2 3.4 3.2 3.4 2.7 3.2 3.1 3.2 3.4 3.0
Post-secondary
education 3.0 2.5 2.9 3.6 3.0 3.0 2.9 3.0 3.6 2.7
Notes : * Not seasonally adjusted, but including first-time job-seekers and re-entrants into the
labour force. ^ Including craft courses. # Provisional figures. Source : General Household Survey, Census and Statistics Department. 6.9 Other indicators measuring the intensity of unemployment in 2013 were generally positive. The number of long-term unemployed persons (i.e. unemployed for six months or longer) fell marginally from 30 300 in 2012 to 29 700 in 2013, while the long-term unemployment rate stood at a low level of 0.8% in both years. Meanwhile, the percentage share of long-term unemployment in total unemployment fell to 23.0%, the lowest level since 2008 and the median duration of unemployment shortened slightly further from 73 days in 2012 to 71 days in 2013. As regards the reason of unemployment, the proportion of dismissal or lay-offs among the total number of unemployed persons declined markedly by 3.9 percentage points to 48.3% over the same period.

103
Profile of underemployment 6.10 The underemployment situation remained by and large stable in 2013. The annual underemployment rate stayed at a low level of 1.5% in 2013, same as that in 2012. Over the same period, the number of underemployed persons rose slightly by 1 100 to 58 700. As for the latest trend, the underemployment rate in the fourth quarter of 2013 went down to 1.4% from 1.5% in the preceding quarter. Comparing the fourth quarter with the preceding one, the underemployment rates in the construction, and food and beverage service activities sectors declined visibly, more than offsetting the rises observed in warehousing and support activities for transportation, and arts, entertainment and recreation. Analysed by occupational category, craft and related workers, and service and sales workers were those witnessing more visible decreases in underemployment rates over the same period of comparison.

104
Box 6.1
Labour’s share of national income in Hong Kong Gross Domestic Product (GDP) is a measure of the total value of production of all resident producing units of an economy in a specified period. Viewing from the income side, it represents the total incomes for various factors of production (viz. labour, capital and entrepreneurship) distributed by the resident producing units in an economy, as rewards to their production of goods and provision of services. Factor incomes1 include "compensation of employees" (CoE) and "gross operating surplus" (GOS) of resident producers2. Labour’s share of national income, measured in terms of the ratio of CoE to GDP, is commonly used as a crude indicator of income distribution among labour and capital in an economy. While the long-run stability of this ratio was once a “stylised fact” about economic growth, recent empirical studies revealed that many economies witnessed a notable decline in this ratio during the past two decades3. Through analysing past data back to the 1980s, this article tries to identify the key features and determinants of labour’s share of national income in Hong Kong.
Characteristics of labour’s share of national income in Hong Kong
Unlike many other developed economies, labour’s share of national income in Hong Kong, while experiencing some ups and downs in the past two to three decades, did not exhibit any visible directional change (Chart 1). The ratio of CoE to GDP averaged at 50.5% during 1980 – 2012, pointing to a more or less equal share of national income among labour and capital. In fact, CoE and GOS grew at about the same average annual rates of 9.0% and 8.4% respectively between 1980 and 2012. By and large, labour and capital enjoyed proportionate income growth alongside economic expansion in Hong Kong.
Chart 1 : Labour’s share of national income remained broadly stable in overall terms
-20
-15
-10
-5
0
5
10
15
20
0
10
20
30
40
50
60
70
80
90
100
1980 1982 1984 1986 1988 1990 1992 1994 1996 1998 2000 2002 2004 2006 2008 2010 2012
GOS (LHS)
CoE (LHS)
(% of nominal GDP) (%)
Rate of change in real GDP* (RHS)
Notes : (*) Refers to rate of change in real GDP at market prices (right axis). On the other hand, the left axis refers to
percentage shares of GOS and CoE in nominal GDP at basic prices (see footnote 1 for more details). Figures for 2012 are subject to revision later on when more data are available. Source : National income statistics, Census and Statistics Department.
(1) Figures on income components of GDP can be obtained from the GDP estimates compiled by the production approach.
In Hong Kong, GDP by production approach is measured at basic prices which include “taxes on production”. Nevertheless, for analytical purpose, “taxes on production” has been removed from the series of GDP at basic prices discussed in this article.
(2) CoE refers to total wages and salaries, payment in kind and employer’s social security expenditure. GOS measures the return to capital and entrepreneurship as a result of engaging in production.
(3) According to OECD Employment Outlook 2012, the median labour’s share of national income in OECD countries, for instance, went down from 66.1% to 61.7% between the early 1990s and the late 2000s.

105
Box 6.1 (Cont’d)
As depicted in Chart 1, labour’s share of national income in Hong Kong tended to increase during economic downswings and vice versa. This phenomenon can be largely explained by the higher sensitivity of capital income, as captured by GOS, to changes in economic situation. For instance, GOS often plunged immediately in response to slowdown in economic activities and weakening demand, though likewise tended to bounce back swiftly along with recovery. In contrast, movements in CoE were much less volatile and somewhat lagging throughout business cycles along with other labour market indicators. Indeed, most of the past incidences of shrinking nominal GDP were associated with a noticeable dip in GOS, except 2002 and 2003 when the unemployment rate hit successive record highs (Chart 2).
Chart 2 : CoE was less sensitive to economic swings as compared to GOS
-10
-5
0
5
10
15
20
25
30
1981 1983 1985 1987 1989 1991 1993 1995 1997 1999 2001 2003 2005 2007 2009 2011
(%)Contribution of GOS to rate of change in nominal GDP in %-point
Contribution of CoE to rate of change in nominal GDP in %-point
Notes : Years with negative nominal GDP growth are highlighted in shades for reference.
Figures for 2012 are subject to revision later on when more data are available. Source : National income statistics, Census and Statistics Department.
Determinants of labour’s share of national income
Some frequently discussed determinants of labour’s share in literature include globalisation which is often measured by trade openness of an economy, the relative size of the financial sector which reflects the importance of the industry in overall economic activity, technological progress, size of public sector, and labour market institutions such as the presence of a minimum wage.
With reference to the above factors, a simple time-series econometric model is constructed to test the significance of these determinants in explaining the movement in labour’s share of national income in Hong Kong from 1980 to 20124. Year-on-year growth in real GDP is also included as an explanatory variable to account for the changes in economic situation. Among the potential determinants discussed above, the relative size of the financial sector was not found to bear a statistically significant relationship with labour’s share of national income in Hong Kong from this regression analysis. The impact of other explanatory variables is summarised below in Table 1.
(4) Labour’s share of the national income is adopted as dependent variable. Explanatory variables include trade openness
(sum of imports and exports as a share of GDP), relative size of the financial sector (total value added of financing and insurance sector as a share of GDP), technological progress (as proxied by the annual rate of change in total factor productivity), size of public sector (government consumption expenditure as a share of GDP) and the presence of Statutory Minimum Wage (dummy variable). All of the above statistics are sourced from Census and Statistics Department, except total factor productivity which is extracted from internal staff estimates.

106
Box 6.1 (Cont’d)
Table 1: Determinants of labour’s share of national income in Hong Kong
Explanatory variable Coefficient (t-statistics) Trade openness -0.01** (-3.4) Size of public sector 1.10** (6.4) Statutory Minimum Wage 2.12** (2.5) Year-on-year growth in real GDP -0.14** (-2.9) Technological progress 0.39** (3.4)
Diagnostics Number of observations 33 (1980 – 2012) Adjusted R-square 0.71
Notes : (**) Indicates significance at 5% level. Coefficient represents the impact of 1 percentage point change in the explanatory variable (except dummy variable) on labour’s share of national income which is also presented in percentage point. The coefficient for dummy variable indicates the change in labour’s share of national income in the presence of the variable.
The above results broadly conform to the findings of other researches done across economies. In brief, trade openness was negatively correlated to labour’s share of national income, possibly because globalisation facilitated relocation of production to places where cheaper land and labour are available, which had in turn added to the competition faced by local labour from their overseas counterparts. On the other hand, the size of public sector and the presence of Statutory Minimum Wage had positive impacts on the ratio of CoE to GDP. Conceivably, increase in government spending for the provision of non-profit-making services such as public healthcare and education would generate mainly labour income instead of capital income, thus boding well for labour’s share of national income. Likewise, the presence of Statutory Minimum Wage, when appropriately set without unduly jeopardising competitiveness or causing significant negative impact on employment, also tended to boost the total earnings of the employees by protecting the lesser-skilled segment from excessively low wages.
Interestingly, unlike other developed economies, the above regression analysis indicated a positive relationship between technological progress and labour’s share of national income in Hong Kong. Literature generally shows that technological progress enables machines to replace human in routine tasks, thus depressing the income share going to lower-skilled workers. In contrast, higher-skilled workers often benefit from improvements in technology, particularly those in the form of innovations in information and communication technologies and production processes, as these workers know how to leverage on new technology for productivity enhancement. In this connection, the markedly increased share of higher-skilled employees in Hong Kong from 20.8% in 1993 to 36.1% in 20125 should suffice to speak for the positive correlation between technological progress and the labour’s share of national income observed in Hong Kong.
(5) Higher-skilled occupations include managers, administrators, professionals and associate professionals. Before 1993,
the breakdown of associate professionals was not available in the occupation classification. That said, jobs upgrading was already apparent in the years prior to 1993, with the share of managers, administrators and professionals in all employees up visibly from 9.1% in 1985 (the earliest figure available) to 17.3% in 1992.

107
Box 6.1 (Cont’d)
Concluding remarks
Hong Kong’s flexible and adaptive workforce has always been the cornerstone and precious resources of our economic development. Labour’s share of national income in Hong Kong, albeit lagging behind changes in economic conditions, has stayed relatively stable over time, suggesting a rather balanced income growth among labour and capital in the past few decades. As for the determinants of labour’s share, while Hong Kong largely shared a similar set of factors with other developed economies, the growing pool of well-educated local talents underpinned by the Government’s huge investment in education over the past decades appeared to have helped mitigate the commonly observed downward pressure inflicted by technological progress on the ratio of CoE to GDP. With an even more fierce competition among different economies under the wave of globalisation, the Hong Kong economy must continue with its restructuring towards a high value-added and knowledge-based economy. In this regard, continuous training and skills upgrading are essential for the local workforce so as to better fit the needs for Hong Kong’s future economic development.

108
Profile of employment in establishments
6.11 The quarterly statistics collected from private sector establishments on employment, vacancies, wages and payroll are available only up to September 2013. To bring the analysis more up-to-date, attempts have been made wherever possible by drawing reference to information from supplementary sources. 6.12 Total employment in private sector establishments grew solidly further by 1.7% in September 2013 over a year earlier to a new record high of 2 706 500, reflecting vibrant job creation along with the steady economic growth. Backed by the high level of public infrastructure works, employment at construction sites continued to expand appreciably in September (up 6.3% year-on-year), though at a less rapid pace compared to the preceding quarters. Visible job gains were also observed in some domestically-oriented services sectors, such as information and communications (up 5.2%), social and personal services (up 2.9%), financing, insurance, real estate, professional and business services (up 2.6%), and transportation, storage, postal and courier services (up 2.5%). These gains more than offset the secular downtrend in manufacturing employment (down 2.7%) as well as the jobs lost in the import/export trade and wholesale sector (down 0.7%). Analysed by establishment size, employment in large enterprises expanded by 2.5% over a year earlier, contributing almost 80% of the job creation. Meanwhile, employment in small and medium-sized enterprises (SMEs)(7) grew by 0.8%. Taking the first nine months of 2013 together, total employment in private sector establishments increased by 1.7% year-on-year. As for the civil service, employment grew steadily by 1.5% in September 2013, and by 1.2% in the first nine months of 2013 over the same period last year. Vacancies 6.13 Job vacancies continued to increase notably in all major economic sectors in September 2013, reflecting the generally tight manpower situation. The number of private sector vacancies went up by 12.7% over a year earlier to 78 300 in September 2013. For the first nine months of 2013, job vacancies in the private sector rose by 12.4% year-on-year.

109
Table 6.6 : Employment by major economic sector 2012 2013 Annual average Mar Jun Sep Dec Mar Jun Sep Import/export trade
and wholesale 556 400
(-1.1) 557 200
(-1.4) 558 300
(-0.4) 555 400
(-1.6) 554 600
(-0.9) 558 000
(0.1) 554 400
(-0.7) 551 600
(-0.7) Retail 259 100
(2.5) 256 800
(2.2) 259 400
(2.9) 259 700
(2.7) 260 200
(2.1) 262 700
(2.3) 264 800
(2.1) 264 800
(1.9) Accommodation(a) and
food services 272 300
(2.6) 269 000
(2.3) 272 300
(2.3) 273 700
(2.8) 274 200
(3.0) 275 600
(2.4) 276 200
(1.4) 275 900
(0.8) Transportation, storage,
postal and courier services
166 600 (1.8)
165 600 (2.2)
166 700 (2.2)
166 900 (1.9)
167 200 (1.1)
168 100 (1.5)
169 300 (1.6)
171 000 (2.5)
Information and
communications 96 400
(5.6) 95 200
(6.6) 95 900
(5.3) 97 500
(6.3) 97 200
(4.2) 98 400
(3.3) 101 100
(5.4) 102 600
(5.2) Financing, insurance,
real estate, professional and business services
666 500 (3.1)
662 200 (4.6)
664 700 (3.5)
668 200 (2.4)
671 000 (1.9)
676 100 (2.1)
678 300 (2.1)
685 200 (2.6)
Social and personal
services 450 000
(2.4) 444 600
(1.9) 450 600
(2.7) 450 800
(2.3) 454 200
(2.8) 458 600
(3.2) 461 000
(2.3) 463 800
(2.9) Manufacturing 106 900
(-5.1) 108 000
(-6.2) 107 600
(-5.4) 106 800
(-4.3) 105 300
(-4.6) 104 000
(-3.7) 103 400
(-4.0) 103 900
(-2.7) Construction sites
(manual workers only) 71 300 (13.8)
70 600 (20.1)
71 700 (22.4)
72 200 (13.4)
70 600 (1.7)
77 800 (10.1)
82 500 (15.1)
76 800 (6.3)
All establishments
surveyed in the private sector(b)
2 656 000 (1.9)
2 639 700 (2.1)
<0.4>
2 657 700 (2.3)
<0.7>
2 661 500 (1.6)
<0.2>
2 665 000 (1.3) <§>
2 689 700 (1.9)
<0.9>
2 701 600 (1.7)
<0.5>
2 706 500 (1.7)
<0.3> Civil service(c) 159 300
(1.1) 159 200
(1.5) 159 200
(1.2) 159 100
(0.9) 159 700
(0.7) 160 700
(0.9) 160 900
(1.1) 161 500
(1.5)
Notes : Employment figures enumerated from business establishments, as obtained from the Quarterly Survey of Employment and Vacancies, are somewhat different from those enumerated from households, as obtained from the General Household Survey. This is mainly due to difference in sectoral coverage: while the former survey covers selected major sectors, the latter survey covers all sectors in the economy.
(a) Accommodation services sector covers hotels, guesthouses, boarding houses and other establishments providing short term accommodation.
(b) The total figures on private sector employment cover also employment in mining and quarrying; and in electricity and gas supply, and waste management, besides employment in the major sectors indicated above.
(c) These figures cover only those employed on civil service terms of appointment. Judges, judicial officers, ICAC officers, locally engaged staff working in the Hong Kong Economic and Trade Offices outside Hong Kong, and other government employees such as non-civil service contract staff are not included.
( ) % change over a year earlier.
< > Seasonally adjusted quarter-to-quarter % change.
§ Increase less than 0.05%.
Sources : Quarterly Survey of Employment and Vacancies, Census and Statistics Department. Quarterly Employment Survey of Construction Sites, Census and Statistics Department.

110
6.14 Analysed by economic sector, substantial vacancy gains were observed in construction sites (up 73.2% year-on-year), information and communications (up 40.2%), and import/export trade and wholesale (up 23.1%) in September 2013. In terms of occupational category, additional job openings were concentrated in the lower-skilled segment (up 19.4%), particularly among craft and related workers (up 44.4%), and service and sales workers (up 28.2%). In contrast, higher-skilled vacancies fell by 1.9% year-on-year in September, as the increase in job openings for associate professionals (up 9.5%) was more than offset by the decreases in professionals (down 34.5%), and managers and administrators (down 13.9%). Taking the first nine months of 2013 as a whole, lower-skilled vacancies surged by 18.8%, while high-skilled vacancies went down marginally by 0.4%. Analysed by the size of establishments, both large enterprises and SMEs posted double-digit vacancy growth, at 14.0% and 11.3% respectively in September 2013 over a year earlier. As regards the civil service, the number of job openings went up by 1.1% year-on-year to 6 670 in September 2013. 6.15 Analysing the number of job openings in private sector establishments relative to that of job-seekers, the ratio of job vacancies per 100 unemployed persons was 58 in September 2013, down marginally from 59 in June 2013 but still above the 53 recorded a year earlier. In terms of skill segment, the ratios for both higher-skilled and lower-skilled jobs in September 2013, at 84 and 68 respectively, were higher than their year-ago levels, signifying a general tightening of the manpower situation. Yet the increase in vacancy-to-unemployed ratio was more apparent among lower-skilled jobs, in particular for service and sales workers, and craft and related workers. Analysed by economic sector, visible manpower shortages were observed in human health services, and residential care and social work services, with the corresponding ratios far exceeding 100. When expressed as a percentage of job vacancies to total employment opportunities, the vacancy rate for private sector establishments in September 2013, at 2.8%, was 0.3 percentage point higher than a year earlier. More distinct increases in vacancy rate were seen in residential care and social work services, financing and insurance, information and communications, construction sites, and accommodation and food services over the period.

111
Table 6.7 : Vacancies by major economic sector
Number of vacancies 2012 2013 Vacancy
rate in Sep 2013
Annual average Mar Jun Sep Dec Mar Jun Sep
Economic sector (%) Import/export trade
and wholesale 8 510 (8.5)
8 950 (7.8)
9 140 (10.6)
8 240 (6.4)
7 710 (9.0)
10 440 (16.7)
10 120 (10.7)
10 140 (23.1)
1.8
Retail 7 900
(33.6) 8 180 (35.7)
6 900 (32.7)
8 950 (45.9)
7 560 (20.4)
9 400 (15.0)
8 120 (17.8)
9 190 (2.6)
3.4
Accommodation(a) and
food services 12 030 (46.5)
11 040 (42.7)
12 270 (51.1)
12 940 (62.0)
11 860 (31.9)
15 550 (40.9)
12 970 (5.7)
14 360 (11.0)
4.9
Transportation, storage,
postal and courier services
3 290 (25.5)
3 200 (26.1)
3 410 (13.2)
3 540 (45.7)
3 010 (20.2)
3 620 (13.1)
4 100 (20.3)
3 640 (2.8)
2.1
Information and
communications 2 370 (1.7)
2 480 (-7.4)
2 380 (8.6)
2 150 (-4.0)
2 480 (11.6)
2 680 (8.2)
3 050 (28.3)
3 020 (40.2)
2.9
Financing, insurance,
real estate, professional and business services
16 090 (14.5)
16 180 (14.8)
16 610 (14.0)
15 820 (10.6)
15 750 (18.9)
17 510 (8.2)
17 950 (8.1)
18 450 (16.6)
2.6
Social and personal
services 15 170 (16.0)
16 310 (23.1)
16 490 (29.5)
14 820 (6.6)
13 070 (5.0)
17 330 (6.2)
17 690 (7.3)
15 620 (5.4)
3.3
Manufacturing 2 740
(25.0) 2 860 (21.1)
2 970 (37.2)
2 370 (2.6)
2 770 (42.5)
2 600 (-9.1)
2 680 (-9.8)
2 700 (14.1)
2.5
Construction sites
(manual workers only) 640
(95.1) 670
(347.0) 590 (94.7)
510 (-4.3)
800 (142.7)
930 (39.6)
1 030 (74.3)
890 (73.2)
1.1
All establishments
surveyed in the private sector(b)
68 840 (21.5)
69 970 (22.3) <8.7>
70 840 (25.1) <5.5>
69 460 (20.4)
<-2.1>
65 100 (18.0) <4.9>
80 170 (14.6) <5.6>
77 860 (9.9)
<1.2>
78 300 (12.7) <1.1>
2.8
Civil service(c) 6 340
(0.9) 5 880 (-2.5)
6 350 (1.8)
6 600 (-0.5)
6 550 (5.0)
6 220 (5.8)
6 980 (10.0)
6 670 (1.1)
4.0
Notes : Vacancy rate refers to the ratio of vacancies to total employment opportunities (actual employment plus vacancies).
(a) Accommodation services sector covers hotels, guesthouses, boarding houses and other establishments providing short term accommodation.
(b) The total figures on private sector vacancies cover also vacancies in mining and quarrying; and in electricity and gas supply, and waste management, besides vacancies in the major sectors indicated above.
(c) These figures cover only vacancies for those staff to be employed on civil service terms of appointment.
( ) % change over a year earlier.
< > Seasonally adjusted quarter-to-quarter % change.
Sources : Quarterly Survey of Employment and Vacancies, Census and Statistics Department.
Quarterly Employment Survey of Construction Sites, Census and Statistics Department.

112
Q12008
Q12009
Q12010
Q12011
Q12012
Q12013
0
20
40
60
80
100
120
140
160
180
200
(a) By economic sector
ManufacturingImport/export trade and wholesaleRetailAccommodation and food servicesTransportation and storageFinancing, insurance, real estate, prof. & business servicesSocial and personal services
Ratio of the number of job vacancies to that of 100 unemployed persons
Q12008
Q12009
Q12010
Q12011
Q12012
Q12013
0
20
40
60
80
100
120
140
160
180
200
(b) By occupation
Professionals and associate professionalsManagers and administratorsClerical support workersService and sales workersPlant and machine operators, craft & related workersElementary occupations
Ratio of the number of job vacancies to that of 100 unemployed persons
Diagram 6.5 : Manpower shortage remained apparent in some sectors and occupations
6.16 The vacancy registration figures compiled by the Labour Department (LD), notwithstanding its smaller sample size, may provide some hints on the latest developments in the labour market. In the fourth quarter of 2013, the average number of private sector job vacancies posted by LD was around 102 400 per month, up notably by 11.3% from a year earlier. For 2013 as a whole, the monthly average number of private sector vacancies rose by 6.3% over 2012, reaching an all-time high of 101 400.

113
Wages and earnings 6.17 On the back of favourable labour market conditions, wages and earnings sustained solid growth in 2013. Wage index, which covers regular payment to employees at the supervisory level or below, moved up by 4.8% year-on-year in nominal terms in September. Taking the first nine months of 2013 together, nominal wages improved by 4.9%, translating into a real increase of 0.3% after adjusting for inflation(8). These compared with the corresponding rises of 5.7% and 1.6% for 2012 as a whole. 6.18 In September 2013, nominal wage index increased across all economic sectors and occupations. More notable year-on-year improvements were observed in real estate leasing and maintenance management (up 9.4%), and professional and business services (up 6.1%). Meanwhile, miscellaneous non-production workers (up 6.8%) and service workers (up 6.4%) recorded more visible rises over the same period, reflecting the particularly tight manpower demand-supply balance in the lower-paid segment. 6.19 Labour earnings(9), as measured by the index of payroll per person engaged in the private sector, posted an appreciable growth of 5.9% year-on-year in the third quarter of 2013. After discounting inflation, there was a real growth of 0.5%. Taking the first nine months of 2013 together, labour earnings grew by 5.4% in nominal terms and 1.0% in real terms, as against 6.5% and 2.3% respectively for 2012 as a whole. 6.20 Nominal payroll rose in all major sectors in the third quarter of 2013. In particular, earnings for workers in professional and business services (up 8.0%), accommodation and food service activities (up 7.7%), and real estate activities (up 7.5%) registered more notable increases.

114
Q12008
Q12009
Q12010
Q12011
Q12012
Q12013
-6
-4
-2
0
2
4
6
8
10
12
(a) Year-on-year rate of changein nominal terms
Payroll index
Wage index
Percent
Q12008
Q12009
Q12010
Q12011
Q12012
Q12013
-6
-4
-2
0
2
4
6
8
10
12
(b) Year-on-year rate of changein real terms
Payroll index
Wage index
Percent
Diagram 6.6 : Labour earnings and wages sustained solid increases
6.21 More recent statistics compiled from the General Household Survey, though not strictly comparable to those from the business establishment surveys, showed that in the fourth quarter of 2013, the average monthly employment earnings(10) of full-time employees (excluding foreign domestic helpers) in the lowest decile group continued to enjoy above-average income gain at 4.4% year-on-year in nominal terms, backed by the sturdy labour demand in the lower-skilled segment. For 2013 as a whole, preliminary estimates suggested that their average employment earnings rose appreciably further by around 6% in nominal terms and 1% in real terms after discounting inflation, thanks in part to the upward adjustment of the SMW rate in May 2013. The vibrant and widespread job creation also supported further improvement in the overall income situation. The median monthly household income (excluding foreign domestic helpers) sustained notable growth in all quarters in 2013, and rose by 5.7% year-on-year in the fourth quarter, translating into a real increase of 1.4% after discounting inflation.

115
Highlights of recent labour-related measures and policy developments 6.22 In 2013, LD organised 14 large-scale job fairs. A total of 392 organisations conducted on the spot recruitment in the job fairs, offering over 29 500 vacancies. 15 training bodies also took part in these job fairs to introduce job-training programmes and receive applications. LD will continue to organise large-scale job fairs in different districts, canvassing vacancies from various industries for application by job-seekers on the spot. Apart from large-scale job fairs, district-based job fairs are organised at LD’s Job Centres from time to time to assist job-seekers in seeking employment. Recruitment activities are also staged by catering and retail employers at the two industry-based recruitment centres regularly for interviewing job-seekers on the spot. 6.23 To enhance the employability and employment opportunities of young people, middle-aged persons and persons with disabilities, LD increased the allowance payable to employers under the Youth Employment and Training Programme (YETP), the Employment Programme for the Middle-aged, and the Work Orientation and Placement Scheme in June 2013 so as to encourage employers to offer them more openings and provide them with on-the-job training. To encourage participation in workplace attachment training and pre-employment training under YETP, LD increased the attachment allowance and training allowance payable to trainees in June and September 2013 respectively. Moreover, to strengthen employment services to residents living in remote areas, LD will set up a job centre in Tung Chung in 2014 to facilitate job-seekers in the region in obtaining employment services and save their travelling expenses. 6.24 The Work Incentive Transport Subsidy Scheme seeks to help relieve the burden of work-related travelling expenses on low-income earners so as to promote sustained employment. The Scheme has since 2013 provided the option of individual-based applications in addition to household-based applications. Individual-based applicants can apply from July 2013 onwards. As at end-2013, LD received 23 436 individual-based applications. This accounted for 56% of the total 42 016 applications received from July to December 2013.

116
6.25 The Standard Working Hours Committee (SWHC) was appointed in April 2013 for a term of three years to foster an informed and in-depth discussion in the community with a view to building consensus and identifying the way forward for a working hours policy. Up to end-January 2014, the SWHC has held five meetings. Two working groups (WGs) on “Working Hours Consultation” and “Working Hours Study” have also been formed to specifically take charge of wide public consultation and comprehensive working hours surveys. The two WGs strive to submit WG reports to the SWHC by end-2014 for deliberation and formulation of future work.
6.26 With the revised SMW rate of $30 per hour taking effect from 1 May 2013, LD has organised extensive publicity activities and conducted proactive workplace inspections to enforce the statutory requirement. Implementation of the revised SMW rate has generally been smooth, and the state of law compliance has been satisfactory. The overall employment market has remained stable and earnings of low-income employees have continued to improve.

117
Notes : (1) Labour force statistics enumerated from the General Household Survey are statistics
which involve the use of the population figures in the compilation process. These statistics of the three-month periods of November 2011 – January 2012 to October – December 2012 have been revised to take into account the final end-2012 population estimates.
The classification of occupation adopted by the Census and Statistics Department
follows the International Standard Classification of Occupations (ISCO), which is used to classify the occupation of an employed person or the previous occupation of an unemployed person. After the implementation of the new ISCO, 2008 (ISCO-08), the General Household Survey has been enhanced to adopt the ISCO-08 in compiling labour force statistics by occupation, with statistics backcasted to the quarter of January to March 2011. Starting from the reference quarter of January to March 2011, all the labour force statistics by occupation, unless otherwise specified, are compiled based on the ISCO-08.
(2) For a person aged 15 or above to be classified as unemployed, he or she should:
(a) not have a job and not be performing any work for pay or profit during the reference period (i.e. seven days before enumeration); and (b) be available for work during the reference period; and (c) be seeking work during the 30 days before enumeration.
Notwithstanding the above, the following types of persons are also considered
unemployed: (a) persons without a job, having sought work but not available for work because of temporary sickness; (b) persons without a job, available for work but not having sought work because they will take up new jobs or start business at a subsequent date, or expect to return to their original jobs; and (c) discouraged workers not having sought work because they believe work is not available to them.
Even at full employment, some frictional unemployment is bound to exist as workers
move between jobs in order to obtain better terms of employment. The precise level of unemployment which can be described as purely frictional varies amongst economies, depending on the structure and characteristics of their labour markets.
The seasonally adjusted series is compiled using the X-12 ARIMA method, which is a
standard method applied in compiling seasonally adjusted statistical data series. (3) The main criteria for an employed person aged 15 or above to be classified as
underemployed are: involuntarily working less than 35 hours during the reference period (i.e. seven days before enumeration), and either available for additional work during the reference period or seeking additional work during the 30 days before enumeration.
Following these criteria, employed persons taking no-pay leave due to slack work
during the reference period are also classified as underemployed if they had worked less than 35 hours or were on leave for the entire reference period.
(4) Figures enumerated from household data. The employed population is defined here to
include those persons aged 15 or above who performed work for pay or profit or had a formal job attachment during the reference period (i.e. seven days before enumeration).

118
(5) The labour force, or the economically active population, is defined to include all persons aged 15 or above who either were engaged in productive work during the reference period (i.e. seven days before enumeration) or would otherwise have been engaged in productive work but were unemployed.
(6) The low paying sectors as identified by the Minimum Wage Commission include:
(i) retail; (ii) restaurants (including Chinese restaurants, non-Chinese restaurants, fast food cafes, and Hong Kong-style tea cafes. However, beverage serving places, event catering and other food service activities are not included.); (iii) estate management, security and cleaning services (including real estate maintenance management, security services, cleaning services and membership organisations); (iv) other low paying sectors, namely - elderly homes; - laundry and dry cleaning services; - hairdressing and other personal services; - local courier services; and - food processing and production.
(7) Manufacturing enterprises with fewer than 100 employees and non-manufacturing enterprises with fewer than 50 employees are regarded as small and medium-sized enterprises (SMEs) in Hong Kong. Yet, establishments with the same main business registration number (BRN) and engaging in activities of the same industry sector are grouped into one business unit for the purpose of calculating the number of SMEs. Thus, a business with a lot of small chain stores each employing a small number of employees will be considered as a single large enterprise, instead of separate SMEs.
(8) Different consumer price indices are used for compiling the real indices of labour
earnings and wages, taking into account their relevance to the respective occupation coverage. Specifically, the Composite CPI, being an indicator of overall consumer prices, is taken as the price deflator for earnings received by employees at all levels of the occupational hierarchy. The CPI(A), being an indicator of consumer prices for the relatively low expenditure group, is taken as the price deflator for wages in respect of employees engaged in occupations up to the supervisory level.
(9) In addition to wages, which include all regular and guaranteed payments like basic pay
and stipulated bonuses and allowances, earnings also cover overtime pay and other non-guaranteed or irregular bonuses and allowances, except severance pay and long service payment. Because of this difference, as well as the difference in sectoral and occupational coverage, the movements in average earnings, as measured by payroll per person engaged, do not necessarily match closely with those in wage rates.
(10) The average (mean) monthly employment earnings are easily affected by extreme
values in the survey sample, more so when reckoned for higher-end workers. They should therefore be interpreted with caution, in particular when they are compared over time.

119
CHAPTER 7 : PRICES Summary
Inflation was broadly steady in 2013, as domestic cost pressures, most notably rental costs, tended to stabilise in the latter part of the year, while imported inflation stayed subdued. The increase in underlying Composite Consumer Price Index (Composite CPI)(1), which nets out the effects of the Government’s one-off relief measures to more accurately reflect the underlying inflation trend, eased to 4.0% in 2013, from 4.7% in 2012.
Domestic price pressures, the major driver of inflation over the recent past, showed increasingly affirming signs of stabilisation towards the end of 2013. In addition to the milder increases in fresh-letting private residential rentals during most of 2013 after the Government’s latest round of demand-side management measures announced in February, the rises in other commercial rentals also softened as the year proceeded. The upward pressure on shop rentals receded progressively over the course of 2013, while that on office rentals also turned milder in the fourth quarter of the year. Meanwhile, labour costs maintained a steady increase on the back of a relatively tight labour market.
External price pressures posed less of a threat to local inflation in 2013, as inflation in many of our major import sources stayed tame amid the broadly stable international commodity prices and slower global economic growth. The notable yen depreciation also helped reduce the import prices of goods from Japan during the year.
In the near term, the upside risks to inflation should be limited, particularly if the current trends of moderated domestic rental increases and broadly steady international commodity prices continue. However, the potential threat of sharp swings in international commodity prices against the background of ample global liquidity remains. This, coupled with the effects of unanticipated weather conditions on food prices, still poses some uncertainty to Hong Kong’s inflation outlook.

120
Consumer prices 7.1 Underlying consumer price inflation held largely stable in 2013, hovering at around 4% except for a small rise in the third quarter partly because of the feed-through of higher residential rentals in 2012. Yet in the fourth quarter, the lagged effects of the milder rise in fresh-letting residential rentals since early 2013 began to set in, containing the increase in the private housing rental component of the CPI. The occasional spikes in food prices due to bad weather conditions also brought some mild fluctuations in the overall inflation rate, but food inflation was moderate for the year as a whole. Shop and office rental cost pressures also seemed to be abating in the latter part of 2013, particularly so for shop rentals alongside the somewhat moderated growth in retail sales. On the other hand, labour costs recorded further steady increases under the tight labour market conditions. Externally, the rise in import prices narrowed in 2013, thanks to the broadly steady international commodity prices and benign inflation in our major import sources(2). Taken together, Hong Kong’s underlying inflation eased further in 2013, representing a receding inflation trend for two years in a row.
Note : The year-on-year rates of change of the Consumer Price Indices from the fourth quarter of
2010 onwards are computed from the 2009/10-based series, and those before that from the 2004/05-based series. Splicing has been applied to the indices to maintain continuity.
Q12009
Q12010
Q12011
Q12012
Q12013
-2
0
2
4
6
8
10Composite CPI
Underlying Composite CPI
Year-on-year rate of change (%)
Diagram 7.1 : Underlying inflation held largely stable over the course of 2013

121
7.2 Underlying consumer price inflation, which nets out the effects of the Government’s one-off relief measures to more accurately reflect the underlying inflation trend, held largely stable at 3.8% and 3.9% respectively in the first two quarters of 2013, and then climbed modestly to 4.3% in the third quarter, before easing back to 4.0% in the last quarter. For 2013 as a whole, the underlying inflation averaged 4.0%, down from 5.3% and 4.7% respectively in 2011 and 2012. The headline consumer price inflation, as measured by the rate of change in the Composite CPI, averaged 4.3% in 2013, as compared to 5.3% and 4.1% respectively in 2011 and 2012. Headline inflation followed a similar trend as underlying inflation in 2013, but rose more visibly to 5.3% in the third quarter mainly because of a distinctly lower base of comparison resulted from the Government’s payment of public housing rentals in July 2012.
-3
0
3
6
9
12
15
18
21
Q12009
Q12010
Q12011
Q12012
Q12013
-2
0
2
4
6
8
10
12
14Underlying Composite CPI (LHS)Import prices (LHS)Nominal wage index (LHS)Fresh-letting residential rentals (8-quarter moving average) (RHS)
Year-on-year rate of change (%) Year-on-year rate of change (%)
Diagram 7.2 : Domestic price pressures showed signs of easing on a broad front over the course of 2013

122
Table 7.1 : Consumer Price Indices (year-on-year rate of change (%))
Composite CPI CPI(A) CPI(B) CPI(C)
Underlying(a) Headline
2012 Annual 4.7 4.1 3.6 4.3 4.1
H1 5.5 4.7 4.2 5.0 4.9
H2 3.9 3.5 3.1 3.7 3.4
Q1 5.9 5.2 4.6 5.5 5.4
Q2 5.1 4.2 3.7 4.5 4.4
Q3 4.0 3.1 1.9 3.7 3.4
Q4 3.8 3.8 4.2 3.6 3.3
2013 Annual 4.0 4.3 5.1 4.1 3.8
H1 3.8 3.9 4.4 3.6 3.5
H2 4.1 4.8 5.8 4.5 4.1
Q1 3.8 3.7 4.2 3.5 3.3
Q2 3.9 4.0 4.6 3.8 3.6
Q3 4.3 5.3 7.3 4.6 4.2
Q4 4.0 4.3 4.4 4.4 4.1
(seasonally adjusted quarter-to-quarter rate of change (%))
2012 Q1 1.2 1.2 1.4 1.2 1.0
Q2 0.9 0.8 0.8 0.9 0.8
Q3 0.5 -2.0 -5.9 -0.4 0.4
Q4 1.1 3.7 8.4 1.9 1.1
2013 Q1 1.1 1.1 1.2 1.1 1.0
Q2 1.1 1.3 1.3 1.2 1.2
Q3 0.8 -0.8 -3.4 0.3 0.8
Q4 1.0 2.7 5.5 1.7 1.0
Note : (a) Underlying consumer price inflation is calculated by netting out the effects of all
relevant one-off measures introduced since 2007, including the waiver and Government’s payment of public housing rentals, rates concession, suspension of Employees Retraining Levy, and subsidies for household electricity charges.
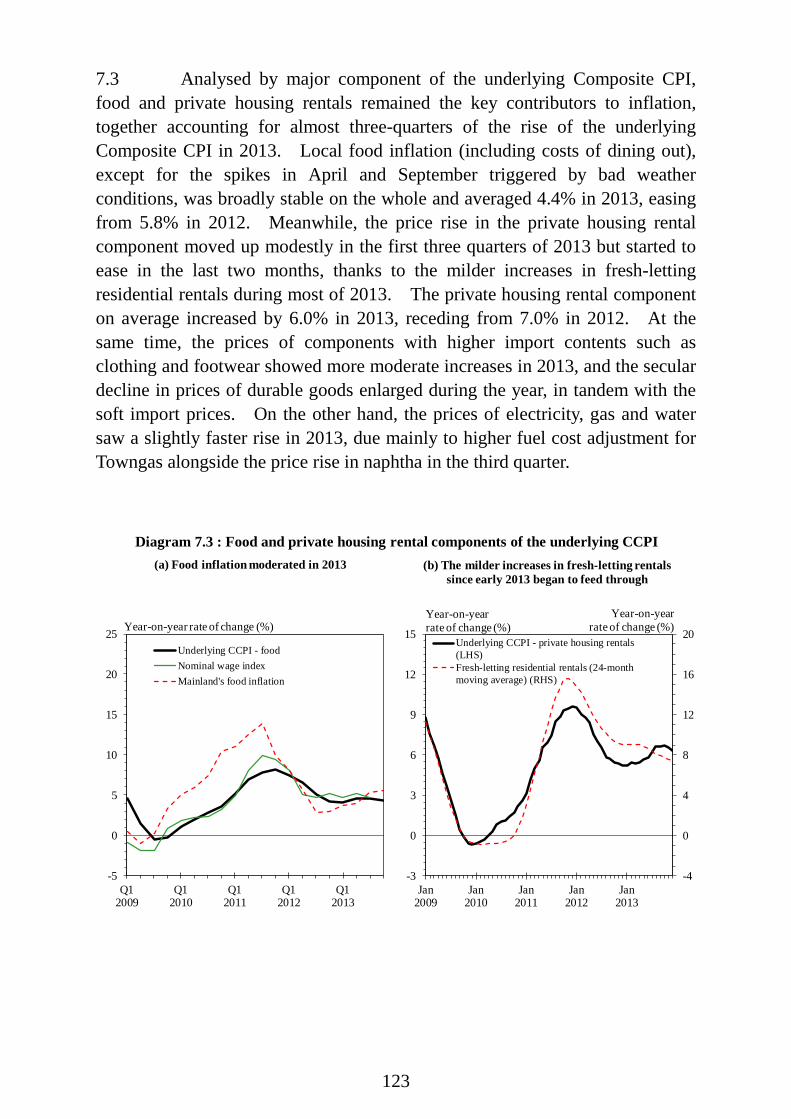
123
7.3 Analysed by major component of the underlying Composite CPI, food and private housing rentals remained the key contributors to inflation, together accounting for almost three-quarters of the rise of the underlying Composite CPI in 2013. Local food inflation (including costs of dining out), except for the spikes in April and September triggered by bad weather conditions, was broadly stable on the whole and averaged 4.4% in 2013, easing from 5.8% in 2012. Meanwhile, the price rise in the private housing rental component moved up modestly in the first three quarters of 2013 but started to ease in the last two months, thanks to the milder increases in fresh-letting residential rentals during most of 2013. The private housing rental component on average increased by 6.0% in 2013, receding from 7.0% in 2012. At the same time, the prices of components with higher import contents such as clothing and footwear showed more moderate increases in 2013, and the secular decline in prices of durable goods enlarged during the year, in tandem with the soft import prices. On the other hand, the prices of electricity, gas and water saw a slightly faster rise in 2013, due mainly to higher fuel cost adjustment for Towngas alongside the price rise in naphtha in the third quarter.
-4
0
4
8
12
16
20
Jan2009
Jan2010
Jan2011
Jan2012
Jan2013
-3
0
3
6
9
12
15Underlying CCPI - private housing rentals(LHS)Fresh-letting residential rentals (24-monthmoving average) (RHS)
Q12009
Q12010
Q12011
Q12012
Q12013
-5
0
5
10
15
20
25Underlying CCPI - foodNominal wage indexMainland's food inflation
Year-on-year rate of change (%)Year-on-year rate of change (%)
Year-on-year rate of change (%)
Diagram 7.3 : Food and private housing rental components of the underlying CCPI(a) Food inflation moderated in 2013 (b) The milder increases in fresh-letting rentals
since early 2013 began to feed through

124
Note : The year-on-year rates of change of the Composite CPI from the fourth quarter of 2010
onwards are computed from the 2009/10-based series, and those before that from the 2004/05-based series.
-6
-4
-2
0
2
4
6
8
10
Food Meals out Otherfoodstuffs
Housing Privatedwellings
Publicdwellings
Electricity,gas andwater
Alcoholicdrinks and
tabacco
Clothingand
footwear
Durablegoods
Misc. goods Transport Misc.services
2012 2013
Diagram 7.4 (a) : The price increases in many major components in the underlying Composite CPI remained moderate
Year-on-year rate of change (%)
Food Housing
3.1
1.2
-0.3 -0.1
0.8
1.5 2.0
2.4
3.7
5.0
6.1 6.4
5.9
5.1
4.0 3.8 3.8 3.9 4.3
4.0
-2
-1
0
1
2
3
4
5
6
7
8
Q12009
Q12010
Q12011
Q12012
Q12013
Diagram 7.4 (b) : Contribution to underlying consumer price inflationby major component
Underlying consumer price inflation
Percent
FoodPrivate housing rentalsTransportOthers

125
Table 7.2 : Composite Consumer Price Index by component (year-on-year rate of change (%))
2013 Expenditure component Weighting (%) 2012 2013 Q1 Q2 Q3 Q4 Food 27.45 5.8 4.4 4.1 4.5 4.6 4.4 Meals bought away 17.07 5.4 4.4 4.4 4.3 4.3 4.5 from home Other foodstuffs 10.38 6.5 4.4 3.6 4.8 4.9 4.1
(a)Housing 31.66 5.6 6.7 5.2 6.1 9.4 6.1
(6.4) (5.8) (5.5) (5.8) (6.3) (5.8) Private dwellings 27.14 6.8 6.3 5.0 6.1 7.0 7.0 (7.0) (6.0) (5.4) (5.7) (6.5) (6.5) Public dwellings 2.05 -7.1 16.0 9.7 8.9 777.6 -1.8
(3.2) (6.0) (9.5) (9.2) (5.9) (-0.1) Electricity, gas and water 3.10 -8.2 6.9 4.9 5.9 9.6 7.1 (3.6) (5.1) (3.6) (4.4) (7.2) (5.3) Alcoholic drinks and 0.59 3.0 1.5 1.6 1.9 1.4 1.1
tobacco Clothing and footwear 3.45 3.1 1.7 1.5 1.0 1.7 2.5 Durable goods 5.27 -1.4 -4.3 -3.5 -5.0 -4.7 -4.0 Miscellaneous goods 4.17 2.2 2.2 1.4 2.2 2.5 2.7 Transport 8.44 3.0 2.3 2.0 2.2 2.8 2.4 Miscellaneous services 15.87 2.8 3.7 3.5 3.1 3.9 4.3
(2.8) (3.2) (3.5) (3.1) (3.1) (3.1)
All items 100.00 4.1 4.3 3.7 4.0 5.3 4.3 (4.7) (4.0) (3.8) (3.9) (4.3) (4.0)
Notes : (a) The housing component covers rents, rates, Government rent, maintenance costs and
other housing charges. Its sub-components on private and public dwellings as presented here, however, cover rents, rates and Government rent only. Hence, the combined weighting of private and public dwellings is slightly less than the weighting of the entire housing component.
( ) Underlying rates of change after netting out the effect of Government’s one-off relief
measures.
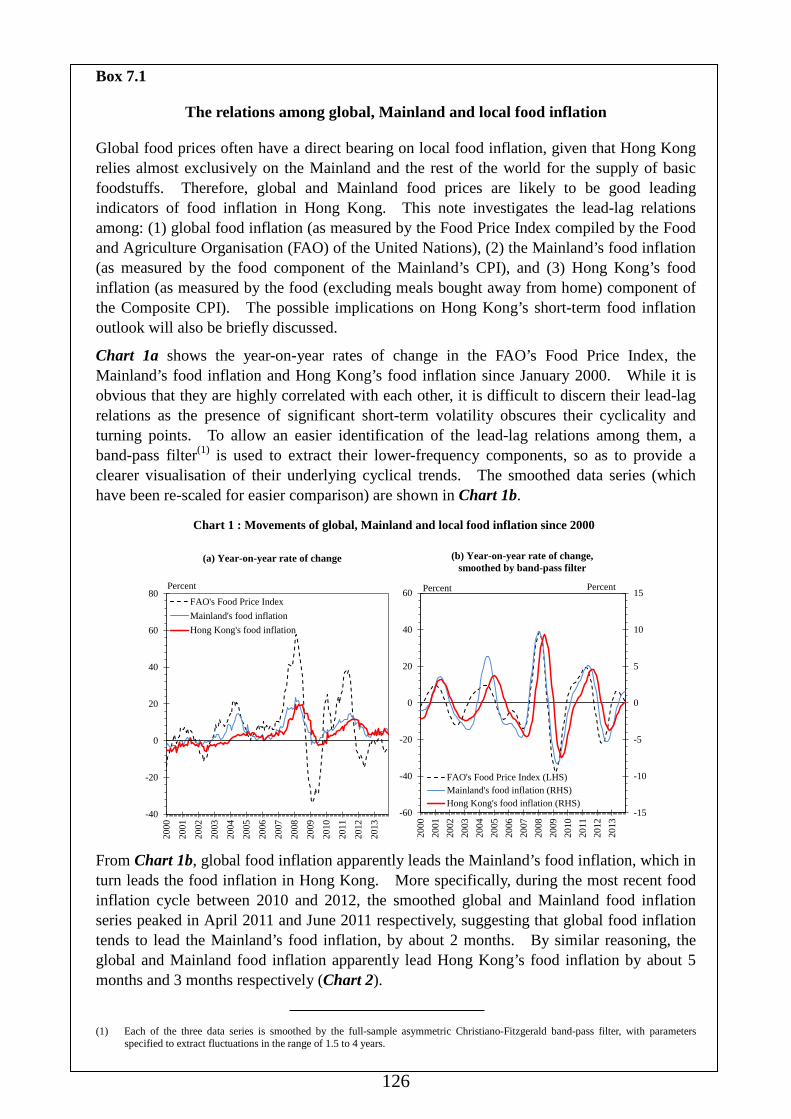
126
Box 7.1
The relations among global, Mainland and local food inflation
Global food prices often have a direct bearing on local food inflation, given that Hong Kong relies almost exclusively on the Mainland and the rest of the world for the supply of basic foodstuffs. Therefore, global and Mainland food prices are likely to be good leading indicators of food inflation in Hong Kong. This note investigates the lead-lag relations among: (1) global food inflation (as measured by the Food Price Index compiled by the Food and Agriculture Organisation (FAO) of the United Nations), (2) the Mainland’s food inflation (as measured by the food component of the Mainland’s CPI), and (3) Hong Kong’s food inflation (as measured by the food (excluding meals bought away from home) component of the Composite CPI). The possible implications on Hong Kong’s short-term food inflation outlook will also be briefly discussed.
Chart 1a shows the year-on-year rates of change in the FAO’s Food Price Index, the Mainland’s food inflation and Hong Kong’s food inflation since January 2000. While it is obvious that they are highly correlated with each other, it is difficult to discern their lead-lag relations as the presence of significant short-term volatility obscures their cyclicality and turning points. To allow an easier identification of the lead-lag relations among them, a band-pass filter(1) is used to extract their lower-frequency components, so as to provide a clearer visualisation of their underlying cyclical trends. The smoothed data series (which have been re-scaled for easier comparison) are shown in Chart 1b.
From Chart 1b, global food inflation apparently leads the Mainland’s food inflation, which in turn leads the food inflation in Hong Kong. More specifically, during the most recent food inflation cycle between 2010 and 2012, the smoothed global and Mainland food inflation series peaked in April 2011 and June 2011 respectively, suggesting that global food inflation tends to lead the Mainland’s food inflation, by about 2 months. By similar reasoning, the global and Mainland food inflation apparently lead Hong Kong’s food inflation by about 5 months and 3 months respectively (Chart 2).
(1) Each of the three data series is smoothed by the full-sample asymmetric Christiano-Fitzgerald band-pass filter, with parameters specified to extract fluctuations in the range of 1.5 to 4 years.
-40
-20
0
20
40
60
80
2000
2001
2002
2003
2004
2005
2006
2007
2008
2009
2010
2011
2012
2013
FAO's Food Price IndexMainland's food inflationHong Kong's food inflation
Percent
(a) Year-on-year rate of change
-15
-10
-5
0
5
10
15
-60
-40
-20
0
20
40
60
2000
2001
2002
2003
2004
2005
2006
2007
2008
2009
2010
2011
2012
2013
FAO's Food Price Index (LHS)Mainland's food inflation (RHS)Hong Kong's food inflation (RHS)
Percent
(b) Year-on-year rate of change, smoothed by band-pass filter
Percent
Chart 1 : Movements of global, Mainland and local food inflation since 2000

127
Box 7.1 (Cont’d)
To confirm the results, the cross-correlograms among the three data series are also examined (Chart 3). The diagrams, indicating that global and Mainland’s food inflation lead Hong Kong’s food inflation by about 5 months and 4 months respectively, are in broad agreement with the observations in the preceding paragraph.
Notes : FAO – Global food inflation; CH – Mainland’s food inflation; HK – Hong Kong’s food inflation. The shaded bars
correspond to the number of lag period (in months) such that the pairs of data series under consideration attain maximum cross correlation.
In view of the recent softening in global food prices (the FAO’s Food Price Index fell by 4.4% year-on-year in the second half of 2013) and the easing food inflation in the Mainland near the end of 2013, Hong Kong’s food inflation should remain contained in the near term, judging from the lead-lag relations in the recent periods. Yet, there might still be occasional food price hikes arising from higher volatility in global food and commodity prices and also from unforeseen adverse supply shocks in major food-exporting economies. The Government will continue to monitor the situation closely.
-15
-10
-5
0
5
10
15
20
25
30
-40
-20
0
20
40
60
80
2000 2001 2002 2003 2004 2005 2006 2007 2008 2009 2010 2011 2012 2013 2014
FAO's Food Price Index, lagged 5 months (LHS)
Mainland's food inflation, lagged 3 months (RHS)
Hong Kong's food inflation (RHS)
Year-on-year rate of change (%) Year-on-year rate of change (%)
Chart 2 : Global and Mainland food inflation as leading indicators of local food inflation
-1.0
-0.8
-0.6
-0.4
-0.2
0.0
0.2
0.4
0.6
0.8
1.0
0 1 2 3 4 5 6 7 8 9 10 11 12
Number of months (i)
Cross-correlation between CH and FAO (the latter lagged by i months)
-1.0
-0.8
-0.6
-0.4
-0.2
0.0
0.2
0.4
0.6
0.8
1.0
0 1 2 3 4 5 6 7 8 9 10 11 12
Number of months (i)
Cross-correlation between HK and FAO (the latter lagged by i months)
-1.0
-0.8
-0.6
-0.4
-0.2
0.0
0.2
0.4
0.6
0.8
1.0
0 1 2 3 4 5 6 7 8 9 10 11 12
Number of months (i)
Cross-correlation between HK and CH (the latter lagged by i months)
Chart 3 : Cross-correlograms of global, Mainland and local food inflation

128
Costs of factor inputs and import prices
7.4 Domestic cost pressures, while still visible on the whole, abated somewhat in the latter part of 2013, particularly so in certain segments. The increase in shop rentals, especially on a year-on-year comparison, narrowed considerably over the course of 2013 alongside the moderated growth in retail sales and tourist spending. The upward pressure on office rentals also softened somewhat in the latter half of the year, though the extent of deceleration was milder as compared to that of shop rentals. Specifically during the fourth quarter, shop and office rentals both actually fell, albeit only slightly, after posting nearly uninterrupted surges over the past few years. Meanwhile, labour costs increased rather steadily in the first three quarters of 2013, at a rate which was also modestly lower than in 2012. Nonetheless, wages for the lower-skilled workers still benefited from the extra boost from the upward adjustment of the Statutory Minimum Wage rate in May.
Q1
2009Q1
2010Q1
2011Q1
2012Q1
2013
-5
0
5
10
15
20Overall import prices
Import prices of foodstuffs
Import prices of capital goods
Import prices of consumer goods
Import prices of raw materials and semi-manufactures
Year-on-year rate of change (%)
Diagram 7.5 : Domestic cost pressures abated more visibly in the second half of 2013, while imported inflation remained tame on the whole
(a) Commercial rentals and labour cost (b) Import prices by selected end-use category
0
5
10
15
20
Jan2011
Jan2012
Jan2013
0
5
10Nominal payroll index (LHS)
Office rental index (RHS)
Shop rental index (RHS)
Year-on-year rate of change (%)

129
7.5 External price pressures were largely subdued in 2013. The year-on-year change in overall import prices remained soft during most of 2013 before rising back slightly in the fourth quarter. For 2013 as a whole, there was an average increase of merely 0.9% in 2013, down from 3.3% in 2012. Analysed by end-use category, import prices of foodstuffs rose only by 3.3% in 2013 despite the temporary jumps observed from time to time, down from 4.1% in 2012. Import prices of consumer goods and capital goods likewise moderated, reflecting the modest inflation in the major supply sources and possibly also the sharp depreciation of the yen. Import prices of fuels relapsed to a decline, in tandem with the lower international energy prices during the year. On the other hand, import prices of raw materials increased modestly by 2.0% in 2013, similar to the 1.4% gain in 2012, mirroring the broadly steady international commodity prices during the year.
Table 7.3 : Prices of imports by end-use category
(year-on-year rate of change (%))
Foodstuffs
Consumer
goods
Raw materials and semi-manufact
ures
Fuels
Capital goods
All
2012 Annual 4.1 4.1 1.4 2.6 4.7 3.3 H1 7.3 5.8 2.2 8.0 5.0 4.4 H2 1.3 2.6 0.5 -2.3 4.3 2.2 Q1 9.3 7.1 2.3 16.5 4.6 5.0 Q2 5.4 4.7 2.1 0.8 5.4 3.9 Q3 2.5 2.8 0.3 -2.6 4.6 2.3 Q4 0.4 2.3 0.7 -2.0 4.0 2.1 2013 Annual 3.3 1.8 2.0 -3.6 -0.6 0.9 H1 2.2 1.7 0.5 -5.4 0.6 0.6 H2 4.4 1.9 3.3 -1.8 -1.6 1.1 Q1 1.8 2.0 0.4 -5.5 2.0 1.1 Q2 2.7 1.4 0.7 -5.4 -0.8 0.2 Q3 3.3 0.6 2.8 -1.9 -1.4 0.6 Q4 5.2 3.2 3.8 -1.8 -1.9 1.5

130
-12
-8
-4
0
4
8
12
16
20
Q12009
Q12010
Q12011
Q12012
Q12013
-20
-16
-12
-8
-4
0
4
8
12
Import-weighted nominal effective exchange rate index of theHong Kong dollar (LHS, inverted)
Prices of imports of consumer goods (RHS)
Year-on-year rate of change (%)
Year-on-year rate of change (%)
-40
-20
0
20
40
60
80
Q12009
Q12010
Q12011
Q12012
Q12013
-20
-10
0
10
20
30
40Mainland's retail price index for food items (LHS)
Prices of imports of foodstuffs (LHS)
FAO food price index (RHS)
Year-on-yearrate of change (%)
Diagram 7.6 : Import prices by end-use category
Year-on-yearrate of change (%)
(a) Imported food inflation stayed tame during most of 2013
(b) Import prices of consumer goods rose only mildly
An increase in the nominal EERI indicates strengthening of the Hong Kong dollar. The y-axis of nominal EERI in this graph is inverted for easier comprehension.
Note :
-8
-4
0
4
8
12
16
Q12009
Q12010
Q12011
Q12012
Q12013
-40
-20
0
20
40
60
80CRB spot index (LHS)
Prices of imports of raw materials
Year-on-year rate of change (%)
and semi-manufactures (RHS)
Year-on-year rate of change (%)
Q12009
Q12010
Q12011
Q12012
Q12013
-60
-40
-20
0
20
40
60
80
100North Sea Brent
Prices of imports of fuels
Year-on-year rate of change (%)
(c) Import prices of raw materials increased modestly alongside steady global commodity prices
(d) Import prices of fuels fell moderately

131
Output prices
7.6 Output prices, as measured by the Producer Price Indices(3), showed some mixed movements across sectors in the first three quarters of 2013. Output prices for the manufacturing sector fell modestly over a year earlier after a marginal rise in 2012, mainly dragged by the sharp fall in prices in the industry grouping of metal, computer, electronic and optical products, machinery and equipment. Among the service sectors, output prices for accommodation services saw further growth, albeit at a more moderate pace alongside the slower expansion in inbound tourism. Output prices for land and air transport posted mild year-on-year increases in the first three quarters as a whole amid the subdued trade flows, while those for water transport relapsed to a modest decline partly because of a higher base of comparison. On the other hand, output prices for courier services increased only moderately. Separately, output prices for telecommunications services stayed on a downtrend amid the continued adoption of cost-saving technologies and intense competition.
Table 7.4 : Producer Price Indices for the manufacturing sector
and selected services sectors (year-on-year rate of change (%))
2012
2013
Industry group
Annual Q1 Q2 Q3 Q4 Q1-Q3 Q1 Q2 Q3
Manufacturing
0.1 3.6 -0.6 -1.4 -1.0 -2.3 0.6 -2.4 -5.2
Selected services sectors(a)
Accommodation services
7.9 12.1 8.2 8.3 3.5 2.3 2.5 2.8 1.7
Land transport
1.5 2.1 1.8 1.3 0.7 1.4 0.6 1.0 2.4
Water transport
6.4 -4.3 18.5 6.3 5.3 -2.7 7.3 -14.8 1.8
Air transport
0.6 -3.3 1.2 1.0 3.5 0.5 4.0 -2.4 0.1
Telecommunications
-2.4 -4.4 -1.6 -1.6 -1.9 -1.8 -1.6 -1.8 -1.7
Courier services 2.1 3.1 2.0 1.2 2.3 3.0 2.7 3.1 3.3 Note : (a) Producer Price Indices for other services sectors are not available, due to the
difficulties involved in defining and delineating the various types of services and hence in measuring their respective price changes. This is particularly so for such sectors as banking and insurance, where the producers often do not charge their customers explicitly.

132
GDP deflator 7.7 As a broad measure of the overall change in prices in the economy, the GDP deflator(4) rose by 1.2% in 2013, considerably down from a 3.7% increase in 2012. Within the GDP deflator, the terms of trade(5) resumed a marginal improvement of 0.4% in 2013, as import prices receded amid subdued global inflation and a much weaker yen. Taking out the external components, the domestic demand deflator rose by only 0.3% in 2013, also notably less than the 4.2% increase in 2012. Apart from the substantial decline in prices for machinery and equipment, again thanks to the yen depreciation, the moderated increases in flat prices and rentals were also relevant factors.
Q12009
Q12010
Q12011
Q12012
Q12013
-4
-2
0
2
4
6
GDP deflator
Domestic demand deflator
Year-on-year rate of change (%)
(a) GDP deflator rose only modestly in 2013
Q12009
Q12010
Q12011
Q12012
Q12013
-4
-2
0
2
4
6
GDP deflator
Terms of trade in goods and services
Year-on-year rate of change (%)
Diagram 7.7 : GDP deflator
(b) Terms of trade resumed growth
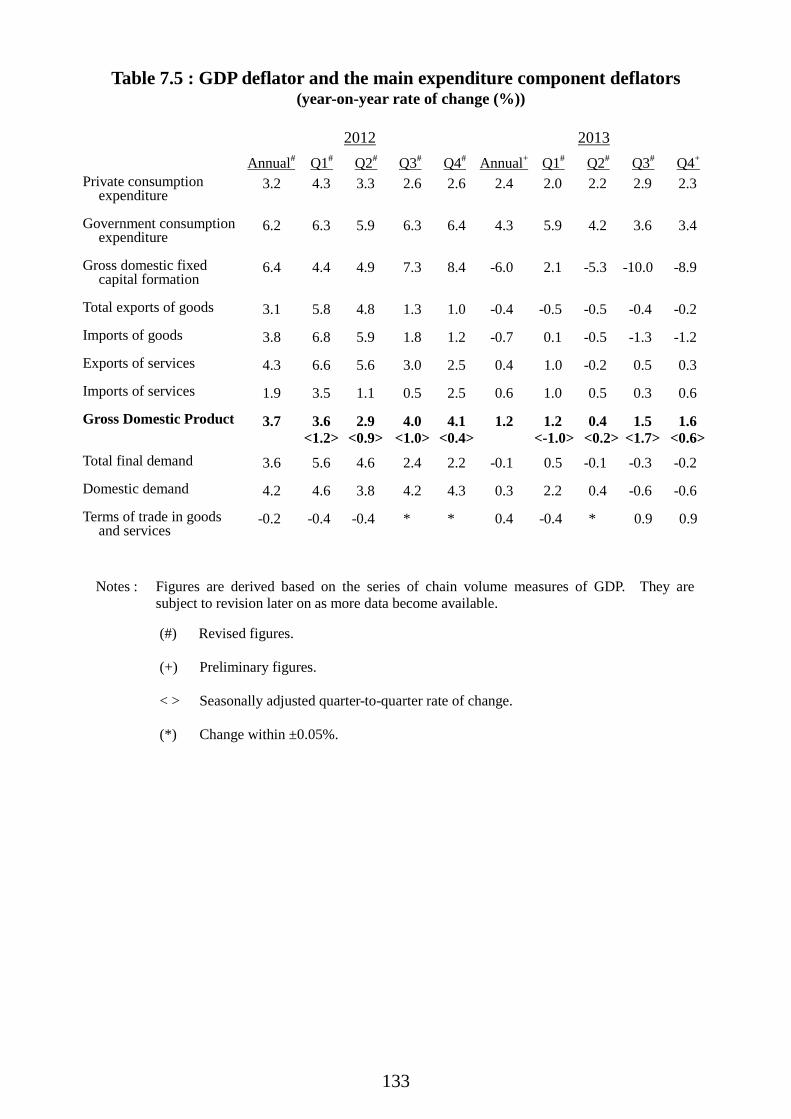
133
Table 7.5 : GDP deflator and the main expenditure component deflators (year-on-year rate of change (%))
2012 2013 Annual# Q1# Q2# Q3# Q4# Annual+ Q1# Q2# Q3# Q4+
Private consumption expenditure
3.2 4.3 3.3 2.6 2.6 2.4 2.0 2.2 2.9 2.3
Government consumption expenditure
6.2 6.3 5.9 6.3 6.4 4.3 5.9 4.2 3.6 3.4
Gross domestic fixed capital formation
6.4 4.4 4.9 7.3 8.4 -6.0 2.1 -5.3 -10.0 -8.9
Total exports of goods
3.1 5.8 4.8 1.3 1.0 -0.4 -0.5 -0.5 -0.4 -0.2
Imports of goods
3.8 6.8 5.9 1.8 1.2 -0.7 0.1 -0.5 -1.3 -1.2
Exports of services
4.3 6.6 5.6 3.0 2.5 0.4 1.0 -0.2 0.5 0.3
Imports of services
1.9 3.5 1.1 0.5 2.5 0.6 1.0 0.5 0.3 0.6
Gross Domestic Product
3.7 3.6 <1.2>
2.9 <0.9>
4.0 <1.0>
4.1 <0.4>
1.2 1.2 <-1.0>
0.4 <0.2>
1.5 <1.7>
1.6 <0.6>
Total final demand
3.6 5.6 4.6 2.4 2.2 -0.1 0.5 -0.1 -0.3 -0.2
Domestic demand
4.2 4.6 3.8 4.2 4.3 0.3 2.2 0.4 -0.6 -0.6
Terms of trade in goods and services
-0.2 -0.4 -0.4 * * 0.4 -0.4 * 0.9 0.9
Notes : Figures are derived based on the series of chain volume measures of GDP. They are subject to revision later on as more data become available.
(#) Revised figures. (+) Preliminary figures.
< > Seasonally adjusted quarter-to-quarter rate of change. (*) Change within ±0.05%.
134
Notes : (1) The Consumer Price Indices (A), (B) and (C) are compiled by reference to the average
expenditure patterns for different groups of households as obtained from the Household Expenditure Survey. Then, by aggregating the expenditure patterns of all the households covered by the above three indices, a Composite CPI is compiled.
The expenditure ranges of the households covered in the 2009/10-based CPIs are shown
below:
Approximate proportion of households covered
Average monthly expenditure range during Oct 2009 to Sep 2010
(%) ($) CPI(A) 50 4,500 to 18,499 CPI(B) 30 18,500 to 32,499 CPI(C) 10 32,500 to 65,999
The weightings of the various components in the 2009/10-based CPIs are as follows:
Expenditure component
Composite CPI
CPI(A)
CPI(B)
CPI(C)
(%) (%) (%) (%) Food 27.45 33.68 27.16 20.87 Meals bought away from
home 17.07 19.23 17.90 13.55
Other foodstuffs 10.38 14.45 9.26 7.32 Housing 31.66 32.19 31.43 31.36 Private dwellings 27.14 24.78 28.13 28.45 Public dwellings 2.05 5.49 0.72 -- Maintenance costs and
other housing charges 2.47 1.92 2.58 2.91
Electricity, gas and water 3.10 4.36 2.84 2.03 Alcoholic drinks and
tobacco 0.59 0.91 0.56 0.29
Clothing and footwear 3.45 2.60 3.45 4.39 Durable goods 5.27 3.73 5.73 6.39 Miscellaneous goods 4.17 3.87 4.17 4.49 Transport 8.44 7.22 8.35 9.93 Miscellaneous services
15.87 11.44 16.31 20.25
All items 100.00 100.00 100.00 100.00

135
(2) The table below presents the year-on-year rates (%) of consumer price inflation in selected economies.
2012 2013
Annual Q1 Q2 Q3 Q4 Annual Q1 Q2 Q3 Q4
Selected developed economies
US 2.1 2.8 1.9 1.7 1.9 1.5 1.7 1.4 1.6 1.2 Canada 1.5 2.3 1.6 1.2 0.9 0.9 0.9 0.8 1.1 0.9 EU 2.6 2.9 2.6 2.7 2.5 1.5 2.0 1.6 1.5 1.0 Japan * 0.3 0.2 -0.4 -0.2 0.4 -0.6 -0.3 0.9 1.4
Major emerging economies
Mainland China 2.6 3.8 2.9 1.9 2.1 2.6 2.4 2.4 2.8 2.9 Russia 5.1 3.9 3.8 6.0 6.5 6.8 7.1 7.2 6.4 6.4 India 9.7 8.6 10.2 9.9 10.1 10.1 10.7 9.5 9.7 10.4 Brazil 5.4 5.8 5.0 5.2 5.6 6.2 6.4 6.6 6.1 5.8
Selected Asian economies
Hong Kong 4.1 5.2 4.2 3.1 3.8 4.3 3.7 4.0 5.3 4.3 Singapore 4.6 4.9 5.3 4.2 4.0 2.4 4.0 1.6 1.8 2.0 Taiwan 1.9 1.3 1.6 2.9 1.8 0.8 1.8 0.8 * 0.6 Korea 2.2 3.0 2.4 1.6 1.7 1.3 1.6 1.2 1.4 1.1 Malaysia 1.7 2.3 1.7 1.4 1.3 2.1 1.5 1.8 2.2 3.0 Thailand 3.0 3.4 2.5 2.9 3.2 2.2 3.1 2.3 1.7 1.7 Indonesia 4.3 3.7 4.5 4.5 4.4 7.0 5.3 5.6 8.6 8.4 Philippines 3.2 3.1 3.0 3.6 3.0 2.9 3.2 2.6 2.4 3.5 Vietnam 9.1 15.9 8.6 5.6 7.0 6.6 6.9 6.6 7.0 5.9 Macao 6.1 6.3 6.6 6.0 5.6 5.5 5.4 5.1 5.6 5.9
Note : (*) Change within ±0.05%. (3) The Producer Price Index is designed to reflect changes in the prices of goods and
services received by local producers. Producer prices refer to the transacted prices, net of any discounts or rebates allowed to the buyers. Transportation and other incidental charges are not included.
(4) The implicit price deflators of GDP and its main expenditure components are derived by
dividing GDP at current prices by the corresponding chained-dollar figures. The rate of change in the GDP deflator may differ substantially from that in the Composite CPI over the same time span. The Composite CPI covers consumer price inflation in particular. Yet the GDP deflator is a much broader measure of inflation for the entire economy, and takes into account all the price changes related to consumption, investment, exports and imports. Also, the rate of change in the GDP deflator may differ appreciably from that in the total final demand deflator, depending on the movement in the prices of final demand and imports. Likewise, the rate of change in the GDP deflator may differ appreciably from that in the domestic demand deflator, depending on the movement in the prices of imports and exports.
(5) The terms of trade is defined as the ratio of the prices of total exports to the prices of
total imports.

136
Calendar of Events of Significance for the Hong Kong Economy in 2013
1 Jan The liberalisation measures under Supplement IX to the Mainland and Hong Kong
Closer Economic Partnership Arrangement (CEPA) came into effect. Hong Kong service suppliers enjoyed preferential access to the Mainland market in 48 service areas, including 37 new liberalisation measures in 22 service sectors. The number of products with rules of origin agreed under CEPA was increased to 1 757. A new statutory disclosure regime, which requires all Hong Kong-listed companies to disclose price sensitive inside information to the public in a timely manner, came into effect. The Banking (Capital) Rules 2012 came into force, introducing the first phase of the capital adequacy requirements under the Basel III capital framework for the banking sector.
4 Jan As an interim scheme before the completion of the new Home Ownership Scheme (HOS) flats, the Hong Kong Housing Authority (HA) launched the Scheme of Extending the HOS Secondary Market to White Form (WF) Buyers, with an annual quota of 5 000, for eligible WF applicants to purchase flats with premium not yet paid on the HA’s HOS Secondary Market or the Hong Kong Housing Society (HKHS)’s Flat-for-Sale Scheme Secondary Market.
5 Jan The People’s Bank of China Shenzhen Branch released implementation details on cross-border Renminbi (RMB) lending in Qianhai, specifying the uses, application procedures and regulation of cross-border RMB lending in Qianhai. The launch of the RMB cross-border lending has further facilitated the growth of RMB lending business in Hong Kong.
7 Jan The Government announced the tendering of 10-year Government Bonds, totalling $1.5 billion, under the Institutional Bond Issuance Programme of the Government Bond Programme.
8 Jan The draft West Kowloon Cultural District Development Plan was approved by the Chief Executive (CE) in Council under the Town Planning Ordinance.
10 Jan The Heritage Foundation and the Wall Street Journal released the 2013 Index of Economic Freedom. Hong Kong was rated the freest economy in the world for the 19th consecutive year.
11 Jan The Chief Secretary for Administration (CS) and the Mayor of Shenzhen Municipal Government co-chaired the Hong Kong/Shenzhen Co-operation Meeting in Shenzhen. At the meeting, the two sides comprehensively reviewed the co-operation initiatives in 2012, and conducted in-depth discussion on a number of key areas. The Finance Committee of the Legislative Council (LegCo) approved the creation of a new block vote to support the Universal Accessibility Programme to retrofit lifts to existing public walkways.
14 Jan The Hong Kong Special Administrative Region (HKSAR) Government and the Government of Italian Republic signed an Agreement for the Avoidance of Double

137
Taxation and the Prevention of Fiscal Evasion with respect to Taxes on Income in Hong Kong.
17 Jan CE announced the establishment of the Economic Development Commission (EDC) to provide visionary direction and advice to the Government on the overall strategy and policy to broaden Hong Kong’s economic base and to enhance Hong Kong’s economic growth and development. At the same time, following CE’s announcement on the establishment of the Financial Services Development Council (FSDC) in his first Policy Address, he appointed Mrs Laura Cha as Chairman of the Council.
18 Jan The International Monetary Fund (IMF) released its Staff Report on Hong Kong, reiterating that the Linked Exchange Rate system remains the best arrangement for Hong Kong and commending the Government's pre-emptive efforts to safeguard financial stability.
21 Jan The Hong Kong Monetary Authority (HKMA) conducted in Dubai its seventh in a series of overseas roadshows to showcase Hong Kong as the offshore RMB business centre, attracting 150 participants from corporates and financial institutions from the United Arab Emirates and the region.
25 Jan The Government announced the tendering of 5-year Government Bonds, totalling $2 billion, under the Institutional Bond Issuance Programme of the Government Bond Programme. The overseas Automatic Teller Machine (ATM) cash withdrawal capability for all ATM cards (including debit cards and credit cards) issued by authorized institutions (AIs) in Hong Kong will be pre-set as “deactivated” with effect from 1 March 2013 to enhance the security of ATM services. The Office of the Government Chief Information Officer (OGCIO) launched the InfoCloud portal that puts together a shared pool of information and resources including sample use cases, guidelines and best practices to promote the wider use of cloud computing services and technologies.
28 Jan The Secretary for Constitutional and Mainland Affairs (SCMA) and the Vice Mayor of Guangzhou co-chaired the second meeting of the Hong Kong/Guangzhou Co-operation Working Group in Hong Kong. At the meeting, the two sides reviewed the co-operation achievements made in the previous year and exchanged views on the development of Nansha and other issues of mutual concern.
29 Jan The Securities and Futures Commission (SFC) authorised the first RMB-denominated money market fund which is also available for investment by mandatory provident fund (MFP) schemes.
1 Feb A total of 12 pieces of subsidiary legislation made under the new Companies Ordinance on administrative, technical and procedural matters were published in the Gazette progressively in three batches between February and July 2013.
6 Feb Based on the Treasury Markets Association’s (TMA) report and the Hong Kong Association of Banks’ (HKAB) submission, the HKMA announced a package of measures to enhance the transparency and robustness of the fixing mechanism for the Hong Kong Dollar (HKD) Interest Settlement Rate (the Hong Kong Interbank Offered Rate or HIBOR).

138
CE visited Guangzhou and Shenzhen and called on leaders of the Guangdong Provincial Government and the Shenzhen Municipal Government.
7 Feb With a view to facilitating the development of Hong Kong into a regional innovation and technology hub, the Government announced the way forward of the local patent system, including the introduction of an “original grant” patent system while retaining the current re-registration system for grant of standard patents.
8 Feb The Trust Law (Amendment) Bill 2013, which sought to strengthen the competitiveness of Hong Kong’s trust industry vis-à-vis other major common law jurisdictions and enhance our status as an international asset management centre, was published in the Gazette. It was subsequently passed by the LegCo on 17 July 2013 to become the Trust Law (Amendment) Ordinance 2013 and came into effect on 1 December 2013.
21 Feb CS led the HKSAR Government delegation to attend in Beijing the second meeting of the Inter-ministries Joint Conference on the Development of Qianhai Area in Shenzhen. At the meeting, representatives from the governments of HKSAR, Guangdong and Shenzhen as well as representatives of relevant ministries of the Central Government put forward suggestions on the formulation and implementation of policies for Qianhai. The HKSAR Government also reflected views of the Hong Kong business sector towards Qianhai development.
21 Feb – 20 May
The Government conducted the Stage 2 Public Engagement exercise on “Our Future Railway” to explore seven local enhancement schemes for the existing railway lines. These schemes included the North Island Line, Siu Sai Wan Line, South Island Line (West), Tuen Mun South Extension, Tung Chung West Extension, addition of the Hung Shui Kiu Station and addition of the Kwu Tung Station.
22 Feb To address the overheated property market, the Financial Secretary (FS) announced that the Government would amend the Stamp Duty Ordinance to adjust the rates of ad valorem stamp duty (AVD) on transactions of residential and non-residential properties and to advance the charging of AVD on non-residential property transactions from the conveyance on sale to the agreement for sale. In a new round of prudential supervisory measures, the HKMA issued guidelines requiring banks to assume a larger increase (300 basis points) in mortgage rate in the stress tests of mortgage applicants’ repayment ability. The maximum loan-to-value (LTV) ratios of mortgage loans for commercial and industrial properties will also be lowered by 10 percentage points, while that for standalone car park spaces will be set at 40%, with a maximum tenor of 15 years. The HKMA also introduced a risk weight floor of 15% for all residential mortgages granted by banks using the internal ratings-based approach. The Hong Kong Mortgage Corporation (HKMC) announced revisions to the eligibility criteria for the Mortgage Insurance Programme (MIP), with the maximum MIP cover of 90% LTV only for mortgage loans of properties with value at or below $4 million (previously $6 million).
25 Feb The Government announced the tendering of 2-year Government Bonds, totalling $3.5 billion, through the re-opening of an existing 3-year Government Bond issue under the Institutional Bond Issuance Programme of the Government Bond Programme.
26 Feb Hong Kong and Thailand signed the Cooperation Arrangement on Strengthening Trade and Economic Relations. The Arrangement helps encourage and promote bilateral

139
economic cooperation between Hong Kong and Thailand in various areas.
27 Feb FS delivered the Budget for the financial year 2013-14 to the LegCo, proposing measures to promote economic growth, optimise human resources and care for people's livelihood. In promoting the economy, FS put forward measures to strengthen pillar industries with a view to maintaining Hong Kong’s competitiveness. At the same time, the Budget supported the development of emerging industries to broaden and solidify our economic base, and supported local enterprises by promoting economic integration with the Mainland and tapping new markets. In the face of persistently weak export markets and a challenging external environment, the Budget proposed measures to assist small and medium enterprises in raising capital and tapping new markets. To optimise Hong Kong’s overall manpower structure and quality, FS proposed to increase investment in education. Apart from enhancing the regular education services, the Budget introduced measures to enhance vocational training, in particular for those industries experiencing labour shortage, by supporting them to develop structured training programmes in order to attract new blood into the sectors. In caring for people's livelihood, substantial resources were allocated to social welfare, poverty alleviation, healthcare services and environmental protection. In addition, FS put forward a package of relief measures, including electricity subsidy, extra allowance to recipients of the Comprehensive Social Security Assistance and other social security schemes, paying rent for public housing tenants, rates waiver, tax reduction and adjustment to tax allowances and deductions, to assist the grassroots and the middle class families. FS also proposed a reduction in profits tax and waiving of business registration fees to ease the operating pressure on enterprises. On tax related measures, FS proposed to (a) reduce 2012-13 profits tax, salaries tax and tax under personal assessment by 75%,
subject to a ceiling of $10,000 per case; (b) increase the basic and additional one-off child allowances; (c) increase the deduction ceiling for expenses of self-education; (d) waive business registration fees for 2013-14; and (e) extend the profits tax exemption for offshore funds and reduce the profits tax on the
offshore insurance of captive insurance companies. The 2012 Economic Background and 2013 Prospects were published along with the 2013-14 Budget. Hong Kong’s Gross Domestic Product (GDP) was forecast to grow moderately by 1.5-3.5% in real terms in 2013, supported by relatively firm domestic demand amid stable employment situation and sustained growth in investment. The headline and underlying Composite Consumer Price Indices (CPI) were forecast to increase by 4.5% and 4.2% respectively in 2013.
28 Feb The Government announced the 2013-14 Land Sale Programme (LSP) and abolished the Application Mechanism to resume fully the initiative to sell government land. The 2013-14 LSP offered a total of 46 residential sites with a capacity to produce about 13 600 flats, and contained nine commercial/business sites and one hotel site.
28 Feb – 2 Mar
CS led a HKSAR Government delegation to Sichuan to meet with senior officials of the Sichuan Provincial Government and to witness the signing of the two Sichuan-Hong Kong co-operation agreements regarding continued collaboration in the Wolong Nature Reserve and in sports to lay a foundation for the two governments to further foster
140
multifaceted co-operation.
1 Mar The HKMC extended the application period of the special 80% loan guarantee product offered at a concessionary level of guarantee fee under its Small and Medium Enterprise (SME) Financing Guarantee Scheme for one year until 28 February 2014, as one of the measures announced in the 2013-14 Budget to provide enhanced support for our enterprises.
6 Mar The China Securities Regulatory Commission announced the revised administrative rules and implementation details on RMB Qualified Foreign Institutional Investors (RQFII) pilot scheme, under which the types of institutions eligible for applying for RQFII were enlarged and the investment restriction of RQFII funds was also relaxed. This has been conducive to the launch of more innovative and diversified RMB investment products in Hong Kong and has enhanced the cross-border use and circulation of RMB funds between the Mainland and Hong Kong.
12 Mar Led by the Secretary for Commerce and Economic Development (SCED), the Working Group on Intellectual Property (IP) Trading was tasked to provide strategic advice on promoting Hong Kong as an IP trading hub and devise supporting measures.
14 Mar The Hong Kong International Airport (HKIA) received the Air Cargo Award of Excellence in the category of “Airports Asia – 1 million or more tonnes” for the eighth consecutive time since 2006.
15 Mar CS and the Vice-Governor of Guangdong Province co-chaired the 18th Working Meeting of the Hong Kong/Guangdong Co-operation Joint Conference in Guangzhou. At the meeting, both sides reviewed the progress of implementation of the 2012 Work Plan of the Framework Agreement on Hong Kong/Guangdong Co-operation (Work Plan) and finalised the 2013 Work Plan. The 84 co-operation items in the 2013 Work Plan basically cover all areas of Hong Kong/Guangdong co-operation.
18 Mar – 13 Apr
The ninth Entertainment Expo Hong Kong, Asia’s leading entertainment industry gathering, featured nine events covering a global mix of film, TV, music and digital entertainment.
19 Mar Four existing mobile network operators successfully bid for a total of 50 MHz of radio spectrum in the 2.5/2.6 GHz band at a total sum of spectrum utilisation fees of $1.54 billion, for the further development of 4G mobile telecommunications services in Hong Kong. The Government announced the tender invitation for two residential sites in the Kai Tak Development Area selected for piloting the “Hong Kong Property for Hong Kong People” measure, whereby only Hong Kong Permanent Residents may purchase the flats thereon within 30 years. The two sites were sold on 5 June 2013. CE visited Tianjin and called on leaders of the Tianjin Municipal Government.
21 Mar The TMA held the Treasury Markets Forum in Shenzhen to discuss the latest development of cross-border RMB business and the financial policies concerning Qianhai, attended by participants from regulatory bodies, banks and financial institutions from both Shenzhen and Hong Kong. The Secretary for Development (SDEV) kicked off the 3-month Stage 2 public engagement on Enhancing Land Supply Strategy through reclamations outside Victoria

141
Harbour and rock cavern development to provide land for the sustainable development of Hong Kong.
22 Mar HKIA achieved the "Optimisation" level in the Airport Carbon Accreditation programme organised by Airports Council International. HKIA was the first and only airport in the Asia-Pacific attaining this standard.
27 Mar The HKMA announced the findings of the consultancy study on the development of Near Field Communication (NFC) mobile payment infrastructure in Hong Kong. The study reaffirmed Hong Kong’s promising market conditions for the rapid take off of NFC mobile payment services and produced a draft set of standards and guidelines for the industry.
28 Mar The Environment Bureau published “A Clean Air Plan for Hong Kong” to outline the relevant policies and plans to improve air quality. The HKMA and the SFC jointly announced their commitment to comply with the new international regulatory standards on financial market infrastructures (FMIs) contained in a report “Principles for Financial Market Infrastructures” (PFMIs), issued jointly by the Committee on Payment and Settlement Systems of the Bank for International Settlements (BIS) and the International Organization of Securities Commissions (IOSCO) in April 2012. Both the HKMA and the SFC will implement the PFMIs within their respective regulatory frameworks through their regulatory guidelines. The HA launched the sale of the remaining 832 surplus HOS flats.
6 – 7 Apr CE attended the Boao Forum for Asia Annual Conference 2013 in Hainan.
8 Apr The Hong Kong ICT Awards 2013 Awards Presentation Ceremony was held to give recognition and encouragement to outstanding information and communications technology (ICT) products and solutions developed by Hong Kong ICT innovators.
8 – 21 Apr Hong Kong's first-ever International IT Fest (IT Fest) was held, featuring 25 international and local events in various ICT domains and showcasing Hong Kong's strengths and achievements as a leading ICT hub in the Asia Pacific region.
9 Apr The Government set up the Standard Working Hours Committee which comprises members drawn from the labour and the business sectors, academia, community and Government. The Committee is tasked with the mission of following up on the Government’s completed policy study on standard working hours, promoting an informed, in-depth and objective discussion of the community on the subject of working hours, with a view to jointly exploring and identifying options that suit the needs of Hong Kong.
12 Apr The inaugural Australia-Hong Kong RMB Trade and Investment Dialogue was held in Sydney. The annual Dialogue, attended by business leaders and officials from central banks and finance ministries in both Australia and Hong Kong, will foster closer collaboration between Australia and Hong Kong on RMB trade settlement, the development of RMB-denominated products and closer RMB banking and financial links.
16 Apr OGCIO and the Economic and Information Commission of Guangdong Province co-organised the Hong Kong-Guangdong Cloud Industry Collaboration Forum for promoting awareness and adoption of cloud services in both places.

142
The Government launched a public consultation on legislative proposals to improve Hong Kong’s corporate insolvency law. The Government and MTR Corporation Limited (MTRCL) completed the five-yearly review on the Fare Adjustment Mechanism (FAM) of MTRCL. The new FAM package has incorporated profitability of MTRCL and public affordability as additional factors for consideration when MTR fares are adjusted. It has also reduced the fare increase rate by 0.5 percentage point through adoption of a new value for the productivity factor embedded in the formula of the new FAM. Accordingly, the fare increase for 2013 has been reduced from 3.2% to 2.7%. Also worthy of note is that MTRCL would be fined for serious service disruptions under a newly introduced service performance arrangement. Proceeds will benefit passengers through fare concession.
22 Apr The HKSAR Government and the Government of Guernsey signed an Agreement for the Avoidance of Double Taxation and the Prevention of Fiscal Evasion with respect to Taxes on Income.
25 Apr The HKMA removed the RMB Net Open Position limit and the minimum requirement on the RMB liquidity ratio. Conditions regarding the application of RMB liquefiable assets for the calculation of the statutory liquidity ratio were also uplifted. Hong Kong and the Association of Southeast Asian Nations (ASEAN) agreed to pursue a bilateral free trade agreement (FTA). The FTA will enhance trade and investment flows between ASEAN and Hong Kong, generate new opportunities for our businesses, and boost economic growth in the longer term.
25 – 26 Apr CE visited ministries of the Central Government, including the Ministry of Commerce and the National Development and Reform Commission.
26 Apr The Government announced the tendering of 3-year Government Bonds, totalling $3 billion, under the Institutional Bond Issuance Programme of the Government Bond Programme.
29 Apr The Residential Properties (First-hand Sales) Ordinance came into full effect.
1 May The Statutory Minimum Wage rate was increased by 7.1% from $28 to $30 per hour. The Chief Executive Officer of the SFC assumed chairmanship for the Asia-Pacific Regional Committee of IOSCO.
3 May To enhance the robustness of the HIBOR fixing mechanism, the HKMA issued a statutory guideline on “Code of Conduct for Benchmark Submitters” in the Gazette, setting out the supervisory requirements on the systems of control to be maintained by benchmark submitters and providing comprehensive guidance on the rate corroboration process.
10 May The Government released the preliminary GDP figures for the first quarter of 2013. The Hong Kong economy grew moderately by 2.8% year-on-year in real terms, amid an unsteady external trading environment and a relatively resilient domestic sector. In the May update of the economic forecast for 2013, the forecast growth rate in real terms of GDP was maintained at 1.5-3.5%. The forecast rates of increase in the headline and underlying Composite CPI were also maintained at 4.5% and 4.2%

143
respectively.
13 May The HKSAR Government and the Government of the State of Qatar signed an Agreement for the Avoidance of Double Taxation and the Prevention of Fiscal Evasion with respect to Taxes on Income in Hong Kong.
14 May The importation of foreign domestic helpers was de-designated as a labour importation scheme under the Employees Retraining Ordinance (Cap. 423) by the CE in Council, which gave effect to the abolition of Employees Retraining Levy imposed on employers of foreign domestic helpers. The new themed area - “Mystic Point” of the Hong Kong Disneyland was opened, which marked the completion of the park’s latest phase of expansion. The expansion has enlarged the existing theme park by about 23% and has added more than 30 new attractions, entertainment and interactive experiences, bringing the total number of attractions to over 100.
17 May Cushman & Wakefield and hurleypalmerflatt published the Data Centre Risk Index 2013 Report. Hong Kong continued to be ranked as the lowest risk location for data centres in Asia Pacific for three consecutive years, and ranked the sixth lowest in the world.
20 May The Government announced “Hong Kong: Blueprint for Sustainable Use of Resources 2013-2022”, which maps out targets, policies and action plans for waste management for the coming 10 years. The overall target is to reduce the municipal solid waste disposal rate by 40% on a per capita basis by 2022.
22 May In light of the growing acceptance of innovative retail payment products and services, the Financial Services and the Treasury Bureau (FSTB) and HKMA jointly issued a public consultation paper to propose enhancing the regulatory regime for stored value facilities (SVF) and retail payment systems (RPS) in Hong Kong.
24 May A resolution under the Loans Ordinance passed by the LegCo was gazetted to raise the borrowing ceiling of the Government Bond Programme from $100 billion to $200 billion to further promote the sustainable development of the bond market in Hong Kong.
31 May Data centre solution provider NTT opened its Financial Data Centre in Tseung Kwan O Industrial Estate. The design of the Financial Data Centre has achieved the TIA-942 Tier IV requirements, which is the highest technical standard for data centres.
4 – 5 Jun CE attended the opening ceremony of the second Annual Urban Land Institute Asia Pacific Summit in Shanghai. During his stay in Shanghai, CE also called on leaders of the Shanghai Municipal Government.
6 – 7 Jun The Secretary for the Environment led a delegation to Taipei, to participate in the Hong Kong-Taipei inter-city forum co-organised by the Hong Kong Economic, Trade and Cultural Office and the Taipei City Government. The delegation visited the waste management facilities in Taipei and met with the Taiwan Environmental Protection Administration to share experiences of implementing environmental policies.
7 Jun The Finance Committee of the LegCo approved the funding application for the construction works of the Tuen Mun – Chek Lap Kok Link project.
9 – 13 Jun CE attended the trade promotion events organised by the Hong Kong Trade Development Council (HKTDC) in New York. During his stay in New York, CE met with political

144
and business leaders and exchanged views on a wide range of issues.
10 Jun The Government raised the grant ceiling of the SME Export Marketing Fund, with a view to encouraging SMEs to explore new markets and business opportunities through participation in different export promotion activities.
11 Jun The HKMA and the HKTDC jointly organised a seminar on “Hong Kong: The Premier Global Hub for Offshore RMB Business” in New York, attracting 230 representatives from corporates and financial institutions as well as other organisations in the US.
12 Jun The Kai Tak Cruise Terminal commenced operation and received its first cruise liner "Mariner of the Seas".
17 Jun The European Commission published its 15th report on Hong Kong, which continued to affirm the development of relations and co-operation between the European Union (EU) and Hong Kong in areas including trade, investment, and dialogue on issues of mutual interest, as well as recognise Hong Kong’s strategic importance as a trading and investment partner for the EU.
18 Jun The first offshore RMB Bond Index Exchange-traded Fund (ETF) was launched and listed on the Stock Exchange of Hong Kong (SEHK).
19 – 21 Jun The Commerce and Economic Development Bureau (CEDB) led a Hong Kong ICT delegation to participate in the “China International Software and Information Service Fair” held in Dalian. An IT forum was organised and a Hong Kong Pavilion set up to promote Hong Kong's innovative ICT products and services and to explore business opportunities.
20 Jun The Government announced the receipt of a total of 520 823 valid applications for a total of $39.6 billion in principal amount in launching a further issuance of iBond under the Retail Bond Issuance Programme of the Government Bond Programme. The total number of applications has achieved a new record in the local retail bond market. A total of $10 billion of iBond, with a tenor of three years, was issued on 24 June and listed on SEHK on 25 June.
24 Jun The TMA launched the CNH Hong Kong Interbank Offered Rate fixing (CNH HIBOR fixing), providing a formal benchmark for market participants to make reference to in pricing their RMB loan and interest rate contracts. The 10th meeting of the Hong Kong-Shenzhen Joint Task Force on Boundary District Development (JTF) was convened in Shenzhen. The JTF noted the progress of the Liantang/Heung Yuen Wai Boundary Control Point (BCP) project and the study on the development of the Lok Ma Chau Loop.
24 – 29 Jun FS led a business delegation to visit Cambodia and Myanmar, to promote trade flows and economic development between Hong Kong and these two countries with a view to further tapping into the emerging Southeast Asian market.
26 Jun The Ministry of Finance launched the fifth issue of RMB Bonds of the Central People’s Government in Hong Kong. The Government announced the Consultation Conclusions on the Key Legislative Proposals for the Establishment of an Independent Insurance Authority.

145
27 Jun The Islamic Financial Services Board organised and the HKMA hosted the Seminar on
Strategies for the Development of Islamic Capital Markets in Hong Kong to promote discussions, understanding and experience-sharing in the area of Islamic capital markets. Hong Kong was ranked the world's third largest recipient of Foreign Direct Investment (FDI) flows in 2012, according to the World Investment Report 2013 released by the United Nations Conference on Trade and Development. Hong Kong continued to be the second largest FDI recipient in Asia after Mainland China.
28 Jun To provide the legal framework for the regulatory regime for over-the-counter (OTC) derivatives market in Hong Kong, the Securities and Futures (Amendment) Bill 2013 was gazetted. It will enable Hong Kong to put in place an appropriate and effective regime which meets the requirements of the Group of Twenty (G20) and is in line with developments in other international financial centres. The West Kowloon Cultural District Authority announced the winning team for the architectural design competition of M+, Hong Kong’s new museum for visual culture, in the West Kowloon Cultural District. The Government announced the tender invitation for an industrial site in Tseung Kwan O, designated for the development of a high-tier data centre that would serve as part of the critical infrastructure supporting Hong Kong’s economic development. The site was sold on 9 October 2013.
29 Jun Hong Kong and some World Trade Organization (WTO) Members launched the negotiation on the Trade in Services Agreement.
Jul – Aug Create Hong Kong, with the support of local animation and comics sector, presented the Hong Kong Ani-Com Summer 2013 to promote the Comix Home Base and arouse public interest in comics and animation. 14 animation and comics-related programmes attracted over 900 000 participants.
1 Jul The Ministry of Science and Technology approved the establishment of 4 new Partner State Key Laboratories (PSKLs) by local universities under a new round of application exercise, increasing the total number of PSKLs in Hong Kong to 16. The number of products with rules of origin agreed under CEPA was increased to 1 774.
4 Jul SDEV announced the North East New Territories New Development Areas (NDA) Project. The Government would first proceed with the Kwu Tung North NDA and the Fanling North NDA, as extension to Fanling/Sheung Shui New Town, and a major source of land supply to meet the medium to long term housing as well as other social and economic development needs of Hong Kong.
10 Jul The Government announced the tendering of 5-year Government Bonds, totalling $2 billion, through the re-opening of an existing 5-year Government Bond issue under the Institutional Bond Issuance Programme of the Government Bond Programme. The Inland Revenue and Stamp Duty Legislation (Alternative Bond Schemes) (Amendment) Ordinance 2013, which provides a comparable taxation framework for Islamic bonds (sukuk) vis-à-vis conventional bonds and enhances the competitiveness of Hong Kong in the development of a sukuk market, was enacted by the LegCo.

146
12 Jul The Finance Committee of the LegCo approved the 2013-14 Civil Service Pay Adjustment. The adjustment rates ranged from 2.55% to 3.92%, and took retrospective effect from 1 April 2013.
15 Jul The HKMA and Bank of Thailand jointly announced the establishment of a cross border payment-versus-payment (PvP) link between the Thai Baht real time gross settlement system (BAHTNET) in Thailand and the US Dollar Real Time Gross Settlement system (USD RTGS system) in Hong Kong, to be launched in the second half of 2014. The establishment of this PvP link will increase the efficiency and safety of the foreign exchange settlement between US dollar in Hong Kong and Thai Baht in Thailand. The Government launched the Stage 2 Community Engagement of the Hung Shui Kiu NDA Planning and Engineering Study to gauge the public’s views on the Preliminary Outline Development Plan.
17 Jul The LegCo passed the relevant Notices to increase the minimum level of relevant income for making MPF mandatory contributions from $6,500 to $7,100 per month with effect from 1 November 2013 and to increase the maximum level of relevant income for making MPF mandatory contributions from $25,000 to $30,000 per month with effect from 1 June 2014.
17 – 18 Jul FS paid a two-day visit to Guangzhou and Dongguan to foster closer economic co-operation between Hong Kong and Guangdong Province. As Nansha has been chosen as a major co-operation zone for Guangdong and Hong Kong in implementing pilot measures, FS visited various key developments in Nansha to gain a better understanding of the district's latest development plans.
19 Jul FS and the Secretary for Economy and Finance of the Macao Special Administrative Region co-chaired the 6th Hong Kong Macao Co-operation High Level Meeting in Hong Kong. At the Meeting, the two sides conducted in-depth discussion on the progress made in individual areas of co-operation in the past year and co-operation directions for the coming year. The Trade Descriptions (Unfair Trade Practices) (Amendment) Ordinance 2012, which prohibits commonly seen unfair trade practices, came into full implementation. It enhances the protection of consumer interests. The rate of the Business Registration Certificate levy which finances the Protection of Wages on Insolvency Fund was reduced from $450 to $250 per annum. The Inland Revenue (Amendment) (No.2) Ordinance 2013 came into effect. Hong Kong is now able to enter into tax information exchange agreements with other jurisdictions where necessary. The exchange of information arrangements under comprehensive avoidance of double taxation agreements is also enhanced.
22 Jul The SFC authorised the first unlisted structured investment products that contain RMB features for offering to the public. These products were equity-linked investments that could be (i) denominated in RMB or a freely convertible currency; and (ii) linked to reference asset(s) denominated in HKD and/or RMB.
26 Jul The HKMA implemented two enhancements in the provision of RMB liquidity facility to AIs participating in RMB business in Hong Kong. In addition to one-week RMB funds, the enhanced facility also provides one-day funds (available on a next day basis) and overnight funds (available on the same day) to help banks meet their liquidity needs.

147
29 Jul The Government announced the tendering of 10-year Government Bonds, totalling
$1.5 billion, through the re-opening of an existing 10-year Government Bond issue under the Institutional Bond Issuance Programme of the Government Bond Programme.
30 Jul – 2 Aug
FS visited Wuhan in Hubei Province and Changsha in Hunan Province during a four-day visit to strengthen economic and trade ties with these two provinces.
1 Aug A one-off incentive scheme to subsidise replacement of catalytic converters and oxygen sensors of petrol and liquefied petroleum gas (LPG) taxis and light buses was launched to reduce excessive emissions.
16 Aug The Government released the preliminary GDP figures for the second quarter of 2013. While the external sector was still constrained by the unsteady global economic environment, the domestic sector remained resilient and continued to be the key growth driver. Real GDP increased moderately by 3.3% in the second quarter over a year earlier. In the August update of the economic forecast for 2013, the forecast growth rate in real terms of GDP was revised to 2.5-3.5%. The forecast rates of increase in the headline and underlying Composite CPI were slightly revised downward to 4.3% and 4% respectively.
21 Aug Standard & Poor’s Financial Services LLC affirmed Hong Kong’s long-term local- and foreign-currency sovereign ratings at “AAA”, with “Stable” outlook.
23 Aug The HKMA issued the “Code of Conduct for Reference Banks for TMA’s CNH Hong Kong Interbank Offered Rate” (the Code) as Annex B to the statutory guideline on “Code of Conduct for Benchmark Submitters” gazetted on 3 May. The Code provides sound practices on systems of control for the CNH HIBOR fixing process as well as clear guidance for reference banks to observe in making rate submissions for this fixing.
26 Aug The Government announced the tendering of 2-year Government Bonds, totalling $3.5 billion, through the re-opening of an existing 5-year Government Bond issue under the Institutional Bond Issuance Programme of the Government Bond Programme.
29 Aug The HKSAR Government and the Central People’s Government signed Supplement X to CEPA.
30 Aug The Airport Authority (AA) released its first sustainability report entitled "SUSTAINING OUR CAPACITY – Our Blueprint for Shared Growth", providing a review of the AA’s sustainability performance and its initiatives in three key areas: safety and security; economy; and quality of life.
1 Sep Commissioning of The Hong Kong Branch Line facilities was completed to support operations using the new natural gas supplies through the Mainland’s Second West-East Natural Gas Pipeline.
3 Sep The Long Term Housing Strategy (LTHS) Steering Committee published a consultation document on the review of the LTHS and launched a three-month public consultation.
5 Sep The HKMA announced the Hong Kong results of the BIS triennial survey on foreign exchange and derivatives market turnover. Hong Kong advanced one place and ranked fifth in the global foreign exchange market as compared to the last survey in 2010. If

148
transactions in the OTC interest rate derivatives market were included, Hong Kong’s ranking moved up from seventh in 2010 to sixth in 2013.
5 – 6 Sep FS participated in the G20 Leaders’ Summit in St Petersburg, Russia, as part of the delegation of the People's Republic of China.
6 Sep The HKMA and the TMA jointly organised the Treasury Markets Summit 2013 in Hong Kong, attracting over 300 participants, including representatives from regulatory authorities, the Government, treasury market practitioners, asset owners and managers as well as senior executives and professionals from banks and other financial institutions from different geographic locations.
8 – 9 Sep CE attended the 9th Pan-Pearl River Delta Regional Co-operation and Development Forum and Trade Fair in Guiyang City, Guizhou Province. During the visit, CE had bilateral meetings with some of the provincial leaders.
14 Sep The Investment Promotion and Protection Agreement between Hong Kong and Kuwait entered into force. This is the first investment agreement between Hong Kong and a Middle East economy.
16 Sep CE and the Governor of Guangdong Province co-chaired the 16th Plenary of the Hong Kong/Guangdong Co-operation Joint Conference in Hong Kong. Both sides reviewed the progress of Hong Kong-Guangdong co-operation over the past year at the meeting and agreed that in the coming year, the two Governments will focus on promoting early basic achievement of liberalisation of trade in services between Hong Kong and Guangdong, and step up co-operation in various aspects with a view to enhancing the overall competitiveness of the region. To further promote cooperation between Hong Kong and Guangdong on information technology, CEDB and the Economic and Information Commission of Guangdong Province jointly signed the "Framework Agreement on Information Technology Cooperation between Hong Kong and Guangdong".
18 Sep Hong Kong remained the freest economy in the world, according to the 2013 Annual Report on the Economic Freedom of the World jointly released by the Fraser Institute of Canada, CATO Institute of the US and more than 80 other research institutes around the world.
19 Sep Fitch Ratings affirmed Hong Kong’s long-term local- and foreign-currency sovereign ratings at “AA+”, with “Stable” outlook.
19 – 20 Sep FS attended the Asia-Pacific Economic Cooperation (APEC) Finance Ministers' Meeting in Bali, Indonesia and met with his counterparts.
24 Sep The West Kowloon Cultural District Authority held the Ground-breaking Ceremony of Xiqu Centre, the first major performing arts venue in the West Kowloon Cultural District.
26 – 27 Sep CE led a trade delegation to Chongqing, to deepen the trade’s understanding about the business environment and investment opportunities in Chongqing and to enhance exchanges and cooperation between the enterprises of both places. During the visit, CE called on leaders of the Chongqing Municipal Government.

149
27 Sep The Hong Kong-Taiwan Economic and Cultural Co-operation and Promotion Council and its Taiwan counterpart, Taiwan-Hong Kong Economic and Cultural Co-operation Council, held their fourth joint meeting in Hong Kong. On the economic front, the export credit insurance organisations of both places signed a co-operation agreement to better assist Hong Kong and Taiwan businesses in enhancing their risk management; and the tourism promotion organisations of both places joined hands in promoting cruise tourism.
28 Sep The first Commission on Poverty Summit, chaired by CE, announced the poverty line, which was set at 50% of the median monthly household income before government policy intervention. The poverty line helps better understand the poverty situation, formulate appropriate policies and assess the effectiveness of government policy intervention.
1 Oct The new initial public offering (IPO) sponsors regime took effect, under which IPO sponsors have to thoroughly understand any company aspiring to access Hong Kong’s public capital markets before a listing application is made. Emphasising early and comprehensive due diligence and a properly drafted prospectus to accompany the application, the new requirements apply to listing applications submitted on or after 1 October 2013.
3 Oct The Pacific Economic Co-operation Council published its State of the Region Report 2013-2014. The Report recognised Hong Kong as one of the economies most highly integrated with the Asia-Pacific region. HKIA was inducted into the Travel Hall of Fame in the TTG Travel Awards after clinching the Best Airport award 10 times since 2002.
4 Oct The SFC approved the first RMB share class to be offered by an SFC-authorised fund with underlying investments mostly in non-RMB denominated assets.
5 – 8 Oct CE attended the APEC 2013 Leaders’ Week and other related meetings in Bali. During his stay in Bali, CE met with APEC leaders to exchange views on issues of mutual concern.
7 Oct CE appointed members to the Consultative Committee on Economic and Trade Co-operation between Hong Kong and the Mainland to advise the HKSAR Government on matters related to strengthening co-operation with the Mainland in trade, economic and other relevant areas.
9 Oct The first data centre site at Tseung Kwan O, with an area of about 10 300 square metres, was sold at a premium of $428 million.
9 – 11 Oct FS visited New York and attended the plenary session of the Annual Meetings of the International Monetary Fund and the World Bank Group in Washington, DC, as a member of the Chinese delegation.
15 Oct CE in Council approved in principle the applications of Fantastic Television Limited and Hong Kong Television Entertainment Company Limited for a domestic free television programme service licence. If the two applicants are eventually granted the licences, it will be the first time in 40 years that competition be introduced into the free television market.

150
16 Oct The Government announced the introduction of further refinements to improve the revitalisation measures to facilitate redevelopment or wholesale conversion of industrial buildings in appropriate land use zonings into non-industrial uses. These measures will continue to apply until 31 March 2016.
18 Oct The last infrastructure works contract under the Shatin to Central Link project was awarded. In 2013, a total of 13 infrastructure works contracts were awarded under the said project with a total sum of $11.3 billion.
18 Oct – 7 Dec
The InnoTech Month 2013 was launched to enhance the community’s awareness of innovation and technology. Two roadshows and a 9-day InnoCarnival held at Hong Kong Science Park had drawn a total attendance of over 230 000.
21 – 22 Oct ASEAN Economic Ministers and representatives visited Hong Kong to promote economic and trade co-operation between Hong Kong and ASEAN.
22 – 24 Oct CE attended the opening ceremony of the 17th Beijing-Hong Kong Economic Co-operation Symposium in Beijing. During his stay in Beijing, CE called on Central Government officials responsible for financial and monetary matters and leaders of financial institutions in the Mainland.
23 Oct OGCIO and the Beijing Municipal Commission of Economy and Information Technology co-organised the “Smart City and Sustainable Development Forum” to strengthen ICT collaboration between the two places.
24 Oct The Government launched a public engagement exercise on population policy to collect public views on how to nurture a population that can drive Hong Kong’s economic development while building a socially inclusive society.
25 Oct The Companies Ordinance (Commencement) Notice 2013 was published in the Gazette to appoint 3 March 2014 as the commencement date for the new Companies Ordinance.
28 Oct The Government announced the tendering of 3-year Government Bonds, totalling $3 billion, through the re-opening of an existing 5-year Government Bond issue under the Institutional Bond Issuance Programme of the Government Bond Programme. The HKMA hosted the launching ceremony for the Treat Customers Fairly Charter, signed up by 22 retail banks. The Charter incorporates five high-level principles aiming to promote a stronger corporate culture among banks of treating customers fairly. Meanwhile, several retail banks announced they will waive dormant account fee and exempt all vulnerable group customers from low-balance fee. The Government launched the Stage 2 public consultation exercise on the elevated rail-based Environmentally Friendly Linkage System for Kowloon East to enhance the connectivity of Kowloon East and facilitate its transformation into another central business district.
28 – 31 Oct The Environment Bureau, together with the HKTDC, co-organised the Eco Expo Asia 2013. The expo featured “Sustainable Use of Resources” as a main theme, and attracted more than 290 exhibitors from 19 countries and regions.
29 Oct The Environment Bureau and the Economic and Information Commission of Guangdong Province jointly held the fifth "Hong Kong - Guangdong Cleaner Production Partners" presentation ceremony. A total of 85 Hong Kong-owned manufacturing enterprises, 3

151
sourcing enterprises and 16 environmental technology service providers were commended as "Hong Kong - Guangdong Cleaner Production Partners". The Customs and Excise Department (C&ED) and the Mainland Customs signed a mutual recognition arrangement (MRA) to enable the respective Customs accredited companies (i.e. Authorized Economic Operators (AEOs) in HK and “AA-class” companies in the Mainland) to enjoy clearance facilitation for their goods imported from or exported to the other side.
31 Oct The major structural works of three new stations (Kennedy Town Station, HKU Station and Sai Ying Pun Station) of the West Island Line were completed.
1 Nov Japan Credit Rating Agency, Ltd. affirmed Hong Kong’s long-term local- and foreign-currency sovereign ratings at “AA+”, with “Stable” outlook. The Official Receiver’s Office reduced the statutory fees, charges and deposits for bankruptcy and court winding-up cases. The minimum level of relevant income for making MPF mandatory contributions was increased from $6,500 to $7,100 per month.
6 Nov The first high speed train set of Guangzhou-Shenzhen-Hong Kong Express Rail Link, with a design maximum operating speed of 350 kph, rolled off the production line for track testing.
7 Nov The Government and the HKTDC jointly hosted the third Asian Logistics and Maritime Conference, attracting over 1 600 business leaders and industry practitioners from 27 countries and regions.
7 – 9 Nov The HKTDC held the sixth Hong Kong International Wine and Spirits Fair. The number of exhibitors increased to 1 005, attracting over 20 000 traders.
9 – 12 Nov The Third Plenary Session of the Eighteenth Communist Party of China Central Committee, which was held in Beijing, approved the Decision on Major Issues Concerning Comprehensively Deepening Reforms.
14 Nov The seventh annual Structured Dialogue meeting between the HKSAR Government and the EU was held in Hong Kong. The two sides conducted fruitful discussions on a wide range of subjects to deepen mutual understanding, and identified areas for further co-operation.
15 Nov The Government released the preliminary GDP figures for the third quarter of 2013. The Hong Kong economy grew moderately further by 2.9% in real terms in the third quarter over a year earlier. In the November update of the economic forecast for 2013, the forecast growth rate of GDP in real terms was revised to 3%. The forecast rates of increase in the headline and underlying Composite CPI were maintained at 4.3% and 4% respectively. The Communications Authority announced its decision to adopt a hybrid administratively-assigned cum market-based approach for the re-assignment of the 118.4 MHz of paired spectrum in the 1.9 - 2.2 GHz band upon expiry of the existing assignments in October 2016. SCED also announced the methodology in setting the relevant spectrum utilisation fee which will be prescribed through subsidiary legislation.

152
HKIA was voted the “Best Airport in China” by readers of a leading travel publication “Business Traveller China” for the seventh time in eight years.
18 Nov The FSDC published its first batch of research reports, putting forward proposals to facilitate the diversification of the financial services industry and positioning and functioning of Hong Kong as an international financial centre.
18 – 21 Nov FS visited London and Paris to strengthen economic ties between Hong Kong and these two places.
19 Nov The 11th meeting of the JTF was convened in Hong Kong. The JTF noted the progress of the Liantang/Heung Yuen Wai BCP project including that both the Hong Kong and Shenzhen sides had reached a fundamental consensus on the architectural features and details of the BCP Passenger Terminal Building. It also noted the progress of the planning and engineering study for the Lok Ma Chau Loop and the results of the environmental impact assessment. The JTF was pleased to note the substantial progress made in respect of these two projects and expected that both Hong Kong and Shenzhen sides would continue to work closely to take the projects forward.
19 – 22 Nov Representatives of the Environment Bureau joined the Chinese delegation to attend the United Nations Climate Change Conference in Warsaw, Poland. The HKSAR Government also participated in the “Low-Carbon Development in China” exhibition at the China Pavilion, to introduce Hong Kong’s total approach in low-carbon development. SIGGRAPH Asia 2013 attracted over 6 000 world-wide renowned designers, researchers and developers of the digital entertainment sector to showcase spectacular work on computer graphics and interactivity and share their insights.
21 Nov The Ministry of Finance launched the sixth issue of RMB Bonds of the Central People’s Government in Hong Kong.
22 Nov The HKMA launched the “Consumer Education Programme” to help the public to be “smart and responsible” in using banking services. The Working Group on IP Trading formulated an overall strategy for promoting the development of Hong Kong as an IP trading hub. In 2014, the Working Group will explore specific policy and other measures in support of the focus strategies.
24 – 27 Nov With support from the Government, the Asia Pacific Information and Communications Technology Alliance (APICTA) Awards 2013 was held in Hong Kong. Hong Kong won four Grand Awards and 12 Merits in this regional contest.
25 Nov CS and the Mayor of Shenzhen Municipal Government co-chaired the Hong Kong/Shenzhen Co-operation Meeting in Hong Kong. At the meeting, the two sides comprehensively reviewed the co-operation initiatives in 2013, and conducted in-depth discussion on a number of key areas. The HKAB issued the Best Practice for NFC Mobile Payment in Hong Kong. The HKMA also held a seminar for HKAB and industry representatives to exchange views on the innovations and future development of NFC mobile payment services.

153
OTC Clearing Hong Kong Limited, a subsidiary of Hong Kong Exchanges and Clearing Limited, commenced operation to provide clearing services for OTC derivatives.
26 Nov The data centre of Digital Realty Trust and Savvis in Tseung Kwan O Industrial Estate opened for operation. The first RQFII A-share ETF managed by a local financial institution was launched and listed on SEHK.
27 – 29 Nov CE led a trade delegation to Guangxi, to deepen the trade’s understanding about the business environment and investment opportunities in Guangxi and to enhance exchanges and cooperation between the enterprises of both places. He also called on leaders of the Guangxi Zhuang Autonomous Region Government and the Qinzhou and Fangchenggang Municipal Governments.
28 Nov The Kai Tak Fantasy (KTF) International Ideas Competition on Urban Planning and Design was launched by the Energising Kowloon East Office (EKEO) of the Development Bureau. The EKEO wishes to solicit creative and innovative proposals for KTF's development into a tourism, entertainment and recreation destination for both the local community and visitors. C&ED signed an MRA with the India Customs to mutually recognise the respective AEOs, enabling them to enjoy clearance facilitation for their goods imported from or exported to the other side.
30 Nov
The Government Wi-Fi Programme was rolled out to 437 government premises, providing free Wi-Fi Internet access service to the public and visitors with over 2 300 hotspots. The service will be extended to more leisure locations and popular focal points in 2014.
2 – 7 Dec “Business of Design Week 2013”, the largest annual design event in Asia and one of the leading design events in the world, was held in Hong Kong. Belgium was the partner country for the event. Over 100 000 persons participated in the “Business of Design Week” and its concurrent events.
3 Dec The first meeting of the Joint Forum on Islamic Finance was held in Hong Kong as one of the agreed initiatives in August 2013 between the HKMA and Bank Negara Malaysia (BNM) to strengthen collaboration between Hong Kong and Malaysia in the area of Islamic finance through setting up a private-sector led joint forum.
3 – 7 Dec The Hong Kong, China delegation attended the Ninth Ministerial Conference (MC9) of the WTO held in Bali, Indonesia. The MC9 concluded the Bali Package, which comprised Trade Facilitation, agriculture and development issues. The Agreement on Trade Facilitation is the first multilateral agreement concluded by the WTO since its establishment in 1995.
4 Dec At the Opening Ceremony of its annual flagship conference, InnoAsia 2013, the Hong Kong Science and Technology Parks Corporation (HKSTPC) officially announced its designation by the Ministry of Science and Technology as the “Hong Kong National Modern Services Industrialisation (Partner) Base”. The designation was made in recognition of HKSTPC’s support to the development of various modern service sectors.
5 Dec The first meeting of the Hong Kong – Malaysia Private Sector Dialogue on Offshore RMB Business was held in Kuala Lumpur and attended by senior representatives from

154
10 Hong Kong and Malaysian banks, in addition to HKMA and BNM officials. The Dialogue is intended to be a platform through which Hong Kong and Malaysian financial institutions can deepen their cooperation and enhance their collective capabilities in providing RMB products and services. Invest Hong Kong organised its first global competition for startups – “StartmeupHK Venture Programme 2013” in Hong Kong, attracting 384 entries from 39 countries and cities. The global competition aimed to promote Hong Kong as Asia’s leading hub of entrepreneurship and innovation.
5 – 6 Dec As part of the overall strategy in promoting the development of Hong Kong as a premier IP trading hub in the region, the Government, for the first time, co-organised the Business of Intellectual Property Asia Forum (BIP Asia) with the HKTDC and the Hong Kong Design Centre in order to elevate the event to a whole new level. Launched in 2011, BIP Asia has now become an annual leading IP event in the region. The HKTDC also launched the Asia Intellectual Property Exchange, an online IP trading portal built and developed in-house, with a view to enhancing Hong Kong’s online IP trading volume, capabilities and connections.
6 Dec As part of the efforts to implement the “original grant” patent system in Hong Kong, the Intellectual Property Department (IPD) and the State Intellectual Property Office (SIPO) signed the Co-operation Arrangement in the Area of Patent in Hong Kong, under which SIPO would provide technical assistance and support to the IPD for substantive examination of patent applications and the training of staff.
6 – 7 Dec CE visited Guangzhou, Zhongshan and Zhuhai, and attended the HK-Pearl River Delta Industrial & Commercial Circle Goodwill Gathering 2013 in Zhongshan. During the visit, CE called on leaders of the Guangdong Provincial Government and the Zhongshan and Zhuhai Municipal Governments.
11 Dec The Electronic Bill Presentment and Payment (EBPP) service was launched, jointly developed by the HKMA and the banking industry, aiming to provide convenient one-stop bill payment services for the public. The procurement contracts for the trains running along the East West Corridor under the Shatin to Central Link project was awarded, with a total sum of $2.3 billion.
18 Dec In light of the recent progress of economic recovery in the US, the Federal Reserve (the Fed) announced to taper its monthly pace of asset purchases by US$10 billion to US$75 billion per month from January 2014 onwards. At the same time, the Fed pointed out that the prevailing low interest rates would remain appropriate well past the time that the unemployment rate falls below its previously announced 6.5% threshold if inflation stays subdued. The Toys and Children's Products Safety (Amendment) Ordinance 2013 was passed by the LegCo. It enables the making of subsidiary legislation to control phthalates in certain toys and child products for better protection of children’s health.
27 Dec The Government rolled out the Government Cloud Platform (GovCloud) to facilitate more agile and cost-effective delivery of common e-government services for shared use by government departments. A total of $242 million has been earmarked to implement the GovCloud services in the coming five years.

155
30 Dec The Government launched the Air Quality Health Index (AQHI) to replace the Air Pollution Index (API). The AQHI is a health risk-based index, providing more timely and useful air pollution information to the public.
31 Dec The number of visitors to Hong Kong in 2013 reached 54.3 million, setting a new record.

157
Table Page
1. Gross Domestic Product by expenditure component (at current market prices) 158-159
2. 160-161
3. Gross Domestic Product by economic activity (at current prices) 162
4. 163
5. 164-165
6. Balance of Payments by major component (at current prices) 166
7. 167
7a. 168
8. Total exports of goods by market (in value terms) 169
9. Imports of goods by source (in value terms) 170
10. Retained imports of goods by end-use category (in value terms) 170
11. Exports and imports of services by component (at current market prices) 171
11a. 172
12. Incoming visitors by source 173
13. Property market 174-175
14. 176-177
15. Monetary aggregates 178-179
16. Rates of change in business receipts indices for services industries/domains 180
17. Labour force characteristics 181
18. Employment in selected major industries 182
19. Number of workers engaged at building and construction sites 183
20. Rates of change in indices of payroll per person engaged by selected industry section 184
21. Rates of change in wage indices by selected industry section 185
22. Rates of change in prices 186-187
23. Rates of change in Composite Consumer Price Index 188-189
24. 190-191
Visible and invisible trade (at current market prices)
Rates of change in implicit price deflators of GDP and its main expenditurecomponents
Statistical Appendix
Property prices and rentals
Rates of change in chain volume measures of Gross Domestic Product byexpenditure component (in real terms)
Rates of change in chain volume measures of Gross Domestic Product by economicactivity (in real terms)
Visible and invisible trade based on the change of ownership principle
Exports and imports of services based on the change of ownership principle bycomponent (at current market prices)
Value added and employment statistics of the Four Key Industries and other selectedindustries
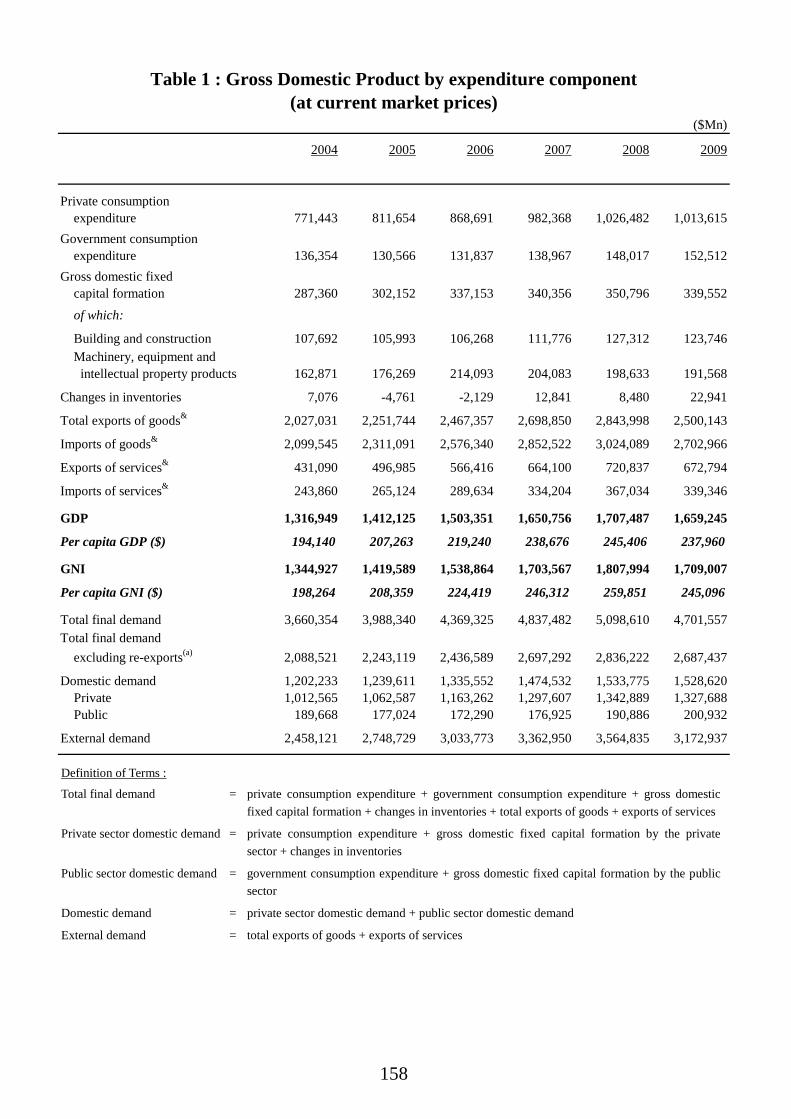
158
($Mn)
2004 2005 2006 2007 2008 2009
Private consumption expenditure 771,443 811,654 868,691 982,368 1,026,482 1,013,615Government consumption expenditure 136,354 130,566 131,837 138,967 148,017 152,512Gross domestic fixed capital formation 287,360 302,152 337,153 340,356 350,796 339,552 of which:
Building and construction 107,692 105,993 106,268 111,776 127,312 123,746 Machinery, equipment and intellectual property products 162,871 176,269 214,093 204,083 198,633 191,568
Changes in inventories 7,076 -4,761 -2,129 12,841 8,480 22,941
Total exports of goods& 2,027,031 2,251,744 2,467,357 2,698,850 2,843,998 2,500,143
Imports of goods& 2,099,545 2,311,091 2,576,340 2,852,522 3,024,089 2,702,966
Exports of services& 431,090 496,985 566,416 664,100 720,837 672,794
Imports of services& 243,860 265,124 289,634 334,204 367,034 339,346
GDP 1,316,949 1,412,125 1,503,351 1,650,756 1,707,487 1,659,245
Per capita GDP ($) 194,140 207,263 219,240 238,676 245,406 237,960
GNI 1,344,927 1,419,589 1,538,864 1,703,567 1,807,994 1,709,007
Per capita GNI ($) 198,264 208,359 224,419 246,312 259,851 245,096
Total final demand 3,660,354 3,988,340 4,369,325 4,837,482 5,098,610 4,701,557Total final demand excluding re-exports(a) 2,088,521 2,243,119 2,436,589 2,697,292 2,836,222 2,687,437
Domestic demand 1,202,233 1,239,611 1,335,552 1,474,532 1,533,775 1,528,620 Private 1,012,565 1,062,587 1,163,262 1,297,607 1,342,889 1,327,688 Public 189,668 177,024 172,290 176,925 190,886 200,932
External demand 2,458,121 2,748,729 3,033,773 3,362,950 3,564,835 3,172,937
Table 1 : Gross Domestic Product by expenditure component(at current market prices)
Definition of Terms :
Total final demand = private consumption expenditure + government consumption expenditure + gross domestic fixed capital formation + changes in inventories + total exports of goods + exports of services
Private sector domestic demand = private consumption expenditure + gross domestic fixed capital formation by the private sector + changes in inventories
Public sector domestic demand = government consumption expenditure + gross domestic fixed capital formation by the public sector
Domestic demand = private sector domestic demand + public sector domestic demand
External demand = total exports of goods + exports of services

159
($Mn)
2010 2011 2012# 2013# 2013Q1# Q2# Q3# Q4#
Private consumption expenditure 1,090,234 1,224,402 1,314,961 1,401,993 344,340 353,372 336,812 367,469Government consumption expenditure 157,371 168,517 185,487 198,553 50,947 47,456 49,531 50,619Gross domestic fixed capital formation 386,852 455,294 517,348 502,328 114,506 126,086 124,890 136,846 of which:
Building and construction 139,249 179,341 204,859 216,776 53,712 51,229 54,646 57,189 Machinery, equipment and intellectual property products 209,568 239,854 278,415 258,763 52,307 68,579 64,301 73,576
Changes in inventories 37,522 11,742 -3,662 -2,715 3,586 -7,974 -1,394 3,067
Total exports of goods& 3,068,444 3,420,076 3,591,776 3,816,411 871,855 929,088 1,000,343 1,015,125
Imports of goods& 3,395,057 3,848,200 4,116,410 4,394,928 1,024,117 1,100,267 1,117,381 1,153,163
Exports of services& 829,044 941,178 1,003,047 1,066,029 256,945 249,898 272,371 286,815
Imports of services& 398,078 438,576 455,382 465,179 114,220 106,900 118,561 125,498
GDP 1,776,332 1,934,433 2,037,165 2,122,492 503,842 490,759 546,611 581,280
Per capita GDP ($) 252,887 273,550 284,735 295,303 -- -- -- --
GNI 1,813,928 1,987,259 2,066,620 N.A. 516,419 518,987 546,979 N.A.
Per capita GNI ($) 258,240 281,020 288,852 N.A. -- -- -- --
Total final demand 5,569,467 6,221,209 6,608,957 6,982,599 1,642,179 1,697,926 1,782,553 1,859,941Total final demand excluding re-exports(a) 3,058,027 3,433,562 3,655,431 3,832,103 925,615 929,977 955,564 1,020,946
Domestic demand 1,671,979 1,859,955 2,014,134 2,100,159 513,379 518,940 509,839 558,001 Private 1,449,592 1,614,020 1,737,235 1,802,320 434,376 450,804 436,591 480,549 Public 222,387 245,935 276,899 297,839 79,003 68,136 73,248 77,452
External demand 3,897,488 4,361,254 4,594,823 4,882,440 1,128,800 1,178,986 1,272,714 1,301,940
Table 1 : Gross Domestic Product by expenditure component(at current market prices) (Cont'd)
Notes: (a) Re-export margin is nevertheless retained in the total final demand.
(#) Figures are subject to revision later on as more data become available.
(&) Figures are based on the System of National Accounts 2008, other than the change of ownership principle. For figures based on the change of ownership principle, please see Table 7a. For details about the change of ownership principle, please refer to the Special Report on Gross Domestic Product published by the Census and Statistics Department in September 2012.
(--) Not applicable.
N.A. Not yet available.
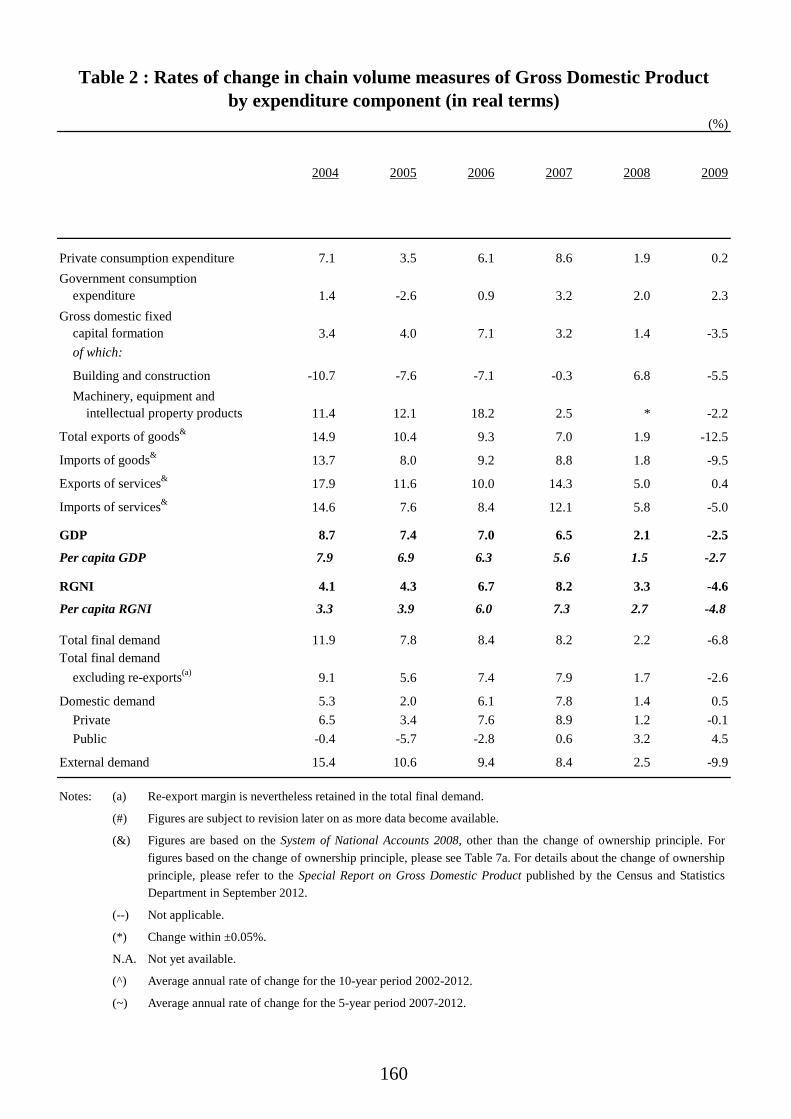
160
(%)
2004 2005 2006 2007 2008 2009
Private consumption expenditure 7.1 3.5 6.1 8.6 1.9 0.2Government consumption expenditure 1.4 -2.6 0.9 3.2 2.0 2.3Gross domestic fixed capital formation 3.4 4.0 7.1 3.2 1.4 -3.5 of which:
Building and construction -10.7 -7.6 -7.1 -0.3 6.8 -5.5 Machinery, equipment and intellectual property products 11.4 12.1 18.2 2.5 * -2.2
Total exports of goods& 14.9 10.4 9.3 7.0 1.9 -12.5
Imports of goods& 13.7 8.0 9.2 8.8 1.8 -9.5
Exports of services& 17.9 11.6 10.0 14.3 5.0 0.4
Imports of services& 14.6 7.6 8.4 12.1 5.8 -5.0
GDP 8.7 7.4 7.0 6.5 2.1 -2.5
Per capita GDP 7.9 6.9 6.3 5.6 1.5 -2.7
RGNI 4.1 4.3 6.7 8.2 3.3 -4.6
Per capita RGNI 3.3 3.9 6.0 7.3 2.7 -4.8
Total final demand 11.9 7.8 8.4 8.2 2.2 -6.8Total final demand excluding re-exports(a) 9.1 5.6 7.4 7.9 1.7 -2.6
Domestic demand 5.3 2.0 6.1 7.8 1.4 0.5 Private 6.5 3.4 7.6 8.9 1.2 -0.1 Public -0.4 -5.7 -2.8 0.6 3.2 4.5
External demand 15.4 10.6 9.4 8.4 2.5 -9.9
Table 2 : Rates of change in chain volume measures of Gross Domestic Productby expenditure component (in real terms)
Notes: (a) Re-export margin is nevertheless retained in the total final demand.
(#) Figures are subject to revision later on as more data become available.
(&) Figures are based on the System of National Accounts 2008, other than the change of ownership principle. For figures based on the change of ownership principle, please see Table 7a. For details about the change of ownership principle, please refer to the Special Report on Gross Domestic Product published by the Census and Statistics Department in September 2012.
(--) Not applicable.
(*) Change within ±0.05%.
N.A. Not yet available.
(^) Average annual rate of change for the 10-year period 2002-2012.
(~) Average annual rate of change for the 5-year period 2007-2012.

161
(%)
2010 2011 2012# 2013# 2013
Q1# Q2# Q3# Q4#
10 years2003 to
2013#
5 years2008 to
2013#
Private consumption expenditure 6.1 8.4 4.1 4.2 6.5 4.6 2.4 3.2 5.0 4.6Government consumption expenditure 3.4 2.5 3.6 2.7 2.2 3.1 2.3 3.2 1.9 2.9Gross domestic fixed capital formation 7.7 10.2 6.8 3.3 -3.3 7.6 2.8 5.3 4.3 4.8 of which:
Building and construction 5.7 15.7 7.2 -1.2 -2.4 -1.0 3.2 -4.1 * 4.1 Machinery, equipment and intellectual property products 6.5 12.3 10.2 10.5 -4.3 19.4 7.3 17.2 8.0 7.3
Total exports of goods& 17.3 3.4 1.8 6.7 8.8 6.2 6.2 5.8 5.7 2.9
Imports of goods& 18.1 4.7 3.0 7.6 9.6 7.6 6.8 6.5 6.3 4.4
Exports of services& 14.7 5.5 2.2 5.8 5.1 8.0 5.5 4.9 8.6 5.6
Imports of services& 11.1 3.5 1.9 1.5 0.5 -1.0 2.7 3.7 6.0 2.5
GDP 6.8 4.8 1.5 2.9 2.9 3.1 2.8 3.0 4.5 2.7
Per capita GDP 6.0 4.1 0.4 2.5 -- -- -- -- 3.8 2.0
RGNI 3.6 4.8 -0.2 N.A. 3.2 4.2 5.0 N.A. 3.2^ 1.3~
Per capita RGNI 2.9 4.1 -1.3 N.A. -- -- -- -- 2.6 ^ 0.6 ~
Total final demand 13.6 4.7 2.5 5.7 6.8 5.7 5.3 5.2 5.7 3.7Total final demand excluding re-exports(a) 10.4 5.6 3.2 4.5 5.8 4.6 4.1 3.6 5.2 4.1
Domestic demand 7.1 6.5 3.9 3.9 4.2 3.6 3.6 4.2 4.4 4.4
Private 6.6 6.7 3.6 3.9 4.5 3.4 2.9 4.7 4.8 4.1 Public 10.2 5.5 5.8 4.0 2.4 4.9 8.1 1.2 2.4 6.0External demand 16.8 3.9 1.9 6.5 7.9 6.6 6.0 5.6 6.3 3.5
Table 2 : Rates of change in chain volume measures of Gross Domestic Productby expenditure component (in real terms) (Cont'd)
Average annualrate of change:

162
2008 2009 2010
$Mn%
share $Mn%
share $Mn%
share $Mn%
share $Mn%
share
Agriculture, fishing, mining and quarrying 925 0.1 1,090 0.1 948 0.1 944 * 1,114 0.1
Manufacturing 31,506 1.9 28,714 1.8 30,410 1.8 30,578 1.6 30,600 1.5
Electricity, gas and water supply, and waste management 39,651 2.4 35,032 2.2 34,486 2.0 33,877 1.8 35,337 1.8
Construction 48,403 3.0 50,264 3.2 56,531 3.3 65,484 3.4 73,445 3.6
Services 1,499,529 92.6 1,466,724 92.7 1,614,922 93.0 1,770,166 93.1 1,872,567 93.0Import/export, wholesale and retail trades 399,200 24.6 370,226 23.4 413,308 23.8 492,900 25.9 511,537 25.4Accommodation (a) and food services 53,600 3.3 48,789 3.1 56,418 3.2 66,421 3.5 72,044 3.6Transportation, storage, postal and courier services 98,390 6.1 99,208 6.3 137,941 7.9 120,034 6.3 120,609 6.0Information and communications 49,127 3.0 47,893 3.0 55,024 3.2 62,952 3.3 70,866 3.5
Financing and insurance 277,112 17.1 255,900 16.2 283,752 16.3 305,282 16.1 319,312 15.9Real estate, professional and business services 166,086 10.3 173,903 11.0 188,476 10.8 213,987 11.3 232,416 11.5Public administration, social and personal services 278,100 17.2 288,109 18.2 295,257 17.0 313,585 16.5 337,747 16.8
Ownership of premises 177,915 11.0 182,696 11.5 184,745 10.6 195,005 10.3 208,036 10.3
GDP at basic prices 1,620,013 100.0 1,581,824 100.0 1,737,298 100.0 1,901,049 100.0 2,013,062 100.0
Taxes on products 58,233 -- 54,689 -- 68,707 -- 69,401 -- 63,575 --
Statistical discrepancy (%) 1.7 -- 1.4 -- -1.7 -- -1.9 -- -1.9 --
GDP at current market prices 1,707,487 -- 1,659,245 -- 1,776,332 -- 1,934,433 -- 2,037,165 --
Table 3 : Gross Domestic Product by economic activity(at current prices)
2012#2011
Notes: Individual figures may not add up exactly to the total due to rounding.
(a) Accommodation services cover hotels, guesthouses, boarding houses and other establishments providing short term accommodation.
(#) Figures are subject to revision later on as more data become available.
(--) Not applicable.
(*) Less than 0.05%.
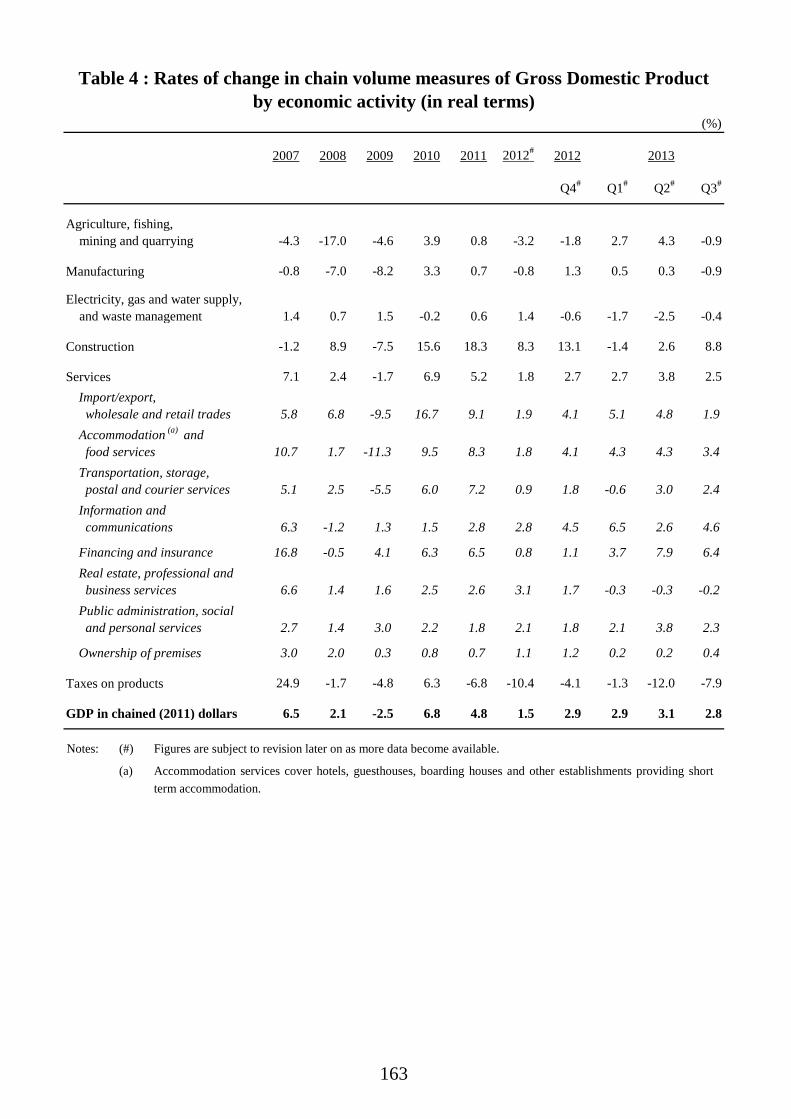
163
(%)
2007 2008 2009 2010 2011 2012# 2012 2013
Q4# Q1# Q2# Q3#
Agriculture, fishing, mining and quarrying -4.3 -17.0 -4.6 3.9 0.8 -3.2 -1.8 2.7 4.3 -0.9
Manufacturing -0.8 -7.0 -8.2 3.3 0.7 -0.8 1.3 0.5 0.3 -0.9
Electricity, gas and water supply, and waste management 1.4 0.7 1.5 -0.2 0.6 1.4 -0.6 -1.7 -2.5 -0.4
Construction -1.2 8.9 -7.5 15.6 18.3 8.3 13.1 -1.4 2.6 8.8
Services 7.1 2.4 -1.7 6.9 5.2 1.8 2.7 2.7 3.8 2.5Import/export, wholesale and retail trades 5.8 6.8 -9.5 16.7 9.1 1.9 4.1 5.1 4.8 1.9Accommodation (a) and food services 10.7 1.7 -11.3 9.5 8.3 1.8 4.1 4.3 4.3 3.4Transportation, storage, postal and courier services 5.1 2.5 -5.5 6.0 7.2 0.9 1.8 -0.6 3.0 2.4Information and communications 6.3 -1.2 1.3 1.5 2.8 2.8 4.5 6.5 2.6 4.6
Financing and insurance 16.8 -0.5 4.1 6.3 6.5 0.8 1.1 3.7 7.9 6.4Real estate, professional and business services 6.6 1.4 1.6 2.5 2.6 3.1 1.7 -0.3 -0.3 -0.2Public administration, social and personal services 2.7 1.4 3.0 2.2 1.8 2.1 1.8 2.1 3.8 2.3
Ownership of premises 3.0 2.0 0.3 0.8 0.7 1.1 1.2 0.2 0.2 0.4
Taxes on products 24.9 -1.7 -4.8 6.3 -6.8 -10.4 -4.1 -1.3 -12.0 -7.9
GDP in chained (2011) dollars 6.5 2.1 -2.5 6.8 4.8 1.5 2.9 2.9 3.1 2.8
Table 4 : Rates of change in chain volume measures of Gross Domestic Productby economic activity (in real terms)
Notes: (#) Figures are subject to revision later on as more data become available.
(a) Accommodation services cover hotels, guesthouses, boarding houses and other establishments providing short term accommodation.

164
$Bn% share
in total(1) $Bn% share
in total(1) $Bn% share
in total(1) $Bn% share
in total(1) 2010 2011 2012#
Value added at current prices
Four Key Industries 886.2 56.0 1,014.1 58.4 1,112.8 58.5 1,166.8 58.0 14.4 9.7 4.9
Financial services 255.9 16.2 283.8 16.3 305.3 16.1 319.3 15.9 10.9 7.6 4.6
Tourism 51.0 3.2 74.6 4.3 86.2 4.5 94.6 4.7 46.4 15.5 9.7
Trading and logistics 377.8 23.9 439.6 25.3 485.4 25.5 495.4 24.6 16.3 10.4 2.0Professional services and other producer services(2) 201.5 12.7 216.1 12.4 235.9 12.4 257.6 12.8 7.2 9.1 9.2
Other selected industries (3) 124.2 7.9 143.8 8.3 161.2 8.5 175.9 8.7 15.7 12.1 9.1Cultural and creative industries 63.3 4.0 77.6 4.5 89.6 4.7 97.8 4.9 22.6 15.4 9.2
Medical services 23.9 1.5 26.1 1.5 27.4 1.4 29.5 1.5 9.3 4.9 7.5
Education services 16.5 1.0 17.5 1.0 20.0 1.1 22.6 1.1 6.2 13.9 13.2Innovation and technology 10.7 0.7 11.8 0.7 12.4 0.7 13.4 0.7 9.6 5.1 8.5Testing and certification services 5.1 0.3 5.2 0.3 5.4 0.3 5.8 0.3 1.5 4.1 8.6
Environmental industries 4.7 0.3 5.6 0.3 6.5 0.3 6.8 0.3 19.3 16.3 3.6Nominal GDP at basic prices 1,581.8 100.0 1,737.3 100.0 1,901.0 100.0 2,013.1 100.0 9.8 9.4 5.9
Table 5 : Value added and employment statistics of the Four Key Industriesand other selected industries
Annual percentagechange (%)2009 2010 2011 2012#
Notes: Individual figures may not add up exactly to the total due to rounding.
(1) Refers to percentage share in nominal GDP at basic prices. Such GDP figure is slightly different from the commonly used one, i.e. valued at current market prices, in which taxes on products are included.
(2) Other producer services refer to producer services other than financial services, tourism, trading and logistics and professional services.
(3) The other selected industries reflect the direct contribution of these industries in the private sector only. Some of them are service domains straddling across different industries. For example, “innovation and technology” activities may exist in any industry and organisation. The term “industry” is used to denote the aggregate of the economic activities concerned for easy general understanding.
(4) Since innovation and technology involves significant non-routine activities, persons engaged in these activities are measured by the volume of labour input to innovation and technology in full-time equivalent terms (in terms of man-years).
(5) Figures refer to the quarterly averages of employment in the years concerned. Figures for 2009 differ from the figures at a particular time point in the Report on the 2009 Survey of Testing and Certification Activities published in February 2010.
(6) Figures refer to Composite Employment Estimates.
(#) Figures are subject to revision later on as more data become available.

165
Number('000)
% sharein total
Number('000)
% sharein total
Number('000)
% sharein total
Number('000)
% sharein total 2010 2011 2012#
Employment
Four Key Industries 1 643.8 47.4 1 670.1 48.0 1 706.0 47.7 1 727.6 47.2 1.6 2.1 1.3
Financial services 211.4 6.1 216.7 6.2 226.3 6.3 228.8 6.3 2.5 4.4 1.1
Tourism 192.2 5.5 215.1 6.2 235.9 6.6 250.9 6.9 11.9 9.7 6.3
Trading and logistics 783.9 22.6 778.2 22.4 774.4 21.6 764.9 20.9 -0.7 -0.5 -1.2Professional services and other producer services(2) 456.2 13.1 460.1 13.2 469.4 13.1 483.0 13.2 0.9 2.0 2.9
Other selected industries (3) 395.8 11.4 406.7 11.7 420.7 11.8 435.0 11.9 2.8 3.4 3.4Cultural and creative industries 188.3 5.4 189.4 5.4 192.9 5.4 200.4 5.5 0.6 1.8 3.9
Medical services 72.7 2.1 73.5 2.1 76.3 2.1 79.0 2.2 1.0 3.8 3.5
Education services 62.2 1.8 66.5 1.9 70.7 2.0 73.1 2.0 6.9 6.3 3.4Innovation and technology(4) 27.5 0.8 28.8 0.8 29.3 0.8 30.2 0.8 4.9 1.5 3.3Testing and certification services(5) 12.7 0.4 12.4 0.4 13.1 0.4 12.8 0.3 -2.3 5.8 -2.5
Environmental industries 32.4 0.9 36.1 1.0 38.4 1.1 39.5 1.1 11.3 6.3 3.1
Total employment(6) 3 470.3 100.0 3 478.6 100.0 3 579.5 100.0 3 657.1 100.0 0.2 2.9 2.2
Table 5 : Value added and employment statistics of the Four Key Industriesand other selected industries (Cont'd)
2012#Annual percentage
change (%)201120102009

166
($Mn)
2008 2009 2010 2011 2012# 2012 2013
Q4# Q1# Q2# Q3#
Current account(a) 255,808 164,001 124,369 107,513 32,151 12,878 -1,658 -5,325 31,817
Goods 194,753 103,008 25,564 -58,203 -146,729 -23,814 -67,602 -90,627 -17,777
Services -21,041 27,617 78,789 132,681 169,760 41,230 58,065 62,446 54,549
Primary income 100,507 49,762 37,596 52,826 29,455 819 12,577 28,228 368
Secondary income -18,412 -16,386 -17,580 -19,791 -20,336 -5,357 -4,698 -5,372 -5,323
Capital and financial account(a) -254,709 -144,532 -88,838 -113,242 -67,664 -34,487 -12,528 25,953 -8,589
Capital account -1,958 -3,021 -4,436 -2,021 -1,433 -297 -123 -123 -1,280
Financial account -252,750 -141,511 -84,402 -111,220 -66,231 -34,190 -12,405 26,076 -7,309 Financial non-reserve assets -28,774 470,987 -25,257 -24,437 122,658 60,153 3,999 51,508 -36,030
Direct investment 77,371 -28,421 -122,026 1,868 -102,623 -60,969 -91,761 -81,059 11,563
Portfolio investment -281,141 -310,083 -442,460 -10,979 -31,592 -162,984 33,735 -31,658 -123,286
Financial derivatives 63,338 24,560 18,677 20,884 15,208 -1,474 3,914 -7,487 10,598
Other investment 111,659 784,930 520,552 -36,210 241,665 285,580 58,111 171,712 65,095
Reserve assets -223,976 -612,498 -59,145 -86,783 -188,889 -94,343 -16,404 -25,432 28,722
Net errors and omissions -1,099 -19,470 -35,530 5,729 35,513 21,609 14,186 -20,628 -23,227
Overall Balance of Payments 223,976 612,498 59,145 86,783 188,889 94,343 16,404 25,432 -28,722
Table 6 : Balance of Payments by major component(at current prices)
Notes: Individual figures may not add up exactly to the total due to rounding.
(a) In accordance with the accounting rules adopted in compiling Balance of Payments, a positive value for the balance figure in the current account represents a surplus whereas a negative value represents a deficit. In the capital and financial account, a positive value indicates a net financial inflow while a negative value indicates a net outflow. As increases in external assets are debit entries and decreases are credit entries, a negative value for the reserve assets represents a net increase while a positive value represents a net decrease.
(#) Figures are subject to revision later on as more data become available.

167
($Mn)
2009 2010 2011 2012# 2013# 2013
Q1# Q2# Q3# Q4#
Total exports of goods 2,500,143 3,068,444 3,420,076 3,591,776 3,816,411 871,855 929,088 1,000,343 1,015,125
Imports of goods 2,702,966 3,395,057 3,848,200 4,116,410 4,394,928 1,024,117 1,100,267 1,117,381 1,153,163
Visible trade balance -202,823 -326,613 -428,124 -524,634 -578,517 -152,262 -171,179 -117,038 -138,038(-7.5) (-9.6) (-11.1) (-12.7) (-13.2) (-14.9) (-15.6) (-10.5) (-12.0)
Exports of services 672,794 829,044 941,178 1,003,047 1,066,029 256,945 249,898 272,371 286,815
Imports of services 339,346 398,078 438,576 455,382 465,179 114,220 106,900 118,561 125,498
Invisible trade balance 333,448 430,966 502,602 547,665 600,850 142,725 142,998 153,810 161,317(98.3) (108.3) (114.6) (120.3) (129.2) (125.0) (133.8) (129.7) (128.5)
Exports of goods and services 3,172,937 3,897,488 4,361,254 4,594,823 4,882,440 1,128,800 1,178,986 1,272,714 1,301,940Imports of goods and services 3,042,312 3,793,135 4,286,776 4,571,792 4,860,107 1,138,337 1,207,167 1,235,942 1,278,661Visible and invisible trade balance 130,625 104,353 74,478 23,031 22,333 -9,537 -28,181 36,772 23,279
<4.3> <2.8> <1.7> <0.5> <0.5> <-0.8> <-2.3> <3.0> <1.8>
Table 7 : Visible and invisible trade(at current market prices)
Notes: Figures in this table are reckoned on GDP basis and based on the System of National Accounts 2008, other than the change of ownership principle. For figures based on the change of ownership principle, please see Table 7a. For details about the change of ownership principle, please refer to the Special Report on Gross Domestic Product published by the Census and Statistics Department in September 2012.
(#) Figures are subject to revision later on as more data become available.
( ) As a percentage of the total value of imports of goods/services.
< > As a percentage of the total value of imports of goods and services.

168
2009 2010 2011 2012# 2013# 2013
Q1# Q2# Q3# Q4#
At current market prices ($Mn)
Total exports of goods 2,454,394 3,021,492 3,406,765 3,632,957 3,945,186 889,079 944,366 1,043,344 1,068,397
Imports of goods 2,351,386 2,995,928 3,464,968 3,779,686 4,148,437 956,681 1,034,993 1,061,121 1,095,642
Visible trade balance 103,008 25,564 -58,203 -146,729 -203,251 -67,602 -90,627 -17,777 -27,245(4.4) (0.9) (-1.7) (-3.9) (-4.9) (-7.1) (-8.8) (-1.7) (-2.5)
Exports of services 501,303 625,719 710,716 764,026 820,746 202,912 199,040 206,404 212,390
Imports of services 473,686 546,930 578,035 594,266 595,162 144,847 136,594 151,855 161,866
Invisible trade balance 27,617 78,789 132,681 169,760 225,584 58,065 62,446 54,549 50,524(5.8) (14.4) (23.0) (28.6) (37.9) (40.1) (45.7) (35.9) (31.2)
Exports of goods and services 2,955,697 3,647,211 4,117,481 4,396,983 4,765,932 1,091,991 1,143,406 1,249,748 1,280,787
Imports of goods and services 2,825,072 3,542,858 4,043,003 4,373,952 4,743,599 1,101,528 1,171,587 1,212,976 1,257,508
Visible and invisible trade balance 130,625 104,353 74,478 23,031 22,333 -9,537 -28,181 36,772 23,279
<4.6> <2.9> <1.8> <0.5> <0.5> <-0.9> <-2.4> <3.0> <1.9>
Rates of change in real terms (%)
Total exports of goods -11.2 18.0 4.6 3.2 8.9 9.9 8.2 8.9 8.8
Imports of goods -7.0 19.9 6.7 4.6 10.7 11.7 10.3 10.7 10.4
Exports of services 1.7 15.3 5.7 2.7 7.3 5.7 9.7 7.3 6.6
Imports of services -12.9 10.0 -0.2 2.3 -0.6 -1.0 -1.9 -0.4 0.8
Table 7a : Visible and invisible trade based on the change of ownership principle
Notes: Figures in this table are reckoned on GDP basis and based on the System of National Accounts 2008.
Statistics on visible and invisible trade presented in this table provide supplementary information for analysis of international trade in goods and services, compiled using the change of ownership principle in recording goods sent abroad for processing and merchanting under the System of National Accounts 2008. The statistics are consistent with the goods and services statistics in the current account of Hong Kong's Balance of Payments. For details about the change of ownership principle, please refer to the Special Report on Gross Domestic Product published by the Census and Statistics Department in September 2012.
(#) Figures are subject to revision later on as more data become available.
( ) As a percentage of the total value of imports of goods/services.
< > As a percentage of the total value of imports of goods and services.

169
2009 2010 2011 2012 2013Q1 Q2 Q3 Q4
(% change) ($Mn)
All markets -12.6 22.8 10.1 2.9 3.6 3,559,686 4.0 2.4 3.3 4.8
Mainland of China -7.8 26.5 9.3 6.3 4.9 1,949,247 6.3 5.1 3.7 4.8
United States -20.6 16.4 -0.4 2.3 -2.1 331,303 -1.4 -4.8 0.2 -2.6
Japan -10.0 17.2 5.9 6.5 -6.1 135,229 -3.1 -7.5 -8.8 -4.7
India 0.2 42.4 25.6 -17.5 7.9 83,301 3.8 7.1 7.6 13.9
Taiwan -0.4 25.4 24.3 -5.2 -4.3 77,359 19.4 -13.3 -2.1 -14.1
Germany -15.5 1.6 10.7 -12.8 -5.1 73,827 -6.5 -5.7 -0.5 -7.8
Republic of Korea -13.0 24.4 14.2 -4.0 9.0 64,128 2.7 5.8 7.9 19.5
Vietnam 16.6 33.9 37.3 9.9 15.5 58,580 1.5 14.7 25.3 21.4
Singapore -23.6 20.7 10.3 -0.5 4.7 58,580 8.3 3.0 1.3 6.7
United Kingdom -20.8 1.9 -3.4 -6.0 -2.0 54,045 -10.1 -8.9 5.3 3.9
Rest of the world -20.2 20.9 15.1 0.6 5.7 674,087 2.3 3.3 5.4 11.5
Table 8 : Total exports of goods by market(in value terms)
2013
(% change over a year earlier)(% change)
Note: Individual figures may not add up exactly to the total due to rounding.
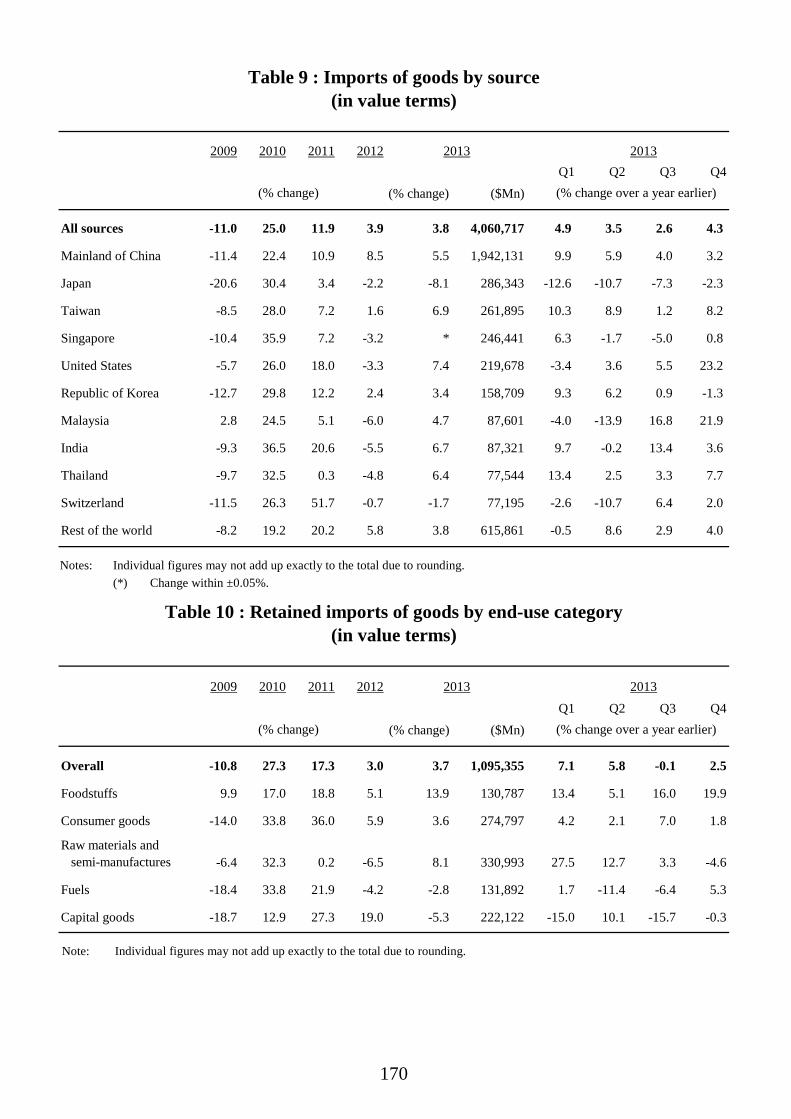
170
2009 2010 2011 2012 2013Q1 Q2 Q3 Q4
(% change) ($Mn)
All sources -11.0 25.0 11.9 3.9 3.8 4,060,717 4.9 3.5 2.6 4.3
Mainland of China -11.4 22.4 10.9 8.5 5.5 1,942,131 9.9 5.9 4.0 3.2
Japan -20.6 30.4 3.4 -2.2 -8.1 286,343 -12.6 -10.7 -7.3 -2.3
Taiwan -8.5 28.0 7.2 1.6 6.9 261,895 10.3 8.9 1.2 8.2
Singapore -10.4 35.9 7.2 -3.2 * 246,441 6.3 -1.7 -5.0 0.8
United States -5.7 26.0 18.0 -3.3 7.4 219,678 -3.4 3.6 5.5 23.2
Republic of Korea -12.7 29.8 12.2 2.4 3.4 158,709 9.3 6.2 0.9 -1.3
Malaysia 2.8 24.5 5.1 -6.0 4.7 87,601 -4.0 -13.9 16.8 21.9
India -9.3 36.5 20.6 -5.5 6.7 87,321 9.7 -0.2 13.4 3.6
Thailand -9.7 32.5 0.3 -4.8 6.4 77,544 13.4 2.5 3.3 7.7
Switzerland -11.5 26.3 51.7 -0.7 -1.7 77,195 -2.6 -10.7 6.4 2.0
Rest of the world -8.2 19.2 20.2 5.8 3.8 615,861 -0.5 8.6 2.9 4.0
2009 2010 2011 2012 2013Q1 Q2 Q3 Q4
(% change) ($Mn)
Overall -10.8 27.3 17.3 3.0 3.7 1,095,355 7.1 5.8 -0.1 2.5
Foodstuffs 9.9 17.0 18.8 5.1 13.9 130,787 13.4 5.1 16.0 19.9
Consumer goods -14.0 33.8 36.0 5.9 3.6 274,797 4.2 2.1 7.0 1.8
Raw materials and semi-manufactures -6.4 32.3 0.2 -6.5 8.1 330,993 27.5 12.7 3.3 -4.6
Fuels -18.4 33.8 21.9 -4.2 -2.8 131,892 1.7 -11.4 -6.4 5.3
Capital goods -18.7 12.9 27.3 19.0 -5.3 222,122 -15.0 10.1 -15.7 -0.3
2013
(% change) (% change over a year earlier)
Table 9 : Imports of goods by source(in value terms)
Table 10 : Retained imports of goods by end-use category(in value terms)
2013
(% change over a year earlier)(% change)
Notes: Individual figures may not add up exactly to the total due to rounding. (*) Change within ±0.05%.
Note: Individual figures may not add up exactly to the total due to rounding.

171
2009 2010 2011 2012# 2013Q1# Q2# Q3# Q4#
(% change) ($Mn)
Exports of services -6.7 23.2 13.5 6.6 6.3 1,066,029 6.2 7.8 6.1 5.2
Transportation -18.6 26.3 7.8 -0.6 -1.4 245,109 -3.0 -6.5 2.1 2.5
Travel 6.7 35.6 28.4 15.8 17.7 302,017 20.2 28.3 15.7 9.2
Trade-related -4.3 18.0 11.0 3.9 2.6 288,559 3.4 2.2 2.0 2.9
Other services -3.1 16.4 10.1 9.0 6.2 230,344 4.4 9.8 5.1 6.3
Imports of services -7.5 17.3 10.2 3.8 2.2 465,179 1.5 -0.5 3.0 4.4
Transportation -21.6 20.7 14.3 2.3 -0.4 142,046 -4.4 -3.7 2.0 4.6
Travel -3.8 11.9 9.8 5.2 4.7 163,014 7.0 0.4 4.1 7.4
Trade-related 0.5 21.6 1.1 1.7 -0.1 33,685 3.4 -1.0 -1.8 -0.7
Other services 5.7 19.5 8.7 4.6 2.5 126,434 1.0 2.8 4.0 2.4
Net exports of services -5.8 29.2 16.6 9.0 9.7 600,850 10.3 15.0 8.6 5.9
(% change over a year earlier)(% change)
Table 11 : Exports and imports of services by component(at current market prices)
2013#
Notes: Individual figures may not add up exactly to the total due to rounding.
Figures are based on the System of National Accounts 2008, other than the change of ownership principle. For figures based on the change of ownership principle, please see Table 11a. For details about the change of ownership principle, please refer to the Special Report on Gross Domestic Product published by the Census and Statistics Department in September 2012.
(#) Figures are subject to revision later on as more data become available.

172
2009 2010 2011 2012# 2013Q1# Q2# Q3# Q4#
(% change) ($Mn)
Exports of services -7.9 24.8 13.6 7.5 7.4 820,746 7.0 9.4 7.4 6.1
Transportation -18.6 26.3 7.8 -0.6 -1.4 245,109 -3.0 -6.5 2.1 2.5
Travel 6.7 35.6 28.4 15.8 17.7 302,017 20.2 28.3 15.7 9.2
Other services -4.6 16.2 8.1 8.3 5.6 273,620 4.3 8.6 4.5 5.7
Imports of services -16.2 15.5 5.7 2.8 0.2 595,162 -0.2 -1.5 0.3 1.8
Transportation -21.6 20.7 14.3 2.3 -0.4 142,046 -4.4 -3.7 2.0 4.6
Travel -3.8 11.9 9.8 5.2 4.7 163,014 7.0 0.4 4.1 7.4
Other services -19.0 15.1 0.1 1.9 -2.0 290,102 -1.8 -1.4 -2.7 -1.9
(% change)
Table 11a: Exports and imports of services based on the change of ownershipprinciple by component (at current market prices)
2013#
(% change over a year earlier)
Notes: Individual figures may not add up exactly to the total due to rounding.
Statistics on exports and imports of services presented in this table provide supplementary information for analysis of international trade in goods and services, compiled using the change of ownership principle in recording goods sent abroad for processing and merchanting under the System of National Accounts 2008. The statistics are consistent with the goods and services statistics in the current account of Hong Kong's Balance of Payments. For details about the change of ownership principle, please refer to the Special Report on Gross Domestic Product published by the Census and Statistics Department in September 2012.
(#) Figures are subject to revision later on as more data become available.

173
2009 2010 2011 2012 2013 2013Q1 Q2 Q3 Q4
('000)
All sources 29 590.7 36 030.3 41 921.3 48 615.1 54 298.8 12 742.3 12 623.5 14 498.9 14 434.0
Mainland of China 17 956.7 22 684.4 28 100.1 34 911.4 40 745.3 9 500.6 9 314.6 11 286.0 10 644.1
South and Southeast Asia 2 885.2 3 500.9 3 751.1 3 651.8 3 718.0 818.6 972.2 810.7 1 116.4
Taiwan 2 009.6 2 164.8 2 148.7 2 088.7 2 100.1 515.1 488.7 566.5 529.8
Europe 1 610.5 1 757.8 1 801.3 1 867.7 1 893.7 483.1 461.0 406.0 543.6
United States 1 070.1 1 171.4 1 212.3 1 184.8 1 109.8 270.3 285.0 245.8 308.8
Japan 1 204.5 1 316.6 1 283.7 1 254.6 1 057.0 267.3 237.2 271.1 281.5
Others 2 854.0 3 434.5 3 623.9 3 656.1 3 674.9 887.3 864.8 912.9 1 009.9
(% change over a year earlier)
All sources 0.3 21.8 16.4 16.0 11.7 13.5 13.7 11.1 9.0
Mainland of China 6.5 26.3 23.9 24.2 16.7 20.3 21.2 15.8 11.1
South and Southeast Asia -1.7 21.3 7.1 -2.6 1.8 0.3 -1.3 0.8 6.7
Taiwan -10.3 7.7 -0.7 -2.8 0.5 3.9 -1.8 -0.6 0.9
Europe -5.9 9.1 2.5 3.7 1.4 -0.1 4.0 -0.2 1.7
United States -6.7 9.5 3.5 -2.3 -6.3 -4.9 -9.6 -9.1 -1.9
Japan -9.1 9.3 -2.5 -2.3 -15.7 -22.3 -22.2 -21.8 8.6
Others -13.1 20.3 5.5 0.9 0.5 -1.8 -0.2 0.1 3.7
Table 12 : Incoming visitors by source
Note: Individual figures may not add up exactly to the total due to rounding.

174
2004 2005 2006 2007 2008 2009 2010
Residential property(a) (in units) 26 036 17 321 16 579 10 471 8 776 7 157 13 405Commercial property 371 145 291 368 390 235 189
of which :Office space 279 34 108 320 341 151 124Other commercial premises(b) 91 111 183 48 49 84 65
Industrial property(c) 1 17 27 16 78 3 21of which :Industrial-cum-office premises 0 4 0 0 4 0 0Conventional flatted factory space 1 0 0 16 70 3 21Storage premises(d) 0 13 27 0 4 0 0
Production of public housing(in units)Rental housing flats(e) 20 614 24 691 4 430 4 795 22 759 19 021 6 385Subsidised sales flats(e) 0 0 0 2 010 2 200 370 1 110
Residential property 530.0 550.7 706.7 900.0 530.0 546.8 570.5Commercial property 161.3 481.9 468.4 327.5 147.7 178.3 158.4Industrial property(f) 16.4 35.1 23.9 103.5 106.6 97.1 34.3Other properties 407.1 408.0 199.2 207.7 212.8 253.2 459.2Total 1 114.8 1 475.8 1 398.2 1 538.6 997.1 1 075.4 1 222.4
Residential property(g) 100 630 103 362 82 472 123 575 95 931 115 092 135 778Primary market 25 694 15 994 13 986 20 123 11 046 16 161 13 646Secondary market 74 936 87 368 68 486 103 452 84 885 98 931 122 132
Selected types of non-residential properties(h)
Office space 3 213 3 431 2 874 4 129 2 845 2 521 3 591Other commerical premises 7 833 7 143 4 402 5 490 4 149 5 359 7 639Flatted factory space 5 889 6 560 7 409 9 072 5 741 5 554 8 206
Table 13 : Property market
Completion of new property by the private sector('000 m2 of internal floor area)
Building plans with consent to commence work in the private sector('000 m2 of usable floor area)
Agreements for sale and purchase of property(Number)
Notes: Individual figures may not add up exactly to the total due to rounding. (a) Figures before 2002 cover all completed residential premises to which either temporary or full Occupation Permits
have been granted, as well as village type houses issued with Letters of Compliance. Property developments subject to a Consent Scheme need a Certificate of Compliance, Consent to Assign or Consent to Lease in addition to an Occupation Permit before the premises can be individually assigned. Village-type housing units are excluded as from 2002 and units issued with temporary Occupation Permits are also excluded as from 2004 onwards.
Residential premises here pertain to private residential units, excluding units built under the Private Sector Participation Scheme (PSPS), Home Ownership Scheme (HOS), Buy or Rent Option, Mortgage Subsidy Scheme, Sandwich Class Housing Scheme, Urban Improvement Scheme (UIS) and Flat-for-Sale Scheme. Figures from 2004 onwards also cover those private flats converted from subsidised flats.
(b) These include retail premises and other premises designed or adapted for commercial use, with the exception of purpose-built offices. Car-parking space and commercial premises built by the Hong Kong Housing Authority and the Hong Kong Housing Society are excluded.
(c) These include industrial-cum-office premises, but exclude specialised factory buildings which are developed mainly for own use.
(d) These include storage premises at the container terminals and the airport.

175
2011 2012 2013 2013Q1 Q2 Q3 Q4
Residential property(a) (in units) 9 449 10 149 8 254 236 1 249 2 951 3 818Commercial property 197 226 161 5 28 66 62
of which :Office space 155 136 123 1 19 56 47Other commercial premises(b) 42 90 39 4 9 11 16
Industrial property(c) 105 170 85 0 0 81 4of which :Industrial-cum-office premises 0 0 0 0 0 0 0Conventional flatted factory space 32 46 85 0 0 81 4Storage premises(d) 73 123 0 0 0 0 0
Production of public housing(in units)Rental housing flats(e) 17 787 9 778 20 898 10 407 0 7 942 2 549Subsidised sales flats(e) 0 0 0 0 0 0 0
Residential property 580.6 796.4 816.0 149.8 214.5 154.1 297.7Commercial property 133.6 210.2 309.5 48.3 56.8 90.5 114.0Industrial property(f) 109.3 70.7 138.1 90.4 5.1 17.6 25.0Other properties 232.7 428.9 136.4 11.5 12.1 7.2 105.7Total 1 056.2 1 506.1 1 400.1 299.9 288.4 269.4 542.3
Residential property(g) 84 462 81 333 50 676 16 271 11 443 11 079 11 883Primary market 10 880 12 968 11 046 2 924 2 508 1 628 3 986Secondary market 73 582 68 365 39 630 13 347 8 935 9 451 7 897
Selected types of non-residential properties(h)
Office space 3 071 3 269 1 698 869 280 279 270Other commerical premises 5 980 7 282 4 284 2 208 693 584 799Flatted factory space 7 619 9 731 4 267 2 265 690 695 617
Table 13 : Property market (Cont'd)
Completion of new property by the private sector('000 m2 of internal floor area)
Building plans with consent to commence work in the private sector('000 m2 of usable floor area)
Agreements for sale and purchase of property(Number)
Notes: (e) The series, sourced from the Housing Authority's housing production figures, exhaustively cover all housing production (cont'd) and to count projects (including surplus HOS projects) which undergo transfer of usage at the time of disposal and
according to their actual usage. Moreover, surplus HOS courts and blocks pending disposal are excluded from production statistics until they are disposed. Rental and sales flats projects of the Housing Society are included.
(f) These include multi-purpose industrial premises designed also for office use. (g) The figures are derived from sale and purchase agreements of domestic units received for registration for the relevant
periods. They generally relate to transactions executed up to four weeks prior to their submission for registration. Sales of domestic units refer to sale and purchase agreements with payment of stamp duty. These statistics do not include sales of units under the Home Ownership Scheme, the Private Sector Participation Scheme and the Tenants Purchase Scheme except those after payment of premium. Primary sales generally refer to sales from developers. Secondary sales refer to sales from parties other than developers.
(h) Timing of the figures for non-residential properties is based on the date on which the S&P Agreement is signed, which may differ from the date on which the Agreement is received for registration.

176
2004 2005 2006 2007 2008 2009 2010
(Index (1999=100))
Property price indices :
Residential flats(a) 78.0 92.0 92.7 103.5 120.5 121.3 150.9
Office space 99.3 133.0 139.3 165.5 199.0 179.8 230.4
Shopping space 119.3 149.3 153.5 172.5 192.2 193.1 257.2
Flatted factory space 88.6 125.0 158.5 199.5 235.9 216.3 284.4
Property rental indices(b) :
Residential flats 77.7 86.5 91.6 101.8 115.7 100.4 119.7
Office space 78.1 96.4 117.4 131.9 155.5 135.7 147.6
Shopping space 92.8 100.5 104.3 111.8 116.2 110.9 122.9
Flatted factory space 77.3 82.6 91.0 100.5 109.3 99.4 108.9
(% change)
Property price indices :
Residential flats(a) 26.6 17.9 0.8 11.7 16.4 0.7 24.4
Office space 58.9 33.9 4.7 18.8 20.2 -9.6 28.1
Shopping space 39.5 25.1 2.8 12.4 11.4 0.5 33.2
Flatted factory space 23.6 41.1 26.8 25.9 18.2 -8.3 31.5
Property rental indices(b) :
Residential flats 5.6 11.3 5.9 11.1 13.7 -13.2 19.2
Office space 4.7 23.4 21.8 12.4 17.9 -12.7 8.8
Shopping space 7.4 8.3 3.8 7.2 3.9 -4.6 10.8
Flatted factory space 3.2 6.9 10.2 10.4 8.8 -9.1 9.6
Table 14 : Property prices and rentals
Notes: (a) Figures pertain to prices of existing flats traded in the secondary market, but not new flats sold in the primary market.
(b) All rental indices shown in this table have been adjusted for concessionary leasing terms such as provision of refurbishment, granting of rent-free periods, and waiver of miscellaneous charges, if known.
For residential property, changes in rentals cover only new tenancies for which rentals are freshly determined. For non-residential property, changes in rentals cover also lease renewals upon which rentals may be revised.
(#) Figures for non-residential property are provisional.
(+) Provisional figures.

177
2011 2012 2013 2013Q1 Q2 Q3# Q4+
(Index (1999=100))
Property price indices :
Residential flats(a) 182.1 206.2 242.4 237.5 241.2 245.6 245.2
Office space 297.9 334.7 409.9 400.3 409.6 415.9 414.0
Shopping space 327.4 420.5 506.3 501.3 509.0 510.5 504.3
Flatted factory space 385.0 489.8 655.8 636.7 657.8 671.3 657.3
Property rental indices(b) :
Residential flats 134.0 142.6 154.5 151.7 153.5 155.8 156.9
Office space 169.9 188.3 203.9 196.9 203.5 207.9 207.1
Shopping space 134.3 151.3 165.4 160.4 165.7 168.1 167.3
Flatted factory space 118.6 131.9 147.1 140.5 146.1 150.6 151.1
(% change over a year earlier)
Property price indices :
Residential flats(a) 20.7 13.2 17.6 28.2 19.2 16.1 8.6
Office space 29.3 12.4 22.5 32.5 26.9 21.6 11.4
Shopping space 27.3 28.4 20.4 38.0 26.6 16.2 5.6
Flatted factory space 35.4 27.2 33.9 52.1 42.6 31.8 15.3
Property rental indices(b) :
Residential flats 11.9 6.4 8.3 13.5 9.9 6.6 4.1
Office space 15.1 10.8 8.3 7.8 9.1 9.0 7.2
Shopping space 9.3 12.7 9.3 11.9 10.5 8.9 6.1
Flatted factory space 8.9 11.2 11.5 12.3 11.1 12.5 10.2
Table 14 : Property prices and rentals (Cont'd)

178
2004 2005 2006 2007 2008 2009 2010
(as at end of period)Hong Kong dollar money supply ($Mn)
M1 412,629 348,248 387,909 454,342 491,115 671,241 730,093M2(a) 2,208,591 2,329,669 2,777,679 3,281,017 3,239,857 3,587,717 3,866,788M3(a) 2,219,557 2,345,838 2,795,545 3,300,500 3,261,306 3,604,843 3,878,193
Total money supply ($Mn)M1 484,494 434,684 491,648 616,709 645,833 901,819 1,017,227M2 4,166,706 4,379,057 5,054,332 6,106,348 6,268,058 6,602,310 7,136,271M3 4,189,544 4,407,188 5,089,741 6,139,758 6,300,751 6,626,843 7,156,260
Deposit ($Mn)HK$ 2,017,911 2,131,579 2,568,283 3,075,042 3,033,980 3,373,595 3,617,183Foreign currency 1,848,145 1,936,322 2,188,993 2,793,856 3,024,004 3,007,445 3,245,081Total 3,866,056 4,067,901 4,757,275 5,868,898 6,057,984 6,381,040 6,862,265
Loans and advances ($Mn)HK$ 1,666,740 1,797,350 1,917,437 2,184,705 2,354,755 2,401,323 2,824,445Foreign currency 488,964 514,637 550,392 776,971 930,883 887,160 1,403,281Total 2,155,704 2,311,987 2,467,828 2,961,676 3,285,638 3,288,483 4,227,726
Trade-weighted 113.6 112.6 111.1 106.3 100.7 101.9 99.5Import-weighted 115.4 114.1 112.6 107.6 101.3 102.2 99.2Export-weighted 111.7 110.9 109.6 104.8 100.1 101.6 99.8
(% change)Hong Kong dollar money supply
M1 16.3 -15.6 11.4 17.1 8.1 36.7 8.8M2(a) 4.8 5.5 19.2 18.1 -1.3 10.7 7.8M3(a) 4.6 5.7 19.2 18.1 -1.2 10.5 7.6
Total money supplyM1 17.2 -10.3 13.1 25.4 4.7 39.6 12.8M2 9.3 5.1 15.4 20.8 2.6 5.3 8.1M3 8.6 5.2 15.5 20.6 2.6 5.2 8.0
DepositHK$ 4.5 5.6 20.5 19.7 -1.3 11.2 7.2Foreign currency 13.0 4.8 13.0 27.6 8.2 -0.5 7.9Total 8.4 5.2 16.9 23.4 3.2 5.3 7.5
Loans and advancesHK$ 6.0 7.8 6.7 13.9 7.8 2.0 17.6Foreign currency 5.8 5.3 6.9 41.2 19.8 -4.7 58.2Total 5.9 7.2 6.7 20.0 10.9 0.1 28.6
Trade-weighted -2.4 -0.9 -1.3 -4.3 -5.3 1.2 -2.4Import-weighted -2.4 -1.1 -1.3 -4.4 -5.9 0.9 -2.9Export-weighted -2.4 -0.7 -1.2 -4.4 -4.5 1.5 -1.8
Table 15 : Monetary aggregates
Nominal Effective Exchange Rate Indices(Jan 2010 =100)(b)
Nominal Effective Exchange Rate Indices(Jan 2010 =100)(b)
Definition of Terms : The Hong Kong Dollar Money Supply is the Hong Kong dollar component of the respective monetary aggregate.
Total Money Supply: M1: Legal tender notes and coins with the public, plus customers’ demand deposits with licensed banks.
M2: M1 plus customers’ savings and time deposits with licensed banks, plus negotiable certificates of deposit issued by licensed banks and held outside the monetary sector.
M3: M2 plus customers’ deposits with restricted licence banks and deposit-taking companies, plus negotiable certificates of deposit issued by such institutions and held outside the monetary sector.
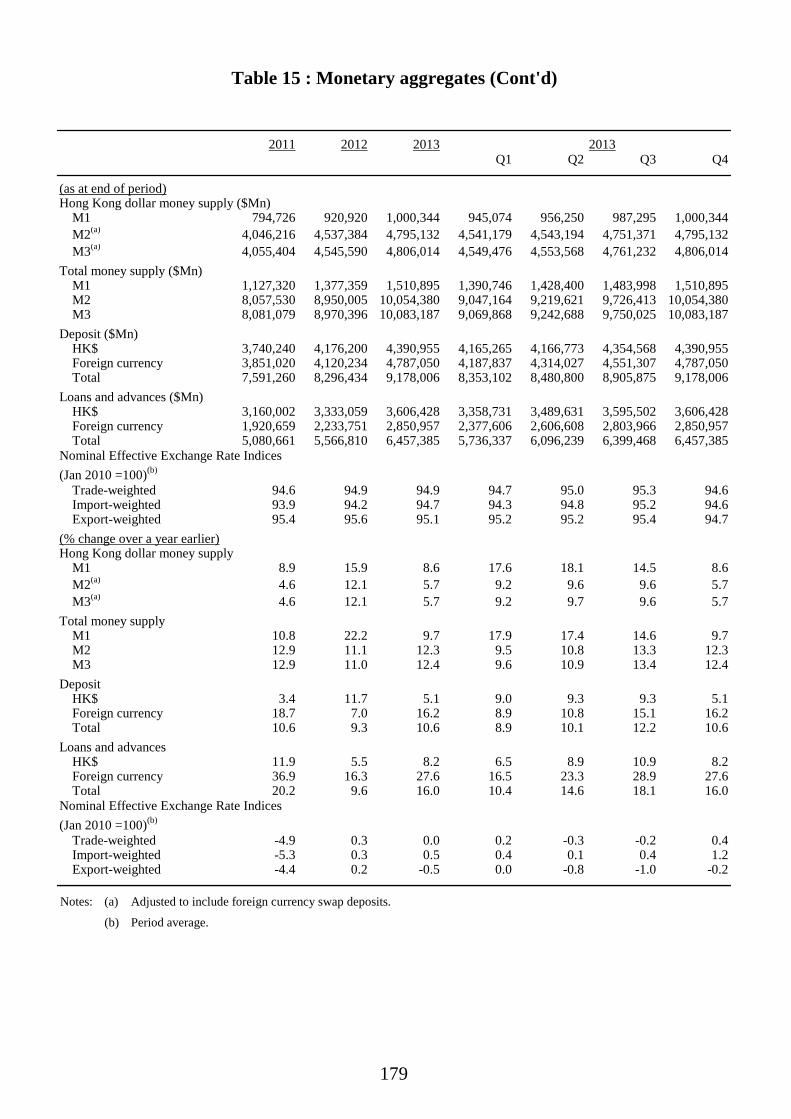
179
2011 2012 2013 2013Q1 Q2 Q3 Q4
(as at end of period)Hong Kong dollar money supply ($Mn)
M1 794,726 920,920 1,000,344 945,074 956,250 987,295 1,000,344M2(a) 4,046,216 4,537,384 4,795,132 4,541,179 4,543,194 4,751,371 4,795,132M3(a) 4,055,404 4,545,590 4,806,014 4,549,476 4,553,568 4,761,232 4,806,014
Total money supply ($Mn)M1 1,127,320 1,377,359 1,510,895 1,390,746 1,428,400 1,483,998 1,510,895M2 8,057,530 8,950,005 10,054,380 9,047,164 9,219,621 9,726,413 10,054,380M3 8,081,079 8,970,396 10,083,187 9,069,868 9,242,688 9,750,025 10,083,187
Deposit ($Mn)HK$ 3,740,240 4,176,200 4,390,955 4,165,265 4,166,773 4,354,568 4,390,955Foreign currency 3,851,020 4,120,234 4,787,050 4,187,837 4,314,027 4,551,307 4,787,050Total 7,591,260 8,296,434 9,178,006 8,353,102 8,480,800 8,905,875 9,178,006
Loans and advances ($Mn)HK$ 3,160,002 3,333,059 3,606,428 3,358,731 3,489,631 3,595,502 3,606,428Foreign currency 1,920,659 2,233,751 2,850,957 2,377,606 2,606,608 2,803,966 2,850,957Total 5,080,661 5,566,810 6,457,385 5,736,337 6,096,239 6,399,468 6,457,385
Trade-weighted 94.6 94.9 94.9 94.7 95.0 95.3 94.6Import-weighted 93.9 94.2 94.7 94.3 94.8 95.2 94.6Export-weighted 95.4 95.6 95.1 95.2 95.2 95.4 94.7
(% change over a year earlier)Hong Kong dollar money supply
M1 8.9 15.9 8.6 17.6 18.1 14.5 8.6M2(a) 4.6 12.1 5.7 9.2 9.6 9.6 5.7M3(a) 4.6 12.1 5.7 9.2 9.7 9.6 5.7
Total money supplyM1 10.8 22.2 9.7 17.9 17.4 14.6 9.7M2 12.9 11.1 12.3 9.5 10.8 13.3 12.3M3 12.9 11.0 12.4 9.6 10.9 13.4 12.4
DepositHK$ 3.4 11.7 5.1 9.0 9.3 9.3 5.1Foreign currency 18.7 7.0 16.2 8.9 10.8 15.1 16.2Total 10.6 9.3 10.6 8.9 10.1 12.2 10.6
Loans and advancesHK$ 11.9 5.5 8.2 6.5 8.9 10.9 8.2Foreign currency 36.9 16.3 27.6 16.5 23.3 28.9 27.6Total 20.2 9.6 16.0 10.4 14.6 18.1 16.0
Trade-weighted -4.9 0.3 0.0 0.2 -0.3 -0.2 0.4Import-weighted -5.3 0.3 0.5 0.4 0.1 0.4 1.2Export-weighted -4.4 0.2 -0.5 0.0 -0.8 -1.0 -0.2
Table 15 : Monetary aggregates (Cont'd)
Nominal Effective Exchange Rate Indices(Jan 2010 =100)(b)
Nominal Effective Exchange Rate Indices(Jan 2010 =100)(b)
Notes: (a) Adjusted to include foreign currency swap deposits.
(b) Period average.

180
Table 16 : Rates of change in business receipts indices forservices industries/domains
(%)
2009 2010 2011 2012 2012 2013
Q4 Q1 Q2 Q3
Services Industry
Import and export trade -13.7 19.7 8.9 -1.3 5.7 0.6 * 0.2
Wholesale -12.6 25.0 12.7 3.2 4.7 6.3 2.3 3.4
Retail 0.6 18.3 24.9 9.8 7.6 13.9 16.1 7.5
Transportation -19.9 24.5 4.4 0.9 3.1 1.2 0.1 -0.3within which :Land transport -2.6 6.0 7.0 11.9 11.0 7.6 6.3 6.6Water transport -24.1 20.5 0.6 -2.4 4.5 2.3 -3.9 -7.1Air transport -21.0 33.7 6.7 0.3 * -1.2 1.2 2.7
Warehousing and storage 1.4 9.5 9.4 25.2 16.3 1.4 0.9 14.4
Courier -6.1 28.3 17.3 16.1 27.5 16.4 14.7 53.0
Accommodation services(a) -17.4 25.3 19.6 13.8 13.3 11.3 6.8 2.6
Food services 0.6 5.1 6.4 5.0 5.2 3.7 4.6 3.8
Information and communications -3.2 4.9 8.8 9.3 13.0 7.0 8.2 6.7within which :Telecommunications 1.4 3.0 8.1 14.7 26.3 9.6 8.3 11.1Film entertainment -12.6 -6.4 -5.6 1.9 1.1 -8.1 4.2 -5.2
Banking 1.5 8.8 10.8 9.4 6.8 17.8 14.2 16.8
Financing (except banking) -10.3 16.7 -2.4 1.6 10.9 0.2 7.1 10.5within which :Financial markets and asset management -11.7 15.3 -3.2 1.7 13.0 -2.0 6.7 9.9
within which : Asset management -12.1 28.4 10.6 -5.4 2.0 6.8 20.1 13.1
Insurance 0.7 8.3 9.4 13.6 15.0 13.6 12.1 16.0
Real estate 9.7 11.4 -0.9 11.8 11.5 5.7 -2.3 -10.6
Professional, scientific and technical services -0.5 13.9 7.3 -0.5 0.4 4.1 10.8 6.7
Administrative and support services -12.4 12.3 10.2 8.2 7.5 7.1 11.2 10.8
Services Domain
Tourism, convention and exhibition services 3.2 30.6 20.6 14.8 15.4 15.2+ 28.2+ 15.1+
Computer and information technology services -15.0 32.5 10.4 15.1 9.7 4.6 2.7 0.4
Notes: Upon the implementation of the new HSIC Version 2.0 by the C&SD in October 2008, the new classification has been adopted in compiling the quarterly business receipts indices. Starting from the first quarter of 2009, all business receipts indices are compiled based on the HSIC Version 2.0, and the base period of the indices has been changed to 2008 (i.e. with the quarterly average of the indices in 2008 taken as 100). The series of business receipts indices under the HSIC Version 2.0 has also been backcasted to the first quarter of 2005.
(a) Accommodation services covers hotels, guesthouses, boarding houses and other establishments providing short term accommodation.
(*) Change within ±0.05%.
(+) Provisional figures.

181
2009 2010 2011 2012 2013 2013
Q1 Q2 Q3 Q4
(%)Labour force participation rate 60.8 59.6 60.1 60.5 61.4 61.2 61.5 61.5 61.2
Seasonally adjusted unemployment rate 5.3 4.3 3.4 3.3 3.3 3.5 3.3 3.3 3.2
Underemployment rate 2.3 2.0 1.7 1.5 1.5 1.6 1.6 1.5 1.4
('000)Population of working age 6 022.9 6 093.8 6 164.4 6 253.4 6 313.3 6 299.7 6 305.1 6 314.7 6 333.8
Labour force 3 660.3 3 631.3 3 703.1 3 785.2 3 873.3 3 852.7 3 877.2 3 884.3 3 878.8
Persons employed 3 467.6 3 474.1 3 576.4 3 660.7 3 744.0 3 720.2 3 745.1 3 750.1 3 760.4
Persons unemployed 192.6 157.2 126.7 124.5 129.3 132.5 132.1 134.2 118.4
Persons underemployed 83.8 72.5 63.3 57.6 58.7 61.1 61.4 57.0 55.5
(% change over a year earlier)Population of working age 0.8 1.2 1.2 1.4 1.0 1.2 0.9 0.8 0.8
Labour force 0.6 -0.8 2.0 2.2 2.3 2.4 2.5 2.7 2.2
Persons employed -1.2 0.2 2.9 2.4 2.3 2.2 2.4 2.7 2.2
Persons unemployed 50.4 -18.4 -19.4 -1.8 3.9 7.6 4.5 1.9 1.4
Persons underemployed 23.4 -13.5 -12.7 -9.0 2.0 4.2 12.7 -3.9 -0.7
Table 17 : Labour force characteristics

182
2008 2009 2010 2011 2012 2012 2013Dec Mar Jun
Selected major industries (No.)
Manufacturing -3.5 -5.7 -4.5 -5.6 -5.1 -4.6 -3.7 -4.0 -2.7 103 914
Construction sites (manual workers only) -1.5 2.2 9.6 13.2 13.8 1.7 10.1 15.1 6.3 76 804
Import and export trade -0.3 -4.4 0.9 -0.3 -1.1 -0.9 0.4 -0.4 -0.4 489 576
Wholesale -2.7 -2.0 1.2 * -0.6 -0.6 -1.5 -2.8 -2.5 62 052
Retail 2.8 -0.3 3.3 4.0 2.5 2.1 2.3 2.1 1.9 264 751
Food and beverage services 1.8 * 3.7 6.6 1.6 2.0 2.1 1.0 0.2 236 714
Accommodation services(a) 3.1 -1.0 1.5 5.8 9.2 9.2 4.6 4.5 4.4 39 181
Transportation, storage, postal and courier services 3.5 1.1 1.5 2.0 1.8 1.1 1.5 1.6 2.5 170 988
Information and communications 3.6 -1.6 1.3 3.4 5.6 4.2 3.3 5.4 5.2 102 577
Financing and insurance 5.6 -0.5 4.8 6.3 1.9 0.2 -1.1 0.2 2.1 210 930
Real estate 2.7 0.5 4.1 8.0 4.2 3.0 4.0 1.7 0.3 126 041
Professional and business services (excluding cleaning and similar services) 3.4 0.9 2.2 4.2 3.4 2.6 3.6 4.0 4.6 269 168
Cleaning and similar services -1.7 6.7 13.7 9.5 3.3 2.8 2.9 1.2 0.7 79 097
Education 4.8 5.3 3.4 1.5 2.4 2.5 3.1 2.7 3.0 177 137
Human health services 5.1 3.8 3.0 4.1 4.9 5.0 5.1 5.4 5.4 107 595
Residential care and social work services 1.3 1.5 1.8 1.3 2.0 2.9 2.0 0.4 * 58 443
Arts, entertainment, recreation and other services 1.9 0.8 5.0 2.8 0.6 1.5 2.2 0.1 1.9 120 581
Civil Service(b) 0.1 1.1 0.5 0.7 1.1 0.7 0.9 1.1 1.5 161 541
Others(c) 7.0 -1.0 3.1 -0.6 -5.1 -3.2 -0.4 2.5 5.3 10 912
Table 18 : Employment in selected major industries
(% change over a year earlier)Sep
(% change)
Notes: Starting from March 2009, the survey coverage has been expanded to include more economic activities in some of the industries due to the change in industrial classification based on the Hong Kong Standard Industrial Classification Version 2.0. The activities newly covered are in the industries of transportation, storage, postal and courier services; professional and business services; and arts, entertainment, recreation and other services. The series of employment statistics under the HSIC Version 2.0 has also been backcasted to March 2000.
(a) Accommodation services covers hotels, guesthouses, boarding houses and other establishments providing short term accommodation.
(b) These figures cover only those employed on civil service terms of appointment. Judges, judicial officers, ICAC officers, locally engaged staff working in the Hong Kong Economic and Trade Offices outside Hong Kong, and other government employees such as non-civil service contract staff are not included.
(c) Include employment in mining and quarrying; and in electricity and gas supply, and waste management.
(*) Change within ±0.05%.

183
2008 2009 2010 2011 2012 2012 2013Dec Mar Jun Sep
(Number)
Building sites
Private sector 28 899 28 776 28 620 31 780 37 687 36 461 39 845 43 217 39 450
Public sector(a) 8 136 10 277 11 463 12 335 10 578 10 579 11 744 10 701 8 508
Sub-total 37 034 39 053 40 083 44 115 48 265 47 040 51 589 53 918 47 958
Civil engineering sites
Private sector 1 686 1 618 1 544 1 250 1 410 1 359 1 055 1 149 1 504
Public sector(a) 10 703 9 831 13 714 17 270 21 621 22 179 25 159 27 475 27 342
Sub-total 12 388 11 449 15 258 18 520 23 030 23 538 26 214 28 624 28 846
Total 49 422 50 501 55 341 62 635 71 295 70 578 77 803 82 542 76 804
(% change over a year earlier)
Building sites
Private sector -1.2 -0.4 -0.5 11.0 18.6 -2.5 5.8 10.1 5.6
Public sector(a) 4.7 26.3 11.5 7.6 -14.2 -5.4 8.6 11.3 -24.8
Sub-total 0.1 5.5 2.6 10.1 9.4 -3.1 6.5 10.3 -1.5
Civil engineering sites
Private sector 0.7 -4.0 -4.6 -19.0 12.8 -6.7 -23.1 -19.9 2.1
Public sector(a) -7.0 -8.1 39.5 25.9 25.2 14.5 20.9 28.3 23.8
Sub-total -6.0 -7.6 33.3 21.4 24.4 13.0 18.2 25.3 22.5
Total -1.5 2.2 9.6 13.2 13.8 1.7 10.1 15.1 6.3
Table 19 : Number of workers engaged at building and construction sites
Notes: Individual figures may not add up exactly to the total due to rounding.
(a) Including the Mass Transit Railway Corporation Limited and the Airport Authority Hong Kong.

184
(%)
2008 2009 2010 2011 2012 2012 2013
Selected industry section Q4 Q1 Q2 Q3
(in nominal terms)Manufacturing 0.9 -3.5 2.6 7.2 8.6 5.9 2.1 3.1 3.1Sewerage, waste management and remediation activities -8.6 2.1 -0.1 5.6 4.5 2.1 3.5 6.3 7.8Import/export and wholesale trade 6.3 -1.6 2.6 12.9 4.4 6.1 3.2 0.4 5.8Retail trade 8.1 -1.5 3.9 12.3 10.1 9.9 4.9 8.0 6.9Transportation, storage, postal and courier services -0.6 -0.2 3.4 4.0 1.7 5.8 4.6 5.7 4.9Accommodation(a) and food service activities 2.6 -0.6 3.3 9.7 6.0 5.9 4.7 7.6 7.7Information and communications 6.6 0.2 2.6 7.4 8.3 7.1 4.4 5.0 5.6Financial and insurance activities 9.0 -3.3 7.2 11.5 4.4 3.8 6.4 3.4 3.0Real estate activities 8.0 -2.4 1.3 11.4 7.5 6.1 4.5 6.4 7.5Professional and business services 3.5 0.6 2.4 2.0 4.9 4.0 4.8 7.4 8.0Social and personal services 3.1 1.7 -2.4 3.1 7.4 5.2 5.8 4.1 2.0
All industries surveyed 2.6 0.5 2.4 7.9 6.5 5.9 5.2 5.0 5.9
(in real terms)Manufacturing -3.3 -4.1 0.3 1.9 4.4 2.1 -1.4 -0.8 -2.1Sewerage, waste management and remediation activities -12.3 1.5 -2.3 0.3 0.5 -1.6 -0.1 2.3 2.3Import/export and wholesale trade 1.9 -2.3 0.2 7.2 0.3 2.2 -0.4 -3.5 0.4Retail trade 3.6 -2.1 1.6 6.7 5.8 5.9 1.3 3.8 1.5Transportation, storage, postal and courier services -4.7 -0.8 1.1 -1.2 -2.3 2.0 0.9 1.7 -0.5Accommodation(a) and food service activities -1.7 -1.2 1.0 4.2 1.8 2.1 1.0 3.5 2.2Information and communications 2.2 -0.4 0.3 2.0 4.1 3.2 0.8 1.0 0.2Financial and insurance activities 4.6 -3.9 4.8 6.0 0.3 * 2.7 -0.6 -2.3Real estate activities 3.5 -3.0 -1.0 5.8 3.3 2.2 0.9 2.4 2.0Professional and business services -0.7 * 0.1 -3.1 0.8 0.3 1.1 3.3 2.4Social and personal services -1.2 1.1 -4.6 -2.1 3.3 1.4 2.1 0.1 -3.2
All industries surveyed -1.7 -0.1 0.1 2.5 2.3 2.0 1.5 1.0 0.5
Table 20 : Rates of change in indices of payroll per person engagedby selected industry section
Notes: The rates of change in real terms are compiled from the Real Indices of Payroll per Person Engaged. The Indices are derived by deflating the Nominal Indices of Payroll per Person Engaged by the 2009/10-based Composite CPI.
Upon the implementation of the new Hong Kong Standard Industrial Classification Version 2.0 (HSIC V2.0) by the C&SD in October 2008, the new classification has been adopted in compiling the payroll statistics. Starting from the first quarter of 2009, all the payroll statistics, unless otherwise specified, are compiled based on the HSIC V2.0. The series of payroll indices under HSIC V2.0 has also been backcasted to the first quarter of 2004.
(a) Accommodation services covers hotels, guesthouses, boarding houses and other establishments providing short term accommodation.
(*) Change within ±0.05%.

185
(%)
2008 2009 2010 2011 2012 2012 2013
Dec Mar Jun Sep
(in nominal terms)Manufacturing 2.6 -1.2 -1.0 6.7 4.3 1.6 2.4 6.5 5.1Import/export, wholesale and retail trades(a) 3.6 -1.1 2.6 7.8 4.5 3.7 3.6 3.0 3.4
within which :Import/export and wholesale trades 3.1 -1.2 2.7 8.3 4.8 -- 3.8 -- 3.6Retail trade 4.9 -0.2 1.1 -0.3 2.1 -- 2.1 -- 3.8
Transportation 1.8 * 1.1 4.0 3.4 2.9 3.6 3.7 3.9Accommodation(b) and food service activities
3.1 -2.3 2.5 9.3 8.0 8.4 6.9 7.2 5.5
Financial and insurance activities(c) 2.8 -0.5 3.0 6.7 4.3 6.1 5.3 5.1 4.0Real estate leasing and maintenance management 2.7 -0.4 2.6 8.6 8.0 7.1 5.8 9.2 9.4Professional and business services 4.9 0.8 3.4 12.6 6.8 3.7 3.3 5.8 6.1Personal services 0.5 -0.7 3.4 9.6 9.7 8.4 7.3 6.9 5.4All industries surveyed 3.4 -0.9 2.4 8.1 5.7 5.1 4.7 5.2 4.8
(in real terms)Manufacturing -0.1 -1.8 -3.7 1.3 0.3 -2.5 -1.5 1.8 *Import/export, wholesale and retail trades(a) 0.9 -1.7 -0.2 2.4 0.5 -0.5 -0.4 -1.6 -1.6
within which :Import/export and wholesale trades 0.4 -1.7 -0.1 2.8 0.7 -- -0.2 -- -1.4Retail trade 2.2 -0.7 -1.6 -5.3 -1.8 -- -1.8 -- -1.3
Transportation -0.8 -0.5 -1.7 -1.2 -0.6 -1.3 -0.4 -0.8 -1.2Accommodation(b) and food service activities 0.4 -2.8 -0.3 3.8 3.8 4.0 2.8 2.5 0.4Financial and insurance activities(c) 0.2 -1.0 0.2 1.3 0.2 1.8 1.3 0.5 -1.0Real estate leasing and maintenance management 0.1 -1.0 -0.2 3.1 3.8 2.7 1.8 4.4 4.1Professional and business services 2.2 0.3 0.6 6.9 2.7 -0.5 -0.7 1.1 1.0Personal services -2.1 -1.2 0.6 4.1 5.5 4.0 3.2 2.2 0.3All industries surveyed 0.7 -1.5 -0.4 2.7 1.6 0.9 0.7 0.6 -0.2
Table 21 : Rates of change in wage indicesby selected industry section
Selected industry section
Notes: The rates of change in real terms are compiled from the Real Wage Indices. The Indices are derived by deflating the Nominal Wage Indices by the 2009/10-based CPI(A).
Upon the implementation of the new Hong Kong Standard Industrial Classification Version 2.0 (HSIC V2.0) by the C&SD in October 2008, the new classification has been adopted in compiling the wage statistics. Starting from March 2009, all the wage statistics, unless otherwise specified, are compiled based on the HSIC V2.0. The series of wage indices under HSIC V2.0 has also been backcasted to March 2004.
(a) Starting from 2009, the sample size of the wage enquiry conducted in the second and fourth quarters of a year will be reduced. Therefore, wage statistics at detailed industry breakdowns will not be available for June and December of a year.
(b) Accommodation services covers hotels, guesthouses, boarding houses and other establishments providing short term accommodation.
(c) Excluding stock, commodity and bullion brokers, exchanges and services companies; insurance agents and brokers; and real estate agencies.
(*) Change within ±0.05%.
(--) Not applicable.

186
(%)
2004 2005 2006 2007 2008 2009 2010 2011
GDP deflator -3.6 -0.2 -0.5 3.1 1.3 -0.4 0.3 3.9
Domestic demand deflator -0.1 1.1 1.6 2.4 2.6 -0.8 2.2 4.5
Consumer Price Indices(a) :Composite CPI -0.4 1.0 2.0 2.0 4.3 0.5 2.4 5.3CPI(A) * 1.1 1.7 1.3 3.6 0.4 2.7 5.6CPI(B) -0.5 1.0 2.1 2.2 4.6 0.5 2.3 5.2CPI(C) -0.9 0.8 2.2 2.7 4.7 0.6 2.1 5.1
Unit Value Indices :Domestic exports 1.5 2.2 -2.1 0.8 5.1 -0.2 5.5 6.4Re-exports 1.1 1.2 1.1 2.4 3.8 1.2 4.6 8.0Total exports of goods 1.2 1.3 1.0 2.3 3.8 1.1 4.7 8.0Imports of goods 2.9 2.7 2.1 2.3 4.4 -0.1 6.4 8.1
Terms of Trade Index -1.7 -1.4 -1.1 0.1 -0.5 1.3 -1.7 -0.1
Producer Price Index for all manufacturing industries(b) 2.2 0.8 2.2 3.0 5.6 -1.7 6.0 8.3
Tender Price Indices :
Public sector building projects -1.5 1.4 5.0 20.1 41.9 -15.9 12.5 11.6Public housing projects 3.5 7.7 11.2 19.7 30.8 -6.8 6.7 10.1
Table 22 : Rates of change in prices
Notes: (a) The year-on-year rates of change before October 2010 were derived using the index series in the bases periods at that time (for instance the 2004/05-based index series), compared with the index a year earlier in the same base period.
(b) Starting from the first quarter of 2009, the producer price indices for all manufacturing industries are compiled based on the HSIC Version 2.0, and the base period of the indices has been changed to 2008 (i.e. with the quarterly average of the indices in 2008 taken as 100). The new series has also been backcasted to the first quarter of 2005. The rates of change before 2006 presented here are the old series compiled based on the HSIC Version 1.1. The two series are therefore not strictly comparable.
(#) Figures are subject to revision later on as more data become available.
(*) Change within ±0.05%.
(--) Not applicable.
N.A. Not yet available.
(^) Average annual rate of change for the 10-year period 2002-2012.
(~) Average annual rate of change for the 5-year period 2007-2012.

187
(%)
2012 2013 2013
Q1 Q2 Q3 Q410 years
2003 to 20135 years
2008 to 2013
GDP deflator# 3.7 1.2 1.2 0.4 1.5 1.6 0.9 1.7
Domestic demand deflator# 4.2 0.3 2.2 0.4 -0.6 -0.6 1.8 2.0
Consumer Price Indices(a) :Composite CPI 4.1 4.3 3.7 4.0 5.3 4.3 2.5 3.3CPI(A) 3.6 5.1 4.2 4.6 7.3 4.4 2.5 3.5CPI(B) 4.3 4.1 3.5 3.8 4.6 4.4 2.6 3.3CPI(C) 4.1 3.8 3.3 3.6 4.2 4.1 2.5 3.1
Unit Value Indices :Domestic exports 2.5 2.2 4.2 2.3 1.8 0.6 2.4 3.3Re-exports 3.4 1.3 0.5 0.4 1.7 2.4 2.8 3.7Total exports of goods 3.4 1.3 0.6 0.4 1.7 2.4 2.8 3.7Imports of goods 3.3 0.9 1.1 0.2 0.6 1.5 3.3 3.7
Terms of Trade Index 0.1 0.4 -0.5 0.2 1.0 0.8 -0.5 *
Producer Price Index for all manufacturing industries(b) 0.1 N.A. 0.6 -2.4 -5.2 N.A. -- 3.6 ~
Tender Price Indices :
Public sector building projects 8.3 N.A. 7.2 6.5 6.3 N.A. 7.4^ 10.2 ~
Public housing projects 6.4 N.A. 8.8 9.6 10.1 N.A. 7.4^ 8.8 ~
Average annualrate of change:
Table 22 : Rates of change in prices (Cont'd)
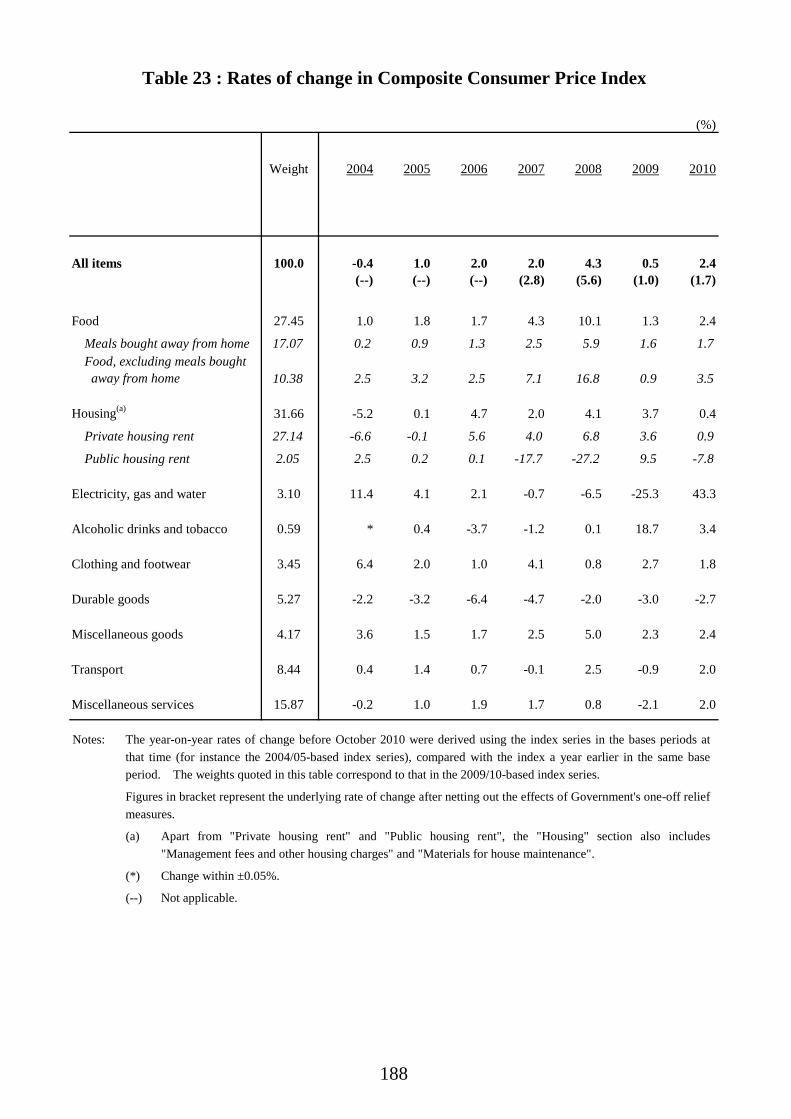
188
(%)
Weight 2004 2005 2006 2007 2008 2009 2010
All items 100.0 -0.4 1.0 2.0 2.0 4.3 0.5 2.4(--) (--) (--) (2.8) (5.6) (1.0) (1.7)
Food 27.45 1.0 1.8 1.7 4.3 10.1 1.3 2.4
Meals bought away from home 17.07 0.2 0.9 1.3 2.5 5.9 1.6 1.7Food, excluding meals bought away from home 10.38 2.5 3.2 2.5 7.1 16.8 0.9 3.5
Housing(a) 31.66 -5.2 0.1 4.7 2.0 4.1 3.7 0.4
Private housing rent 27.14 -6.6 -0.1 5.6 4.0 6.8 3.6 0.9
Public housing rent 2.05 2.5 0.2 0.1 -17.7 -27.2 9.5 -7.8
Electricity, gas and water 3.10 11.4 4.1 2.1 -0.7 -6.5 -25.3 43.3
Alcoholic drinks and tobacco 0.59 * 0.4 -3.7 -1.2 0.1 18.7 3.4
Clothing and footwear 3.45 6.4 2.0 1.0 4.1 0.8 2.7 1.8
Durable goods 5.27 -2.2 -3.2 -6.4 -4.7 -2.0 -3.0 -2.7
Miscellaneous goods 4.17 3.6 1.5 1.7 2.5 5.0 2.3 2.4
Transport 8.44 0.4 1.4 0.7 -0.1 2.5 -0.9 2.0
Miscellaneous services 15.87 -0.2 1.0 1.9 1.7 0.8 -2.1 2.0
Table 23 : Rates of change in Composite Consumer Price Index
Notes: The year-on-year rates of change before October 2010 were derived using the index series in the bases periods at that time (for instance the 2004/05-based index series), compared with the index a year earlier in the same base period. The weights quoted in this table correspond to that in the 2009/10-based index series.
Figures in bracket represent the underlying rate of change after netting out the effects of Government's one-off relief measures.
(a) Apart from "Private housing rent" and "Public housing rent", the "Housing" section also includes "Management fees and other housing charges" and "Materials for house maintenance".
(*) Change within ±0.05%.
(--) Not applicable.

189
(%)
Weight 2011 2012 2013 2013
Q1 Q2 Q3 Q4
10 years2003 to
2013
5 years2008 to
2013
All items 100.0 5.3 4.1 4.3 3.7 4.0 5.3 4.3 2.5 3.3(5.3) (4.7) (4.0) (3.8) (3.9) (4.3) (4.0) (--) (3.4)
Food 27.45 7.0 5.8 4.4 4.1 4.5 4.6 4.4 3.9 4.2
Meals bought away from home 17.07 5.2 5.4 4.4 4.4 4.3 4.3 4.5 2.9 3.6Food, excluding meals bought away from home 10.38 9.9 6.5 4.4 3.6 4.8 4.9 4.1 5.6 5.0
Housing(a) 31.66 7.2 5.6 6.7 5.2 6.1 9.4 6.1 2.9 4.7
Private housing rent 27.14 7.2 6.8 6.3 5.0 6.1 7.0 7.0 3.4 4.9
Public housing rent 2.05 11.9 -7.1 16.0 9.7 8.9 777.6 -1.8 -2.8 4.0
Electricity, gas and water 3.10 -4.2 -8.2 6.9 4.9 5.9 9.6 7.1 1.0 0.1
Alcoholic drinks and tobacco 0.59 17.1 3.0 1.5 1.6 1.9 1.4 1.1 3.7 8.5
Clothing and footwear 3.45 6.8 3.1 1.7 1.5 1.0 1.7 2.5 3.0 3.2
Durable goods 5.27 -3.8 -1.4 -4.3 -3.5 -5.0 -4.7 -4.0 -3.4 -3.0
Miscellaneous goods 4.17 3.8 2.2 2.2 1.4 2.2 2.5 2.7 2.7 2.6
Transport 8.44 4.4 3.0 2.3 2.0 2.2 2.8 2.4 1.6 2.2
Miscellaneous services 15.87 3.5 2.8 3.7 3.5 3.1 3.9 4.3 1.5 2.0
Table 23 : Rates of change in Composite Consumer Price Index (Cont'd)
Average annualrate of change:

190
(%)
2004 2005 2006 2007 2008 2009 2010
Private consumption expenditure -0.4 1.6 0.9 4.1 2.5 -1.4 1.4
Government consumption expenditure -2.6 -1.7 0.1 2.2 4.4 0.7 -0.2
Gross domestic fixed capital formation 2.2 1.1 4.2 -2.1 1.7 0.3 5.8
Total exports of goods 0.9 0.6 0.3 2.2 3.4 0.5 4.6
Imports of goods 2.9 1.9 2.1 1.7 4.1 -1.3 6.3
Exports of services 0.5 3.3 3.6 2.5 3.4 -7.0 7.4
Imports of services 4.1 1.0 0.8 3.0 3.8 -2.7 5.6
Gross Domestic Product -3.6 -0.2 -0.5 3.1 1.3 -0.4 0.3
Total final demand 0.5 1.1 1.1 2.3 3.1 -1.1 4.3
Domestic demand -0.1 1.1 1.6 2.4 2.6 -0.8 2.2
Table 24 : Rates of change in implicit price deflators of GDPand its main expenditure components
Note: (#) Figures are subject to revision later on as more data become available.

191
(%)
2011 2012# 2013# 2013
Q1# Q2# Q3# Q4#
10 years2003 to
2013#
5 years2008 to
2013#
Private consumption expenditure 3.6 3.2 2.4 2.0 2.2 2.9 2.3 1.8 1.8
Government consumption expenditure 4.5 6.2 4.3 5.9 4.2 3.6 3.4 1.7 3.1
Gross domestic fixed capital formation 6.8 6.4 -6.0 2.1 -5.3 -10.0 -8.9 2.0 2.5
Total exports of goods 7.7 3.1 -0.4 -0.5 -0.5 -0.4 -0.2 2.3 3.1
Imports of goods 8.2 3.8 -0.7 0.1 -0.5 -1.3 -1.2 2.9 3.2
Exports of services 7.6 4.3 0.4 1.0 -0.2 0.5 0.3 2.5 2.4
Imports of services 6.4 1.9 0.6 1.0 0.5 0.3 0.6 2.4 2.3
Gross Domestic Product 3.9 3.7 1.2 1.2 0.4 1.5 1.6 0.9 1.7
Total final demand 6.7 3.6 -0.1 0.5 -0.1 -0.3 -0.2 2.1 2.7
Domestic demand 4.5 4.2 0.3 2.2 0.4 -0.6 -0.6 1.8 2.0
Average annualrate of change:
Table 24 : Rates of change in implicit price deflators of GDPand its main expenditure components (Cont'd)