2015 Half Year Financial Results - Newcrest Mining · 2015 Half Year Financial Results ......
36
2015 Half Year Financial Results 13 February 2015 Sandeep Biswas Managing Director and CEO Gerard Bond Finance Director and CFO
Transcript of 2015 Half Year Financial Results - Newcrest Mining · 2015 Half Year Financial Results ......
2015 Half Year Financial Results13 February 2015
Sandeep BiswasManaging Director and CEO
Gerard BondFinance Director and CFO

1
DisclaimerForward Looking StatementsThese materials include forward looking statements. Often, but not always, forward looking statements can generally be identified by the use of forward lookingwords such as “may”, “will”, “expect”, “intend”, “plan”, “estimate”, “anticipate”, “continue”, and “guidance”, or other similar words and may include, without limitation,statements regarding plans, strategies and objectives of management, anticipated production or construction commencement dates and expected costs orproduction outputs.Forward looking statements inherently involve known and unknown risks, uncertainties and other factors that may cause the company’s actual results,performance and achievements to differ materially from any future results, performance or achievements. Relevant factors may include, but are not limited to,changes in commodity prices, foreign exchange fluctuations and general economic conditions, increased costs and demand for production inputs, the speculativenature of exploration and project development, including the risks of obtaining necessary licences and permits and diminishing quantities or grades of reserves,political and social risks, changes to the regulatory framework within which the company operates or may in the future operate, environmental conditions includingextreme weather conditions, recruitment and retention of personnel, industrial relations issues and litigation.Forward looking statements are based on the company and its management’s good faith assumptions relating to the financial, market, regulatory and otherrelevant environments that will exist and affect the company’s business and operations in the future. The company does not give any assurance that theassumptions on which forward looking statements are based will prove to be correct, or that the company’s business or operations will not be affected in anymaterial manner by these or other factors not foreseen or foreseeable by the company or management or beyond the company’s control.Although the company attempts and has attempted to identify factors that would cause actual actions, events or results to differ materially from those disclosed inforward looking statements, there may be other factors that could cause actual results, performance, achievements or events not to be as anticipated, estimatedor intended, and many events are beyond the reasonable control of the company. Accordingly, readers are cautioned not to place undue reliance on forwardlooking statements. Forward looking statements in these materials speak only at the date of issue. Subject to any continuing obligations under applicable law orany relevant stock exchange listing rules, in providing this information the company does not undertake any obligation to publicly update or revise any of theforward looking statements or to advise of any change in events, conditions or circumstances on which any such statement is based.Ore Reserves and Mineral Resources Reporting RequirementsAs an Australian company with securities listed on the Australian Securities Exchange (“ASX”), Newcrest is subject to Australian disclosure requirements and standards, including the requirements of the Corporations Act and the ASX. Investors should note that it is a requirement of the ASX listing rules that the reporting of ore reserves and mineral resources in Australia comply with the 2012 Edition of the Australasian Code for Reporting of Exploration Results, Mineral Resources and Ore Reserves (the “JORC Code”) and that Newcrest’s ore reserve and mineral resource estimates comply with the JORC Code. On 28 November 2014 Newcrest ceased to be a reporting issuer in Canada.

2
Disclaimer
Competent Person’s StatementThe information in this presentation that relates to Exploration Targets, Exploration Results, Mineral Resources and Ore Reserves and other scientific and technical information,is based on information compiled by Mr C. Moorhead. Mr Moorhead is the Executive General Manager Minerals and a full-time employee of Newcrest Mining Limited. He is ashareholder in Newcrest Mining Limited and is entitled to participate in Newcrest’s executive equity long term incentive plan, details of which are included in Newcrest’s 2014Remuneration Report. Ore Reserves growth is one of the performance measures under that plan. He is a Fellow of The Australasian Institute of Mining and Metallurgy. MrMoorhead has sufficient experience which is relevant to the styles of mineralisation and types of deposits under consideration and to the activity which he is undertaking to qualifyas a Competent Person as defined in the JORC Code. Mr Moorhead consents to the inclusion in this presentation of the matters based on his information in the form and contextin which it appears including sampling, analytical and test data underlying the results.The information in this presentation that relates to Golpu Mineral Resources and Ore Reserves is based on and accurately reflects reports prepared by Mr G. Job. Mr Job isExecutive General Manager for Minerals and Strategic Planning for the Morobe Mining Joint Ventures, a full time employee of and seconded to the JVs from Harmony GoldMining Company Limited, Newcrest’s joint venture partner in each of the Morobe Mining Joint Ventures. He is entitled to participate in Harmony’s equity long term incentive plan,details of which are included in Harmony’s 2014 Remuneration Report. He is a Member of The Australasian Institute of Mining and Metallurgy. Mr Job has sufficient experiencewhich is relevant to the style of mineralisation and type of deposit under consideration and to the activity which he is undertaking to qualify as a Competent Person as defined inthe JORC Code. Mr Job consents to the inclusion in this presentation of the matters based on his information in the form and context in which it appears.
Non-IFRS Financial InformationThis presentation is a summary document and should be read in conjunction with the Appendix 4D on the ASX platform. Newcrest results are reported under InternationalFinancial Reporting Standards (IFRS) including EBIT (earnings before interest and tax) and EBITDA (earnings before interest, tax, depreciation and amortisation) which are usedto measure segment performance. This presentation also includes certain non-IFRS financial information including Underlying profit (profit after tax before significant itemsattributable to owners of the parent company), All-In Sustaining Cost (determined in accordance with the World Gold Council Guidance Note on Non-GAAP Metrics releasedJune 2013), Free cash flow (cash flow from operating activities less cash flow related to investing activities), EBITDA margin (EBITDA expressed as a percentage of revenue)and EBIT margin (EBIT expressed as a percentage of revenue). These measures are used internally by management to assess the performance of the business and makedecisions on the allocation of resources and are included in this presentation to provide greater understanding of the underlying performance of the Company’s operations. Whenreviewing business performance, this non-IFRS information should be used in addition to, and not as a replacement of, measures prepared in accordance with IFRS. The non-IFRS information has not been subject to audit or review by Newcrest’s external auditor. Newcrest Group All-In Sustaining Costs will vary from period to period as a result ofvarious factors including production performance, timing of sales, the level of sustaining capital and the relative contribution of each asset. Reconciliations of non-IFRS measuresto the most appropriate IFRS measure are provided in slide 28 in this presentation.
3
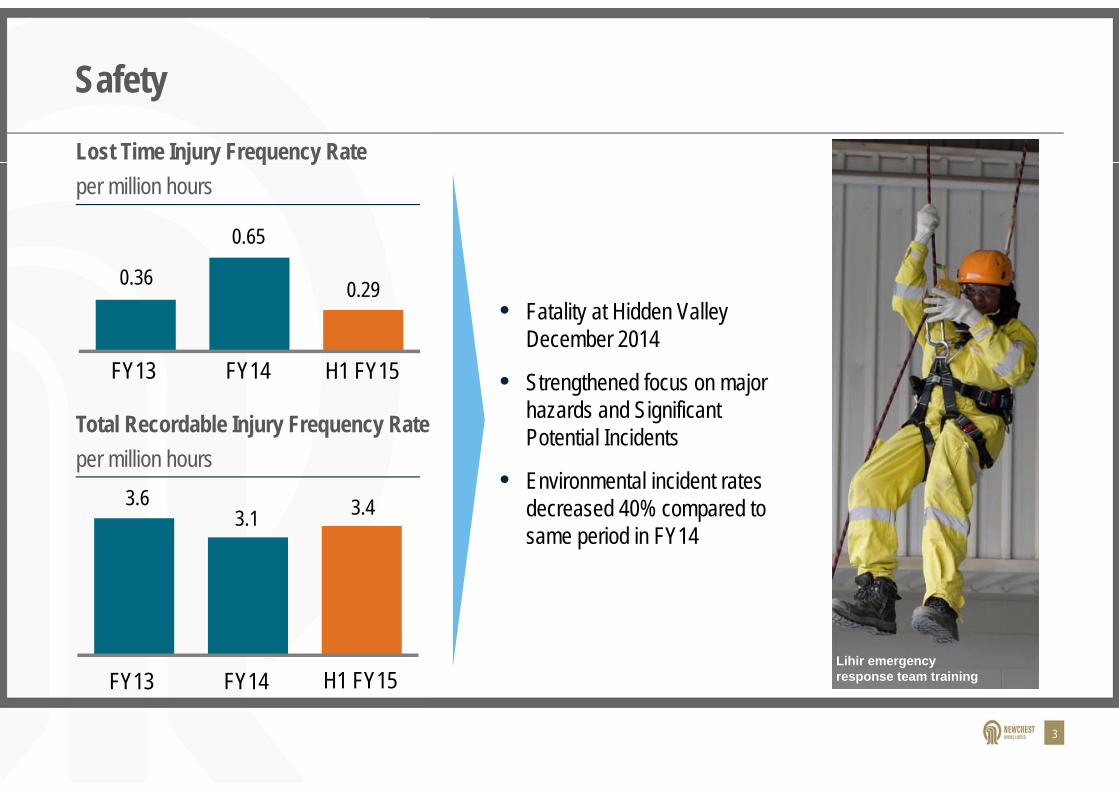
Safety
Total Recordable Injury Frequency Rateper million hours
• Fatality at Hidden Valley December 2014
• Strengthened focus on major hazards and Significant Potential Incidents
• Environmental incident rates decreased 40% compared to same period in FY14
0.36
0.65
0.29
H1 FY15FY13 FY14
3.63.1 3.4
FY13 H1 FY15FY14
Lost Time Injury Frequency Rateper million hours
Lihir emergency response team training
4
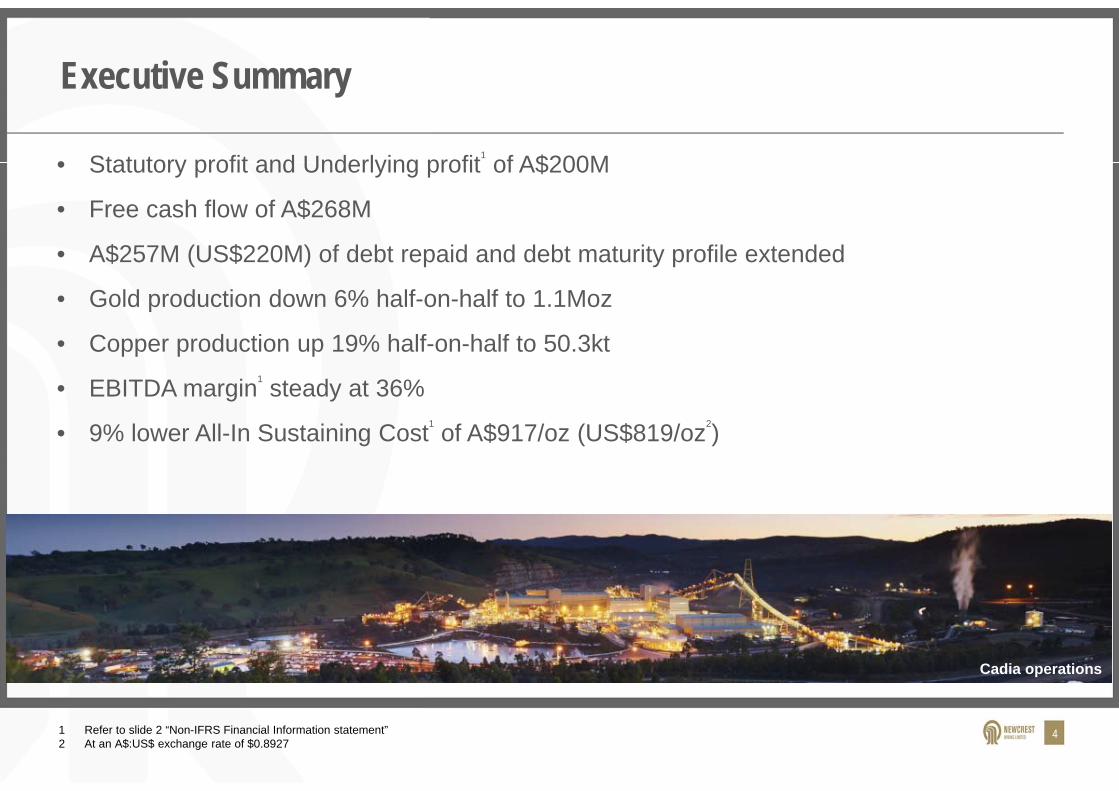
Executive Summary
• Statutory profit and Underlying profit1 of A$200M
• Free cash flow of A$268M
• A$257M (US$220M) of debt repaid and debt maturity profile extended
• Gold production down 6% half-on-half to 1.1Moz
• Copper production up 19% half-on-half to 50.3kt
• EBITDA margin1 steady at 36%
• 9% lower All-In Sustaining Cost1 of A$917/oz (US$819/oz2)
Cadia operations
1 Refer to slide 2 “Non-IFRS Financial Information statement”2 At an A$:US$ exchange rate of $0.8927
5
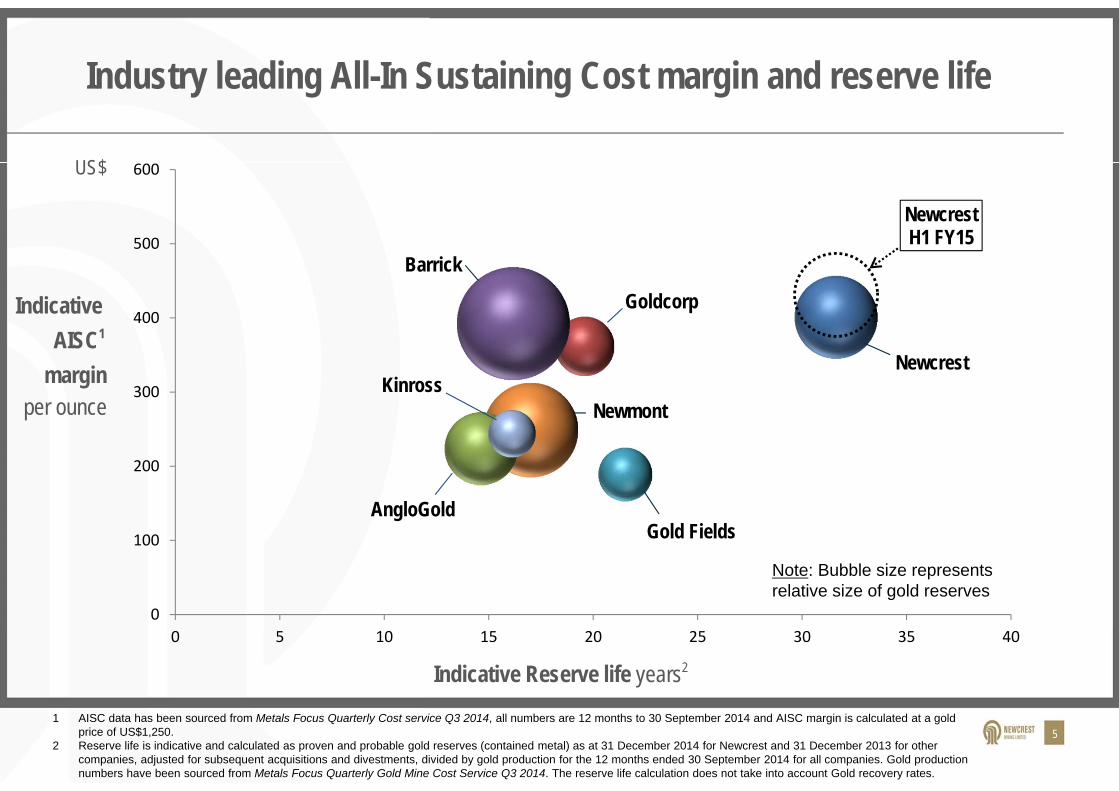
Newcrest
Gold Fields
Goldcorp
Newmont
AngloGold
Kinross
Barrick
NewcrestH1 FY15
0
100
200
300
400
500
600
0 5 10 15 20 25 30 35 40
Industry leading All-In Sustaining Cost margin and reserve life
Indicative Reserve life years2
Indicative AISC1
marginper ounce
Note: Bubble size represents relative size of gold reserves
US$
1 AISC data has been sourced from Metals Focus Quarterly Cost service Q3 2014, all numbers are 12 months to 30 September 2014 and AISC margin is calculated at a gold price of US$1,250.
2 Reserve life is indicative and calculated as proven and probable gold reserves (contained metal) as at 31 December 2014 for Newcrest and 31 December 2013 for other companies, adjusted for subsequent acquisitions and divestments, divided by gold production for the 12 months ended 30 September 2014 for all companies. Gold production numbers have been sourced from Metals Focus Quarterly Gold Mine Cost Service Q3 2014. The reserve life calculation does not take into account Gold recovery rates.

6
EDGE – comprehensive, company-wide improvement program
Safety and operational discipline
Culture of accountability and personal ownership
Cash generation
Profitable growth
Key focus areas
• Edge is pursuing sustained cash flow uplift
• Execution of initiatives with rigorous performance management underway over past 9 months
• Transformation engages the whole organisation:• 900+ initiatives• 350+ initiative owners
• Program pulls all business improvement levers, covering all operations and organisational culture
• To date have realised ~A$170M1 of cash benefits (as at 31 December 2014)
1 Normalised for grade, gold price and foreign exchange against baseline. Comprises both one-off and run rate values
7
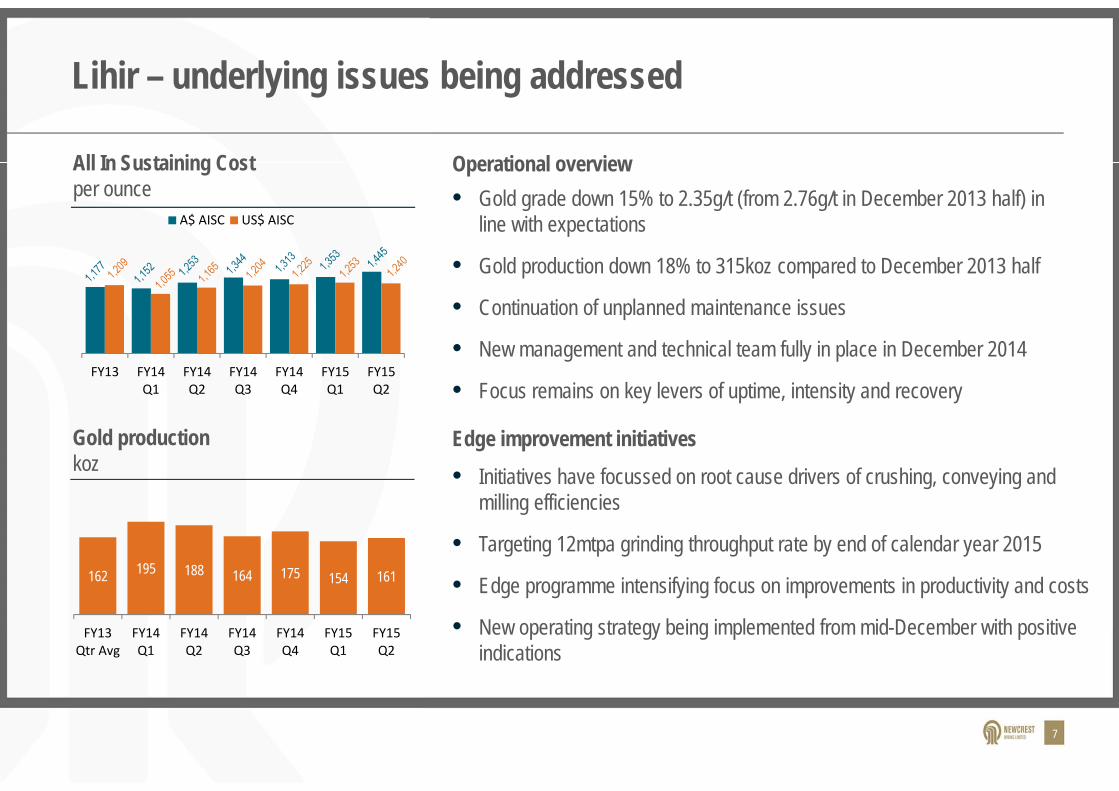
Lihir – underlying issues being addressed
Gold productionkoz
All In Sustaining Costper ounce
Operational overview• Gold grade down 15% to 2.35g/t (from 2.76g/t in December 2013 half) in
line with expectations
• Gold production down 18% to 315koz compared to December 2013 half
• Continuation of unplanned maintenance issues
• New management and technical team fully in place in December 2014
• Focus remains on key levers of uptime, intensity and recovery
• Initiatives have focussed on root cause drivers of crushing, conveying and milling efficiencies
• Targeting 12mtpa grinding throughput rate by end of calendar year 2015
• Edge programme intensifying focus on improvements in productivity and costs
• New operating strategy being implemented from mid-December with positive indications
Edge improvement initiatives
162 195 188 164 175 154 161
FY13Qtr Avg
FY14Q1
FY14Q2
FY14Q3
FY14Q4
FY15Q1
FY15Q2
FY13 FY14Q1
FY14Q2
FY14Q3
FY14Q4
FY15Q1
FY15Q2
A$ AISC US$ AISC

8
Flexible plant that enables us to optimise recovery and throughput
Levers discussed at investor day 2014 to maximise cash generation ability from the autoclaves:
– Blending the level of sulphur in feed
– Balancing flotation to direct feed
– Balancing oxygen to sulphur ratio
– Increasing autoclave GEHO pump rates
– Optimising oxygen capacity
Grinding
Autoclave(Sulphur 5-8%)
Leaching
Flotation
Directfeed
Indirectfeed
Crushing
Future focus:Put pressure on the autoclaves

9
Lihir – New operating strategy
Old strategy:Maximise gold recovery in autoclaves
• Manage feedstock through suboptimal mining and milling processes to achieve 5-8% sulphur levels
• Oxidise (burn) 90%+ of sulphur to maximise gold recovery
Mills and mine capacity fluctuate to balance sulphur requirements for autoclaves
Shift in approach:Moving from managing the autoclave feed sulphur concentration to maximising gold bearing sulphur mass flow to the autoclaves.Examination of the underlying mineralogy identified 2 main types of pyrite• Microcrystalline pyrite - more
reactive with higher gold content• Crystalline (blocky) pyrite -
appears less reactive with lower gold content that burns slower
New strategy:Maximise gold production throughput in autoclaves
• Manage throughput of sulphur through autoclaves to maximise gold production.
• Extent of oxidation is optimised/reduced with limited impact on gold recovery
• Applies to most but not necessarily all ore types
Mills and mine now operate at increased capacity
Net impact = increased gold production at lower unit cost
Prior operating strategy Challenging set thinking New operating strategy

10
Lihir – Optimising oxygen capacity
February 2015
– Taking autoclaves 1,2 & 3 off line to install modern oxygen flow meters (autoclaves 2&3 also having regular maintenance impacting February production)
– New flow meters increase capacity and flexibility in the autoclave circuit
– Increases direct feed ore into autoclaves
Autoclave plant at Lihir

11
Lihir plant uptime: Improving shutdown planning and execution
Optimising shutdown planning…
Cumulative duration of planned tasks (hours)
FGO mill shutdown example
Reducing duration: Actual outage time (hours)
Key improvement factors• Dedicated shutdown coordinator• Improved contractor management• Investment in specialised tooling
Key improvement factors• Improved kitting & staging preparation• On-the-job handovers• Concurrent ramp-up activities
AC
1FG
O
-13%
ImprovedPrevious
252288
Plan
-16%
Actual
-10%
226252
97
46
-53%
Plan Actual
… and improving execution Actual critical pathoutage time (hours)
Increased plant uptime
Increased plant uptime
242289
Autoclave 1 example
Planned outage time (hours)
FGO maintenance, Lihir
Autoclave maintenance, Lihir

12
Cadia – exceeding expectations
Gold productionkoz
All In Sustaining Costper ounce
Performance overview
• Cadia East ramping up in FY15 ahead of schedule
• Gold production 4% higher than the corresponding period
• Copper production 21% higher than corresponding period
• Cadia East Panel Cave 2 achieved commercial production
• Surface breakthrough of Panel Cave 1
• Low cost capital improvements on Ridgeway fixed plant increased productivity by 14%
• Increased loader capacity and concreting loader routes at Cadia East increasing productivity by 22% over plan
• Panel Cave 2 development lowering costs from ~$14,000 per metre down to ~$11,000 per metre through improved planning and efficiency, requiring less labour
Edge improvement initiatives
112154 151 133 154 153 165
FY13Qtr Avg
FY14Q1
FY14Q2
FY14Q3
FY14Q4
FY15Q1
FY15Q2
FY13 FY14Q1
FY14Q2
FY14Q3
FY14Q4
FY15Q1
FY15Q2
A$ AISC US$ AISC

13
Telfer – strong performance, future options review broadened
Gold productionkoz
All In Sustaining Costper ounce
Performance overview
• Gold production down 2% compared to corresponding period
• Copper production was up 14% compared to corresponding period
• Next cutback investment continues to be evaluated
• Future options review broadened to encompass:– Hedging fuel and A$ metal prices for cutback period– Alternative ownership options
• Renegotiated major contracts (tailings dam lift, underground mining, mobile fleet maintenance, site services) resulting in approx. A$30M of annual savings
Edge improvement initiatives
131 124 157 127 128 135 140
FY13Qtr Avg
FY14Q1
FY14Q2
FY14Q3
FY14Q4
FY15Q1
FY15Q2
FY13 FY14Q1
FY14Q2
FY14Q3
FY14Q4
FY15Q1
FY15Q2
A$ AISC US$ AISC

14
Other operations’ half year performance compared with corresponding period
Gold
pro
duct
ion
koz
AISC
per o
unce
Performance overview against corresponding period• A$ AISC/oz down 24%
• Gold production up 20% to 48koz
• Gold grade up 15% to 1.62g/t (from 1.41g/t) in line with expectations
Bonikro
• A$ AISC/oz down 9% due to lower sustaining capital expenditure
• Gold grade up 2% to 12.06g/t (from 11.83g/t)
• Calendar year reserves depletion largely replaced in updated reserves statement
Gosowong Hidden Valley
• Fatality 6 December 2014
• A$ AISC/oz down 8% due to lower sustaining capital expenditure
• Gold production was down 2% to 49koz
45 40 55 48
FY13HY Avg
FY14 H1 FY14 H2 FY15 H1
156 149 196134
FY13HY Avg
FY14 H1 FY14 H2 FY15 H1
43 50 56 49
FY13HY Avg
FY14 H1 FY14 H2 FY15 H1
1,751 1,484
992 1,132
1,7991,369
907 1,010
FY13 FY14 H1 FY14 H2 FY15 H1
A$ AISC US$ AISC
664 990
683 897 682 913
625 800
FY13 FY14 H1 FY14 H2 FY15 H1
A$ AISC US$ AISC 2,407
1,627 1,205
1,491
2,472
1,5011,102
1,331
FY13 FY14 H1 FY14 H2 FY15 H1
A$ AISC US$ AISC

2015 Half Year Financial Results
Gerard BondFinance Director & CFO

16
2015 Half Year financial highlights
Profitability• Statutory profit and Underlying profit1 of A$200M• AISC spend of A$1.05bn - 12% lower than
corresponding period• EBITDA1 of A$730M• EBITDA margin1 36.3%
Cash Flow• Cash flow from operating activities of A$566M• Free cash flow of A$268M• All operations generated positive free cash flow
Balance Sheet as at 31 December 2014• A$257M (US$220M) of debt repaid• Net debt of A$4,291M• A$2,310M in cash and undrawn bank facilities Gold pour at Telfer
1 Refer to slide 2 “Non-IFRS Financial Information statement”
17
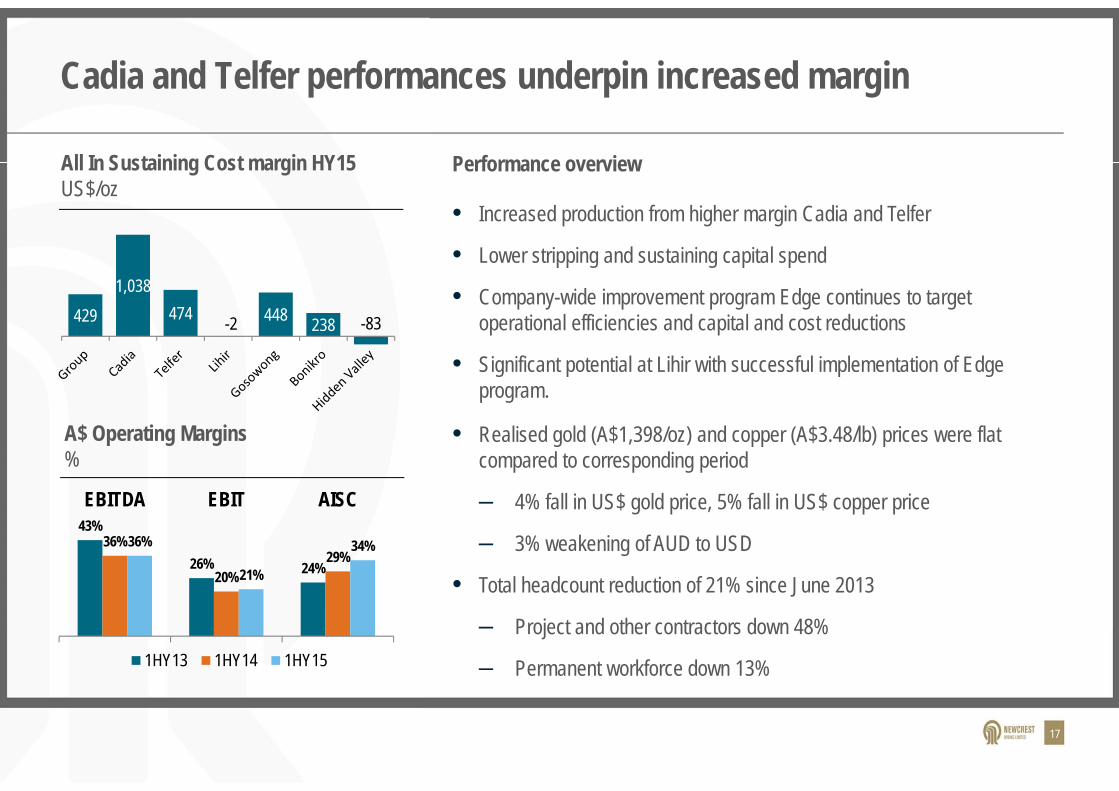
Cadia and Telfer performances underpin increased margin
A$ Operating Margins%
All In Sustaining Cost margin HY15US$/oz
Performance overview
• Increased production from higher margin Cadia and Telfer
• Lower stripping and sustaining capital spend
• Company-wide improvement program Edge continues to target operational efficiencies and capital and cost reductions
• Significant potential at Lihir with successful implementation of Edge program.
• Realised gold (A$1,398/oz) and copper (A$3.48/lb) prices were flat compared to corresponding period
– 4% fall in US$ gold price, 5% fall in US$ copper price
– 3% weakening of AUD to USD
• Total headcount reduction of 21% since June 2013
– Project and other contractors down 48%
– Permanent workforce down 13%
43%
26% 24%
36%
20%29%
36%
21%
34%
EBITDA EBIT AISC
1HY13 1HY14 1HY15
4291,038
474 -2 448 238 -83

18
Group underlying profit
Underlying profit down 3% to A$200M compared to corresponding period
• Lower USD commodity prices largely offset by lower AUD FX rate
• Increased copper by-products offset by fall in gold production
(18)
31
207
(60) 52 (66)
(25)13
81 (10) 22(27)
200
Gold Copper and Silver
19
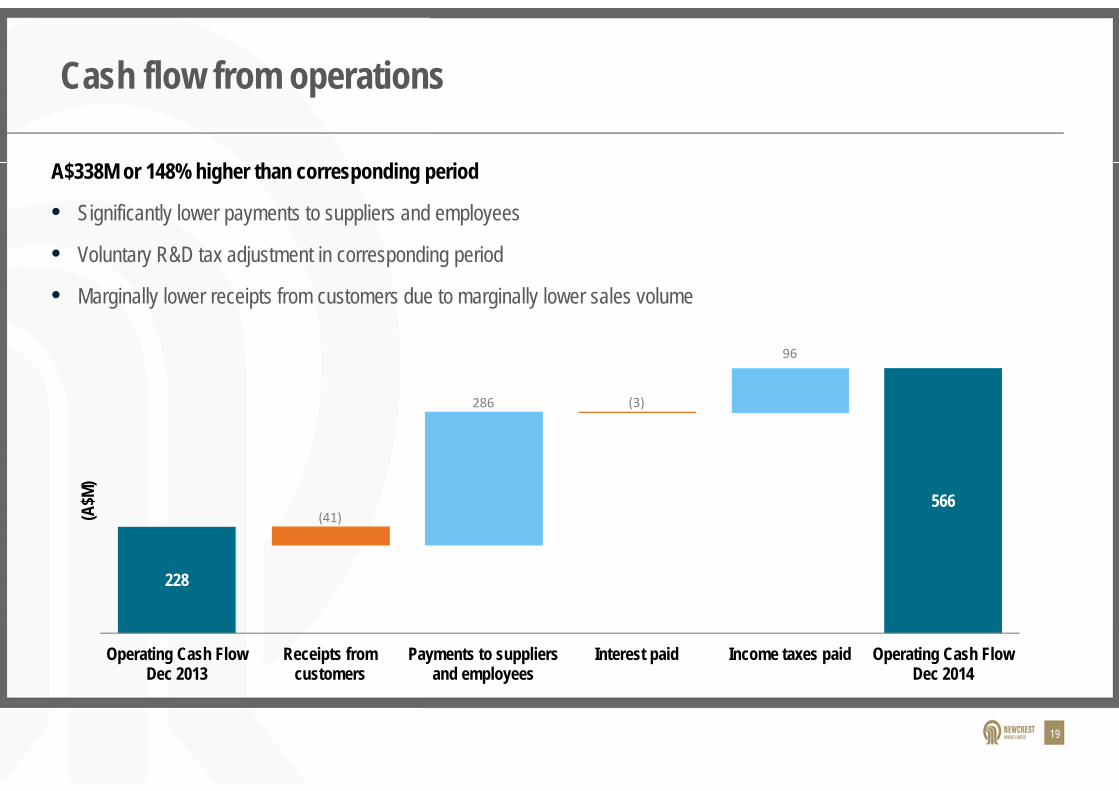
Cash flow from operations
A$338M or 148% higher than corresponding period
• Significantly lower payments to suppliers and employees
• Voluntary R&D tax adjustment in corresponding period
• Marginally lower receipts from customers due to marginally lower sales volume
228
566(41)
(3)286
96
Operating Cash FlowDec 2013
Receipts fromcustomers
Payments to suppliersand employees
Interest paid Income taxes paid Operating Cash FlowDec 2014
(A$M
)
20
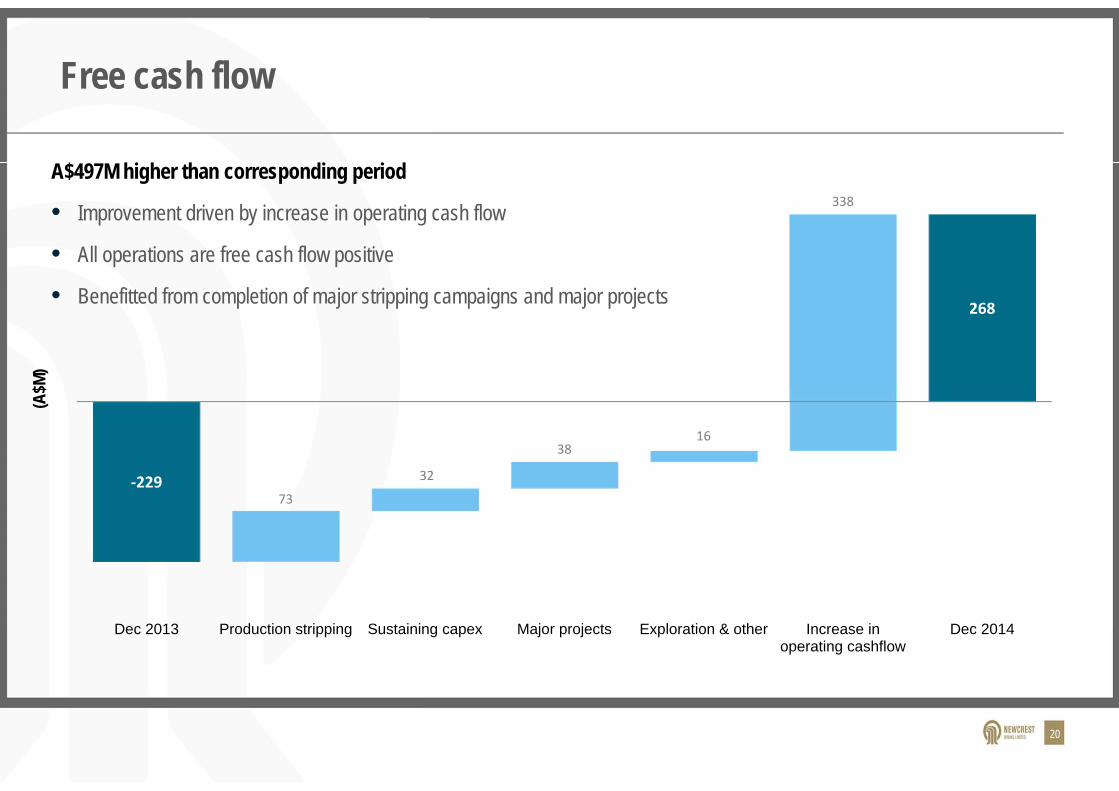
Free cash flow(A
$M)
‐229
268
73
32
3816
338
Dec 2013 Production stripping Sustaining capex Major projects Exploration & other Increase inoperating cashflow
Dec 2014
A$497M higher than corresponding period
• Improvement driven by increase in operating cash flow
• All operations are free cash flow positive
• Benefitted from completion of major stripping campaigns and major projects
21
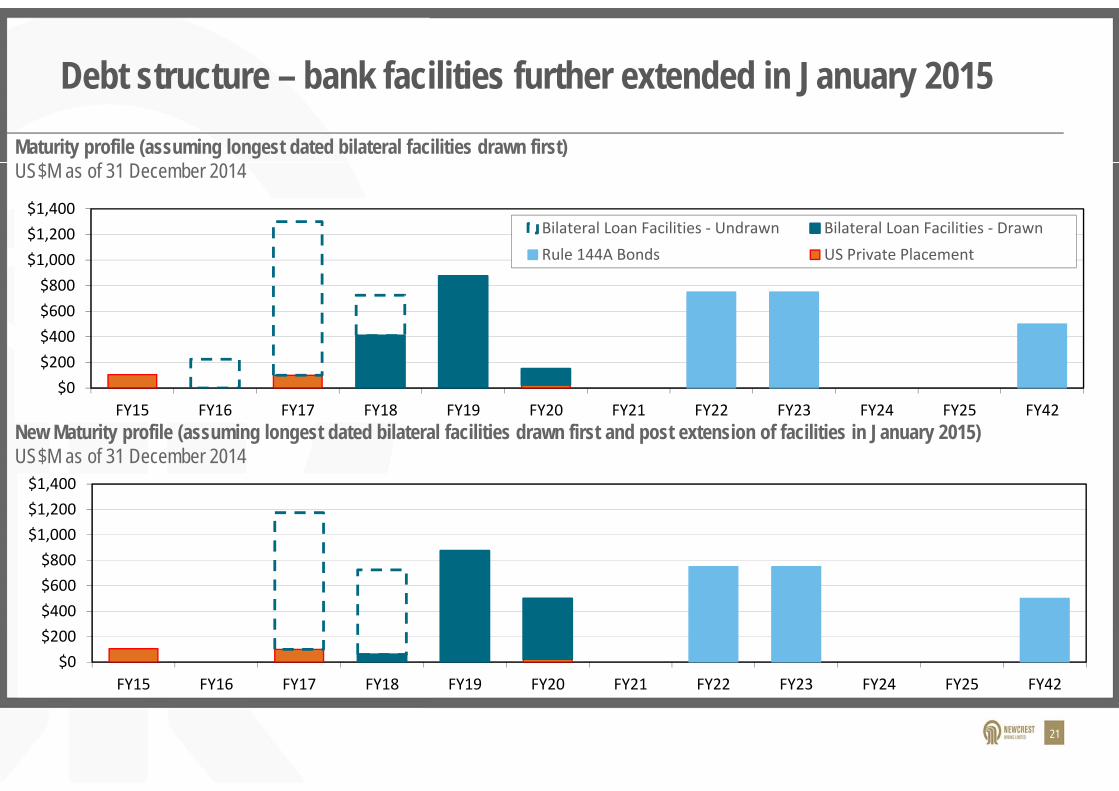
Debt structure – bank facilities further extended in January 2015
$0$200$400$600$800
$1,000$1,200$1,400
FY15 FY16 FY17 FY18 FY19 FY20 FY21 FY22 FY23 FY24 FY25 FY42
Bilateral Loan Facilities ‐ Undrawn Bilateral Loan Facilities ‐ DrawnRule 144A Bonds US Private Placement
$0$200$400$600$800
$1,000$1,200$1,400
FY15 FY16 FY17 FY18 FY19 FY20 FY21 FY22 FY23 FY24 FY25 FY42
Maturity profile (assuming longest dated bilateral facilities drawn first)US$M as of 31 December 2014
New Maturity profile (assuming longest dated bilateral facilities drawn first and post extension of facilities in January 2015)US$M as of 31 December 2014

22
FY15 foreign exchange sensitivities1 and oil hedges
Site MovementParameterFull YearEBIT Impact
Lihir + PGK 0.10USD/PGK US$ 14M
Gosowong + IDR 1,000USD/IDR US$ 5 M
Foreign Exchange
Hidden Valley + PGK 0.10USD/PGK US$ 4 M
Lihir ‘000 bblGasoil2 189
Cadia ‘000 bblGasoil 96
Oil hedges entered into for FY 15
Hidden Valley ‘000 bblGasoil 111
Site UnitFuel Quantity
Telfer ‘000 bblGasoilGosowong ‘000 bblGasoil
Lihir ’000 THFO3 183
199
Total ’000 bblGasoil 832237
1 Each sensitivity is calculated on a standalone basis2 Gasoil hedges at an average cost of US$ 119/bbl3 Heavy Fuel Oil hedges at average cost of US$603/MT
Full year cost reflected in AISC guidance in FY15

2015 Half Year Financial Results
Sandeep Biswas – Managing Director & Chief Executive Officer

24
Golpu progressing to feasibility study
• World class ore body with mineral resources of 9 million tonnes of copper and 20 million ounces of gold1
• Highlights of updated pre-feasibility study stage one2
– Stage one capital expenditure is forecast at US$2.3B
– First production targeting 2020
– Approximate mine life of 27 years
– Copper C1 cash cost US$0.78/lb
– Gold AISC estimated to be negative US$1,685/oz
– Initial block cave operating at 3Mtpa which will be replaced by a deeper block cave operating at 6Mtpa from 2024
• Stage 2 progressing to pre-feasibility study
1 Newcrest Annual Statement of Mineral Resources and Ore Reserves as at December 31, 2014.2 Estimates are from a prefeasibility study and as such are subject to an accuracy range of ±25%
25
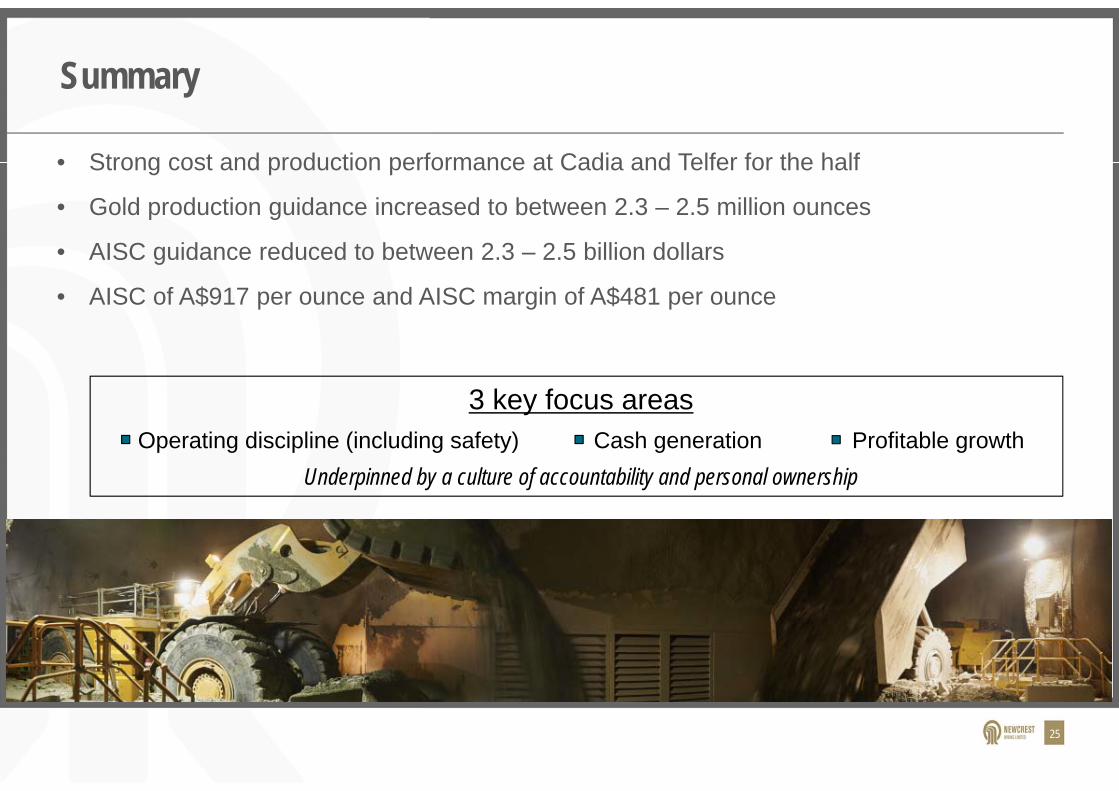
Summary
• Strong cost and production performance at Cadia and Telfer for the half
• Gold production guidance increased to between 2.3 – 2.5 million ounces
• AISC guidance reduced to between 2.3 – 2.5 billion dollars
• AISC of A$917 per ounce and AISC margin of A$481 per ounce
3 key focus areasOperating discipline (including safety) Cash generation Profitable growth
Underpinned by a culture of accountability and personal ownership

Questions & answers

Appendices

28
“Underlying Profit” Reconciliation
1 Underlying profit has been presented to assist in the assessment of the relative performance of the Group.2 Excludes asset impairment attributable to non-controlling interests.3 Excludes income tax applicable to significant items in the 31 December 2013 period4 EBIT and EBITDA are used to measure segment performance and have been extracted from the segment information disclosed in the ASX Appendix 4D.
6 months ended31 December 2013
A$M31 December 2014
A$M
Research and development tax claim amendment 120-Asset impairment (after-tax) 52-
Statutory Profit 40200
Non-controlling interest impact (5)-Total Significant Items 167-
Underlying profit1 207200
Non-controlling interest in controlled entities2 97Income tax expense3 100127Net finance costs 8890EBIT4 404424Depreciation and amortisation 327306EBITDA4 731730

29
2015 financial year production guidance1
1 Please refer to Forward Looking Statements note
Operation Gold ProductionCadia 610 – 650 koz
Lihir 680 – 720 koz
Telfer 510 – 560 koz
Gosowong 300 – 360 koz
Hidden Valley (50%) 90 – 110 koz
Bonikro 100 – 120 koz
Group 2.3 – 2.5 Moz
Group 2.2 – 2.5 Moz
Cadia Valley ~ 70 kt
Telfer ~ 25 kt
Group 90 – 100 kt
Copper ProductionOperation
Silver ProductionOperation

30
2015 cost and capital guidance1
1 Please refer to Forward Looking Statements note2 Assumes copper price of US$2.50/lb, silver price of US$20 per ounce and AUD:USD exchange rate of 0.803 Duplicated above under All-in Sustaining Costs and under Capital expenditure
Cadia Lihir TelferGosowong
(100%)Hidden
Valley (50%)Bonikro (100%)
Corporate & Other Group
All-In Sustaining Cost (key components)A$MA$M A$M A$M A$M A$M A$M A$M
• Operating costs(post by-product credits)2
1,750-1,900120-140 765-855 430-460 210-225 115-130 80-100 -
• On-site exploration expenditure 20-303-4 1-2 3-5 10-15 - 3-4 -
• Production stripping3 75-90- 50-60 - - 23-30 2-3 -
• Sustaining capital3 275-30075-85 80-90 50-60 40-50 15-25 10-15 5-10
• Corporate, rehabilitation and other 120-150- 2-3 20-27 5-10 5-10 1-2 100-120
• All-In Sustaining Cost 2,300-2,500200-220 900-1,000 500-530 270-300 165-185 95-115 100-130
Capital expenditure• Production stripping3 75-90- 50-60 - - 23-30 2-3 -
• Sustaining capital3 275-30075-85 80-90 50-60 40-50 15-25 10-15 5-10
• Projects and development capital 270-300240-280 - - - - 10-15 20-25
Total capital expenditure 315-365 130-150 50-60 40-50 38-55 22-33 25-35 620-690
Exploration expenditure 50-60Depreciation and amortisation (including production stripping) 720-770
31
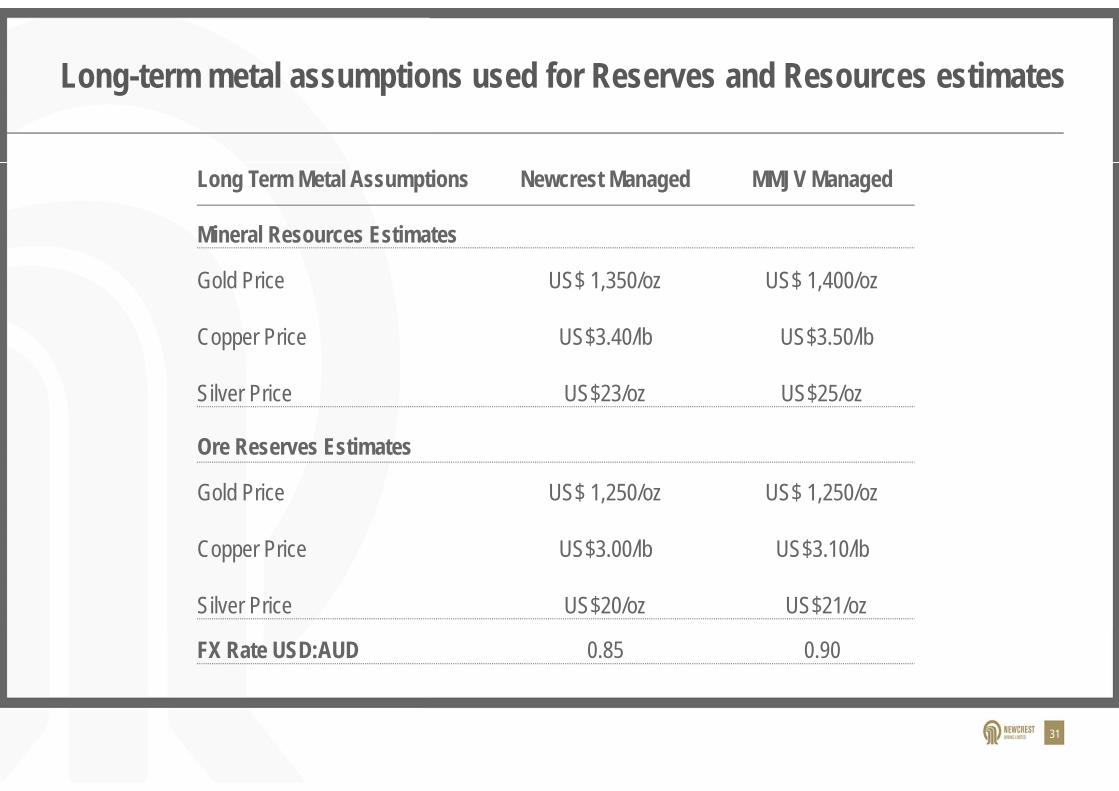
Long-term metal assumptions used for Reserves and Resources estimates
Long Term Metal Assumptions MMJV ManagedNewcrest Managed
Gold Price US$ 1,400/ozUS$ 1,350/oz
Copper Price US$3.50/lbUS$3.40/lb
Silver Price US$25/ozUS$23/oz
Mineral Resources Estimates
Gold Price US$ 1,250/ozUS$ 1,250/oz
Copper Price US$3.10/lbUS$3.00/lb
Silver Price US$21/ozUS$20/oz
Ore Reserves Estimates
FX Rate USD:AUD 0.900.85
32
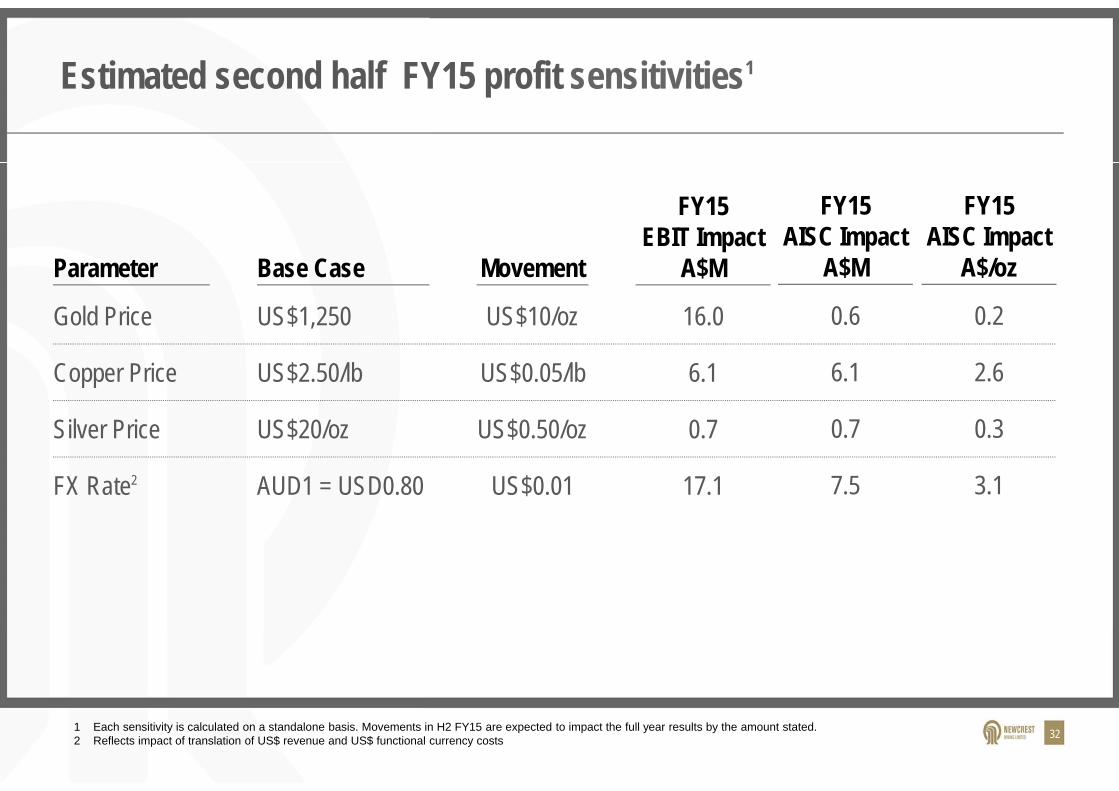
Estimated second half FY15 profit sensitivities1
Parameter MovementBase Case
FY15EBIT Impact
A$M
Gold Price US$10/ozUS$1,250 16.0
Copper Price US$0.05/lbUS$2.50/lb 6.1
Silver Price US$0.50/ozUS$20/oz 0.7
FX Rate2 US$0.01AUD1 = USD0.80 17.1
1 Each sensitivity is calculated on a standalone basis. Movements in H2 FY15 are expected to impact the full year results by the amount stated.2 Reflects impact of translation of US$ revenue and US$ functional currency costs
FY15AISC Impact
A$M
0.6
6.1
0.7
7.5
FY15AISC Impact
A$/oz
0.2
2.6
0.3
3.1

33
Reserves and resources movements
Newcrest Gold Mineral Resource Changes FY14
Newcrest Gold Ore Reserve Changes FY14
150
(3)(5)
(2)
140
Dec‐13 Depletion Adjustments Rounding Dec‐14
Gold (M
oz)
78
0.5 (3)
(0.6)
75
Dec‐13 Depletion Adjustments Rounding Dec‐14
Gold (M
oz)
Key drivers
• Telfer - removal of M-Reefs from Main Dome pit optimisation plus sensitivity to exchange rate.
• Cadia Hill & Bonikro – application of a more conservative constraining pit-shells and increased cut-off grades
• Gosowong – increase due to incremental growth at Toguraci and Kencana.
Key drivers
• Telfer – redesign of Main Dome pit due to proposed underground mining of M-Reefs + sensitivity to exchange rate.
• Bonikro – redesign of Pushback 5 + application of a higher cut-off grade
• Partially offset by increases at Gosowong (resource additions) and Lihir (pit redesign)

34
Peer comparison reserves and reserve life
32
22
20
17 16 16 15
Reserve Life - Gold (Years)1,2
102
8675
66
54 4943
Reserves - Gold (Moz)1,2
1 Reserves reflect proven and probable gold reserves (contained metal) as at 31 December 2014 for Newcrest and 31 December 2013 for other companies, adjusted for subsequent acquisitions and divestments.
2 Reserve life calculated as reserves divided by gold production for the 12 months ended 30 September 2014 for all companies. Gold production numbers have been sourced from Metals Focus Quarterly Gold Mine Cost Service Q3 2014. The reserve life calculation does not take into account Gold recovery rates.
35
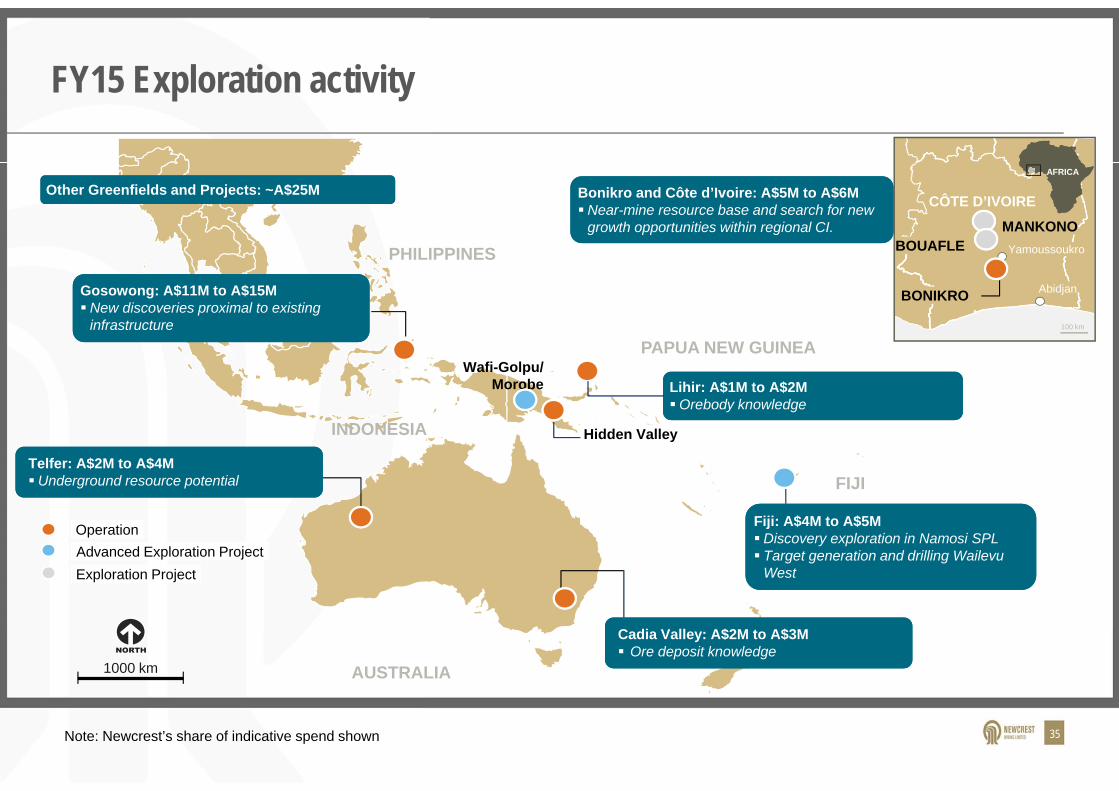
FY15 Exploration activity
PHILIPPINES
Hidden Valley
Wafi-Golpu/Morobe
100 km
AFRICA
Yamoussoukro
AbidjanBONIKRO
MANKONOBOUAFLE
CÔTE D’IVOIRE
PAPUA NEW GUINEA
INDONESIA
AUSTRALIA
FIJI
1000 km
Bonikro and Côte d’Ivoire: A$5M to A$6MNear-mine resource base and search for new
growth opportunities within regional CI.
Bonikro and Côte d’Ivoire: A$5M to A$6MNear-mine resource base and search for new
growth opportunities within regional CI.
Telfer: A$2M to A$4MUnderground resource potentialTelfer: A$2M to A$4MUnderground resource potential
Gosowong: A$11M to A$15MNew discoveries proximal to existing
infrastructure
Gosowong: A$11M to A$15MNew discoveries proximal to existing
infrastructure
Lihir: A$1M to A$2MOrebody knowledgeLihir: A$1M to A$2MOrebody knowledge
Fiji: A$4M to A$5MDiscovery exploration in Namosi SPL Target generation and drilling Wailevu
West
Fiji: A$4M to A$5MDiscovery exploration in Namosi SPL Target generation and drilling Wailevu
West
OperationAdvanced Exploration Project
Note: Newcrest’s share of indicative spend shown
Cadia Valley: A$2M to A$3M Ore deposit knowledgeCadia Valley: A$2M to A$3M Ore deposit knowledge
Other Greenfields and Projects: ~A$25M Other Greenfields and Projects: ~A$25M
Exploration Project