2015-16 District Accountability Overview - SFUSD: Home · te s Achievement Chronic Absenteeism ......
37
2015-16 District Accountability Overview Board of Educa>on Mee>ng, November 15, 2016 1
Transcript of 2015-16 District Accountability Overview - SFUSD: Home · te s Achievement Chronic Absenteeism ......

2015-16DistrictAccountabilityOverview
BoardofEduca>onMee>ng,November15,20161

OverviewforToday’sSession
• Viewourdistrict’sdata
• Ar1culatetheconnec1onbetweenourdistrict’sdataanddistrict/schoolprac1ce
• DemonstratewaysinwhichCentralOfficeandSchoolSitestaffarecollabora1ng…
– tohighlightandexpandsuccessfulprac1cesandiden1fyareasforgrowth– torevisitourstrategiesanddetermineanypoten1alchanges– topreparetoleaddataconversa1onsattheschool/communitylevel
2

SeJngtheContext
3
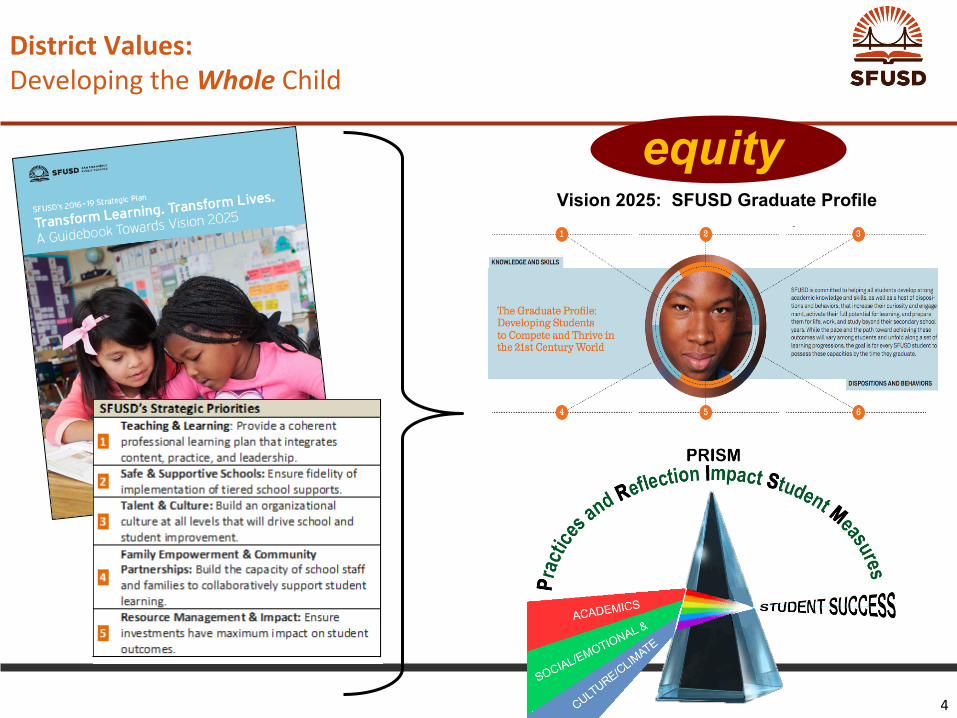
DistrictValues:DevelopingtheWholeChild
Vision 2025: SFUSD Graduate Profile
equity
4

StrategiestoImprove
Moving Toward Vision 2025
2008-2012 2013-2015 2016-2019
Vision 2025
Future Strategic Plans
5

StrategiesinAc>on
6

AccountabilityMeasures
7

BSCs presented
to
BOE
SystemicUseofData:
Dec ’15 Jan ’16 Feb ’16 Mar ’16 Apr ’16 May ’16 Jun ’16 Jul ’16 Aug ’16 Sept ’16
Oct ’16
BSC
Pro
cess
In
terim
and
Sum
mat
ive
Mea
sure
s
Data Conferences & Mid Year Data
Summative Measures CORE Culture/Climate & SEL Surveys
(Feb – April) SBAC (Mar – End of May)
Spring Interim District Assessments
Admin Institute: Data Analysis
Develop and submit 1st Draft of BSCs; Community Forums
Feb 20 – Mar 25
Budget Process Kick-Off and School Planning Retreat
Develop and submit final BSC revisions; SSC Engagement
September
NOTE: Strong correlations exist between Interim and Summative Measures.
Fall Interim District Assessments
Data Conferences Beginning of year
8

NOVEMBER(Mid-Year)Forma>veAccountabilityMeasures(StudentlevelreportsdistributedduringTeacherConferences)
Interim District Assessment Report (grades 3-8)
Standards-based Report Card (grades TK-5) 4-sides per report card; available in English, Arabic, Chinese, Spanish, Tagalog and Vietnamese
2-sides per student report; available in English, Chinese and Spanish
9

DataReview&Reflec>on
10

Connec>ngtheDots:StrategicPlan……....OurIndicators……….LCAPPriority
SCHOOLS CENTRAL ACADEMIC INDICATORS LCAP PRIORITY
Inst
ruct
iona
l Gui
danc
e
Teac
hing
& L
earn
ing
SBAC Performance & Change from Previous Year – ELA & MATH Standards; Achievement
Graduation rate Engagement; Course Access
High school dropout rate Engagement
% of pupils who have passed an advanced placement exam with score of 3+ Achievement; Course Access
% of SFUSD preschool students ready for kindergarten District LCAP Indicator
High school readiness Engagement; Course Access
% of SFUSD 12th graders graduating UC/ CSU ready Other Outcomes
% of ELs who demonstrate growth on CELDT (AMAO1) Achievement
% of ELs who become English proficient (AMAO2) AchievementSCHOOLS CENTRAL SEL/CULTURE CLIMATE INDICATORS LCAP PRIORITY
Stud
ent C
ente
red
Lear
ning
C
limat
e
Safe
& S
uppo
rtiv
e Sc
hool
s ELL Reclassification Rate Achievement
Chronic Absenteeism Rate Engagement
Suspension Rate School Climate
Reduce SpEd dispro. identification of AA Students for Emotional Disturbance School Climate
SEL - Growth Mindset, Self Efficacy, Self Management, Social Awareness School Climate
Culture/Climate Surveys - Students: Positive response rates School Climate
Culture/Climate Surveys - Staff: Positive response rates School Climate
Culture/Climate Surveys - Families: Positive response rates School Climate
11

HowdoIreflectonmydata?
By looking at performance and/or growth across multiple measures and not in isolation.
1. NavigateandUnderstandeachreport• Whatdoesthisreporttellme?• HowdoIaccessandunderstandthedatainthisreport?• WhatotherdatadoIneedtogetamorecompletepicture?
2. ReflectonPerformanceandChangeacrossmul1plemeasures(OverallandSubgroups)
• Whatarethe1–2strengthsthatstandout?• Whatarethe1–2areasforgrowththatstandout?
3. ConfirmyourBSCGoalsandAc>onsbasedonyourreflec1ons• WhatstrengthsorareasforgrowthareconsistenttowhatIiden1fiedinmy
BSCdraW?(likelyconfirmsBSCGoalsandAc1ons)• WhatstrengthsorareasforgrowtharedifferentfromwhatIiden1fiedin
myBSCdraW?(poten1alrevisionofGoalsandAc1ons)• Whatac5onswillItaketoimprove?Iseveryac1onmo1vatedbythedata?• HowwillIknowifthoseac1onsareleadingtoimprovement?
12

DistrictDemographics
9.3% 0.4%
34.1%
3.6% 4.7%
29.3%
1.2%
3.6%
13.9%
SFUSD Enrollment
African American American Indian Asian
Decline to State Filipino Latino
Pacific Islander Two or More Races White 0.0% 10.0% 20.0% 30.0% 40.0% 50.0% 60.0% 70.0%
English Language Learner
Free & Reduced Lunch
Foster Youth
Special Education
27.3%
62.3%
1.2%
11.5%
SFUSD Special Programs (N= 58,865)
As reported on October 7, 2015, SFUSD student enrollment was 58,865 in grades K to 12 (includes transitional Kindergarten and 13 charter schools).Source: California Department of Education (CDE)
13
AcademicIndicators• Gradua1onrates• Dropoutrates• SBACPerformance&ChangefromPreviousYear–ELA&MATHReadinessIndicators• %ofSFUSDpreschoolstudentsreadyforkindergarten• Highschoolreadiness• %ofSFUSD12thgradersgradua1ngUC/CSUreadyELDIndicators• ELRedesigna1on• %ofELswhodemonstrategrowthonCELDT(AMAO1)• %ofELswhobecomeEnglishproficient(AMAO2)
ACADEMICINDICATORS
14

Gradua>on&DropoutData
77.2
81.8 82.2 81.6 83.9
84.9
56.9 63.6
71.0
65.5 64.3 71.2
88.6 89.5 89.7 89.0 91.6 92.0
59.5
67.9
67.4
68.4 69.3 72.7
78.3 85.2
82.2 83.9 87.3
84.7
50
55
60
65
70
75
80
85
90
95
2009-10 2010-11 2011-12 2012-13 2013-14 2014-15
SFUSD Cohort Graduation %'s
SFUSD African American Asian Latino White
11.3 10.5 10.1 9.0
7.9 7.0
18.8 20.8
15.1 16.5
17.7 16.4
6.2 5.7 5.4 5.7 4.1 3.2
20.3 19.7
19.1
13.7 14.2 12.5 13.1
9.1
13.2
10.4
7.3
7.8
0
5
10
15
20
25
2009-10 2010-11 2011-12 2012-13 2013-14 2014-15
SFUSD Cohort Dropout %'s
SFUSD African American Asian Latino White
Source: California Department of Education (CDE)
SFUSD’s Cohort Graduation Rate has increased to almost 85% (represents 7.7% increase since 2009-10). It is noteworthy when looking at a 5 year trend in graduation rates that we saw significant increases among all our targeted subgroups. SFUSD increased the African American graduation rate by 14.3% and the Latino graduation rate by increased by 13.2% in the last 5 years.
15

SBACELA&MATH–StatevsDistrict
0
10
20
30
40
50
60
70
Gr 3 Gr 4 Gr 5 Gr 6 Gr 7 Gr 8 Gr 11 Total
43 44 49 48 48 48
59
49 48 49 55 53 53 52
67
53
SBAC English Language Arts
State SFUSD
0 10 20 30 40 50 60 70 80
African American
Asian Latino White Eng Lang Learner
Special Ed
31
76
37
64
13 14 18
69
28
76
20 15
SBAC English Language Arts
State SFUSD
0
10
20
30
40
50
60
Gr 3 Gr 4 Gr 5 Gr 6 Gr 7 Gr 8 Gr 11 Total
46
38 33 35 36 36
33 37
56 49 46 46
51 49 52 50
SBAC Mathematics
State SFUSD
0 10 20 30 40 50 60 70 80
African Amer
Asian Latino White ELL Special Ed
18
72
24
53
12 11 12
70
21
69
27
16
SBAC Mathematics
State SFUSD 16

AcademicAchievementHighlights–SBACELA
Summary
Grade
Gender
Race/Ethnicity
SFUSD Language Fluency
English Learner & Redesignated
Language Pathway
Special Education Status
Economic Status
Local Control & Accountability Plan (LCAP)
17

Overall Performance Subgroup Performance • 53%ofSFUSDstudentsmee1ngorexceeding
standardforEnglishLanguageArts(ELA,upfrom52%lastyear),and
• 50%mee1ngorexceedingstandardforMath(upfrom48%lastyear)
Theperformanceofourtargetedgroupsshowsapersistentachievementgap,especiallyforourAfricanAmericanstudents.Theirrateofperformanceinmathema1csatalllevelsareextremelylow.Asstudentsmoveupingradelevels,theincreaseddifficultylevelofthecontentaccentuatestheachievementgap,especiallyinmath.
Grades3-5maintainedpercentmee1ngorexceedingstandardinELA(50.5%)andMath(50.1%).
Grades3-5:• African-American(17.5%inELAand14.1%inMath)• La1no(28.3%inELAand24.8%inMath)• PacificIslanders(31.0%inELAand29.6%inMath)
Grades6-8showedsignificantgainsthepercentmee1ngorexceedingstandardinELA(52.5%,up2.5%fromlastyear)andMath(48.2%,up1.8%fromlastyear).
Grades6-8:• African-American(16.3%inELAand10.4%inMath)• La1no(24.2%inELAand17.9%inMath)• PacificIslanders(14.4%inELAand16.0%inMath)
Grade11increasedthepercentmee1ngorexceedingstandardandshowedgainsinELA(66.7%,up1.2%fromlastyear)andMath(52.1%,up2.7%fromlastyear).
Grade11:• African-American(33.2%inELAand10.3%inMath)• La1no(42.6%inELAand15.7%inMath)
SFUSD:SBACELAandMath,OverallandSubgroupPerformance
18

SFUSD:ComparisontoCOREDistricts
• SFUSDistheonlydistrictamongallCOREdistrictswhere50%ormoreofallstudentsaremee1ngorexceedingstandardsinbothELAandMath.
• WhenlookingatsubgroupdataforCOREdistricts,ourAAandLa1nostudentshadlowerproficiencyratesandshowedlessgrowth.
• OurProgramstudents,ELandSPED,hadthehighestproficiencyratescomparedtootherCOREdistrictsinELAandMath,butshowedlessgrowth.
19

SFUSD:SchoolPerformance
Schools that scored: • Above the district average on BOTH content areas, and/or • Made significant improvements overall and for targeted
subgroups (AA, Latino, EL & SPED) from last year
SchoolLevel SchoolsElementary/K-8Schools(Grades3-5)
Lafayeke,Clarendon,Alamo,McCoppin,Argonne,Ortega,Serra,andBryant
Middle/K-8Schools(Grades6-8)
Lilienthal,Lawton,Giannini,Roosevelt,Aptos,Marina,andHoover
HighSchools(Grade11)
Lowell,Lincoln,TheAcademy,andSFInterna1onal
20

Rela>onshipbetweenForma>veandSumma>veMeasures:Informingusalongtheway…
ELA Measure Predicting Correlation
F&P: Gr 2 EOY, 2015 SBAC: Gr 3 ELA Scale Score, 2016 ~0.57
F&P: Gr 3-8 EOY, 2016 SBAC: Gr 3-8 ELA Scale Score, 2016 ~0.55
SRI: Gr 3-HS Window 1 & 2 NCE Score, 2016 SBAC: Gr 3-HS ELA Scale Score, 2016 ~0.73
ELA IAB: Gr 3-HS Fall and Spring, 2015-16 SBAC: Gr 3-HS ELA Scale Score, 2016 ~0.87
ELA Writing Tasks: Gr 3-HS, 2015-16 SBAC: Gr 3-HS ELA Scale Score, 2016 ~0.54
Math Measure Predicting Correlation
Math IAB: Gr 3-HS Fall and Spring, 2015-16 SBAC: Gr 3-HS Math Scale Score, 2016 ~0.85
Math Milestone Tasks: Gr 3-HS, 2015-16 SBAC: Gr 3-HS Math Scale Score, 2016 ~0.61
21

ReadinessIndicators
41 47
53 55
45 43
55 52
58 53
61 67
17
33 36 34
56
76 80
75
0
10
20
30
40
50
60
70
80
90
2012-13 2013-14 2014-15 2015-16
SFUSD Kindergarten Readiness Rate %
SFUSD African American Chinese Latino White
0
20
40
60
80
100
SFUSD African American
Asian Latino White
63.4
27.8
84.2
42.7
63.6 65.8
30.4
89.0
45.6
64.4
SFUSD High School Readiness Rate %
2014-15 2015-16
52.4 55.8 56.2 56.9 59.8
22.0 27.6 27.8 24.6
31.7
65.1 68.2 68.1 65.9
76.3
35.6 35.8 36.3 45.0
39.5
58.0 62.1 62.2
66.4 64.3
0
10
20
30
40
50
60
70
80
90
2010-11 2011-12 2012-13 2013-14 2014-15
SFUSD UC Readiness Rate %
SFUSD African American Asian Latino White
22
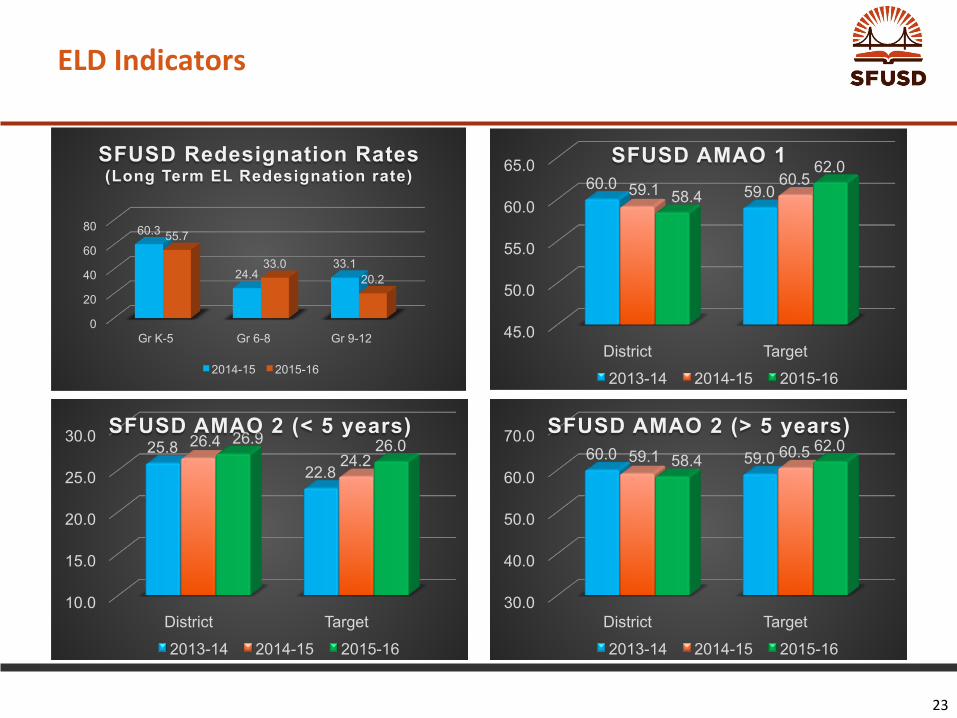
ELDIndicators
0
20
40
60
80
Gr K-5 Gr 6-8 Gr 9-12
60.3
24.4 33.1
55.7
33.0 20.2
SFUSD Redesignation Rates (Long Term EL Redesignation rate)
2014-15 2015-16
45.0
50.0
55.0
60.0
65.0
District Target
60.0 59.0 59.1 60.5 58.4
62.0 SFUSD AMAO 1
2013-14 2014-15 2015-16
30.0
40.0
50.0
60.0
70.0
District Target
60.0 59.0 59.1 60.5 58.4 62.0
SFUSD AMAO 2 (> 5 years)
2013-14 2014-15 2015-16
10.0
15.0
20.0
25.0
30.0
District Target
25.8 22.8
26.4 24.2
26.9 26.0 SFUSD AMAO 2 (< 5 years)
2013-14 2014-15 2015-16
23

CULTURECLIMATEINDICATORS• ChronicAbsenteeismRate• SuspensionRateSEL/CultureClimateSurveys• SELSurveys-GrowthMindset,SelfEfficacy,SelfManagement,SocialAwareness• Culture/ClimateSurveys-Students:Posi1veresponserates• Culture/ClimateSurveys-Staff:Posi1veresponserates• Culture/ClimateSurveys-Families:Posi1veresponserates
SEL/CultureClimateINDICATORS
24

Culture/ClimateIndicators
0 5
10 15 20 25 30
Totals African American
Asian Latino White
9.8
28.1
1.9
14.7
4.9 6.5
20.6
0.9
9.5 7.1
11.8
26.2
4.3
20.3
12.8
SFUSD 2015-16 Chronic Absenteeism Rate %
Gr K-5 Gr 6-8 Gr 9-12
0
5
10
15
SFUSD African American
Asian Latino White
0.3 2.0
0.1 0.3 0.2
3.3
14.1
0.3
5.0
1.4 2.0
10.2
0.6 2.4 1.4
SFUSD 2015-16 Suspension Rate %
Gr K-5 Gr 6-8 Gr 9-12
25
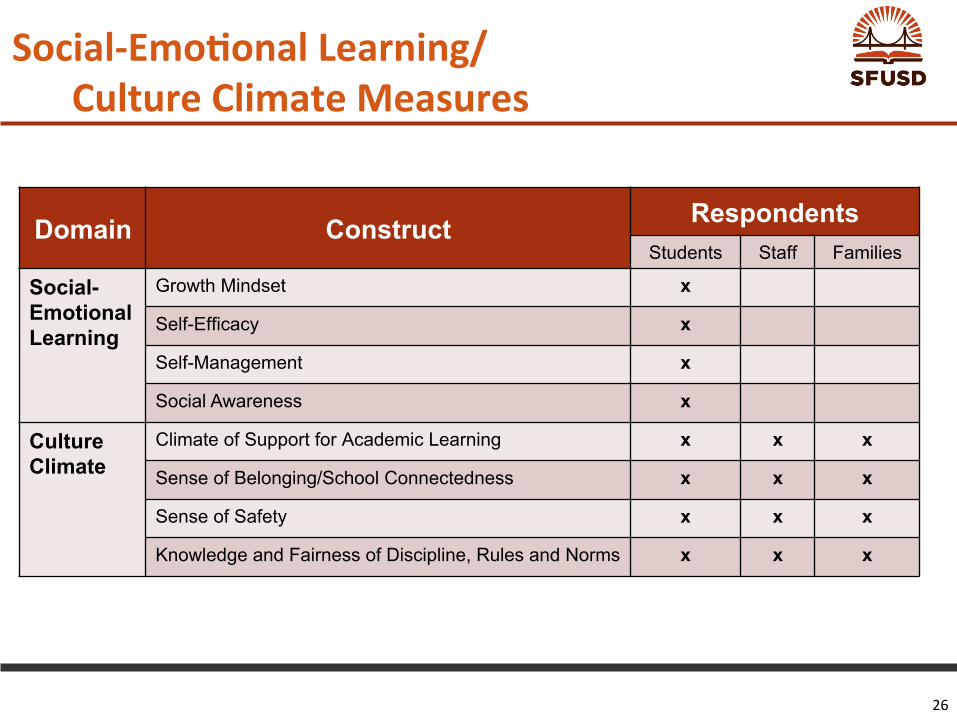
Social-Emo>onalLearning/CultureClimateMeasures
Domain Construct Respondents Students Staff Families
Social-Emotional Learning
Growth Mindset x
Self-Efficacy x
Self-Management x
Social Awareness x
Culture Climate
Climate of Support for Academic Learning x x x
Sense of Belonging/School Connectedness x x x
Sense of Safety x x x
Knowledge and Fairness of Discipline, Rules and Norms x x x
26
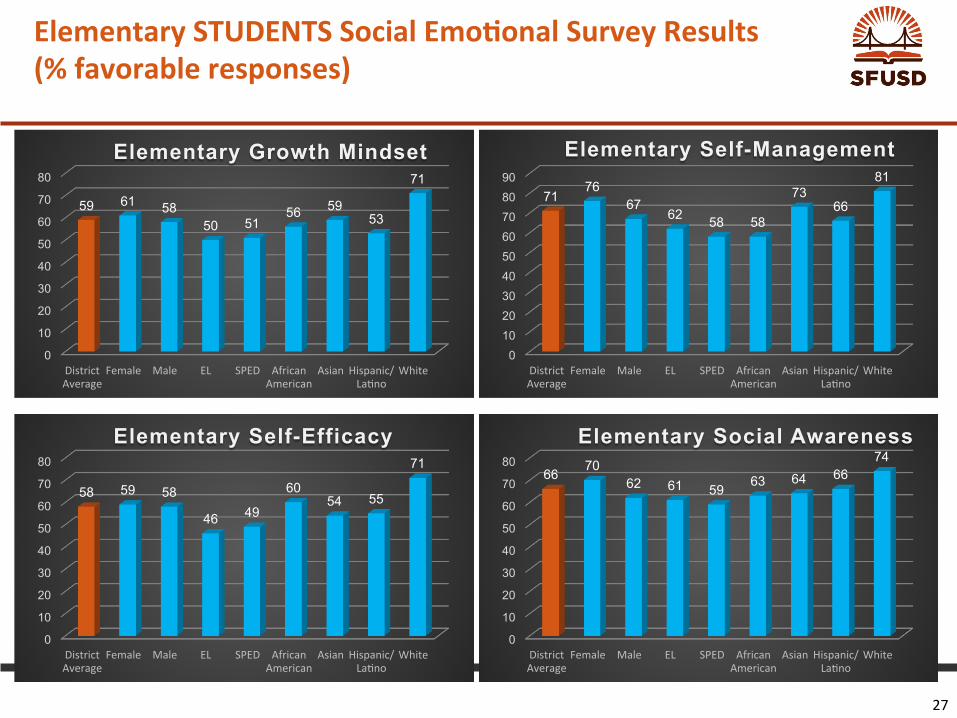
ElementarySTUDENTSSocialEmo>onalSurveyResults(%favorableresponses)
0 10 20 30 40 50 60 70 80 90
DistrictAverage
Female Male EL SPED AfricanAmerican
Asian Hispanic/La1no
White
71 76
67 62 58 58
73 66
81
Elementary Self-Management
0
10
20
30
40
50
60
70
80
DistrictAverage
Female Male EL SPED AfricanAmerican
Asian Hispanic/La1no
White
59 61 58 50 51
56 59 53
71
Elementary Growth Mindset
0
10
20
30
40
50
60
70
80
DistrictAverage
Female Male EL SPED AfricanAmerican
Asian Hispanic/La1no
White
58 59 58
46 49
60 54 55
71
Elementary Self-Efficacy
0
10
20
30
40
50
60
70
80
DistrictAverage
Female Male EL SPED AfricanAmerican
Asian Hispanic/La1no
White
66 70
62 61 59 63 64 66
74 Elementary Social Awareness
27

SecondarySTUDENTSSocialEmo>onalSurveyResults(%favorableresponses)
0
10
20
30
40
50
60
70
80
DistrictAverage
Female Male EL SPED AfricanAmerican
Asian Hispanic/La1no
White
75 78 73
67 62 63
79
69
80 Secondary Self-Management
0
10
20
30
40
50
60
70
80
DistrictAverage
Female Male EL SPED AfricanAmerican
Asian Hispanic/La1no
White
61 61 61
46 45
57 63
53
72
Secondary Growth Mindset
0
10
20
30
40
50
60
70
DistrictAverage
Female Male EL SPED AfricanAmerican
Asian Hispanic/La1no
White
52 48
55
43 40
49 53
44
65 Secondary Self-Efficacy
0
10
20
30
40
50
60
70
DistrictAverage
Female Male EL SPED AfricanAmerican
Asian Hispanic/La1no
White
61 65
58 56 53 55 62
58
69 Secondary Social Awareness
28

CultureClimateSurveyResults-STUDENTS,STAFF&FAMILIES(%favorableresponses)
58 60 62 64 66 68 70 72 74 76 73 74
71 70
67 65
73 72
76 Elementary Students
50 52 54 56 58 60 62 64 66 64 64 64
66
61
56
65 63 64
Secondary Students
86 87 88 89 90 91 92 93 94 95
DistrictAverage
EL SPED ES MS K8 HS Asian AfricanAmerican
Hispanic/La1no
White
92
95
92
94
90 89
91
94
89
93
91
Family
69 70 71 72 73 74 75 76 77 78
District Average
Non- Teacher
Teacher 0 to 1 year
1 to 2 years
3 to 5 years
6 to 10 years
Over 10 years
74
78
72
75 74
72 73
76
Staff
29

SFUSD:Social-Emo>onalLearning/CultureClimateMeasures
SOCIAL/EMOTIONALLEARNINGSKILLS:StudentResults• AcrossthefourSELdomains,Self-ManagementhadthemostfavorableresponseratesbySFUSDstudents,withabove70%averagefavorabilityra1ngattheelementaryandsecondarylevels.However,thisdomainalsohadalargedisparityforAfricanAmericanandSpecialEduca1onstudentsfromthedistrictaveragera1ng.
• Ontheotherhand,GrowthMindset(59%favorabilityforelementarystudentsand61%favorabilityforsecondarystudents)andSelfEfficacy(58%favorabilityforelementarystudentsand52%favorabilityforsecondarystudents)hadtheleastfavorableresponserates.Disaggrega1ngbysubgroups,ELandSPEDstudentshadthelowestratesonbothdomains.
• ThehighestfavorableresponseratesonallfourSELdomainswerefromWhitestudents(responserateswere8-14%higherthantheoverallrate).
CULTURE/CLIMATEMEASURES:Student,Staff&FamilyResults• ELEMENTARYSTUDENTS:Acrossallsubgroups,Whitestudentshavethemostfavorablepercep1on(76%)ofCulture-ClimateandtheAfricanAmericanstudentshadtheleastfavorablepercep1on(65%).
• SECONDARYSTUDENTS:Acrossallsubgroups,ELstudentshavethemostfavorablepercep1onofCulture-Climate(66%)andtheAfricanAmericanstudentshadtheleastfavorablepercep1on(56%).
• STAFF:Staffthathasbeenhereforover10yearshadthemostfavorablepercep1on(76%).• FAMILY:Familyresponsesatallschoollevelsweresignificantlymorefavorablethanstudentsorstaff.Overall,andacrossallsubgroupstheirrateoffavorableresponseswas>89%.
30

2016SBACELArelatedto2016OverallSELMeasures
SFUS
D G
rade
s 6−
8 Av
erag
e SB
AC P
rofic
ienc
y (5
3%)
SFUSD Grades 6−8 Average SEL Favorability (62%)
High SELHigh SBAC
Low SELLow SBAC
Low SELHigh SBAC
High SELLow SBAC
10
30
50
70
90
55 60 65 70 75% of Students at a School Responding Favorably on Aggregated Social−Emotional Learning (SEL) Measures
% o
f Stu
dent
s at
a S
choo
l Pro
ficie
nt o
n 20
16 S
BAC
ELA
Scatterplot of Grades 6−8 2016 SBAC ELA Proficiency vs. 2016 Social Emotional Learning Favorability
31

ElementarySchools:Rela>onshipbetweenAcademicandSELData
Majority of these schools had high rates of ELL students
Majority of these schools showed improvement on the SBAC as compared to the previous year
32

ASchool’sData
33

ASchool’sDataandReflec>on
ACADEMIC REFLECTION - Successful Practices: 70% full implementation of Balanced Literacy. Implementing designated and integrated ELD with fidelity. Math Class Labs and PD with C&I department. In math classes, focus on math strategy and the 3 read protocol. Grade level collaboration around data for selected focal students. Target: Increase SBAC proficiency by 5% at all grade levels and F&P proficiency levels to at least 80% by Grade 2. Next steps: Commitment to the lesson study process and 100% implementation of Balanced Literacy. Continue our focus on focal students. Develop focused ELD lessons. SEL/CC REFLECTION - Successful Practices: Our attendance liaison, monitoring of attendance data, routines for rewarding good attendance and communication about the importance around attendance are reasons for our high attendance rate. For Culture/ Climate two of the early release days used for establishing relationships with after school program and community partners. Posted and practiced behavioral expectations. Teachers practice appreciating effort (eg. PAX games). Target: Chronic Absenteeism rate <5%. Improve Social Emotional skills by 5%. Increases in culture-climate favorability. Next steps: Maintain attendance strategies and share success with staff and families.Use report card rubric for monitoring SEL/ CC measures. Implementation of Positive Behavior Intervention & Supports. Teachers will select different skill areas to discuss during ILT. 34

ASchool’sDataandAcademicReflec>on
ACADEMIC REFLECTION – Successful Practices: 70% full implementation of Balanced Literacy. Implementing designated and integrated ELD with fidelity. Math Class Labs and PD with C&I department. In math classes, focus on math strategy and the 3 read protocol. Grade level collaboration around data for selected focal students. Target: Increase SBAC proficiency by 5% at all grade levels and F&P proficiency levels to at least 80% by Grade 2. Next steps: Commitment to the lesson study process and 100% implementation of Balanced Literacy. Continue our focus on focal students. Develop focused ELD lessons.
35

ASchool’sDataandSEL/CCReflec>on
SEL/CC REFLECTION - Successful Practices: Our attendance liaison, monitoring of attendance data, routines for rewarding good attendance and communication about the importance around attendance are reasons for our high attendance rate. For Culture/ Climate two of the early release days used for establishing relationships with after school program and community partners. Posted and practiced behavioral expectations. Teachers practice appreciating effort (eg. PAX games). Target: Chronic Absenteeism rate <5%. Improve Social Emotional skills by 5%. Increases in culture-climate favorability. Next steps: Maintain attendance strategies and share success with staff and families.Use report card rubric for monitoring SEL/ CC measures. Implementation of Positive Behavior Intervention & Supports. Teachers will select different skill areas to discuss during ILT.
36

Foralldataques1ons,pleasecontactResearch,Planning&Assessment
Presenters
RituKhanna,Chief,[email protected]
JohnBurke,Supervisor,[email protected]
DistrictAssessmentOverviewandpowerpointpresenta1oncanbefoundontheRPADistrictDataCenterwebpageweb.sfusd.edu/services/research_public/default.aspx
RESEARCH, PLANNING & ASSESSMENT TEL: (415) 241-6454 FAX: (415) 241-6035
San Francisco Unified School District • 555 Franklin Street • San Francisco, California 94102-5299
37