2014 - One Vision Housing (OVH) | Housing provider in...
18
2014
Transcript of 2014 - One Vision Housing (OVH) | Housing provider in...

2014

Page 2
At One Vision Housing we strive to be one of the best Registered Providers of Social Housing in the
country, offering excellent value for money (VFM) in the services we offer to our customers.
VFM sits at the very heart of our activities, with our commitments to:
• Optimise the use of our assets and resources
• Improve the health and economic well-being of our customers through our social, economic and
environmental activities
• Reinvest any additional capacity that we create to improve services, mitigate risk and invest in the
development of our housing stock
• Maintain the very highest levels of customer service
To date we have developed and deployed a robust and challenging approach to the pursuit of value for
money. Since 2006 we have made £54m of efficiency savings in addition to delivering a range of broader
social outcomes achieved through our programmes of financial inclusion, employment, apprenticeships
and community development.
VFM is embedded within our organisational culture. We have always recognised its importance and
necessity. VFM enables us to achieve our strategic aims and objectives. Our proactive approach to VFM
positions us to meet the risks, challenges and opportunities that lie ahead of us.
In our view this self-assessment does more than simply demonstrate our compliance with the HCA’s
Economic Standards in relation to VFM. We believe this self-assessment demonstrates that VFM sits at the
heart of everything we do and is a key component of our continuing success.
Darren Hardy – Chair of the Board
Roy Williams – Chief Executive

Page 3
We are clear that for OVH value for money is about:
An excellent customer experience.
Clear outcomes directly linked to the way we spend our money, and…
Using the innovative Sovini Group business model to drive efficiency through our Group Partners.
Due to OVH’s clear Strategic approach to VFM planning and reporting with its key stakeholders we believe
that OVH is compliant, and will continue to be compliant with the HCA’s Economic Standards relating to
Value for Money.
At OVH we have a vision ‘to be the best’. The way we use our resources is a crucial foundation in our
Strategic Plan 2014-19 that allows us to progress our corporate aims and objectives:
To deliver value for money, and excellent services
Recruit, develop and retain excellent people
Provide homes that people want to live in
Maintain safe, secure, and sustainable neighbourhoods
Prioritise services effectively and exceed customer aspirations
Make a positive impact on our communities and the wider society
We are clear that value and excellent customer experience are closely entwined. We always aim to excel
in the way we deliver services which runs alongside our Performance Management Framework (PMF)
which details the mechanisms for monitoring and reporting performance, costs and outcomes for our
customers. We use our Risk Management Framework (RMF) to assess and calculate our risks and stress
test our Business Plan.
The value for money approach for OVH is applied from Group level and directly links to the Sovini Group
vision “Creating the environment for success”. The Sovini VFM Strategy sets out how the activities of the
wider Sovini Group Partners (of which OVH is one partner) who will drive efficiency, VAT and other
productivity savings through the provision of ‘shared’ and ‘self-delivered’ services and in doing so part fulfil
their social, economic and environmental responsibilities. The VFM Strategy also outlines how Group
Partners will strive to seek and secure new, profitable external contracts.
Our leaders and business model are geared towards future business development. We have an agreed 30
year Business Plan with our funder which is delivered through our five year Strategic Plans with key
milestones outlined in our annual Service Delivery Plans.
We are an evolving business, achieving sustainable growth through an innovative business model which
incorporates a group structure of both commercial and not-for-profit organisations. This model allows
profits to be gift aided to the not-for-profit partners for reinvestment in social businesses.

Page 4
A further aspect of sustainability planning is our goal of creating safe and secure communities. Our impact
in our neighbourhoods and communities is assessed through Neighbourhood Plans and we work with local
intelligence, including direct feedback from customers. This intelligence helps to define future plans.
There is a defined process for allocating financial, physical and technological resources in support of
strategy. These are identified and assessed as part of the strategic planning process and on a more regular
basis through service reviews.
Our 30 year Business Plan, which details our income and expenditure forecasts, is approved by Board and
our funders annually. This has more prudent assumptions and reflects our strategic risk mitigation.
Our Annual Base Budget sets more stretching financial performance targets than the approved Business
Plan. This is produced using Zero Based Budgeting to ensure that our core operating costs are affordable
and to determine what additional resources are available for growth and service improvement priorities as
identified in our Service Delivery Plans.
Our Risk Management Framework is fully automated in Covalent our Performance Management System. Both
strategic and operational risks are logged, impact assessed and prioritised for action. Risk owners are assigned
and accountable for risk improvement actions and the outputs and progress of their actions is used to provide
assurance to our Board through the Business Assurance Committee. This enables One Vision to identify, assess
and monitor risks on a continuous basis. Strategic risks are reviewed monthly with action taken to control and
minimise risk.
Through regular reviews, we have made improvements to our approach (for example, reviewing our
framework annually to ensure that our approach to risk and appetite for it remains aligned to business
priorities). Our risk register is updated upon identification of new or developing risk.
Stress testing through scenario planning, is undertaken as an integral part of our strategic planning to
identify the potential impact of critical changes to the external environment, this is reflected in our
strategic planning and risk management processes.
For example, OVH participates in the Merseyside Pension Scheme (MPS), which is currently a defined benefit (final salary) Pension Scheme (DBPS). Pension costs are reassessed and valued every three years by an independent qualified actuary. The last actuarial valuation was carried out in 2013/14. This reported that our scheme is 85% funded and our forecast pension deficit is £4.3m. This risk has been fully reviewed and mitigated, with the deficit fully funded and reflected in our latest Business Plan and the scheme remains open to new employees.
A Performance Management Framework has been devised to enable us to deliver our vision, mission and
strategic aims by linking the key objectives to performance measures and targets that are regularly evaluated
and reviewed.
The PMF ensures that the arrangement and monitoring of service delivery is undertaken consistently, in a
measured way and that our operational objectives and the Board’s strategic priorities are aligned. Targets

Page 5
are set with key stakeholders and are reviewed annually to ensure that they continue to support the aims
and objectives of our organisation and vision to be the best.
Further evidence of successful service delivery and efficient business processes are the accreditations we
currently hold which include:
Customer Service Excellence
Investors in People Gold Standard
Quality Management System ISO 9001:2008
Environmental Management System ISO 14001:2004
Customer Contact Centre Association Global Standard
TPAS Quality Assured Scrutiny, Landlord reaccreditation and Contractor reaccreditation
Housemark Anti-Social Behaviour Accreditation
Income Management Excellence Accreditation (HQN)
Housemark Complaints Accreditation
The OVH Board drive VFM, through the Business Planning process they establish a budget and through
regular review and scrutiny throughout the year they assess the quality of service and the performance
against budget. The Board always make business decisions with VFM in mind and this is embedded within
the strategic aims of the organisation. Below are some examples of decisions that the Board have made
that directly impact on VFM:
The pricing structure put in place for repair, maintenance and investment works when Sovini Property
Services (SPS) was first established was based on the rates previously paid to Connaught our external
repairs contractor. Since 2010/11 SPS have gift aided circa £18m of their profits to OVH, who have
reinvested these resources to improve services, build new homes (174 to date) and create new job
opportunities and outcomes. From April 2014, a new pricing methodology based upon National
Housing Federation (NHF) Schedule of Rates has been agreed. This has resulted in OVH retaining £2m
per annum (recurring) efficiency and VAT savings, which are being utilised to complete energy
efficiency (with potential energy grant gains), neighbourhood plan and other investment
improvements, including servicing the funding of 437 new homes in the next five years. Under the new
pricing arrangements OVH will continue receive the same high standards of service and social (job)
outcomes from SPS, but at a significantly reduced cost.
This year Board made a decision following an options appraisal for high rise blocks. The Board
considered the implications of the Bedroom Tax, current demand issues and increased void levels in
relation to high rise properties as well as the cost of refurbishment, demolition and the status quo. By
discussing the options appraisal and the risk associated with each option, the Board decided to
demolish two high rise blocks (149 homes) with the intention of working with our funder to use
unutilised elements of the existing £100m loan facility to build new homes in those areas of Sefton
where the supply of social housing is increasingly in short supply and where demand from prospective
tenants is higher than can currently be met.
In 2013/14 the Board have been heavily involved in the restructure of the current loan portfolio to arrange borrowing via a Private Placement (PP) with a new investor. The Board discussed and reviewed options at meetings in July 2013, November 2013 and February 2014 to come to their decision to

Page 6
refinance to the value of £40m. The Board reached this decision by working with the management team as well as an independent treasury advisor to make sure the refinancing provided value and assisted OVH to achieve its strategic aims. Business Plan modelling which incorporated various borrowing options and indicate development programme assumptions was carried out to clearly demonstrate and define the outcomes. By accessing new funds via a PP OVH is able to secure long term funding (30 years at a rate of circa 5%), at a time when traditional lenders are restricting new lending to no more than seven years. The new arrangements will enable OVH to progress a development programme of 437 homes and the opportunity to revisit capital markets in 2017/18, with an additional borrowing capacity of circa £63m.
The main stakeholder group for OVH are our current and future tenants, the people who drive demand for our service. However, we operate in a complex environment that means the wider list of stakeholders include:
Our regulator the Homes and Communities Agency
The Government - both nationally and locally
Public Health providers
Police, Fire and Ambulance Services
Education and training providers that operate in our neighbourhoods
Third Sector organisations that deliver services in our neighbourhoods
Our funders, Royal Bank of Scotland
The taxpayer, through Housing Benefit payments We engage with stakeholders through formal and informal mechanisms to understand their needs and deliver services to meet those needs. We think that OVH offers value, albeit different, to each of our stakeholders by operating in a professional and transparent way in line with our Corporate Values.
We have implemented a TPAS accredited Resident Empowerment and Community Governance Strategy,
that facilitates a number of engagement mechanisms with customers. It allows them to influence standards of
service delivery, review our performance and suggest ideas for improvement through review and scrutiny.
“Reviewing performance allows the residents to ensure that the services we receive remain
effective and continue to deliver value for the money that is spent in providing them. It also
allows the providers of the services to understand the values and expectations of the residents
who are using the service.”
Anthony Bailey, Tenant, member of the Value-for-Money Steering Group and the OVH Customer and
Neighbourhoods Service Review Group.
We publish an Annual Report to tenants that includes evidence of our compliance against the consumer and
economic standards for housing, along with our performance for the year, including a breakdown of where our
money comes from and how it is spent. We continue to develop this approach further with customers, allowing
direct input and each year it has been improved following review and feedback from staff and customers who
attend our editorial panel.
We manage our wider stakeholder relationships, actively promoting a no surprise culture and ensuring that our
communication remains effective.

Page 7
The recruitment and management of our staff is aligned to the organisational values to ensure we invest
where it matters most. Our values are integrated into the recruitment process from identification of a
resource requirement (to support the delivery of our strategic plan), through to advertisement of the
vacancy and selection of the successful candidate. We assess candidates against the values of the
organisation throughout the recruitment process and understand the importance of getting the ‘right fit’
with our culture. An innovative assessment centre has been designed to test potential candidates using
psychometric exercises and team building activities. Our process now ensures the best possible
opportunity for candidates to show their suitability for us and their commitment to our values.
On the back of our success in the Sunday Times Best Companies, (No.1 in 2012 and 2013,) and the overall
UK Winner of the UK Excellence Awards 2013, we are also first in the ‘UK Great Workplaces Awards’ 2014.
We were also awarded two of the six special awards for delivering excellence in wellbeing, and delivering
excellence in employee voice.
We have annual performance appraisals and personal improvement plans for all staff which link to our
values, strategic aims and objectives through the employee appraisal process. The appraisal process
focuses on personal and professional competencies, delivery of targets, and identification of development
needs aligned to the Strategic Plan.
Our staff survey results demonstrate our high staff engagement with VFM and the visions for the
organisation, as well as their satisfaction with OVH as an employer.

Page 8
OVH was formed as an LSVT in 2006, following the transfer of 11,500 homes from Sefton Council. We are now a more mature organisation with a demonstrable track record in outperforming our service, operational and financial
targets and realising year on year cashable efficiencies (circa £50m)1. Our stock is located across the local authority area, and to manage the diversity of our stock profile we have divided our homes into 18 neighbourhood areas that reflect the geography of our neighbourhoods and largely aligns to the archetype of our homes.
Deprivation in Sefton is higher than the UK average. About 10,000 children live in poverty and life expectancy for
men and women is lower than the UK average. Sefton has higher than national average housing benefit
claimants, alongside a high three or more bedroom stock profile. In 2013/14 this has resulted in considerable
strain to the organisation with tenants moving due to bedroom tax and a lack of appropriately sized alternate
homes. Once empty we are also struggling to relet these larger homes to capacity.
Our relet times have increased from 20.9 days in 2012/13 to 33.3 days in 2013/14, with relet times for three
bedroomed homes averaging 39.3 days in 2013/14. The onset of Welfare Reform and choice based lettings has
resulted in greater mobility and desire to move in our client base. The effect of these changes has been to
increase the amount of rent lost to the organisation from homes being void more often and for longer periods.
The impact of Welfare Reform is now a standard agenda item at every Board and management meeting to
ensure we mitigate the risk on the business.
In 2013/14 we reassessed the support needs of our tenants, which meant that 589 of our existing tenants no longer required support. In light of this and following negotiations with Sefton Borough Council we converted 589 properties from supported housing to general needs homes and plans provide intensive housing management and service funded from other sources of income. In addition we restructured our staffing resources internally to reflect this shift in service provision. This continues to support our vulnerable customers and is sustainable going forward.
March 2012 March 2013 March 2014
General needs homes 9,398 9,516 10,108
Average rent for general needs home £72.69 £77.49 £81.42
Supported housing 1,600 1,519 912
Average rent for a supported home £62.81 £67.93 £70.32
Intermediate rent homes 0 0 6
Affordable rent homes 0 0 6
Leaseholder homes 557 561 566
Non-social rented homes 16 39 71
Total homes owned2 11,571 11,635 11,669
The number of homes we own has increased slightly in 2013/14, we plan to increase our development
programme in 2014/15 following our refinancing, so this figure will increase in future years.
1 Source: OVH Efficiency Tracker (Blue) 2 Source: Statistical Data Return submissions
Page 9
To date, we have built 174 new homes and received £90k of Affordable Homes Grant from the HCA for six homes in Southport which, has a chronic under supply of affordable social housing. We also plan to build a further 437 homes in the coming five years, utilising our surpluses and a further £40m of new PP funding, which we hope to have drawn down in early July 2014.
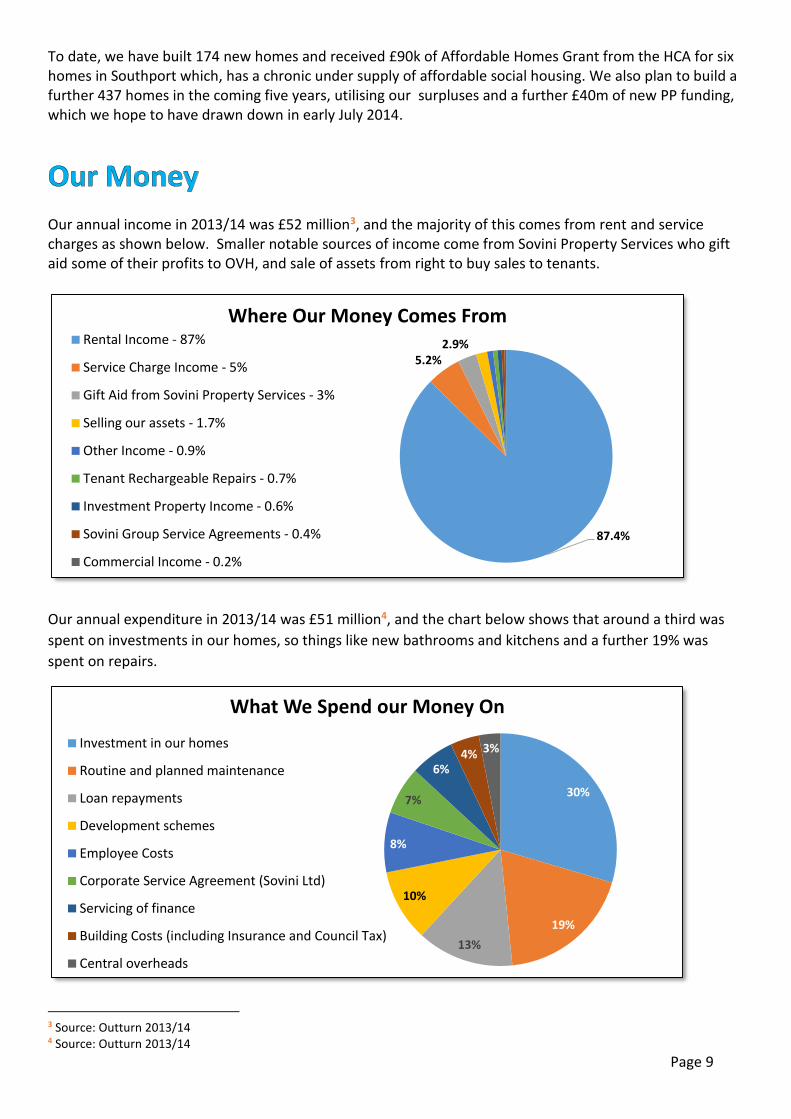
Our annual income in 2013/14 was £52 million3, and the majority of this comes from rent and service charges as shown below. Smaller notable sources of income come from Sovini Property Services who gift aid some of their profits to OVH, and sale of assets from right to buy sales to tenants.
Our annual expenditure in 2013/14 was £51 million4, and the chart below shows that around a third was
spent on investments in our homes, so things like new bathrooms and kitchens and a further 19% was
spent on repairs.
3 Source: Outturn 2013/14 4 Source: Outturn 2013/14
30%
19%
13%
10%
8%
7%
6%4% 3%
What We Spend our Money On
Investment in our homes
Routine and planned maintenance
Loan repayments
Development schemes
Employee Costs
Corporate Service Agreement (Sovini Ltd)
Servicing of finance
Building Costs (including Insurance and Council Tax)
Central overheads
87.4%
5.2%2.9%
Where Our Money Comes FromRental Income - 87%
Service Charge Income - 5%
Gift Aid from Sovini Property Services - 3%
Selling our assets - 1.7%
Other Income - 0.9%
Tenant Rechargeable Repairs - 0.7%
Investment Property Income - 0.6%
Sovini Group Service Agreements - 0.4%
Commercial Income - 0.2%

Page 10
Annual Efficiency Statement 2013/145
Saving Total
Service Area Efficiency Explanation Cash
Releasing Non Cash Releasing
£ooo £ooo £ooo
1. Void and Bad Debts Outperformance of Business Plan Targets
568 - 586
2. Management Costs
Savings reapplied to fund apprenticeships/ other cost increases/growth
552 553 1,105
3. Property Management Volume and Unit Cost Efficiencies
389 - 389
4. Market Rent Reduced white good cost and other enhancements
96 - 96
5. Investment Programme Unbudgeted Grant Income
90 522 612
6. Treasury Cash Flow Efficiencies 383 - 383
One Vision Housing Total Annual Efficiency Savings 2,078 1,075 3,153
Sovini Property Services to One Vision Housing
Gift Aid 1,700
- 1,700
Sovini Property Services Total Annual Efficiency Savings
1,700 - 1,700
One Vision Homes and Sovini Property Services Annual Efficiency Savings
3,778 1,075 4,853
1. We reflected prudent assumptions in our Business Plan for void and bad debt provisions in light of the
anticipated impact of Welfare Reform. Target setting ensured we outperformed our Business Plan targets
throughout the year. Facilities such as the Hardship Fund have helped to minimise the impact of the
reforms on our most vulnerable tenants.
2. Management cost efficiencies have occurred in the following principal areas:
• Vacancy management and restructuring savings
• Power usage and utility bills
• Service improvement and additional income/ grant funding
• Legal costs as the business applies a more preventative approach
• Delivery of the 2013/14 VFM and Procurement Action Plans.
Unavoidable cost increases occurred due to essential building maintenance, increased self-insurance and
consultancy costs.
5 Source: OVH VFM Tracker
Page 11
3. Our expenditure on Routine and Planned Maintenance (responsive repairs, void repairs, planned,
cyclical, specialist and aids and adaptations) was £389k less than we budgeted for, due to lower repair and
void volumes and reduced average repair costs.
4. We planned to spend £200k enhancing our market rented homes, our actual costs were lower than we
thought and we saved £96k which we now plan to spend on other priorities.
5. We applied and were successfully awarded £90k of Affordable Homes grant and £522k of energy
efficiency grants.
6. Treasury efficiencies were achieved through the proactive investment of surplus “in period” surplus cash and the partial repayment in the year of variable loans.
In agreement with the OVH Board, our efficiency savings will be utilised to facilitate our development
programme of new homes, address emerging Neighbourhood Priorities (including environmental projects
to improve the sustainability of our tenancies), deliver hardship funds to assist vulnerable tenants with the
impact of welfare reform and to provide further apprenticeship and employment opportunities for those
living in our communities.
We routinely assess the long term viability of assets where exceptional repairs are required or where
emerging Neighbourhood Management issues call the sustainability of the asset into question.
An appraisal is carried out that combines financial and non-financial information on a range of options;
typically retention, demolition and disposal. This is presented to our Executive Management Team for a
decision and is then used to make strategic recommendations to our Board.
The appraisal includes:
A 30 year Net Present Value (NPV) and discounted payback period assessment
Performance information (e.g. void turnover, rent arrears)
Feedback from Neighbourhood Officers and other front line staff
Similar assessments are carried out on proposed acquisitions under our buyback scheme.
During 2013/14 we recognised that a more proactive approach to asset management was required,
particularly in light of the recent welfare reforms and the effect this is having on demand for some
properties and the ability of customers to financially sustain their tenancies.
As part of this new approach, a financial sustainability index has been developed to provide a clearer
picture of how our assets are performing, supported by our Asset Management Strategy. This index has
been developed in collaboration with our neighbourhood, asset and finance teams to ensure it provides a
true reflection of the costs and income associated with each individual asset.
The index calculates the financial performance of each asset, this information can then be aggregated
based on asset archetypes, customer profiles, geographic location or a combination of these. We are now
using the index to identify exception performance, investigate the underlying drivers and establish if and
how these drivers can be controlled or influenced.

Page 12
Where the drivers of poor performance can be controlled or influenced, and the cost of doing so delivers a
positive NPV over 30 years, a plan to improve performance will be developed. This plan will be influenced
in part by an analysis of high performing neighbourhoods to identify what makes them perform well. Plans
will generally involve a mix of property improvements, environmental improvements and neighbourhood
management interventions but may also include demolition, remodelling, tenure alteration, disposal and
new development.
Where the drivers of poor performance cannot be controlled or influenced, or the cost of doing so does
not deliver a positive NPV over 30 years, options to dispose of the assets will be assessed. The disposal of
assets that do not and cannot deliver value for money enables us to invest in high performing assets
through acquisition and new development.
A second element of our new strategic approach is the identification of properties with high open market
values. The sale of such properties has the potential to generate funds for the development of new social
rented homes, enabling us to meet demand and increase the number of high performing properties within
our portfolio.
The following table6 shows the return on assets analysis for our social housing stock. As OVH was a negative transfer from Sefton Borough Council we used Savill’s, our independent valuer, to produce our existing use values. This valuation is the figure that has been used in our analysis.
Operating Surplus
Capital Deployed
Return %
£000's £000's
£8,710 £225,010 3.87%
We complete annual VFM assessments against all service areas using benchmarking information, we do this within our own teams and across services to support each other in identifying areas for improvement and implementing change. For example: we brought all Graphic Design services in-house making an initial saving of over £100,000. As our business and service offer continues to grow, the design team now delivers services that would cost over £500,000 each year if outsourced. Completing VFM assessments ensures that we are all aware of the costs and changes over time of our services. We use a range of benchmarking clubs including: The Airport Group where we benchmark detailed service and operating costs Baker Tilly for back office costs Merseyside Registered provider benchmarking which has focused on Welfare Reform this year Housemark core benchmarking and specialist benchmarking services For our frontline service delivery we use the Housemark National LSVT club and the chart shows the performance of our key service areas. The table below gives an overall summary of our performance.
6 Source: Outturn 2013/14

Page 13
The following benchmarked areas have been included within our statement as they have been identified as key priorities of our stakeholders and are reviewed annually through our stakeholder consultation events. These icons are used to help explain the benchmarking results for each indicator.
Quartile 1 This means we are performing in the top quarter of all those organisations in our benchmarking club.
Quartile 3 This means we are performing below average but not in the bottom quarter of those organisations in our benchmarking club.
Quartile 2 This means we are performing above average but not in the top in the quarter of those organisations in our benchmarking club
Quartile 4 This means we are performing in the bottom quarter of all those organisations in our benchmarking club.
2

Page 14
Voids & Lettings Service 2010/11 2011/12 2012/13
% of new tenants satisfied with the lettings and allocations process
No data
98%
99%
Direct cost per property of the lettings service
£31.27
£40.15
£39.86
Average relet time (excluding voids that needed major works)
32.4 days
21.5 days
20.9 days
Income Management Service 2010/11 2011/12 2012/13
Direct cost per property of the rent arrears and collection service
£67.82
£62.65
£63.66
Current tenant rent arrears (excluding unpaid Housing Benefit payments) as a % of rent due
2.3%
1.9%
1.7%
Proportion of rent collected from current tenants (including arrears brought forward from previous years)
95.9%
94.1%
94.4%
Tenancy & Neighbourhood Management
2010/11 2011/12 2012/13
% of tenants who are satisfied with the services provided by OVH
84%
87%
87%
Direct cost per property of the tenancy management service
£48.29
£48.94
£51.82
% of tenancies that are terminated within a 12 month period
7.7%
8.6%
11.2%
Anti-Social Behaviour Service 2010/11 2011/12 2012/13
% of tenants who are satisfied with the way their case of ASB was handled by OVH
87%
87%
87%
Direct cost per property of the anti-social behaviour service
£43.79
£39.17
£39.82
Number of successfully closed ASB cases per 1,000 homes
71
91
100
Page 15
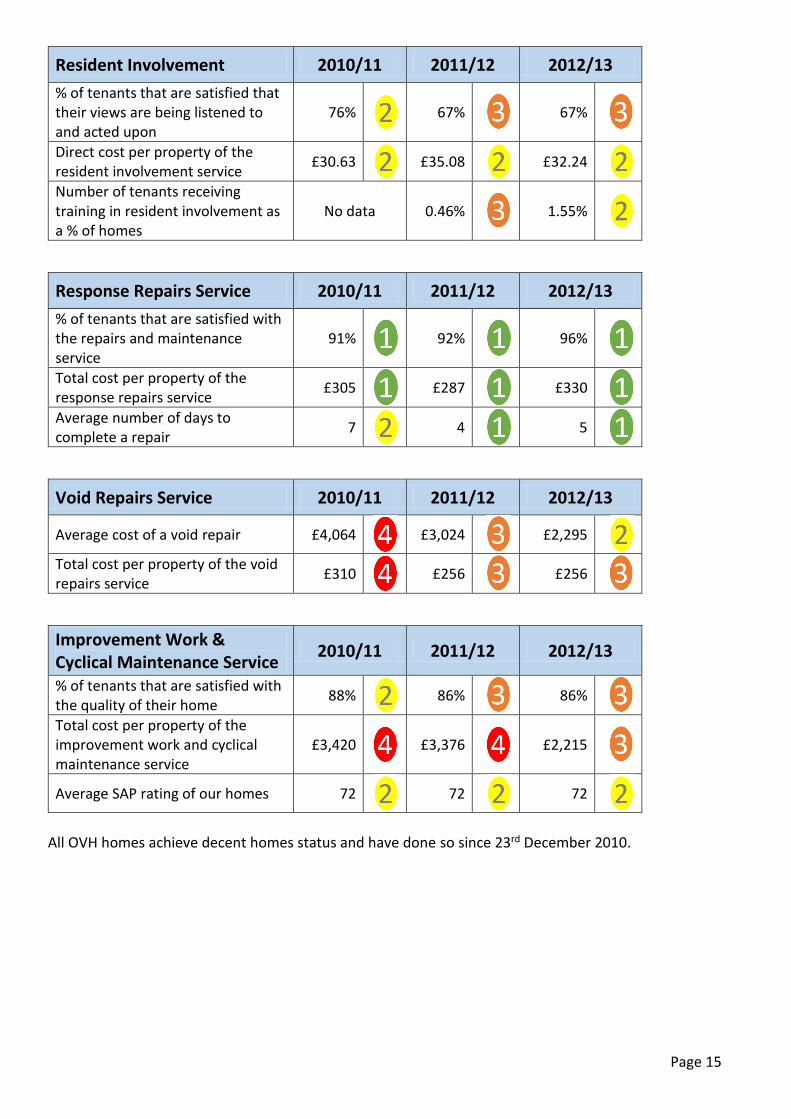
Resident Involvement 2010/11 2011/12 2012/13
% of tenants that are satisfied that their views are being listened to and acted upon
76%
67%
67%
Direct cost per property of the resident involvement service
£30.63
£35.08
£32.24
Number of tenants receiving training in resident involvement as a % of homes
No data 0.46%
1.55%
Response Repairs Service 2010/11 2011/12 2012/13
% of tenants that are satisfied with the repairs and maintenance service
91%
92%
96%
Total cost per property of the response repairs service
£305
£287
£330
Average number of days to complete a repair
7
4
5
Void Repairs Service 2010/11 2011/12 2012/13
Average cost of a void repair £4,064
£3,024
£2,295
Total cost per property of the void repairs service
£310
£256
£256
Improvement Work & Cyclical Maintenance Service
2010/11 2011/12 2012/13
% of tenants that are satisfied with the quality of their home
88%
86%
86%
Total cost per property of the improvement work and cyclical maintenance service
£3,420
£3,376
£2,215
Average SAP rating of our homes 72
72
72
All OVH homes achieve decent homes status and have done so since 23rd December 2010.

Page 16
Customer Service Centre 2010/11 2011/12 2012/13
% of tenants satisfied with the way their call was handled
95% 95% No data 95% No data 95%
Total cost per property of the service centre
£59 £56 No data £61 No data £59
Average number of seconds to answer a call
No data 11
13
No data
We also use the Baker Tilly benchmarking of Back Office costs which has given the following results:
Back Office Costs (per property)
2010/11 2011/12 2012/13
Back Office Total Costs £298.39
£284.01
£320.10
Percentage of rental income spent on back office costs
8.0% 7.4% 8.3%
We further breakdown this information by function to help us understand our benchmarking costs and make sure we are delivering value in our back office as well as in our service delivery.
A full list of benchmarking is available on our website value for money pages, and will be updated with
2013/14 results as soon as they become available.
We use our benchmarking information with managers and teams, to identify good practice and to learn from our peers. Benchmarking information informs our strategic and Business Planning processes. We share our results with our stakeholders, to allow them to challenge performance standards and understand good performance. Our benchmarking results inform the work of our scrutiny panel, and are used by our Executive Management Team and Board to prompt service reviews and deliver continuous improvement. We think benchmarking is a crucial part of being an organisation that delivers customer excellence.
We are clear that social value is generated across the organisation as safe homes and communities are
central to the quality of life for our tenants, and we enhance this with community development and social
inclusion activity. The main strands of our community development activity are targeted at youth
diversionary activity and crime prevention, health and wellbeing, employment and training, and
environmental improvements. We chose these priority areas as they reflect the needs of our customers
and neighbourhoods and we have been clearly evaluating and recording the impact of the projects we
have supported.
Currently we are using the HACT social value toolkit to reflect back over 2013/14 and see where our
greatest impact on social value has been. The main strand of this work is to support decision making in
terms of future service delivery.
Following this methodology we have found that:
Page 17
Delivering youth diversionary activity that costs £10,000, creates £240,000 of social value for the young
people and the neighbourhoods we work in
We run a job club that costs £63,000 every year to run, last year we got 21 people into full time jobs
and two people into part time jobs, generating £200,000 of social value
Our suite of tenant involvement panels that cost £135,000 to facilitate, produce £218,000 social value
for our customers and our neighbourhoods.
During 2014/15 we plan to have our social value accounts certified by HACT to verify the way we have
applied their methodology of the social value we create.
We also have an embedded approach to Corporate Social Responsibility that positively embraces
responsibility for our actions and encourages a positive impact through all our activities on the
environment, communities and stakeholders. We believe that behaving ethically is fundamental to
establishing and sustaining relationships with our partners and the development of our business.
We are working towards the ISO 26000:2010 Corporate Social Responsibility Standard in 2014/15. We
have set a baseline and an action plan supported by targets which will monitor our impact throughout the
year.
Over the past year we have reduced our impact on the environment by:
Reducing the amount of electricity we use by half a million KWh, from 4.5 million KWh to 4.0 million
KWh
Using less water, reducing our use by 300 cubic meters of water
Recycling over 80% of our construction waste so it doesn’t go to landfill
Realising a 14% reduction in our carbon footprint
Reducing our carbon dioxide emissions from 8.7 tonnes per full time equivalent member of staff to 5.9.
Gas consumption was down 16% in the past year.
A more detailed report of our gains, achievements and outcomes in relation to our impact on the wider society is contained within our Corporate and Social Responsibility Annual Report available on our website.
Page 18
We have worked with our Board members, Business Assurance Committee, Customers, Sovini Partners, HCA and our funders to progress the following priorities for VFM. These priorities are:
Completion of the VFM Assessment of service areas, using 2013/14 Housemark and Baker Tilly benchmark data due to be completed by October 2014.
Profitability assessment of OVH’s stock and assets including recommendations drawn from OVH’s demand study of stock and assets in 2014/15.
An analysis and certification of social value achievements through the HACT Social Value toolkit, measuring the impact on society of our community initiatives (e.g. employment and skills opportunities, apprenticeships, local community and schools projects).
Review and Implementation of Intra Group Service Level Agreements, which generate efficiency savings for OVH.
Further spend analysis of services projects during 2014/15 to inform our future procurement priorities and identify further opportunities for the “self delivery” of services, including environmental services.
Identification of continuous improvement initiatives and VFM suggestions made through our VFM Incentive Scheme.
Further Implementation of ‘Year 2’ key projects of the Groups IT Strategy (FLOW) including the implementation of effective Asset Management and HR Software.
Identification and pursuance of any applicable commercial opportunities or contracts.
Tendering of the current mobile phone contract.
Review and re-assessment of our current contracts to ensure procurement compliance and to identify areas for improvement relating to VFM outcomes.
Draw down a further £40m in new loans, following completion of our current funding review and commence implementation of our indicative development programme, with 437 new homes built from 2014 to 2019.
Demolish 173 high rise and low rise flats which, are at the end of their useful life (with £13.8m less investment requirement) and utilising these resources to fund additional loans and other service improvement priorities.
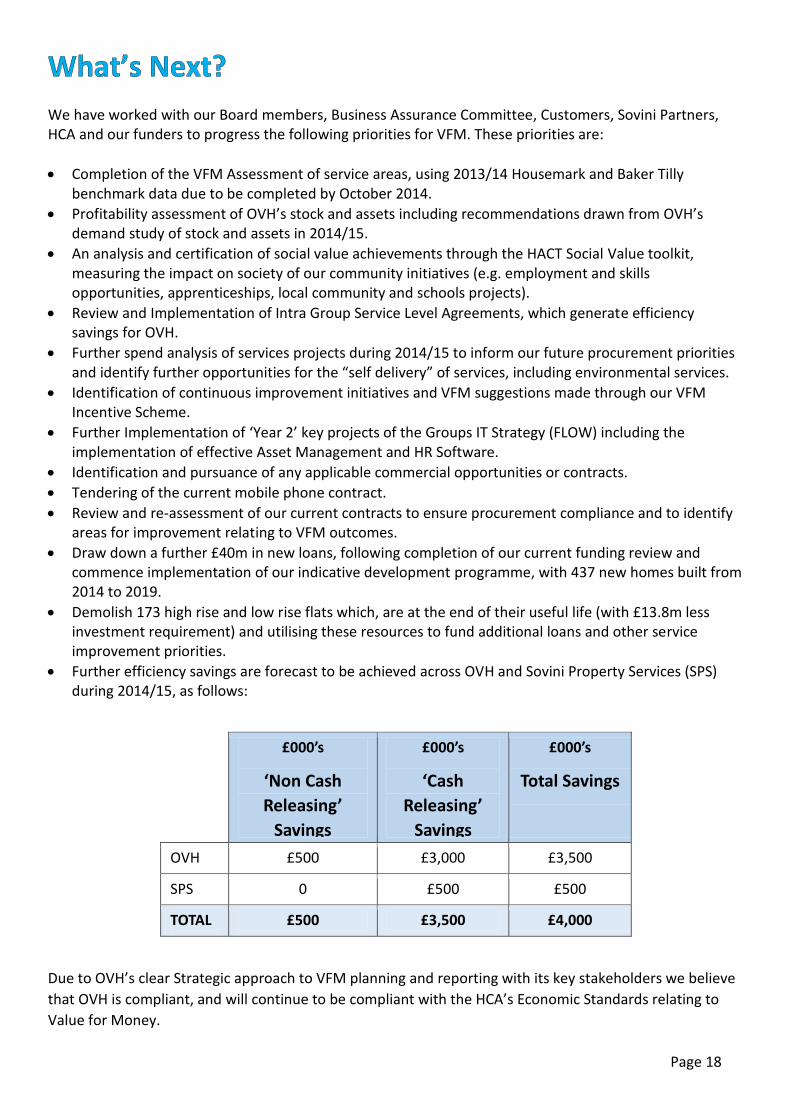
Further efficiency savings are forecast to be achieved across OVH and Sovini Property Services (SPS) during 2014/15, as follows:
£000’s
‘Non Cash
Releasing’
Savings
£000’s
‘Cash
Releasing’
Savings
£000’s
Total Savings
OVH £500 £3,000 £3,500
SPS 0 £500 £500
TOTAL £500 £3,500 £4,000
Due to OVH’s clear Strategic approach to VFM planning and reporting with its key stakeholders we believe
that OVH is compliant, and will continue to be compliant with the HCA’s Economic Standards relating to
Value for Money.


![[Case Study] OVH main challenges and key differentiators](https://static.fdocuments.us/doc/165x107/5a672f0f7f8b9ab12b8b47b1/case-study-ovh-main-challenges-and-key-differentiators.jpg)