2014 Capital Analyst Notes - Financial Services · SAP has introduced CATS ... Tax and Utility...
39
Financial Services 2014 – 2023 CAPITAL BUDGET AND PLAN OVERVIEW 2014 – 2023 Capital Budget and Plan Highlights Financial Services' 2014-2023 Capital Plan focuses on system and business process improvements, including implementation of the Cross Application Time Sheet (CATS) project replacing the existing outdated customized module. The 2014–2023 Capital Budget and Plan allocates state of good repair funding to sustain the financial and payroll systems and implement system upgrades to support automation of processes and reduction of manual effort allowing for greater efficiencies. SAP has introduced CATS which provides real time access to time and attendance, considered as best practices. The 10-Year Capital Plan also allocates the 10-Year Capital Plan also allocates funding to service improvements for the implementation of multi-year, service-based and performance focussed planning and budgeting processes and technologies. CAPITAL PROGRAM SUMMARY Contents I: Overview 1 II: Council Approved Budget 4 III: 10-Year Capital Plan 5 IV: 2014 Capital Budget 16 V: Issues for Discussion 21 Appendices: 1) 2013 Performance 23 2) 10-Year Capital Plan Summary 26 3) 2014 Capital Budget; 2023 Capital Plan 2015 - 27 4) 2014 Cash Flow & Future Year Commitments 28 5) 2014 Capital Projects with Financing Detail 29 6) 2014 Reserve / Reserve Fund Review 30 www.toronto.ca/budget2014
Transcript of 2014 Capital Analyst Notes - Financial Services · SAP has introduced CATS ... Tax and Utility...

Financial Services 2014 – 2023 CAPITAL BUDGET AND PLAN OVERVIEW
2014 – 2023 Capital Budget and Plan Highlights Financial Services' 2014-2023 Capital Plan focuses on system and business process improvements, including implementation of the Cross Application Time Sheet (CATS) project replacing the existing outdated customized module.
The 2014–2023 Capital Budget and Plan allocates state of good repair funding to sustain the financial and payroll systems and implement system upgrades to support automation of processes and reduction of manual effort allowing for greater efficiencies. SAP has introduced CATS which provides real time access to time and attendance, considered as best practices.
The 10-Year Capital Plan also allocates the 10-Year Capital Plan also allocates funding to service improvements for the implementation of multi-year, service-based and performance focussed planning and budgeting processes and technologies.
CAPITAL PROGRAM SUMMARY
Contents
I: Overview 1
II: Council Approved Budget 4
III: 10-Year Capital Plan 5
IV: 2014 Capital Budget 16
V: Issues for Discussion 21
Appendices:
1) 2013 Performance 23
2) 10-Year Capital Plan Summary 26
3) 2014 Capital Budget; 2023 Capital Plan
2015 -27
4) 2014 Cash Flow & Future Year Commitments 28
5) 2014 Capital Projects with Financing Detail 29
6) 2014 Reserve / Reserve Fund Review 30
www.toronto.ca/budget2014
2014-2023 Capital Program Financial Services
Capital Spending and Financing
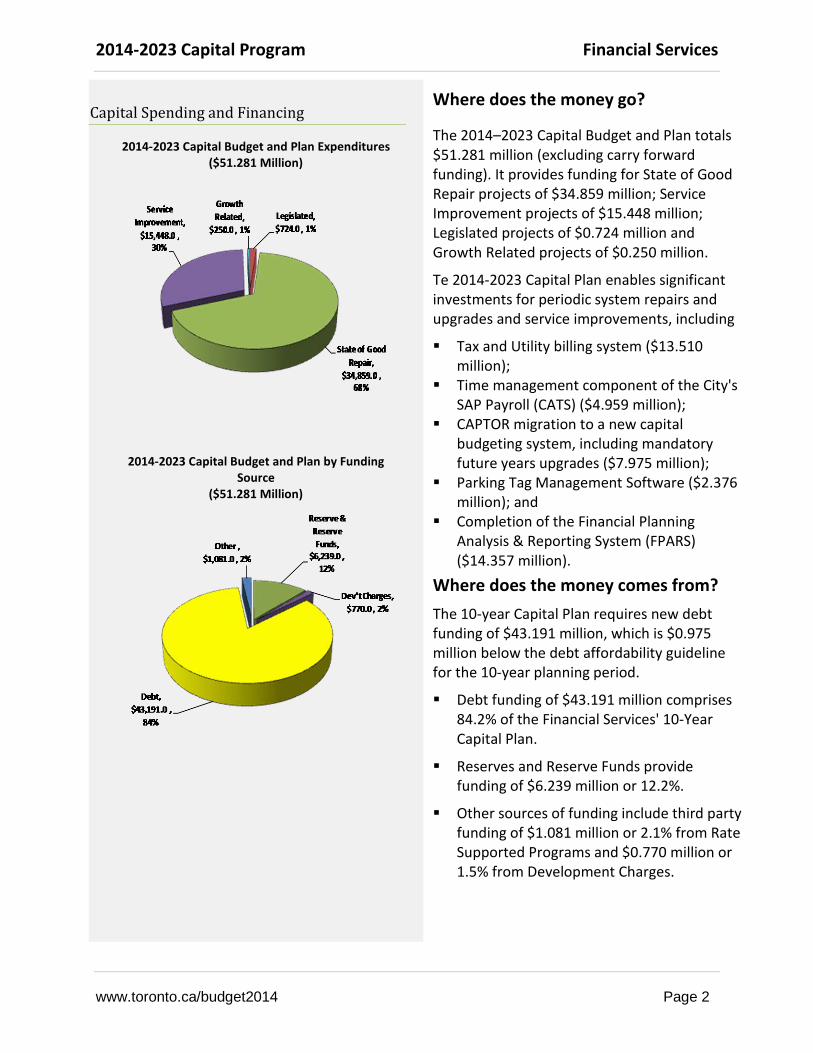
2014-2023 Capital Budget and Plan Expenditures ($51.281 Million)
2014-2023 Capital Budget and Plan by Funding Source
($51.281 Million)
Where does the money go?
The 2014–2023 Capital Budget and Plan totals $51.281 million (excluding carry forward funding). It provides funding for State of Good Repair projects of $34.859 million; Service Improvement projects of $15.448 million; Legislated projects of $0.724 million and Growth Related projects of $0.250 million.
Te 2014-2023 Capital Plan enables significant investments for periodic system repairs and upgrades and service improvements, including
Tax and Utility billing system ($13.510 million);
Time management component of the City's SAP Payroll (CATS) ($4.959 million);
CAPTOR migration to a new capital budgeting system, including mandatory future years upgrades ($7.975 million);
Parking Tag Management Software ($2.376 million); and
Completion of the Financial Planning Analysis & Reporting System (FPARS) ($14.357 million).
Where does the money comes from? The 10-year Capital Plan requires new debt funding of $43.191 million, which is $0.975 million below the debt affordability guideline for the 10-year planning period.
Debt funding of $43.191 million comprises 84.2% of the Financial Services' 10-Year Capital Plan.
Reserves and Reserve Funds provide funding of $6.239 million or 12.2%.
Other sources of funding include third party funding of $1.081 million or 2.1% from Rate Supported Programs and $0.770 million or 1.5% from Development Charges.
www.toronto.ca/budget2014 Page 2

2014-2023 Capital Program Financial Services
Key Challenges and Priority Actions High demand for both IT & internal staff resources – There are competing demands for limited IT and other divisional internal staff resources. As a priority actions, I &T has expedited a process to hire additional resources to support delivery of capital projects and is planning to fill all vacancies by Q2, 2014.
City-wide Capital Projects – Financial Services' capital projects are complex and have City-wide implications requiring extensive consultation processes and involve varying levels of divisional staff and support. Financial Services staff collaboration and partnerships with key divisions and leveraging internal and external expertise are critical for success.
2014 Capital Budget Highlights The 2014 Capital Budget for Financial Services of $20.476 million will: Begin the feasibility and scoping of the City-
wide business requirements necessary for migration of the current CAPTOR capital software program ($0.950 million) efforts.
Continue state of good repair on the Tax and Utility Billing System ($1.420 million) and CATS project ($1.231 million).
Complete FPARS budgeting, planning, and reporting activities and begin requirements for the FPARS Service Improvement projects such as the FPARS Enterprise Performance Management (EPM) functionality ($13.555 million) and the Workflow Document Management Technology project ($1.115 million).
www.toronto.ca/budget2014 Page 3
2014-2023 Capital Program Financial Services
II: COUNCIL APPROVED BUDGET City Council approved the following recommendations:
1. City Council approve the 2014 Capital Budget for Financial Services with a total project cost of $5.250 million, and 2014 cash flow of $20.476 million and future year commitments of $26.808 million comprised of the following:
a) New Cash Flow Funding for:
i) 2 new sub-projects with a 2014 total project cost of $5.250 million that requires cash flow of $1.075 million in 2014 and a future year cash flow commitment of $0.125 million in 2015;
ii) 12 previously approved sub-projects with a 2014 cash flow of $9.848 million; and a future year cash flow commitment of $9.736 million in 2015; $9.416 million in 2016; $0.650 million in 2017; $0.770 million in 2018 and $0.956 million in 2019;
iii) 4 sub-projects from previously approved projects with carry forward funding from 2012 and prior years requiring 2015 cash flow of $5.155 million which forms part of the affordability target that requires Council to reaffirm its commitment; and
b) 2013 approved cash flow for 8 previously approved sub-projects with carry forward funding from 2013 into 2014 totalling $9.553 million.
2. City Council approve new debt service costs of $0.292 million in 2014 and incremental debt costs of $1.492 million in 2015; $1.628 million in 2016; $0.622 million in 2017; $0.080 million in 2018; $0.099 million in 2019; $0.190 million in 2020; $0.471 million in 2021 and $0.320 million in 2022 resulting from the approval of the 2014 Capital Budget, to be included in the 2014 and future year operating budgets.
3. City Council consider operating costs of $0.370 million net in 2014, and $0.115 million net in 2015, emanating from the approval of the 2014 Capital Budget for inclusion in the 2014 and future year operating budgets.
4. City Council approve 10 temporary capital positions for the delivery of new 2014 capital projects and that the duration for each temporary position not exceed the life and funding of its respective project / sub-project.
www.toronto.ca/budget2014 Page 4

2014-2023 Capital Program Financial Services
III: 10-YEAR CAPITAL PLAN 10 - Year Capital Plan
2014 Budget, 2015 – 2018 Plan (In $000s)
`
2014 2015 2016 2017 2018 2014 - 2018 5-Yea r
Tota l Percent
Budget Projected Actua l
Gross Expenditures: 2013 Capita l Budget & Approved FY Commitments 35,153 20,320 21,575 7,970 3,498 1,280 1,285 35,608 85.1% Cha nges to Approved FY Commitments (11,727) 1,766 5,918 (500) 375 (4,168) -10.0% 2014 New/Cha nge i n Scope and Future Year Commitments 1,075 1,158 3,017 5,250 12.5% 2015- 2018 Ca pi ta l Pl a n Es ti ma tes 2-Yea r Ca rry Forwa rd for Rea pprova l 5,155 5,155 12.3% 1-Yea r Ca rry Forwa rd to 2014 9,553
Total Gross Annual Expenditures & Plan 35,153 29,873 10,923 16,049 12,433 780 1,660 41,845 100.0%
Program Debt Target 12,932 19,409 6,518 3,498 650 770 30,845
Financing: Debt 8,500 10,354 14,138 8,958 650 770 34,870 83.3% Res erves /Res erve Funds 20,636 154 995 3,475 500 5,124 12.2% Devel opment Cha rges 425 125 125 130 390 770 1.8% Provincia l/Federa l Debt Recovera bl e Other Revenue 5,592 290 791 1,081 2.6%
Total Financing 35,153 10,923 16,049 12,433 780 1,660 41,845 100.0%
By Project Category: Health & Safety -Legis lated 1,247 204 130 390 724 1.7% SOGR 7,697 2,265 8,805 12,433 650 1,270 25,423 60.8% Servi ce Improvement 26,071 8,329 7,119 15,448 36.9% Growth Rel a ted 138 125 125 250 0.6%
Total by Project Category 35,153 10,923 16,049 12,433 780 1,660 41,845 100.0%
Asset Value ($) at year-end Yearl y SOGR Ba cklog Es ti mate (not a ddress ed by current plan) Accumulated Backlog Es timate (end of year) Backlog: Percentage of Asset Value (%)
Debt Servi ce Cos ts 292 1,492 1,628 622 80 4,114 Operati ng Impa ct on Progra m Cos ts 370 115 - - - 485 New Pos i ti ons 3 - - - - 3
2014 Budget and 2015 - 2018 Plan
2013
-
10,000
20,000
30,000
40,000
2013 Budget
2013 Projected Actual
2014 Rec.
2015 Plan
2016 Plan
2017 Plan
2018 Plan
($00
0s)
2013 Carry Forward (into 2014) Gross Expenditures Debt Program Debt Target
Carry Fwd to 2014
www.toronto.ca/budget2014 Page 5

2014-2023 Capital Program Financial Services
10 - Year Capital Plan 2019 - 2023 Plan
(In $000s)
0
1,000
2,000
3,000
4,000
5,000
6,000
2019 Plan 2020 Plan 2021 Plan
($00
0s)
Gross Expenditures Debt
`
2022 Plan 2023 Plan Program Debt Target
Gross Expenditures: 2013 Capi ta l Budget & Approved FY Commi tments Changes to Approved FY Commitments 2014 New/Cha nge i n Scope a nd Future Yea r Commi tments 2-Ye a r Ca rry Forwa rd for Re a pprova l 2019 - 2023 Ca pi ta l Pl a n Es ti ma te s
2019 - 2023 Capital Plan
2019 2020 2021 2022 2023 2014 - 2023 10-Yea r
Tota l Percent
1,156 4,050 125
4,105 44,919 (600) 600 (4,043)
5,250 5,155
-
87.6% -7.9% 10.2% 10.1%
Total Gross Annual Expenditures & Plan 1,281 4,050 3,505 600 - 51,281 100.0%
Program Debt Target 1,156 4,050 3,115 - 5,000 44,166
Financing: Debt Res erves /Res erve Funds Devel opment Cha rges Provincia l/Federa l Debt Recovera bl e Other Revenue
1,156 4,050 125
3,115 43,191 390 600 6,239
770 --
1,081
84.2% 12.2% 1.5%
2.1% Total Financing 1,281 4,050 3,505 600 - 51,281 100.0%
By Project Category: Health & Safety Legis lated SOGR Servi ce Improvement Growth Rel a ted
1,281 4,050
-724
3,505 600 34,859 15,448
250
1.4% 68.0% 30.1% 0.5%
Total by Project Category 1,281 4,050 3,505 600 - 51,281 100.0%
Asset Value($) at year-end Yea rly SOGR Ba ckl og Es tima te (not a ddres s ed by current pl a n) Accumulated Backlog Es timate (end of year) - - - - -Backlog: Percentage of Asset Value (%)
Debt Servi ce Cos ts 99 190 471 320 0 5,193 Opera ti ng Impa ct on Progra m Cos ts 485 New Pos i ti ons 3
www.toronto.ca/budget2014 Page 6

2014-2023 Capital Program Financial Services
Key Changes to the 2013 - 2022 Approved Capital Plan Changes to the 2013 -2022 Approved Capital Plan
(In $000s)
2013 2014 2015 2016 2017 2018 2019 2020 2021 2022 2023 2013 - 2022 Capital Budget & Plan 28,278 21,575 7,970 3,498 1,280 1,285 1,156 4,050 4,105 2014 - 2023 Capital Budget & Plan 10,923 16,049 12,433 780 1,660 1,281 4,050 3,505 600 Change % (49.4) 101.4% 255.4% (39.1) 29.2% 10.8% 0.0% (14.6) Change $ -10,652 8,079 8,935 -500 375 125 0 -600 600
0
5,000
10,000
15,000
20,000
25,000
30,000
The 2014 Capital Budget and the 2015 - 2023 Capital Plan reflects an increase of $6.362 million from the 2013 to 2022 Approved Capital Plan. The changes to the 2013 – 2022 Approved Capital Plan are outlined below:
The Tax and Utility Billing Systems cash flow funding for the upgrades are deferred to 2015 and 2016 and future years upgrades to beyond 2023 due to the reprioritization of this project as a result of insufficient staffing capacity, resulting in a decrease of $5.415 million from the 2013-2022 Approved Capital Plan.
The decision to delay the Enterprise Performance Management component of the FPARS project to 2014 and 2015 will result in a change of the cash flow by $0.238 million over the 2013-2022 Approved Capital Plan, without increasing the total project cost.
The following chart details the key project cash flow changes to the 2014 – 2023 Approved Capital Plan.
Summary of Project Changes (In $000s)
Total Project
Cost
2014 2015 2016 2017 2018 2014 - 2018 2014 - 2022 Revised Total
Project Gross Debt Gross Debt Gross Debt Gross Debt Gross Debt Gross Debt Gross Debt
Previously Approved Financial Planning, Analysis & Reporting System (FPARS) 61,100 (6,881) (6,881) 7,119 7,119 238 238 238 238 61,100 Tax and Utility System Upgrade 15,893 (4,355) (2,569) 835 501 8,935 5,460 5,415 3,392 5,415 3,392 15,893 PCI Compliance 2,362 27 27 27 27 27 27 2,362 Accounts Payable Process improvements 3,470 194 194 194 194 194 194 3,470 Workflow & Document Mgmt. Technology 2,852 88 44 88 44 88 44 2,852 eProcurement Implementation 1,955 130 130 130 130 130 130 1,955 Risk Management Information System Upgrade 125 34 34 - 34 - 125 Revenue System Part II 3,500 (14) (14) (14) - 3,500
Total Previously Approved 91,257 (10,777) (9,055) 7,954 7,620 8,935 5,460 - - - - 6,112 4,025 6,112 4,025 91,257 New
Development Charges Studies 125 125 250 - 250 - 250 Risk Management Information System Upgrade (125) (125) - - 125
- -Total New - 125 - 125 - - - - - (125) - 125 - 250 - 375
Total Changes 91,257 (10,652) (9,055) 8,079 7,620 8,935 5,460 - - (125) - 6,237 4,025 6,362 4,025 91,632
www.toronto.ca/budget2014 Page 7

2014-2023 Capital Program Financial Services
2014 – 2023 Capital Plan 2014 – 2023 Capital Plan by Project Category
(In $000s)
The 10-Year Capital Plan for Financial Services of $51.281 million provides funding for State of Good Repair (SOGR) projects of $34.859 million; Service Improvement projects of $15.448 million; Legislated projects of $0.724 million and Growth Related projects of $0.250 million.
State of Good Repair represents the largest project category (68%) for which total funding is allocated in the 10-Year Capital Plan. These projects are primarily required to revitalize current financial information systems, improve accuracy and timeliness of information, standardize reporting practices across the City and facilitate improved information distribution to Divisions, Committees and Council, using leading and best practices.
Over the first 5 years, a significant investment of $25.423 million is for upgrades and periodic system replacements, including replacement of the Tax and Utility Billing System ($13.510 million), upgrades to the time management component of the City's SAP payroll (CATS) ($4.959 million), to establish City-wide business requirements for the CAPTOR migration to a new capital budgeting system ($5.000 million) and upgrade to the Parking Tag Management Software ($1.420 million).
During the second 5 years, additional investments of $9.436 million are required to replace systems based on life-cycle management and technological advancements. Included are mandatory system upgrades such as those to SAP for the ECC, PBF and Payroll components ($4.000 million); CAPTOR system ($2.975 million); Parking Tag Management Software ($0.956 million) and replacement of the Payment Processing Equipment ($0.780 million).
Service Improvement projects represent 30.1% of the total project funding in the 10-Year Capital Plan, all of which resides in the first 5 years.
Capital funding totals $15.448 million ($8.329 million in 2014 and $7.119 million in 2015), including $14.357 million to complete the implementation of FPARS project by 2015.
www.toronto.ca/budget2014 Page 8

2014-2023 Capital Program Financial Services
Capital funding requirements for Legislated projects total $0.724 million or 1.4% of the 10-Year Capital Plan.
$0.204 million is required in the first five years to complete the PCI Compliance project. Security standards to ensure the financial integrity of all processing of card transactions must be completed by 2014 to ensure the sustainment of the City's business.
$0.520 million is required for the Development Charges Background Study project of which $0.130 million is required in the first five years starting in 2017 and ending in 2018. Funding is recovered from developers' contributions for the legislated 5 year update of the Development Charges By-Law.
Funding for the Growth Related project is at a cost of $0.250 million for Development Charges studies for the Port Lands and Scarborough Subway corridor.
2014–2023 Capital Plan by Funding Source (In $000s)
The 10-Year Capital Plan of $51.281 million will be financed by $43.191 million of debt, $6.239 million from Reserve / Reserve funds, $0.770 million from Development Charges and Other Revenues of $1.081 million.
Debt accounts for $34.870 million or 83.3% of the financing for the 2014 Budget and 2015 – 2018 Capital Plan and amounts to $43.191 million or 84.2% of the funding for the 10-Year Capital Plan.
The debt funding is below the 10-year debt affordability projects of $44.166 million allocated to this Program by $0.975 million. This was primarily due to the reprioritization of the Tax Billing System.
The Waste Management and the Insurance Reserve Funds and the Capital Financing Reserve constitute $5.124 million or 12.2% of required funding in the first 5 years and $6.239 million of 12.2% over 10 years.
www.toronto.ca/budget2014 Page 9

2014-2023 Capital Program Financial Services
Reserve-funded projects include a portion of the Utility Billing System Upgrade ($4.470 million) and Investment and Debt Management System Upgrade ($0.500 million).
Development Charges fund $0.770 million or 1.5% of the 10-Year Capital Budget and Plan's expenditures.
Development Charge funding of $0.520 million for an update to the Development Charges By-Law in 2017 and $0.250 million for Development Charges Studies for growth related projects.
Other sources of revenue represent 2.1% or $1.081 million of total capital financing. Funding is primarily from Rate Supported Programs, all in the first five years for the
Revenue System Phase II and the Workflow and Document Management Technology projects.
Capital Initiatives by Category Summary of Capital Initiatives by Category
(In $000s) 2014
Budget 2015 Plan
2016 Plan
2017 Plan
2018 Plan
2019 Plan
2020 Plan
2021 Plan
2022 Plan
2023 Plan
2014 - 2023 Total
Total Expenditures by Category
Legislated
Development Charges Background Study PCI Compliance 204
130 390 520 204
Sub-Total 204 - - 130 390 - - - - - 724
State of Good Repair
Tax Bil l ing System Upgrade Util ity Bil l ing System Upgrade SAP- Supported Cross Application CAPTOR Migration To New system SAP Upgrades (ECC, PBF, Payroll) Payment Tag Mgmt. Software Upgrade Investment & Debt Mgmt. System Upgrade Payment Processing Equipment Upgrade Risk Mgmt. Information System Upgrade
110
1,171 950
34
2,679 1,786 3,307 1,033
5,460 3,475
481 3,017
650 770 500
200 956
125
250 3,800
2,725
780 600
8,249 5,261 4,959 7,975 4,000 2,376 1,100
780 159
-Sub-Total 2,265 8,805 12,433 650 1,270 1,281 4,050 3,505 600 - 34,859
Service Improvements
Financial Planning Analysis & Reporting System Revenue System - Phase II Workflow & Document Mgmt. Technology eProcurement Implementation Accounts Payable Process improvements
7,238 221 378 298 194
7,119 14,357 221 378 298 194
-Sub-Total 8,329 7,119 - - - - - - - - 15,448
Growth Related
Development Charges Studies 125 125 250 -
Sub-Total 125 125 - - - - - - - - 250
Total Expenditures by Category 10,923 16,049 12,433 780 1,660 1,281 4,050 3,505 600 - 51,281
www.toronto.ca/budget2014 Page 10

2014-2023 Capital Program Financial Services
Major Capital Initiatives
The 10-Year Capital Plan supports Financial Services' stewardship responsibilities and commitment to maintain current technology in a state of good repair to support city-wide services as well as to enhance and fully leverage the use of the City’s current financial information systems using leading and best practices. The greater part of the 10-Year Capital Plan is systems oriented, focusing on technological improvements to enhance city-wide financial processes, information and reporting.
State of Good Repair
The Tax Billing System Replacement project requires redesigning and upgrades to accommodate new technology and new approved programs, minimize delays in billing and processing revenues and ensure no loss of data during system failures. Total cost for this replacement project over the 10-Year Capital Plan period is $8.249 million.
The Utility Billing System Replacement project requires $5.261 million over 10 years to upgrade the system to ensure it is adequate to meet current and future business needs. The system supports the current billing process and combines both Water and Solid Waste into one utility bill. Improvements are required to the operating system in order to accommodate new technology that will generate efficiencies, cost-savings and enhanced service delivery.
The SAP Upgrade (ECC, PBF and Payroll) requires $4.0 million to make improvements to the planning and resource allocation system and continue to implement its corporate management framework. This upgrade will improve the quality of the programs' business planning by consolidating information to support decisions relative to resource allocation and levels of service.
The CAPTOR Migration to New System project requires $5.0 million to review the City's current capital program software and establish City-wide business requirements with a view to migrate the functionality to a new system. Once business requirements are established, the estimate will be revised based on full City requirements as part of the 2015 Budget process. CAPTOR was implemented in 1999 as an interim solution and now is due for a major upgrade and/or replacement. Future updates to the system are planned for 2020 and 2021 at an estimated cost of $2.975 million.
The Parking Tags Software Replacement System requires $2.376 million for lifecycle replacement due to changing technology. This system processes parking tickets that generate annual revenues to the City and must be kept current to ensure continued revenue flows, and improve customer service.
The Investment & Debt Management System requires $1.100 million for periodic upgrades to support the continued delivery of timely, effective, and accurate financial information and services.
The SAP Supported Cross Application Timesheets (CATS) Implementation project requires $4.959 million for the installation of CATS technology that will significantly improve the City's processing of payroll and move the City to best practices. It will be the
www.toronto.ca/budget2014 Page 11

2014-2023 Capital Program Financial Services
single central point of integration with an enterprise wide time and attendance management solution.
Service Improvements
The Financial Planning Analysis & Reporting System requires $14.357 million in 2014 and 2015 to implement the multi-year performance-focused service based planning, budgeting process system and re-engineer complement, financial and payroll processes, data and systems to produce financial and complement information in a service view. Funding will be used to implement SAP technologies, including Business Warehouse to manage the information flows from source divisional systems to SAP and Enterprise Performance Management (EPM) that will introduce a unified approach to the collection, monitoring and reporting of key performance indicators (KPIs) for the City.
State of Good Repair (SOGR) Backlog Financial Services does not have any backlog of state of good repair projects.
10-Year Capital Plan: Impact on the Operating Budget Operating Impact Summary
(In $000s)
2014 -Program Costs, Revenues and Net 2015 2016 2017 2018 2019 2020 2021 2022 2023 2023
($000s) 2014 Budget Plan Plan Plan Plan Plan Plan Plan Plan Plan Total
2014 Capital Budget
Program Gross Expenditure 370.0 370.0
Program Revenue
Program Costs (Net) 370.0 370.0
Approved Positions 3.0 3.0
2015 - 2023 Capital Plan
Program Gross Expenditure 115.0 115.0
Program Revenue
Program Costs (Net) 115.0 115.0
Approved Positions
Total
Program Gross Expenditure 370.0 115.0 485.0
Program Revenue
Program Costs (Net) 370.0 115.0 485.0 Approved Positions 3.0 3.0
The 10-Year Capital Plan will increase future year Operating Budgets by a total of $0.485 million net over the 2014 – 2023 period. Approved positions will increase by 3 over the 10-year time frame.
This is comprised of funding to sustain the following:
Salaries and benefits for 3 positions (1 position each for Financial Planning, Payroll and Human Resources) are required in 2014 with operating costs of $0.370 million to ensure the
www.toronto.ca/budget2014 Page 12

2014-2023 Capital Program Financial Services
Program areas can meet their respective sustainment responsibilities for a new and re-engineered FPARS related processes an new technologies;
The Workflow & Document Management Technology project for the Revenue Services Division will require funds for maintenance & support resulting in $0.085 million in 2015; and
The E-Procurement Implementation will require $0.060 million for hardware and software maintenance and support in 2015.
Net Operating Impact by Project (In $000s)
Projects
2014 Budget 2015 Plan 2016 Plan 2017 Plan 2018 Plan 2014 - 2018
Budget & Plan 2019 - 2023 Capital Plan
$000s Positions $000s Positions $000s Positions $000s Positions $000s Positions $000s Positions $000s Positions Previously Approved projects Financial Pl anning Analysis & Reporti ng System 370.0 3.0 370.0 3.0 Workflow & Document Mgmt. Technology 85.0 85.0 eProcurement Implementati on 30.0 30.0
New Projects -2014
New Projects - Future Year
Total (Net) 370.0 3.0 115.0 485.0 3.0
Capital Project Delivery: Temporary Positions
Position Title
CAPTOR Project
Number # of
Positions
Project Delivery Salary and Benefits $ Amount( $000s)
Start Date End Date (m/d/yr) 2014 2015 2016 2017 2018
2019 -2023
Supervisor Production Support FNS907850-1 1.0 1/1/2014 12/31/2014 120.0 Senior Business Analyst. FNS907850-1 1.0 8/1/2014 12/31/2014 50.0 Senior Financial APP Secu Syst Analyst FNS907850-1 1.0 8/1/2014 12/31/2014 50.0 Senior Financial & Systems Analyst FNS907850-1 5.0 9/1/2014 12/31/2014 200.0
Payroll Benefits Pension Service Rep. 1 FNS907850-1 1.0 9/1/2014 12/31/2014 40.0
Senior Busniess Analysts Pay and Benefits Processing FNS907850-1 1.0 9/1/2014 12/31/2014 40.0
Total 10.0 500.0
Approval of the 2014 – 2023 Capital Budget and Plan will require 30 new temporary capital positions to deliver the following capital projects:
10 temporary positions in 2014 to continue with the Cross Application Timesheet (CATS) Implementation project.
These 10 temporary capital positions are required for the delivery of new 2014 – 2023 capital projects / sub-projects and that the duration for each temporary position does not exceed the life of the funding of its respective capital projects / sub projects.
www.toronto.ca/budget2014 Page 13

2014-2023 Capital Program Financial Services
Capacity to Spend Capacity to Spend – Budget vs. Actual
(In $000s)
-
5,000
10,000
15,000
20,000
25,000
30,000
35,000
40,000
($00
0s)
2009 2010 2011 2012 2013 2014 Actual Actual Actual Actual Projected Budget
Gross Budget Expenditures Total Adj. Cfwd from Prior Year Actual Spending
In the last four years, Financial Services have spent on average 31% of its approved capital budgets. This low spending rate is attributed to the following factors:
Projects that Financial Services is responsible for are large / City-wide, more complex to implement, requires consultation and collaboration with partner/client divisions to ensure business needs are met and have significant impact on resourcing and organizational change.
The Divisions that belong to Financial Services (Accounting Services; Payroll, Pension and Employee Benefits; Financial Planning; Revenue Services; Corporate Finance; and Purchasing and Materials Management) have limited capacity to undertake multiple projects and continues with ongoing operations.
Procurement Delays – procuring for large complex projects have experienced delays due to the time and resources required to develop and issue RFPs and competition for / lack of qualified vendors to meet requirements. These projects include:
FPARS - From 2009 to 2011, Financial Services' capacity to spend was hindered by project delays mainly due to the inability to acquire external resources to move forward on the FPARS project, a major component of Financial Services' Capital Budget and Plan. In February 2012, the RFP was issued and awarded to the successful external consultant to implement the SAP Public-Sector Budget Formulation (PBF) system and changes to financial, payroll and human resources systems, data and processes to meet the requirements of the FPARS project. The actual spending rate for 2012 was 64.2%, a significant improvement from previous years due to the progress made by the FPARS
www.toronto.ca/budget2014 Page 14

2014-2023 Capital Program Financial Services
project. Total spending for 2013 is projected at 52.6% of which 84.2% is related to the FPARS project.
Tax and Utility Billing System - The progress made in 2012 was partially hampered by the lack of vendors able to provide a Tax and Utility Billing System that met the City's requirements. As a result, the project was deferred to 2013.
A review of the capacity to spend and project readiness to proceed resulted in further deferral of the Tax and Utility Billing System to 2015. For 2014, focus will be on completing the FPARS project. In addition, the Purchasing and Materials Management Division has included in their 2014 Operating Budget submission requests for additional resources to provide enhanced support for procurement.
www.toronto.ca/budget2014 Page 15

2014-2023 Capital Program Financial Services
IV: 2014 CAPITAL BUDGET 2014 Capital Budget by Project Category and Funding Source
Note: Excludes carry forward funding
The 2014 Capital Budget, excluding funding carried forward from 2013 to 2014, requires new 2014 cash flow funding of $10.923 million.
State of Good Repair projects valued at $2.265 million account for 20.7% of the 2014 Capital Budget. Priorities in 2014 include the upgrade to the current SAP time management function in the City's payroll system (CATS) requiring $1.171 million, and to begin a review of the City's current capital program software, CAPTOR, and establish City-wide business requirements for the migration to a new system requiring $0.950 million.
Service Improvement projects account for $8.329 million or 76.3% of the cash flow funding in the 2014 Capital Budget. The FPARS project requires $6.818 million to finish budgeting and actual complement in a service and $0.421 million to start the implementation of the Enterprise Performance Management module, an advanced tool that will combine finance, human resource and performance data providing costing, complement management and performance metrics for the City's services.
Legislated projects represent $0.204 million or 1.9% of the 2014 Capital Budget to complete the PCI Compliance project.
Growth projects represent $0.125 million or 1.1% of the cash flow funding in the 2014 Capital Budget to begin Development Charges Studies for the Port Lands and Scarborough Subway Corridor.
The 2014 Capital Budget for Financial Services is funded primarily from debt, which accounts for 94.8% or $10.354 million financing. This is $9.055 million below the debt affordability guideline of $19.409 million set for this Program in 2014. The FPARS project accounts for funding of $7.238 million or 69.9%. The CATS project for $1.151 or 11.1% and the CAPTOR Migration project $0.950 million or 9.2%.
www.toronto.ca/budget2014 Page 16

2014-2023 Capital Program Financial Services
Other sources of funding represent 2.7% or $0.290 million of the 2014 financing, and include revenues from Rate Supported Programs of $0.069 million for the Workflow and Document Management Technology project and $0.221 million for the Revenue Services Phase II project.
Reserve and Reserve Funds constitute $0.154 million or 1.4% of the required funding.
Development Charges fund $0.125 million or 1.1% of the 2014 Capital Budget expenditures.
www.toronto.ca/budget2014 Page 17

2014-2023 Capital Program Financial Services
2014 Cash Flow & Future Year Commitments (In $000s)
2013 2012 & Previously Total 2014
Prior Year Approved Cash Cash Flow Carry Flow 2014 New 2014 Total 2013 Carry (Incl 2013
Forward Commitments Cash Flow Cash Flow Forwards C/Fwd) 2015 2016 2017 2018 2019 2020 2021 2022 2023 Total Cost
Expenditures Previously Approved 9,848 9,848 9,553 19,401 14,891 9,416 650 770 956 46,084 Change in Scope - - -New 125 125 125 125 250 New w/Future Year 950 950 950 950
Total Expenditure 9,848 1,075 10,923 9,553 20,476 15,016 9,416 650 770 956 - - - - 47,284 Financing
Debt 9,404 950 10,354 4,255 14,609 13,105 5,941 650 770 956 36,031 Other 290 290 1,819 2,109 791 2,900 Reserves/Res Funds 154 154 3,479 3,633 995 3,475 8,103 Development Charges 125 125 125 125 250
Total Financing (including carry forward funding) 9,848 1,075 10,923 9,553 20,476 15,016 9,416 650 770 956 - - - - 47,284
The Financial Services 2014 Capital Budget is $20.476 million including carry forward funding of $9.553 million; provides $9.848 million for previously approved projects already underway and $1.075 million for new projects.
Approval of the 2014 Capital Budget will result in future year commitments of $16.049 million in 2015, $12.433 million in 2016, $0.650 million in 2017, $0.770 million in 2018, and $0.956 million in 2019.
Previously approved projects include the FPARS project ($20.674 million), Tax and Utility Billing System ($14.820 million), the CATS project ($5.019 million) and Document Management Technology project ($1.115 million).
New projects include the CAPTOR migration project ($5.0 million) and Development Charges Studies ($0.250 million).
www.toronto.ca/budget2014 Page 18

2014-2023 Capital Program Financial Services
2014 Capital Project Highlights 2014 Capital Project Highlights
(In $000s)
Project
Total Project
Cost 2014 2015 2016 2017 2018 2014 -2018 2019 2020 2021 2022 2023
2014 -2023 Total
Financial Planning Analysis & Reporting System 61,100 13,555 7,119 20,674 20,674 SAP Upgrades (ECC, PBF, Payroll) 4,000 - 200 3,800 4,000 CAPTOR Migrati on To PBF 7,975 950 1,033 3,017 5,000 250 2,725 7,975 Tax Bil l ing System Upgrade 9,922 710 2,679 5,460 8,849 8,849 Util ity Bil l ing System Upgrade 5,971 710 1,786 3,475 5,971 5,971 SAP- Supported Cross Application Timesheet (CATS) 5,184 1,231 3,307 481 5,019 5,019 Parking Tag Mgmt. Software Upgrade 2,592 650 770 1,420 956 2,376 Payment Processing Equipment Upgrade 780 - 780 780 Revenue System - Phase II 3,500 221 221 221 Workflow & Document Mgmt. Technology 2,852 1,115 1,115 1,115 Risk Mgmt. Information System Upgrade 1,417 383 383 125 508 Investment & Debt Mgmt. System Upgrade 1,575 185 500 685 600 1,285 eProcurement Implementation 1,955 893 893 893 Accounts Payable Process Improvements 3,470 194 194 194 PCI Compliance 2,362 204 204 204 Development Charges Background Study 520 130 390 520 520 Development Charges Studies 250 125 125 250 250 Total (including carry forward funding) 115,425 20,476 16,049 12,433 780 1,660 51,398 1,281 4,050 3,505 600 60,834
The 2014 Capital Budget provides funding of $20.476 million to:
Complete the following projects:
The Accounts Payable Process Improvements project with $0.194 million to implement modifications to automate the Electronic Payment Submission System.
The meter-reader software equipment and cashiering software of the Revenue Systems-Phase II improvements project at a cost of $0.221 million.
The revised scope of the Workflow & Document Management and imaging projects at a cost of $1.115 million.
Periodic enhancements to the Risk Management System at a cost of $0.383 million.
Upgrades to the Investment and Debt Management System project requiring $0.185 million provided.
The e-Procurement Implementation project to utilize corporate technology to streamline the purchasing functions requiring $0.893 million.
The credit card payments compliance project (PCI Compliance) is on schedule to be completed in 2014 to ensure the City meets the full payment card and data security standards at a cost of $0.204 million.
Continue the following projects:
The Financial Planning Analysis & Reporting System requires $14.357 million in 2014 and 2015 to implement the multi-year performance-focused service based planning, budgeting process system and re-engineer complement, financial and payroll processes, data and systems to produce financial and complement information in a service view. Funding will be
www.toronto.ca/budget2014 Page 19

2014-2023 Capital Program Financial Services
used to implement SAP technologies, including Business Warehouse to manage the information flows from source divisional systems to SAP and Enterprise Performance Management (EPM) that will introduce a unified approach to the collection, monitoring and reporting of key performance indicators (KPIs) for the City.
Enhancements to the Tax and Utility Billing Systems with $1.420 million in 2014; $4.465 million in 2015 and $8.935 million in 2015.
The SAP Supported Cross Application Timesheets (CATS) Implementation project with $1.231 million provided for staff and consultants to complete the design phase of the time management component.
Begin the following projects:
Establish the City-wide business requirements for the migration of CAPTOR to a new capital budgeting system with $0.950 million. Once established, these requirements will guide the review of solutions and inform the final costs of this project to be updated for the 2015 Budget process, in 2014.
Start the EPM functionality with cash flows of $0.421 million in 2014 and $7.119 million in 2015, which will:
Development Charges Study requires $0.125 million in 2014 and $0.125 million in 2015.
www.toronto.ca/budget2014 Page 20

2014-2023 Capital Program Financial Services
V: ISSUES FOR DISCUSSION Key Program Issues
Key Program Issues
Financial Planning, Analysis & Reporting (FPARS) Status Update The Financial Planning, Analysis & Reporting System will provide the foundation for the City to develop and implement multi-year performance-focused, service based budgets. It will provide the tools to plan, analyze, evaluate and approve services, activities and their respective service levels. It will also allow the City to track and report on service objectives, targets and performance (dashboards and scorecards) to assess efficiency, effectiveness and results.
Financial Services (Financial Planning, Accounting Services and Payroll, Pension and Employee Benefits) in conjunction with Information and Technology and Human Resources, continue to develop a business warehouse and business analysis capability with integrated financial, HR, payroll and performance data to deliver the information necessary to support a service-based and performance-focused multi-year planning, budgeting monetary and reporting process.
The FPARS systems implementation and business transformation project has a total project cost of $61.1 million to fund the creation of program maps and service inventory, feasibility/fit gap analysis, vendor implementation of PBF, staff resources, organizational change management and communications, facilities rental and implementation of enterprise performance management reporting capabilities. The 2014 Capital Budget includes $13.555 million in 2014 and $7.119 million in 2015 to complete this business transformation and system implementation project for the City.
Capital expenditures for 2013 is projected to be $15.573 million to proceed as planned with the implementation of the Public Budget Formulation (PBF), Reporting Analytics, and Complement Management modules. The budget submission process of PBF went live in May, 2013. Work has been completed on the remaining PBF and complement management functionality, the respective financial and payroll components of SAP to achieve the service view. This second phase of the FPARS release strategy went live November 12, 2013. The implementation of Enterprise Performance Management (EPM) functionality will commence in 2014 and complete in 2015 as the project maximizes PBF performance functionality by leveraging SAP Business Intelligence and analytics capability.
Other deliverables continue to proceed as planned including updating Program Map/Service inventory to establish service standards and service levels for all City Agencies, as directed by City Council; establishing a full inventory of performance measurements for all City Programs and describes the City's New service Planning Process.
The project is a city-wide undertaking which requires significant resources being dedicated to the project and its deliverables as well as engagement and participation from all City Programs and Agencies to ensure its success. Various strategies, particularly workshop, change management, and communication approaches are being used to ensure awareness,
www.toronto.ca/budget2014 Page 21

2014-2023 Capital Program Financial Services
understanding, adoption and implementation of this business transformation and technology initiative.
Benefits The FPARS project is a transformative effort that aims to restructure the financial planning, budgeting, accounting, human resource and management information systems and processes by implementing SAP as an integrative solution. Improving the City's financial and organizational management functions has the potential to produce significant benefits both in terms of greater internal efficiencies and enhanced value to the public in improved transparency, accountability and the delivery of higher quality of services.
The full impact of the FPARS project has to be examined over the life-cycle costs in relation to its benefits. It is expected that incremental benefits will accrue from this project over a number of years. Since the project is still in its early stages of implementation, the cost and benefit estimates in this report will be subject to a post implementation review after the systems and related processes become rooted and fully operational.
The anticipated financial and operational benefits of the FPARS project that can be derived from the new and reengineer processes, the reporting capability and the technology provided. Some of the benefits will be more immediate and will be seen through the implementation of the Public Budget Formulation (PBF) solution. Other benefits will be realized over a longer term including establishing the foundation for further business transformation at the City of Toronto.
In terms of immediate benefits that have been identified to date, ongoing salary and benefits savings of $5.646 million will be realized in the 2014 Operating Budget through the use of the new PBF budgeting tool's personnel expenditure planning (PEP) functionality that has automated the budgeting for salaries and benefits based on particular instructions regarding the funding of vacant positions.
The City is currently working with SAP Canada on establishing these benefits through a value engineering approach. This approach will document the benefit realization of FPARS and SAP assets at the City. It will also align to present and future business initiatives to maximize the investment. The goal ultimately is to ensure it is fully utilized in the business divisions. This evaluation will partner the City and SAP Canada to ensure the City leverage all the business benefits.
www.toronto.ca/budget2014 Page 22

2014-2023 Capital Program Financial Services
Appendix 1 2013 Performance
2013 Key Accomplishments In 2013, Financial Services accomplished the following:
For the FPARS project:
Completed the rollout of PBF and related planning and budgeting processes.
Implemented the re-design/configuration of the City’s Financial System (SAP) to capture the Service View for accounting, payroll and HR data.
Enhanced the internally built application, Electronic Payment Submission (EPS) by further automating processes generating efficiencies in Accounts Payable.
Continued with enhancements to the Electronic Payment Submission (EPS) to incorporate the elimination of the penny and automation of PCard Profile management.
Completed the Cashiering project at eight counter operation locations.
Launched e-Post for electronic delivery and payment with the interim 2013 property tax bill.
The PCI Compliance project employed Qualified Security Assessors (QSA) to assess whether IT systems are functioning in compliance with a set of defined parameters.
Loans Module have been developed and installed for the Investment and Debt Management System Upgrade project.
Finalized the contract with the vendor for the Risk Management Information project.
Issued RFR, developed an RFP and selected a consultant for the Cross Application Timesheet (CATS) Implementation project.
Completed industry consultations and and revised and issued RFP to hire a consultant for the e-Procurement project.
www.toronto.ca/budget2014 Page 23

2014-2023 Capital Program Financial Services
2013 Capital Variance Review 2013 Budget to Actual Comparison
(In $000s)
2013 Approved Actuals as of Sept. 30, 2013
(3rd Quarter Variance) Projected Actuals at Year End Unspent Balance $ $ % Spent $ % Spent $ Unspent % Unspent
35,153 9,180 26.1% 18,502 52.6% 16,651 47.4%
Capital expenditure for the 9 months ending September 30, 2013 totalled $9.180 million or 26.1% of the 2013 Approved Capital Budget of $35.153 million.
The projected project year-end under-spending is largely attributable to the following projects:
The Tax Billing System Replacement project and Utility Billing System Replacement project will not incur any expenditure in 2013 due to a re-evaluation of the planned solution that revealed it may not fully meet requirements. As a result, the projects have been suspended. Options are being considered and a strategy formulated to evaluate alternatives, including in-house system upgrades or purchasing commercially available software solutions for both systems. Capital forecasts have been revised to reflect carry forward funding of $6.265 million to future years, including the development of an RFP for the information gathering/needs analysis phase of the project in 2014.
The Financial Planning, Analysis and Reporting System (FPARS) project's capital expenditures for 2013 is projected to be $7.913 million to proceed as planned with the implementation of the Public Budget Formulation (PBF), Reporting Analytics, and Complement Management functionalities. The budget submission process of PBF went live in May, 2013. Work is completed on the remaining PBF and complement management functionality, financial and payroll components of SAP to achieve the service view and the second phase of FPARS went live in November, 2013 for full operational use in 2014. The FPARS project is projecting under spending of $6.317 million due to a decision to delay the implementation of Enterprise Performance Management (EPM) functionality to 2014 and 2015 as the project maximizes PBF performance functionality by leveraging SAP Business Intelligence and analytics capability. The under-spending of $6.317 million will be carried forward into 2014.
The Workflow & Document Management Technology project's capital expenditures are projected to be $0.140 million or 10.0% of the 2013 approved cash flow of $1.403 million by year end. The under-spending is due to external resourcing and sub-contractor issues on part of the vendor, including the replacement of the project manager and other key project staff. City staff are reviewing options for completion and are in discussions with the vendor to re-evaluate project deadlines and cash flow requirements for 2013 and 2014. The under-spending of $0.140 million will be carried forward into 2014.
The eProcurement Implementation project's capital expenditures are projected to be $0.158 million or 11.2% of the 2013 approved cash flow of $1.411 million by year-end. Projected spending is lower than planned due to delays in the RFP process. An RFP for services to
www.toronto.ca/budget2014 Page 24

2014-2023 Capital Program Financial Services
complete the planning and scoping exercise was issued and closed in March 2013 but no formal bids were received. Consequently, the project team has completed a debriefing with the vendors with the intent of re-issuing a revised RFP in 2014. As a result, approximately $1.253 million will be carried forward to 2014.
The PCI Compliance project's capital expenditures are projected to be $0.490 million or 51% of the 2013 approved cash flow of $0.960 million by year-end due to delays in hiring Qualified Security Assessors (QSA) who will be assessing the project's compliance with certain parameters. Although the project is anticipated to be under spent by $0.470 million at year-end, it is on schedule to be completed by 2014 to ensure the City meets the full payment card and data security standards. The under-spending of $0.470 million will be carried forward into 2014.
www.toronto.ca/budget2014 Page 25

2014-2023 Capital Program Financial Services
Appendix 2 10-Year Capital Plan Project Summary
(In $000s)
Project 2014
Budget Plan 2014 -
2023 2015 2016 2017 2018 2019 2020 2021 2022 2023
Financial Planning Analysis & Reporting System 13,555 7,119 20,674
7,975 8,849 5,971 5,019 2,376
780 221
1,115 508
1,285 893 194
4,000 204 520 250
0
CAPTOR Migration To PBF 950 1,033 3,017 250 2,725 Tax Bil l ing System Upgrade 710 2,679 5,460 Util ity Bil l ing System Upgrade 710 1,786 3,475 SAP- Supported Cross Application 1,231 3,307 481 Parking Tag Mgmt. Software Upgrade 650 770 956 Payment Processing Equipment Upgrade 780 Revenue System - Phase II 221 Workflow & Document Mgmt. Technology 1,115 Risk Mgmt. Information System Upgrade 383 125 Investment & Debt Mgmt. System Upgrade 185 500 600 eProcurement Implementation Accounts Payable Process Improvements SAP Upgrades (ECC, PBF, Payroll)
893 194
200 3,800 PCI Compliance 204 Development Charges Background Study
125 125 130 390
Development Charges Studies
Total (Including carry forward funding) 20,476 16,049 12,433 780 1,660 1,281 4,050 3,505 600 0 60,834
www.toronto.ca/budget2014 Page 26

2014-2023 Capital Program Financial Services
Appendix 3 2014 Capital Budget;
2015 to 2023 Capital Plan
www.toronto.ca/budget2014 Page 27

nt
18
22
Report Phase 5 - Program 24 Financial Services Program Phase 5 Sub-Project Category 01,02,03,04,05 Part B Sub-Project Status S2,S5,S6
Apr-25-2014 14:28:32
Part C Sub-Project Status S2,S3,S4
Page 1 of 4 Report 7C
Appendix 3: 2014 Capital Budget: 2015 to 2023 Capital Plan Gross Expenditures ($000's)
CITY OF TORONTO
Financial Services
Sub- Project No. Project Name
PrioritySubProj No. Sub-project Name Ward Stat. Cat.
Current and Future Year Cash Flow Commitments Current and Future Year Cash Flow Commitments Financed By
2014 2015 2016 2017 2018
Total
2014-2018
Total
2019-2023
Total
2014-2023
Provincial Grants and Subsidies
Debt Recoverable
Reserves Reserve Funds
Capital from
Current Other 1 Other2 Debt Development
Charges
Federal Subsidy
Total Financing
CFO906794 Investment & Debt Mgmt System 2011 Replaceme
3 1 Investment & Debt Mgmt System 2011 Replacement
03 S2 CW
Sub-total
CFO906795 Fin. Plan. Analysis & Reporting System (FPARS)
1 3 FPARS -Conceptual Design, Implem. & Extension
04 S2 CW
0 7 SAP Business Process Change & Technology Transfer
04 S2 CW
0 8 SAP Upgrades (ECC, PBF, Payroll) 03 S6 CW
Sub-total
CFO906798 Risk Mgmt Information System Replacement
1 1 Risk Mgmt Information System Replacement 03 S2 CW
Sub-total
CFO906800 Risk Mgmt Information System Replacement 2019
3 1 Risk Mgmt Information System Replacement 2019
03 S6 CW
Sub-total
CFO906802 Investment & Debt Mgmt System Replacement 20
3 1 Investment & Debt Mgmt System Replacement 2018
03 S6 CW
Sub-total
CFO906892 Captor Migration to New System 2014
3 1 Captor Migration to New System 2014 03 S5 CW
Sub-total
FNS907438 PCI Compliance
1 1 PCI Compliance 02 S2 CW
Sub-total
FNS907439 Investment & Debt Mgmt System Replacement 20
3 1 Investment & Debt Mgmt System Replacement 2022
03 S6 CW
Sub-total
FNS907442 Capital Migration to New System 2020
185 0 0 0 0 185 0 185 0 0 185 0 0 0 0 0 00 185
185 0 0 0 0 185 0 185 0 185 0 0 0 0 0 000 185
2,747
10,808
0
0 0 0 0
7,119 0 0 0
0 0 0 0
2,747
17,927
0
0
0
4,000
2,747
17,927
4,000
0
0
0
0 0 0 0 0 0 2,747 00
0 2,792 0 0 0 0 15,135 00
0 0 0 0 0 0 4,000 00
2,747
17,927
4,000
13,555 7,119 0 0 0 20,674 4,000 24,674 0 2,792 0 0 0 0 21,882 000 24,674
383 0 0 0 0 383 0 383 0 0 0 383 0 0 0 0 00 383
383 0 0 0 0 383 0 383 0 0 383 0 0 0 0 000 383
0 0 0 0 0 0 125 125 0 0 0 125 0 0 0 0 00 125
0 0 0 0 0 0 125 125 0 0 125 0 0 0 0 000 125
0 0 0 0 500 500 0 500 0 0 500 0 0 0 0 0 00 500
0 0 0 0 500 500 0 500 0 500 0 0 0 0 0 000 500
950 1,033 3,017 0 0 5,000 0 5,000 0 0 0 0 0 0 0 5,000 00 5,000
950 1,033 3,017 0 0 5,000 0 5,000 0 0 0 0 0 0 5,000 000 5,000
204 0 0 0 0 204 0 204 0 0 0 0 0 0 0 204 00 204
204 0 0 0 0 204 0 204 0 0 0 0 0 0 204 000 204
0 0 0 0 0 0 600 600 0 0 600 0 0 0 0 0 00 600
0 0 0 0 0 0 600 600 0 600 0 0 0 0 0 000 600

1
CATS
Report Phase 5 - Program 24 Financial Services Program Phase 5 Sub-Project Category 01,02,03,04,05 Part B Sub-Project Status S2,S5,S6
Apr-25-2014 14:28:32
Part C Sub-Project Status S2,S3,S4
Page 2 of 4 Report 7C
Appendix 3: 2014 Capital Budget: 2015 to 2023 Capital Plan Gross Expenditures ($000's)
CITY OF TORONTO
Financial Services
Sub- Project No. Project Name
PrioritySubProj No. Sub-project Name Ward Stat. Cat.
Current and Future Year Cash Flow Commitments Current and Future Year Cash Flow Commitments Financed By
2014 2015 2016 2017 2018
Total
2014-2018
Total
2019-2023
Total
2014-2023
Provincial Grants and Subsidies
Debt Recoverable
Reserves Reserve Funds
Capital from
Current Other 1 Other2 Debt Development
Charges
Federal Subsidy
Total Financing
FNS907442 Capital Migration to New System 2020
3 1 Capital Migration to New System 2020 03 S6 CW
Sub-total
FNS907443 Development Charges Background Study 2017
3 1 Development Charges Background Study 2017
02 S6 CW
Sub-total
FNS907444 Payment Processing Equipment Replacement 202
3 1 Payment Processing Equipment Replacement 2021
03 S6 CW
Sub-total
FNS907850 PPEB SAP-Supported Cross Applicat. Timesheet
0 1 Cross-Application Timesheet (CATS) Implementation
03 S2 CW
Sub-total
FNS908030 Development Charges Studies
0 1 DC Studies-Port Lands and Scarbor. Subway Corridor
05 S4 CW
Sub-total
TRE906803 Revenue System - Phase II (Part 2)
1 1 Revenue System - Phase II 04 S2 CW
Sub-total
TRE906804 Accounts Payable Process Improvements
1 3 Accounts Payable Process Improvements Phase III
04 S2 CW
Sub-total
TRE906809 Tax & Utility Replacement
1 1 Tax Billing System 03 S2 CW
1 2 Utility Billing System 03 S2 CW
1 3 Tax Billing System Replacement 03 S2 CW
1 4 Utlilty Billing System Replacement 03 S2 CW
Sub-total
0 0 0 0 0 0 2,975 2,975 0 0 0 0 0 0 0 2,975 00 2,975
0 0 0 0 0 0 2,975 2,975 0 0 0 0 0 0 2,975 000 2,975
0 0 0 130 390 520 0 520 0 520 0 0 0 0 0 0 00 520
0 0 0 130 390 520 0 520 0 0 0 0 0 0 0 0520 0 520
0 0 0 0 0 0 780 780 0 0 0 390 0 0 0 390 00 780
0 0 0 0 0 0 780 780 0 0 390 0 0 0 390 000 780
1,231 3,307 481 0 0 5,019 0 5,019 0 0 0 0 0 0 0 5,019 00 5,019
1,231 3,307 481 0 0 5,019 0 5,019 0 0 0 0 0 0 5,019 000 5,019
125 125 0 0 0 250 0 250 0 250 0 0 0 0 0 0 00 250
125 125 0 0 0 250 0 250 0 0 0 0 0 0 0 0250 0 250
221 0 0 0 0 221 0 221 0 0 0 0 0 221 0 0 00 221
221 0 0 0 0 221 0 221 0 0 0 0 221 0 0 000 221
194 0 0 0 0 194 0 194 0 0 0 0 0 0 0 194 00 194
194 0 0 0 0 194 0 194 0 0 0 0 0 0 194 000 194
552
710
158
0
0 0 0 0
730 185 0 0
2,679 5,460 0 0
1,056 3,290 0 0
552
1,625
8,297
4,346
0
0
0
0
552
1,625
8,297
4,346
0
0
0
0
0 0 0 110 442 0 0 00
0 0 338 0 557 730 0 00
0 0 0 0 0 0 8,297 00
0 0 4,285 0 0 61 0 00
552
1,625
8,297
4,346
1,420 4,465 8,935 0 0 14,820 0 14,820 0 0 4,623 110 999 791 8,297 000 14,820

Report Phase 5 - Program 24 Financial Services Program Phase 5 Sub-Project Category 01,02,03,04,05 Part B Sub-Project Status S2,S5,S6
Apr-25-2014 14:28:32
Part C Sub-Project Status S2,S3,S4
Page 3 of 4 Report 7C
Appendix 3: 2014 Capital Budget: 2015 to 2023 Capital Plan Gross Expenditures ($000's)
CITY OF TORONTO
Financial Services
Sub- Project No. Project Name
PrioritySubProj No. Sub-project Name Ward Stat. Cat.
Current and Future Year Cash Flow Commitments Current and Future Year Cash Flow Commitments Financed By
2014 2015 2016 2017 2018
Total
2014-2018
Total
2019-2023
Total
2014-2023
Provincial Grants and Subsidies
Debt Recoverable
Reserves Reserve Funds
Capital from
Current Other 1 Other2 Debt Development
Charges
Federal Subsidy
Total Financing
TRE906811 Parking Tag Mgmt Software Replacement
1 1 Parking Tag Mgmt Software Replacement 03 S2 CW
1 2 Parking Tag Mgmt Software Replacement II 03 S2 CW
Sub-total
TRE906815 Workflow & Document Mgmt Technology
1 1 Workflow & Document Mgmt Technology 04 S2 CW
Sub-total
TRE906890 eProcurement - Implementation
2 1 eProcurement - Implementation 04 S2 CW
2 2 eProcurement - Implementation Plan 04 S2 CW
Sub-total
0
0
0 0 168 0
0 0 482 770
168
1,252
0
956
168
2,208
0
0
0 0 0 0 0 0 168 00
0 0 0 0 0 0 2,208 00
168
2,208
0 0 0 650 770 1,420 956 2,376 0 0 0 0 0 0 2,376 000 2,376
1,115 0 0 0 0 1,115 0 1,115 0 0 0 120 0 437 0 558 00 1,115
1,115 0 0 0 0 1,115 0 1,115 0 0 120 0 437 0 558 000 1,115
557
336
0 0 0 0
0 0 0 0
557
336
0
0
557
336
0
0
0 0 0 0 452 0 105 00
0 0 0 0 0 0 336 00
557
336
893 0 0 0 0 893 0 893 0 0 0 0 452 0 441 000 893
Total Program Expenditure 20,476 16,049 12,433 780 1,660 51,398 9,436 60,834 0 770 4,077 5,641 110 2,109 791 47,336 00 60,834

Apr-25-2014 14:28:32 Page 4 of 4 Report 7C
Report Phase 5 - Program 24 Financial Services Program Phase 5 Sub-Project Category 01,02,03,04,05 Part B Sub-Project Status S2,S5,S6 Part C Sub-Project Status S2,S3,S4
CITY OF TORONTO
Gross Expenditures ($000's)
Appendix 3: 2014 Capital Budget: 2015 to 2023 Capital Plan
Financial Services
Current and Future Year Cash Flow Commitments and Estimates Current and Future Year Cash Flow Commitments and Estimates Financed By
Ward Stat. Cat.
Sub- Project No. Project Name
Priority SubProj No. Sub-project Name 2014 2015 2016 2017 2018
Total
2014-2018
Total
2019-2023
Total
2014-2023
Provincial Grants and Subsidies
Debt Recoverable
Reserves
Reserve Funds
Capital from
Current Other 1 Other2 Debt Federal Development Subsidy Charges
Total Financing
Financed By:
Development Charges 125 125 0 130 390 770 0 770 0 770 0 0 0 0 0 0 00 770
Reserves (Ind. "XQ" Ref.) 2,977 0 0 0 500 3,477 600 4,077 0 0 4,077 0 0 0 0 0 00 4,077
Reserve Funds (Ind."XR" Ref.) 656 995 3,475 0 0 5,126 515 5,641 0 0 0 5,641 0 0 0 0 00 5,641
Capital from Current 110 0 0 0 0 110 0 110 0 0 0 0 110 0 0 0 00 110
Other1 (Internal) 2,109 0 0 0 0 2,109 0 2,109 0 0 0 0 0 2,109 0 0 00 2,109
Other2 (External) 0 791 0 0 0 791 0 791 0 0 0 0 0 0 791 0 00 791
Debt 14,499 14,138 8,958 650 770 39,015 8,321 47,336 0 0 0 0 0 0 0 47,336 00 47,336
Total Program Financing 20,476 16,049 12,433 780 1,660 51,398 9,436 60,834 0 770 4,077 5,641 110 2,109 791 47,336 00 60,834
Status Code Description
S2 S2 Prior Year (With 2014 and\or Future Year Cashflow)
S3 S3 Prior Year - Change of Scope 2014 and\or Future Year Cost\Cashflow)
S4 S4 New - Stand-Alone Project (Current Year Only)
S5 S5 New (On-going or Phased Projects)
S6 S6 New - Future Year (Commencing in 2015 & Beyond)
Category Code Description
01 Health and Safety C01
02 Legislated C02
03 State of Good Repair C03
04 Service Improvement and Enhancement C04
05 Growth Related C05
06 Reserved Category 1 C06
07 Reserved Category 2 C07

2014-2023 Capital Program Financial Services
Appendix 4 2014 Cash Flow and
Future Year Commitments
www.toronto.ca/budget2014 Page 28

nt
CATS
Report Phase 5 - Program 24 Financial Services Program Phase 5 Sub-Project Category 01,02,03,04,05 Part B Sub-Project Status S2
Apr-25-2014 14:30:26
Part C Sub-Project Status S2,S3,S4,S5
Page 1 of 3 Report 7C
Appendix 4: 2014 Cash Flow and Future Year Commitments Gross Expenditures ($000's)
CITY OF TORONTO
Financial Services
Sub- Project No. Project Name
PrioritySubProj No. Sub-project Name Ward Stat. Cat.
Current and Future Year Cash Flow Commitments Current and Future Year Cash Flow Commitments Financed By
2014 2015 2016 2017 2018
Total
2014-2018
Total
2019-2023
Total
2014-2023
Provincial Grants and Subsidies
Debt Recoverable
Reserves Reserve Funds
Capital from
Current Other 1 Other2 Debt Development
Charges
Federal Subsidy
Total Financing
CFO906794 Investment & Debt Mgmt System 2011 Replaceme
3 1 Investment & Debt Mgmt System 2011 Replacement
03 S2 CW
Sub-total
CFO906795 Fin. Plan. Analysis & Reporting System (FPARS)
1 3 FPARS -Conceptual Design, Implem. & Extension
04 S2 CW
0 7 SAP Business Process Change & Technology Transfer
04 S2 CW
Sub-total
CFO906798 Risk Mgmt Information System Replacement
1 1 Risk Mgmt Information System Replacement 03 S2 CW
Sub-total
CFO906892 Captor Migration to New System 2014
3 1 Captor Migration to New System 2014 03 S5 CW
Sub-total
FNS907438 PCI Compliance
1 1 PCI Compliance 02 S2 CW
Sub-total
FNS907850 PPEB SAP-Supported Cross Applicat. Timesheet
0 1 Cross-Application Timesheet (CATS) Implementation
03 S2 CW
Sub-total
FNS908030 Development Charges Studies
0 1 DC Studies-Port Lands and Scarbor. Subway Corridor
05 S4 CW
Sub-total
TRE906803 Revenue System - Phase II (Part 2)
1 1 Revenue System - Phase II 04 S2 CW
Sub-total
TRE906804 Accounts Payable Process Improvements
185 0 0 0 0 185 0 185 0 0 185 0 0 0 0 0 00 185
185 0 0 0 0 185 0 185 0 185 0 0 0 0 0 000 185
2,747
10,808
0 0 0 0
7,119 0 0 0
2,747
17,927
0
0
2,747
17,927
0
0
0 0 0 0 0 0 2,747 00
0 2,792 0 0 0 0 15,135 00
2,747
17,927
13,555 7,119 0 0 0 20,674 0 20,674 0 2,792 0 0 0 0 17,882 000 20,674
383 0 0 0 0 383 0 383 0 0 0 383 0 0 0 0 00 383
383 0 0 0 0 383 0 383 0 0 383 0 0 0 0 000 383
950 0 0 0 0 950 0 950 0 0 0 0 0 0 0 950 00 950
950 0 0 0 0 950 0 950 0 0 0 0 0 0 950 000 950
204 0 0 0 0 204 0 204 0 0 0 0 0 0 0 204 00 204
204 0 0 0 0 204 0 204 0 0 0 0 0 0 204 000 204
1,231 3,307 481 0 0 5,019 0 5,019 0 0 0 0 0 0 0 5,019 00 5,019
1,231 3,307 481 0 0 5,019 0 5,019 0 0 0 0 0 0 5,019 000 5,019
125 125 0 0 0 250 0 250 0 250 0 0 0 0 0 0 00 250
125 125 0 0 0 250 0 250 0 0 0 0 0 0 0 0250 0 250
221 0 0 0 0 221 0 221 0 0 0 0 0 221 0 0 00 221
221 0 0 0 0 221 0 221 0 0 0 0 221 0 0 000 221

Report Phase 5 - Program 24 Financial Services Program Phase 5 Sub-Project Category 01,02,03,04,05 Part B Sub-Project Status S2
Apr-25-2014 14:30:26
Part C Sub-Project Status S2,S3,S4,S5
Page 2 of 3 Report 7C
Appendix 4: 2014 Cash Flow and Future Year Commitments Gross Expenditures ($000's)
CITY OF TORONTO
Financial Services
Sub- Project No. Project Name
PrioritySubProj No. Sub-project Name Ward Stat. Cat.
Current and Future Year Cash Flow Commitments Current and Future Year Cash Flow Commitments Financed By
2014 2015 2016 2017 2018
Total
2014-2018
Total
2019-2023
Total
2014-2023
Provincial Grants and Subsidies
Debt Recoverable
Reserves Reserve Funds
Capital from
Current Other 1 Other2 Debt Development
Charges
Federal Subsidy
Total Financing
TRE906804 Accounts Payable Process Improvements
1 3 Accounts Payable Process Improvements Phase III
04 S2 CW
Sub-total
TRE906809 Tax & Utility Replacement
1 1 Tax Billing System 03 S2 CW
1 2 Utility Billing System 03 S2 CW
1 3 Tax Billing System Replacement 03 S2 CW
1 4 Utlilty Billing System Replacement 03 S2 CW
Sub-total
TRE906811 Parking Tag Mgmt Software Replacement
1 1 Parking Tag Mgmt Software Replacement 03 S2 CW
1 2 Parking Tag Mgmt Software Replacement II 03 S2 CW
Sub-total
TRE906815 Workflow & Document Mgmt Technology
1 1 Workflow & Document Mgmt Technology 04 S2 CW
Sub-total
TRE906890 eProcurement - Implementation
2 1 eProcurement - Implementation 04 S2 CW
2 2 eProcurement - Implementation Plan 04 S2 CW
Sub-total
194 0 0 0 0 194 0 194 0 0 0 0 0 0 0 194 00 194
194 0 0 0 0 194 0 194 0 0 0 0 0 0 194 000 194
552
710
158
0
0 0 0 0
730 185 0 0
2,679 5,460 0 0
1,056 3,290 0 0
552
1,625
8,297
4,346
0
0
0
0
552
1,625
8,297
4,346
0
0
0
0
0 0 0 110 442 0 0 00
0 0 338 0 557 730 0 00
0 0 0 0 0 0 8,297 00
0 0 4,285 0 0 61 0 00
552
1,625
8,297
4,346
1,420 4,465 8,935 0 0 14,820 0 14,820 0 0 4,623 110 999 791 8,297 000 14,820
0
0
0 0 168 0
0 0 482 770
168
1,252
0
956
168
2,208
0
0
0 0 0 0 0 0 168 00
0 0 0 0 0 0 2,208 00
168
2,208
0 0 0 650 770 1,420 956 2,376 0 0 0 0 0 0 2,376 000 2,376
1,115 0 0 0 0 1,115 0 1,115 0 0 0 120 0 437 0 558 00 1,115
1,115 0 0 0 0 1,115 0 1,115 0 0 120 0 437 0 558 000 1,115
557
336
0 0 0 0
0 0 0 0
557
336
0
0
557
336
0
0
0 0 0 0 452 0 105 00
0 0 0 0 0 0 336 00
557
336
893 0 0 0 0 893 0 893 0 0 0 0 452 0 441 000 893
Total Program Expenditure 20,476 15,016 9,416 650 770 46,328 956 47,284 0 250 2,977 5,126 110 2,109 791 35,921 00 47,284

Apr-25-2014 14:30:26 Page 3 of 3 Report 7C
Report Phase 5 - Program 24 Financial Services Program Phase 5 Sub-Project Category 01,02,03,04,05 Part B Sub-Project Status S2 Part C Sub-Project Status S2,S3,S4,S5
CITY OF TORONTO
Gross Expenditures ($000's)
Appendix 4: 2014 Cash Flow and Future Year Commitments
Financial Services
Current and Future Year Cash Flow Commitments and Estimates Current and Future Year Cash Flow Commitments and Estimates Financed By
Ward Stat. Cat.
Sub- Project No. Project Name
Priority SubProj No. Sub-project Name 2014 2015 2016 2017 2018
Total
2014-2018
Total
2019-2023
Total
2014-2023
Provincial Grants and Subsidies
Debt Recoverable
Reserves
Reserve Funds
Capital from
Current Other 1 Other2 Debt Federal Development Subsidy Charges
Total Financing
Financed By:
Development Charges 125 125 0 0 0 250 0 250 0 250 0 0 0 0 0 0 00 250
Reserves (Ind. "XQ" Ref.) 2,977 0 0 0 0 2,977 0 2,977 0 0 2,977 0 0 0 0 0 00 2,977
Reserve Funds (Ind."XR" Ref.) 656 995 3,475 0 0 5,126 0 5,126 0 0 0 5,126 0 0 0 0 00 5,126
Capital from Current 110 0 0 0 0 110 0 110 0 0 0 0 110 0 0 0 00 110
Other1 (Internal) 2,109 0 0 0 0 2,109 0 2,109 0 0 0 0 0 2,109 0 0 00 2,109
Other2 (External) 0 791 0 0 0 791 0 791 0 0 0 0 0 0 791 0 00 791
Debt 14,499 13,105 5,941 650 770 34,965 956 35,921 0 0 0 0 0 0 0 35,921 00 35,921
Total Program Financing 20,476 15,016 9,416 650 770 46,328 956 47,284 0 250 2,977 5,126 110 2,109 791 35,921 00 47,284
Status Code Description
S2 S2 Prior Year (With 2014 and\or Future Year Cashflow)
S3 S3 Prior Year - Change of Scope 2014 and\or Future Year Cost\Cashflow)
S4 S4 New - Stand-Alone Project (Current Year Only)
S5 S5 New (On-going or Phased Projects)
Category Code Description
01 Health and Safety C01
02 Legislated C02
03 State of Good Repair C03
04 Service Improvement and Enhancement C04
05 Growth Related C05
06 Reserved Category 1 C06
07 Reserved Category 2 C07

2014-2023 Capital Program Financial Services
Appendix 5 2014 Capital Project with Financing Details
www.toronto.ca/budget2014 Page 29

Apr-25-2014 14:25:17 Page 1 of 2
(Phase 5) 24-Financial Services Sub-Project Category: 01,02,03,04,05 Type: B Sub-Project Status: S2 Type: C Sub-Project Status: S2,S3,S4,S5
Report P2-1A
CITY OF TORONTO
Appendix 5: 2014 Capital Projects with Financing Details
Financial Services
Sub-Project Summary
Project/Financing 2014 Financing
Priority Project Project Name Start Date Completion Date
Cash Flow Provincial Grants
Subsidies
Federal Subsidy
Developmt Charges
Reserves Reserve Funds
Capital From Current
Other 1 Other 2 Debt Debt Recoverable
PCI Compliance FNS907438 0
PCI Compliance 1 1 01/01/2009 12/31/2014
Project Sub-total:
PPEB SAP-Supported Cross Applicat. Timesheet CATS FNS907850 0
Cross-Application Timesheet (CATS) Implementation 0 1 01/01/2013 12/31/2016
Project Sub-total:
Development Charges Studies FNS908030 0
DC Studies-Port Lands and Scarbor. Subway Corridor 0 1 01/01/2014 12/31/2014
Project Sub-total:
Fin. Plan. Analysis & Reporting System (FPARS) CFO906795 1
SAP Business Process Change & Technology Transfer 0 7 10/30/2010 12/31/2014
FPARS -Conceptual Design, Implem. & Extension 1 3 01/01/2007 12/31/2014
Project Sub-total:
Revenue System - Phase II (Part 2) TRE906803 1
Revenue System - Phase II 1 1 01/01/2000 12/31/2014
Project Sub-total:
Accounts Payable Process Improvements TRE906804 1
Accounts Payable Process Improvements Phase III 1 3 01/01/2007 12/31/2014
Project Sub-total:
Workflow & Document Mgmt Technology TRE906815 1
Workflow & Document Mgmt Technology 1 1 01/01/2004 12/31/2014
Project Sub-total:
Risk Mgmt Information System Replacement CFO906798 2
Risk Mgmt Information System Replacement 1 1 01/01/2009 12/31/2014
Project Sub-total:
Captor Migration to New System 2014 CFO906892 3
Captor Migration to New System 2014 3 1 01/01/2014 12/31/2015
Project Sub-total:
Investment & Debt Mgmt System 2011 Replacement CFO906794 5
Investment & Debt Mgmt System 2011 Replacement 3 1 01/01/2011 12/31/2014
Project Sub-total:
204
204
0
0
0
0
0
0
0
0
00
00
0
0
0
0
0204
0204
1,231
1,231
0
0
0
0
0
0
0
0
00
00
0
0
0
0
01,231
01,231
125
125
0
0
0
0
125
125
0
0
00
00
0
0
0
0
00
00
10,808
2,747
13,555
0
0
0
0
0
0
0
0
0
2,792
0
2,792
00
00
00
0
0
0
0
0
0
08,016
02,747
010,763
221
221
0
0
0
0
0
0
0
0
00
00
221
221
0
0
00
00
194
194
0
0
0
0
0
0
0
0
00
00
0
0
0
0
0194
0194
1,115
1,115
0
0
0
0
0
0
0
0
0120
0120
437
437
0
0
0558
0558
383
383
0
0
0
0
0
0
0
0
0383
0383
0
0
0
0
00
00
950
950
0
0
0
0
0
0
0
0
00
00
0
0
0
0
0950
0950
185
185
0
0
0
0
0
0
185
185
00
00
0
0
0
0
00
00
TRE906890 eProcurement - Implementation 5

Apr-25-2014 14:25:17 Page 2 of 2
(Phase 5) 24-Financial Services Sub-Project Category: 01,02,03,04,05 Type: B Sub-Project Status: S2 Type: C Sub-Project Status: S2,S3,S4,S5
CITY OF TORONTO
Appendix 5: 2014 Capital Projects with Financing Details
Financial Services
Sub-Project Summary
Report P2-1A
Project/Financing
Priority Project Project Name
2014 Financing
Start Date Completion Date
Cash Flow Provincial Grants
Subsidies
Federal Subsidy
Developmt Charges
Reserves Reserve Funds
Capital From Current
Other 1 Other 2 Debt Debt Recoverable
eProcurement - Implementation TRE906890 5
eProcurement - Implementation 2 1 01/01/2007 12/31/2014 557 0 0 0 0 00 452 0 0105
eProcurement - Implementation Plan 2 2 01/01/2010 12/31/2014
Project Sub-total:
336
893
0
0
0
0
0
0
0
0
00
00
0
452
0
0
0336
0441
Tax & Utility Replacement TRE906809 6
Tax Billing System 1 1
Utility Billing System 1 2
Tax Billing System Replacement 1 3
01/01/2007 12/31/2016
01/07/2007 12/31/2016
08/08/2007 12/31/2016
Project Sub-total:
552
710
158
1,420
0
0
0
0
0
0
0
0
0
0
0
0
0
0
0
0
110 0
0153
00
110 153
442
557
0
999
0
0
0
0
00
00
0158
0158
Program Total: 20,476 0 0 125 2,977 110 656 2,109 0 014,499
Status Code Description
S2 S2 Prior Year (With 2014 and\or Future Year Cashflow)
S3 S3 Prior Year - Change of Scope 2014 and\or Future Year Cost\Cashflow)
S4 S4 New - Stand-Alone Project (Current Year Only)
S5 S5 New (On-going or Phased Projects)
Category Code Description
01 Health and Safety C01
02 Legislated C02
03 State of Good Repair C03
04 Service Improvement and Enhancement C04
05 Growth Related C05

2014-2023 Capital Program Financial Services
Appendix 6 2014 Reserve / Reserve Fund Review
(In $000s)
Reserve/Reserve Fund Review - Program Specific
Reserve / Reserve Fund Name
Project / SubProject Name and Number
Projected Balance as at Dec 31,
2013 *
Contributions / (Withdrawls)
2014 Budget 2015 Plan 2016 Plan 2017 Plan 2018 Plan 2019 Plan 2020 Plan
2021 Plan 2022 Plan 2023 Plan
2014 - 2023 Total
Contributions / (Withdrawls)
Waste Management (XR1404)
Beginning Balance Contributions / (Withdrawls) Util ity Bil l ing System Replacement TRE906809 Workflow & Document Mgmt. Technology
Payment Processing Equipment Replacement
54,175 54,175
(120)
54,055
(995)
53,060
(3,475)
49,585 49,585 49,585 49,585 49,585
(390)
49,195 49,195
(4,470)
(120)
(390) Total Withdrawls (120) (995) (3,475) (390) - (4,980) Contributions / Interest
Total Reserve Fund Balance at Year-End 54,175 54,055 53,060 49,585 49,585 49,585 49,585 49,585 49,195 49,195 49,195 * Based on the 3rd Quarter Variance Report
Reserve/Reserve Fund Review – Corporate
2014 Budget 2015 Plan 2016 Plan 2017 Plan 2018 Plan 2019 Plan 2020 Plan
2021 Plan 2022 Plan 2023 Plan
2014- 2023 Total
Contributions / (Withdrawls)
Beginning Balance 527,121 527,121 527,121 527,121 527,121 527,121 526,621 526,621 526,621 526,621 526,021 Contributions / (Withdrawls)
Capital Financing Reserve (XQ0011)
Investment & Debt Mgmt. System Replacement (500) (600) (1,100)
527,121 527,121 527,121 527,121 526,621 526,621 526,621 526,621 526,021 526,021 (1,100) -
Beginning Balance 18,307 18,307 18,273 18,273 18,273 18,273 18,273 18,273 18,273 18,273 18,273 Insurance Reserve Fund (XR1010)
Risk Mgmt. Information System Replacement (34) (125) (159)
Total Withdrawls (34) - - - - (125) - - - - (159) Contributions / Interest -
(34) - - - - (125) - - - - (1,259)
18,273 18,273 18,273 18,273 18,273 18,148 18,273 18,273 18,273 18,273 (1,259)
Total Reserve Fund Balance at Year-End
Other program / Agency Net Withrawals and Contributions Total Reserve Fund Balance at Year-End
Reserve / Reserve Fund Name
Project / SubProject Name and Number
Projected Balance as at Dec 31,
2013 *
Contributions / (Withdrawls)
Total Program Contributions / (Withdrawls)
* Based on the 3rd Quarter Variance Report
www.toronto.ca/budget2014 Page 30