2013MonitoringProgress:! … · Development Assistance (ODA) ... In 2011, the optional module of "...
31
1 2013 Monitoring Progress: Implementing Busan Commitments in Peru Peruvian Agency for International Co-operation (Agencia Peruana de Cooperación International) – APCI Lima, April 8, 2014 2014 Agencia Peruana de Cooperación Internacional
Transcript of 2013MonitoringProgress:! … · Development Assistance (ODA) ... In 2011, the optional module of "...

1
2013 Monitoring Progress:
Implementing Busan Commitments in Peru
Peruvian Agency for International Co-operation (Agencia Peruana de Cooperación International) – APCI Lima, April 8, 2014 2014
Agencia Peruana de Cooperación Internacional
2
Peruvian Agency for International Cooperation – APCI Directorate of Policies and Programs APCI Technical Team: Soledad Bernuy, Director (in charge) of Policies and Programs, [email protected] +511- 3193609 Nancy Silva, Directorate of Policies and Programs, [email protected] + 511-3193601 Elisa Robles, Directorate of Policies and Programs, [email protected] + 511-3193666 Ana Lucia Cosamalon, Directorate of Policies and Programs, [email protected] +511- 3193673 Santiago Alayza Sueiro, Directorate of Policies and Programs, [email protected], +511- 3193606

3
CONTENTS
Introduction
About the Busan 2013 monitoring process
Methodology
Overview of results
Results by indicator
Indicator 1 Development co-operation is focused on results that meet developing countries’ priorities. (Pilot exercise)
Indicator 5A Development co-operation is more predictable (annual predictability)
Indicator 5B Development co-operation is more predictable (medium term predictability)
Indicator 6 The aid is on budgets subject to parliamentary control.
Indicator 7 Mutual accountability among development co-operation actors is strengthened through inclusive reviews.
Indicator 8 Gender equality and women’s empowerment.
Indicator 9B Use of developing countries’ PFM (PFM) and procurement systems)
Annex

4
2013 Busan Monitoring Process of Commitments in Peru
INTRODUCTION Peru is experiencing the longest economic expansive stage of its Republic history. Between 2000 and 2010 the country grew 5% annually and this process has generated substantial changes. Classified as a low- and middle- income country and ranked amongst the recipients of large amounts of Official Development Assistance (ODA) in Latin America, it became an upper-middle income country and reduced the amount of ODA that they receive. Since 2008, Peru, as an Upper-Middle Income Country (UMIC), has a Gross National Income (GNI) of USD 4,780 per capita (current USD 2010), using the Atlas Method), with a GDP average growth rate of 7.1% (2005-2010). This classification criteria responds to the assumption that, as long as countries increase their per capita income, they have more resources and tools to fight against poverty and to finance their development. However, notwithstanding such progress, in Peru, the levels of poverty and extreme poverty still remain. For 2010, Peru has a population of 29.5 million inhabitants, of which 2.9 million (9.8%) live in extreme poverty earning less than 1.8 US$ per day. Poverty reduction has been higher in urban areas than in rural areas, both poverty and extreme poverty. This reveals that the sectors more connected to the market have been able to reduce poverty to a greater extent. Similarly, the urban-rural gap between the number of people living in poverty and in extreme poverty has increased from 1.9 to 3.1 times for people living in extreme poverty and 6 times to more than 14 times among people living in extreme poverty. This also reveals the extent of inequality, which did not have any significant decrease, as proved on the comparison of 2005 GINI (0.51) and that of 2011 (0.45). Throughout the last decade, as a result of the international crisis, a decrease of the amount of ODA towards Peru has been noticed. In absolute terms, it has decreased from 500.5 to 335.6 million US dollars between 2007 and 2010. Non-Refundable International Cooperation Fund (NRICF) has been decreasing since 2008, year of the world crisis of real estate. In 2010, the latest date of available information, the total amount is less than 33% of the level in 2007. Another important trend is that cooperation from private sources has become from 35% in 2007 to 45% of the total in 20101. UMIC condition puts the country in the international scene as a dual country, that is, as a country that still seeks international cooperation to learn how to better distribute its achievements amongst its population and also with the accountability to offer aid to other countries which are in a previous stage within their development process. The value and importance of the NRICF remain in the capacity to transfer knowledge, technology and good practices rather than in the amount of aid, which in our country reaches only 0.5 % of the GNP. The monitoring framework of Busan’s commitments is within a context of severe decrease of ODA resulting from several factors, amongst them, the international financial crisis. This shall suppose to improve the coordination and procedures for effective use of ODA resources.
1 2013 Annual Plan for International Co-‐operation. Executive Board Resolution, Nº056-‐2013/APCI-‐DE, dated July 09, 2013.
Page. 30-‐31

5
ABOUT THE 2013 BUSAN MONITORING PROCESS Peru has expressed its desire to comply with international commitments to the effectiveness of development co-operation, adopted in the Paris Declaration and Accra Agenda for Action, and the initiatives set up in Busan. The Peruvian Agency for International Cooperation (APCI), as a National Coordinator, responsible for monitoring in Peru the effectiveness of development cooperation, participated and conducted three monitoring surveys on the Paris Declaration (2006, 2008 and 2011) in order to measure the progress of the country with regards to five principles: Ownership, Alignment, Harmonization, Management oriented to results and mutual accountability. The Fourth High Level Forum on Aid Effectiveness in Busan2, South Korea (2011) was a step forward in the agenda of cooperation effectiveness, which set down the rules to design new co-operation, whose result was the conformation of a new Global Partnership for Effective Development Co-operation.
The purpose of monitoring the undertaking of commitments in Busan is to support the national and international accountability, and, in June 2012, it was agreed a periodic monitoring on a set of ten global indicators and their associated targets.
Once again, Peru expressed its desire to participate in the 2013 Global Monitoring Framework of Commitments in Busan, and on July the 5th, 2013 it officialized the beginning of the Process in Peru, in the XXXI Donors Forum. The process was leaded by the APCI along with the technical support of the Spanish Agency for International Development Co-operation (AECID) and the United Nations Development Programme (UNDP) as focal points. A total of 16 donors participated in the process (hereinafter called providers of development co-operation), different from the 2011 year, in which 20 cooperation providers participated. The difference is explained because in 2013 consultations, a new one which did not participate in the 2011 Survey (Australia) did participate, and five which had previously participated, did not participate this time (FIDA, Finland, Italy, OEA, OIM). As in previous years, United Nation Agencies are participating, totalizing a number of 9 Agencies.3. Governmental bodies, which have been part of the process, have joined the APCI’s efforts in order to measure the government indicators, making a total number of 14 public institutions, such as: Ministry of Production (PRODUCE), Ministry of Women and Vulnerable Populations (MIMP), Ministry of Education (MINED), Ministry of Housing, Construction and Sanitation (MVC), Ministry of Labor and Promotion of Employment (MTPE), Ministry of Foreign Trade and Tourism (MINCETUR), Health Department (MINSA), Ministry of Economy and Finance (MEF), Presidency of the Council of Ministers (PCM), National Center for Strategic Planning (CEPLAN), Office of the Public Defender, National Committee for Development and Life without Drugs (DEVIDA), National Institute of Statistics and Informatics (INEI), Ministry of Development and Social Inclusion (MIDIS) and the Congress of the Republic. Out of the 10 indicators of Busan, subject matter of consultancy during the global monitoring process, the APCI considered important to measure the 7 indicators proposed by the UNDP-OECD4 Secretariat, two of them optional: Indicator 1: development co-operation is focused on results that meet developing countries’ priorities and Indicator 8: Gender Equality and Women’s Empowerment (see Table Nº 1 with 7 indicators).
With regards to the gender indicator, the Peruvian government has been actively participating since 2011 in the monitoring of co-operation effectiveness for gender equality. In 2011, the optional module of
2 160 countries and 45 international organizations which have approved the Busan Agreement. 3 The 16 sources of cooperation providers are: Germany, Australia, World Bank, Belgium, IDB, CAF, Canada, Korea, United
States, Spain, Global Fund for fight against AIDS, tuberculosis and malaria, Japan, OEI, NNUU, Switzerland and European Union. The 9 Agencies of United Nations are: FAO, OIT, UN Women, UNAIDS, OPS/OMS, PMA, PNUD, UNFPA and UNICEF.
4 Guide to the Monitoring Framework of the Global Partnership, March 1st, 2013.
6
gender equality was developed within the framework of the Survey on the Paris Declaration. For the current process of Busan, it has been decided to measure the indicator 8 progress, including indicators proposed in the Paris Declaration. This process has been developed in parallel, conducted by the APCI along with the UN Women’s technical and financial support.
The information and funding on co-operation registered during to process of measurement of progress in Busan commitments make reference to the ODA. This includes transactions: (i) whose main objective is the promotion of economic development and welfare; and ii) made in (priority) concession economic terms or in very favorable conditions (in case of a loan, which entail a grant element of at least 25%)5. It is to underline that the financial amounts correspond to the 2011 calendar year in Peru, except indicator 5b, for which the reference year was 2013. On the other side, it was agreed that disbursements registered would be those registered in net volumes. Counterpart resources and administrative expenditures are not included, unless administrative expenditures are directly related to technical co-operation. Notwithstanding, external consultants’ fees are taken into account for services provided in the country. Finally, results obtained shall make possible to draft the whole image of the national progress at international scale, to be presented in the First High Level Meeting of the Global Partnership foreseen for April 15-16, 2014, in Mexico.
5 Detailed definitions appear in the statistical directives ofOECD-‐DAC Statistical Directives (OCDE, 2007).
7
METHODOLOGY
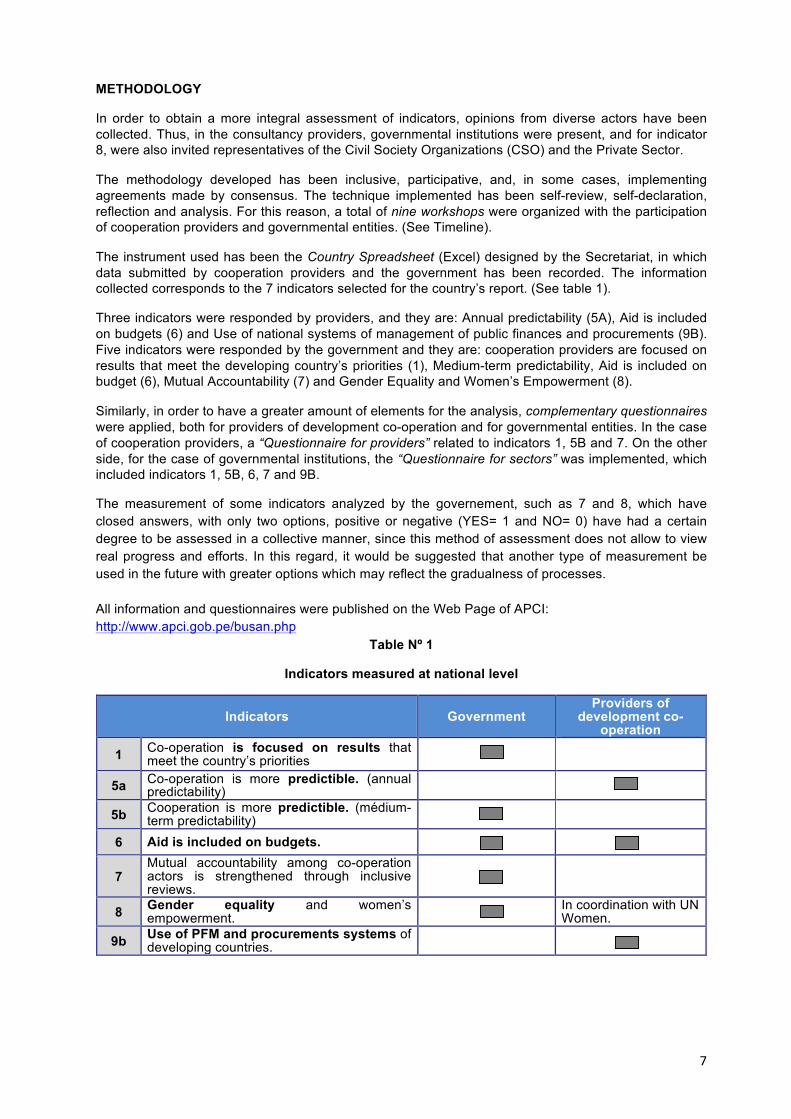
In order to obtain a more integral assessment of indicators, opinions from diverse actors have been collected. Thus, in the consultancy providers, governmental institutions were present, and for indicator 8, were also invited representatives of the Civil Society Organizations (CSO) and the Private Sector.
The methodology developed has been inclusive, participative, and, in some cases, implementing agreements made by consensus. The technique implemented has been self-review, self-declaration, reflection and analysis. For this reason, a total of nine workshops were organized with the participation of cooperation providers and governmental entities. (See Timeline).
The instrument used has been the Country Spreadsheet (Excel) designed by the Secretariat, in which data submitted by cooperation providers and the government has been recorded. The information collected corresponds to the 7 indicators selected for the country’s report. (See table 1).
Three indicators were responded by providers, and they are: Annual predictability (5A), Aid is included on budgets (6) and Use of national systems of management of public finances and procurements (9B). Five indicators were responded by the government and they are: cooperation providers are focused on results that meet the developing country’s priorities (1), Medium-term predictability, Aid is included on budget (6), Mutual Accountability (7) and Gender Equality and Women’s Empowerment (8).
Similarly, in order to have a greater amount of elements for the analysis, complementary questionnaires were applied, both for providers of development co-operation and for governmental entities. In the case of cooperation providers, a “Questionnaire for providers” related to indicators 1, 5B and 7. On the other side, for the case of governmental institutions, the “Questionnaire for sectors” was implemented, which included indicators 1, 5B, 6, 7 and 9B.
The measurement of some indicators analyzed by the governement, such as 7 and 8, which have closed answers, with only two options, positive or negative (YES= 1 and NO= 0) have had a certain degree to be assessed in a collective manner, since this method of assessment does not allow to view real progress and efforts. In this regard, it would be suggested that another type of measurement be used in the future with greater options which may reflect the gradualness of processes. All information and questionnaires were published on the Web Page of APCI: http://www.apci.gob.pe/busan.php
Table Nº 1
Indicators measured at national level
Indicators Government Providers of
development co-operation
1 Co-operation is focused on results that meet the country’s priorities
5a Co-operation is more predictible. (annual predictability)
5b Cooperation is more predictible. (médium-term predictability)
6 Aid is included on budgets.
7 Mutual accountability among co-operation actors is strengthened through inclusive reviews.
8 Gender equality and women’s empowerment.
In coordination with UN Women.
9b Use of PFM and procurements systems of developing countries.

8
The review of indicator 8 on gender equality and women’s empowerment was made as an independent process, i.e., a specific questionnaire was used, including also some additional questions, such as disaggregated information according to sex and indicators of review which had been also considered in the Report on the Paris Declaration.
The APCI in coordination with UN Women in Peru made a wide call to actors involved, organizing four specific workshops for each group, including not only State’s Entities, but also some providers, as well as OSC and the Private Sector. This latter was called in order to submit governmental progress, as well as to know its activities and projections for gender equality in the country. In order to prepare the Systematization Report of all the workshops, there was assistance from a consulting company6.
The official launch was made on July 5, 2013 in the XXXI Forum of Cooperation Providers, in which focal points were defined (UNDP and AECID), whose technical support was fundamental for timely development of this exercise. The assignment of a coordinator for each provider and for governmental institution was another important aspect for the good development of the process.
In this first meeting, it was agreed that the information be collected in two moments; the first stage was the training stage and the second stage was the submission of results. Thus, the “Training Workshop” was organized with the representatives from providers and governmental entities’ (separately) and whose target was to submit the monitoring framework of Busan and its scope. The second stage was the organization of the “Workshop on Review of the First Results”, which was, similarly, made with providers and with governmental entities.
Finally, the results of this first stage of collection, consolidation and analysis of information were submitted in a meeting with cooperation providers, including United Nations Agencies and some governmental entities, on October 25, 2013.
The Peruvian Government considers that this national monitoring process, in addition to include providers and national authorities, should not only be limited to obtain quantitative and qualitative data for indicators, but it also needs to promote spaces of dialog, consultation and reflection with other development actors, including the OSC, as well as the private sector, an important and a new actor, to share experiences, knowledge and good practices on development co-operation in the country. In this line of work, the APCI with the assistance from the AECID and the UNDP, organized the Seminar “Peru in the New Global Partnership for Effective Development Co-operation: dialog among diverse development actors” (Lima, October 24, 2013), whose target was to promote the inclusive dialog among the diverse development actors in order to communicate and to spread the Global Partnership’ initiative by encouraging a debate on how to improve the co-operation effectiveness and the experience of its multiple actors. During this process, there also was the aid provided by the AECID and the UNDP, as focal points, this, to promote discussions with international experts of the academy, research centers and United Nations through meetings of technical assistance with APCI and participation in the Seminar above mentioned. Víctor Viñuales, President of ECODES (Spanish specialized ONGD), professor José Antonio Alonso from the Complutense Institute of International Studies of Complutense University of Madrid and Gonzalo Pizarro, Regional Coordinator of Fight against Poverty and MDGs of the UNDP participated. The main stages and activities of the monitoring process made in Peru are described below:
6 Report on the Peruvian State progress with respect to indicator 8: Gender equality and Women’s
empowerment, Russela Zapata, September 2013. 55 page.

9
TIMELINE
DATE ACTIVITY
July 2 and 5 Official Launch (XXXI Donors Forum) and Guide Distribution
July 18 and 22 Preparatory Workshop with representatives of Providers of
development co-operation / Governmental entities (review of indicators and criteria for filling). (2 workshops).
July 19 and August 20
Data Collection (use of spreadsheets and complementary questionnaire (cooperation providers and government).
August 16 – September Indicator 8 and Gender Equality: data collection (4 workshops).
Ausut 21 - September 25
Data consolidation: (APCI in charge of Country Spreadsheet together with UNDP and AECID’s assistance.
October 10 and 11 Workshop on review of first results, with representatives of Providers / governmental entities. (2 workshops).
October 24 First extensive and inclusive dialogue: “Peru in the new Global
Partnership for Effective Development Co-operation: dialogue amongst diverse development actors”.
October 25 Submission of final results: with representatives of Providers / Governmental entities.
October 31 Submission of spreadsheet + Report: to the UNDP-OECD Team (Secretariat) by the APCI.
November – December
Preparation of Report on Global Progress: The Secretariat prepares the final report to be submitted in the First High Level Meeting of the Global Partnership, Mexico 2014.

10
SUMMARY ON RESULTS
The quantitative results of the survey are supported in the data supplied by providers. Additionally, the qualitative evidence submitted by diverse governmental institutions is used to answer the Government’s questions. The 2013 process results are presented below based on the latest result of the 2011 Monitoring Survey on the Paris Declaration.
Table Nº 2
Preliminary Results at national level
INDICATOR 2010 (Paris)7
2013 (Busan) Target (2015)
1
Development cooperation is based on results which meet to the developing countries’ priorities.
N/A8 Pilot execices (parallel process)
5A Development cooperation is more predictable (annual predictability)
80% 93%
To reduce half the gap – To reduce half the aid proportion not disbursed within the fiscal year for which it was scheduled.
5B Development co-operation is more predictable (medium-term predictability)
N/A NO / 43%
To reduce half the gap – To reduce half the proportion of co-operation funds which are not covered by expenditure plans.
6 Aid is on budgets subject to parliamentary control.
79% 24%
To reduce half the gap – to reduce half the proportion of co-operation flows to the public sector which is not reflected in public budgets (reflected, at least, 85% reported on budget).
7
Mutual accountability amongst co-operation actors is strengthened through inclusive reviews.
SI NO / 40%
100%
All developing countries shall have inclusive mutual reviews.
8 Gender equality and women’s empowerment
N/A NO / 8%
100%
All developing countries have systems which monitor and make public resources allocations for gender equality.
9b Use of country PFM and procurement systems 71% 61%
National aims shall depend on points in indicator 9a (PFM systems quality):
• Reduction of the difference by a third – Reduction of a third in % of funds of development co-operation funds which do not use the PFM national and procurements systems for countries between 3.5 and 4.5 in indicator 9a.
Source: Document is based on: Guide to the Monitoring Framework of the Global Parnership). According to the latest report from the Secretariat, march 2014
7 Resultados de la encuesta 2011 de la Declaración de Paris en el Perú. 8 N/A: indicador not applicable

11
RESULTS FOR INDICATOR
This indicator is focused on the annual predictability on international development cooperation. The annual predictability seeks to measure the difference between the cooperation funds scheduled and the funds disbursed by cooperation providers to the public sector within one year. Cooperation funds to the public sector are considered to be scheduled for disbursement, as long as the Peruvian Government has been notified with some advance notice.
Cooperation predictability is an engagement proposed since the Paris Declaration. To disburse the funding in a predictable and in a timely manner in accordance with the programs adopted contributes to enhance public sector planning and budgeting. The target of this indicator is that by the end of 2015, half the proportion of funding not disbursed within the fiscal year for which it was scheduled has been reduced. In contrast with previous measurements, data for indicator’s numerator and denominator is calculated from information reported by providers.
Table Nº 3 Indicator 5A: Annual Predictability (Reference Year 2011, USA Dollars)
Indicator 5a: Annual predictability
Total
disbursements
Disbursements for government
sector
Scheduled disbursements for govt. sector
Indicator 5a
a b c d = 'as
scheduled' e = 'beyond scheduled'
Australia 3.2 0.4 0.0 0% -- Belgium 19.6 5.3 6.5 81% CAF 3.3 2.1 1.3 100% 61% Canada 21.7 1.5 1.5 100% EU
Institutions 19.7 7.6 30.9 25%
Germany 199.7 199.7 176.7 100% 13% Global Fund 7.9 1.9 3.7 50% IDB 254.9 224.5 254.9 88% Japan 198.6 198.6 198.6 100% Korea 6.1 6.1 6.1 100% OEI 1.1 0.7 1.1 61% Spain 60.3 22.1 10.2 100% 118% Switzerland 7.3 5.6 10.5 54% United
Nations 35.7 30.0 30.6 98%
United States 82.8 82.8 66.6 100% 24% World Bank 129.5 124.4 125.9 99% Total 1 051 913 925 93% 6%
According to the figures shown in Table 1, annual predictability reached a high global value of 93%. Notwithstanding, very different situations are hidden depending on the cooperation provider. On one hand, there are cooperation providers who disbursed to the government more than it had been foreseen (Spain, Germany, United States and Development Bank of Latin America CAF). In the case of Spain,
Indicator 5A: Development cooperation is more predictable (annual predictability)

12
this difference is explained because there is one type of cooperation from decentralized origin (Autonomous and Local Governments), of which there is only information about disbursed amounts. A particular case is that of Australia, which did not make a timeline for Peru, notwithstanding it made some disbursements in our country. This is because their approach is regional not national. On the other hand, there is a group of cooperation providers, in which their disbursements are lower than their estimates (United Nations, Belgium, OEI, World Bank, Global Fund, European Union, Switzerland and IDB). And there are three cases (Japan, Canada and Korea) where the schedule was the same as it had been disbursed (100%). It is important to homogenize the concept on previous communication to the Peruvian Government in order that it can be calculated as “foreseen”, given that it may be understood by each provider in a different way. Another aspect which should be underlined is the fact that, in general, refundable cooperation (IDB, WB, and Japan) has better predictability than non-reimbursable cooperation (primarily the Global Fund and EU, which disbursed 50% or less than it had been foreseen for 2011). This is due to the fact that, in general, reimbursable cooperation for public budget and for proceedings set forth has higher predictability than that non-refundable. In order to improve the 5A indicator measurement, it would be advisable to report separately the non-reimbursable co-operation funds registered by the APCI and the reimbursable co-operation (loans) registered by the MEF. Additionally, this indicator should consider the use of a formula that allows preventing positive and negative variations from compensating among them (for instance: variation coefficient). Conclusion: In general, information recorded seems to indicate the existence of important predictability problems. Points to be analyzed for this indicator are in the first place, whether differences amongst predictability and real disbursements could be due to problems on execution, predictability, report, lack of communication with the Government, along with the fact that in some cases budgeting cycles and fiscal years from providers are different from those in Peru. With regards to the latter, it is recognized that each country has its timeline period set forth, however it is necessary to make some progress in annual periodicity. On the other hand, it is clear that annual predictability improvement of providers shall depend to a large extent on the improvement of Peruvian proceedings: approval of agreements, effectiveness; declaration on projects’ feasibility by the National System on Public Investment – SNIP, etc., which, on many occasions, end in affecting the execution of disbursements of diverse programs and/or projects on co-operation.

13
This indicator is focused on the medium-term predictability on development co-operation. According to the Busan Declaration, medium-term predictability seeks to reach the commitment that by 2013, providers of development co-operation have provided the Peruvian Government with their estimated predictability on funding and/or their implementation plans for three to five years’ period. It is important to mention that this is a new indicator that has no equivalent in the monitoring surveys on the Paris Declaration. Implementation plans should cover all the components known from the Country Assistance Strategy (budgeting assistance, projects, technical co-operation, aid in kind, etc.) and include estimations on future flows which still need to be assigned to specific activities. The target of this indicator is to know whether the Peruvian Government (public institutions, regional governments, and other) has disbursement estimations from cooperation providers for the 2014-2016 period given that this is measured by the government itself and it has been consulted with the 14 governmental institutions. Additionally, the APCI has requested that each cooperation provider that is participating makes its own self-assessment, including the 9 agencies of United Nations separately. From the analysis from governmental institutions, it may be concluded that medium-term predictability is even lower in Peru, which demands specific actions and highest level coordination in order that this information be available. In this way, it helps the internal budgeting timeline and a more efficient execution of funds. On the other hand, according to the answers received from providers themselves, medium-term predictability reached an average global value of 43%. Notwithstanding, very different situations are hidden depending on the providers.
Table Nº 4
Medium-term predictability (Year of reference 2013, YES=1; No=0)
Indicator 5b: Medium-term predictability. Estimated proportion of total funding
covered by forward spending plans
Fiscal Year
ending 2014 Fiscal Year
ending 2015 Fiscal Year
ending 2016 2013
Total disbursements
(Yes=1; No=0) (Yes=1; No=0) (Yes=1; No=0) (%) (USD m)
a b c d = (a+b+c)/3 (for reference)
Australia 0 0 0 0.00% 3.2 Belgium 1 1 0 66.67% 19.6 CAF 1 0 0 33.33% 3.3 Canada 0 0 0 0.00% 21.7
EU Institutions 1 1 1 100.00% 19.7
Germany 0 0 0 0.00% 199.7
Global Fund 1 1 0 66.67% 7.9 IDB 1 1 0 66.67% 254.9 Japan 0 0 0 0.00% 198.6
Korea 0 0 0 0.00% 6.1 OEI 0 0 0 0.00% 1.1 Spain 0 0 0 0.00% 60.3 Switzerland 1 1 1 100.00% 7.3 United Nations 1 1 0 66.77% 35.7 United States 1 1 1 100.00% 82.8
World Bank 1 1 1 100.00% 129.5 Total 56.2% 50.0% 25.0% 43.0% 1051
Indicator 5B: Development cooperation is more predictable (medium-‐term predictability)

14
Responses of de Untied Nations
Fiscal Year ending 2014
Fiscal Year ending 2015
Fiscal Year ending 2016
2013
(Yes=1; No=0) (Yes=1; No=0) (Yes=1; No=0) (%)
PNUD 1 1 1 100.00%
OPS/OMS 1 1 0 66.67%
UNICEF 1 1 1 100.00%
UNFPA 1 1 0 66.67%
ONU Mujeres 0 0 0 0.00%
ONUSIDA 0 0 0 0.00%
PMA 1 1 1 100.00%
FAO 0 0 0 0.00%
OIT 0 0 0 0.00%
All agencies 5 5 3
% 55,5% 55,5% 33,3%
(*) According to the latest report from the Secretariat, current percentages would have changed due to the formula modification.
Firstly, it has been observed that some of them, seemingly, do not have multiannual predictability: as in the cases of Spain, Australia, OEI, Germany, Japan, Canada, Korea and several UN Agencies (UN Women, UNAIDS, FAO and ILO). This may be due to diverse reasons which would be advisable to explore: economic situation, providers’ systems and administrative proceedings constraints, co-operation cycle renewals, and governmental changes which have an impact on co-operation policies, disbursement concept, planning not finished yet but which are expected to be ready before the end of the year, dependence on other providers in the case of multilateral, among others.
Other providers have partial predictability which only covers one or two of the years considered (generally those included in a multiannual program in force): United Nations, Belgium, Global Fund, IDB, CAF, and among UN Agencies OPS/OMS and UNFPA. In these cases, what is important is to ensure that these providers’ programming cycles ensure at least three years and are aligned, to the extent possible, with the Peruvian government multiannual program.
Only 7 cooperation providers have certain predictability for 3 years, amongst them are: WB, EU, Switzerland, United States, including three UN Agencies: PNUD, UNICEF and PMA. It is important to mention that all of them declare to include in these estimates all forms of co-operation oriented to the governmental sector.
On the other hand, providers such as the IDB and the United States, which have fiscal years different from Peru, declare to communicate their multiannual estimates on expenditures according to the Peruvian calendar year.
It is possible that the lack of communication may be due to problems on the way each of them sees an act of communication on disbursement estimates ahead of time.
An ideal practice which is underneath of this indicator is that in a bilateral negotiation between a provider and Peruvian authorities, the provider should provide the predictability data on medium-term disbursements of all types of instruments to be used during the programming period. Notwithstanding, the most frequent practice is that multiannual predictability available are limited to determined instruments, programs and projects, which are frequently negotiated independently from the Country’s Strategy (if there exists) and not from the total of all the existing modalities and devices.
Conclusion:
15
It is necessary to take into account that the lack of previous and complete information about the co-operation fund may affect, in some cases, the capacity governmental entities have to plan and to apply policies and strategies timely, above all, to request on time counterpart resources to the public budget and to properly plan the execution of resources.
There is no doubt that it deals with an important issue, particularly within the framework of reforms that intend to introduce multiannual budget in the Peruvian State.
Finally, as in Indicator 5A, it is necessary to differentiate reimbursable and non-reimbursable co-operation, given that tend to be different.

16
This indicator comes from the Survey on the Paris Declaration Indicator 3 and has a modification in the sense that denominator is the amount ex-ante scheduled for disbursement and not the disbursement made by the provider. Additionally, the indicator contains two predictability aspects: The first one is the capacity providers have to disburse the aid on the date foreseen. The second one is the capacity the Government has to register disbursements made by cooperation providers to the public sector. Similarly, this indicator is oriented to consign the level at which cooperation providers’ financial support is recorded in national budgets. Besides, the indicator mentioned above allows knowing how those development co-operation programs are connected to the process of each country to register disbursments on it’s own budgets and to their capacity to supervise their use and therefore their accountability. It deals with the fact that not only budget supports are recorded in public budgets, but also the other support modalities oriented to the public sector, even when funds do not circulate across public channels. The objective of this indicator is to reduce the difference in half –the proportion of cooperation flows for the governmental sector which are not reflected on public budget(s). (At 85% of the budget). In 2010, this data reached 41% in global average, being the base-line in Peru (2010): 79%. The data to analyze this indicator have been taken from figures supplied by the Ministry of Economy and Finance – MEF, from the existing public budgets and the auto-declaration of aid providers. Figures taken from the MEF correspond to the Modified Institutional Budget (Presupuesto Institucional Modificado – PIM). In 2011, in Peru this indicator reaches a 24% average, far away from the target proposed. At a disaggregated level, the scenario is presented in the following Table:
Table Nº 5 Aid is included in the budget subject to parliamentary scrutiny
(Reference Year 2011)
Indicator 6: Aid on budget
Funds recorded in
govt. annual budget
Scheduled disbursements for
govt. sector 2013 *
a b c = 'as scheduled' d = 'beyond scheduled'
Australia 0.0 0.0 0% Belgium 0.9 6.5 13% CAF 0.8 1.3 62% Canada 16.8 1.5 100% 1031% EU Institutions 18.0 30.9 58% Germany 50.6 176.7 29% Global Fund 0.0 3.7 0% IDB 4.7 254.9 2% Japan 127.6 198.6 64% Korea 0.0 6.1 1% OEI 0.0 1.1 3% Spain 11.6 10.2 100% 14% Switzerland 0.2 10.5 2% United Nations 0.0 30.6 0% United States 5.5 66.6 8% World Bank 1.0 125.9 1%
Total 238 925 24% 2%
Source: a: MEF, b: Provider’sAnnual Declaration
Out of the data recorded for this report (information as of 2011) and in the light of the data reported by the Government (US$ 237,865,747) and Providers US$ (925,082,435), the indicator estimate gives the
Indicator 6: Aid is on budgets which are subject to parliamentary scrutiny

17
result that only 24% of the ODA provided to the public sector is on the public budget approved by the legislative power. According to this data, five of the sixteen cases about there is information less than 3% of development cooperation scheduled would have been recorded (WB: 1%, IDB: 2%, Switzerland: 2%, OEI: 3%, Korea: 1%). On the other hand, resources disbursed by Australia and the Global Fund had no record on budget (0%). In contrast, 8 % is recorded in budget of resources scheduled of United States and 13% of Belgium. Similarly, CAF resources recorded by 62%, Japan 64%, European Union 58% and Germany 29% of the resources scheduled stand out with high percentages. Canada has a 1131% in this indicator, which shows a great difference between the disbursement scheduled and what was really recorded in budget. A first glance at indicator 6, whose total result has been 24% could mean a setback in front of 79% indicator (for 2010, 63% for 2007 and 46% for 2005), notwithstanding, it is important to mention that for that indicator it was considered as denominator the funding effectively disbursed and not the scheduled funding to be disbursed, being this latter amount much higher than the previous one in most cases. On the other hand, it may be deducted from these data that disbursements recorded in budget are very small (US$ 237,865,747), given that in Peru this record can only be made when resources flow through public budget channels, as set forth by national rules on this subject. Even though the indicator states that all should be recorded, this is not possible for the Peruvian case, unless domestic legal regulations may be modified. On the other hand, there has been allocated only data coming from donation and transfer accounts in the Public Budget for US$ 75,031,747.00, which corresponds to technical co-operation and non-reimbursable funding, recorded for each public institution in the Integrated Financial Administration System (SIAF) of MEF9, plus loans for US$ 162,234,000 that the MEF considers that they are regarded as concessional loans and that they come primarily from Japan (JICA) and from Germany (KfW). See table below.
Table Nº 6 Resources allocated on the public budget
(Reference Year 2011)
Item PIM USD Budgeted Donations and transfers 75,031,7478 Concessional loans 162,234,000 § Germany (KFW) 40,764,000 § Japan (JICA) 121,470,000
Total
237,865,747
Source: General Direction of Public Budget of the Ministry of Economy and Fnance– MEF.
It is to underline that there is a great difference between the amounts that the MEF considers as disbursements of concessional loans (with rates lower than the Libor Rate) and those declared by organisms such as IDB and the World Bank. Thus, whilst Peru considers that only US$ 162.234.000 coming from Japan and Germany meet the concession requirement, these multilateral organisms consider amounts of US$ 125.918.058,55 (World Bank) and US$ 254.859.880,95 (IDB) as concession loans. The General Directorate of Indebtedness and Public Treasury has recorded disbursements of non-concessional loans from both organisms for the year 2011 for US$ 221.465.000 coming from the IDB and US$ 45.271.000 from BIRF (World Bank). Similarly, it allocates US$ 390.334.000 from the CAF and US$ 3.958.000 from FIDA, which makes a total of US$ 661.028.000 in loans from international organizations in 2011. On their side, the total number of loans coming from the Paris Club represent a total of US$ 328.765.000, out of which US$ 193.013.000 come from Germany and US$ 135.752.000 come from Japan.
9 It is important to mention that the MEF allocates a total of US$ 96,838,231 for donation account, for 2011, out of which US$ 21,206,484.0 correspond to co-‐operation providers such as Italy, Holland, GEF which did not participate in this monitoring process and another group calle as others, which have been excluded, given that there is no figure to be compared to.

18
Table Nº 7
Amounts disbursed to Peru of Non-Concessional Loans (Reference Year 2011)
CO-OPERATION PROVIDERS Amounts (in US$)
Organizations IDB 221,465,000 BIRF 45,271,000 CAF 390.334,000 FIDA 3,958,000
Total Number of Organisations 661,028,000
Paris Club Germany 193,013,000 Japan 135,752,000
Total Paris Club 328,765,000
Total General Non-Concessional Loans 989,793,000
Source: General Directorate of Indebtedness and Public Treasury of MEF The total amount of loans disbursed in 2011 to Peru is US$ 989.793.000, which is near US$ 925.082.435 allocated for suppliers. In this context, it would be advisable to review definitions on concession for the case of loans, given that they do not coincide with the concept defined by the MEF. These differences on concept have a direct influence on the result of this indicator, which is very low. With regards to non-reimbursable co-operation and technical co-operation, the amounts recorded in budgets are lower than loans, even though there is an important trend to continue increasing in some cases such as Belgium and the European Union. Conclusion: Given that indicator 6 could reflect how development co-operation is aligned with the country’s development priorities and policies, plans and programs, in addition to an obligatory accountability and/or scrutiny by the legislative power, what has been mentioned above would suggest a review of parameters fixed to determine the concession of loans, given that the difference lies in this concept. On the other hand, for technical cooperation and non-reimbursable (donation) it would be advisable that national budgeting regulations may be modified in order that all the resources from internal providers may be recorded and have real and reliable data of the effective amounts that enter the country, for any modality and device. By collecting public institutions’ contribution, It can be concluded that, in general, in Peru, there is a low incorporation of ODA resources in the public budget, given that cooperation providers still use their own internal systems of resources management, except the cases of the EU budget assistance reported by the MEF and the efforts made by Belgium, Canada and Spain for the Basket of Funds of the Office of the Ombudsman and those of the WB and Japan for the case of loans reported by the Ministry of Housing and the MEF.
Efforts should be made in order to allocate the information about the opening initial budget (PIA) instead of PIM, since this is the one that better reveals the initial scheduling of disbursements scheduled by cooperation providers and is approved by the Congress of the Republic in the opening of the fiscal year.

19
This indicator measures the progress made by developing countries in undertaking co-operation commitments, understanding that co-operation providers and governments from country stakeholders should be accountable before their citizens and amongst them for effective development co-operation. In this sense, this indicator is focused on the extent of undertaking high level periodic years in which governmental authorities and a large set of providers participate in order to review the mutual assessment on development results and on development co-operation quality in the country. High level participation is considered when it includes at least vice-ministerial participation or its equivalent, and, with regards to joint devices on assessment, it has been opted to consider in addition to multi-provider reviews, bilateral reviews which may be specific to a project, program, sector or important issue, provided that the participants’ level is sufficiently high. The nearest indicator antecedent is in the Survey on the 2011 Paris Declaration and subsequently as one of Busan commitments. Although the Government is in charge of this indicator measurement, it was considered appropriate to ask each co-operation provider and governmental entities of ODA recipients. To determine the progress made in this indicator. Peru is considered to have a mutual assessement progress when at least four of the five applied criteria are met. (See table 8). The methodology used was the following: 1 point when affirmative answers are equal than or more than 60% whilst it is considered 0 points to percentages lower than 60%. Having specified this, the result of the answers is shown in the following table:
Indicator 7: Mutual accountability
Aid/partnership
policy Country-level
targets
Assessment towards targets
Involvement of non-executive stakeholders
Results made public
2013 2010 *
(Yes/No) (Yes/No) (Yes/No) (Yes/No) (Yes/No) (Yes/No) (for reference)
At least 4/5
criteria
Peru Yes No Yes No No No Yes
2015 Target Yes
v.20131122
Indicator 7: Mutual accountability among development co-‐operation actors is stengthened through inclusive reviews

20
Table Nº 8
Indicator 7: Mutual accountability among development co-operation actors is strengthened through inclusive reviews
(Reference Year 2011)
CRITERIA
Qg5 Do you have a document on Strategy on Country Assistance, Association Framework
or other similar?
Qg6 Have
specific targets on quality and
development cooperation
been assessed?
Qg7 Over the last two years have you made a joint
assessment/review of the targets proposed in your cooperation interventions with participation of the Peruvian Government at
high level?
Qg8 Actors which are not part of the executive power (OSC,
private sector, private
companies, regional
governments, others) have
actively participated in
these assessments?
Qg9 Have the results of
these years been made
public timely and
exhaustively?
PROVIDERS Criterion 1 of
Indicator 1 (Si=1/No=0)
Assessment
in the two last years
High Level Participation
YES YES YES YES YES YES
Spain 1 0 1 1 0 1 Australia 1 0 1 0 0 1 Belgium 1 1 1 1 1 1 OEI 0 0 0 0 0 0 World Bank 1 0 0 0 0 0 Global Fund 0 1 0 1 1 1 European Union 1 1 1 1 1 1 Germany 1 1 1 1 1 1 Switzerland 1 1 1 1 1 0 Japan 1 0 1 1 0 0 United States 1 0 1 0 1 1 Korea 1 0 0 0 0 0 CAF 1 0 0 0 0 0 IDB 1 1 1 1 1 1 Canada 1 1 1 1 1 1 UNSO 1 1 1 1 1 0 Percentage 16 providers 87% 50% 68% 62% 56% 56%
ANSWERS FROM AGENCIES OF THE UNITED NATIONS SYSTEM ORGANIZATIONS UNDP 1 1 1 1 1 1 PAHO/WHO 1 1 1 1 1 1 UNICEF 1 0 1 1 0 1 UNFPA 1 1 1 1 0 1 UN WOMEN 0 1 1 1 1 0 UNAIDS 1 1 1 0 1 0 PMA 1 1 1 1 1 1 FAO 1 0 1 1 1 0 ILO 0 1 1 1 1 0 Result UNSO 78% 78% 100% 89% 78% 56%
With regards to the first criterion, 87% (14 out of 16 providers) stated that they have an updated document of their Country Aid Strategy; whilst 13% (2 co-operation providers) expressed that they do not have such document (OEI and Global Fund).
50% of the providers consulted (8 out of 16 providers) expressed that they have specific targets with the country on development co-operation effectiveness, taking into account commitments set forth with the Government in their Bilateral Programs, or in periodic reviews of their high level projects or activities.
21
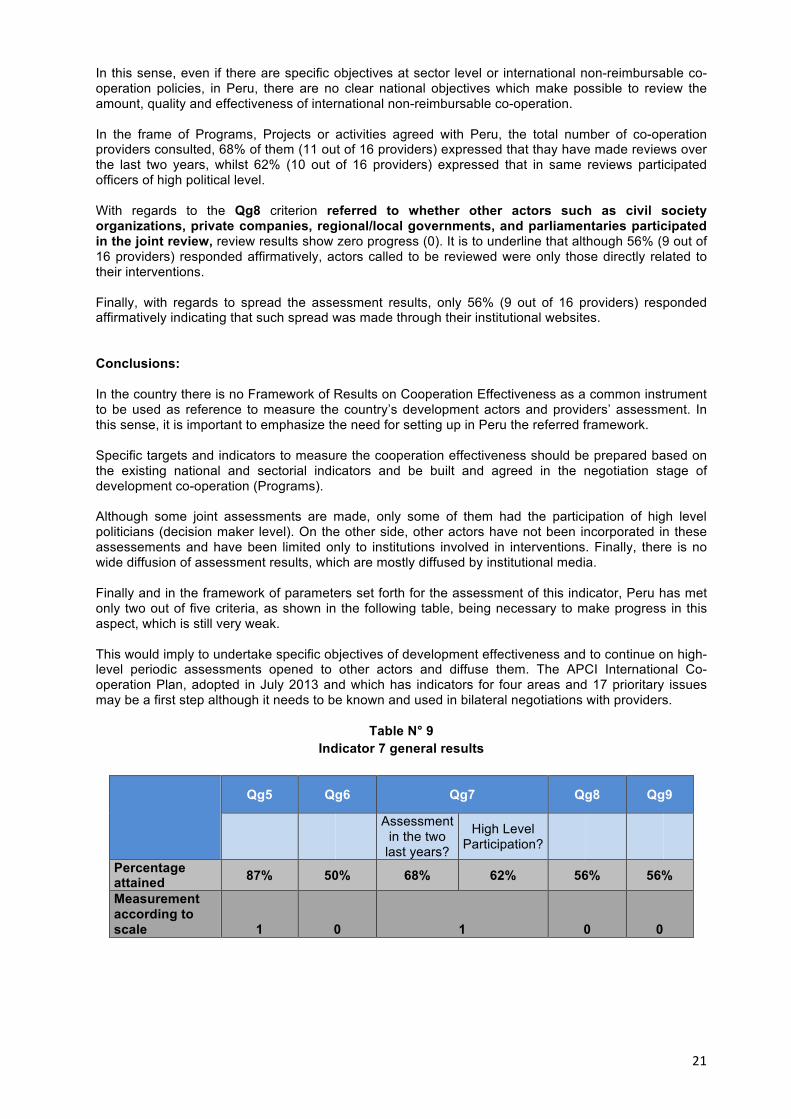
In this sense, even if there are specific objectives at sector level or international non-reimbursable co-operation policies, in Peru, there are no clear national objectives which make possible to review the amount, quality and effectiveness of international non-reimbursable co-operation. In the frame of Programs, Projects or activities agreed with Peru, the total number of co-operation providers consulted, 68% of them (11 out of 16 providers) expressed that thay have made reviews over the last two years, whilst 62% (10 out of 16 providers) expressed that in same reviews participated officers of high political level. With regards to the Qg8 criterion referred to whether other actors such as civil society organizations, private companies, regional/local governments, and parliamentaries participated in the joint review, review results show zero progress (0). It is to underline that although 56% (9 out of 16 providers) responded affirmatively, actors called to be reviewed were only those directly related to their interventions. Finally, with regards to spread the assessment results, only 56% (9 out of 16 providers) responded affirmatively indicating that such spread was made through their institutional websites. Conclusions: In the country there is no Framework of Results on Cooperation Effectiveness as a common instrument to be used as reference to measure the country’s development actors and providers’ assessment. In this sense, it is important to emphasize the need for setting up in Peru the referred framework. Specific targets and indicators to measure the cooperation effectiveness should be prepared based on the existing national and sectorial indicators and be built and agreed in the negotiation stage of development co-operation (Programs). Although some joint assessments are made, only some of them had the participation of high level politicians (decision maker level). On the other side, other actors have not been incorporated in these assessements and have been limited only to institutions involved in interventions. Finally, there is no wide diffusion of assessment results, which are mostly diffused by institutional media. Finally and in the framework of parameters set forth for the assessment of this indicator, Peru has met only two out of five criteria, as shown in the following table, being necessary to make progress in this aspect, which is still very weak. This would imply to undertake specific objectives of development effectiveness and to continue on high-level periodic assessments opened to other actors and diffuse them. The APCI International Co-operation Plan, adopted in July 2013 and which has indicators for four areas and 17 prioritary issues may be a first step although it needs to be known and used in bilateral negotiations with providers.
Table N° 9 Indicator 7 general results
Qg5 Qg6 Qg7 Qg8 Qg9
Assessment
in the two last years?
High Level Participation?
Percentage attained 87% 50% 68% 62% 56% 56%
Measurement according to scale 1 0 1 0 0

22
This indicator assessed the Peruvian Government efforts to develop budget tracking system for gender equality. Similarly, weaknesses on this issue could have been identified in a self-assessement environment and constructive review, having as a result the form of actions which would help us to provide substantial progress in this issue.
The methodology developed to submit the report has been inclusive, participative, thoughtful and analytical. A total of 76 representatives participated (87% women, 13% men) of 26 public entities, 20 international co-operation agencies and 16 organizations of the civil society. There have also been the participation and contribution of 18 representatives (895 women, 11% men) of 10 private enterprises and 4 business associations. (See: Annex the Final Report on this process).
Information supplied was processed and consolidated in preliminary reports, which were put into consideration of entities in the three workshops developed, with the State, Co-operation and Civil society, respectively. The information was revised in each workshop, with a prospecitive analysis and mutual recommendations, using as procedure a participative methodology, teamwork, as well as the space for individual and collective interventions and proposals.
To assess Indicator 8, the matrix prepared was considered for sectors, for the analysis contributions from co-operation providers and from civil society were included.
Finally, were also included the results of two further indicators on the us use of disaggregated data for sex, to support the decision-making with regards to the resource allocation at sectorial and/or at local levels; and with regards to the assessments on the impact on budgets and expenditures to assess how women and men benefit from the public expenditure; both indicators have been assessed by sectors, co-operation providers and civil society organizations.
Indicator 8: Gender Equality and Women’s Empowerment
Answers from 26 governmental insituttions are presented below, which assessed the indicator globally with very low points, with 8% average, as shown in Table N° 10.
Indicator 8: Gender Equality and Women's Empowerment
Govt. statement
n tracking systems
Allocations systematically
tracked
System leadership/over-sight by govt.
Budget info. opublically available
2013
(Yes/No) (Yes/No) (Yes/No) (Yes/No) (Yes/No)
a b c d At least 2/4 criteria
*
Peru No No No No No
2015 Target Yes
Indicator 8: Gender Equality and Women’s empowerment

23
Table Nº 10 Indicator 8: Gender equality and women’s empowerment
(Reference Year 2011 onwards)
Information about the Sectors that did not answer the questionnaire10
(Qg10) Does your sector has a system or an
official declaration to monitor the
budget allocated to gender equality or women’s
empowerment? Yes= 1 No = 0
(Qg11) Does your sector
have a systematic monitoring (regular) of
budget allocations for
gender equality and women’s
empowerment? Yes= 1 No = 0
(Qg12) Is your sector part of a system which monitors or
supervises the public budget allocated for
gender equalityor women’s
empowerment? Yes = 1 No = 0
(Qg13) Does your
sector make publilc budget allocation to
gender equality or women’s
empowerment? Yes = 1 No = 0
(Qg13) Which are the tools used to
spread information about
the budget allocated by your sector for gender
equality or women’s
empowerment ?
Yes= 1 No = 0
YES 3 2 2 1 2
NO 23 24 24 25 24 TOTAL 26 26 26 26 26 % 11.54% 8.33% 7.69% 3.85% 7.69% Global average % 7.82%
Final assessment 0 0 0 0 0
With regards to the question, there is a budget tracking system allocated for gender equality, only three institutions (of 26) answered affirmatively and they are: the Ministry of Women and Vulnerable Population (MIMP), the Ministry of the Interior (MININTER) and the Congress. Similarly, with regards to a systematic budget tracking system, only two institutions (MIMP and the MININTER) answered affirmatively. The situation gets worse when it is assessed if the institution supervises or monitors the budget, the MIMP and JNE answered affirmatively. Finally, the weakness part is in transparency, since only one institution, the MIMP, makes public the budget and only two has some diffusion tools which are the MIMP and MININTER.
Although there has been progress in the preparation of strategic guidelines and there is the National Plan on Gender Equality, this instrument is not decisive for budget planning and priorization, given that there are no mandatory guidelines to undertake budgeting and its strategic guideline with sectorial, regional and local plans.
Therefore, this progress is not reflected in administrative and monitoring aspects, specifically, there is no expenditure classifier in budget for gender equality. Another factor that has influence on this issue is the free interpretation of the concept on transversalization, since specific objectives referred to gender are not identified in development issues, and, therefore, neither results nor the corresponding activities are proposed. This will result in no resource allocation, most of the time it is considered to be sufficient to include the issue only as an approach in institutional documents, without a correlation of objectives and budget.
Most of International Co-operation in the country has a gender officer, with strategies and tools for the accompaniment and technical assistance to public entities and civil society; they even allocate resources to hire experts for projects they finance. However, sometimes, the expert on gender is only for the specific project and not for the institution.
2. Further Indicator: Use of specific indicators of gender and data disaggregated by sex to support decision-making with regards to resource allocation at sectorial and/or local levels.
Table 11 Data are disaggregated by sex
10 Governmental entities participating in the Indicator 8 measurement are: CEPLAN, Congress of the Republic, Ombudsman Office, INEI, JNE, MINAG, MINCETUR, MINAM, MINCUL, MINDEF, MEF, MINEDU, MIDIS, MININTER, MINJUD, MIMP, PRODUCE, MRE, MINSA, MTPE, MTC, MINISTRY OF HOUSING, ONPE, PCM, RENIEC AND APCI.

24
INDICATOR N°2 DATA IS DISAGREGATED Progress Score
BY SEX 1 2 3 4 5
Q1. Data for monitoring and evaluation of the national development strategy are disagregated systematically by sex. They are timely, relevant, detailed.
x
Q2. Are analized and utilized in decisions. x Q3. Are comunicated to the public x Q4. Donors support the capacitation for the recopilation, analysis and difusion.
x
Q5. Donors utilize this data in their process and decision making, aid allocation and programme elaboration.
x
1. = Slight action: data disaggregation by sex blocked, sporadic or inexisting. This is not analyzed
nor spread systematically. 2. = There exist elements: there is a certain base (structures, plans) for data disaggregation by
sex, these data are not analyzed nor spread systematically. 3. = Action undertaken: progress is not enough, disaggregation of main monitoring indicators and
data analysis are more systematic and are made public. There are plans to ensure the use of data in decision making, but it does not operate yet in all the public sectors.
4. = Developped: significant progress but it needs to ensure sustainability, disaggregated data by sex are appropriate and detailed, the system ensures a manageable number of actions, results and indicators related to the IO, data used for decision making.
5. = Sustainable: there are no signs of possible deterioration; there exist a generalized belief in data disaggregation.
Even if there is disagreggated information by sex (assessment of 3 points) this is not used for decision-making (assessment of 2 points), although in the case of providers the use in decision-making is higher (3 points).
It has been confirmed the absence of a specific budget for gathering, recording, processing, reporting and publication of information disaggregated by sex in public institution, except that of the National Institute of Statistics and Informatics. This situation will not facilitate the measurement of the extent of affectation and results differentiated from the projects, in women and men, nor to measure the impact on political and technical objectives.
Most of sectorial data is not disaggregated by sex and there is no sectorial data for all the other issues on gender equality and the existing one is not interpreted with a multicause logic. Furthermore, there is a weak interinstitutional articulation in the gathering, systematization and socialization of information about gender. Even if there is a Demographic and Family Health Surveys (ENDES in Spanish) and public information in the Web Page, data of women from 15 years and with union of couple are only considered.
Finally, it has been confirmed that few Co-operation entities support issues on training for data analysis in a context in which there is no State-Civil Society articulation.
3. Further indicator “Use of regular assesments of impact on budgets and expenditures to approach how men and women benefit from public expenditure”
To assess this indicator, three questions have been considered which come from the report on the Paris Declaration; two of them determine the importance of making joint assessments of the progress and impact of the intervention for gender equality, among State’s bodies and among these with Co-operation and Civil Society organizations. The third question seeks to measure the strategic priority of gender equality in the country.
Public entities, civil society and co-operation organizations which answered the questionnaire noted that no mutal and/or joint assessment is made, and there is consensus on the fact that gender equality and women’s empowerment remains as a weakness in the public pollcy of the Peruvian State.
Sectorial reports on the Act on equal opportunities for men and women to be submitted in the Congress – as it is the same with the Monitoring Matrix of the Supreme Decree N° 027 to be submitted to the

25
Presidency of the Council of Ministers – are consolidated in a document, but its progress is not assessed at intersectorial level. The formality is complied, but it is not assessed its effectiveness for the sector itself which reports to, nor for women and men subject to their attention.
Further in-depth assessments are not in practice. There are no devices of information and of an integrated monitoring system and assessment for the 2012 – 2017 National Plan for Gender Equallity (the National System for Gender Equality – SNIG has been submitted in August 2013 and it is not known in the sectors yet).
The existing spaces and devices for gender equality are not used to make intersectorial joint assessments. In some sectors projects which have co-operation resources do not require gender component and in which there are, this is not mandatory to make them. Co-operation entities include the assessment to prepare projects, but there is no mutual assessment review undertaken.
Conclusions:
Even if there is a negative assessment on the existence of a budget tracking system for gender equality, it is encouraging to confirm that it has been undertaken since August 2013, the National System on Gender, which has budget as one of its components.
There is progress in this issue, although this is not reflected in administrative aspects and financial procedures. For this reason, political will is necessary to undertake the system and to make sensitive the Ministry of Economy and Finance to put into operation the resource allocation for gender allocation.
The budget of the Republic does not have an expenditure classifier for gender, being urgent to make incidence actions to make progress in this subject in particular. Information disaggregated by sex is not used for decision-making although its use in the case of co-operation providers is higher, because there is need of handling specific information in the projects.
Policy on gender equality in Peru is still weak, it complies with formal procedures but it does not have consciousness on utility of the issue. This is noticed in sectors themselves when they report the issue both in men and women who are subject to attention.
It is necessary to encourage espaces for dialog and joint assessment State-Co-operation-Civil society to prepare the State Report of all the international commitments for gender equality, similar to that developed in the preparation of this report of Busan Partnership.

26
This indicator has been measured since 2006 in surveys on the Paris Declaration; which target is to assess the use of Public Financial Management (PFM) systems and procurements. To measure this indicator 4 sub-indicators are considered: national systems on budget execution financial reports and the audit and national systems on procurements.
Governmental sectors consulted think that the use of national systems of Public Financial Management has not become widespread. There has been some specific progress referred to national budget execution procedures and much more limited the use of National Systems on the Submission of Financial Reports, Audit and Procurements.
With respect to the use of these systems by co-operation providers, it is observed that they have been used only in an isolated manner, except the case of the EU, which has defined devices for the use of public financial management systems, not being part of a co-operation provider’s widespread policy.
The results by co-operation provider are presented in the following table for the four mentioned sub-indicators.
Table Nº 12 Indicator 9B: Use of PFM and procurements of developing countries
(Reference year 2011 onwards)
Indicator 9b: Use of country PFM and procurement systems
Disbursements for government
sector
Public financial management Procurement
Budget execution Financial reporting Auditing Proc. Systems 2013
a b c d e avg(b,c,d,e) / a
Australia 0.4 0.0 0.0 0.0 0.0 0%
Belgium 5.3 0.0 0.0 0.0 0.0 0%
CAF 2.1 0.0 0.0 0.0 0.0 0%
Canada 1.5 1.5 1.5 1.5 1.5 100%
EU Institutions 7.6 6.0 6.0 6.0 0.0 59%
Germany 199.7 175.1 175.1 175.1 175.1 88%
Global Fund 1.9 1.9 1.9 1.9 1.9 100%
IDB 224.5 224.5 224.5 224.5 0.0 75%
Japan 198.6 135.7 135.7 135.7 135.7 68%
Korea 6.1 0.0 0.0 0.0 0.0 0%
OEI 0.7 0.0 0.0 0.0 0.0 0%
Spain 22.1 1.4 0.0 1.4 2.2 6%
Switzerland 5.6 0.0 0.0 0.0 0.0 0%
United Nations 30.0 3.2 0.3 2.9 3.0 8%
United States 82.8 1.4 1.4 1.4 1.4 2%
World Bank 124.4 124.4 0.0 124.4 0.0 50%
Total 913 675 546 675 321 61%
Indicator 9B: Use of PFM and Procurement Systems of developing countries

27
For 2011, 61 % of the resources from ODA co-operation providers used public financial management systems and procurements. Co-operation providers with higher percentages for this indicator (more than 59%) are: Global Fund, European Union, Germany, Japan, Canada and the IDB. It has to be underlined that even co-operation providers which provide non-reimbursable resources use national budget systems and submission of financial reports. On the other side, it is also observed that the use of the national procurement system is still very low, being evident the cases of the European Union which reports a low use and that of the IDB which does not provide information.
With regard to the use of national budget execution systems, excel with 100%: the World Bank, the Global Fund, Canada and the IDB, that is, these co-operation providers channel their resources through their national budget.
On the other side, it has also been noticed that 7 providers such as the World Bank, IDB, EU, Global Fund, Canada, Germany, Japan (which provide concessional loans) with percentages of more than 50% in the use of this system, mostly use the budget execution system, but 3 more providers are also present and they are: Spain, UNDP and the United States, although with very small percentages.
With regards to the use of national financial reports, it is also noted the Global Fund, Canada and the IDB, which only use national systems (100%) to submit financial reports. It draws the attention the case of the World Bank which has reported not to have used this system, despite the fact that this organization reported in 2010 that 84% of its resources used this national system. The European Union has evolved in inverse sense, which went from 0% in 2010 to 59% in 2011.
With regards to the use of procurement system, also stands out the Global Fund, Canada and Germany, which used more than 80% of their national public purchase systems of their resources. On their side, Japan states that it uses all the Public Financial Management Systems, including public purchase, in around 68% of their disbursed resources.
If we compare the use of the procurement system to the indicators of the Paris Declaration, there is a decrease in 2010-2011. Only providers above mentioned (Global Fund, Canada and Germany) use significantly these purchase systems. It is to point out that the IDB and the WB, organizations which provide loans to the country, continue to use their own systems. On their side, Spain, United Nations and the United States state that they use it to a limited extent. This would imply, on one side, that these providers do not trust these public purchase systems or, on the other side, that they do not have changed their traditional procedures.
The use of the national audit system is kept in 73.8% due to the fact that some non-reimbursable providers such as the Global Fund, Canada and the European Union use it. In the case of the European Union, where the use of budget support is common, national audits are always used.
Similarly, there exists another group of co-operation providers that report no execution in the use of all PFM national systems: CAF, Korea, Switzerland, OEI, Belgium and Australia, that is, they continue to use their own financial systems.
Conclusion
Providers of ODA (loans and donatios) have an execution of more than 59% in 2011 in the use of budget execution systems, of the audit system and financial report. On the other side, the percentage of the use of the procurement system has decreased, and that despite the conclusions of the PEFA assessement of 2009 year, which evaluate positively the Peruvian public finances. However, it is necessary to mention that PEF assessment does not consider whether these systems are flexible and /or fast.
Therefore, the fact that ODA co-operation providers do not mostly use PFM systems would indicate us that the use of these systems is still considered to be risky, primarily due to its slowness.
28
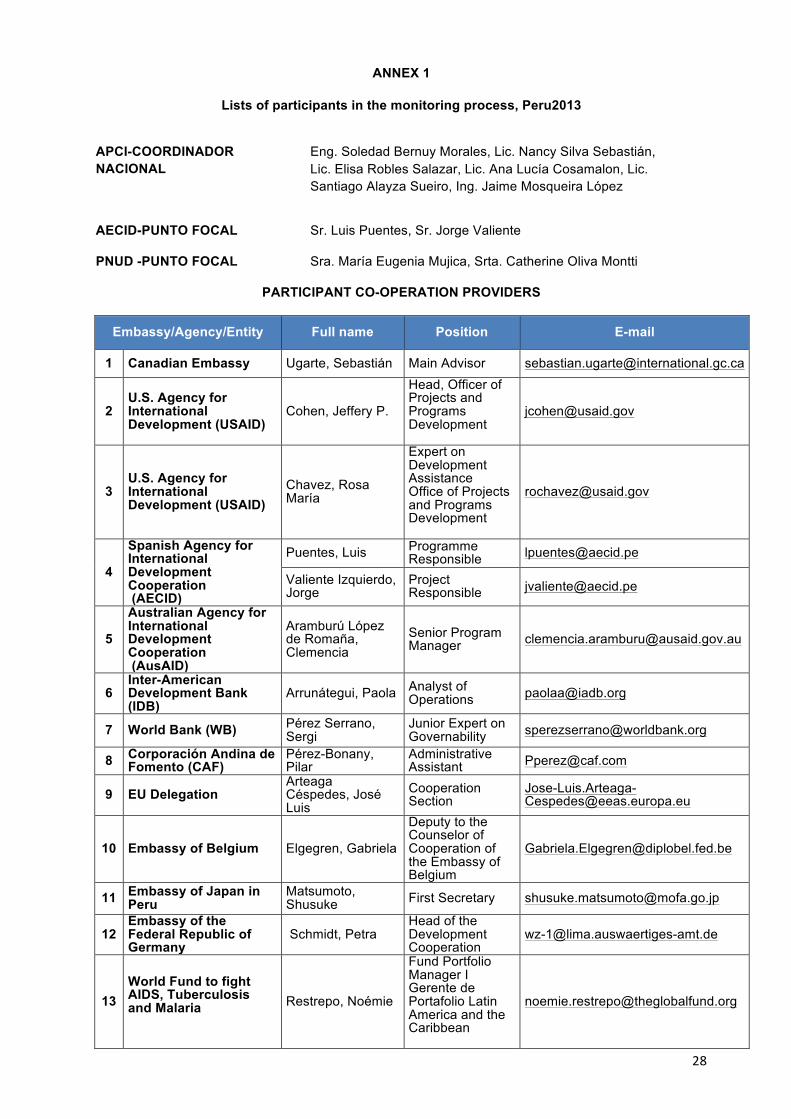
ANNEX 1
Lists of participants in the monitoring process, Peru2013
APCI-COORDINADOR NACIONAL
Eng. Soledad Bernuy Morales, Lic. Nancy Silva Sebastián, Lic. Elisa Robles Salazar, Lic. Ana Lucía Cosamalon, Lic. Santiago Alayza Sueiro, Ing. Jaime Mosqueira López
AECID-PUNTO FOCAL Sr. Luis Puentes, Sr. Jorge Valiente
PNUD -PUNTO FOCAL Sra. María Eugenia Mujica, Srta. Catherine Oliva Montti
PARTICIPANT CO-OPERATION PROVIDERS
Embassy/Agency/Entity Full name Position E-mail
1 Canadian Embassy Ugarte, Sebastián Main Advisor [email protected]
2 U.S. Agency for International Development (USAID)
Cohen, Jeffery P.
Head, Officer of Projects and Programs Development
3 U.S. Agency for International Development (USAID)
Chavez, Rosa María
Expert on Development Assistance Office of Projects and Programs Development
4
Spanish Agency for International Development Cooperation (AECID)
Puentes, Luis Programme Responsible [email protected]
Valiente Izquierdo, Jorge
Project Responsible [email protected]
5
Australian Agency for International Development Cooperation (AusAID)
Aramburú López de Romaña, Clemencia
Senior Program Manager [email protected]
6 Inter-American Development Bank (IDB)
Arrunátegui, Paola Analyst of Operations [email protected]
7 World Bank (WB) Pérez Serrano, Sergi
Junior Expert on Governability [email protected]
8 Corporación Andina de Fomento (CAF)
Pérez-Bonany, Pilar
Administrative Assistant [email protected]
9 EU Delegation Arteaga Céspedes, José Luis
Cooperation Section
10 Embassy of Belgium Elgegren, Gabriela
Deputy to the Counselor of Cooperation of the Embassy of Belgium
11 Embassy of Japan in Peru
Matsumoto, Shusuke First Secretary [email protected]
12 Embassy of the Federal Republic of Germany
Schmidt, Petra Head of the Development Cooperation
13 World Fund to fight AIDS, Tuberculosis and Malaria
Restrepo, Noémie
Fund Portfolio Manager I Gerente de Portafolio Latin America and the Caribbean

29
Embassy/Agency/Entity Full name Position E-mail
14 KOICA Vejarano, Katherinne
Lic. Development Communication
[email protected]; [email protected]
15 Organization of Ibero-American States (OEI) Vargas, Luis Head of
Cooperation Area [email protected]
16 United Nations System – Peru Román, Enrique Coordination
Expert [email protected]
17 FAO Garcia, Alberto Advisro [email protected]
18 PNUD Mujica, María Eugenia
Expert on Programs [email protected]
Oliva-Monti Hayden, Catherina [email protected]
19 UN Women Suarez, Karen National Program Coordinator [email protected]
20 UNAIDS Aaltonen, Their Advisor in Mobilization, Human Rights and Gender
21 PHO/WHO Ugarte Rodriguez, Patricia
Expert on Programs and on Budget
22 PMA Böttger, Iván Program Officer [email protected] 23 UNFPA Mendoza, Walter Program Officer [email protected]
24 UNICEF Portugal, Jorge Senior Advisor of Programs [email protected]
25 OIT / ILO Málaga, Denise Officer of Scheduling [email protected]

30
GOVERNMENTAL ENTITIES
Entity Names and last names Position E-mail
26 Presidencia del Consejo de Ministros – PCM
Liliana La Rosa Huertas
Responisble for International Cooperation
27 Presidencia del Consejo de Ministros - PCM
Yulisa Mendives Officer of the Decentralization Secretariat
28 Centro Nacional de Planeamiento Estratégico – CEPLAN
Alvaro José Vélez Moro
National Director of Coordination and Strategic Planning
[email protected] b.pe
29 Comisión Nacional para el Desarrollo y Vida – DEVIDA
Hernán Yaipen Aréstegui
Head( i.c. ) of Planning and Budget
30 Comisión Nacional para el Desarrollo y Vida – DEVIDA
Alberto Hart Potesta Director (i.c. ) Global Commitment
31 Congreso de la República
Katia Mundaca Pérez
Head – International Cooperation Office
32 Defensoría del Pueblo Aurora Riva Patrón
Head – Office of Strategic Development, International Cooperation and Investments
33 Instituto Nacional de Estadística e Informática – INEI
María Esther Cutimbo Gil
Technical Director of Planning, Budget and Technical Cooperation
34 Ministerio de Agricultura y Riego – MINAG
Guillermo Rebosio Arana
General Director of the Planning and Budget Office
35 Ministerio de Comercio Exterior y Turismo - MINCETUR
Javier Masías Astengo
General Director of Planning, Budget and Development
36 Ministerio de Economía y Finanzas – MEF
Hebert Vega Susana Morales
Officers General Directorate of Indebtedness and Public Treasury
37 Ministerio de Economía y Finanzas – MEF
Hedy Huarcaya Officer General Directorate of Public Budget
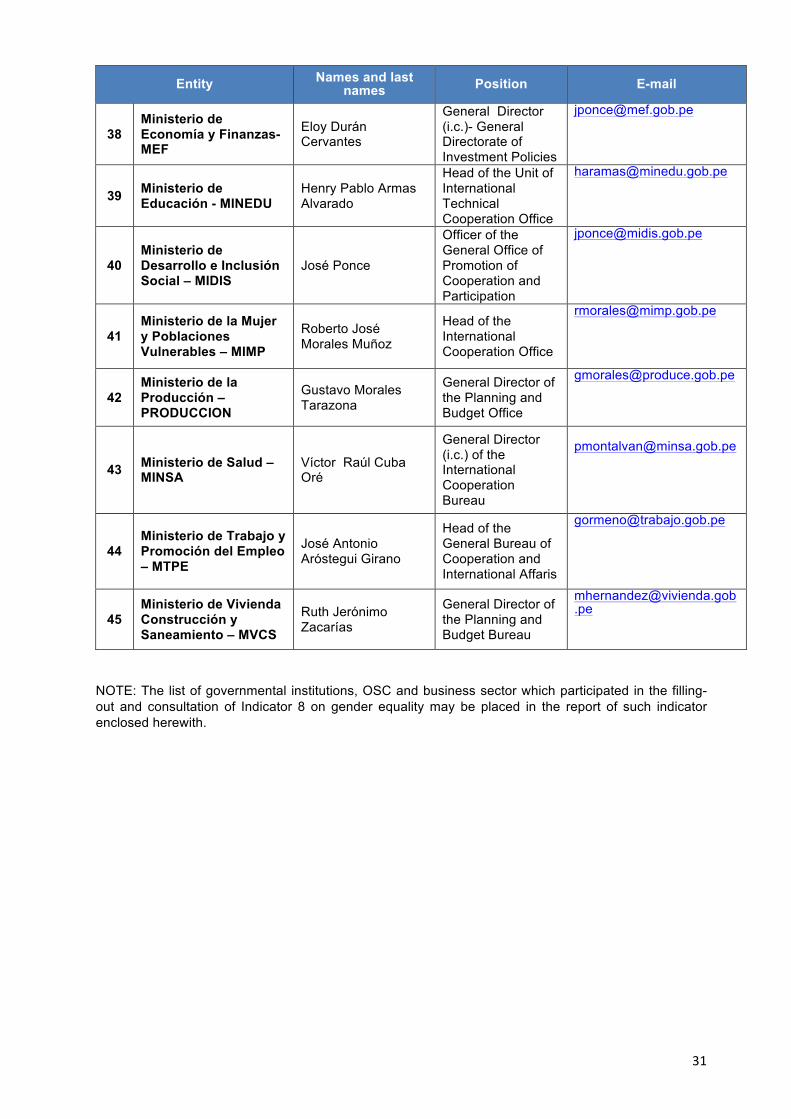
31
Entity Names and last names Position E-mail
38 Ministerio de Economía y Finanzas-MEF
Eloy Durán Cervantes
General Director (i.c.)- General Directorate of Investment Policies
39 Ministerio de Educación - MINEDU
Henry Pablo Armas Alvarado
Head of the Unit of International Technical Cooperation Office
40 Ministerio de Desarrollo e Inclusión Social – MIDIS
José Ponce
Officer of the General Office of Promotion of Cooperation and Participation
41 Ministerio de la Mujer y Poblaciones Vulnerables – MIMP
Roberto José Morales Muñoz
Head of the International Cooperation Office
42 Ministerio de la Producción – PRODUCCION
Gustavo Morales Tarazona
General Director of the Planning and Budget Office
43 Ministerio de Salud – MINSA
Víctor Raúl Cuba Oré
General Director (i.c.) of the International Cooperation Bureau
44 Ministerio de Trabajo y Promoción del Empleo – MTPE
José Antonio Aróstegui Girano
Head of the General Bureau of Cooperation and International Affaris
45 Ministerio de Vivienda Construcción y Saneamiento – MVCS
Ruth Jerónimo Zacarías
General Director of the Planning and Budget Bureau
NOTE: The list of governmental institutions, OSC and business sector which participated in the filling-out and consultation of Indicator 8 on gender equality may be placed in the report of such indicator enclosed herewith.