(2013) Initial Queen Conch (Strombus gigas) studies on St. Eustatius
37
Initial Queen conch (Strombus gigas) studies on St. Eustatius J. van Rijn
-
Upload
truongxuyen -
Category
Documents
-
view
219 -
download
3
Transcript of (2013) Initial Queen Conch (Strombus gigas) studies on St. Eustatius
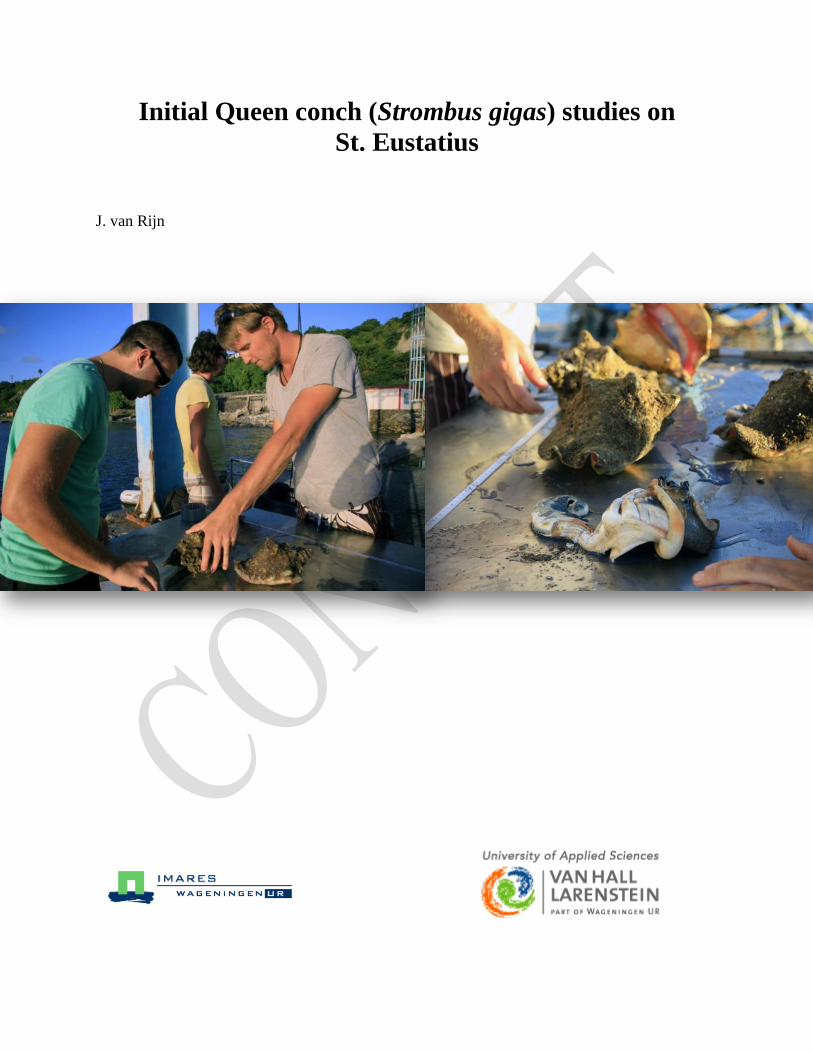
Initial Queen conch (Strombus gigas) studies on St. Eustatius
J. van Rijn

Abstract The large marine gastropod, Queen conch (Strombus gigas) was studied over a period of 3 months on the
island of St. Eustatius. Strombus gigas are widely distributed throughout the Caribbean and are important
to local communities due to its nutritional and traditional value. Because of an increase in conch landings
since the seventies Strombus gigas populations have dramatically declined causing it to be included in the
Appendix II of CITES. Fishermen on St. Eustatius have seen Strombus gigas populations move to deeper
waters. Strombus gigas have been actively protected since 1996 by the St. Eustatius Marine Park in all
surrounding water up to a 30-meter depth contour; no fishing is allowed in the two marine reserves and
regulations state that Strombus gigas may only be caught free diving to a max of 20 conch per person per
year and with a minimum shell length of 19 cm. This study focuses on estimating a trend in Strombus
gigas populations and testing a towed video method for benthic (queen conch) surveys. Dive surveys
covered a transect of 50 meters long and 10 meter wide, noting species, shell length and lip thickness. The
video array was constructed of light weight materials with a live feed to the towing vessel to check
alignment. Towed video transects covered a length of 500 meters with a width of 1 meter only noting
species and numbers. To calibrate this towed video method, a diver followed the video array on 5
occasions to establish a correction factor. Fisheries samples were taken whenever the fishermen would
land his catches and notify us. Population trend surveys showed no clear trend and were unusable due to
the limited sample size. For the dive surveys a total of 25 sites were sampled of which 11 sites met the
minimum density for Strombus gigas to reproduce, of these 11 sites at least 5 are within the marine
reserve and thus unfished. Towed video calibration proved promising, in the future better observer
training and greater sample size is necessary. Of the 11 towed video sites, Strombus gigas clearly prefers
the rubble/algae sites over bare sandy sites. Of the 11, 7 sites met the minimum required density for
reproduction. But the towed video calibration made clear that the Strombus gigas numbers noted during
the towed video analysis are likely to be an over estimate as adult Strombus gigas numbers seem to
include dead Strombus gigas and Strombus costatus who are misinterpreted. In future studies better

observer training is necessary, a larger sample size for trend indications and the towed video calibration is
needed as well. Strombus gigas reproduction and fishing pressure also need to be studied.
Acknowledgements
We greatly thank Tim Stevens for our correspondences about the video tow array method they used for
benthic sampling, Martin de Graaf for its dedicated supervision and Leo Nagelkerke for his help with the
data. The cooperation and time Naldo invested in the study is really appreciated. We also greatly thank
Erik Boman, Roberto Hensen and all the employees and interns of STENAPA for the constant help and
cooperation. Without them most of the work would not have been possible. Thank Scubaqua for their tank
refills and support. This study was funded by the RCN (Rijksdienst Caribisch Nederland).
Project volunteers:
This study would not have been possible without the help of several key volunteers we thank them for
their effort, time and talents invested in the project: Jochem Lastdrager, Erik Houtepen, Steven Leeming
and Tania Timmer.
Jimmy van Rijn; [email protected]
Leeuwarden, February 2013

Content
1 Introduction ........................................................................................................................................... 1
2 Material and Methods ........................................................................................................................... 5
2.1 Study site ....................................................................................................................................... 5
2.2 Dive Survey .................................................................................................................................. 6
2.3 Video array design ........................................................................................................................ 8
2.4 Towed video survey .................................................................................................................... 10
2.5 Calibration towed video .............................................................................................................. 13
2.6 Conch fisheries ............................................................................................................................ 13
3 Results ................................................................................................................................................. 14
3.1 Conch surveys 2003-2012 ........................................................................................................... 14
3.2 Dive surveys ................................................................................................................................ 16
3.3 Video/dive calibration ................................................................................................................. 17
3.4 Towed video data ........................................................................................................................ 18
3.5 Fisheries data .............................................................................................................................. 20
4 Discussion ........................................................................................................................................... 21
5 Recommendations ............................................................................................................................... 22
6 Literature ............................................................................................................................................. 24
7 Appendix I .......................................................................................................................................... 26
8 Appendix II ......................................................................................................................................... 27
9 Appendix III ........................................................................................................................................ 31

1
1 Introduction
Strombus gigas (Queen Conch Phylum Mollusca) is a large gastropod mollusk (fig. 1.a), conch reach full
size at 3-5 years of age, weigh about 2,3kg and grow to ~30cm long. Conch are widely distributed
throughout the Caribbean and this iconic species has high economic and cultural status. Strombus gigas
generally inhabit shallow sand and sea grass beds of Turtle grass (Thalassia) and Manatee grass
(Cymodocea) but are also found amongst the rubble and coral reef habitats (Catarci, 2004) of the
Caribbean Sea and Gulf of Mexico, all the way up to Bermuda and down to Brazil (Fig. 1.b) Strombus
gigas is a herbivore commonly found no deeper than 25 meters as light limits algae and plants growth
beyond those depths (Randall, 1964).
Fig. 1 a) Queen Conch (Strombus gigas) photo by author and b) the distribution of Queen Conch (source: NMFS,
Office of Protected Recourses, 2007)
Strombus gigas or Queen conch have a broad reproductive season (April-October) but usually peaking in
July-August (Stoner et al, 1992). Female Strombus gigas are known to copulate via internal mating with
several mates. Spawning occurs several weeks after copulation. Females produce large egg masses, up to
12cm long (Randall, 1964), containing 100.000s of eggs. The eggs hatch after 5-7 days and start a pelagic
dispersal stage. The planktonic larvae float for 3 to 4 days until the free swimming larval veligers emerge,
these settle on suitable benthic habitat in e approximately a month time (Ehrhardt & Valle-Esquivel,
2008). During their first year juveniles conch are known to hide in the sandy seabed during daytime to
avoid predation, (Randall, 1964. Davis, 2003).

2
Queen conch are an important species in the wider Caribbean due to its nutritional and traditional value.
Queen conch are being fished for decades because they reside in the easily accessible water (< 25m)
(Randall, 1964. Catarci, 2004). Life history causes Queen conch to be sensitive to over fishing. Queen
conch pelagic dispersal stage is the reason that there is a great chance populations are effected an extra
territorial populations and conservation measures (Ehrhardt & Valle-Esquivel, 2008). The critical density
for successful reproduction for Queen conch sits around 50-60 adult conch ha-1 (Stoner and Ray-Culp,
2000) since they can only travel 0.5 mile a month (Glazer et al, 2003). Likeliness to reproduce increases
with higher densities, for unfished populations 90% probability of mating is achieved with densities of
100 adult per hectare and for fished populations this lays between 370 and 570 adults per hectare (Stoner
et al, 2011)
Fig. 2 Total landings of stromboid species in Western Central Atlantic, 1970-2000 (source: Catarci, 2004)
Since the seventies conch landings in the Caribbean have dramatically increased (Fig 2.) causing great
decline of the populations in the wider Caribbean (Catarci, 2004 and Theile, 2003). This trend caused
Queen conch to be included in the Appendix II of Convention on International Trade of Endangered
Species (CITES) since 1992. For Appendix II species under CITES it is required to acquire an export
permit to ensure sustainable harvesting and to prevent the species from becoming an Appendix I species

3
(species threatened with extinction by trade). This permit can only be granted if a Scientific Authority of
the State has advised that trade will not be detrimental to the survival of the species (CITES, 1979). To
review if a non detriment finding is in place this Scientific Authority of the State will access species
biology, status1, current management, control, monitoring, incentives and protection. The Scientific
Authority also needs to monitor the export permits and actual exports of specimens. So whenever this
Scientific Authority determines that the species population is declining it will advise the Management
Authority to adjust the export permit (Rosser and Haywood, 2002).
Queen conch fisheries have a long tradition on St. Eustatius but over the years, possibly due to extensive
fishing pressure and increased landings, conch populations have decreased. This can be concluded from
the fact that Queen Conch densities are low in their normal habitat, shallow waters (<25m) (Randall,
1979). This is substantiated by the fact that fishermen state that conch used to be abundant in shallow
waters and studies by Davis (2003) and White (2005) these signs that conch densities are low in shallow
waters and have declined over the time span of their studies. Although their results cannot be extrapolated
to the entire conch populations of St. Eustatius since they used hotspots measurements instead of random
sampling and a very limited sample size.
Queen conch are actively protected on St. Eustatius since 1996 when the St. Eustatius Marine Park was
established. All the surrounding waters up to a 30-meter depth contour are protected by the St. Eustatius
Marine Park. Marine Park regulations state that Queen Conch can only be caught free diving and if the
shell is bigger than 19cm (Davis, 2003). “The ordinance also states that “it is illegal to catch more than
20 conch per person per year” and that “the collecting of conch is only permitted for own use and
consumption”. Fishermen are obligated by the ordinance to report their catch to the marine park
manager” (Davis, 2003). Because it is a long term tradition and Queen conch are highly nutritious and
believed to have medicinal powers, locals still often eat and catch conch. 1 Status stands for national distribution, abundance, population trend and majors threats
4
Bonaire, Saba and St. Eustatius became special municipalities of the Netherlands in October 2010. As a
result Dutch law will be implemented in the years leading to 2015. This population assessment serves as
policy preparatory work and aims to provide data for the calculation of a maximum sustainable yield but
firstly to test a non detriment finding.
Focus of study This study is subsequent to BES-islands becoming a special municipality of the Netherlands, since all
legislation, treaties and covenants are applicable to St. Eustatius. Meaning more knowledge about the
biodiversity is necessary for appropriate policy adaption. The Institute for Marine Resources &
Ecosystem Studies (IMARES) put this study up as an internship project and was conducted by student
Jimmy van Rijn under direct supervision of Martin de Graaf. The focus of the study is to estimate a trend
in Queen conch populations and to test methods for future research. In continuation of this study, research
will be conducted to provide a broad population assessment of Queen Conch (Strombus gigas) around St.
Eustatius to test a non detriment finding and to allow a base for sustainable yield calculations.
Research questions
1. What trend are S. gigas populations showing?
2. Is the towed video a good alternative conch sampling method?

5
2 Material and Methods
2.1 Study site
The island of St. Eustatius is located in the north-eastern part of the Caribbean (fig. 3.a) and covers 21
square kilometers. The St. Eustatius National Marine Park covers 27,5km2.The park extends around the
whole island and covers the waters from the high tide mark to 30 meters of depth (fig. 3.b). St. Eustatius
Marine Park designated two marine reserves, in the North and South part of the Marine Park, which
enclose the areas with the highest concentration of coral reef habitat. In these two reserves no commercial
or recreational fishing is allowed.
Fig. 3 a) the location of St. Eustatius in the Caribbean (left; source MacRae and Esteban, 2007) and b) the St.
Eustatius National Park (right; source www.statiapark.org)

6
2.2 Dive Survey
Survey sites where selected based on previous conch studies by Davis (2003) and White (2005) (fig. 4.a).
In addition site for conch surveys were selected haphazardly whenever there was an opportunity to join
the
Fig. 4 Location of conch dive survey by Davis (2003), White (2005) and this study and b) location of additional
conch dive surveys conducted during the current study.
marine park (fig. 4.b). For detailed information on all dive study sites see table 2.
Transects were mostly conducted on dive sites with a mooring for safety and practical reasons. At all dive
sites the transect was started at the base of the mooring. As descending the rotating bezel of a diving
compass was turned haphazardly, the position of the lubberline then determined the bearing for the first
transect, as a rule the subsequent transect was conducted 90 degrees left of the preceding, until bottom
time or air limits where reached. The transect had a width of ten meters and was fifty meters long,
covering a total of 500 m2 per transect. The following measurements were taken during the transect,
species, life stage (Table 1), life status (dead_alive), lip thickness (fig. 5) and the siphonal length. Also a
rough estimate of the benthic habitat was recorded based on the percentage coverage of sand, sea grass,
rubble and reef macro-habitats. As the dive spots STENAPA REEF, Drop off west, Outer Jenkins bay and

7
Charles Brown did not allow transects to be conducted at the base of the mooring another starting point
was used. At STENAPA REEF and Drop off west we swam 30 kicks north of the base of the mooring
because this habitat was comparable to Davis (2003) description of the sample sites. Due to the depth of
sites Outer Jenkins bay and South of Charles Brown we chose to conduct a counting transects (no
measurements) at the nearest point to where we entered the water.
Table 1 Life stages conch modified from (Stoner and Davis, 2010)
Life stage Siphonal length (cm) Flared lip Age (years)
Juveniles <10cm no 1-2
Intermediates >10 cm no 2-3
Adult >19cm yes >3
Fig. 5 Conch measurements via method used by (Appeldoorn, 1988)
8
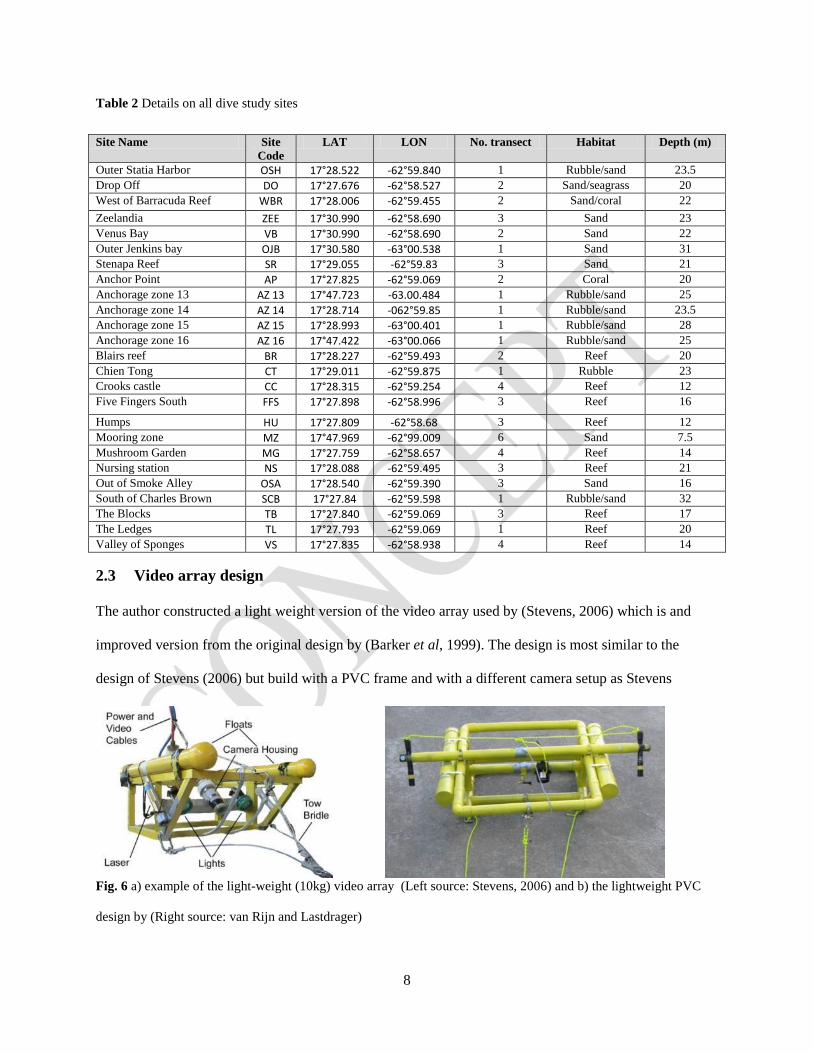
Table 2 Details on all dive study sites
2.3 Video array design
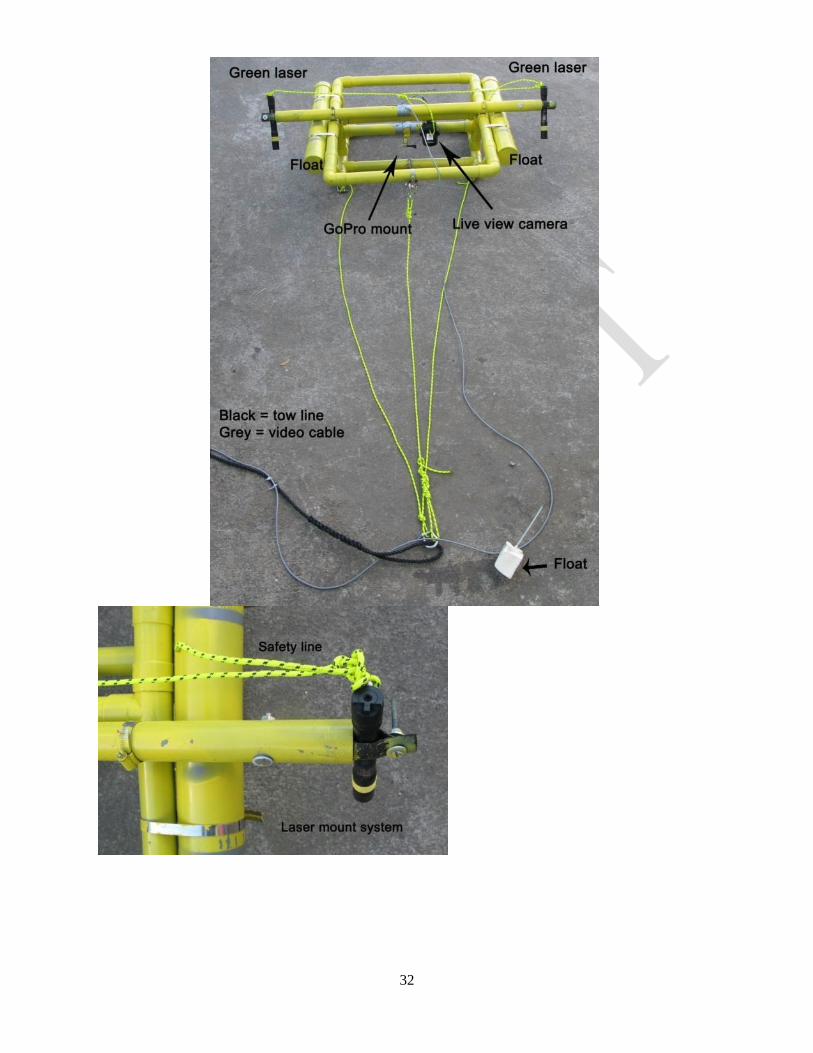
The author constructed a light weight version of the video array used by (Stevens, 2006) which is and
improved version from the original design by (Barker et al, 1999). The design is most similar to the
design of Stevens (2006) but build with a PVC frame and with a different camera setup as Stevens
Fig. 6 a) example of the light-weight (10kg) video array (Left source: Stevens, 2006) and b) the lightweight PVC
design by (Right source: van Rijn and Lastdrager)
Site Name Site Code
LAT LON No. transect Habitat Depth (m)
Outer Statia Harbor OSH 17°28.522 -62°59.840 1 Rubble/sand 23.5 Drop Off DO 17°27.676 -62°58.527 2 Sand/seagrass 20 West of Barracuda Reef WBR 17°28.006 -62°59.455 2 Sand/coral 22 Zeelandia ZEE 17°30.990 -62°58.690 3 Sand 23 Venus Bay VB 17°30.990 -62°58.690 2 Sand 22 Outer Jenkins bay OJB 17°30.580 -63°00.538 1 Sand 31 Stenapa Reef SR 17°29.055 -62°59.83 3 Sand 21 Anchor Point AP 17°27.825 -62°59.069 2 Coral 20 Anchorage zone 13 AZ 13 17°47.723 -63.00.484 1 Rubble/sand 25 Anchorage zone 14 AZ 14 17°28.714 -062°59.85 1 Rubble/sand 23.5 Anchorage zone 15 AZ 15 17°28.993 -63°00.401 1 Rubble/sand 28 Anchorage zone 16 AZ 16 17°47.422 -63°00.066 1 Rubble/sand 25 Blairs reef BR 17°28.227 -62°59.493 2 Reef 20 Chien Tong CT 17°29.011 -62°59.875 1 Rubble 23 Crooks castle CC 17°28.315 -62°59.254 4 Reef 12 Five Fingers South FFS 17°27.898 -62°58.996 3 Reef 16
Humps HU 17°27.809 -62°58.68 3 Reef 12 Mooring zone MZ 17°47.969 -62°99.009 6 Sand 7.5 Mushroom Garden MG 17°27.759 -62°58.657 4 Reef 14 Nursing station NS 17°28.088 -62°59.495 3 Reef 21 Out of Smoke Alley OSA 17°28.540 -62°59.390 3 Sand 16 South of Charles Brown SCB 17°27.84 -62°59.598 1 Rubble/sand 32 The Blocks TB 17°27.840 -62°59.069 3 Reef 17 The Ledges TL 17°27.793 -62°59.069 1 Reef 20 Valley of Sponges VS 17°27.835 -62°58.938 4 Reef 14
9
currently uses for semi deep water survey (Stevens pers. comm. 03-Sept-12). The PVC frame has the
same design as in figure 6.a, the green lasers (Z-Bolt, SCUBA-1 Underwater Scuba & Dive - Waterproof
Green Laser Pointers) are in the same place only the camera beam has a different setup. The authors video
array is fitted with a mini HD underwater camera (V-Nix.nl, GoPro Hero 2, GoPro Dive housing, GoPro
Battery BacPac, Oculus Red Filter, Mustang 32GB SDHC) and a live view camera (Seaview, Seaview
SUPER MINI), a live feed (low quality) camera which is used to check the alignment of the array and for
upcoming obstacles (fig. 6.b). For more detailed photo of the video array design see Appendix III. The
array was attached to the Carolina Skiff 198 cleat and towed at a speed of 0.5-1 knots. The array was
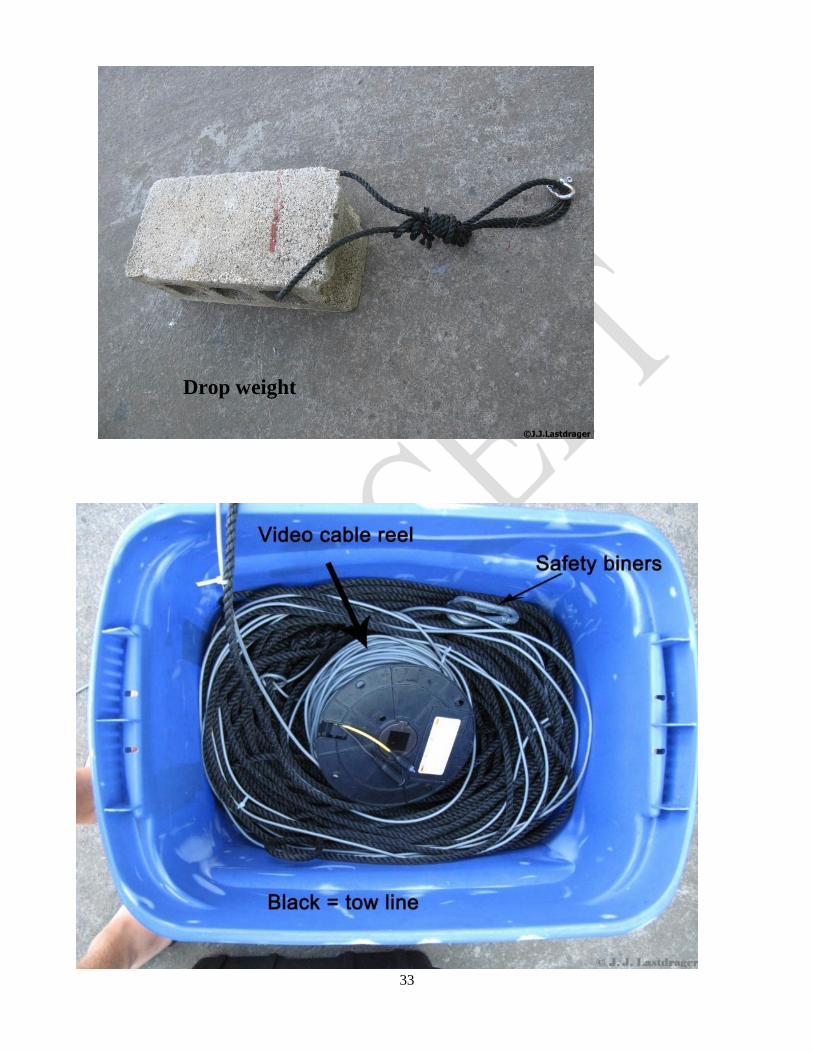
manually adjusted and hauled in and out of the water. A cement brick was used as drop weight, the drop
weight and drag chain were attached with a 100 pound fishing line. Fishing line was used to ensure it
would snap before the rope and array would, making it possible to always safely retrieve the video array.
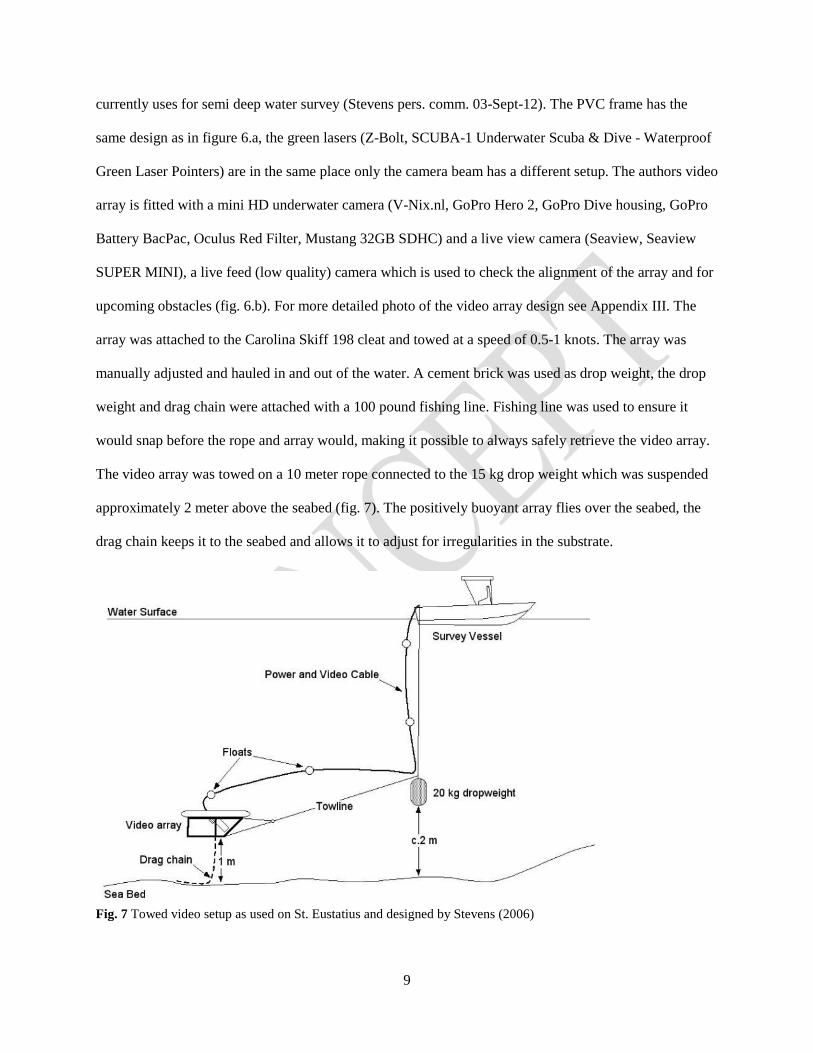
The video array was towed on a 10 meter rope connected to the 15 kg drop weight which was suspended
approximately 2 meter above the seabed (fig. 7). The positively buoyant array flies over the seabed, the
drag chain keeps it to the seabed and allows it to adjust for irregularities in the substrate.
Fig. 7 Towed video setup as used on St. Eustatius and designed by Stevens (2006)

10
2.4 Towed video survey In this phase of the study it was decided to conduct some trail surveys using the towed video array and to
calibrate this method by conducting diver/video surveys. For step by step guidance on using the video
array see Appendix I. The area where the surveys were conducted (fig. 8) is a known for its conch
population as it is the favorite fish site for the only conch fisher of St. Eustatius. See table 3 for details on
all towed video transects. Also it is varies in depth from 20-30 meters consisting of mostly rubble/sand
habitat which proved an ideal test site. Starting points were chosen at random, but we tried to cover the
whole anchorage zone/fishing zone between 20-30 meters. A 500 meter long and 1 meter wide transect
was towed at an approximate speed of 0.5-1 knots. Current, wind conditions and depth profile would
dictate our heading as controlling the speed of the array is critical for later analyses of the footage.
Fig. 8 The location of the towed video trail surveys
11
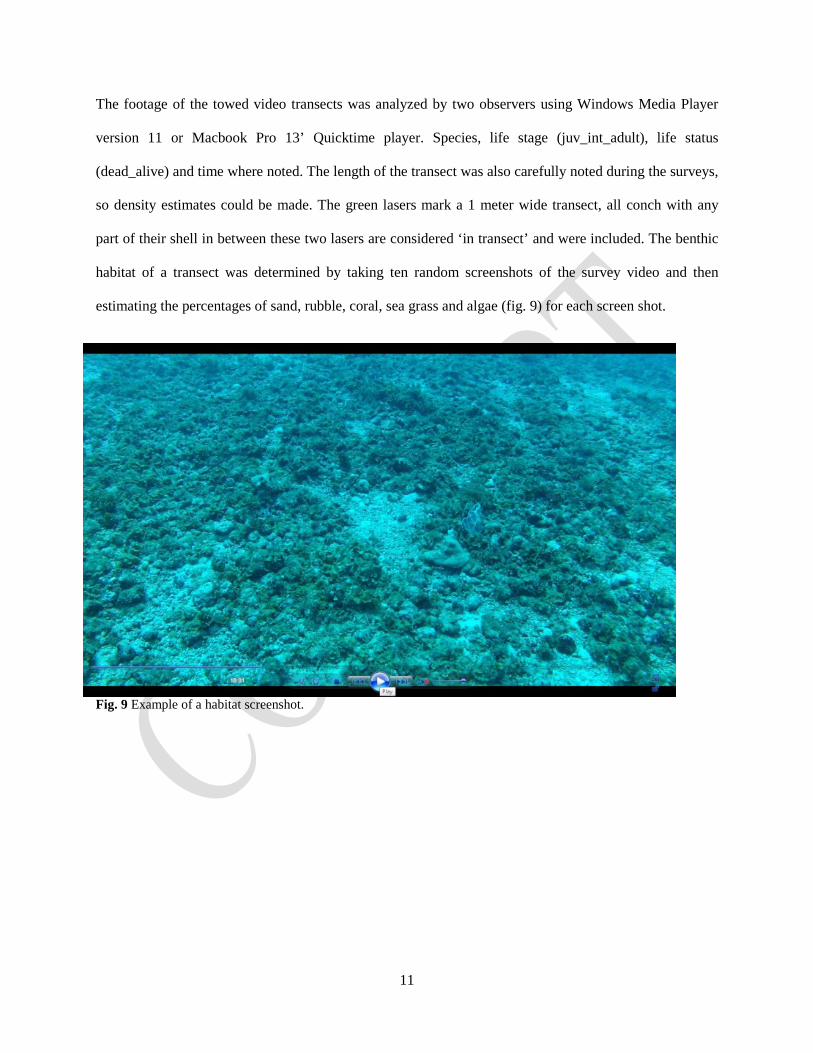
The footage of the towed video transects was analyzed by two observers using Windows Media Player
version 11 or Macbook Pro 13’ Quicktime player. Species, life stage (juv_int_adult), life status
(dead_alive) and time where noted. The length of the transect was also carefully noted during the surveys,
so density estimates could be made. The green lasers mark a 1 meter wide transect, all conch with any
part of their shell in between these two lasers are considered ‘in transect’ and were included. The benthic
habitat of a transect was determined by taking ten random screenshots of the survey video and then
estimating the percentages of sand, rubble, coral, sea grass and algae (fig. 9) for each screen shot.
Fig. 9 Example of a habitat screenshot.

12
Table 3 Details on all towed video samples
Site Name Site Code
LAT LON No. transect
Habitat Depth (m)
Anchorage_zone_1 AZ 1 17°48.086 -62°99.891 1 Rubble 21 Anchorage_zone_2 AZ 2 17°48.324 -63°00.666 1 Rubble 26 Anchorage_zone_3 AZ 3 17°47.756 -63°00.218 1 Rubble 23 Anchorage_zone_4 AZ 4 17°47.726 -63°00.494 1 Rubble 25 Anchorage_zone_5 AZ 5 17°47.310 -62°99.995 1 Rubble 24 Anchorage_zone_6 AZ 6 17°47.939 -63°00.745 1 Rubble 29.5 Anchorage_zone_7 AZ 7 17°48.476 -63°00.784 1 Rubble 30.5 Anchorage_zone_8 AZ 8 17°49.403 -63°00.409 1 Sand 20 Anchorage_zone_9 AZ 9 17°48.844 -63°00.267 1 Sand 22 Anchorage_zone_11 AZ 11 17°48.366 -62°99.922 1 Sand 19 Anchorage_zone_12 AZ 12 17°48.946 -63°00.196 1 Sand 21 Video/dive 1 VD 1 17°28'55.65 62°59'59.63 1 Rubble 18.5 Video/dive 2 VD 2 17°28'29.95 63° 0'4.19 1 Rubble 26 Video/dive 3 VD 3 17°28'41.60 63° 0'9.17 1 Rubble 26 Video/dive 4 VD 4 17°28'44.12 63° 0'13.83 1 Rubble 27 Video/dive 5 VD 5 17°28'50.80 63° 0'10.28 1 Rubble 23

13
2.5 Calibration towed video To quantify the towed video two divers followed the array during a survey. Diver one followed the array
and noted every conch seen between the lasers. Diver two was present for safety reasons and to
communicate with the boat via de live camera. To indicate the start of a transect diver two gave the scuba
sign O.K. and blocked the lens of the GoPro with his hand, to specify the end of a transect the scuba sign
‘surfacing’ was given on camera.
Fig. 10 Starting points of the video/dive comparison transects
2.6 Conch fisheries
On St. Eustatius Queen conch were collected by one fishermen using scuba gear. On three occasions the
commercial catch was sampled. Siphonal length (measured to the nearest cm as the length from the tip of
the siphonal canal to the apex of the spire) and lip thickness (measured to the nearest mm in the mid-
lateral region in a spot unaffected by plaits, and at a distance of 35-45 mm from the edge of the lip) of
whole conch were recorded according to the methodology of Appeldoorn (1988). The total weight (shell+
snail) and snail weight both to the nearest gr, were recorded during one of the two sampling events.

14
3 Results
3.1 Conch surveys 2003-2012 In order to calculate a trend in Strombus gigas populations the four previously studied sites (Outer Statia
Harbor, Drop Off, West of Barracuda Reef and Zeelandia) were surveyed (fig. 4.a). Davis (2003) showed
an average 167 conch ha-1 in 12 transects, White (2005) 88 conch ha-1 in 12 transects and van Rijn (2012)
121 conch ha-1 in 8 transects (fig. 11). Davis and White both sampled 4800 m-1 and van Rijn sampled
3700 m-1. No significant difference in densities was observed between three years.
Fig. 11 Densities (# individuals per ha) of Strombus gigas at four locations around St. Eustatius in 2003, 2005 en 2012. Error bars are 95% confidence intervals.
Siphonal length measurements show that the average length has increased 1 cm each study, being 23cm in
2003, 24cm in 2005 and 25cm in 2012. Compared to other years there was a greater small (< 20cm) and
extra large (> 30cm) population in 2003. White (2005) and van Rijn (2012) show a narrower distribution
of siphonal lengths (fig. 12).
0
50
100
150
200
250
300
350
Dens
ity (c
onch
per
ha)
2003 (avg = 167)
2005 (avg = 69)
2012 (avg = 121)

15
Fig. 12 Length frequency distribution of siphonal lengths of queen conch observed in the dive surveys in 2003, 2005
en 2012.
Over the three studies an increase in lip thickness is visible, Davis (2003) measured an average of 19 mm
out of 86 individuals and van Rijn (2012) an average of 22 mm out of 29 individuals (fig. 13). White
(2005) measured the lowest average with 17 mm out of 33 individuals. Similar to the results of the
siphonal length White (2005) and van Rijn (2012) show a narrower distribution then Davis (2003) does.
Fig. 13 Length frequency distribution of lip thickness of queen conch observed in the dive surveys in 2003, 2005 en
2012.
0
5
10
15
20
25
30
9 15 16 17 18 19 20 21 22 24 25 26 27 28 29 30 31 33
freq
uenc
y (%
)
siphonal length (cm)
2003 (n=86) avg = 23cm
2005 (n=33) avg = 24cm
2012 (n=29) avg = 25cm
0
5
10
15
20
25
1 7 9 12 15 18 21 23 26 29 32 35 37 40 43 46 49 51 54 57 60
freq
uecy
(%)
lip thickness (mm)
2003 (n=86) avg=19 mm
2005 (n=33) avg = 17 mm
2012 (n=29) avg = 22 mm
16
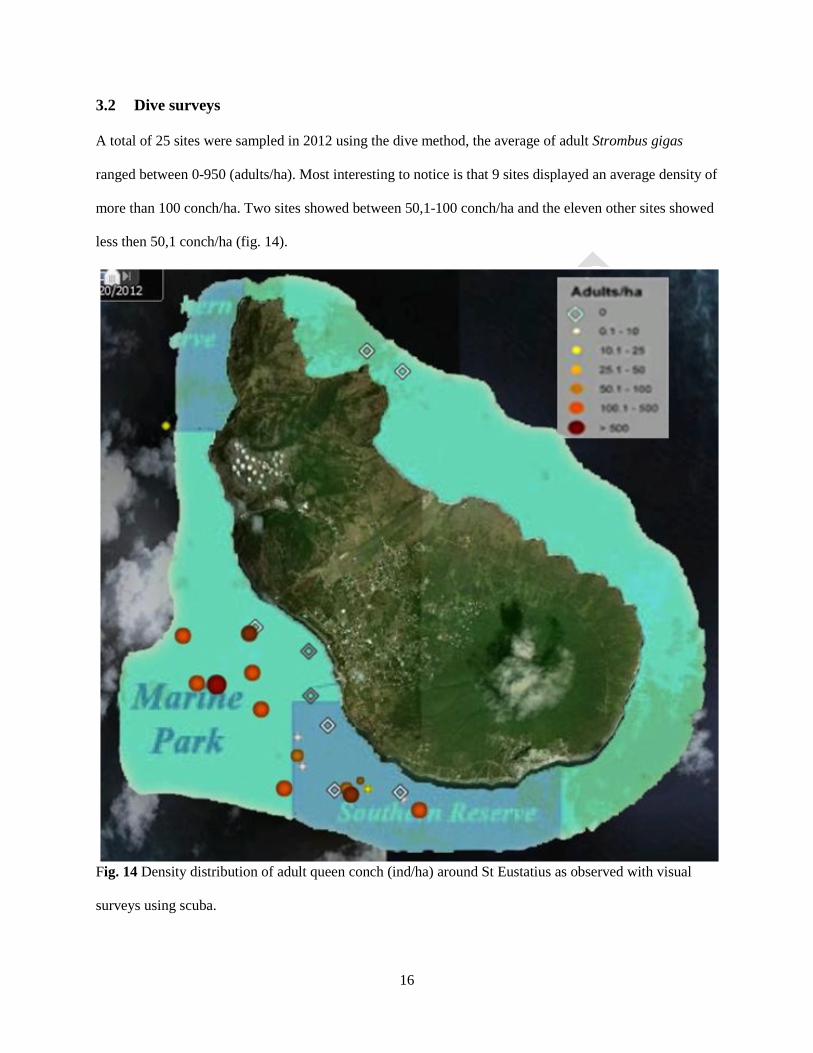
3.2 Dive surveys
A total of 25 sites were sampled in 2012 using the dive method, the average of adult Strombus gigas
ranged between 0-950 (adults/ha). Most interesting to notice is that 9 sites displayed an average density of
more than 100 conch/ha. Two sites showed between 50,1-100 conch/ha and the eleven other sites showed
less then 50,1 conch/ha (fig. 14).
Fig. 14 Density distribution of adult queen conch (ind/ha) around St Eustatius as observed with visual
surveys using scuba.

17
3.3 Video/dive calibration
Video/dive calibration transect were conducted on 5 occasions, in video analysis 80 individuals were
counted, were as the diving observer counted 107 individuals. Via video analysis we overlooked 18 dead
adult S. gigas, 2 dead juvenile Strombus gigas, 11 Strombus costatus, 4 dead Strombus gallus but counted
6 more adult S. gigas and 1 more dead and 1 alive intermediate S. gigas (fig. 15)
. Fig. 15 Video/dive calibration differences
0%
10%
20%
30%
40%
50%
60%
70%
80%
90%
100%
Total video (n = 80) Total dive (n = 107)
Unknown dive/live
Fighting_Conch_Dead
Fighting_Conch
Rooster_Conch_dead
Rooster_Conch
Milk_Conch_dead
Milk_Conch
Queen_Conch_dead_juv
Queen_Conch_juv
Queen_Conch_dead_int
Queen_Conch_int
Queen_Conch_dead_adult
Queen_Conch_adult

18
Fig. 16 Number of individuals per species for all video dive comparison samples
3.4 Towed video data
Transects AZ 1 till 7 are covered in mainly ( > 70%) rubble, as algae have overgrown the rubble in these
transects. The other four transects are mainly ( > 70%) covered with sand (fig. 17.a).
Fig. 17 a) Habitat coverage of the 11 video transects and b) shows densities of adult queen conch per hectare per
video transect
In figure 17.b it was chosen to show only the most commonly found stromboid species, adult Strombus
gigas. Concentration of this species is highest in first seven transects.
0
100
200
300
400
500
600
700
800
900
AZ 1 AZ 2 AZ 3 AZ 4 AZ 5 AZ 6 AZ 7 AZ 8 AZ 9 AZ 11 AZ 12
Indi
vidu
als
per h
ecta
re S. gigas (n=111)
0%
10%
20%
30%
40%
50%
60%
70%
80%
90%
100%
AZ 1 AZ 2 AZ 3 AZ 4 AZ 5 AZ 6 AZ 7 AZ 8 AZ 9 AZ 11
AZ 12
Algae
Seagrass
Coral (live)
Rubble
Sand
0
10
20
30
40
50
60
70
80
num
ber
Total dive (n = 107)
Total video (n = 80)
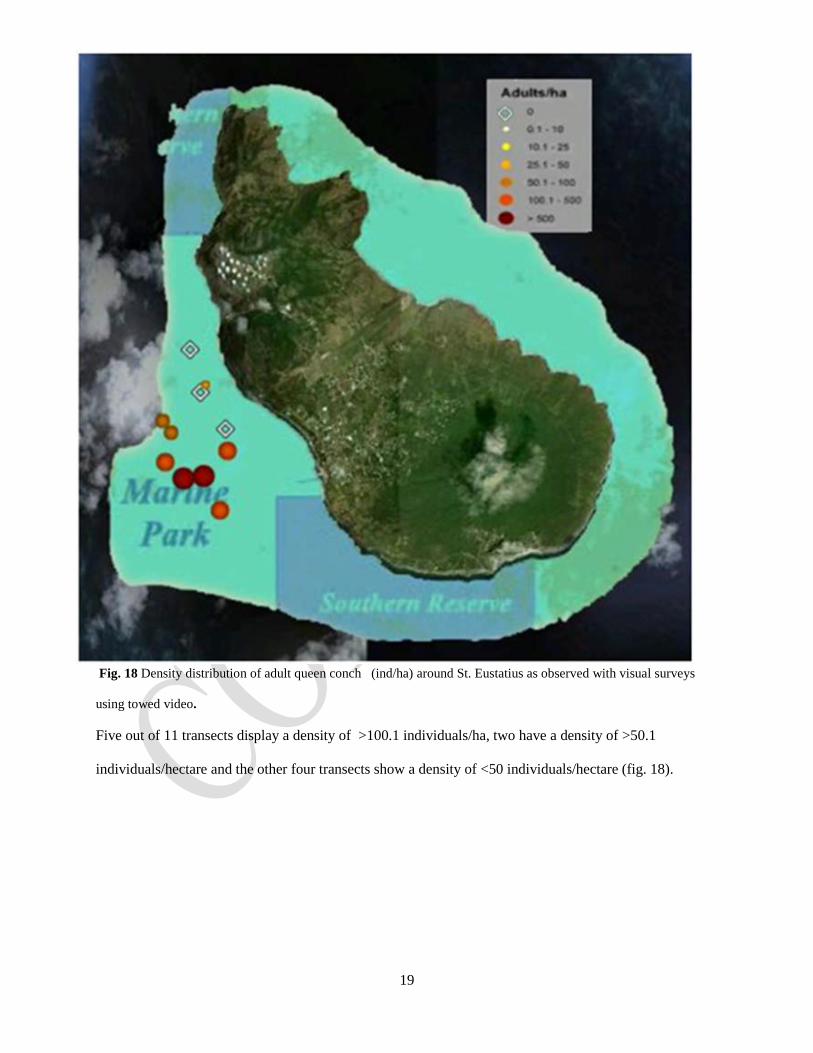
19
Fig. 18 Density distribution of adult queen conch (ind/ha) around St. Eustatius as observed with visual surveys
using towed video.
Five out of 11 transects display a density of >100.1 individuals/ha, two have a density of >50.1
individuals/hectare and the other four transects show a density of <50 individuals/hectare (fig. 18).

20
3.5 Fisheries data
A total of 207 landed S. gigas were measured of three different fishing trips by the same fishermen. The
average siphonal length measured 25cm and the average lip thickness measured 22mm ( n = 29) (fig. 19).
Fig. 19 Frequency distribution of siphonal length (left) and lip thickness (right) of landed conch.

21
4 Discussion
Data from the studies by Davis (2003) , White (2005) and the author allows no comparison due to the
limited sample size. A larger sample size is suggested for future studies. For the site Outer Statia Harbor a
different method was used by the author, a 200 meter long and 1 meter wide transect was surveyed while
diving only species, life stage and life status written down. The reason for the decline in individuals at
West of Barracuda could be because of the population Nurse Sharks (Ginglymostoma cirratum) which
often resides on the nearby dive site nursing station. Nurse Shark are known to prey on Strombus gigas
together with other Elasmobranchii.
Dive survey data shows that 11 sites have a density of >50.1 adult queen conch per hectare meaning
Strombus gigas are capable of reproduction on these sites, 6 sites of these sites are expected to be
exploited by the fishermen. The 3 sites which are outside the fishing grounds are expected to have a
higher reproductive success.
The video/dive calibration is promising, though the difference in S. costatus and dead S. gigas is a
problem. This difference could be due to incomplete knowledge and training by the observers and thus
could be solved by adequate training of the observers in the future. In this study a difference was noticed
in determining conch species between the two main observers, one had a tendency to be more uncertain
and determine a conch as a costatus species.
The towed video data shows a direct link between rubble/algae habitat and queen conch densities, as the
densities on rubble/algae transects AZ 1 till 7 clearly have a higher density then the predominantly four
sandy transects (fig. 17 a/b). For seven sample sites the densities range between >50 and 950 thus is
expected that these are reproductive sub-populations. But because these populations are the only ones to
be exploited by the local fishermen, reproductive success is expected to be lower then unfished sites. The
22
video/dive comparison showed that these densities estimates as result of the towed video analysis are
likely to be lower. As the difference between live queen conch, dead queen conch and milk conch were
impossible to differentiate. The method to measure the transects length was dubious, as the distance from
the starting coordinate was taken as reference for the transect length. But as the GPS measures this length
in a straight line rather than measuring the traveled track it is an imprecise measurement.
The average shell length of 250mm and lip thickness of 22mm collected from the landings of the local
fisher if compared to data from Stoner et al (2011) indicate that populations are not heavily exploited. On
the Bahama’s the fished sites had an average shell length 157-177mm of and lip thickness of 15mm. On
the no take area the average shell length was 206-202mm and lip thickness 26-28mm. Stoner et al (2011)
showed that clean meat weight declined if lip thickness grew thicker then 22mm, thus suggesting
Strombus gigas are at an ideal lip thickness on St. Eustatius for the fishermen. Considering the differences
between the two study sites, densities, habitat depth and other biological differences results from the
Stoner et al (2011) are not readily applicable to Strombus gigas populations on St. Eustatius. But it is de
best data available to make this comparison.
5 Recommendations
To validate the towed video method future observers need better training and a greater sample size of
video/dive transects. This step is to be taken serious in order to obtain accurate data and for the success of
the project. The towed video method eliminates scuba diving risks and restrictions by bottom time, but is
not an all-round solution. Limitations of the video are weather conditions, habitat and speed. Conducting
video array surveys is not possible in coral and high structured areas cause of damage to the reef (coral)
and the video array. Weather conditions limit the usability of the array since relatively calm conditions
are necessary for stable images and controlling the speed of the video array. The video array is limited to
speeds between 0.1 – 1.0 knots, when this speed is exceeded the video image becomes too indistinct to
23
analyze and often the array will lift of the seabed thus loosing the necessary detail. If compared to diving,
video array generally takes longer for a similar area to be surveyed. Video array transect of 500 m2 takes
between 15-50 minutes where as diving transects take between 10-20 minutes for a 500 m2 area to be
surveyed while also yielding more data, like conch measurements. In the authors opinion the array is a
valuable addition to diving surveys when sampling ‘flat’ habitat at depths greater than 20 meters. Also
during the video analysis the dots of the green lasers were often hard to see. Therefore it is recommended
to use a more powerful green laser with a broader beam/dot.
It is recommended to practice analyzing towed video transects before conducting trail recordings in the
field in order to get a feel for the method and to see the amount of attention which is necessary for a
successful transect. See Appendix II for training materials on video analysis, video footage can be
requested from the author. During trail recordings one should calibrate the balance of the video array
(drag chain, position of the drop weight). Advisable is to establish a pattern in working with the towed
video and to learn how to interpret the images of the live view. The images from the live view camera
allow one to judge the alignment of the video array, so whether depth of the drop weight and speed of the
boat allow the video array to shoot usable footage. A possibility to enhance the usability would be to fit a
cheap live feed camera to the drop weight as well as the video array, so the alignment is easier to judge
and monitor.
In order to write a non detriment finding for S. gigas more research is required. This study had to goal to
access the possibilities on St. Eustatius and test and calibrate a new method (towed video). To validate the
towed video method a better calibration is needed. This method combined with the traditional dive
surveys should be used in order to make a comprehensive population assessment for S. gigas around St.
Eustatius and Saba. Reproduction and fishing pressure also need to be studied for the non detriment
finding. As a result of this study the shallow (< 20m) S. gigas populations are still non present like was
noticed before (Davis, 2003. White, 2005).

24
6 Literature Appeldoorn, R.S. 1988. Age determination, growth, mortality and age of first reproduction in adult queen
conch, Strombus gigas L., off Puerto Rico. Fish. Res., 6: 363-378. Barker B.A., Helmond I., Bax N., Williams A., Davenport S. and Wadley V.A. 1999. Vessel-towed
camera platform for sea-floor surveys of the continental shelf. Continental Shelf Research 19: 1161 – 1170.
Catarci, C., 2004. World markets and Industry of selected commercially exploited aquatic
species with an international conservation profile. FAO Fisheries Circular No. 990. Chalifour, J. 2008. Development of an Evaluation Method of the Queen conch (Strombus gigas)
Resources in Guadeloupe and Application to Eight Marine Sites in the Archipelago. Proceedings of the 61st Gulf and Caribbean Fisheries Institute. Gosier, Guadeloupe, French West Indies
Chalifour, J. 2009. First Implementation of Queen Conch Stocks Monitoring in Guadeloupe
on Six Marine Sites in its Archipelago Proceedings of the 61st Gulf and Caribbean Fisheries Institute. Gosier, Guadeloupe, French West Indies
CITES, 1979. Convention on International Trade in Endangered Species of Wild Fauna and Flora. Signed
at Washington, D.C., on 3 March 1973 Amended at Bonn, on 22 June 1979. Accessed at: http://www.cites.org/eng/disc/E-Text.pdf on 28-Jan-2013 Collins, P.M. Harrison, T. n.d. Population structure and size distribution of the Queen Conch in Grape
Tree Bay, Little Cayman Island. Accessed at: http://www.dartmouth.edu/~biofsp/pdf07/180_IP1_Collins_Harrison_Q_conch.pdf on 12-09-2012
Davis, J.E. 2003. Population Assessment of Queen Conch, Strombus gigas, in the St. Eustatius Marine
Park, Netherlands Antilles. St. Eustatius Marine Park. Accessed at: www.statiapark.org on 04-09-2012
Davis, M., Mitchell, B.A., and Brown, J.L., 1984. Breeding behavior of the queen conch,
Strombus gigas, Linne held in natural closed environment. Journal of Shellfish Research. Ehrhardt, N.M. Valle-Esquivel, M. 2008. Conch Stock Assessment Manual. Caribbean Fishery
Management Council. Accessed at http://www.strombusgigas.com on 13-09-2012 Glazer, R.A. Delgado, G.A. Kidney, J.A. 2003. Estimating Queen Conch (Strombus gigas) home ranges
using acoustic telemetry: implications for the design of marine fishery reserves. Gulf Carib. Res. 14 79:89.
Iversen, E.S., Jory, D.E., Bannerot, S.P., 1986. Predation on queen conch (Strombus
gigas) in the Bahamas. Bulletin of Marine Science, 39. NOAA Fisheries. 2012. Queen Conch, Strombus gigas.
Accessed at http://www.nmfs.noaa.gov on 12-09-2012

25
MacRae, D.R. and Esteban N. 2007, St Eustatius Marine Park M anagement Plan. Coastal Zone Management (UK) and St Eustatius National Parks Foundation (STENAPA)
White, J. 2005. Population Assessment of Queen Conchm Strombus gigas, and Spiny Lobster, Panulirus
Argus, in the St. Eustatius Marine Park, Netherlands Antilles. St. Eustatius Marine Park. Accessed at: www.statiapark.org on 04-09-2012
Randall, J.E. 1964. Contributions to the biology of the Queen Conch, Strombus Gigas. Institute of Marine
Biology, University of Puerto Rico, Mayagiiez, Puerto Rico. Ray-Culp, M., M. Davis, A.W. Stoner. 1997. The micropredators of settling and newly settled queen
conch. J. Shell. Res. 16(2): 423-428. Rosser, A.R. and Haywood, M.J. (Compilers). 2002. Guidance For CITES Scientific Authorities:
Checklist to assist in making non-detriment findings for Appendix II exports. IUCN, Gland, Switzerland and Cambridge, UK. xi + 146pp.
Sheenan, E.V. Stevens, T.F. Attrill, M.J. 2010. A Quantitative, Non-Destructive Methodology for
Habitat Characterisation and Benthic Monitoring at Offshore Renewable Energy Developments. PLoS ONE 5(12): e14461. doi:10.1371/journal.pone.0014461
Stevens, T.F. 2006. A lightweight, inexpensive underwater video array. School of Earth, Ocean and
Environmental Sciences, University of Plymouth, Drake Circus, Plymouth. Stoner, A. Davis, M. 2010. Queen Conch Stock Assessment Historical Fishing Grounds Andros Island,
Bahamas. The Nature Conservancy, Northern Caribbean Office. Nassau, Bahamas. Accessed at: www.communityconch.org on 12-10-2012 Stoner, A. W. Davis, M. H. Booker, C. J. 2011. Negative consequences of the allee effect are
compounded by fishing pressure: Comparison of queen conch reproduction in fishing grounds and a marine protected area. Bulletin of Marine Science. 88(1):89–104. 2012
Stoner, A.W., Sandt, V.J., Boidron-Metairon, I.F., 1992. Seasonality of reproductive activity and abundance of veligers in queen conch, Strombus gigas. Fish. Bull. U.S. 90, 161–170.
Theile, S. 2003. Status of the Queen Conch Strombus gigas Stocks, Management and Trade in the
Caribbean A CITES Review. 56th Gulf and Caribbean Fisheries Institute, 675-694.

26
7 Appendix I
Checklist array
StepsBring from
home
Before deployment
Start transectAfter deploym
ent1
GPSCheck the live-view
systemLet the array sink
Check the GoPro2
Red Filtercheck G
oProSoftly guide the dropw
eight overboardStop recording
3Spare batteries
BatteriesSink the dropw
eight till it is on the seabedBatteries
4
Towel to dry the
GoPro or Lasers when
its necessary to open to w
aterproof casingsSD card
Then start towing at m
ax 0.5 knots, the dropw
eight will lift of the bottem
. Consider low
ering it a little bit more depending on
the image on the live view
camera
SD card storage capacity
5Fresh w
ater (rinse)Settings
When the footage on the live-view
looks good you can m
ark a gps point and note the nam
e and time of that gps point (START
TRANSECT)
Lasers batteries
6GoPro and all extra's
Safety line
Monitor the live-view
for correct tow
(height and speed) and large objects on w
hich the array could get stuckN
ote depth
7SD cards
Seal waterproof housing
After 500 meters from
the start you make
can mark another gps point and start
hauling up the array8
Waterproof notebook
Allignment lasers and batteries
9Array + cables
Check the fishline on the drag chain and drop weight
10Drag chain
Check all the attachments (lines)
11Drop w
eightTurn on lasers
12Electronical case
Start recording with the GoPro
13Attach drag chain
14Put array overboard
15Fill the fram
e with w
ater, close the lids16
Check if the lines are in the correct allignment

27
8 Appendix II Sample Number
Video code
Time Species Stage (juv_int_adult_unknown)
Live_Dead
0 T1 3:58 Strombus gigas adult 1 0 T1 5:18 Strombus gigas adult 1 0 T1 5:31 Strombus gigas adult 1 0 T1 7:09 Strombus gigas adult 1 0 T1 8:02 Strombus gigas adult 1 0 T1 9:47 Strombus gigas adult 1 0 T1 12:06 Strombus gigas adult 1 0 T1 12:57 Strombus gigas adult 1 0 T1 17:40 Strombus gigas adult 1 0 T1 17:40 Strombus gigas adult 1 0 T1 17:58 Strombus gigas adult 1 0 T1 17:58 Strombus gigas adult 1 0 T1 19:41 Strombus gigas adult 1 0 T1 OUT
8:25 Strombus costatus adult 1
5 T1 OUT 33:45
Strombus gigas adult possible dead 0
5 T2 7:23 Strombus gigas adult 1 5 T2 9:17 Strombus gigas adult 1 5 T2 9:59 Strombus gigas adult 1 5 T2 9:59 Strombus gigas adult 1 6 T1 8:09 Strombus gigas adult 1 6 T1 9:57 Strombus gigas adult 1 6 T1 10:02 Strombus gigas adult 1 6 T1 11:11 Strombus gigas adult 1 6 T1 14:11 Strombus gigas adult 1 6 T1 14:21 Strombus gigas adult 1 6 T1 14:42 Strombus gigas adult 1 6 T1 15:06 Strombus gigas adult 1 6 T1 15:26 Strombus gigas adult 1 6 T1 16:08 Strombus gigas adult 1 6 T1 16:30 Strombus gigas adult 1 6 T1 17:48? Strombus gigas adult 1 6 T1 18:25 Strombus gigas adult 1 6 T1 20:59? Strombus gigas adult 1 6 T1 20:55? Strombus gigas adult 1 6 T1 21:38 Strombus gigas adult 1 6 T1 21:38 Strombus gigas adult 1 6 T1 21:52 Strombus gigas adult 1 6 T1 25:15 Strombus gigas adult 1

28
6 T1 24:29? Strombus gigas adult 1 6 T1 25:38 Strombus gigas adult 1 6 T1 28:33 Strombus gigas adult 1 6 T1 28:42 Strombus gigas adult 1 6 T1 31:05 Strombus gigas adult 1 6 T1 32:17 Strombus gigas adult 1 6 T1 32:52 Strombus gigas adult 1 6 T2 3:30 Strombus gigas adult 1 6 T2 4:18 Strombus gigas adult 1 6 T2 4:35? Strombus gigas adult 1 6 T2 5:10 Strombus gigas adult 1 6 T2 12:16 Strombus gigas adult 1 8 T2 6:18 Strombus gigas adult 1 8 T2 8:35 Strombus gigas adult 1 8 T2 8:56 Strombus gigas adult 1 8 T2 8:59 Strombus gigas adult 1 8 T2 9:14 Strombus gigas adult 1 8 T2 9:14 Strombus gigas adult 1 8 T2 9:21 Strombus gigas adult 1 8 T2 9:53 Strombus gigas adult 1 8 T2 10:06 Strombus gigas adult 1 8 T2 10:41 Strombus gigas adult 1 8 T2 10:44 Strombus gigas adult 1 8 T2 13:36 Strombus gigas adult 1 8 T2 15:31 Strombus gigas adult 1 8 T3 0:00 Strombus gigas adult 1 8 T3 2:09 Strombus gigas adult 1 8 T3 5:56 Strombus gigas adult 1 8 T3 6:54 Strombus gigas adult 1 8 T3 10:56 Strombus gigas adult 1 8 T3 11:29 Strombus gigas adult 1 8 T3 11:30 Strombus gigas int 1 8 T3 11:31 Strombus gigas adult 1 8 T3 11:41 Strombus gigas adult 1 8 T3 12:00 Strombus gigas int 1 8 T3 14:01 Strombus gigas adult 1 8 T3 14:16 Strombus gigas adult 1 8 T3 14:20 Strombus gigas adult 1 8 T4 2:07 Strombus gigas adult 1 8 T4 2:35 Strombus gigas adult 1 8 T4 3:31 Strombus gigas adult 1 8 T4 3:56 Strombus gigas adult 1 8 T4 4:13 Strombus gigas adult 1

29
8 T4 6:09 Strombus gigas adult 1 8 T4 7:14 Strombus gigas adult 1 8 T4 8:31 Strombus gigas adult 1 8 T4 10:43 Strombus gigas adult 1 8 T4 11:07 Strombus gigas adult 1 8 T4 11:30 Strombus gigas adult 1 8 T4 12:01 Strombus gigas int 1 8 T4 12:05 Strombus gigas adult 1 8 T4 14:21 Strombus gigas adult 1 8 T4 14:37 Strombus gigas adult 1 8 T5 0:50 Strombus gigas adult 1 8 T5 1:57 Strombus gigas adult 1 8 T5 2:14 Strombus gigas adult 1 8 T5 3:29 Strombus gigas adult 1 9 T1 5:23 Strombus gigas adult 1 9 T1 6:21 Strombus gigas adult 1 9 T1 15:01 Strombus gigas adult 1 9 T1 16:29 Strombus gigas adult 1 10 T2 12:06 Strombus gigas adult 1 10 T2 15:02 Strombus gigas adult 1 10 T3 1:31 Strombus gigas adult 1 10 T3 1:39 Strombus gigas adult 1 10 T3 2:37 Strombus gigas adult 1 10 T3 2:40 Strombus gigas adult 1 10 T3 2:47 Strombus gigas adult 1 10 T3 2:50 Strombus gigas adult 1 10 T3 3:01 Strombus gigas adult 1 10 T3 7:53 Strombus gigas adult 1 10 T3 8:19 Strombus gigas adult 1 10 T3 12:11 Strombus gigas int 1 10 T3 16:16 Strombus gigas adult 1 10 T3 16:43 Strombus gigas adult 1 10 T4 3:29 Strombus gigas adult 0 10 T4 4:28 Strombus gigas adult 1 11 T2 7:14 Strombus gigas adult 1 11 T2 9:10 Strombus gigas adult 1 11 T2 10:41 Strombus gigas adult 1 11 T2 11:25 Strombus gigas adult 1 16 T2 4:06 Strombus pugilis? adult 1 20 T1 7:27 Strombus pugilis? adult 1 20 T1 7:28 Strombus pugilis? adult 1 20 T1 7:31 Strombus pugilis? adult 1 20 T2 0:00 Strombus pugilis? adult 1

30
20 T2 0:32 Strombus pugilis? adult 1 20 T2 1:25 Strombus pugilis? adult 1 20 T2 1:40 Strombus pugilis? adult 1 20 T2 7:31 Strombus gigas adult 0 20 T3 1:10 Strombus costatus adult 0 20 T3 1:28 Strombus gigas adult 0 20 T3 2:14 Strombus gigas adult 0 20 T3 3:05 Strombus gigas adult 0

31
9 Appendix III
32
33
Drop weight