Pre-Hispanic Fishery of the Queen Conch, Strombus gigas, on the Islands off the Coast of Venezuela

CONCH (Strombus gigas)
STOCK ASSESSMENT
MANUAL
CARIBBEAN FISHERY MANAGEMENT COUNCIL
2008
Nelson M. Ehrhardt and Monica Valle-Esquivel

1. CITES CONTROLS
The Convention on International Trade in Endangered Species of Wild Faunaand Flora –- CITES –
International agreement between “voluntary participating” States organized under the UN.
An organization “without enforcement capabilities” that “checks compliance of international trade documents with declared export quotas”.
Enforcement is in the power of exporting-importing countries, this is if
they have the political will to protect endangered species.

CITES voluntary State declared export quota system
There is “no specific requirement” in the text of the Convention to establish quotas to limit the trade in CITES-listed species.
Export quotas are established by each voluntary member State “unilaterally”.
Before any State may issue an export quota, its Scientific Authority must advise that the proposed export will not be detrimental to the survival of the species (INTEREST IS ON THE SPECIES AND NOT ON THE FISHERY)

CITES does not promulgate, advocate or suggest ways, methods or algorithms that should be used when estimating Queen Conch export quotas.
CITES assumes that Countries have the know-how and the resources(financially and scientifically) to define annual non detrimental export quotas for Queen Conch.
CITES assumes also that Governments and fishing industry are fair players.
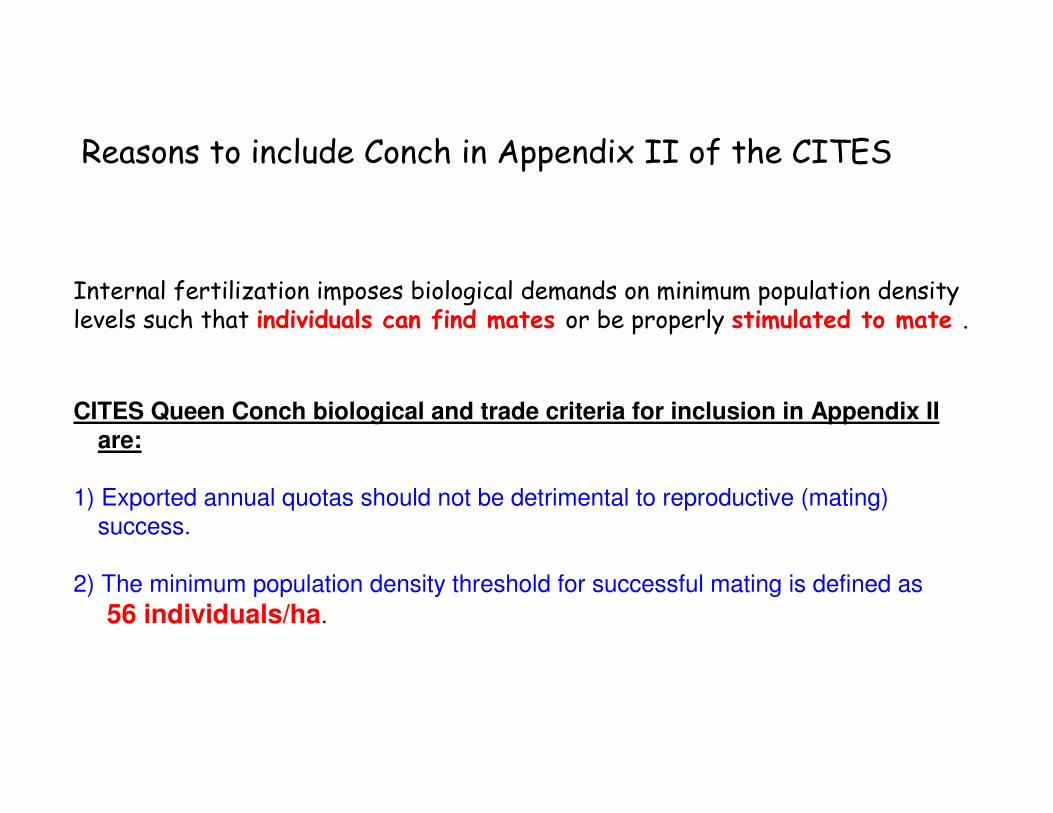
Reasons to include Conch in Appendix II of the CITES
Internal fertilization imposes biological demands on minimum population densitylevels such that individuals can find mates or be properly stimulated to mate .
CITES Queen Conch biological and trade criteria for inclusion in Appendix II
are:
1) Exported annual quotas should not be detrimental to reproductive (mating)
success.
2) The minimum population density threshold for successful mating is defined as
56 individuals/ha.
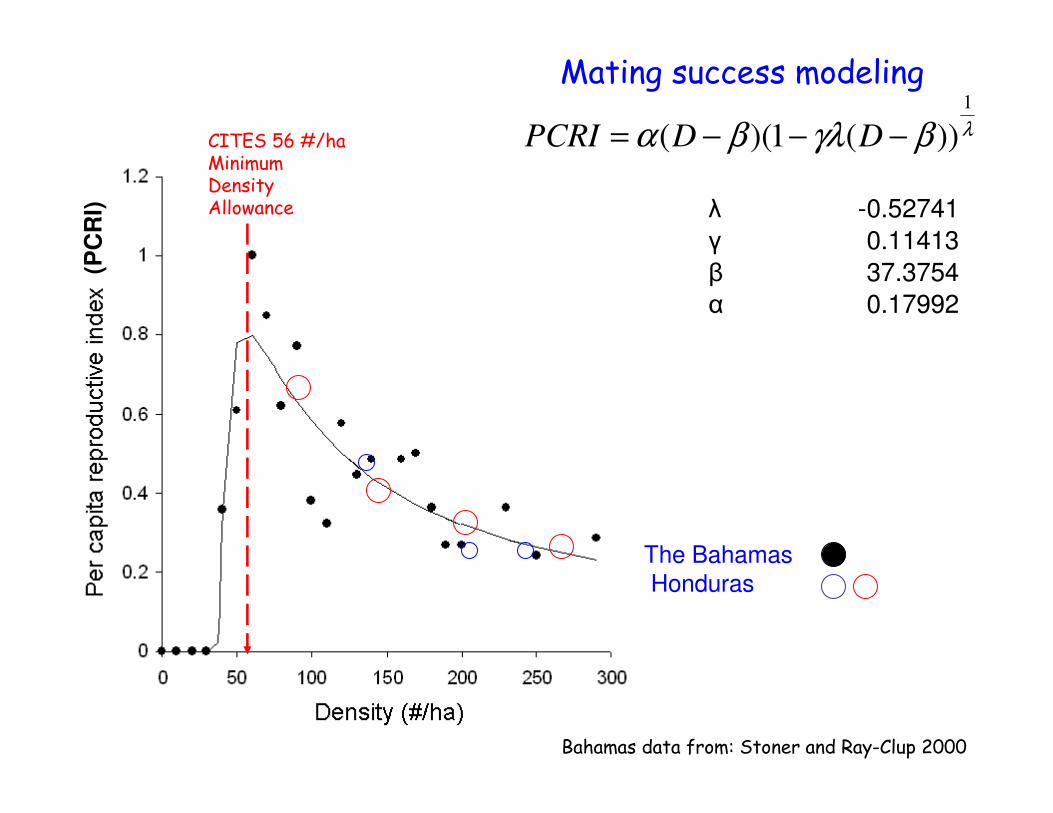
(PC
RI)
λβγλβα1
))(1)(( −−−= DDPCRI
λ -0.52741
γ 0.11413
β 37.3754
α 0.17992
Mating success modeling
CITES 56 #/ha MinimumDensityAllowance
The Bahamas
Honduras
Bahamas data from: Stoner and Ray-Clup 2000

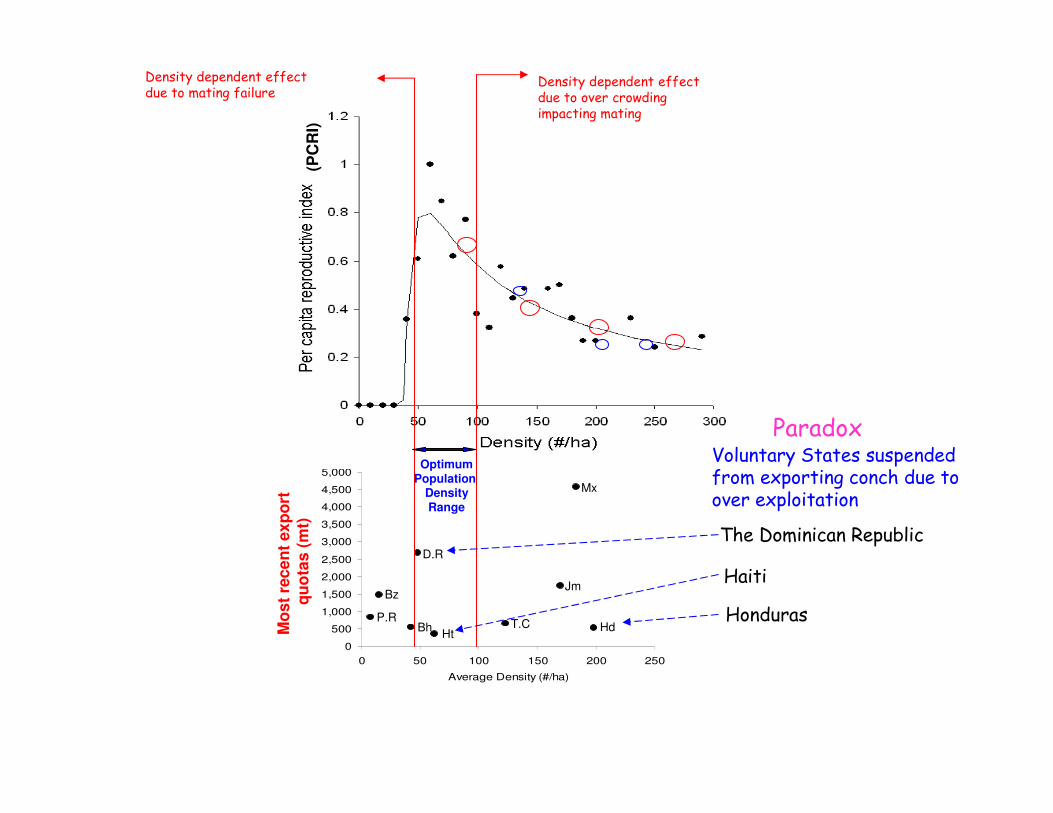
(PC
RI)
Density dependent effectdue to over crowding impacting mating rates
Density dependent effectdue to mating failure
Optimum
Population
Density
Range

RESULTS OF USING NON STANDARDIZED PROCEDURES TO DEFINE QUEEN CONCH EXPORT QUOTAS UNDER A FAIR PLAY CONCEPT
0
500
1,000
1,500
2,000
2,500
3,000
3,500
4,000
4,500
5,000
0 50 100 150 200 250
Average Density (#/ha)
Avera
ge L
andin
gs (m
t)M
ost
recent
export
quota
s (
mt)
P.R
Bz
BhHt
D.R
T.C Hd
Jm
Mx
There is no correlation between the non-detrimental export quotas and thesustainability criteria established for the species (population density)

Density by fishing grounds (#/ha)
Fre
quency Honduras exploited areas
Protected Areas Traffic (2003)
Exploited Areas Traffic (2003)
1. Densities are higher in the exploited areas than in protected areas.2. Issue: How do we estimate quotas based on population density only?
Regional Queen Conch Population Densities
0
500
1,000
1,500
2,000
2,500
3,000
3,500
4,000
4,500
5,000
0 50 100 150 200 250
Average Density (#/ha)
Avera
ge L
andin
gs (m
t)
Mo
st
rec
en
t ex
po
rt
qu
ota
s (
mt)
P.R
Bz
BhHt
D.R
T.C Hd
Jm
Mx
(PC
RI)
Density dependent effectdue to over crowdingimpacting mating
Density dependent effectdue to mating failure
OptimumPopulation
DensityRange
Voluntary States suspended from exporting conch due to over exploitation
The Dominican Republic
Haiti
Honduras
Paradox

0
500
1,000
1,500
2,000
2,500
3,000
3,500
4,000
4,500
5,000
0 50 100 150 200 250
Average Density (#/ha)
Avera
ge L
andin
gs (m
t)
Mo
st
rec
en
t ex
po
rt
qu
ota
s (
mt)
P.R
Bz
BhHt
D.R
T.C Hd
Jm
Mx
(PC
RI)
Density dependent effectdue to over crowding impacting mating
Density dependent effectdue to mating failure
OptimumPopulation
DensityRange
Voluntary Sates identified with proper conch management
Mexico
Belize
Jamaica
Paradox

Technical Issues with CITES export quotas
Voluntary Countries unilaterally report the non detrimental export quotas.
Condition 1
Issues with Condition 1:
1) CITES does not perform a scientific review of the non detrimental quota“declared” by the countries. Reason: CITES does not have specialized personnelor handling power to carry out such reviews.
2) There are no Queen Conch stock assessment protocols adopted by the CITES;therefore, countries “declare” annual non detrimental quotas under differentdata and methods, usually following historic “intuitive” reasoning.

Condition 2.
The Government CITES Office (Management Authority) requests the Government Scientific Authority to review the status of the quota each timea CITES export certificate is requested. Scientific Authority checks if the exports are legally obtained, and certify that exports under CITES Certificateswill not be detrimental to the survival of the species.
Issuess with Condition 2.
1) Traceability of the products is impossible due to integration of several landings in the exported products. Most of the illegally caught Queen Conch cannot be retainedonce it is processed and packed.
2) There is no check on the non detrimental character of each export because it isimplicit that if a quota is still open, such quota was already “declared non detrimental”to the survival of the species by the Management Authority to the CITES.
3) Countries do not have enforcement capabilities to prevent high seas product transfer.

Quota = Fref * Population Biomass
Population Biomass = Average Density * Habitat Range * Average individual weight
Fref = need population parameters (growth, natural mortality, fecundity, matingsuccess as function of population density)
Queen conch annual quota estimation
STOCK ASSESSMENT MANUAL

FISHERY MANAGEMENT OBJECTIVE
OR STRATEGY REGARDING
USE OF THE RESOURCE
FMinimum Density Threshold
POPULATION
BIOMASS
VULNERABLE
OR AVERAGE
FISHABLE
BIOMASS
STRATEGIC
FISHING
MORTALITY
REFERENCE
FISHERY REGULATIONS
OR CONTROLS:
ANNUAL QUOTA
FISHING CAPACITY
ADJUSTED TO
ANNUAL QUOTA
A SIMPLIFIED ANNUAL CONCH QUOTA DEFINITION
ALLOWABLE
BIOLOGICAL
CATCH
ABC = FMDT*Average Biomass
?
?
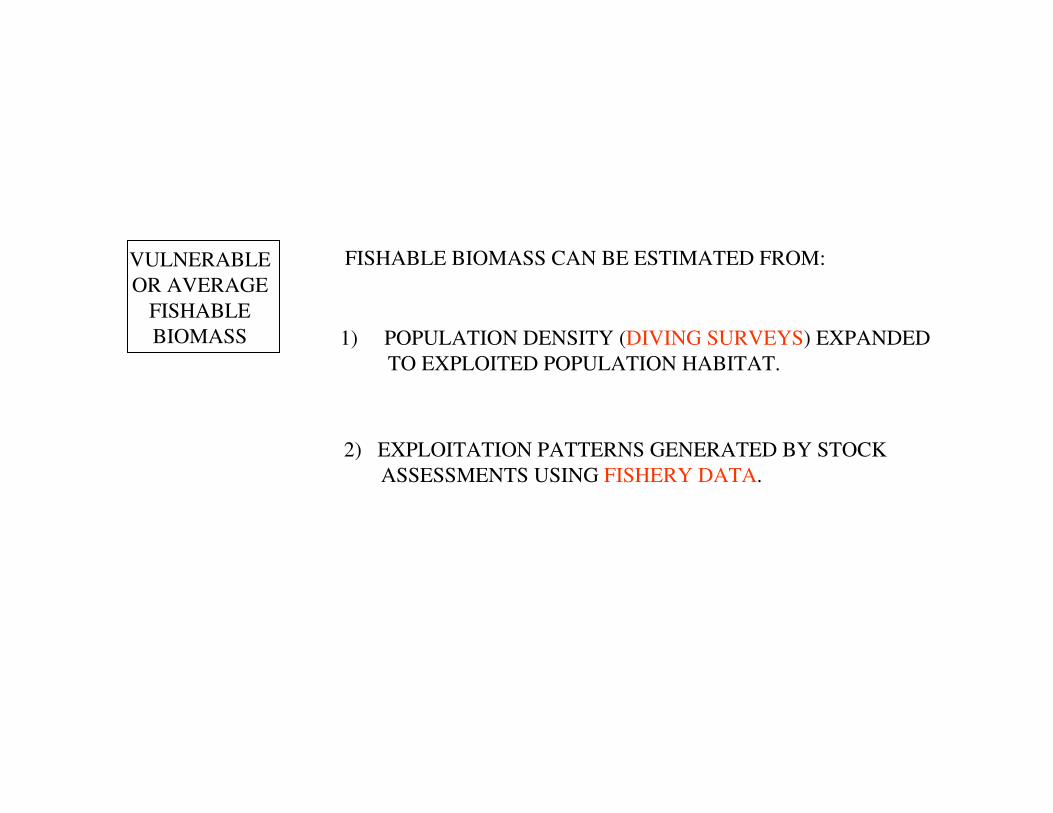
1) POPULATION DENSITY (DIVING SURVEYS) EXPANDED
TO EXPLOITED POPULATION HABITAT.
VULNERABLE
OR AVERAGE
FISHABLE
BIOMASS
FISHABLE BIOMASS CAN BE ESTIMATED FROM:
2) EXPLOITATION PATTERNS GENERATED BY STOCK
ASSESSMENTS USING FISHERY DATA.
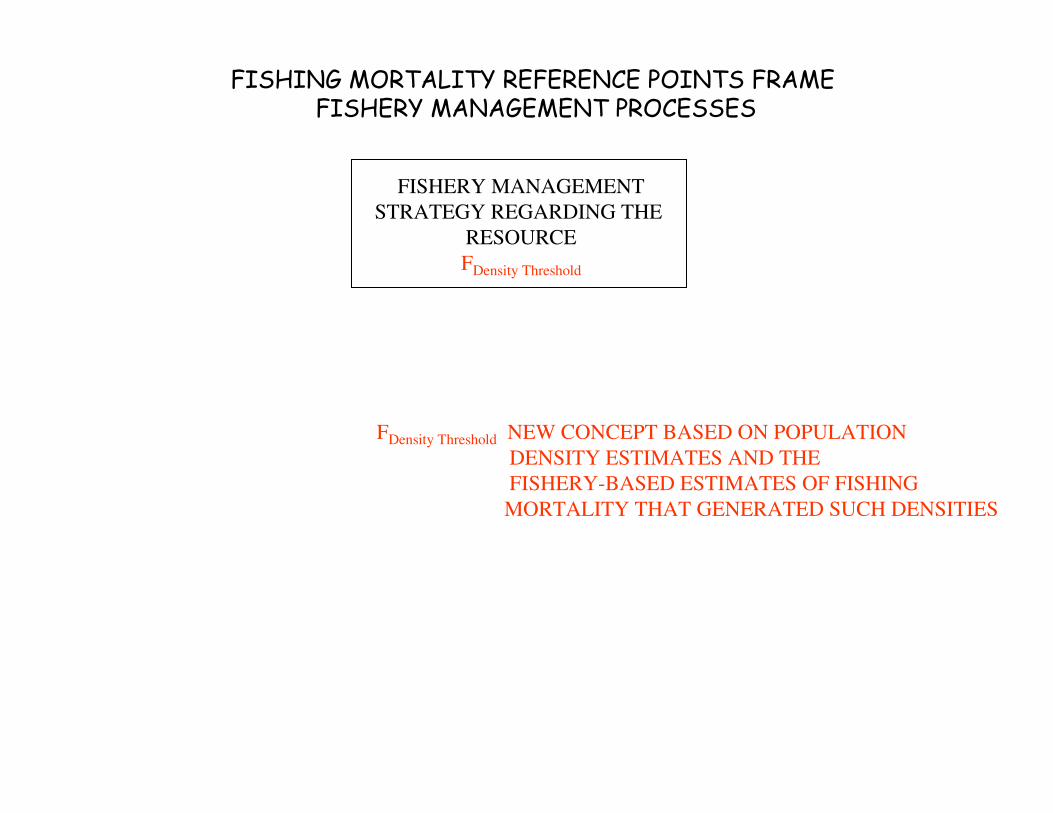
FISHERY MANAGEMENT
STRATEGY REGARDING THE
RESOURCE
FDensity Threshold
FDensity Threshold NEW CONCEPT BASED ON POPULATION
DENSITY ESTIMATES AND THE
FISHERY-BASED ESTIMATES OF FISHING
MORTALITY THAT GENERATED SUCH DENSITIES
FISHING MORTALITY REFERENCE POINTS FRAME FISHERY MANAGEMENT PROCESSES
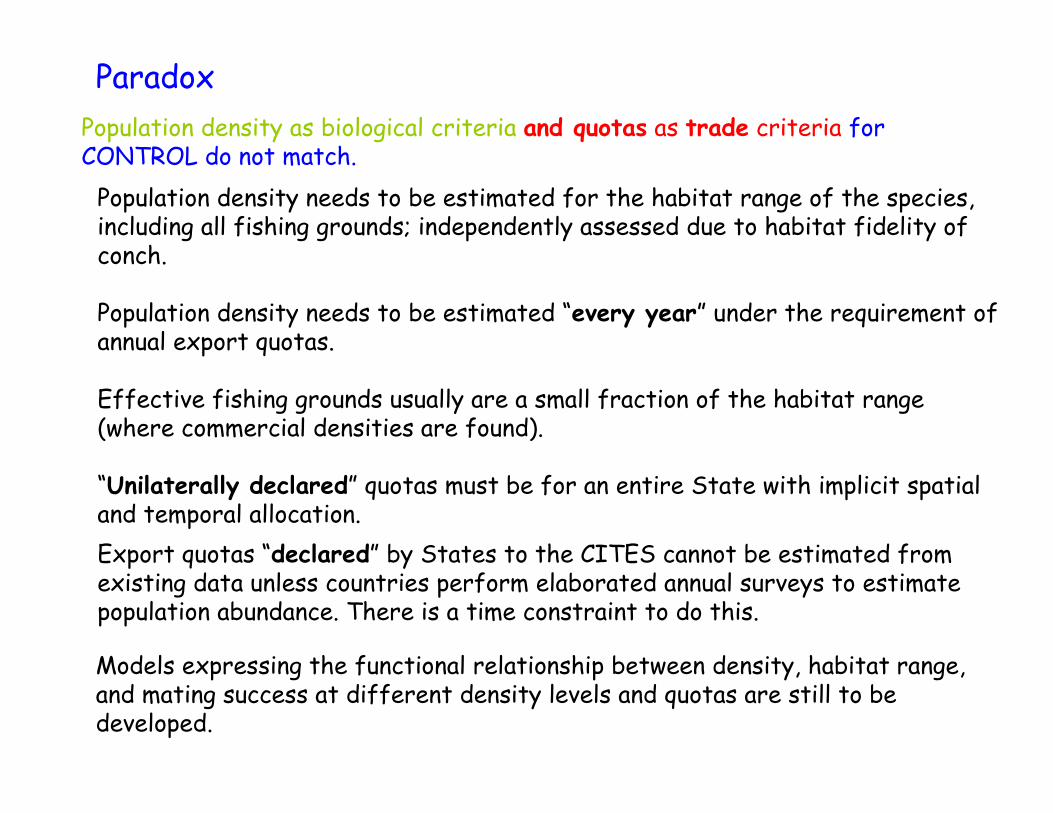
Population density needs to be estimated for the habitat range of the species,including all fishing grounds; independently assessed due to habitat fidelity of conch.
Population density needs to be estimated “every year” under the requirement ofannual export quotas.
Effective fishing grounds usually are a small fraction of the habitat range(where commercial densities are found).
“Unilaterally declared” quotas must be for an entire State with implicit spatial and temporal allocation.
Export quotas “declared” by States to the CITES cannot be estimated fromexisting data unless countries perform elaborated annual surveys to estimatepopulation abundance. There is a time constraint to do this.
Models expressing the functional relationship between density, habitat range,and mating success at different density levels and quotas are still to be developed.
Paradox
Population density as biological criteria and quotas as trade criteria forCONTROL do not match.

Survey approach to assess the resource and control fishing
1. Systematic replicated experimental sampling design to estimate:a. Population habitat range and fishing ground mappingb. Population density and size-sex structuresc. Site fidelity regarding growth, mating success and spawningd. Overall population mortality rate and population abundance
2. Commercial population density surveys and monitoring to estimate:a. Fraction of habitat range usedb. Population density on fishing groundsc. Exploited population mortality rate and abundance

1. Systematic replicated experimental sampling design to estimate and map population densities and dimension habitat range
Rosalinda
Bank
Middle
Bank
Oneida
Bank
Gorda
Bank
Nicaragua
Honduras

Coral Reef
Sampling stations every 3 nm
45 belt transects per sampling station
Systematic random sampling design

Sampling station
Vessel
Area covered
by one diver
1) Conch density per belt transect
2) Average density and variance in sampling station
3) Statistics estimated per sampling station extrapolated to survey area.

Nicaragua
Honduras
Lb / diver
White = 0 Sky Blue = 0.01 to 5.00 Green = 5.01 to 10.00 Yellow-Green = 10.01 to 15.00 Yellow = 15.01 to 20.00
Orange = 20.01 to 25.00 Red = 25.01 to 30.00 Brick Red = 30.01 to 35.00 Brownish Red = > 35.00
Experimental density sampling survey results

Nicaragua
Honduras
2. Monitored commercial operations to define fishing grounds, exploitation rates, and commercial population densities.
Lb / diver
White = 0 Sky Blue = 0.01 to 5.00 Green = 5.01 to 10.00 Yellow-Green = 10.01 to 15.00 Yellow = 15.01 to 20.00
Orange = 20.01 to 25.00 Red = 25.01 to 30.00 Brick Red = 30.01 to 35.00 Brownish Red = > 35.00

Combined experimental sampling surveys and monitored commercial operations to estimate resource characteristics and stock utilization
Nicaragua
Honduras
Lb / diver
White = 0 Sky Blue = 0.01 to 5.00 Green = 5.01 to 10.00 Yellow-Green = 10.01 to 15.00 Yellow = 15.01 to 20.00
Orange = 20.01 to 25.00 Red = 25.01 to 30.00 Brick Red = 30.01 to 35.00 Brownish Red = > 35.00

Oneida Bank
Average Density (#/ha)
2006 2009 2010
86.0 129.7 193.00 Banco Oneida 2009
0%
5%
10%
15%
20%
25%
30%
35%
0 50 100 150 200 250 300 350 400 450 500 550 600 650 700
Densidad estándar (Número por hectárea)
Fre
cuencia
Banco Oneida 2006
0%
5%
10%
15%
20%
25%
30%
35%
0 50 100 150 200 250 300 350 400 450 500 550 600 650 700
Densidad estándar (Número por hectárea)
Fre
cuencia
Banco Oneida 2010
0%
5%
10%
15%
20%
25%
30%
35%
0 50 100 150 200 250 300 350 400 450 500 550 600 650 700
Densidad estándar (Número por hectárea)
Fre
cuencia

Monitoring commercial fleets byElectronic Satellite Logbook System
Marine SealedTouch Screenfor data entry
Switch Box
Satellite Antenna
Marine SealedMicrocomputer

Satellite tracking of
vessel 1 operationsin Rosalind bank
Satellite tracking of
vessel 2 operationsin Rosalind bank
Satellite tracking of
vessel 3 operationsin Rosalind bank
Satellite tracking of
vessel 4 operationsin Rosalind bank
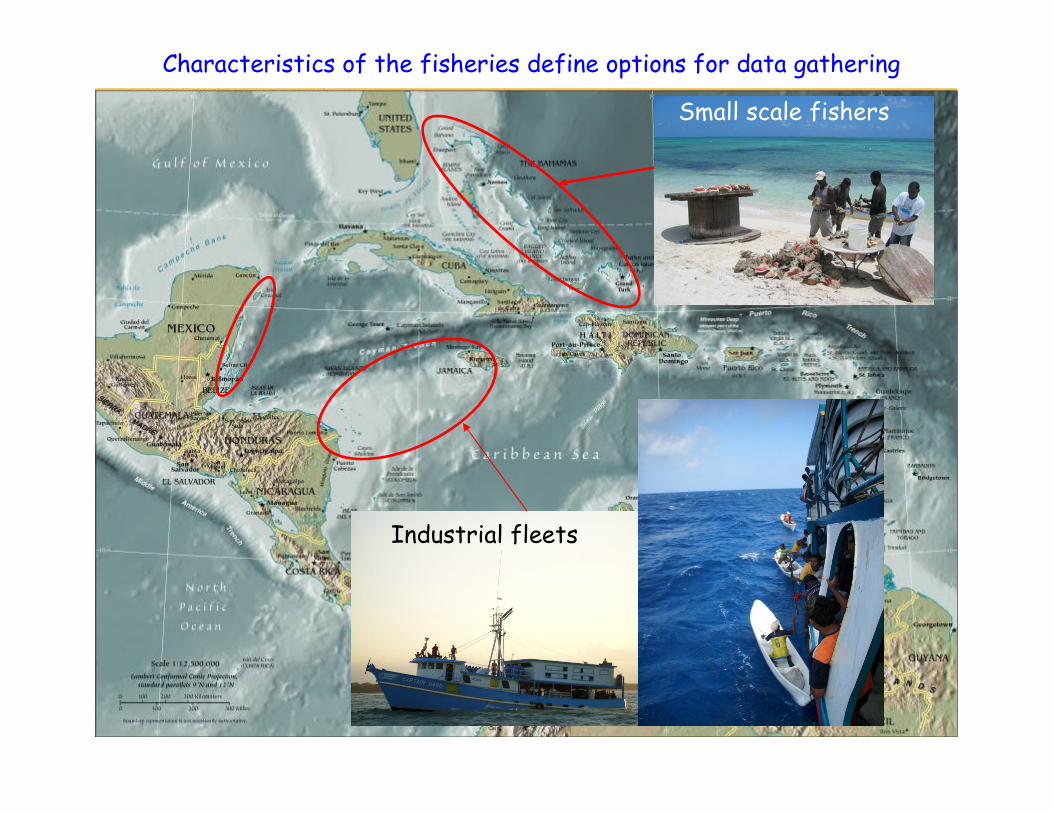
Small scale fishers
Industrial fleets
Characteristics of the fisheries define options for data gathering

65% Clean85% Clean100% Clean Whole
Cracking conch
Cleaning
Small scale fishers land whole queen conch

PROBLEM:Whole animals are not available to measure size frequencies,sex or maturity.
Industrial queen conch fishers land bulk clean frozen conch

Operational Fishing Characteristics that Affect Conch Stock Assessments
Fishing operations take place in areas with the highest densities; therefore,
CPUE does not represent average stock abundance.
Each fishing ground portrays distinct conch biological properties associated with
geographic identities. However, landings are a mix of catches from many different
fishing grounds; therefore:
Surplus production may not capture these distinct geographic identities.
In most fisheries only clean meat is landed. This mars the process of identifying
maturity and size of the individuals landed.
Fishing intensity among the fishing grounds differs and it is difficult to assess.
Such differences are significant to the CPUE standardization.

Stock assessment methods based on size structures of individuals in the landings
1) Growth as a function of clean meet size at age.
2) Empirical natural mortality rate formulation based on growth function.
3) Weight converted catch curves to estimate fishing mortality rates.

-100
0
100
200
300
400
0 1 2 3
AGE (yrs)
SY
PH
ON
AL
LE
NG
TH
(m
m)
Regional Juvenile Conch Growth FunctionsRegional Juvenile Conch Growth Functions
AGE MATURITY
AVERAGE GROWTH PARAMETERS
PARAMETER Loo K to
MEAN 316.42 mm 0.385 -0.051
SD 61.25 0.113 0.28
Bahamas

)t*3A(EXPtW
WW
−
∞
∞=
CONCH GROWTH MODEL (based on clean foot meat weight)
( )
3A
Wln
WW
ln
ln
t
t
−
=
∞
∞
Relative Age is expressed as

Growth in meat weight for queen conch in the
Martinique, Belize and Grand Bahama fisheries.
0
100
200
300
400
500
600
0 5 10 15 20AGE (yrs)
ME
AT
WE
IGH
T (
g)
Martinique (average) Martinique (lower)Martinique (upper)Grand BahamaBelize 1996 data

Natural mortality (M) estimation
M= -.0242 + 4.33/(Relative Age) (Appeldoorn 1988)
( )
−
+−=
∞
∞
W
WW
AM
t
ln
ln
ln
3*33.40242.0
( )
3
ln
ln
ln
ReA
W
WW
lativeAge
t
−
=
∞
∞
(From growth in Ehrhardt’s
weight at age equation)

Honduras
0.0
0.2
0.4
0.6
0.8
1.0
1.2
1.4
1.6
1.8
2.0
0 50 100 150 200 250 300
Carne 100% limpia
Ta
sa
Mo
rta
lid
ad
Na
tura
l (M
)
Clean foot meat size (grams)
Naturalmortality
rate
Average M = 0.72 for
mature weight size

( )
3
ln
ln
ln
ReA
W
WW
lativeAge
t
−
=
∞
∞
(From growth in weight of edible part at age)
Weight converted catch curve
'ln Zt+a=)t
C(
j
t
∆
Slope of line
total instantaneous
mortality rate
=−=∆
+
∞
∞
+
1
1
ln
ln
ln3
1
j
j
jjt
WW
WW
Att
j
Size increment (From growth in weight edible part)

Relative age t’
Weight converted catch curve by fishing ground and year
Relative age t’Relative age t’
Ln
(C/d
t)
Ln
(C/d
t)

F = Z - M

5.500.000 Pre-Hispanic (1160–1540 A.D.) queen conch shells.Los Roques National Park, Venezuela.
Mortality estimation from historic shell discards

From Torres and Sullivan-Sealy (2002)
1960
600Year AD
600 AD and 1960 Discards. Dominican Republic

1960-Shell Discards Dominican Republic
Top
Bottom
From Torres and Sullivan-Sealy (2002)

Turks and Caicos Islands
1450 to 1645 AD1980-1990’s
From Stager and Chen (1996)

Fishing Effort Index
SurplusProductionIndex
Conch
Fish
MSYDensity
fopt
MSYLogistic
fopt
BMSY=?BunexploitedBMSY=Bunexpl/2
PopulationBiomass Index
Dynamic Biomass Production Models
PRODUCTION MODELING
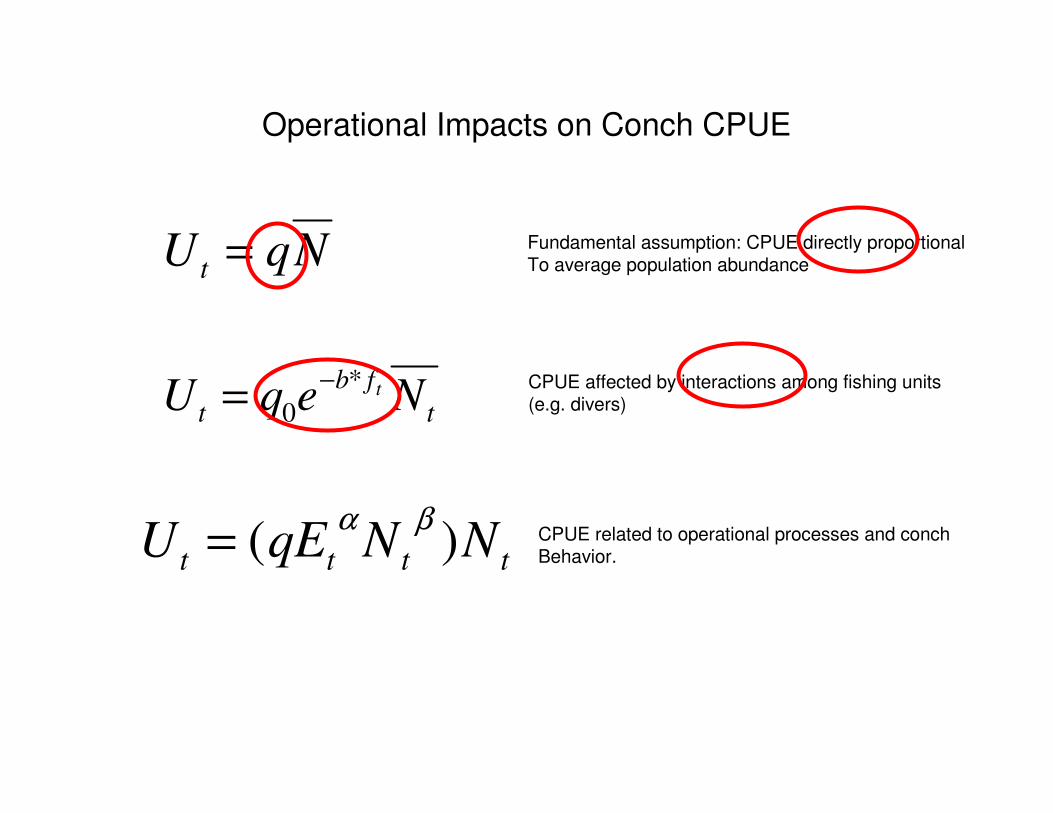
Operational Impacts on Conch CPUE
NqU t = Fundamental assumption: CPUE directly proportionalTo average population abundance
CPUE affected by interactions among fishing units (e.g. divers)t
fb
t NeqU t*
0
−=
CPUE related to operational processes and conchBehavior.tttt NNqEU )(
βα=

Production modeling issues
There is a need to understand the Queen conch population generationfunction which must be subjected to recruitment success as functionof population density.
There is a need to understand catchability dynamics when fishingeffort is fundamentally by diving.
There is a need to assess surplus production by fishing groundsdue to site fidelity of the Queen conch.
There is a need to understand stock connectivity due to nature oflarval drift in strong ocean current systems and the nature of theup-stream exploitation effects.

Colored drawing by Louis Charles Kiener (1799-1881)
Thank you