2013 AAFPRS Membership Study - Facial Plastic and ... · – to provide statistics and insights for...
49
I N T E R N A T I O N A L C O M M U N I C A T I O N S R E S E A R C H 2013 AAFPRS Membership Study February 2014 I N T E R N A T I O N A L C O M M U N I C A T I O N S R E S E A R C H Custom Research • Information Analysis • ICR EXCEL omnibus services Contact: Deb Winneberger 53 W. Baltimore Pike, Media, PA 19063 484-840-4376 (p) • 484-840-4599 (f) • [email protected] • www.icrsurvey.com Conducted for:
Transcript of 2013 AAFPRS Membership Study - Facial Plastic and ... · – to provide statistics and insights for...

I N T E R N A T I O N A L C O M M U N I C A T I O N S R E S E A R C H
2013 AAFPRS Membership Study February 2014
I N T E R N A T I O N A L C O M M U N I C A T I O N S R E S E A R C H
Custom Research • Information Analysis • ICR EXCEL omnibus services
Contact: Deb Winneberger
53 W. Baltimore Pike, Media, PA 19063
484-840-4376 (p) • 484-840-4599 (f) • [email protected] • www.icrsurvey.com
Conducted for:

I N T E R N A T I O N A L C O M M U N I C A T I O N S R E S E A R C H
Background

3 © 2014 – ICR – Confidential
Background
Objectives
The objectives of this research are:
– to provide statistics and insights for facial plastic surgery
– to provide trend information regarding the frequency of both reconstructive and cosmetic surgery
About AAFPRS
The American Academy of Facial Plastic and Reconstructive Surgery is the world's
largest specialty association for facial plastic surgery. It represents more than 2,700
facial plastic and reconstructive surgeons throughout the world. The AAFPRS is a
National Medical Specialty Society of the American Medical Association (AMA), and
holds an official seat in both the AMA House of Delegates and the American College of
Surgeons board of governors. AAFPRS members are board certified surgeons whose
focus is surgery of the face, head, and neck. AAFPRS members subscribe to a code of
ethics. In addition, the AAFPRS provide consumers with free information and brochures
and a list of qualified facial plastic surgeons in their area by visiting the AAFPRS website,
www.facemd.org.
Contact Information
For more information, or to schedule an interview with an AAFPRS spokesperson,
please contact the Academy‟s public relations firm, Kelz PR at 646-450-5359 and ask to
speak to Melissa Kelz.

I N T E R N A T I O N A L C O M M U N I C A T I O N S R E S E A R C H
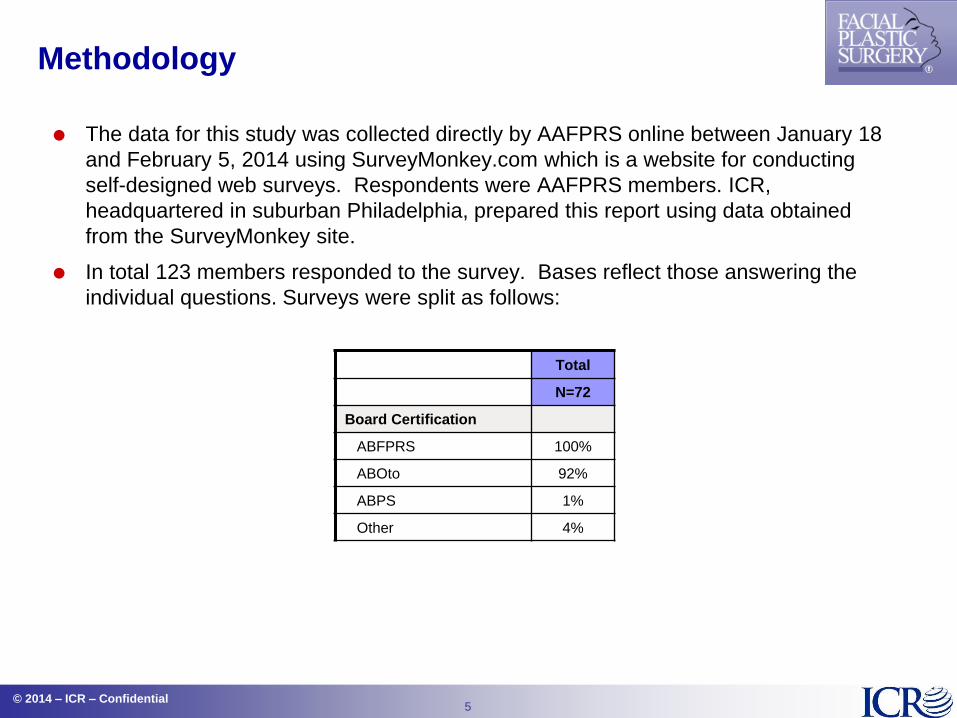
Methodology
5 © 2014 – ICR – Confidential
Methodology
The data for this study was collected directly by AAFPRS online between January 18
and February 5, 2014 using SurveyMonkey.com which is a website for conducting
self-designed web surveys. Respondents were AAFPRS members. ICR,
headquartered in suburban Philadelphia, prepared this report using data obtained
from the SurveyMonkey site.
In total 123 members responded to the survey. Bases reflect those answering the
individual questions. Surveys were split as follows:
Total
N=72
Board Certification
ABFPRS 100%
ABOto 92%
ABPS 1%
Other 4%

6 © 2014 – ICR – Confidential
Methodology (cont.)
Reading Notes
The base sizes are noted for each question. In some cases, the base sizes are less
than the total (N=123 members) since some surgeons did not answer all questions.
Where percentages add to more than 100%, it is due to either a multiple response
question, or rounding to the nearest percent.
Where percentages add up to less than 100%, this is due to the exclusion of “don‟t
know” and “no answer.”
Projected totals are based on the total AAFPRS membership of 749 physicians.
Though the confidence intervals change by procedure, depending on the grouping‟s
sample size and the response variance, the overall survey portion of this research has
a standard error of +/- 8.8% at a 95% level of confidence.

I N T E R N A T I O N A L C O M M U N I C A T I O N S R E S E A R C H
Executive Summary

8 © 2014 – ICR – Confidential
Executive Summary
AAFPRS member surgeons report performing an average of 1067 facial cosmetic surgical,
cosmetic non-surgical, reconstructive and revision procedures per surgeon in 2013.
– Almost three-quarters (786) are made up by cosmetic non-surgical procedures. In 2013,
the most popular cosmetic surgical procedures were: rhinoplasty followed by facelifts,
blepharoplasty, septoplasty, and ablative skin resurfacing. The most common cosmetic
non-surgical procedures were Botox and hyaluronic acid.
– Among the total membership of 749 physicians in AAFPRS, this projects to a total of
799,168 procedures of which 588,964 were cosmetic non-surgical and 210,204 were
cosmetic surgical procedures.
– Very few performed eyebrow transplants, vampire facelifts, and lip augmentation
procedures in 2013.
Facelifts command the highest average fee per procedure ($7087, on average), followed
by: hair transplants ($6572), revision surgery ($6176), and rhinoplasty ($5151).
Projected to the total membership, this translates into over a billion dollars a year being
spent on cosmetic surgical, cosmetic non-surgical, reconstructive and revision procedures
in 2013 ($1,164,105,482) with the highest amounts being spent on facelifts ($209.7 million)
and rhinoplasty ($206.0 million).
On average, 59% of procedures performed by facial plastic surgeons are cosmetic vs.
reconstructive in nature.
Surgeons report that in 2013, less than 25% of their patients were dissatisfied with
previous rhinoplasty surgery from a different office and requested a revision rhinoplasty.

9 © 2014 – ICR – Confidential
Executive Summary (cont.)
Women continue to be the most likely candidates for facial plastic surgery – 81% of all
surgical procedures and non-surgical procedures are performed on women.
– The most common cosmetic surgical procedures undergone by women were: facelifts and
rhinoplasties (average of 37 procedures per surgeon each), ablative skin resurfacing (36) and
blepharoplasty (34).
– The most common non-surgical cosmetic procedures among women were: Botox (348
procedures in 2013), hyaluronic acid injections (187 procedures), superficial peels,
microdermabrasion (119 procedures), and non ablative resurfacing (106 procedures).
– Among male patients, the most common procedures were: Botox (55 procedures in 2013),
hyaluronic acid injections (41 procedures), hair transplants (22 procedures), and rhinoplasty
(21 procedures).
– More than two-thirds of women having procedures are mothers.
By age…
– In 2013, blepharoplasty, brow lift, Botox, facelift, filler injections and chemical peel procedures
were most often performed on patients between the ages of 35 and 60. Rhinoplasty was most
performed on those between the ages of 22 and 60.
– For both female and male patients under the age of 35, the most common procedure
performed was rhinoplasty (86% females; 90% males). Botox was next highest among women
(84%) and septoplasty among men (66%).
– In 2013, more than half of Facial Plastic Surgeons (58%) have seen an increase in cosmetic
surgery or injectables in those under age 30.
– Surgeons believe that children and teens are more likely to undergo plastic surgery as a result
of being bullied versus preventing bullying.

10 © 2014 – ICR – Confidential
Executive Summary (cont.)
Most patients get their information about plastic surgery online (60%), followed by
referrals from friends (53%). Most are concerned with the results of the surgery (73%)
followed by concerns over the cost and recovery time (71% each) when making their
decision to undergo facial plastic surgery.
In 2013, only 3% of surgeons have seen an increase in requests for celebrity procedures.
More than half of their patients (59%) ask for procedures by describing the area of
concern rather than requesting a specific procedure by name or asking for physician
advice.
According to these surgeons, the top trends seen in their offices in 2013 were: patients
being more educated about plastic surgery and more use of non-surgical procedures to
delay surgical procedures. Very few have seen a trend of twins seeking plastic surgery
however there has been an 8% increase in female family members (such as mother-
daughter or sister-sister) requesting procedures together. In addition, in 2013, husband-
wife relationships are the most frequent family members requesting procedures (31%).
Physicians believe lower costs followed by access to a specialty surgeon are reasons why
patients travel to small cities for plastic surgery.
Facial Plastic Surgeons are strongly opposed to online deals and discounts such as
Groupon. They site such a practice as cheapening the specialty, being inappropriate to
offer a procedure before patient screening, and a lack of training of non-medical staff to
perform discounted procedures.

11 © 2014 – ICR – Confidential
Executive Summary (cont.)
33% of surgeons have seen an increase in requests for plastic surgery as a result of
patients being more self aware of their looks because of social media. The top
procedures requested are rhinoplasty and Botox.
On average, 21% of male patients request plastic surgery as a result of their significant
other having received plastic surgery.
The top three areas of the face that receive the most injectables by physicians are the
forehead, cheek and lips.
Upcoming weddings are a popular time, especially for women to have procedures done.
– The most requested procedures by brides are Botox, hyaluronic acid, rhinoplasty,
blepharoplasty, chemical peels and facelifts.
In 2013, Facial Plastic Surgeons report they currently receive an average of 42% of their
revenue from insurance companies and they expect that to decrease to an average of 26% five
years from now.
About half of all procedures performed by these surgeons are in private offices.

12 © 2014 – ICR – Confidential
Executive Summary (cont.)
TRENDING COMPARISONS
There are some differences to note between 2013 and previous years, however they should be
considered with caution since base sizes are small.
Overall number of procedures in 2013 is somewhat higher compared to last year. Those showing
increases are hair transplants and all minimally invasive procedures for both genders, with the
exception of Botox, which showed an increase, driven by women.
– Facelifts, blepharoplasty and lip augmentation had the largest drops while all others remained relatively
flat.
Men had a significant decrease in Botox while the number of Botox procedures among women
increased compared to 2012.
There is a directional decrease from last year in surgeons having patients age 22-34 requesting filler
or fat injections, rhinoplasty and Botox in 2013.
Compared to 2012, most procedures have had either a slight decrease in average cost or remained
flat. The largest cost decreases are hair and eyebrow transplantations and lip augmentations. The
only procedures with slight average cost increases are Botox and hyaluronic acid procedures.
The top trends continue to be patients being more educated about plastic surgery and more use of
non-surgical cosmetic procedures to delay surgery. Patients continue to be most concerned about
results and are more likely to request a procedure by area of concern. However, cost and recovery
time showed significant increases for patient concerns. Requests for celebrity procedures continue
downward in 2013 and fewer procedures are cosmetic vs. reconstructive compared to 2012.

13 © 2014 – ICR – Confidential
Executive Summary (cont.)
TRENDING COMPARISONS (cont.)
Patients continue to get information online, including in online forums or chat rooms, with
significant increases in 2013 for referrals from friends and social media / celebrity
magazine influences.
Surgical procedures prior to weddings has decreased for all types since 2012 with the
exception of ablative skin resurfacing and hair transplants. The only minimally invasive
procedure showing an increase since 2012 is for chemical peels prior to weddings.
COMPARISONS TO 2009
Compared to 2009, the following show increases:
For the most part, the average number of procedures has declined or remained flat since 2009,
with the exception of rhinoplasty, which has increased among both genders, and Botox, which has
increased among women but decreased among men back to the level reported in 2011.
By gender, females had the largest increases since 2009 with:
Rhinoplasty
Ablative skin resurfacing
Hair transplants
Poly-L-Lactic Acid
Males were up from 2009 with:
Hair transplants

14 © 2014 – ICR – Confidential
Executive Summary (cont.)
COMPARISONS TO 2009 (continued)
A majority of the surgical procedures had decreases in costs compared to 2009. The largest
decreases were for ablative skin resurfacing, hair transplants and blepharoplasty. Only revision
surgery and scar revisions show an increase in costs since 2009.
Compared to 2009, among minimally invasive procedures, the only one that showed an
increase was fat injections. Poly-L Lactic acid and hyaluronic acid had decreases in costs since
2009.

I N T E R N A T I O N A L C O M M U N I C A T I O N S R E S E A R C H
Detailed Findings
16 © 2014 – ICR – Confidential
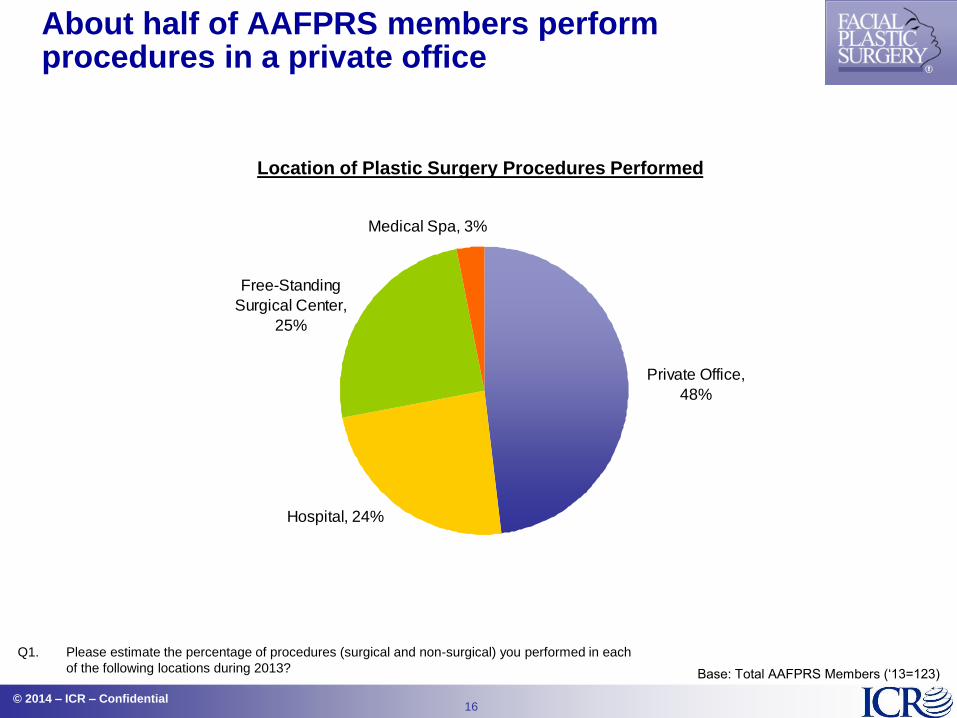
About half of AAFPRS members perform procedures in a private office
Q1. Please estimate the percentage of procedures (surgical and non-surgical) you performed in each
of the following locations during 2013? Base: Total AAFPRS Members („13=123)
Hospital, 24%
Private Office,
48%
Free-Standing
Surgical Center,
25%
Medical Spa, 3%
Location of Plastic Surgery Procedures Performed

17 © 2014 – ICR – Confidential
Surgical procedures performed the most in 2013 were rhinoplasties (average of 53) followed by facelifts (40), blepharoplasty (39), and septoplasties(38) -- Ablative skin resurfacing also averaged in the mid-thirties
Q3. Please estimate the number of procedures you performed in 2013.
(*Added in 2012; **Procedure name change in 2013)
Average Number of Surgical Procedures Performed Per Surgeon
Base: Total AAFPRS Members
( n=‟09=76; „10=114; „11=86;
„12=63; ‟13=99)
38
03
557
5
1519
16
4
33
39
53
4036
022
698
14
23
17
9
35
46
54
46
25
77
13
1916
24
31
38
53
31
36
97
15
20
4
36
49
5450
3
1215
2018
10
47
52
47
65
17
10
4
Septo
plas
ty*
Eyebr
ow T
rans
plan
ts*
Vampire
Fac
elifts*
Hair T
rans
plan
tatio
n
Oto
plas
ty
Chin
Augm
enta
tion
Facial Im
plan
ts**
Scar R
evision
Rev
isio
n Sur
gery
Fore
head
Lift
Lip
Aug
men
tatio
n
Ablat
ive
Skin
Res
urfa
cing
Bleph
arop
lasty
Rhino
plas
ty
Face
lifts
2013
2012
2011
2010
2009

18 © 2014 – ICR – Confidential
On average, 378 Botox procedures were performed by Facial Surgeons in 2013; with extremely few collagen procedures being performed in 2013
Average Number of Minimally Invasive Procedures Performed Per Surgeon
15297
32
197
378
121327
185
326
22260
61
206
355
16172
47
195
381
24
61
<1
385
1426
242
2013
2012
2011
2010
2009
Botox Hyaluronic
Acid Calcium
Hydroxyapetite** Collagen with
PMMA beads**
Poly-L-Lactic
Acid Fat Injections
Q3. Please estimate the number of procedures you performed in 2013.
(**Procedure name change in 2013) (2013- PMMA beads added to
Collagen and dropped from Calcium Hydroxyapetite)
Base: Total AAFPRS Members
( n=‟09=76; „10=114; „11=86;
„12=63; „13=99)
New to 2013
Non Ablative Resurfacing = 57
Superficial Peels, Microdermabrasion** = 70
19 © 2014 – ICR – Confidential
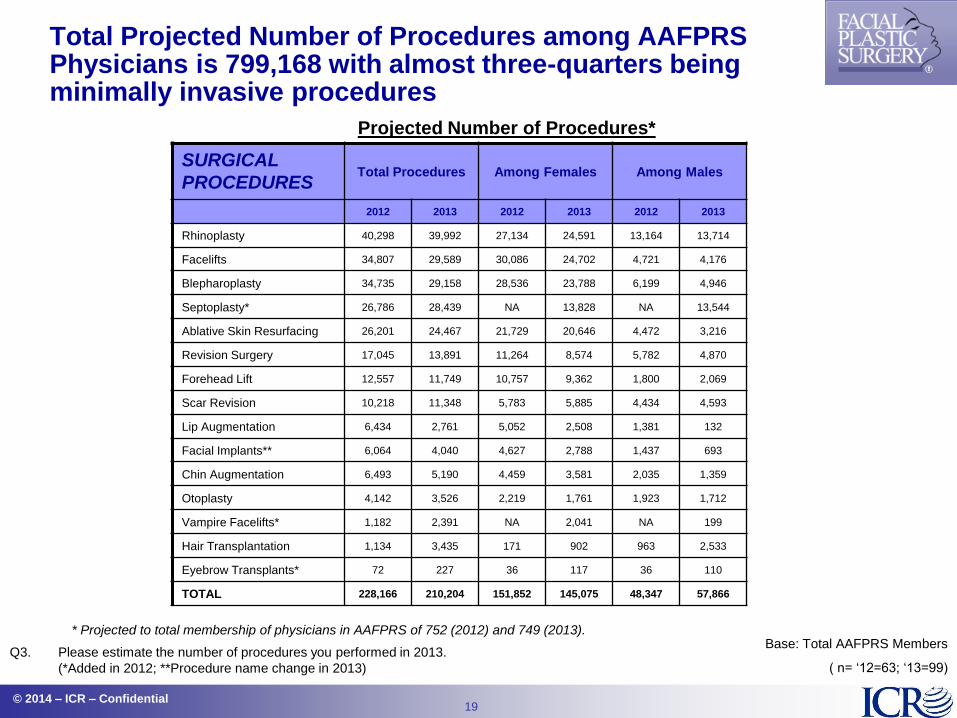
Total Projected Number of Procedures among AAFPRS Physicians is 799,168 with almost three-quarters being minimally invasive procedures
Projected Number of Procedures*
SURGICAL
PROCEDURES Total Procedures Among Females Among Males
2012 2013 2012 2013 2012 2013
Rhinoplasty 40,298 39,992 27,134 24,591 13,164 13,714
Facelifts 34,807 29,589 30,086 24,702 4,721 4,176
Blepharoplasty 34,735 29,158 28,536 23,788 6,199 4,946
Septoplasty* 26,786 28,439 NA 13,828 NA 13,544
Ablative Skin Resurfacing 26,201 24,467 21,729 20,646 4,472 3,216
Revision Surgery 17,045 13,891 11,264 8,574 5,782 4,870
Forehead Lift 12,557 11,749 10,757 9,362 1,800 2,069
Scar Revision 10,218 11,348 5,783 5,885 4,434 4,593
Lip Augmentation 6,434 2,761 5,052 2,508 1,381 132
Facial Implants** 6,064 4,040 4,627 2,788 1,437 693
Chin Augmentation 6,493 5,190 4,459 3,581 2,035 1,359
Otoplasty 4,142 3,526 2,219 1,761 1,923 1,712
Vampire Facelifts* 1,182 2,391 NA 2,041 NA 199
Hair Transplantation 1,134 3,435 171 902 963 2,533
Eyebrow Transplants* 72 227 36 117 36 110
TOTAL 228,166 210,204 151,852 145,075 48,347 57,866
Base: Total AAFPRS Members
( n= „12=63; „13=99)
* Projected to total membership of physicians in AAFPRS of 752 (2012) and 749 (2013).
Q3. Please estimate the number of procedures you performed in 2013.
(*Added in 2012; **Procedure name change in 2013)
20 © 2014 – ICR – Confidential
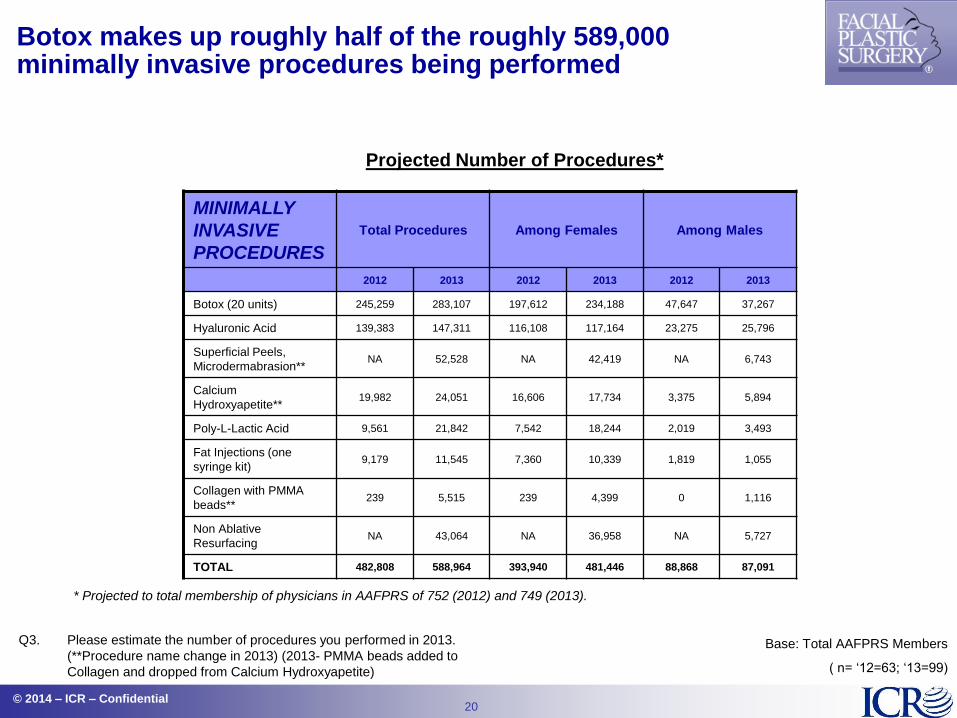
Botox makes up roughly half of the roughly 589,000 minimally invasive procedures being performed
Projected Number of Procedures*
MINIMALLY
INVASIVE
PROCEDURES
Total Procedures Among Females Among Males
2012 2013 2012 2013 2012 2013
Botox (20 units) 245,259 283,107 197,612 234,188 47,647 37,267
Hyaluronic Acid 139,383 147,311 116,108 117,164 23,275 25,796
Superficial Peels,
Microdermabrasion** NA 52,528 NA 42,419 NA 6,743
Calcium
Hydroxyapetite** 19,982 24,051 16,606 17,734 3,375 5,894
Poly-L-Lactic Acid 9,561 21,842 7,542 18,244 2,019 3,493
Fat Injections (one
syringe kit) 9,179 11,545 7,360 10,339 1,819 1,055
Collagen with PMMA
beads** 239 5,515 239 4,399 0 1,116
Non Ablative
Resurfacing NA 43,064 NA 36,958 NA 5,727
TOTAL 482,808 588,964 393,940 481,446 88,868 87,091
Base: Total AAFPRS Members
( n= „12=63; „13=99)
* Projected to total membership of physicians in AAFPRS of 752 (2012) and 749 (2013).
Q3. Please estimate the number of procedures you performed in 2013.
(**Procedure name change in 2013) (2013- PMMA beads added to
Collagen and dropped from Calcium Hydroxyapetite)

21 © 2014 – ICR – Confidential
2
8
36
1014
7
16
9
363734
37
2247
9
17
10
1714
373739
42
237
9
1412
1617
3436
3231
3489
14
8
18
10
34
42
48
1
711
1717
3130
42
59
41
13
3
9
Eye
brow T
rans
plan
ts*
Hair
Trans
plan
tatio
n
Oto
plas
ty
Chin
Aug
ment
atio
n
Sca
r Rev
ision
Revi
sion
Surge
ry
Facial Im
plan
ts**
Foreh
ead Lift
Lip
Aug
men
tatio
n
Ablat
ive
Skin
Resu
rfacing
Rhin
oplast
y
Bleph
aroplast
y
Facelifts
2013
2012
2011
2010
2009
On average in 2013, Surgeons performed 37 each of facelifts and rhinoplasties, 36 ablative skin resurfacings, and 34 blepharoplasties on women
Q4. Please estimate the percentage of your female patients versus male patients that received each of
the following procedures in 2013. (*Added in 2012; **Procedure name change in 2013)
Average Number of Surgical Procedures Performed Per Surgeon
-- Women --
Base: Total AAFPRS Members
( n=„09=67; „10=109; „11=86;
„12=63; ‟13=94)
NA NA
New to 2013
Vampire Facelifts = 30
Septoplasty = 23

22 © 2014 – ICR – Confidential
On men, Facial Surgeons performed 23 septoplasties, followed by 22 hair transplants and 21 rhinoplasties in 2013 on average
Average Number of Surgical Procedures Performed Per Surgeon
-- Men --
20
22
323268867
21
24
10
333389779
18
38
33326
965
8
20
0
13
33325
8710
21
025
996
131417
6 4 54
Eyebro
w Tra
nsplants*
Lip Augm
entation
Hair Tra
nsplantatio
n
Otoplasty
Chin Augmenta
tion
Forehead L
ift
Facial Implants
**
Ablative S
kin R
esurfa
cing
Revision S
urgery
Scar R
evision
Facelifts
Blepharopla
sty
Rhinoplasty
2013
2012
2011
2010
2009
Base: Total AAFPRS Members
( n=‟09=67; ‟10=112; „11=86;
„12=63; ‟13=94) Q4. Please estimate the percentage of your female patients versus male patients that received each of the
following procedures in 2013. (*Added in 2012; **Procedure name change in 2013)
NA NA
New to 2013
Vampire Facelifts = 3
Septoplasty = 23

23 © 2014 – ICR – Confidential
Facial Surgeons performed 348 Botox procedures on women in 2013 on average, followed by an average of 187 hyaluronic acid procedures
Average Number of Minimally Invasive Procedures Performed Per Surgeon
-- Women --
Base: Total AAFPRS Members
( n=‟09=67; ‟10=107; „11=86;
„12=63; „13=94)
22
535740
187
348
16321
37
177
296
33
0
49
80
204
321
237
3360
185
333
35
70
231
25 20
350
2013
2012
2011
2010
2009
Botox Hyaluronic
Acid Calcium
Hydroxyapetite**
Collagen with
PMMA beads**
Poly-L-Lactic
Acid
Fat Injections
Q4. Please estimate the percentage of your female patients versus your patients that received each of
the following procedures in 2013. (**Procedure name change in 2013) (2013- PMMA beads added
to Collagen and dropped from Calcium Hydroxyapetite)
New to 2013
Non Ablative Resurfacing = 106
Superficial Peels, Microdermabrasion** = 119

24 © 2014 – ICR – Confidential
13
21113
41
55
0467
35
71
089
16
28
56
155
9
30
63
3
14
64
2
16
41
2013
2012
2011
2010
2009
Among men, Facial Surgeons performed 55 Botox procedures on average in 2013, followed by an average of 41 hyaluronic acid procedures
Average Number of Minimally Invasive Procedures Performed Per Surgeon
-- Men --
Base: Total AAFPRS Members
( n=‟09=67; ‟10=107; „11=86;
„12=63; „13=94)
Botox Hyaluronic
Acid Calcium
Hydroxyapetite**
Collagen with
PMMA beads**
Poly-L-Lactic
Acid Fat Injections
Q4. Please estimate the percentage of your female patients versus your male patients that received each
of the following procedures in 2013. (**Procedure name change in 2013) (2013- PMMA beads added
to Collagen and dropped from Calcium Hydroxyapetite)
New to 2013
Non Ablative Resurfacing = 16
Superficial Peels, Microdermabrasion** = 19

25 © 2014 – ICR – Confidential
For all procedures asked about, except rhinoplasty, the majority were performed on patients between the ages of 35 and 60 -- Rhinoplasty was most performed on those between the ages of 22 and 60
Q8. Please estimate the percentage of patients by age group for each procedure you performed in 2013.
Average Percentage of Procedures Performed Per Surgeon By Age
%
Under 21
%
22 - 34
%
35 - 60
%
61+
2009 2010 2011 2012 2013 2009 2010 2011 2012 2013 2009 2010 2011 2012 2013 2009 2010 2011 2012 2013
Blepharoplasty 1% 2% 1% 0% 0% 10% 7% 6% 8% 6% 57% 60% 59% 61% 62% 32% 31% 34% 30% 31%
Botox 2% 2% 2% 1% 2% 24% 22% 22% 27% 21% 54% 58% 58% 54% 60% 20% 19% 18% 19% 18%
Browlift 1% 0% 0% 0% 0% 7% 4% 2% 3% 2% 60% 64% 58% 62% 65% 32% 32% 40% 35% 33%
Chemical Peels 4% 2% 3% 2% 2% 23% 17% 20% 20% 18% 46% 58% 50% 54% 57% 27% 22% 27% 23% 23%
Facelifts 0% 1% 0% 0% 0% 1% 1% 0% 1% 0% 57% 61% 55% 59% 61% 42% 37% 45% 40% 39%
Filler or Fat
injections* 3% 1% 2% 1% 2% 23% 19% 22% 23% 14% 52% 58% 55% 55% 58% 23% 22% 21% 21% 25%
Rhinoplasty 24% 20% 21% 20% 22% 40% 41% 43% 44% 37% 30% 32% 31% 31% 31% 6% 7% 5% 6% 10%
Base: Total AAFPRS Members
( n=‟09=73 ‟10=105; „11=75; „12=55; ‟13=39)

26 © 2014 – ICR – Confidential
Rhinoplasty is the top surgical procedure performed most often on both women and men under age 35 - Botox procedures are a close second among these females
Q6. Please indicate the TOP 5 procedures you performed most often on females under the age of 35 in 2013?
(wording change in 2013)
Q7. Please indicate the TOP 5 procedures you performed most often on males under the age of 35 in 2013?
(wording change in 2013 )
Procedures Performed Most Often
on Females Under Age 35
Base: Total AAFPRS Members
(n= „13=91)
0%1%
1%
2%
2%
3%
3%
5%
9%
9%
10%
10%
15%
16%
20%
24%
24%
25%
27%
46%
76%
84%
86%
Eyebrow Transplants
Collagen w/PMMA Beads
Vampire Facelifts/PRP Injections
Hair Transplantation
Facial Implants
Forehead Lift
Facelifts
Poly-L-Lactic Acid
Fat injections
Lip Augmentation
Calcium Hydroxyapetite
Ablative Skin Resurfacing
Otoplasty
Chin Augmentation
Blepharoplasty
Superfical peels, Microdermabrasion
Scar Revision
Non Ablative Resurfacing
Revision Surgery
Septoplasty
Hyaluronic Acid
Botox
Rhinoplasty
Procedures Performed Most Often
on Males Under Age 35
0%0%
1%
1%
1%
3%
4%
5%
8%
8%
8%
14%
14%
14%
21%
26%
27%
32%
44%
54%
57%
66%
90%
Vampire Facelifts/PRP Injections
Lip Augmentation
Collagen w/PMMA Beads
Eyebrow Transplants
Facelifts
Forehead Lift
Fat injections
Ablative Skin Resurfacing
Hair Transplantation
Facial Implants
Poly-L-Lactic Acid
Calcium Hydroxyapetite
Blepharoplasty
Superfical peels, Microdermabrasion
Non Ablative Resurfacing
Hyaluronic Acid
Chin Augmentation
Otoplasty
Revision Surgery
Scar Revision
Botox
Septoplasty
Rhinoplasty

27 © 2014 – ICR – Confidential
Again, in 2013, facelifts were the most expensive procedure followed by hair transplants, revision surgery, and rhinoplasty
Q5. Please estimate the average cost for each of the procedures you performed in
2013. (*Added in 2012; **Procedure name change in 2013; ***Added in 2013)
(2013- PMMA beads added to Collagen and dropped from Calcium
Hydroxyapetite)
Average Cost ($) Per Procedure
2009 2010 2011 2012 2013
Facelifts $7208 $8189 $7327 $7453 $7087
Hair Transplantation $7167 $6438 $5823 $7182 $6572
Revision Surgery $5675 $6520 $6444 $6542 $6176
Rhinoplasty $5283 $5446 $5223 $5541 $5151
Forehead Lift $3928 $4664 $3861 $3817 $3606
Blepharoplasty $3736 $3643 $3528 $3804 $3366
Ablative Skin
Resurfacing $3515 $2535 $2424 $2672 $2232
Otoplasty $3389 $3441 $3485 $3514 $3136
Facial Implants** NA NA NA NA $3004
Chin Augmentation $2338 $2567 $2526 $2404 $2419
Eyebrow Transplants* NA NA NA $4333 $3700
Vampire facelifts* NA NA NA NA $1356
Septoplasty* NA NA NA NA $1787
2009 2010 2011 2012 2013
Fat Injections $1844 $2643 $2499 $2707 $2277
Lip Augmentation $1656 $2122 $1681 $2216 $1635
Scar Revision $1289 $1479 $1395 $1700 $1450
Poly-L-Lactic Acid $1083 $960 $799 $923 $926
Hyaluronic Acid $841 $645 $603 $597 $631
Calcium Hydroxyapetite** $765 $704 $712 $751 $699
Collagen/ with PMMA
beads** NA NA NA NA $1200
Botox (20 units) $444 $326 $308 $300 $450
Superficial Peels,
Microdermabrasion** NA NA NA NA $183
Non Ablative Resurfacing*** NA NA NA NA $778
Base: Total AAFPRS Members
(n=‟09=66; „10=105 ; „11=91; „12=60; ‟13=89)

28 © 2014 – ICR – Confidential
Total Projected Dollars spent on procedures among AAFPRS member physicians is $1,164,105,482 with the highest amounts being spent on facelifts and rhinoplasty
Q5. Please estimate the average cost for each of the procedures you performed in
2013. (*Added in 2012; **Procedure name change in 2013. ****Added in 2013)
Projected Dollars Spent***
Total # of
Procedures
Average Amount
per Procedure
Projected Total Dollars Spent on
Procedure among Members
2012 2013 2012 2013 2012 2013
Facelifts 34,807 29,589 $7453 $7087 $259,402,683 $209,697,134
Hair Transplantation 1,134 3,435 $7182 $6572 $8,143,954 $22,572,823
Revision Surgery 17,045 13,891 $6542 $6176 $111,513,244 $85,784,119
Rhinoplasty 40,298 39,992 $5541 $5151 $223,304,568 $205,987,944
Forehead Lift 12,557 11,749 $3817 $3606 $47,936,543 $42,373,605
Blepharoplasty 34,735 29,158 $3804 $3366 $132,136,378 $98,134,234
Ablative Skin
Resurfacing 26,201 24,467 $2672 $2232 $69,994,996 $54,622,972
Otoplasty 4,142 3,526 $3514 $3136 $14,553,739 $11,057,707
Facial Implants** 6,064 4,040 $2977 $3004 $18,049,119 $12,135,550
Chin Augmentation 6,493 5,190 $2404 $2419 $15,607,496 $12,554,988
Eyebrow Transplants* 72 227 $4333 $3700 $310,349 $839,788
Vampire facelifts* 1,182 2,391 NA $1356 NA $3,242,451
Septoplasty* 26,786 28,439 NA $1787 NA $50,830,514
Base: Total AAFPRS Members (n=„12=60; „13=89)
*** Projected to total membership of physicians in AAFPRS of 752 (2012 and 749 (2013).
29 © 2014 – ICR – Confidential
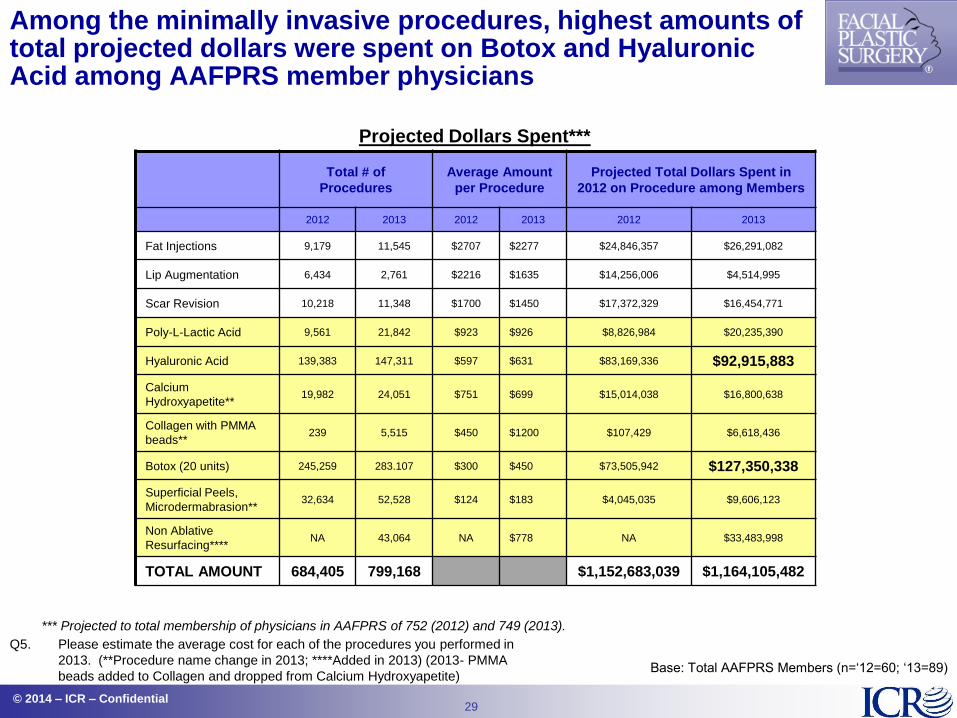
Among the minimally invasive procedures, highest amounts of total projected dollars were spent on Botox and Hyaluronic Acid among AAFPRS member physicians
Q5. Please estimate the average cost for each of the procedures you performed in
2013. (**Procedure name change in 2013; ****Added in 2013) (2013- PMMA
beads added to Collagen and dropped from Calcium Hydroxyapetite)
Projected Dollars Spent***
Total # of
Procedures
Average Amount
per Procedure
Projected Total Dollars Spent in
2012 on Procedure among Members
2012 2013 2012 2013 2012 2013
Fat Injections 9,179 11,545 $2707 $2277 $24,846,357 $26,291,082
Lip Augmentation 6,434 2,761 $2216 $1635 $14,256,006 $4,514,995
Scar Revision 10,218 11,348 $1700 $1450 $17,372,329 $16,454,771
Poly-L-Lactic Acid 9,561 21,842 $923 $926 $8,826,984 $20,235,390
Hyaluronic Acid 139,383 147,311 $597 $631 $83,169,336 $92,915,883
Calcium
Hydroxyapetite** 19,982 24,051 $751 $699 $15,014,038 $16,800,638
Collagen with PMMA
beads** 239 5,515 $450 $1200 $107,429 $6,618,436
Botox (20 units) 245,259 283.107 $300 $450 $73,505,942 $127,350,338
Superficial Peels,
Microdermabrasion** 32,634 52,528 $124 $183 $4,045,035 $9,606,123
Non Ablative
Resurfacing**** NA 43,064 NA $778 NA $33,483,998
TOTAL AMOUNT 684,405 799,168 $1,152,683,039 $1,164,105,482
Base: Total AAFPRS Members (n=„12=60; „13=89)
*** Projected to total membership of physicians in AAFPRS of 752 (2012) and 749 (2013).

30 © 2014 – ICR – Confidential
Patients being more educated about plastic surgery and having more use of non-surgical cosmetic procedures to delay surgical procedures continue to top the list of trends seen in 2013
Q10. Please check the top 5 areas that you consider to be rising trends. Base: Total AAFPRS Members („13=71)
Rising Trends in Practice % Top 5
Patients are more educated about plastic surgery 44%
Non-surgical cosmetic procedures to delay surgical procedures 39%
More women under 35 looking after their skin to prevent visible
signs of aging for longer 34%
People getting plastic surgery to remain competitive in the
workforce 28%
More younger men under 35 seeking rhinoplasty, neck
liposuction, chin implants, acne scar reduction procedures 23%
Women and men are considering cosmetic facial surgery after
separation, divorce or loss of a spouse/partner 23%
Teens seeking rhinoplasty at a younger age (cosmetic, not
reconstructive) 21%
Patients having an injectable or laser treatment on a Daily Deal
site 21%
Patients traveling abroad to undergo cosmetic surgery and then
coming into your practice with complications 20%
Women requesting cosmetic procedures for their wedding or
other milestone event 20%
People requesting cosmetic surgery to remain attractive to
partner/spouse 18%
Women having fewer browlifts due to BOTOX, Dysport and
Xeomin usage increasing 18%
More facial plastic surgeons adding anti-aging and regenerative
medicine into their practices 15%
Rising Trends in Practice % Top 5
Patients opt to undergo procedures during colder months 13%
People seeking cosmetic procedures to look better in selfies,
Instagrams and other social media sites 13%
People wanting plastic surgery due to dissatisfaction with their
image as displayed on social media sites 13%
Increase in facelifts and necklifts among massive weight loss
patients who have undergone lapband or gastric bypass
procedures
13%
People seeing plastic surgery as an extension of personal
care/hygiene 11%
Cheekbones are back with the advent of newly FDA cleared
Juvederm Voluma for cheek enhancement and volume
restoration
10%
Increase among women of color in facial rejuvenation
procedures (fillers, BOTOX, IPL, etc.) 8%
Plastic surgery as a gift 7%
A rise in requests for facial gender transformations for patients
who have undergone transgender procedures 7%
Teens undergoing cosmetic surgery (not reconstructive) 6%
Mothers/Daughters undergoing facial plastic surgery together 4%
Couples undergoing plastic surgery together 3%
People taking plastic surgery vacations 1%
31 © 2014 – ICR – Confidential
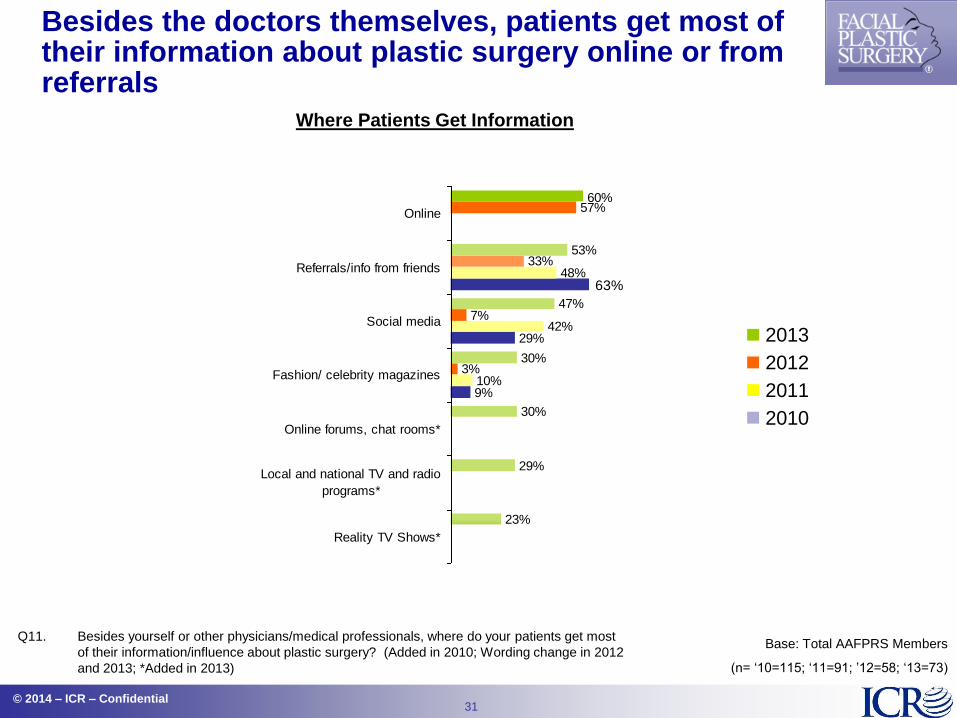
Besides the doctors themselves, patients get most of their information about plastic surgery online or from referrals
Q11. Besides yourself or other physicians/medical professionals, where do your patients get most
of their information/influence about plastic surgery? (Added in 2010; Wording change in 2012
and 2013; *Added in 2013)
9%
29%
10%
42%
48%
3%
7%
33%
57%
23%
29%
30%
30%
47%
53%
63%
60%
Reality TV Shows*
Local and national TV and radio
programs*
Online forums, chat rooms*
Fashion/ celebrity magazines
Social media
Referrals/info from friends
Online
2013
2012
2011
2010
Where Patients Get Information
Base: Total AAFPRS Members
(n= „10=115; „11=91; ‟12=58; „13=73)

32 © 2014 – ICR – Confidential
Patients are most concerned over the results closely followed by concern for the cost and recovery time of facial plastic surgery -- The least concern is shown for social stigma
Q12. What do you feel patients are most concerned about when making a decision to undergo
facial plastic surgery? (Added in 2010; *Wording change in 2013; **Added in 2013)
Patients Concerns
Base: Total AAFPRS Members
(n= „10=115; „11=91; „12=58; „13 n=73)
1%
3%
19%
40%
1%
1%
26%
31%
41%
2%
5%
0%
21%
33%
40%
25%
15%
30%
71%
71%
73%
37%
1%Other
Visible scars**
Social stigma*
Pain/Invasiveness
Recovery time
Cost
Results
2010 2011 2012 2013
33 © 2014 – ICR – Confidential
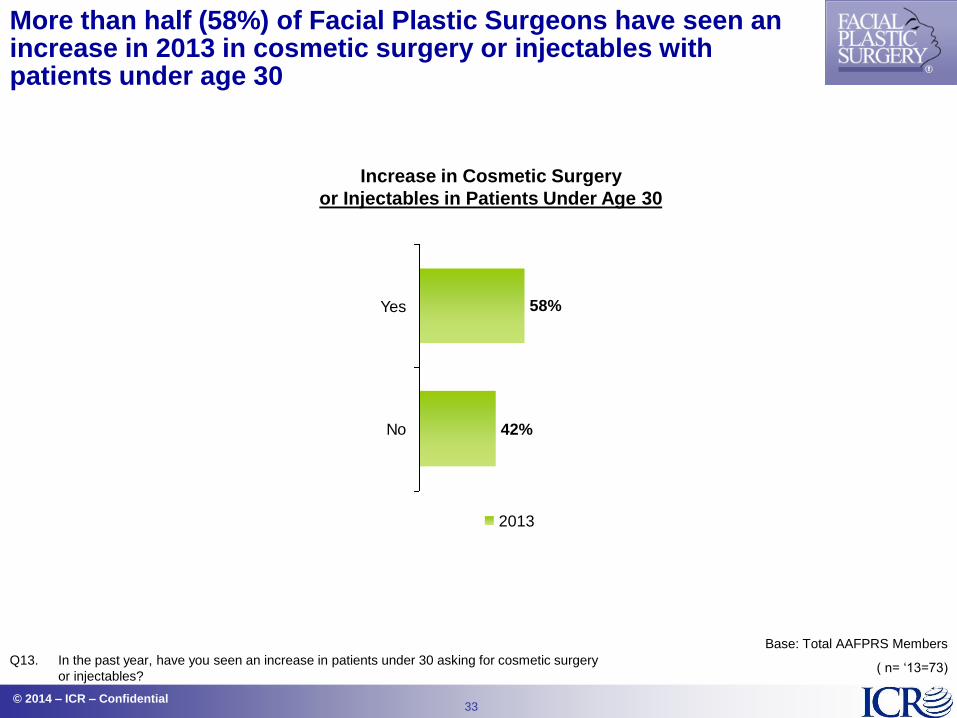
More than half (58%) of Facial Plastic Surgeons have seen an increase in 2013 in cosmetic surgery or injectables with patients under age 30
Base: Total AAFPRS Members
( n= „13=73) Q13. In the past year, have you seen an increase in patients under 30 asking for cosmetic surgery
or injectables?
Increase in Cosmetic Surgery
or Injectables in Patients Under Age 30
42%
58%
No
Yes
2013

34 © 2014 – ICR – Confidential
Only 3% of Facial Plastic Surgeons have seen an increase in requests for celebrity procedures in 2013 -- These requests appear to be on the decline
Base: Total AAFPRS Members
( n= „11=91; „12=58‟ „13=71)
Q14. In the past year, have you seen an increase in requests for “celebrity procedures?”
(i.e. Megan Fox‟s eyebrows, Angelina Jolie‟s lips, Brad Pitt‟s nose, etc.) (Added in
2011; Wording change in 2013)
Increase in Requests for “Celebrity Procedures”
86%
14%
93%
7%
97%
3%
No
Yes
2011 2012 2013
35 © 2014 – ICR – Confidential
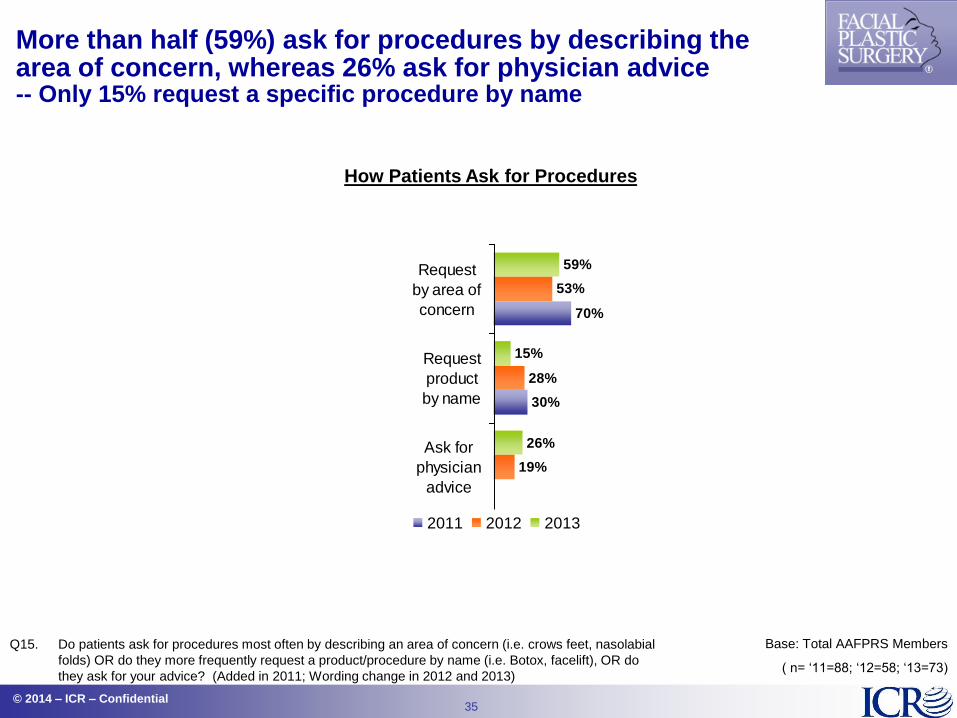
More than half (59%) ask for procedures by describing the area of concern, whereas 26% ask for physician advice -- Only 15% request a specific procedure by name
Base: Total AAFPRS Members
( n= „11=88; „12=58; „13=73)
Q15. Do patients ask for procedures most often by describing an area of concern (i.e. crows feet, nasolabial
folds) OR do they more frequently request a product/procedure by name (i.e. Botox, facelift), OR do
they ask for your advice? (Added in 2011; Wording change in 2012 and 2013)
How Patients Ask for Procedures
30%
70%
19%
28%
53%
26%
15%
59%
Ask for
physician
advice
Request
product
by name
Request
by area of
concern
2011 2012 2013

36 © 2014 – ICR – Confidential
On average, 59% of procedures are cosmetic vs. reconstructive – lower than that reported in 2012
Base: Total AAFPRS Members
( n= „11=90; „12=58; „13=73) Q16. What percentage of your procedures are cosmetic vs. reconstructive?
(Added in 2011; Change in 2013 different percentage ranges)
2011 2012
0-10% 4% 3%
11-20% 6% 2%
21-30% 7% 3%
31-40% 9% 5%
41-50% 7% 3%
51-60% 13% 7%
61-70% 7% 10%
71-80% 13% 21%
81-90% 11% 12%
91-100% 23% 33%
Cosmetic vs. Reconstructive
AVERAGE
2013 = 59%
2012 = 73%
2011 = 62%
2013
<25% 15%
26-49% 26%
50-75% 16%
76%+ 43%

37 © 2014 – ICR – Confidential
Very few (6%) Facial Plastic Surgeons have seen a trend of twins seeking plastic surgery to enhance their similarities -- Among these sets of twins, the age for procedures is typically between 22 and 34 years of age
Base: Total AAFPRS Members
( n= „12=59; „13=72)
Q18. Have you seen a trend in identical twins seeking plastic surgery to enhance their
similarities? If so, what procedures are most requested? (New in 2012)
Q19. If seen, what is the most common age for identical twins to undergo surgery to
maintain/enhance their similar appearance? (New in 2012; Wording change in 2013)
Twins Seeking Plastic Surgery
95%
5%
94%
6%
No
Yes2013
2012
Age for Twins to Undergo Surgery
To Look Similar
2012 2013
See any Twins for
this type of
procedure 12% 6%
(Base:) 7 4
Under 21 29% 0%
22-34 14% 75%
35-60 14% 25%
61 and older 14% 0%

38 © 2014 – ICR – Confidential
0%
0%
0%
2%
2%
2%
12%
16%
1%
20%
31%
0%
3%
0%
1%
0%
20%
24%
Other
Couples*
Husband-Wife*
Brother-Brother
Sister-Brother
Father-Daughter
Mother-Son
Father-Son
Sister-Sister
Mother-Daughter
2013
2012
Seen an Increase in Number of Procedures
Among Family Relationships
Husband - Wife relationships are the most frequent family relationships requesting procedures to bond or look more similar in 2013, followed by Mother-Daughter, Sisters and Couples at similar levels
Q20. In the past year, have you seen an increase in procedures in any of the following family
relationships? If so, please estimate the number of procedures in 2013. (New in 2012;
*Added in 2013)
Base: Total AAFPRS Members
(n= „12=58; „13=71)
Average Number
2012 2013
12 6
16 9
4 0
3 5
5 0
0 7
0 0
NA 8
NA 9
0 6
Among those seeing an increase:

39 © 2014 – ICR – Confidential
For the most part, facial plastic surgeons are seeing less than 25% on average of both male and female rhinoplasty patients who are dissatisfied and seeking revisions
Base: Total AAFPRS Members
( n= 2013=67)
Q21. Please estimate the percentage of patients you saw in 2013 that are dissatisfied with a
previous rhinoplasty surgery from a different office and were seeking a revision
rhinoplasty. (Wording change in 2013)
Average Number of Dissatisfied Patients
Who Seek Revision Rhinoplasty
3%
27%
70%
7%
30%
63%
50%+
26-50%
0-25%
Women
Men

40 © 2014 – ICR – Confidential
More than half of Facial Plastic Surgeons say patients travel to small cities for plastic surgery for lower costs while one-quarter want access to a specialty surgeon
0%14%
27%
59%
6%13%25%
56%
Don't knowPrivacyAccess to a
specialty surgeon
Lower costs
2013
2012
Base: Total AAFPRS Members
(n= „12=52; „13=64) Q22. In your opinion, what is the top reason patients travel to small cities instead of big cities
for plastic surgery trips? (New in 2012)
Reasons Patients Travel to Small Cities
For Plastic Surgery

41 © 2014 – ICR – Confidential
More than two-thirds of female patients are mothers
Q23. Please estimate the percentage of female patients undergoing facial plastic surgery who
are mothers versus women without children. (New in 2012)
Female Patients Undergoing
Facial Plastic Surgery
33%
67%
30%
70%
Women
without
children
Mothers
2013
2012
Base: Total AAFPRS Members
(n= „12=46; ‟13=62)

42 © 2014 – ICR – Confidential
The vast majority (96%) of Facial Plastic Surgeons are against online deals such as those offered by Groupon -- The primary reason against is that it cheapens the field of facial plastic surgery, followed by inadequate patient screening and a lack of training of non-medical staff to perform discounted procedures
Base: Total AAFPRS Members ( n= „13=71) Q25. Are you against the use of online deals or discounts for facial plastic surgery
(such as Groupon)? If yes, explain why. (Wording change in 2013)
Against Online Deals and Discounts
(n=68)
4%
96%
No
Yes
26%
28%
43%
49%
76%
It is unethical and could be
considered fee-splitting
It is okay for non-surgical
treatments but should not be
offered for surgical procedures
Discounted procedures are often
performed by non-medical staff or
staff who may not be sufficiently
trained to keep costs down
It often lures patients into clinics
to have procedures done without
adequate screening
It cheapens the field of facial
plastic surgery and AAFPRS
members should refrain from
working with these sites

43 © 2014 – ICR – Confidential
More than two-thirds of Facial Plastic Surgeons believe children and teens undergoing plastic surgery are likely to have it done as a result of being bullied vs. to prevent being bullied
Base: Total AAFPRS Members
( n= „12=50; ‟13=61) Q26. Do you feel children and teens are more likely to undergo plastic surgery to
prevent bullying OR as a result of bullying? (New in 2012)
Children and Teens
Undergo Plastic Survey
24%
76%
31%
69%
To
prevent
bullying
As a
result of
bullying
2012 2013

44 © 2014 – ICR – Confidential
Base: Total AAFPRS Members
( n= „12=58; ‟13=69)
Q27. Have you seen an increase in requests for plastic surgery stemming from people being
more self aware of their looks because of social media? If so, estimate the percentage of
requests for each procedure. (New in 2012; **Procedure name change in 2013)
Requests for Plastic Surgery Due to Being More Self Aware of Looks in Social Media
See an Increase in Requests Average % of Requests
2012 2013 2012 2013
Any Requests 31% 33%
Rhinoplasty 22% 28% 27% 37%
Botox 19% 20% 31% 27%
Facelifts 17% 16% 25% 20%
Blepharoplasty 16% 13% 14% 20%
Chin Augmentation 12% 13% 14% 12%
Lip Augmentation 10% 4% 28% 8%
Otoplasty 7% 9% 13% 13%
Facial Implants** NA 1% NA 5%
Forehead Lift 5% 4% 7% 17%
Scar Revision 5% 4% 7% 10%
Hair Transplantation 3% 3% 11% 18%
Eyebrow Transplants 2% 0% 1% 0%
As in 2012, one in three Facial Plastic Surgeons have seen an increase in requests for surgery due to being more self aware of looks in social media with rhinoplasty and Botox being the most requested in 2013

45 © 2014 – ICR – Confidential
On average 21% of men requesting facial plastic surgery do so because their significant other had also received plastic surgery
Base: Total AAFPRS Members
(n= „12=54; ‟13=63) Q28. Estimate the percentage of men who choose to enhance their looks and undergo facial
plastic surgery as a result of their significant other receiving plastic surgery. (New in 2012)
Men Choosing Facial Plastic Surgery
Since Significant Other Had Procedure Done
2%
0%
6%
0%
13%
20%
24%
35%
2%
2%
2%
5%
6%
27%
29%
27%
71-80%
61-70%
51-60%
41-50%
31-40%
21-30%
11-20%
0-10%
2013
2012
AVERAGE
2012=20%
2013=21%
46 © 2014 – ICR – Confidential
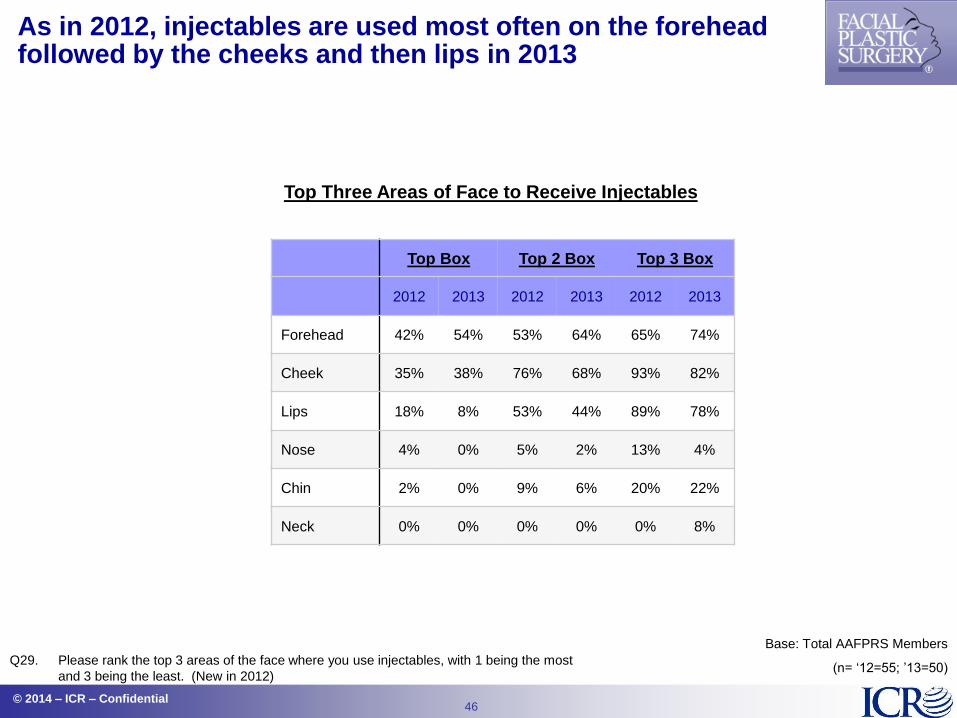
As in 2012, injectables are used most often on the forehead followed by the cheeks and then lips in 2013
Base: Total AAFPRS Members
(n= „12=55; ‟13=50) Q29. Please rank the top 3 areas of the face where you use injectables, with 1 being the most
and 3 being the least. (New in 2012)
Top Three Areas of Face to Receive Injectables
Top Box Top 2 Box Top 3 Box
2012 2013 2012 2013 2012 2013
Forehead 42% 54% 53% 64% 65% 74%
Cheek 35% 38% 76% 68% 93% 82%
Lips 18% 8% 53% 44% 89% 78%
Nose 4% 0% 5% 2% 13% 4%
Chin 2% 0% 9% 6% 20% 22%
Neck 0% 0% 0% 0% 0% 8%

47 © 2014 – ICR – Confidential
As in 2012, rhinoplasty, blepharoplasty and facelifts are the most requested surgical procedures in 2013 prior to a woman’s wedding
Base: Total AAFPRS Members
(n= „12=52; ‟13=63) Q30. What are the most popular procedures requested by women in preparation for a wedding?
(New in 2012; **Procedure name change in 2013)
Popular Surgical Procedures before Wedding
3%2%0%0%0%
6%3%
5%
14%
6%
27%
37%40%
0%4%4%4%
6%8%8%
10%13%13%
42%
48%50%
Hair T
rans
plan
tatio
n
Oto
plas
ty
Eyebr
ow T
rans
plan
ts
Facial Im
plan
ts**
Scar R
evision
Fore
head
Lift
Chin
Augm
enta
tion
Rev
isio
n Sur
gery
Ablat
ive
Skin
Res
urfa
cing
Lip
Aug
men
tatio
n
Face
lifts
Bleph
arop
lasty
Rhino
plas
ty
2013
2012
48 © 2014 – ICR – Confidential
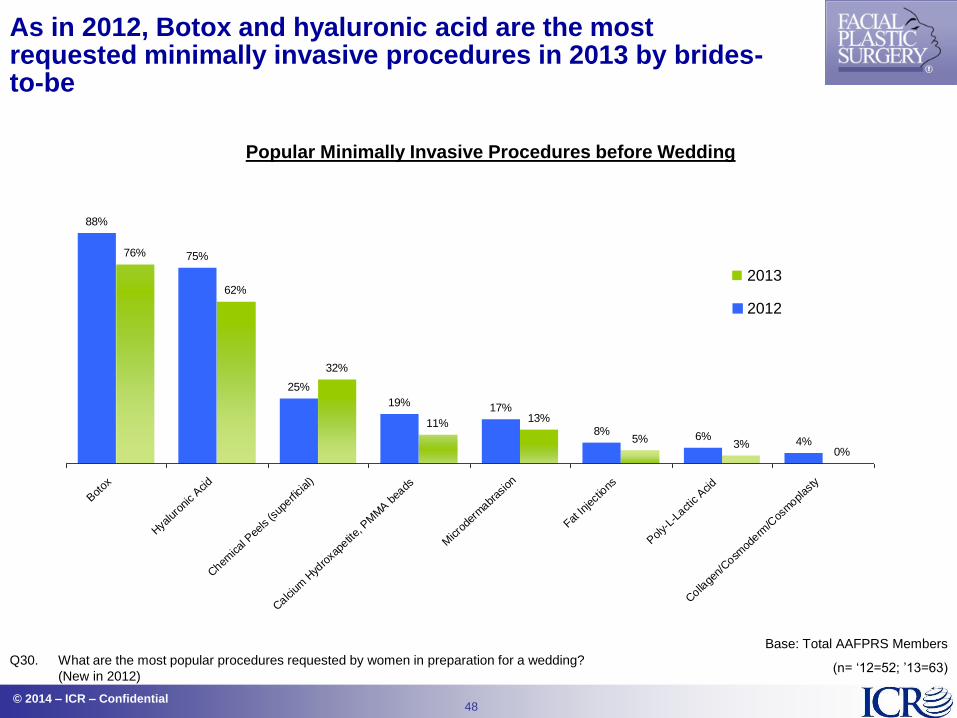
As in 2012, Botox and hyaluronic acid are the most requested minimally invasive procedures in 2013 by brides-to-be
Base: Total AAFPRS Members
(n= „12=52; ‟13=63) Q30. What are the most popular procedures requested by women in preparation for a wedding?
(New in 2012)
Popular Minimally Invasive Procedures before Wedding
0%3%5%
13%11%
32%
62%
76%
4%6%8%
17%19%
25%
75%
88%
Colla
gen/
Cosm
oderm
/Cos
mopl
asty
Pol
y-L-
Lact
ic A
cid
Fat In
ject
ions
Micro
derm
abras
ion
Calc
ium
Hyd
roxa
petit
e, P
MM
A b
eads
Chem
ical
Pee
ls (s
uperfi
cial
)
Hya
luro
nic
Acid
Bot
ox
2013
2012

49 © 2014 – ICR – Confidential
Q31. What percentage of your revenue comes from insurance? (New in 2013)
Q32. Five years from now, in 2019, what percentage of your revenue do you expect will come
from insurance? (New in 2013)
Current 5 Years from
Now
(n=68) (n=67)
0% 12% 28%
1-25% 28% 28%
26-50% 19% 26%
51-75% 21% 12%
76-99% 20% 6%
100% 0% 0%
Average % 42% 26%
Revenue from Insurance
Currently Facial Plastic Surgeons receive an average of 42% of revenue from insurance companies, which is expected to decrease to an average of 26% five years from now