Index 2012 Volume 18 Index 2012.pdf · Melliand International 2012 Index 2012
Upload
satoriwatersflCategory
view
4download
0
COMMONWEALTH OF KENTUCKY
JUSTICE & PUBLIC SAFETY CABINET
2012 Overdose Fatality Report
KENTUCKY OFFICE OF DRUG CONTROL POLICY
J. Michael Brown, Secretary
Justice & Public Safety Cabinet
Van Ingram, Executive Director
Office of Drug Control Policy
2 | P a g e
Table of Contents
Introduction …………………………………………………………………………..Page 3
Overdose Deaths by County ………………………………………………………Page 6
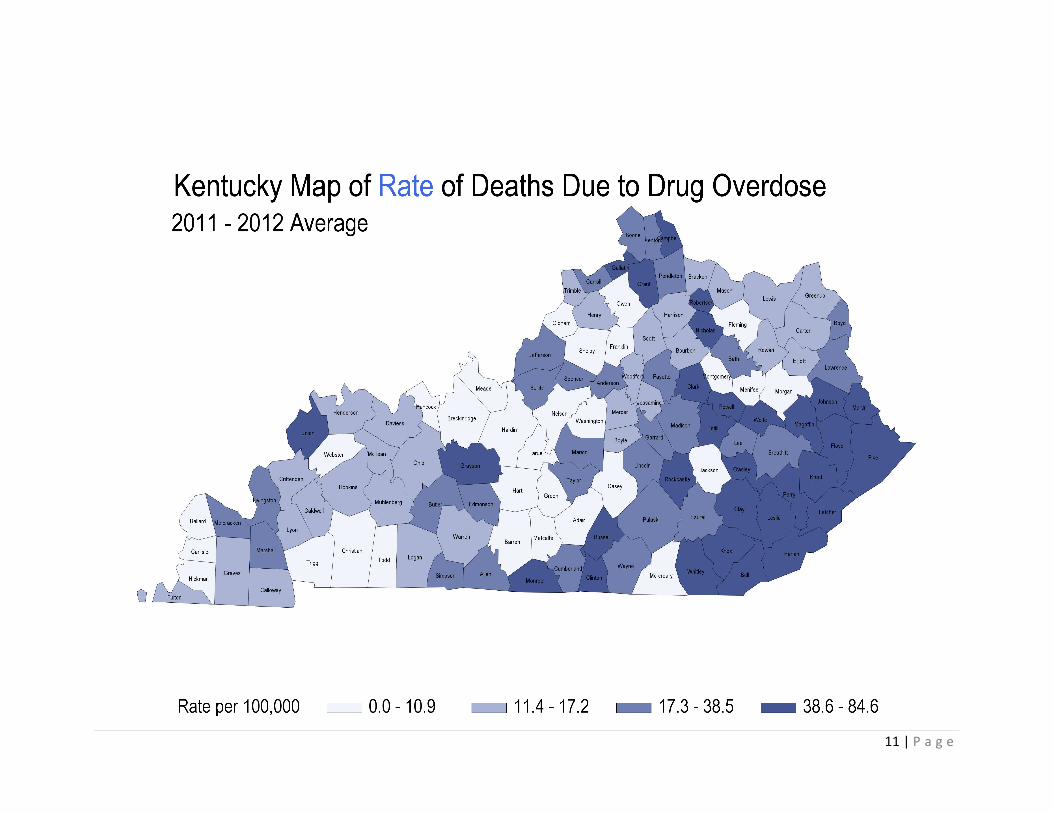
Kentucky Rate of Deaths Due to Drug Overdose by County (map)……….Page 11
2012 Medical Examiner Report:
Statewide Accidents by Major Causes of Death ………………………………Page 12
Statewide Drugs Most Frequently Detected
in the Blood of Overdose Victims…………………………………………………Page 13
Statewide Overdose Deaths by Age, Race, Gender, County
And Drugs Involved ………………………………………………………………...Page 14
3 | P a g e
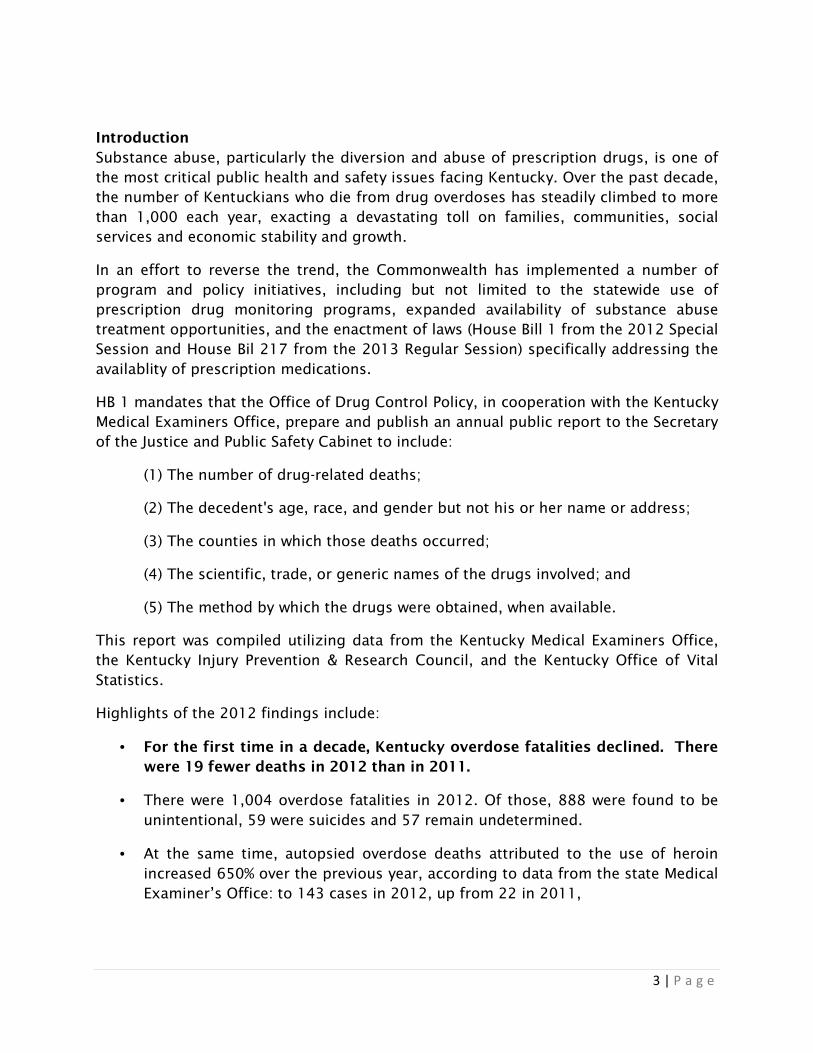
Introduction
Substance abuse, particularly the diversion and abuse of prescription drugs, is one of
the most critical public health and safety issues facing Kentucky. Over the past decade,
the number of Kentuckians who die from drug overdoses has steadily climbed to more
than 1,000 each year, exacting a devastating toll on families, communities, social
services and economic stability and growth.
In an effort to reverse the trend, the Commonwealth has implemented a number of
program and policy initiatives, including but not limited to the statewide use of
prescription drug monitoring programs, expanded availability of substance abuse
treatment opportunities, and the enactment of laws (House Bill 1 from the 2012 Special
Session and House Bil 217 from the 2013 Regular Session) specifically addressing the
availablity of prescription medications.
HB 1 mandates that the Office of Drug Control Policy, in cooperation with the Kentucky
Medical Examiners Office, prepare and publish an annual public report to the Secretary
of the Justice and Public Safety Cabinet to include:
(1) The number of drug-related deaths;
(2) The decedent's age, race, and gender but not his or her name or address;
(3) The counties in which those deaths occurred;
(4) The scientific, trade, or generic names of the drugs involved; and
(5) The method by which the drugs were obtained, when available.
This report was compiled utilizing data from the Kentucky Medical Examiners Office,
the Kentucky Injury Prevention & Research Council, and the Kentucky Office of Vital
Statistics.
Highlights of the 2012 findings include:
• For the first time in a decade, Kentucky overdose fatalities declined. There
were 19 fewer deaths in 2012 than in 2011.
• There were 1,004 overdose fatalities in 2012. Of those, 888 were found to be
unintentional, 59 were suicides and 57 remain undetermined.
• At the same time, autopsied overdose deaths attributed to the use of heroin
increased 650% over the previous year, according to data from the state Medical
Examiner’s Office: to 143 cases in 2012, up from 22 in 2011,

4 | P a g e
• In 2012, overdose deaths attributed to the use of heroin accounted for 19.56%
of all Kentucky Medical Examiner drug overdose cases. In 2011, that
percentage was 3.22%.
• Jefferson County had the most overdose deaths of any county, with 167.
• The largest increase in overdose fatalities occurred in Campbell County, with 25
deaths in 2011 compared to 54 in 2012.
• The largest decrease occurred in Floyd County, with 23 fewer fatalities in 2012
than 2011 (14 versus 37, respectively). Other counties with significant declines
in 2012 include Clay (17 fewer), Knox (12 fewer), and Johnson (11 fewer).
• Overdose deaths in many Eastern Kentucky counties, when compared by
100,000 population, combined 2011 and 2012 data, showed high rates. The
top 10 counties by overdose deaths per 100,000 people for 2011 and 2012
combined are:
Leslie County 85 per 100,000
Clinton County 78 per 100,000
Clay County 76 per 100,000
Estill County 69 per 100,000
Floyd County 65 per 100,000
Nicholas County 64 per 100,000
Perry County 63 per 100,000
Letcher County 62 per 100,000
Knott County 59 per 100,000
Johnson County 58 per 100,000
A review of cases autopsied by the Kentucky Medical Examiner’s Office indicates that in
2012:
• Alprazolam remained the most detected controlled substance in overdose
deaths, present in 41.44% of all autopsied cases.
• Morphine was next at 32.01%, followed by hydrocodone 25.99%, Oxycodone
24.21%, Heroin at 19.56%, and Oxymorphone at 17.51%. It should be noted that
many of the cases with morphine detected may in fact involve heroin, as
5 | P a g e
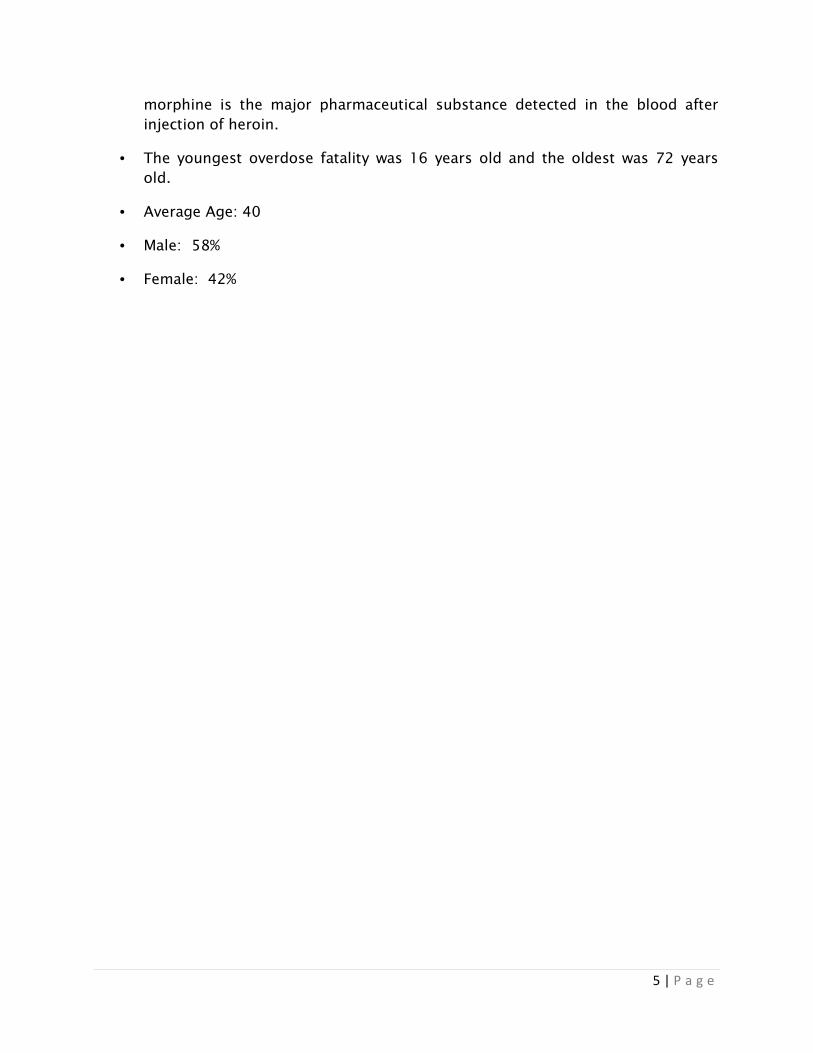
morphine is the major pharmaceutical substance detected in the blood after
injection of heroin.
• The youngest overdose fatality was 16 years old and the oldest was 72 years
old.
• Average Age: 40
• Male: 58%
• Female: 42%

6 | P a g e
Overdose Deaths by County
The following chart lists the number of drug overdose deaths by county for 2011 and
2012, as well as the rate of overdose deaths per 100,000 persons for both years
combined.
Information provided by the Kentucky Injury Prevention & Research Council and the
Kentucky Office of Vital Statistics
*Please note: The Office of Vital Statistics does not report an exact number if county
deaths are less than 5 persons.
KY County
of
residence
Number of deaths due to
drug overdose
Rate of drug
overdose
deaths per 100,000
population 2011-
2012
2011 2012 All All
Adair * * * 11
Allen * * 7 17
Anderson 6 * 10 23
Ballard * 0 * 6
Barren * * 8 9
Bath 6 * 7 30
Bell 17 11 28 49
Boone 19 29 48 20
Bourbon * * 5 13
Boyd 10 10 20 20
Boyle 5 * 8 14
Bracken * 0 * 12
Breathitt * 7 9 33
Breckinridge * * * 10
Bullitt 14 22 36 24
Butler * * 7 27
Caldwell * * * 15
Calloway 5 5 10 13
Campbell 25 54 79 43
Carlisle 0 0 0 0
Carroll * * 7 32
Carter 5 * 7 13

7 | P a g e
KY County
of
residence
Number of deaths due to
drug overdose
Rate of drug
overdose
deaths per 100,000
population 2011-
2012
2011 2012 All All
Casey * * * 9
Christian 5 5 10 7
Clark 13 18 31 43
Clay 25 8 33 76
Clinton 6 10 16 78
Crittenden * * * 16
Cumberland * * * 29
Daviess 10 13 23 12
Edmonson * * 6 25
Elliott * * * 13
Estill 9 11 20 69
Fayette 55 53 108 18
Fleming * 0 * 10
Floyd 37 14 51 65
Franklin 6 * 10 10
Fulton * * * 15
Gallatin * * 8 47
Garrard 8 5 13 39
Grant 8 11 19 39
Graves * 7 10 13
Grayson 12 9 21 40
Green 0 0 0 0
Greenup 8 * 11 15
Hancock 0 * * 6
Hardin 10 11 21 10
Harlan 10 14 24 42
Harrison * * 5 13
Hart * * * 11
Henderson * 8 11 12
Henry * * * 13
Hickman 0 0 0 0
Hopkins 10 * 14 15

8 | P a g e
KY County
of
residence
Number of deaths due to
drug overdose
Rate of drug
overdose
deaths per 100,000
population 2011-
2012
2011 2012 All All
Jackson 0 * * 4
Jefferson 144 167 311 21
Jessamine 8 9 17 17
Johnson 19 8 27 58
Kenton 55 54 109 34
Knott 8 11 19 59
Knox 21 9 30 47
Larue * 0 * 4
Laurel 20 15 35 29
Lawrence 6 6 12 38
Lee * 0 * 19
Leslie 8 11 19 85
Letcher 19 11 30 62
Lewis * * * 14
Lincoln 6 7 13 26
Livingston * * 6 32
Logan * * 7 13
Lyon * * * 12
McCracken 14 19 33 25
McCreary 0 * * 8
McLean * * * 16
Madison 16 20 36 21
Magoffin 9 5 14 53
Marion 5 5 10 25
Marshall 7 6 13 21
Martin 8 5 13 51
Mason * * 6 17
Meade * * * 7
Menifee * 0 * 8
Mercer * * 5 12
Metcalfe 0 0 0 0
Monroe 8 * 12 55

9 | P a g e
KY County
of
residence
Number of deaths due to
drug overdose
Rate of drug
overdose
deaths per 100,000
population 2011-
2012
2011 2012 All All
Montgomery * * 5 9
Morgan * * * 11
Muhlenberg 5 * 8 13
Nelson 5 * 8 9
Nicholas 6 * 9 64
Ohio * 6 8 17
Oldham 7 * 11 9
Owen * * * 9
Owsley * * * 42
Pendleton 5 * 8 27
Perry 20 16 36 63
Pike 35 29 64 50
Powell 5 7 12 48
Pulaski 15 19 34 27
Robertson * 0 * 45
Rockcastle 7 8 15 44
Rowan * 6 8 17
Russell 8 7 15 43
Scott 5 11 16 16
Shelby * * 7 8
Simpson 5 * 7 20
Spencer * * 6 17
Taylor 7 10 17 34
Todd 0 * * 8
Trigg * * * 7
Trimble 0 * * 11
Union 5 7 12 40
Warren 21 17 38 16
Washington * * * 8
Wayne 6 * 9 22
Webster * * * 7
Whitley 15 25 40 56

10 | P a g e
KY County
of
residence
Number of deaths due to
drug overdose
Rate of drug
overdose
deaths per 100,000
population 2011-
2012
2011 2012 All All
Wolfe * * 6 41
Woodford * * 6 12
11 | P a g e

12 | P a g e

13 | P a g e