2012 APTA Fact Book Appendix B - Operating Data · 2012 PUBLIC TRANSPORTATION FACT BOOK APPENDIX B:...
280
2012 PUBLIC TRANSPORTATION FACT BOOK APPENDIX B: TRANSIT AGENCY AND URBANIZED AREA OPERATING STATISTICS February 2012 American Public Transportation Association 1666 K Street, N.W., Suite 1100 Washington, DC 20006 TELEPHONE: (202) 496-4800 EMAIL: [email protected] WEBSITE: www.apta.com
Transcript of 2012 APTA Fact Book Appendix B - Operating Data · 2012 PUBLIC TRANSPORTATION FACT BOOK APPENDIX B:...
2012 PUBLIC TRANSPORTATION FACT BOOK APPENDIX B: TRANSIT AGENCY AND URBANIZED
AREA OPERATING STATISTICS February 2012
American Public Transportation Association 1666 K Street, N.W., Suite 1100
Washington, DC 20006 TELEPHONE: (202) 496-4800 EMAIL: [email protected] WEBSITE: www.apta.com
2012 Public Transportation Fact Book Appendix B: Transit Agency and Urbanized
Area Operating Statistics
American Public Transportation Association Washington, DC February 2012
APTA's Vision Statement Be the leading force in advancing public transportation. APTA's Mission Statement
To strengthen and improve public transportation, APTA serves and leads its diverse membership through
advocacy, innovation, and information sharing.
Prepared by
Matthew Dickens, Statistician (202) 496-4817
John Neff, Senior Policy Researcher (202) 496-4812 [email protected]
Material from 2012 Public Transportation Fact Book, Appendix B: Transit Agency and Urbanized Area Operating Statistics, may be quoted or reproduced, without obtaining the permission of the American Public Transportation Association. Suggested Identification: American Public Transportation Association: 2012 Public Transportation Fact Book, Appendix B: Transit Agency and Urbanized Area Operating Statistics, Washington, DC, February, 2012. Data presented in this publication are based on data published in the National Transit Database. Washington: Federal Transit Administration, 2012, at http://www.ntdprogram.gov/ntdprogram/
About the Fact Book The American Public Transportation Association is a nonprofit international association of over 1,400 public and private member organizations including transit systems and commuter rail operators; planning, design, construction and finance firms; product and service providers; academic institutions; transit associations; and state departments of transportation. APTA members serve the public interest by providing safe, efficient and economical transit services and products. Over 90 percent of persons using public transportation in the United States and Canada are served by APTA members. The Public Transportation Fact Book (formerly the Transit Fact Book) was first published in 1943. This is the fifth edition of a Transit Agency and Urbanized Area Operating Statistics volume to supplement the Public Transportation Fact Book. The tables in this volume arrange data in rank order for all transit agencies reported in the Federal Transit Administration's 2010 National Transit Database. These data are extensions of tables listing only the largest 50 agencies in different modes in the Public Transportation Fact Book. These data will allow all agencies that participate in the National Transit Database to determine other agencies of comparable size. Note that all data included in this volume are extracted from the 2010 National Transit Database. The names and locations used to identify these transit agencies are as they appear in that publication. These data are presented because NTD data are not published in an easily extracted format where data can be sorted by agency or agency modal totals or urbanized area or urbanized area modal totals in size order. The data are summed and ranked in four ways:
Agency Totals: Data for all modes operated by a transit agency are summed to a total. Tables 1 through 3. Agency Modal Totals: Data are reported for each agency for each mode the agency operates. If both directly operated and purchased transportation service are reported for a single mode for an agency, those data are summed to a single number for the agency's total service for each mode. Tables 4 through 6. Modes of service are listed by codes in the following order: AG: Automated Guideway Transit AR: Alaska Railroad CC: Cable Car CR: Commuter Rail DR: Demand Responsive Paratransit DT: Demand Responsive Paratransit - Taxi FB: Ferry Boat HR: Heavy Rail IP: Inclined Plane LR: Light Rail MB: Bus MO: Monorail PB: Publico TB: Trolleybus VP: Van Pool Urbanized Area Totals: All service for all modes for all transit agencies in each urbanized area are summed to a total. Only urbanized areas for which transit service is reported are included on the table. Note that the entire amount of service operated by a transit agency is included in
the urbanized area in which its headquarters is located even if some of that service is operated in another urbanized area. Tables 7 through 9. Urbanized Area Modal Totals: All data for each mode for all transit agencies in each area are summed to give modal totals for each urbanized area. Only urbanized areas with a particular mode of service are listed under each modal category. Note that the entire amount of service operated by a transit agency is included in the urbanized area in which its headquarters is located even if some of that service is operated in another urbanized area. Tables 10 through 12.
Indexes are also provided, on tables 13 through 16, that list each transit agency alphabetically by state and name and each urbanized area by name. The indexes list, for modes and agency or urbanized area totals, the rank for each data item, thereby allowing the agency or urbanized area to be located on Tables 1 through 12. Data are provided for six statistics listed in pairs:
Tables 1, 4, 7, and 10. Vehicles Operated Maximum Service and Vehicles Available for Maximum Service. The agencies are listed in the order of Vehicles Operated Maximum Service. Tables 2, 5, 8, and 11. Annual Vehicle Revenue Miles and Annual Vehicle Revenue Hours. The agencies are listed in the order of Annual Vehicle Revenue Miles. Tables 3, 6, 9, and 12. Unlinked Passenger Trips and Passenger Miles. The agencies are listed in the order of Unlinked Passenger Trips.
The Public Transportation Fact Book is published in three parts. This allows greater detail in statistical content and at the same time allows data to be easier to find and access. These parts are: The Public Transportation Fact Book presents statistics describing the entire United States transit industry for 2010. Also included is a glossary of definitions of reported data items. The Public Transportation Fact Book, Appendix A: Historical Tables, presents primary data items for the entire time period they have been reported in Fact Books and other statistical reports prepared by APTA and its predecessor organizations. Many data items are reported for every year beginning in the 1920s and ridership is reported from 1907. The Public Transportation Fact Book, Appendix B: Transit Agency and Urbanized Area Operating Statistics, this volume, presents six operating statistics for each transit agency in size order, totaled for all service modes operated by the agency and in size order for each individual mode. Data are also summed for urbanized areas, both all modes totaled and for individual modes. These lists greatly expand similar data in previous Public Transportation Fact Books and allow a simple method to determine comparably sized transit agencies; a difficult task when using existing data sources. APTA produces additional data reports that provide detailed information about individual transit agencies that are not available from other sources. These reports or information on obtaining these reports is on the APTA web site at www.apta.com. They include:

The Public Transportation Fare Database, published annually, report details of individual transit agency fare structures, fare collection practices, and fare collection equipment. The Public Transportation Vehicle Database, published annually, lists all vehicles owned by participating agencies in fleets, that is, groups of identical vehicles manufactured in the same year. Extensive information is included on their propulsion plants, dimensions, and equipment, such as communications and passenger amenities. The Transit Infrastructure Database, published in alternating years, lists all fixed-guideways and stations operated by participating transit agencies. The status of fixed-guideways not yet open is reported and the equipment in stations is detailed. The Public Transportation Ridership Report is published quarterly. Each quarterly edition presents ridership for each of three months plus quarterly and year-to-date amounts for all participating transit agencies. The reported data are used to estimate national total ridership, which is reported for individual service modes and an aggregate total. This report presents a quick indicator of the state of the transit industry shortly after the close of the period being reported. The APTA Primer on Transit Funding presents a detailed explanation of funding programs in federal laws authorizing funding for the transit industry. Detailed statistics report amounts of funds available and the text describes the uses to which those funds may be put and the methods by which they are distributed. A new Primer is prepared for each authorization of transit law and they are updated annually to reflect annual appropriations of federal funds for transit. A Profile of Public Transportation: Passenger Demographics and Travel Characteristics Reported in On-Board Surveys is an extensive investigation of the demographic characteristics and travel behavior of transit passengers based on surveys conducted by transit agencies of passengers traveling on-board their vehicles. Extensive data for individual transit agencies can be found at the Federal Transit Administration's National Transit Database (NTD) web site at http://www.ntdprogram.gov/ntdprogram/. NTD data are presented in summary format for each transit agency and in tabular format for specific data categories, such as revenue sources or operating characteristics, with all transit agencies shown in alphabetical order by state and agency. A glossary and additional background material are available on the web site. Archived data for prior years are included.
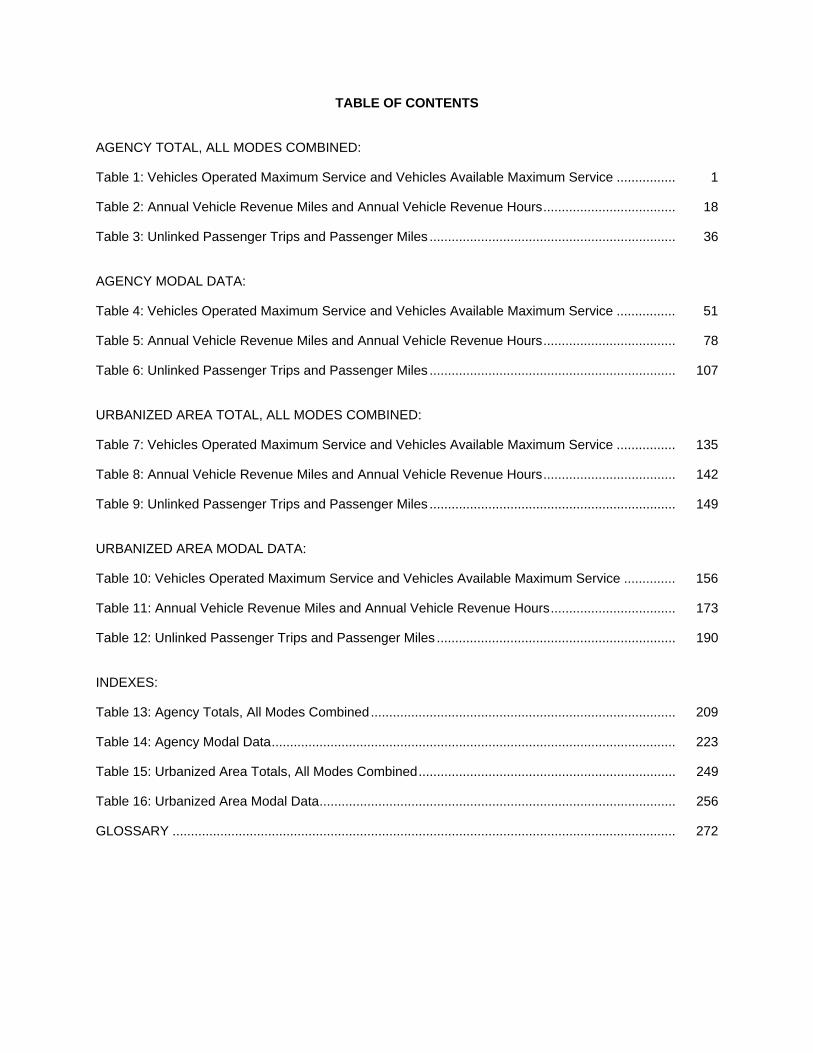
TABLE OF CONTENTS AGENCY TOTAL, ALL MODES COMBINED: Table 1: Vehicles Operated Maximum Service and Vehicles Available Maximum Service ................ 1 Table 2: Annual Vehicle Revenue Miles and Annual Vehicle Revenue Hours .................................... 18 Table 3: Unlinked Passenger Trips and Passenger Miles ................................................................... 36 AGENCY MODAL DATA: Table 4: Vehicles Operated Maximum Service and Vehicles Available Maximum Service ................ 51 Table 5: Annual Vehicle Revenue Miles and Annual Vehicle Revenue Hours .................................... 78 Table 6: Unlinked Passenger Trips and Passenger Miles ................................................................... 107 URBANIZED AREA TOTAL, ALL MODES COMBINED: Table 7: Vehicles Operated Maximum Service and Vehicles Available Maximum Service ................ 135 Table 8: Annual Vehicle Revenue Miles and Annual Vehicle Revenue Hours .................................... 142 Table 9: Unlinked Passenger Trips and Passenger Miles ................................................................... 149 URBANIZED AREA MODAL DATA: Table 10: Vehicles Operated Maximum Service and Vehicles Available Maximum Service .............. 156 Table 11: Annual Vehicle Revenue Miles and Annual Vehicle Revenue Hours .................................. 173 Table 12: Unlinked Passenger Trips and Passenger Miles ................................................................. 190 INDEXES: Table 13: Agency Totals, All Modes Combined ................................................................................... 209 Table 14: Agency Modal Data .............................................................................................................. 223 Table 15: Urbanized Area Totals, All Modes Combined ...................................................................... 249 Table 16: Urbanized Area Modal Data ................................................................................................. 256 GLOSSARY ......................................................................................................................................... 272
2012 Public Transportation Fact Book, Appendix B: Transit Agency and Urbanized Area Operating Statistics
Page 1
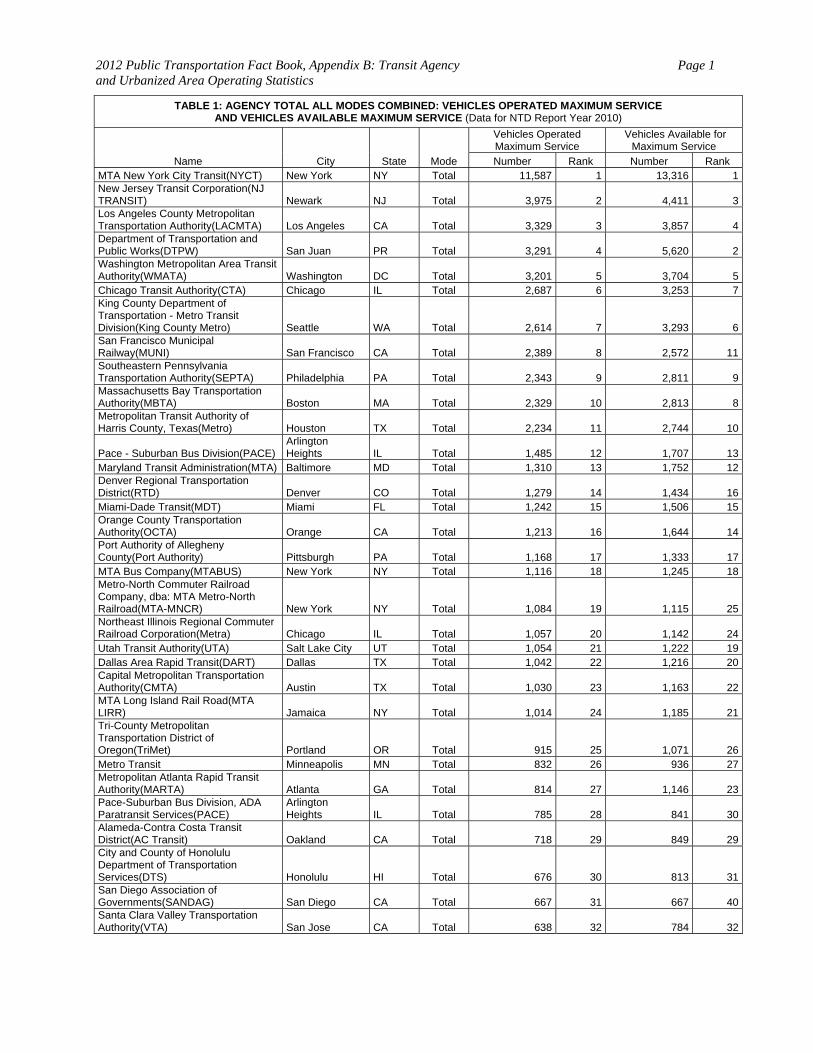
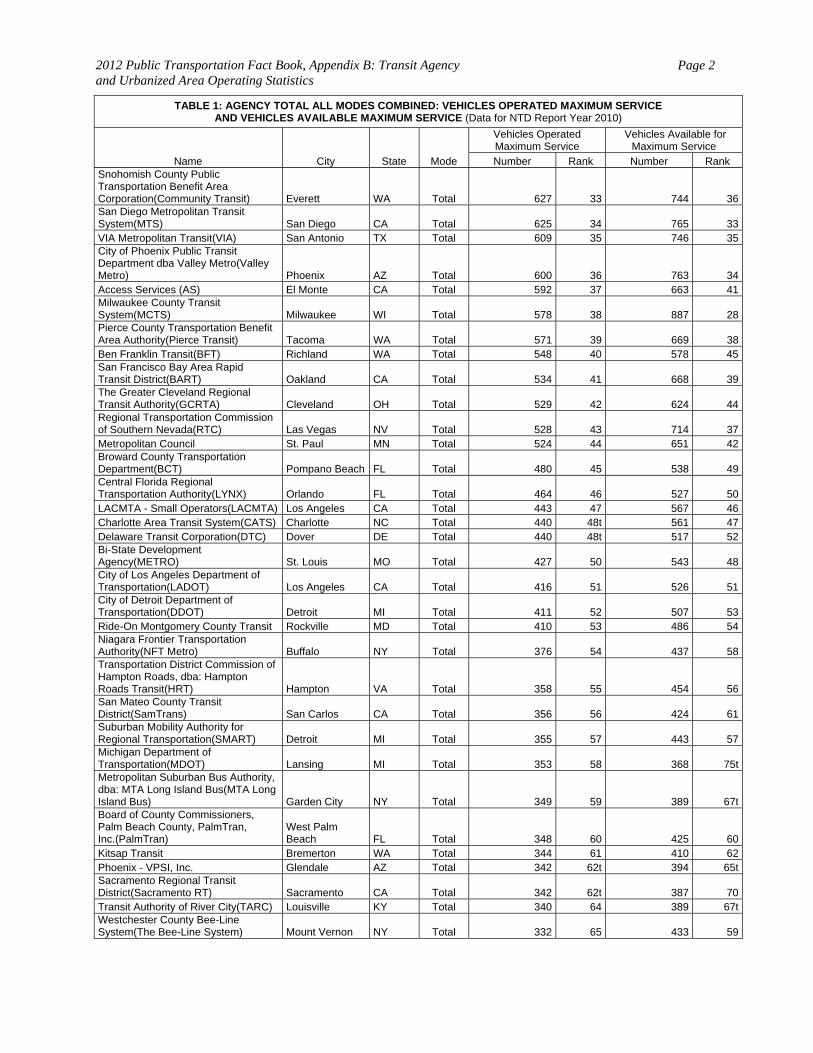
TABLE 1: AGENCY TOTAL ALL MODES COMBINED: VEHICLES OPERATED MAXIMUM SERVICE AND VEHICLES AVAILABLE MAXIMUM SERVICE (Data for NTD Report Year 2010)
Name City State Mode
Vehicles Operated Maximum Service
Vehicles Available for Maximum Service
Number Rank Number Rank MTA New York City Transit(NYCT) New York NY Total 11,587 1 13,316 1New Jersey Transit Corporation(NJ TRANSIT) Newark NJ Total 3,975 2 4,411 3Los Angeles County Metropolitan Transportation Authority(LACMTA) Los Angeles CA Total 3,329 3 3,857 4Department of Transportation and Public Works(DTPW) San Juan PR Total 3,291 4 5,620 2Washington Metropolitan Area Transit Authority(WMATA) Washington DC Total 3,201 5 3,704 5Chicago Transit Authority(CTA) Chicago IL Total 2,687 6 3,253 7King County Department of Transportation - Metro Transit Division(King County Metro) Seattle WA Total 2,614 7 3,293 6San Francisco Municipal Railway(MUNI) San Francisco CA Total 2,389 8 2,572 11Southeastern Pennsylvania Transportation Authority(SEPTA) Philadelphia PA Total 2,343 9 2,811 9Massachusetts Bay Transportation Authority(MBTA) Boston MA Total 2,329 10 2,813 8Metropolitan Transit Authority of Harris County, Texas(Metro) Houston TX Total 2,234 11 2,744 10
Pace - Suburban Bus Division(PACE) Arlington Heights IL Total 1,485 12 1,707 13
Maryland Transit Administration(MTA) Baltimore MD Total 1,310 13 1,752 12Denver Regional Transportation District(RTD) Denver CO Total 1,279 14 1,434 16Miami-Dade Transit(MDT) Miami FL Total 1,242 15 1,506 15Orange County Transportation Authority(OCTA) Orange CA Total 1,213 16 1,644 14Port Authority of Allegheny County(Port Authority) Pittsburgh PA Total 1,168 17 1,333 17MTA Bus Company(MTABUS) New York NY Total 1,116 18 1,245 18Metro-North Commuter Railroad Company, dba: MTA Metro-North Railroad(MTA-MNCR) New York NY Total 1,084 19 1,115 25Northeast Illinois Regional Commuter Railroad Corporation(Metra) Chicago IL Total 1,057 20 1,142 24Utah Transit Authority(UTA) Salt Lake City UT Total 1,054 21 1,222 19Dallas Area Rapid Transit(DART) Dallas TX Total 1,042 22 1,216 20Capital Metropolitan Transportation Authority(CMTA) Austin TX Total 1,030 23 1,163 22MTA Long Island Rail Road(MTA LIRR) Jamaica NY Total 1,014 24 1,185 21Tri-County Metropolitan Transportation District of Oregon(TriMet) Portland OR Total 915 25 1,071 26Metro Transit Minneapolis MN Total 832 26 936 27Metropolitan Atlanta Rapid Transit Authority(MARTA) Atlanta GA Total 814 27 1,146 23Pace-Suburban Bus Division, ADA Paratransit Services(PACE)
Arlington Heights IL Total 785 28 841 30
Alameda-Contra Costa Transit District(AC Transit) Oakland CA Total 718 29 849 29City and County of Honolulu Department of Transportation Services(DTS) Honolulu HI Total 676 30 813 31San Diego Association of Governments(SANDAG) San Diego CA Total 667 31 667 40Santa Clara Valley Transportation Authority(VTA) San Jose CA Total 638 32 784 32
2012 Public Transportation Fact Book, Appendix B: Transit Agency and Urbanized Area Operating Statistics
Page 2
TABLE 1: AGENCY TOTAL ALL MODES COMBINED: VEHICLES OPERATED MAXIMUM SERVICE AND VEHICLES AVAILABLE MAXIMUM SERVICE (Data for NTD Report Year 2010)
Name City State Mode
Vehicles Operated Maximum Service
Vehicles Available for Maximum Service
Number Rank Number Rank Snohomish County Public Transportation Benefit Area Corporation(Community Transit) Everett WA Total 627 33 744 36San Diego Metropolitan Transit System(MTS) San Diego CA Total 625 34 765 33VIA Metropolitan Transit(VIA) San Antonio TX Total 609 35 746 35City of Phoenix Public Transit Department dba Valley Metro(Valley Metro) Phoenix AZ Total 600 36 763 34Access Services (AS) El Monte CA Total 592 37 663 41Milwaukee County Transit System(MCTS) Milwaukee WI Total 578 38 887 28Pierce County Transportation Benefit Area Authority(Pierce Transit) Tacoma WA Total 571 39 669 38Ben Franklin Transit(BFT) Richland WA Total 548 40 578 45San Francisco Bay Area Rapid Transit District(BART) Oakland CA Total 534 41 668 39The Greater Cleveland Regional Transit Authority(GCRTA) Cleveland OH Total 529 42 624 44Regional Transportation Commission of Southern Nevada(RTC) Las Vegas NV Total 528 43 714 37Metropolitan Council St. Paul MN Total 524 44 651 42Broward County Transportation Department(BCT) Pompano Beach FL Total 480 45 538 49Central Florida Regional Transportation Authority(LYNX) Orlando FL Total 464 46 527 50LACMTA - Small Operators(LACMTA) Los Angeles CA Total 443 47 567 46Charlotte Area Transit System(CATS) Charlotte NC Total 440 48t 561 47Delaware Transit Corporation(DTC) Dover DE Total 440 48t 517 52Bi-State Development Agency(METRO) St. Louis MO Total 427 50 543 48City of Los Angeles Department of Transportation(LADOT) Los Angeles CA Total 416 51 526 51City of Detroit Department of Transportation(DDOT) Detroit MI Total 411 52 507 53Ride-On Montgomery County Transit Rockville MD Total 410 53 486 54Niagara Frontier Transportation Authority(NFT Metro) Buffalo NY Total 376 54 437 58Transportation District Commission of Hampton Roads, dba: Hampton Roads Transit(HRT) Hampton VA Total 358 55 454 56San Mateo County Transit District(SamTrans) San Carlos CA Total 356 56 424 61Suburban Mobility Authority for Regional Transportation(SMART) Detroit MI Total 355 57 443 57Michigan Department of Transportation(MDOT) Lansing MI Total 353 58 368 75tMetropolitan Suburban Bus Authority, dba: MTA Long Island Bus(MTA Long Island Bus) Garden City NY Total 349 59 389 67tBoard of County Commissioners, Palm Beach County, PalmTran, Inc.(PalmTran)
West Palm Beach FL Total 348 60 425 60
Kitsap Transit Bremerton WA Total 344 61 410 62Phoenix - VPSI, Inc. Glendale AZ Total 342 62t 394 65tSacramento Regional Transit District(Sacramento RT) Sacramento CA Total 342 62t 387 70Transit Authority of River City(TARC) Louisville KY Total 340 64 389 67tWestchester County Bee-Line System(The Bee-Line System) Mount Vernon NY Total 332 65 433 59
2012 Public Transportation Fact Book, Appendix B: Transit Agency and Urbanized Area Operating Statistics
Page 3
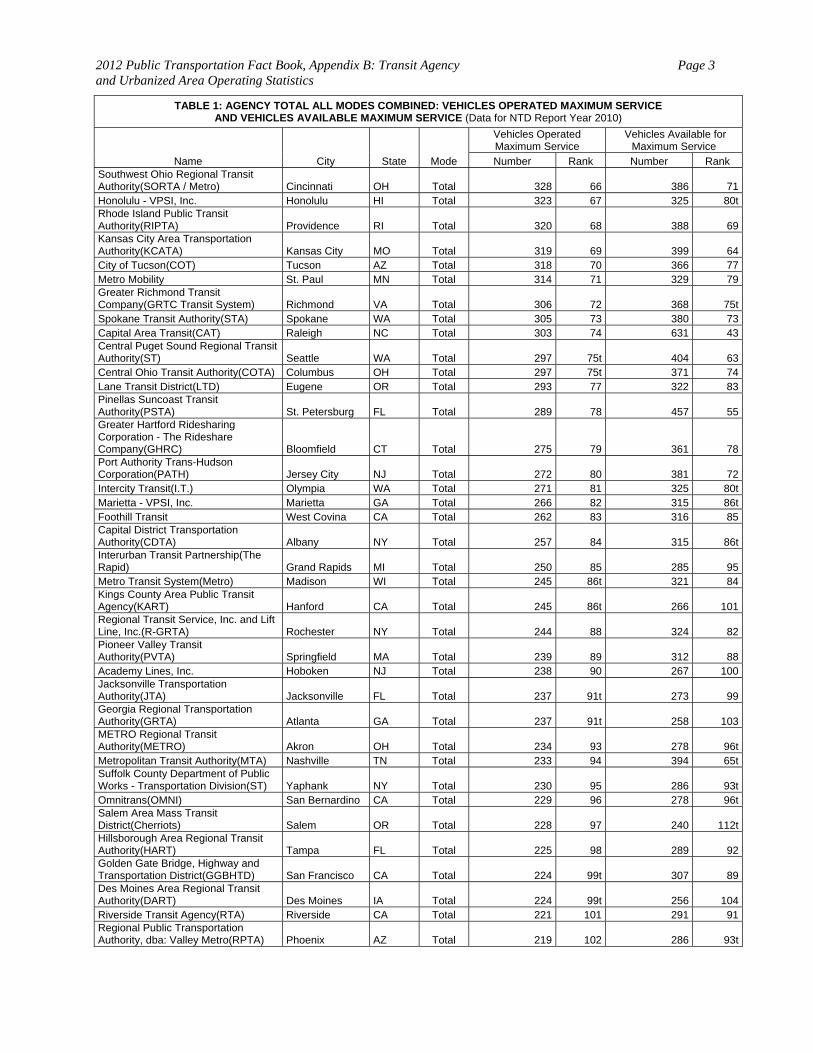
TABLE 1: AGENCY TOTAL ALL MODES COMBINED: VEHICLES OPERATED MAXIMUM SERVICE AND VEHICLES AVAILABLE MAXIMUM SERVICE (Data for NTD Report Year 2010)
Name City State Mode
Vehicles Operated Maximum Service
Vehicles Available for Maximum Service
Number Rank Number Rank Southwest Ohio Regional Transit Authority(SORTA / Metro) Cincinnati OH Total 328 66 386 71Honolulu - VPSI, Inc. Honolulu HI Total 323 67 325 80tRhode Island Public Transit Authority(RIPTA) Providence RI Total 320 68 388 69Kansas City Area Transportation Authority(KCATA) Kansas City MO Total 319 69 399 64City of Tucson(COT) Tucson AZ Total 318 70 366 77Metro Mobility St. Paul MN Total 314 71 329 79Greater Richmond Transit Company(GRTC Transit System) Richmond VA Total 306 72 368 75tSpokane Transit Authority(STA) Spokane WA Total 305 73 380 73Capital Area Transit(CAT) Raleigh NC Total 303 74 631 43Central Puget Sound Regional Transit Authority(ST) Seattle WA Total 297 75t 404 63Central Ohio Transit Authority(COTA) Columbus OH Total 297 75t 371 74Lane Transit District(LTD) Eugene OR Total 293 77 322 83Pinellas Suncoast Transit Authority(PSTA) St. Petersburg FL Total 289 78 457 55Greater Hartford Ridesharing Corporation - The Rideshare Company(GHRC) Bloomfield CT Total 275 79 361 78Port Authority Trans-Hudson Corporation(PATH) Jersey City NJ Total 272 80 381 72Intercity Transit(I.T.) Olympia WA Total 271 81 325 80tMarietta - VPSI, Inc. Marietta GA Total 266 82 315 86tFoothill Transit West Covina CA Total 262 83 316 85Capital District Transportation Authority(CDTA) Albany NY Total 257 84 315 86tInterurban Transit Partnership(The Rapid) Grand Rapids MI Total 250 85 285 95Metro Transit System(Metro) Madison WI Total 245 86t 321 84Kings County Area Public Transit Agency(KART) Hanford CA Total 245 86t 266 101Regional Transit Service, Inc. and Lift Line, Inc.(R-GRTA) Rochester NY Total 244 88 324 82Pioneer Valley Transit Authority(PVTA) Springfield MA Total 239 89 312 88Academy Lines, Inc. Hoboken NJ Total 238 90 267 100Jacksonville Transportation Authority(JTA) Jacksonville FL Total 237 91t 273 99Georgia Regional Transportation Authority(GRTA) Atlanta GA Total 237 91t 258 103METRO Regional Transit Authority(METRO) Akron OH Total 234 93 278 96tMetropolitan Transit Authority(MTA) Nashville TN Total 233 94 394 65tSuffolk County Department of Public Works - Transportation Division(ST) Yaphank NY Total 230 95 286 93tOmnitrans(OMNI) San Bernardino CA Total 229 96 278 96tSalem Area Mass Transit District(Cherriots) Salem OR Total 228 97 240 112tHillsborough Area Regional Transit Authority(HART) Tampa FL Total 225 98 289 92Golden Gate Bridge, Highway and Transportation District(GGBHTD) San Francisco CA Total 224 99t 307 89Des Moines Area Regional Transit Authority(DART) Des Moines IA Total 224 99t 256 104Riverside Transit Agency(RTA) Riverside CA Total 221 101 291 91Regional Public Transportation Authority, dba: Valley Metro(RPTA) Phoenix AZ Total 219 102 286 93t
2012 Public Transportation Fact Book, Appendix B: Transit Agency and Urbanized Area Operating Statistics
Page 4
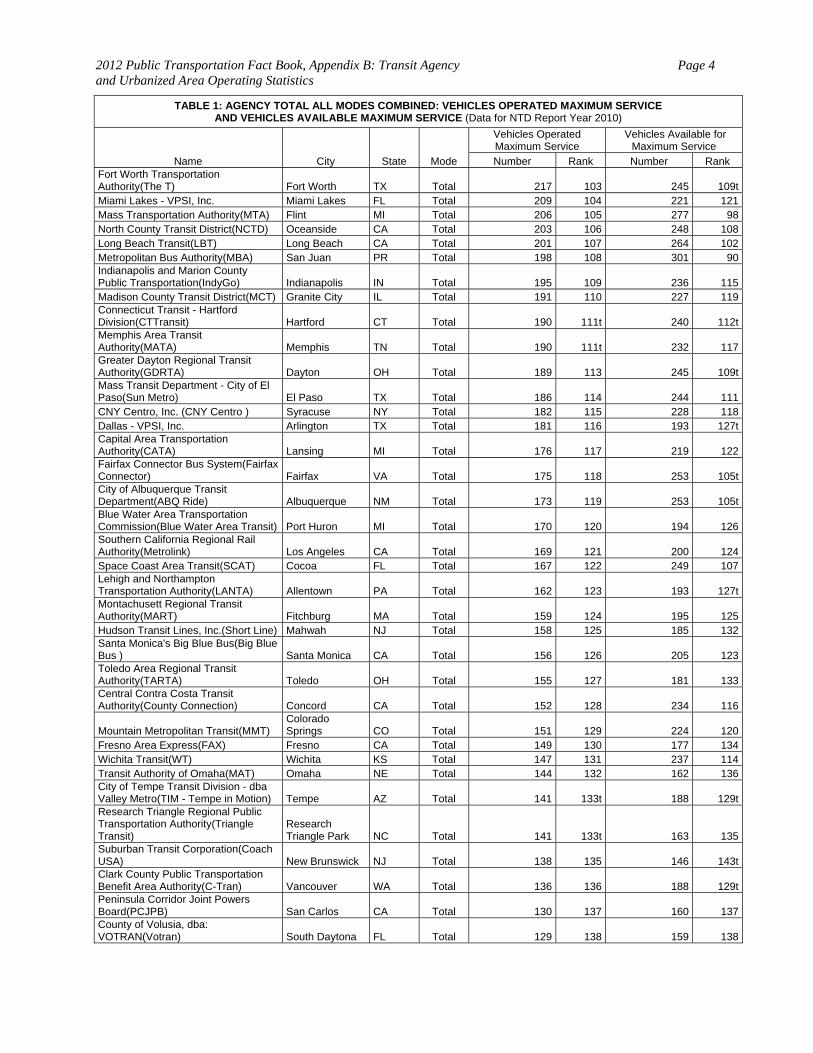
TABLE 1: AGENCY TOTAL ALL MODES COMBINED: VEHICLES OPERATED MAXIMUM SERVICE AND VEHICLES AVAILABLE MAXIMUM SERVICE (Data for NTD Report Year 2010)
Name City State Mode
Vehicles Operated Maximum Service
Vehicles Available for Maximum Service
Number Rank Number Rank Fort Worth Transportation Authority(The T) Fort Worth TX Total 217 103 245 109tMiami Lakes - VPSI, Inc. Miami Lakes FL Total 209 104 221 121Mass Transportation Authority(MTA) Flint MI Total 206 105 277 98North County Transit District(NCTD) Oceanside CA Total 203 106 248 108Long Beach Transit(LBT) Long Beach CA Total 201 107 264 102Metropolitan Bus Authority(MBA) San Juan PR Total 198 108 301 90Indianapolis and Marion County Public Transportation(IndyGo) Indianapolis IN Total 195 109 236 115Madison County Transit District(MCT) Granite City IL Total 191 110 227 119Connecticut Transit - Hartford Division(CTTransit) Hartford CT Total 190 111t 240 112tMemphis Area Transit Authority(MATA) Memphis TN Total 190 111t 232 117Greater Dayton Regional Transit Authority(GDRTA) Dayton OH Total 189 113 245 109tMass Transit Department - City of El Paso(Sun Metro) El Paso TX Total 186 114 244 111CNY Centro, Inc. (CNY Centro ) Syracuse NY Total 182 115 228 118Dallas - VPSI, Inc. Arlington TX Total 181 116 193 127tCapital Area Transportation Authority(CATA) Lansing MI Total 176 117 219 122Fairfax Connector Bus System(Fairfax Connector) Fairfax VA Total 175 118 253 105tCity of Albuquerque Transit Department(ABQ Ride) Albuquerque NM Total 173 119 253 105tBlue Water Area Transportation Commission(Blue Water Area Transit) Port Huron MI Total 170 120 194 126Southern California Regional Rail Authority(Metrolink) Los Angeles CA Total 169 121 200 124Space Coast Area Transit(SCAT) Cocoa FL Total 167 122 249 107Lehigh and Northampton Transportation Authority(LANTA) Allentown PA Total 162 123 193 127tMontachusett Regional Transit Authority(MART) Fitchburg MA Total 159 124 195 125Hudson Transit Lines, Inc.(Short Line) Mahwah NJ Total 158 125 185 132Santa Monica's Big Blue Bus(Big Blue Bus ) Santa Monica CA Total 156 126 205 123Toledo Area Regional Transit Authority(TARTA) Toledo OH Total 155 127 181 133Central Contra Costa Transit Authority(County Connection) Concord CA Total 152 128 234 116
Mountain Metropolitan Transit(MMT) Colorado Springs CO Total 151 129 224 120
Fresno Area Express(FAX) Fresno CA Total 149 130 177 134Wichita Transit(WT) Wichita KS Total 147 131 237 114Transit Authority of Omaha(MAT) Omaha NE Total 144 132 162 136City of Tempe Transit Division - dba Valley Metro(TIM - Tempe in Motion) Tempe AZ Total 141 133t 188 129tResearch Triangle Regional Public Transportation Authority(Triangle Transit)
Research Triangle Park NC Total 141 133t 163 135
Suburban Transit Corporation(Coach USA) New Brunswick NJ Total 138 135 146 143tClark County Public Transportation Benefit Area Authority(C-Tran) Vancouver WA Total 136 136 188 129tPeninsula Corridor Joint Powers Board(PCJPB) San Carlos CA Total 130 137 160 137County of Volusia, dba: VOTRAN(Votran) South Daytona FL Total 129 138 159 138

2012 Public Transportation Fact Book, Appendix B: Transit Agency and Urbanized Area Operating Statistics
Page 5
TABLE 1: AGENCY TOTAL ALL MODES COMBINED: VEHICLES OPERATED MAXIMUM SERVICE AND VEHICLES AVAILABLE MAXIMUM SERVICE (Data for NTD Report Year 2010)
Name City State Mode
Vehicles Operated Maximum Service
Vehicles Available for Maximum Service
Number Rank Number Rank San Joaquin Regional Transit District(RTD) Stockton CA Total 124 139 156 139Erie Metropolitan Transit Authority(the e) Erie PA Total 123 140 136 150Regional Transportation Commission of Washoe County(RTC) Reno NV Total 121 141 140 146Greater Hartford Transit District(GHTD) Hartford CT Total 120 142t 143 145York County Transportation Authority(rabbittransit) York PA Total 120 142t 132 151Santa Cruz Metropolitan Transit District(SCMTD) Santa Cruz CA Total 117 144 128 155Capital Area Transit(CAT) Harrisburg PA Total 115 145 138 147tNew Orleans Regional Transit Authority(NORTA) New Orleans LA Total 112 146 188 129tGainesville Regional Transit System(RTS) Gainesville FL Total 109 147t 147 141tCobb County Department of Transportation Authority(CCT) Marietta GA Total 109 147t 131 152tPotomac and Rappahannock Transportation Commission(PRTC) Woodbridge VA Total 109 147t 131 152tPrince George's County Transit(TheBus) Largo MD Total 107 150t 146 143tTransit Authority of Northern Kentucky(TANK) Fort Wright KY Total 107 150t 137 149Whatcom Transportation Authority(WTA) Bellingham WA Total 103 152t 147 141tSarasota County Area Transit(SCAT) Sarasota FL Total 103 152t 127 156Santa Barbara Metropolitan Transit District(SBMTD) Santa Barbara CA Total 103 152t 123 158Champaign-Urbana Mass Transit District(C-U MTD) Urbana IL Total 103 152t 117 164tHill Country Transit District(The Hop) San Saba TX Total 102 156 154 140Brazos Transit District(The District) Bryan TX Total 101 157t 121 159Monterey-Salinas Transit(MST) Monterey CA Total 101 157t 109 176tPee Dee Regional Transportation Authority(PDRTA) Florence SC Total 100 159 113 169tCharleston Area Regional Transportation Authority(CARTA) Charleston SC Total 99 160 114 168Ann Arbor Transportation Authority(AATA) Ann Arbor MI Total 98 161 126 157Metropolitan Tulsa Transit Authority(MTTA) Tulsa OK Total 97 162t 131 152tDenver Regional Council of Governments(DRCOG) Denver CO Total 97 162t 120 160tBerks Area Reading Transportation Authority(BARTA) Reading PA Total 96 164 112 171tLaketran Grand River OH Total 95 165t 120 160tGreater Attleboro-Taunton Regional Transit Authority(GATRA) Taunton MA Total 95 165t 112 171tKnoxville Area Transit(KAT) Knoxville TN Total 94 167t 138 147tBirmingham-Jefferson County Transit Authority(MAX) Birmingham AL Total 94 167t 111 174tCity Transit Management Company, Inc.(Citibus) Lubbock TX Total 93 169 100 191Chapel Hill Transit(CHT) Chapel Hill NC Total 92 170t 118 163Connecticut Transit - New Haven Division(CTTRANSIT) Hartford CT Total 92 170t 112 171tLee County Transit(LeeTran) Fort Myers FL Total 92 170t 111 174tTorrance Transit System(TTS) Torrance CA Total 92 170t 101 190Red Rose Transit Authority(RRTA) Lancaster PA Total 91 174t 113 169t
2012 Public Transportation Fact Book, Appendix B: Transit Agency and Urbanized Area Operating Statistics
Page 6
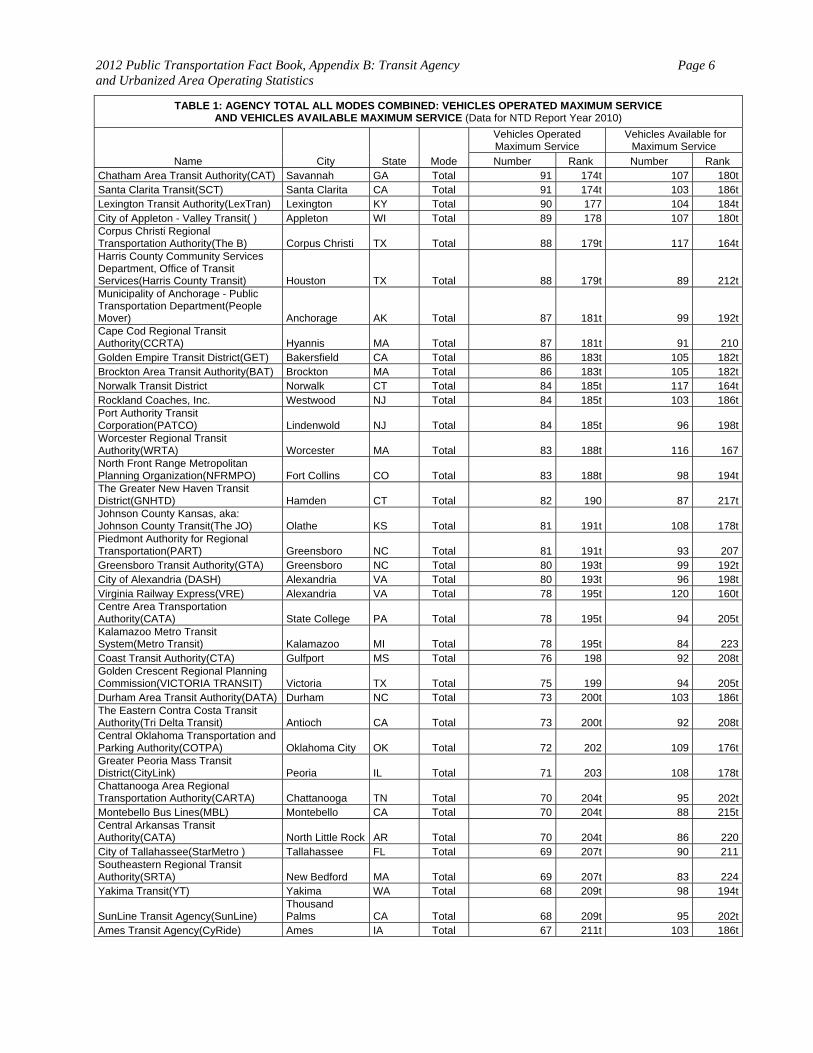
TABLE 1: AGENCY TOTAL ALL MODES COMBINED: VEHICLES OPERATED MAXIMUM SERVICE AND VEHICLES AVAILABLE MAXIMUM SERVICE (Data for NTD Report Year 2010)
Name City State Mode
Vehicles Operated Maximum Service
Vehicles Available for Maximum Service
Number Rank Number Rank Chatham Area Transit Authority(CAT) Savannah GA Total 91 174t 107 180tSanta Clarita Transit(SCT) Santa Clarita CA Total 91 174t 103 186tLexington Transit Authority(LexTran) Lexington KY Total 90 177 104 184tCity of Appleton - Valley Transit( ) Appleton WI Total 89 178 107 180tCorpus Christi Regional Transportation Authority(The B) Corpus Christi TX Total 88 179t 117 164tHarris County Community Services Department, Office of Transit Services(Harris County Transit) Houston TX Total 88 179t 89 212tMunicipality of Anchorage - Public Transportation Department(People Mover) Anchorage AK Total 87 181t 99 192tCape Cod Regional Transit Authority(CCRTA) Hyannis MA Total 87 181t 91 210Golden Empire Transit District(GET) Bakersfield CA Total 86 183t 105 182tBrockton Area Transit Authority(BAT) Brockton MA Total 86 183t 105 182tNorwalk Transit District Norwalk CT Total 84 185t 117 164tRockland Coaches, Inc. Westwood NJ Total 84 185t 103 186tPort Authority Transit Corporation(PATCO) Lindenwold NJ Total 84 185t 96 198tWorcester Regional Transit Authority(WRTA) Worcester MA Total 83 188t 116 167North Front Range Metropolitan Planning Organization(NFRMPO) Fort Collins CO Total 83 188t 98 194tThe Greater New Haven Transit District(GNHTD) Hamden CT Total 82 190 87 217tJohnson County Kansas, aka: Johnson County Transit(The JO) Olathe KS Total 81 191t 108 178tPiedmont Authority for Regional Transportation(PART) Greensboro NC Total 81 191t 93 207Greensboro Transit Authority(GTA) Greensboro NC Total 80 193t 99 192tCity of Alexandria (DASH) Alexandria VA Total 80 193t 96 198tVirginia Railway Express(VRE) Alexandria VA Total 78 195t 120 160tCentre Area Transportation Authority(CATA) State College PA Total 78 195t 94 205tKalamazoo Metro Transit System(Metro Transit) Kalamazoo MI Total 78 195t 84 223Coast Transit Authority(CTA) Gulfport MS Total 76 198 92 208tGolden Crescent Regional Planning Commission(VICTORIA TRANSIT) Victoria TX Total 75 199 94 205tDurham Area Transit Authority(DATA) Durham NC Total 73 200t 103 186tThe Eastern Contra Costa Transit Authority(Tri Delta Transit) Antioch CA Total 73 200t 92 208tCentral Oklahoma Transportation and Parking Authority(COTPA) Oklahoma City OK Total 72 202 109 176tGreater Peoria Mass Transit District(CityLink) Peoria IL Total 71 203 108 178tChattanooga Area Regional Transportation Authority(CARTA) Chattanooga TN Total 70 204t 95 202tMontebello Bus Lines(MBL) Montebello CA Total 70 204t 88 215tCentral Arkansas Transit Authority(CATA) North Little Rock AR Total 70 204t 86 220City of Tallahassee(StarMetro ) Tallahassee FL Total 69 207t 90 211Southeastern Regional Transit Authority(SRTA) New Bedford MA Total 69 207t 83 224Yakima Transit(YT) Yakima WA Total 68 209t 98 194t
SunLine Transit Agency(SunLine) Thousand Palms CA Total 68 209t 95 202t
Ames Transit Agency(CyRide) Ames IA Total 67 211t 103 186t
2012 Public Transportation Fact Book, Appendix B: Transit Agency and Urbanized Area Operating Statistics
Page 7
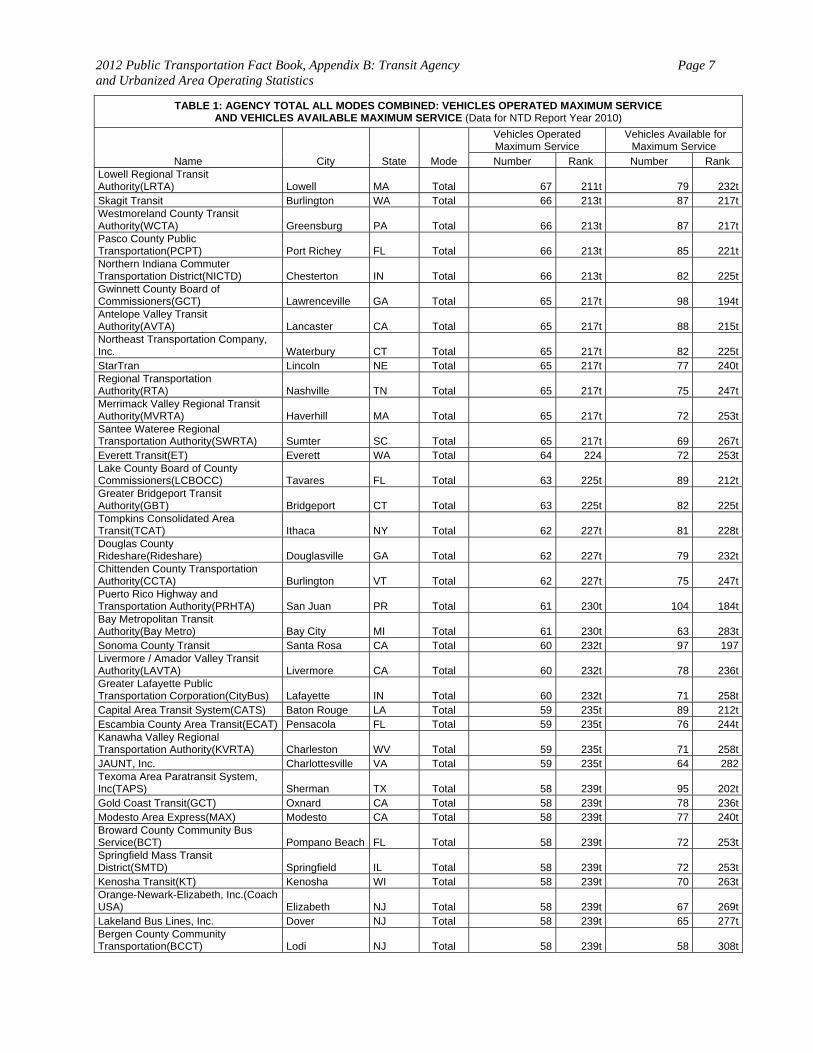
TABLE 1: AGENCY TOTAL ALL MODES COMBINED: VEHICLES OPERATED MAXIMUM SERVICE AND VEHICLES AVAILABLE MAXIMUM SERVICE (Data for NTD Report Year 2010)
Name City State Mode
Vehicles Operated Maximum Service
Vehicles Available for Maximum Service
Number Rank Number Rank Lowell Regional Transit Authority(LRTA) Lowell MA Total 67 211t 79 232tSkagit Transit Burlington WA Total 66 213t 87 217tWestmoreland County Transit Authority(WCTA) Greensburg PA Total 66 213t 87 217tPasco County Public Transportation(PCPT) Port Richey FL Total 66 213t 85 221tNorthern Indiana Commuter Transportation District(NICTD) Chesterton IN Total 66 213t 82 225tGwinnett County Board of Commissioners(GCT) Lawrenceville GA Total 65 217t 98 194tAntelope Valley Transit Authority(AVTA) Lancaster CA Total 65 217t 88 215tNortheast Transportation Company, Inc. Waterbury CT Total 65 217t 82 225tStarTran Lincoln NE Total 65 217t 77 240tRegional Transportation Authority(RTA) Nashville TN Total 65 217t 75 247tMerrimack Valley Regional Transit Authority(MVRTA) Haverhill MA Total 65 217t 72 253tSantee Wateree Regional Transportation Authority(SWRTA) Sumter SC Total 65 217t 69 267tEverett Transit(ET) Everett WA Total 64 224 72 253tLake County Board of County Commissioners(LCBOCC) Tavares FL Total 63 225t 89 212tGreater Bridgeport Transit Authority(GBT) Bridgeport CT Total 63 225t 82 225tTompkins Consolidated Area Transit(TCAT) Ithaca NY Total 62 227t 81 228tDouglas County Rideshare(Rideshare) Douglasville GA Total 62 227t 79 232tChittenden County Transportation Authority(CCTA) Burlington VT Total 62 227t 75 247tPuerto Rico Highway and Transportation Authority(PRHTA) San Juan PR Total 61 230t 104 184tBay Metropolitan Transit Authority(Bay Metro) Bay City MI Total 61 230t 63 283tSonoma County Transit Santa Rosa CA Total 60 232t 97 197Livermore / Amador Valley Transit Authority(LAVTA) Livermore CA Total 60 232t 78 236tGreater Lafayette Public Transportation Corporation(CityBus) Lafayette IN Total 60 232t 71 258tCapital Area Transit System(CATS) Baton Rouge LA Total 59 235t 89 212tEscambia County Area Transit(ECAT) Pensacola FL Total 59 235t 76 244tKanawha Valley Regional Transportation Authority(KVRTA) Charleston WV Total 59 235t 71 258tJAUNT, Inc. Charlottesville VA Total 59 235t 64 282Texoma Area Paratransit System, Inc(TAPS) Sherman TX Total 58 239t 95 202tGold Coast Transit(GCT) Oxnard CA Total 58 239t 78 236tModesto Area Express(MAX) Modesto CA Total 58 239t 77 240tBroward County Community Bus Service(BCT) Pompano Beach FL Total 58 239t 72 253tSpringfield Mass Transit District(SMTD) Springfield IL Total 58 239t 72 253tKenosha Transit(KT) Kenosha WI Total 58 239t 70 263tOrange-Newark-Elizabeth, Inc.(Coach USA) Elizabeth NJ Total 58 239t 67 269tLakeland Bus Lines, Inc. Dover NJ Total 58 239t 65 277tBergen County Community Transportation(BCCT) Lodi NJ Total 58 239t 58 308t
2012 Public Transportation Fact Book, Appendix B: Transit Agency and Urbanized Area Operating Statistics
Page 8
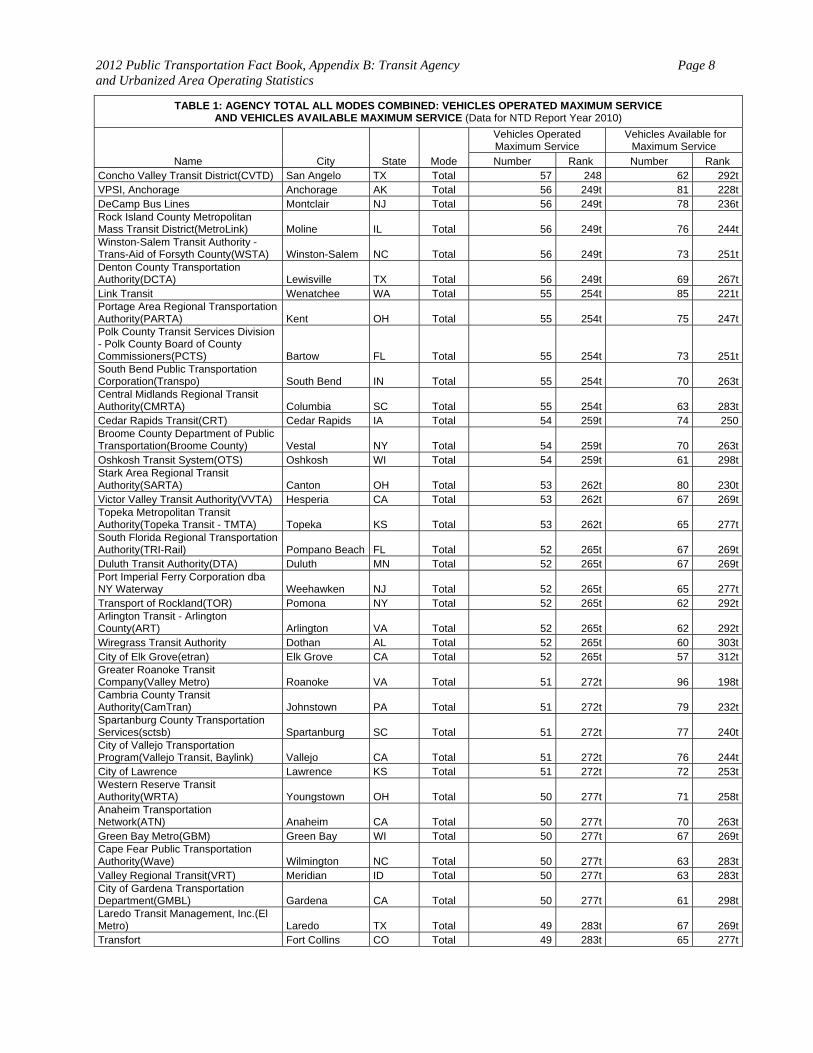
TABLE 1: AGENCY TOTAL ALL MODES COMBINED: VEHICLES OPERATED MAXIMUM SERVICE AND VEHICLES AVAILABLE MAXIMUM SERVICE (Data for NTD Report Year 2010)
Name City State Mode
Vehicles Operated Maximum Service
Vehicles Available for Maximum Service
Number Rank Number Rank Concho Valley Transit District(CVTD) San Angelo TX Total 57 248 62 292tVPSI, Anchorage Anchorage AK Total 56 249t 81 228tDeCamp Bus Lines Montclair NJ Total 56 249t 78 236tRock Island County Metropolitan Mass Transit District(MetroLink) Moline IL Total 56 249t 76 244tWinston-Salem Transit Authority - Trans-Aid of Forsyth County(WSTA) Winston-Salem NC Total 56 249t 73 251tDenton County Transportation Authority(DCTA) Lewisville TX Total 56 249t 69 267tLink Transit Wenatchee WA Total 55 254t 85 221tPortage Area Regional Transportation Authority(PARTA) Kent OH Total 55 254t 75 247tPolk County Transit Services Division - Polk County Board of County Commissioners(PCTS) Bartow FL Total 55 254t 73 251tSouth Bend Public Transportation Corporation(Transpo) South Bend IN Total 55 254t 70 263tCentral Midlands Regional Transit Authority(CMRTA) Columbia SC Total 55 254t 63 283tCedar Rapids Transit(CRT) Cedar Rapids IA Total 54 259t 74 250Broome County Department of Public Transportation(Broome County) Vestal NY Total 54 259t 70 263tOshkosh Transit System(OTS) Oshkosh WI Total 54 259t 61 298tStark Area Regional Transit Authority(SARTA) Canton OH Total 53 262t 80 230tVictor Valley Transit Authority(VVTA) Hesperia CA Total 53 262t 67 269tTopeka Metropolitan Transit Authority(Topeka Transit - TMTA) Topeka KS Total 53 262t 65 277tSouth Florida Regional Transportation Authority(TRI-Rail) Pompano Beach FL Total 52 265t 67 269tDuluth Transit Authority(DTA) Duluth MN Total 52 265t 67 269tPort Imperial Ferry Corporation dba NY Waterway Weehawken NJ Total 52 265t 65 277tTransport of Rockland(TOR) Pomona NY Total 52 265t 62 292tArlington Transit - Arlington County(ART) Arlington VA Total 52 265t 62 292tWiregrass Transit Authority Dothan AL Total 52 265t 60 303tCity of Elk Grove(etran) Elk Grove CA Total 52 265t 57 312tGreater Roanoke Transit Company(Valley Metro) Roanoke VA Total 51 272t 96 198tCambria County Transit Authority(CamTran) Johnstown PA Total 51 272t 79 232tSpartanburg County Transportation Services(sctsb) Spartanburg SC Total 51 272t 77 240tCity of Vallejo Transportation Program(Vallejo Transit, Baylink) Vallejo CA Total 51 272t 76 244tCity of Lawrence Lawrence KS Total 51 272t 72 253tWestern Reserve Transit Authority(WRTA) Youngstown OH Total 50 277t 71 258tAnaheim Transportation Network(ATN) Anaheim CA Total 50 277t 70 263tGreen Bay Metro(GBM) Green Bay WI Total 50 277t 67 269tCape Fear Public Transportation Authority(Wave) Wilmington NC Total 50 277t 63 283tValley Regional Transit(VRT) Meridian ID Total 50 277t 63 283tCity of Gardena Transportation Department(GMBL) Gardena CA Total 50 277t 61 298tLaredo Transit Management, Inc.(El Metro) Laredo TX Total 49 283t 67 269tTransfort Fort Collins CO Total 49 283t 65 277t
2012 Public Transportation Fact Book, Appendix B: Transit Agency and Urbanized Area Operating Statistics
Page 9
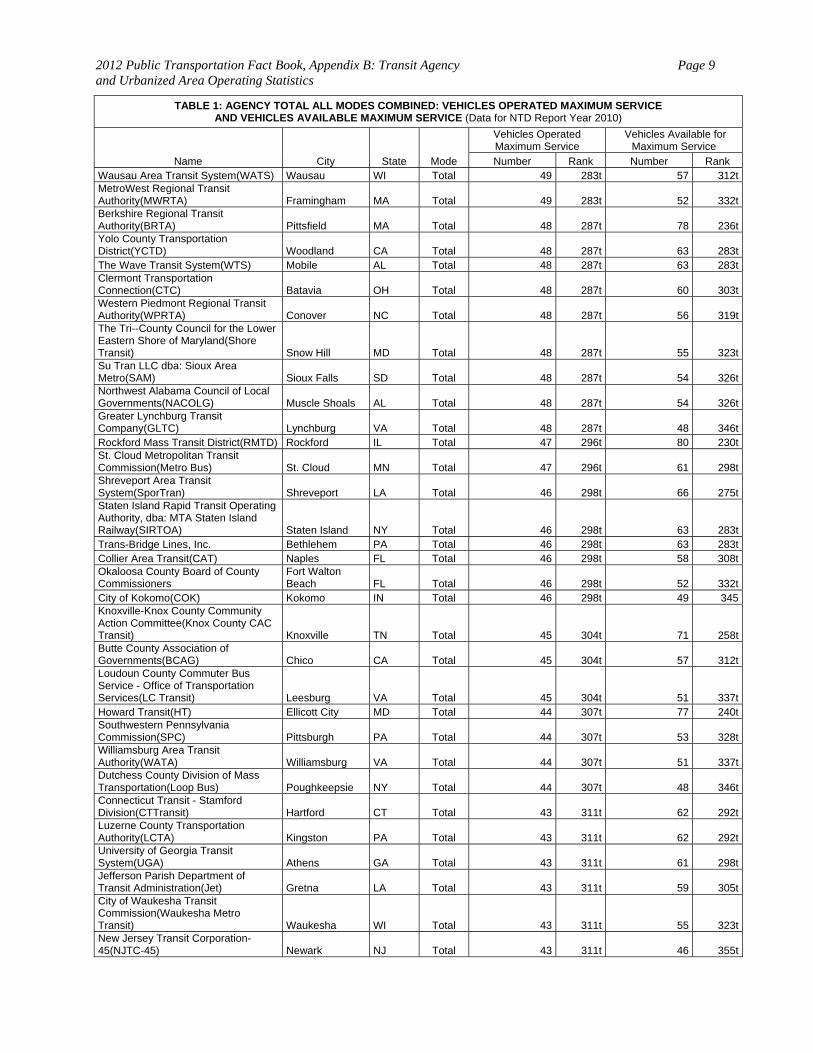
TABLE 1: AGENCY TOTAL ALL MODES COMBINED: VEHICLES OPERATED MAXIMUM SERVICE AND VEHICLES AVAILABLE MAXIMUM SERVICE (Data for NTD Report Year 2010)
Name City State Mode
Vehicles Operated Maximum Service
Vehicles Available for Maximum Service
Number Rank Number Rank Wausau Area Transit System(WATS) Wausau WI Total 49 283t 57 312tMetroWest Regional Transit Authority(MWRTA) Framingham MA Total 49 283t 52 332tBerkshire Regional Transit Authority(BRTA) Pittsfield MA Total 48 287t 78 236tYolo County Transportation District(YCTD) Woodland CA Total 48 287t 63 283tThe Wave Transit System(WTS) Mobile AL Total 48 287t 63 283tClermont Transportation Connection(CTC) Batavia OH Total 48 287t 60 303tWestern Piedmont Regional Transit Authority(WPRTA) Conover NC Total 48 287t 56 319tThe Tri--County Council for the Lower Eastern Shore of Maryland(Shore Transit) Snow Hill MD Total 48 287t 55 323tSu Tran LLC dba: Sioux Area Metro(SAM) Sioux Falls SD Total 48 287t 54 326tNorthwest Alabama Council of Local Governments(NACOLG) Muscle Shoals AL Total 48 287t 54 326tGreater Lynchburg Transit Company(GLTC) Lynchburg VA Total 48 287t 48 346tRockford Mass Transit District(RMTD) Rockford IL Total 47 296t 80 230tSt. Cloud Metropolitan Transit Commission(Metro Bus) St. Cloud MN Total 47 296t 61 298tShreveport Area Transit System(SporTran) Shreveport LA Total 46 298t 66 275tStaten Island Rapid Transit Operating Authority, dba: MTA Staten Island Railway(SIRTOA) Staten Island NY Total 46 298t 63 283tTrans-Bridge Lines, Inc. Bethlehem PA Total 46 298t 63 283tCollier Area Transit(CAT) Naples FL Total 46 298t 58 308tOkaloosa County Board of County Commissioners
Fort Walton Beach FL Total 46 298t 52 332t
City of Kokomo(COK) Kokomo IN Total 46 298t 49 345Knoxville-Knox County Community Action Committee(Knox County CAC Transit) Knoxville TN Total 45 304t 71 258tButte County Association of Governments(BCAG) Chico CA Total 45 304t 57 312tLoudoun County Commuter Bus Service - Office of Transportation Services(LC Transit) Leesburg VA Total 45 304t 51 337tHoward Transit(HT) Ellicott City MD Total 44 307t 77 240tSouthwestern Pennsylvania Commission(SPC) Pittsburgh PA Total 44 307t 53 328tWilliamsburg Area Transit Authority(WATA) Williamsburg VA Total 44 307t 51 337tDutchess County Division of Mass Transportation(Loop Bus) Poughkeepsie NY Total 44 307t 48 346tConnecticut Transit - Stamford Division(CTTransit) Hartford CT Total 43 311t 62 292tLuzerne County Transportation Authority(LCTA) Kingston PA Total 43 311t 62 292tUniversity of Georgia Transit System(UGA) Athens GA Total 43 311t 61 298tJefferson Parish Department of Transit Administration(Jet) Gretna LA Total 43 311t 59 305tCity of Waukesha Transit Commission(Waukesha Metro Transit) Waukesha WI Total 43 311t 55 323tNew Jersey Transit Corporation-45(NJTC-45) Newark NJ Total 43 311t 46 355t
2012 Public Transportation Fact Book, Appendix B: Transit Agency and Urbanized Area Operating Statistics
Page 10
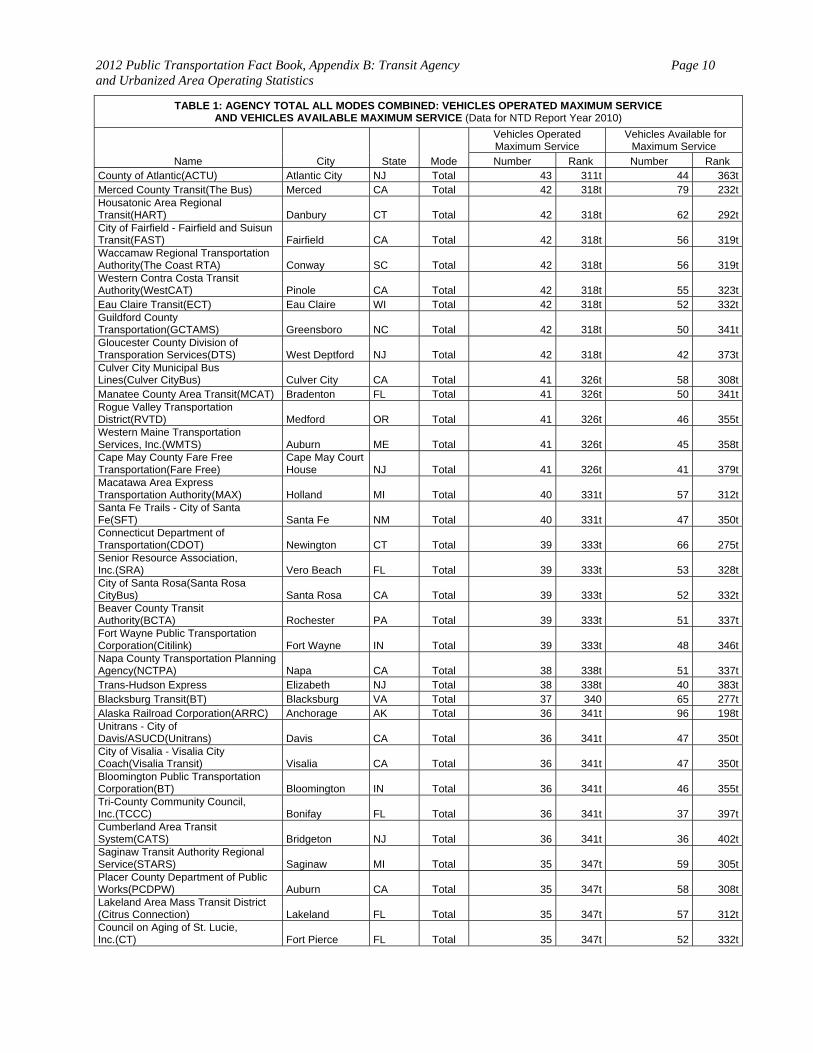
TABLE 1: AGENCY TOTAL ALL MODES COMBINED: VEHICLES OPERATED MAXIMUM SERVICE AND VEHICLES AVAILABLE MAXIMUM SERVICE (Data for NTD Report Year 2010)
Name City State Mode
Vehicles Operated Maximum Service
Vehicles Available for Maximum Service
Number Rank Number Rank County of Atlantic(ACTU) Atlantic City NJ Total 43 311t 44 363tMerced County Transit(The Bus) Merced CA Total 42 318t 79 232tHousatonic Area Regional Transit(HART) Danbury CT Total 42 318t 62 292tCity of Fairfield - Fairfield and Suisun Transit(FAST) Fairfield CA Total 42 318t 56 319tWaccamaw Regional Transportation Authority(The Coast RTA) Conway SC Total 42 318t 56 319tWestern Contra Costa Transit Authority(WestCAT) Pinole CA Total 42 318t 55 323tEau Claire Transit(ECT) Eau Claire WI Total 42 318t 52 332tGuildford County Transportation(GCTAMS) Greensboro NC Total 42 318t 50 341tGloucester County Division of Transporation Services(DTS) West Deptford NJ Total 42 318t 42 373tCulver City Municipal Bus Lines(Culver CityBus) Culver City CA Total 41 326t 58 308tManatee County Area Transit(MCAT) Bradenton FL Total 41 326t 50 341tRogue Valley Transportation District(RVTD) Medford OR Total 41 326t 46 355tWestern Maine Transportation Services, Inc.(WMTS) Auburn ME Total 41 326t 45 358tCape May County Fare Free Transportation(Fare Free)
Cape May Court House NJ Total 41 326t 41 379t
Macatawa Area Express Transportation Authority(MAX) Holland MI Total 40 331t 57 312tSanta Fe Trails - City of Santa Fe(SFT) Santa Fe NM Total 40 331t 47 350tConnecticut Department of Transportation(CDOT) Newington CT Total 39 333t 66 275tSenior Resource Association, Inc.(SRA) Vero Beach FL Total 39 333t 53 328tCity of Santa Rosa(Santa Rosa CityBus) Santa Rosa CA Total 39 333t 52 332tBeaver County Transit Authority(BCTA) Rochester PA Total 39 333t 51 337tFort Wayne Public Transportation Corporation(Citilink) Fort Wayne IN Total 39 333t 48 346tNapa County Transportation Planning Agency(NCTPA) Napa CA Total 38 338t 51 337tTrans-Hudson Express Elizabeth NJ Total 38 338t 40 383tBlacksburg Transit(BT) Blacksburg VA Total 37 340 65 277tAlaska Railroad Corporation(ARRC) Anchorage AK Total 36 341t 96 198tUnitrans - City of Davis/ASUCD(Unitrans) Davis CA Total 36 341t 47 350tCity of Visalia - Visalia City Coach(Visalia Transit) Visalia CA Total 36 341t 47 350tBloomington Public Transportation Corporation(BT) Bloomington IN Total 36 341t 46 355tTri-County Community Council, Inc.(TCCC) Bonifay FL Total 36 341t 37 397tCumberland Area Transit System(CATS) Bridgeton NJ Total 36 341t 36 402tSaginaw Transit Authority Regional Service(STARS) Saginaw MI Total 35 347t 59 305tPlacer County Department of Public Works(PCDPW) Auburn CA Total 35 347t 58 308tLakeland Area Mass Transit District (Citrus Connection) Lakeland FL Total 35 347t 57 312tCouncil on Aging of St. Lucie, Inc.(CT) Fort Pierce FL Total 35 347t 52 332t
2012 Public Transportation Fact Book, Appendix B: Transit Agency and Urbanized Area Operating Statistics
Page 11
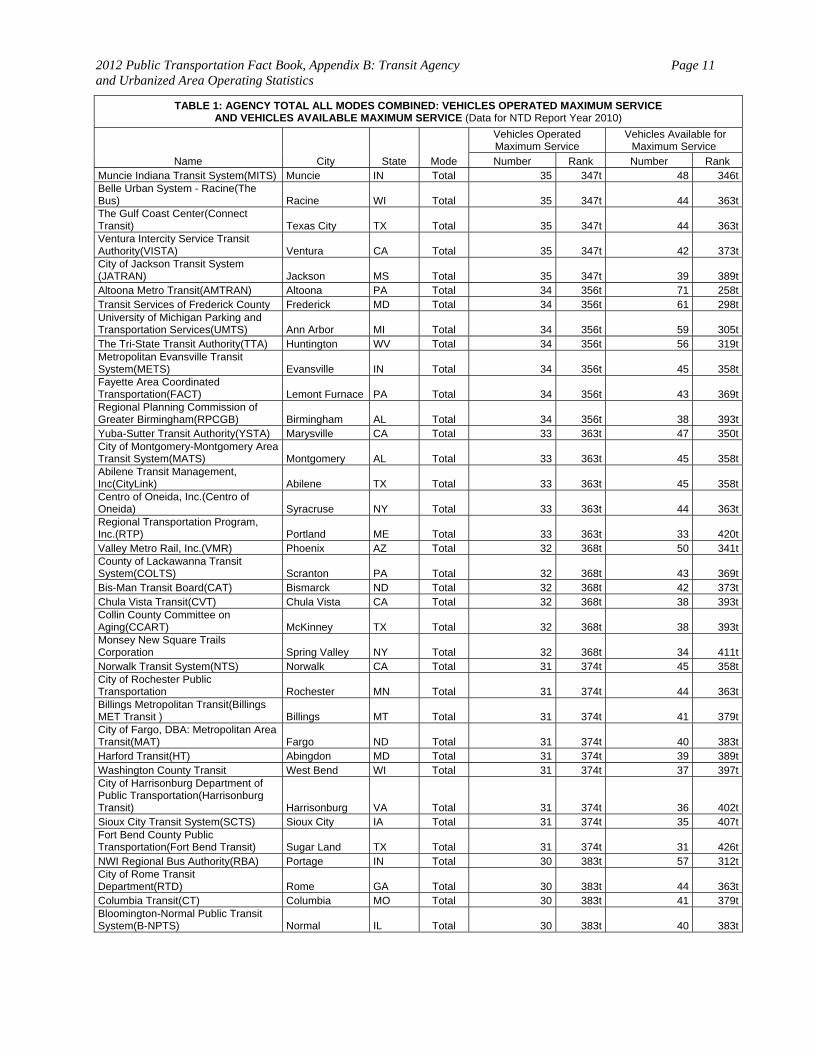
TABLE 1: AGENCY TOTAL ALL MODES COMBINED: VEHICLES OPERATED MAXIMUM SERVICE AND VEHICLES AVAILABLE MAXIMUM SERVICE (Data for NTD Report Year 2010)
Name City State Mode
Vehicles Operated Maximum Service
Vehicles Available for Maximum Service
Number Rank Number Rank Muncie Indiana Transit System(MITS) Muncie IN Total 35 347t 48 346tBelle Urban System - Racine(The Bus) Racine WI Total 35 347t 44 363tThe Gulf Coast Center(Connect Transit) Texas City TX Total 35 347t 44 363tVentura Intercity Service Transit Authority(VISTA) Ventura CA Total 35 347t 42 373tCity of Jackson Transit System (JATRAN) Jackson MS Total 35 347t 39 389tAltoona Metro Transit(AMTRAN) Altoona PA Total 34 356t 71 258tTransit Services of Frederick County Frederick MD Total 34 356t 61 298tUniversity of Michigan Parking and Transportation Services(UMTS) Ann Arbor MI Total 34 356t 59 305tThe Tri-State Transit Authority(TTA) Huntington WV Total 34 356t 56 319tMetropolitan Evansville Transit System(METS) Evansville IN Total 34 356t 45 358tFayette Area Coordinated Transportation(FACT) Lemont Furnace PA Total 34 356t 43 369tRegional Planning Commission of Greater Birmingham(RPCGB) Birmingham AL Total 34 356t 38 393tYuba-Sutter Transit Authority(YSTA) Marysville CA Total 33 363t 47 350tCity of Montgomery-Montgomery Area Transit System(MATS) Montgomery AL Total 33 363t 45 358tAbilene Transit Management, Inc(CityLink) Abilene TX Total 33 363t 45 358tCentro of Oneida, Inc.(Centro of Oneida) Syracruse NY Total 33 363t 44 363tRegional Transportation Program, Inc.(RTP) Portland ME Total 33 363t 33 420tValley Metro Rail, Inc.(VMR) Phoenix AZ Total 32 368t 50 341tCounty of Lackawanna Transit System(COLTS) Scranton PA Total 32 368t 43 369tBis-Man Transit Board(CAT) Bismarck ND Total 32 368t 42 373tChula Vista Transit(CVT) Chula Vista CA Total 32 368t 38 393tCollin County Committee on Aging(CCART) McKinney TX Total 32 368t 38 393tMonsey New Square Trails Corporation Spring Valley NY Total 32 368t 34 411tNorwalk Transit System(NTS) Norwalk CA Total 31 374t 45 358tCity of Rochester Public Transportation Rochester MN Total 31 374t 44 363tBillings Metropolitan Transit(Billings MET Transit ) Billings MT Total 31 374t 41 379tCity of Fargo, DBA: Metropolitan Area Transit(MAT) Fargo ND Total 31 374t 40 383tHarford Transit(HT) Abingdon MD Total 31 374t 39 389tWashington County Transit West Bend WI Total 31 374t 37 397tCity of Harrisonburg Department of Public Transportation(Harrisonburg Transit) Harrisonburg VA Total 31 374t 36 402tSioux City Transit System(SCTS) Sioux City IA Total 31 374t 35 407tFort Bend County Public Transportation(Fort Bend Transit) Sugar Land TX Total 31 374t 31 426tNWI Regional Bus Authority(RBA) Portage IN Total 30 383t 57 312tCity of Rome Transit Department(RTD) Rome GA Total 30 383t 44 363tColumbia Transit(CT) Columbia MO Total 30 383t 41 379tBloomington-Normal Public Transit System(B-NPTS) Normal IL Total 30 383t 40 383t
2012 Public Transportation Fact Book, Appendix B: Transit Agency and Urbanized Area Operating Statistics
Page 12
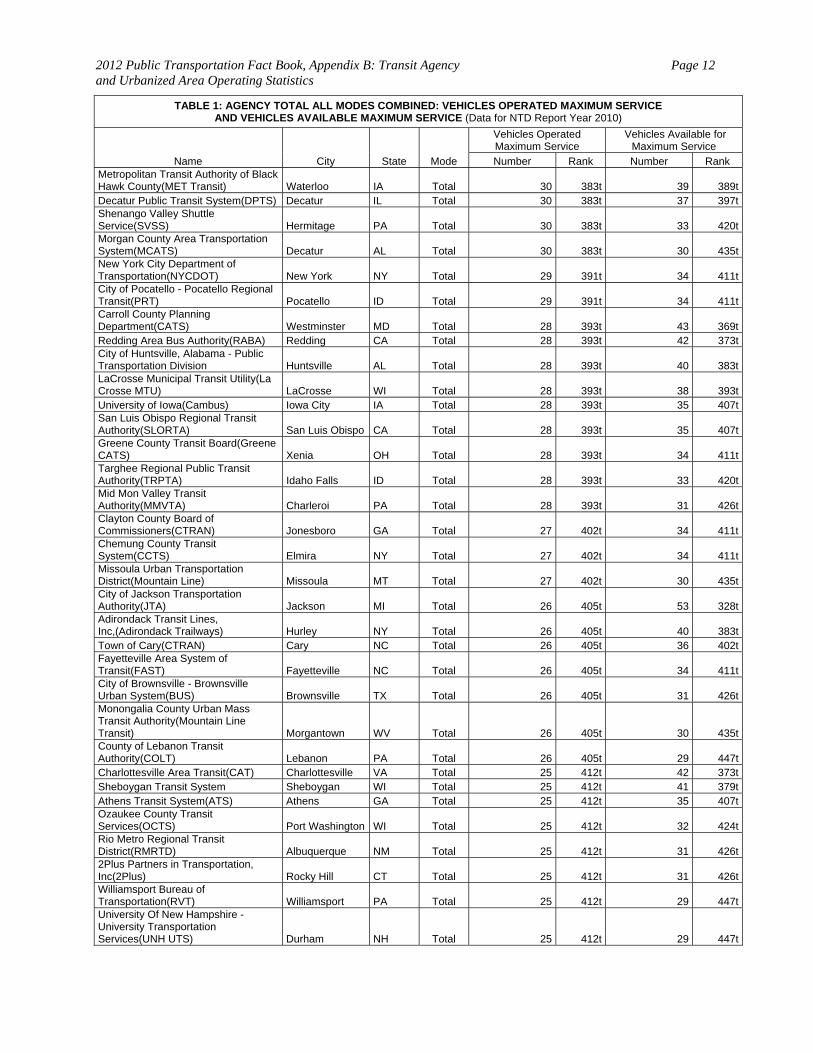
TABLE 1: AGENCY TOTAL ALL MODES COMBINED: VEHICLES OPERATED MAXIMUM SERVICE AND VEHICLES AVAILABLE MAXIMUM SERVICE (Data for NTD Report Year 2010)
Name City State Mode
Vehicles Operated Maximum Service
Vehicles Available for Maximum Service
Number Rank Number Rank Metropolitan Transit Authority of Black Hawk County(MET Transit) Waterloo IA Total 30 383t 39 389tDecatur Public Transit System(DPTS) Decatur IL Total 30 383t 37 397tShenango Valley Shuttle Service(SVSS) Hermitage PA Total 30 383t 33 420tMorgan County Area Transportation System(MCATS) Decatur AL Total 30 383t 30 435tNew York City Department of Transportation(NYCDOT) New York NY Total 29 391t 34 411tCity of Pocatello - Pocatello Regional Transit(PRT) Pocatello ID Total 29 391t 34 411tCarroll County Planning Department(CATS) Westminster MD Total 28 393t 43 369tRedding Area Bus Authority(RABA) Redding CA Total 28 393t 42 373tCity of Huntsville, Alabama - Public Transportation Division Huntsville AL Total 28 393t 40 383tLaCrosse Municipal Transit Utility(La Crosse MTU) LaCrosse WI Total 28 393t 38 393tUniversity of Iowa(Cambus) Iowa City IA Total 28 393t 35 407tSan Luis Obispo Regional Transit Authority(SLORTA) San Luis Obispo CA Total 28 393t 35 407tGreene County Transit Board(Greene CATS) Xenia OH Total 28 393t 34 411tTarghee Regional Public Transit Authority(TRPTA) Idaho Falls ID Total 28 393t 33 420tMid Mon Valley Transit Authority(MMVTA) Charleroi PA Total 28 393t 31 426tClayton County Board of Commissioners(CTRAN) Jonesboro GA Total 27 402t 34 411tChemung County Transit System(CCTS) Elmira NY Total 27 402t 34 411tMissoula Urban Transportation District(Mountain Line) Missoula MT Total 27 402t 30 435tCity of Jackson Transportation Authority(JTA) Jackson MI Total 26 405t 53 328tAdirondack Transit Lines, Inc,(Adirondack Trailways) Hurley NY Total 26 405t 40 383tTown of Cary(CTRAN) Cary NC Total 26 405t 36 402tFayetteville Area System of Transit(FAST) Fayetteville NC Total 26 405t 34 411tCity of Brownsville - Brownsville Urban System(BUS) Brownsville TX Total 26 405t 31 426tMonongalia County Urban Mass Transit Authority(Mountain Line Transit) Morgantown WV Total 26 405t 30 435tCounty of Lebanon Transit Authority(COLT) Lebanon PA Total 26 405t 29 447tCharlottesville Area Transit(CAT) Charlottesville VA Total 25 412t 42 373tSheboygan Transit System Sheboygan WI Total 25 412t 41 379tAthens Transit System(ATS) Athens GA Total 25 412t 35 407tOzaukee County Transit Services(OCTS) Port Washington WI Total 25 412t 32 424tRio Metro Regional Transit District(RMRTD) Albuquerque NM Total 25 412t 31 426t2Plus Partners in Transportation, Inc(2Plus) Rocky Hill CT Total 25 412t 31 426tWilliamsport Bureau of Transportation(RVT) Williamsport PA Total 25 412t 29 447tUniversity Of New Hampshire - University Transportation Services(UNH UTS) Durham NH Total 25 412t 29 447t
2012 Public Transportation Fact Book, Appendix B: Transit Agency and Urbanized Area Operating Statistics
Page 13
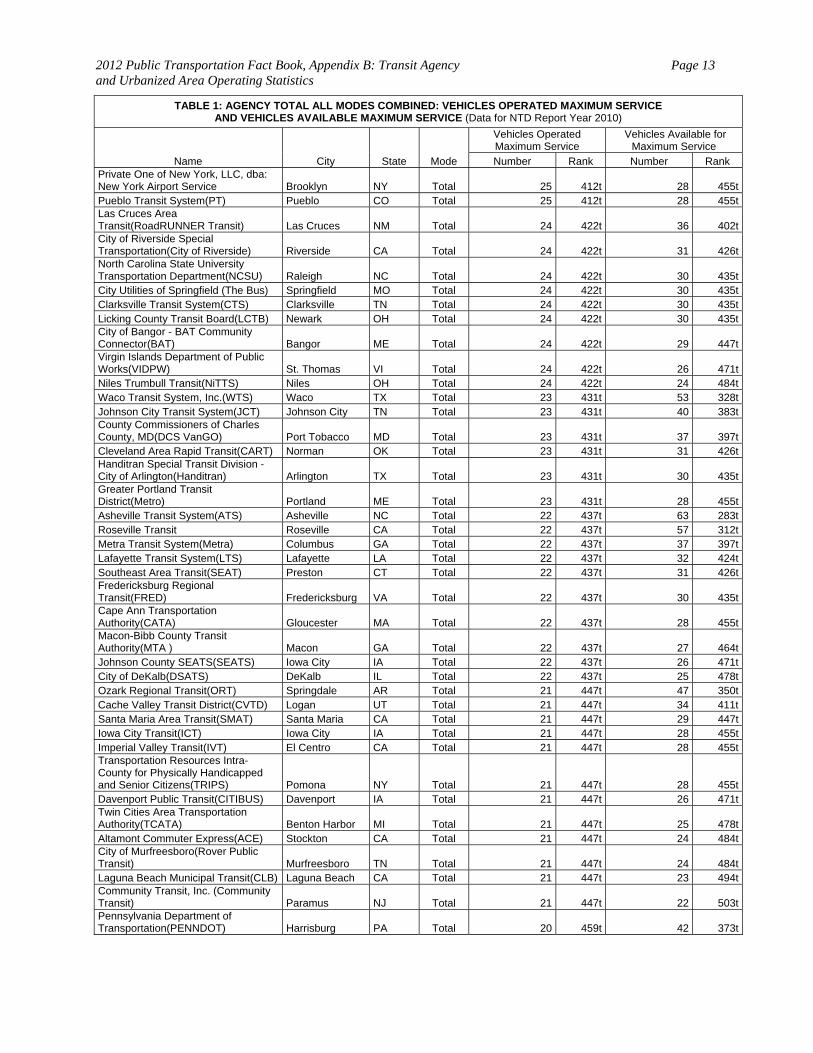
TABLE 1: AGENCY TOTAL ALL MODES COMBINED: VEHICLES OPERATED MAXIMUM SERVICE AND VEHICLES AVAILABLE MAXIMUM SERVICE (Data for NTD Report Year 2010)
Name City State Mode
Vehicles Operated Maximum Service
Vehicles Available for Maximum Service
Number Rank Number Rank Private One of New York, LLC, dba: New York Airport Service Brooklyn NY Total 25 412t 28 455tPueblo Transit System(PT) Pueblo CO Total 25 412t 28 455tLas Cruces Area Transit(RoadRUNNER Transit) Las Cruces NM Total 24 422t 36 402tCity of Riverside Special Transportation(City of Riverside) Riverside CA Total 24 422t 31 426tNorth Carolina State University Transportation Department(NCSU) Raleigh NC Total 24 422t 30 435tCity Utilities of Springfield (The Bus) Springfield MO Total 24 422t 30 435tClarksville Transit System(CTS) Clarksville TN Total 24 422t 30 435tLicking County Transit Board(LCTB) Newark OH Total 24 422t 30 435tCity of Bangor - BAT Community Connector(BAT) Bangor ME Total 24 422t 29 447tVirgin Islands Department of Public Works(VIDPW) St. Thomas VI Total 24 422t 26 471tNiles Trumbull Transit(NiTTS) Niles OH Total 24 422t 24 484tWaco Transit System, Inc.(WTS) Waco TX Total 23 431t 53 328tJohnson City Transit System(JCT) Johnson City TN Total 23 431t 40 383tCounty Commissioners of Charles County, MD(DCS VanGO) Port Tobacco MD Total 23 431t 37 397tCleveland Area Rapid Transit(CART) Norman OK Total 23 431t 31 426tHanditran Special Transit Division - City of Arlington(Handitran) Arlington TX Total 23 431t 30 435tGreater Portland Transit District(Metro) Portland ME Total 23 431t 28 455tAsheville Transit System(ATS) Asheville NC Total 22 437t 63 283tRoseville Transit Roseville CA Total 22 437t 57 312tMetra Transit System(Metra) Columbus GA Total 22 437t 37 397tLafayette Transit System(LTS) Lafayette LA Total 22 437t 32 424tSoutheast Area Transit(SEAT) Preston CT Total 22 437t 31 426tFredericksburg Regional Transit(FRED) Fredericksburg VA Total 22 437t 30 435tCape Ann Transportation Authority(CATA) Gloucester MA Total 22 437t 28 455tMacon-Bibb County Transit Authority(MTA ) Macon GA Total 22 437t 27 464tJohnson County SEATS(SEATS) Iowa City IA Total 22 437t 26 471tCity of DeKalb(DSATS) DeKalb IL Total 22 437t 25 478tOzark Regional Transit(ORT) Springdale AR Total 21 447t 47 350tCache Valley Transit District(CVTD) Logan UT Total 21 447t 34 411tSanta Maria Area Transit(SMAT) Santa Maria CA Total 21 447t 29 447tIowa City Transit(ICT) Iowa City IA Total 21 447t 28 455tImperial Valley Transit(IVT) El Centro CA Total 21 447t 28 455tTransportation Resources Intra-County for Physically Handicapped and Senior Citizens(TRIPS) Pomona NY Total 21 447t 28 455tDavenport Public Transit(CITIBUS) Davenport IA Total 21 447t 26 471tTwin Cities Area Transportation Authority(TCATA) Benton Harbor MI Total 21 447t 25 478tAltamont Commuter Express(ACE) Stockton CA Total 21 447t 24 484tCity of Murfreesboro(Rover Public Transit) Murfreesboro TN Total 21 447t 24 484tLaguna Beach Municipal Transit(CLB) Laguna Beach CA Total 21 447t 23 494tCommunity Transit, Inc. (Community Transit) Paramus NJ Total 21 447t 22 503tPennsylvania Department of Transportation(PENNDOT) Harrisburg PA Total 20 459t 42 373t
2012 Public Transportation Fact Book, Appendix B: Transit Agency and Urbanized Area Operating Statistics
Page 14
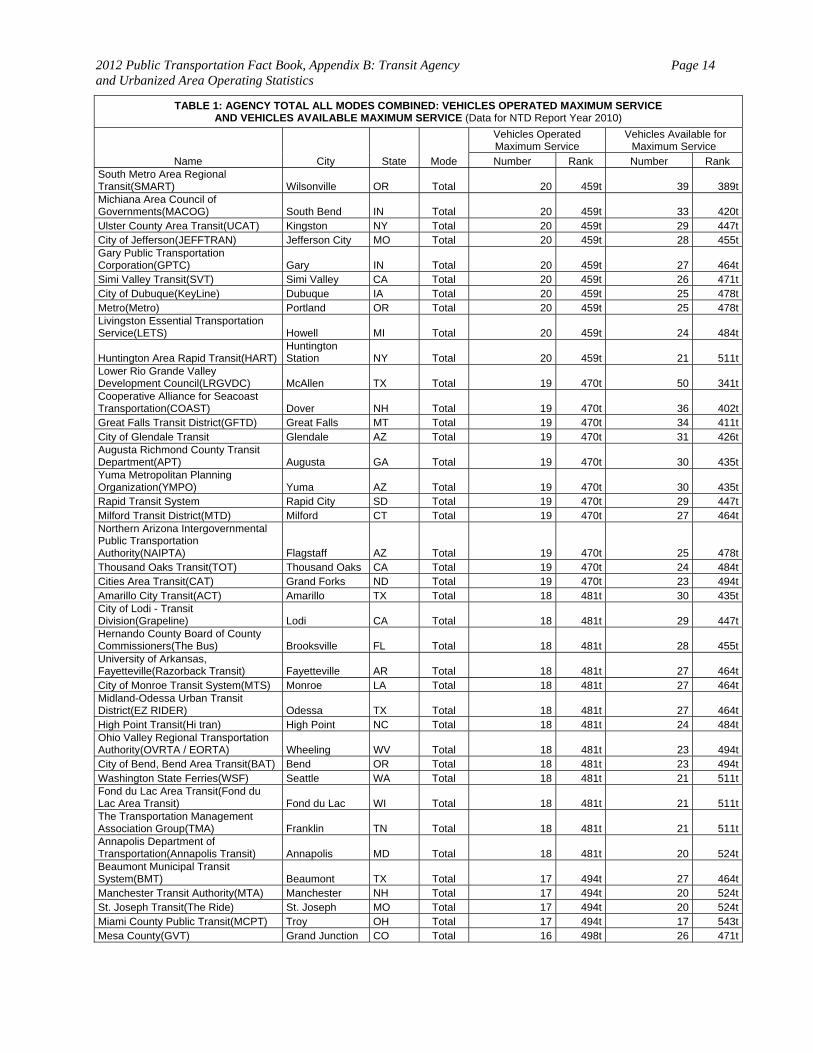
TABLE 1: AGENCY TOTAL ALL MODES COMBINED: VEHICLES OPERATED MAXIMUM SERVICE AND VEHICLES AVAILABLE MAXIMUM SERVICE (Data for NTD Report Year 2010)
Name City State Mode
Vehicles Operated Maximum Service
Vehicles Available for Maximum Service
Number Rank Number Rank South Metro Area Regional Transit(SMART) Wilsonville OR Total 20 459t 39 389tMichiana Area Council of Governments(MACOG) South Bend IN Total 20 459t 33 420tUlster County Area Transit(UCAT) Kingston NY Total 20 459t 29 447tCity of Jefferson(JEFFTRAN) Jefferson City MO Total 20 459t 28 455tGary Public Transportation Corporation(GPTC) Gary IN Total 20 459t 27 464tSimi Valley Transit(SVT) Simi Valley CA Total 20 459t 26 471tCity of Dubuque(KeyLine) Dubuque IA Total 20 459t 25 478tMetro(Metro) Portland OR Total 20 459t 25 478tLivingston Essential Transportation Service(LETS) Howell MI Total 20 459t 24 484t
Huntington Area Rapid Transit(HART) Huntington Station NY Total 20 459t 21 511t
Lower Rio Grande Valley Development Council(LRGVDC) McAllen TX Total 19 470t 50 341tCooperative Alliance for Seacoast Transportation(COAST) Dover NH Total 19 470t 36 402tGreat Falls Transit District(GFTD) Great Falls MT Total 19 470t 34 411tCity of Glendale Transit Glendale AZ Total 19 470t 31 426tAugusta Richmond County Transit Department(APT) Augusta GA Total 19 470t 30 435tYuma Metropolitan Planning Organization(YMPO) Yuma AZ Total 19 470t 30 435tRapid Transit System Rapid City SD Total 19 470t 29 447tMilford Transit District(MTD) Milford CT Total 19 470t 27 464tNorthern Arizona Intergovernmental Public Transportation Authority(NAIPTA) Flagstaff AZ Total 19 470t 25 478tThousand Oaks Transit(TOT) Thousand Oaks CA Total 19 470t 24 484tCities Area Transit(CAT) Grand Forks ND Total 19 470t 23 494tAmarillo City Transit(ACT) Amarillo TX Total 18 481t 30 435tCity of Lodi - Transit Division(Grapeline) Lodi CA Total 18 481t 29 447tHernando County Board of County Commissioners(The Bus) Brooksville FL Total 18 481t 28 455tUniversity of Arkansas, Fayetteville(Razorback Transit) Fayetteville AR Total 18 481t 27 464tCity of Monroe Transit System(MTS) Monroe LA Total 18 481t 27 464tMidland-Odessa Urban Transit District(EZ RIDER) Odessa TX Total 18 481t 27 464tHigh Point Transit(Hi tran) High Point NC Total 18 481t 24 484tOhio Valley Regional Transportation Authority(OVRTA / EORTA) Wheeling WV Total 18 481t 23 494tCity of Bend, Bend Area Transit(BAT) Bend OR Total 18 481t 23 494tWashington State Ferries(WSF) Seattle WA Total 18 481t 21 511tFond du Lac Area Transit(Fond du Lac Area Transit) Fond du Lac WI Total 18 481t 21 511tThe Transportation Management Association Group(TMA) Franklin TN Total 18 481t 21 511tAnnapolis Department of Transportation(Annapolis Transit) Annapolis MD Total 18 481t 20 524tBeaumont Municipal Transit System(BMT) Beaumont TX Total 17 494t 27 464tManchester Transit Authority(MTA) Manchester NH Total 17 494t 20 524tSt. Joseph Transit(The Ride) St. Joseph MO Total 17 494t 20 524tMiami County Public Transit(MCPT) Troy OH Total 17 494t 17 543tMesa County(GVT) Grand Junction CO Total 16 498t 26 471t
2012 Public Transportation Fact Book, Appendix B: Transit Agency and Urbanized Area Operating Statistics
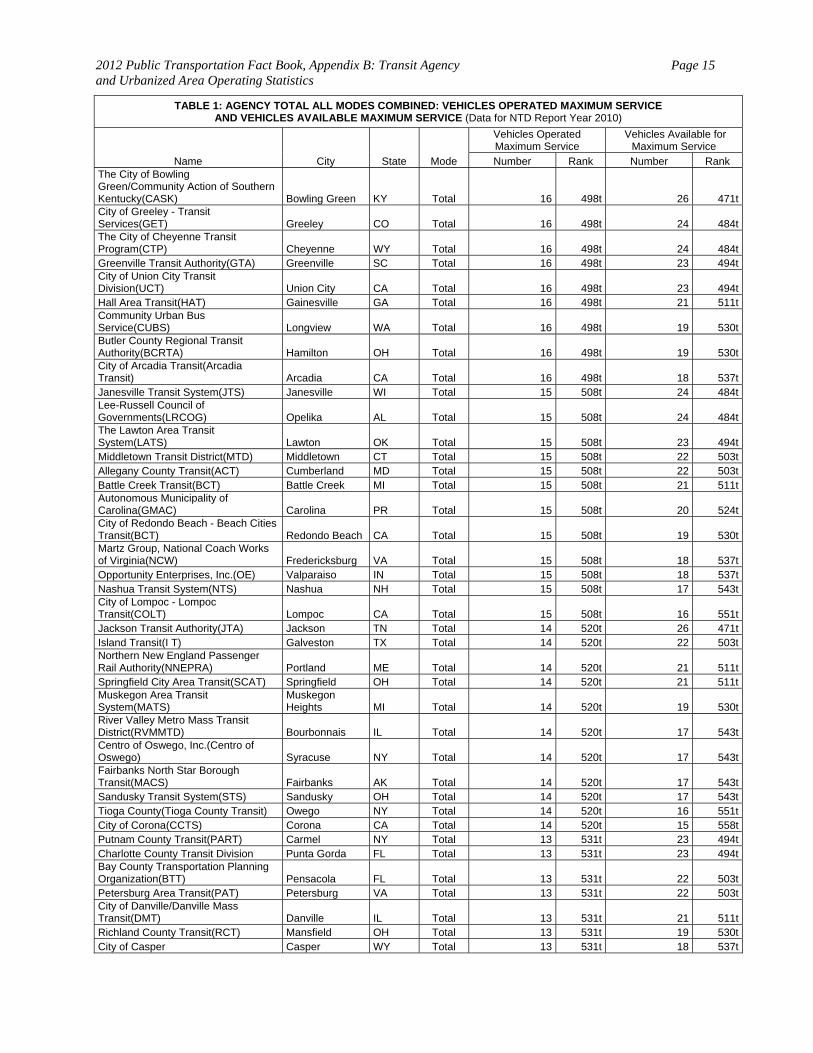
Page 15
TABLE 1: AGENCY TOTAL ALL MODES COMBINED: VEHICLES OPERATED MAXIMUM SERVICE AND VEHICLES AVAILABLE MAXIMUM SERVICE (Data for NTD Report Year 2010)
Name City State Mode
Vehicles Operated Maximum Service
Vehicles Available for Maximum Service
Number Rank Number Rank The City of Bowling Green/Community Action of Southern Kentucky(CASK) Bowling Green KY Total 16 498t 26 471tCity of Greeley - Transit Services(GET) Greeley CO Total 16 498t 24 484tThe City of Cheyenne Transit Program(CTP) Cheyenne WY Total 16 498t 24 484tGreenville Transit Authority(GTA) Greenville SC Total 16 498t 23 494tCity of Union City Transit Division(UCT) Union City CA Total 16 498t 23 494tHall Area Transit(HAT) Gainesville GA Total 16 498t 21 511tCommunity Urban Bus Service(CUBS) Longview WA Total 16 498t 19 530tButler County Regional Transit Authority(BCRTA) Hamilton OH Total 16 498t 19 530tCity of Arcadia Transit(Arcadia Transit) Arcadia CA Total 16 498t 18 537tJanesville Transit System(JTS) Janesville WI Total 15 508t 24 484tLee-Russell Council of Governments(LRCOG) Opelika AL Total 15 508t 24 484tThe Lawton Area Transit System(LATS) Lawton OK Total 15 508t 23 494tMiddletown Transit District(MTD) Middletown CT Total 15 508t 22 503tAllegany County Transit(ACT) Cumberland MD Total 15 508t 22 503tBattle Creek Transit(BCT) Battle Creek MI Total 15 508t 21 511tAutonomous Municipality of Carolina(GMAC) Carolina PR Total 15 508t 20 524tCity of Redondo Beach - Beach Cities Transit(BCT) Redondo Beach CA Total 15 508t 19 530tMartz Group, National Coach Works of Virginia(NCW) Fredericksburg VA Total 15 508t 18 537tOpportunity Enterprises, Inc.(OE) Valparaiso IN Total 15 508t 18 537tNashua Transit System(NTS) Nashua NH Total 15 508t 17 543tCity of Lompoc - Lompoc Transit(COLT) Lompoc CA Total 15 508t 16 551tJackson Transit Authority(JTA) Jackson TN Total 14 520t 26 471tIsland Transit(I T) Galveston TX Total 14 520t 22 503tNorthern New England Passenger Rail Authority(NNEPRA) Portland ME Total 14 520t 21 511tSpringfield City Area Transit(SCAT) Springfield OH Total 14 520t 21 511tMuskegon Area Transit System(MATS)
Muskegon Heights MI Total 14 520t 19 530t
River Valley Metro Mass Transit District(RVMMTD) Bourbonnais IL Total 14 520t 17 543tCentro of Oswego, Inc.(Centro of Oswego) Syracuse NY Total 14 520t 17 543tFairbanks North Star Borough Transit(MACS) Fairbanks AK Total 14 520t 17 543tSandusky Transit System(STS) Sandusky OH Total 14 520t 17 543tTioga County(Tioga County Transit) Owego NY Total 14 520t 16 551tCity of Corona(CCTS) Corona CA Total 14 520t 15 558tPutnam County Transit(PART) Carmel NY Total 13 531t 23 494tCharlotte County Transit Division Punta Gorda FL Total 13 531t 23 494tBay County Transportation Planning Organization(BTT) Pensacola FL Total 13 531t 22 503tPetersburg Area Transit(PAT) Petersburg VA Total 13 531t 22 503tCity of Danville/Danville Mass Transit(DMT) Danville IL Total 13 531t 21 511tRichland County Transit(RCT) Mansfield OH Total 13 531t 19 530tCity of Casper Casper WY Total 13 531t 18 537t
2012 Public Transportation Fact Book, Appendix B: Transit Agency and Urbanized Area Operating Statistics
Page 16
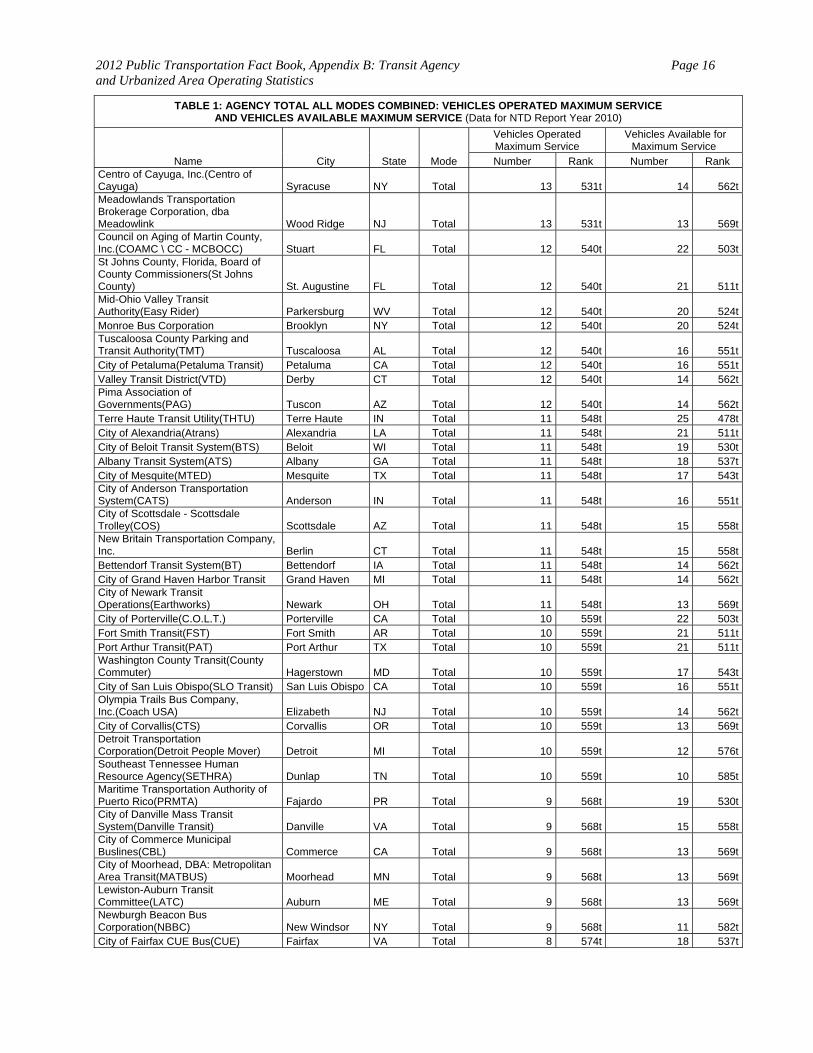
TABLE 1: AGENCY TOTAL ALL MODES COMBINED: VEHICLES OPERATED MAXIMUM SERVICE AND VEHICLES AVAILABLE MAXIMUM SERVICE (Data for NTD Report Year 2010)
Name City State Mode
Vehicles Operated Maximum Service
Vehicles Available for Maximum Service
Number Rank Number Rank Centro of Cayuga, Inc.(Centro of Cayuga) Syracuse NY Total 13 531t 14 562tMeadowlands Transportation Brokerage Corporation, dba Meadowlink Wood Ridge NJ Total 13 531t 13 569tCouncil on Aging of Martin County, Inc.(COAMC \ CC - MCBOCC) Stuart FL Total 12 540t 22 503tSt Johns County, Florida, Board of County Commissioners(St Johns County) St. Augustine FL Total 12 540t 21 511tMid-Ohio Valley Transit Authority(Easy Rider) Parkersburg WV Total 12 540t 20 524tMonroe Bus Corporation Brooklyn NY Total 12 540t 20 524tTuscaloosa County Parking and Transit Authority(TMT) Tuscaloosa AL Total 12 540t 16 551tCity of Petaluma(Petaluma Transit) Petaluma CA Total 12 540t 16 551tValley Transit District(VTD) Derby CT Total 12 540t 14 562tPima Association of Governments(PAG) Tuscon AZ Total 12 540t 14 562tTerre Haute Transit Utility(THTU) Terre Haute IN Total 11 548t 25 478tCity of Alexandria(Atrans) Alexandria LA Total 11 548t 21 511tCity of Beloit Transit System(BTS) Beloit WI Total 11 548t 19 530tAlbany Transit System(ATS) Albany GA Total 11 548t 18 537tCity of Mesquite(MTED) Mesquite TX Total 11 548t 17 543tCity of Anderson Transportation System(CATS) Anderson IN Total 11 548t 16 551tCity of Scottsdale - Scottsdale Trolley(COS) Scottsdale AZ Total 11 548t 15 558tNew Britain Transportation Company, Inc. Berlin CT Total 11 548t 15 558tBettendorf Transit System(BT) Bettendorf IA Total 11 548t 14 562tCity of Grand Haven Harbor Transit Grand Haven MI Total 11 548t 14 562tCity of Newark Transit Operations(Earthworks) Newark OH Total 11 548t 13 569tCity of Porterville(C.O.L.T.) Porterville CA Total 10 559t 22 503tFort Smith Transit(FST) Fort Smith AR Total 10 559t 21 511tPort Arthur Transit(PAT) Port Arthur TX Total 10 559t 21 511tWashington County Transit(County Commuter) Hagerstown MD Total 10 559t 17 543tCity of San Luis Obispo(SLO Transit) San Luis Obispo CA Total 10 559t 16 551tOlympia Trails Bus Company, Inc.(Coach USA) Elizabeth NJ Total 10 559t 14 562tCity of Corvallis(CTS) Corvallis OR Total 10 559t 13 569tDetroit Transportation Corporation(Detroit People Mover) Detroit MI Total 10 559t 12 576tSoutheast Tennessee Human Resource Agency(SETHRA) Dunlap TN Total 10 559t 10 585tMaritime Transportation Authority of Puerto Rico(PRMTA) Fajardo PR Total 9 568t 19 530tCity of Danville Mass Transit System(Danville Transit) Danville VA Total 9 568t 15 558tCity of Commerce Municipal Buslines(CBL) Commerce CA Total 9 568t 13 569tCity of Moorhead, DBA: Metropolitan Area Transit(MATBUS) Moorhead MN Total 9 568t 13 569tLewiston-Auburn Transit Committee(LATC) Auburn ME Total 9 568t 13 569tNewburgh Beacon Bus Corporation(NBBC) New Windsor NY Total 9 568t 11 582tCity of Fairfax CUE Bus(CUE) Fairfax VA Total 8 574t 18 537t

2012 Public Transportation Fact Book, Appendix B: Transit Agency and Urbanized Area Operating Statistics
Page 17
TABLE 1: AGENCY TOTAL ALL MODES COMBINED: VEHICLES OPERATED MAXIMUM SERVICE AND VEHICLES AVAILABLE MAXIMUM SERVICE (Data for NTD Report Year 2010)
Name City State Mode
Vehicles Operated Maximum Service
Vehicles Available for Maximum Service
Number Rank Number Rank City of Turlock(BLAST and DART) Turlock CA Total 8 574t 16 551tCity of Long Beach(Long Beach Bus) Long Beach NY Total 8 574t 14 562tCity of Grand Prairie Transportation Services Department(Grand Connection) Grand Prairie TX Total 8 574t 12 576tSpartanburg Transit System(SPARTA) Spartanburg SC Total 8 574t 11 582tSouth Lake County Community Services, Inc.(SLCCS) Crown Point IN Total 8 574t 10 585tCity of Seattle - Seattle Center Monorail Transit(SMS) Seattle WA Total 8 574t 8 595tPorter County Aging and Community Services, Inc.(PCACS) Valparaiso IN Total 7 581t 12 576tCoralville Transit System(CTS) Coralville IA Total 7 581t 10 585tCity of Valparaiso Valparaiso IN Total 7 581t 9 589tCity of Washington(WCT) Washington PA Total 7 581t 9 589tPeoria Transit Peoria AZ Total 7 581t 9 589tSurprise Dial-A-Ride Transit System Surprise AZ Total 7 581t 8 595tLawrence County Port Authority(LCT) Ironton OH Total 7 581t 8 595tParking & Transit Department(KU) Lawrence KS Total 6 588t 43 369tCity of Loveland Transit(COLT) Loveland CO Total 6 588t 13 569tGreater Glens Falls Transit System(GGFT) Queensbury NY Total 6 588t 12 576tCity of La Mirada Transit(LMT) La Mirada CA Total 6 588t 12 576tBuckhead Community Improvement District(BCID) Atlanta GA Total 6 588t 11 582tBillyBey Ferry Company, LLC New York NY Total 6 588t 9 589tCity of Middletown - Middletown Transit System(MTS) Middletown OH Total 6 588t 9 589tPrivate Transportation Corporation Brooklyn NY Total 6 588t 8 595tHendrick Hudson Bus Lines, Inc.(HHBL) Newburgh NY Total 6 588t 8 595tCity of Poughkeepsie Poughkeepsie NY Total 6 588t 7 602Lorain County Transit(LCT) Elyria OH Total 5 598t 12 576tClarkstown Mini-Trans Nanuet NY Total 5 598t 10 585tThe University of Montana - ASUM Transportation(ASUM OT) Missoula MT Total 5 598t 9 589tEast Chicago Transit(ECT) East Chicago IN Total 5 598t 8 595tTown of Monroe Dial-A-Bus(Monroe DAB) Monroe NY Total 5 598t 6 603tVillage of Kiryas Joel(KJ) Monroe NY Total 4 603t 6 603tCasco Bay Island Transit District(CBITD) Portland ME Total 4 603t 5 607tNorth Township of Lake County Dial-A-Ride Hammond IN Total 4 603t 5 607tCity of Alameda Ferry Services Alameda CA Total 3 606t 8 595tCrescent City Connection Division - Louisiana Department of Transportation(CCCD) New Orleans LA Total 3 606t 6 603tBrunswick Transit Alternative(BTA) Brunswick OH Total 3 606t 6 603tVillage of Spring Valley Bus(Spring Valley Jitney) Spring Valley NY Total 2 609 3 609Pierce County Ferry Operations(Pierce County Ferry) University Place WA Total 1 610t 1 610tKing County Ferry District(KCFD) Seattle WA Total 1 610t 1 610t
2012 Public Transportation Fact Book, Appendix B: Transit Agency and Urbanized Area Operating Statistics
Page 18
TABLE 2: AGENCY TOTAL ALL MODES COMBINED: ANNUAL VEHICLE REVENUE MILES AND ANNUAL VEHICLE REVENUE HOURS (Data for NTD Report Year 2010)
Name City State Mode
Annual Vehicle Revenue Miles
Annual Vehicle Revenue Hours
Number (Thousands) Rank
Number (Thousands) Rank
MTA New York City Transit(NYCT) New York NY Total 510,264.1 1 37,351.2 1New Jersey Transit Corporation(NJ TRANSIT) Newark NJ Total 161,703.9 2 8,213.0 5Washington Metropolitan Area Transit Authority(WMATA) Washington DC Total 128,074.3 3 8,369.3 4Los Angeles County Metropolitan Transportation Authority(LACMTA) Los Angeles CA Total 123,241.1 4 8,568.7 3Chicago Transit Authority(CTA) Chicago IL Total 121,854.9 5 9,435.7 2Massachusetts Bay Transportation Authority(MBTA) Boston MA Total 95,035.5 6 6,450.6 7Southeastern Pennsylvania Transportation Authority(SEPTA) Philadelphia PA Total 88,709.3 7 6,871.4 6Metropolitan Transit Authority of Harris County, Texas(Metro) Houston TX Total 66,516.7 8 4,035.2 9MTA Long Island Rail Road(MTA LIRR) Jamaica NY Total 63,767.8 9 2,019.9 25San Francisco Bay Area Rapid Transit District(BART) Oakland CA Total 63,237.5 10 1,780.2 30Metro-North Commuter Railroad Company, dba: MTA Metro-North Railroad(MTA-MNCR) New York NY Total 57,986.3 11 1,613.9 35King County Department of Transportation - Metro Transit Division(King County Metro) Seattle WA Total 56,906.4 12 4,109.1 8Denver Regional Transportation District(RTD) Denver CO Total 55,861.4 13 3,818.0 10Metropolitan Atlanta Rapid Transit Authority(MARTA) Atlanta GA Total 55,180.6 14 3,291.0 14Miami-Dade Transit(MDT) Miami FL Total 50,203.2 15 3,816.3 11Maryland Transit Administration(MTA) Baltimore MD Total 48,356.6 16 3,326.2 13Dallas Area Rapid Transit(DART) Dallas TX Total 45,469.0 17 2,908.2 17Northeast Illinois Regional Commuter Railroad Corporation(Metra) Chicago IL Total 43,143.6 18 1,397.0 41Tri-County Metropolitan Transportation District of Oregon(TriMet) Portland OR Total 37,152.8 19 2,873.4 18Port Authority of Allegheny County(Port Authority) Pittsburgh PA Total 36,790.1 20 2,587.2 19Orange County Transportation Authority(OCTA) Orange CA Total 36,660.6 21 2,471.0 20
Pace - Suburban Bus Division(PACE) Arlington Heights IL Total 35,040.3 22 2,092.8 24
Department of Transportation and Public Works(DTPW) San Juan PR Total 32,409.5 23 2,982.0 16Utah Transit Authority(UTA) Salt Lake City UT Total 31,867.1 24 1,577.2 36VIA Metropolitan Transit(VIA) San Antonio TX Total 30,332.2 25 2,008.3 26San Francisco Municipal Railway(MUNI) San Francisco CA Total 28,406.8 26 3,469.3 12Alameda-Contra Costa Transit District(AC Transit) Oakland CA Total 27,837.3 27 2,255.9 21San Diego Metropolitan Transit System(MTS) San Diego CA Total 27,816.3 28 2,176.7 22Access Services (AS) El Monte CA Total 26,892.1 29 1,517.0 38Bi-State Development Agency(METRO) St. Louis MO Total 26,508.9 30 1,692.4 33MTA Bus Company(MTABUS) New York NY Total 26,382.7 31 3,102.9 15Metro Transit Minneapolis MN Total 25,431.4 32 2,099.4 23Pace-Suburban Bus Division, ADA Paratransit Services(PACE)
Arlington Heights IL Total 25,365.7 33 1,756.5 31
2012 Public Transportation Fact Book, Appendix B: Transit Agency and Urbanized Area Operating Statistics
Page 19
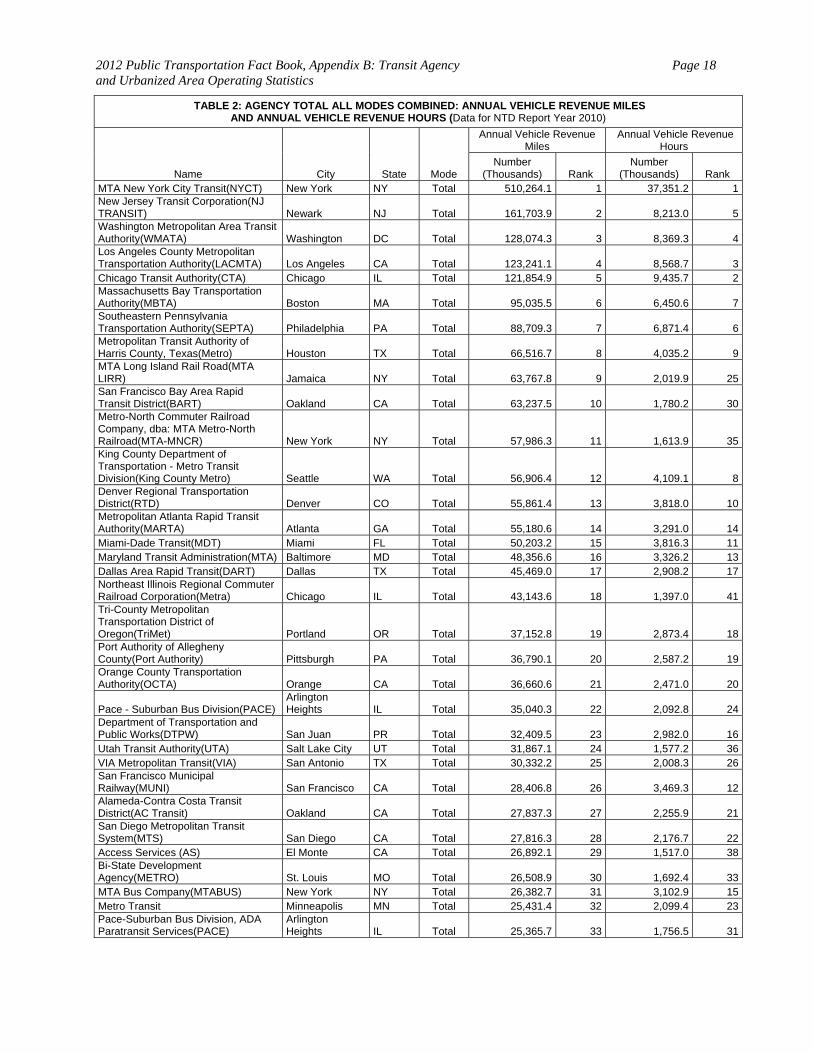
TABLE 2: AGENCY TOTAL ALL MODES COMBINED: ANNUAL VEHICLE REVENUE MILES AND ANNUAL VEHICLE REVENUE HOURS (Data for NTD Report Year 2010)
Name City State Mode
Annual Vehicle Revenue Miles
Annual Vehicle Revenue Hours
Number (Thousands) Rank
Number (Thousands) Rank
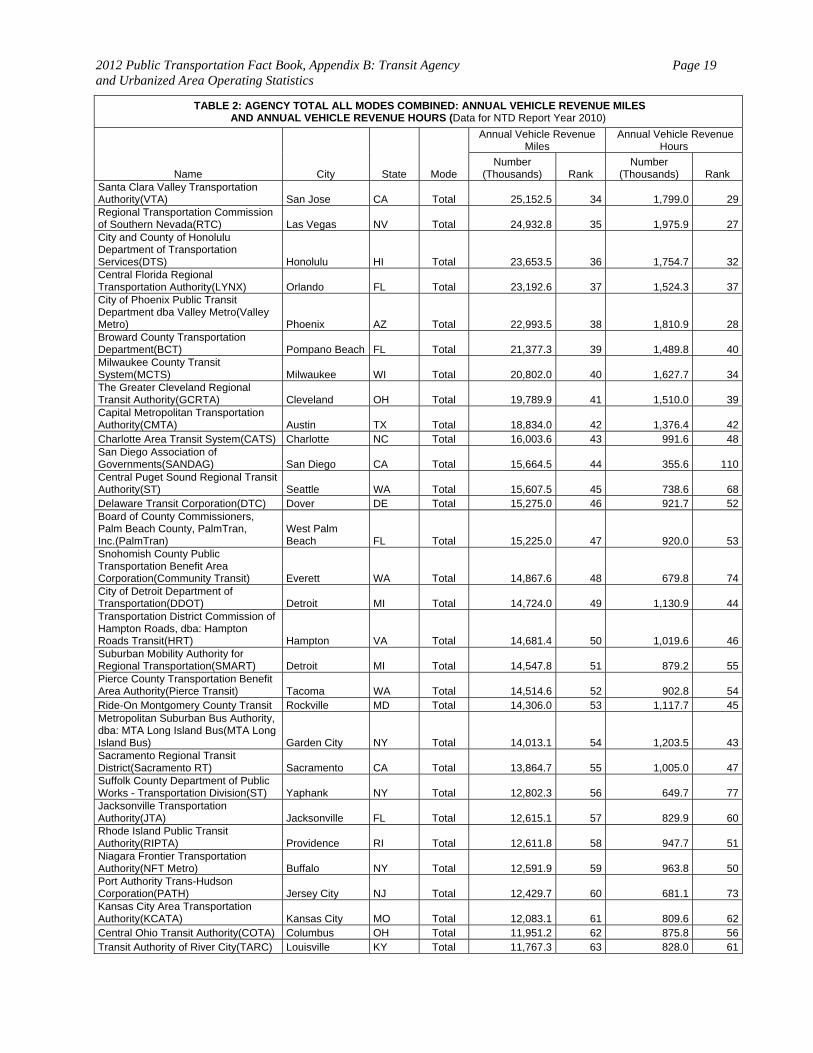
Santa Clara Valley Transportation Authority(VTA) San Jose CA Total 25,152.5 34 1,799.0 29Regional Transportation Commission of Southern Nevada(RTC) Las Vegas NV Total 24,932.8 35 1,975.9 27City and County of Honolulu Department of Transportation Services(DTS) Honolulu HI Total 23,653.5 36 1,754.7 32Central Florida Regional Transportation Authority(LYNX) Orlando FL Total 23,192.6 37 1,524.3 37City of Phoenix Public Transit Department dba Valley Metro(Valley Metro) Phoenix AZ Total 22,993.5 38 1,810.9 28Broward County Transportation Department(BCT) Pompano Beach FL Total 21,377.3 39 1,489.8 40Milwaukee County Transit System(MCTS) Milwaukee WI Total 20,802.0 40 1,627.7 34The Greater Cleveland Regional Transit Authority(GCRTA) Cleveland OH Total 19,789.9 41 1,510.0 39Capital Metropolitan Transportation Authority(CMTA) Austin TX Total 18,834.0 42 1,376.4 42Charlotte Area Transit System(CATS) Charlotte NC Total 16,003.6 43 991.6 48San Diego Association of Governments(SANDAG) San Diego CA Total 15,664.5 44 355.6 110Central Puget Sound Regional Transit Authority(ST) Seattle WA Total 15,607.5 45 738.6 68Delaware Transit Corporation(DTC) Dover DE Total 15,275.0 46 921.7 52Board of County Commissioners, Palm Beach County, PalmTran, Inc.(PalmTran)
West Palm Beach FL Total 15,225.0 47 920.0 53
Snohomish County Public Transportation Benefit Area Corporation(Community Transit) Everett WA Total 14,867.6 48 679.8 74City of Detroit Department of Transportation(DDOT) Detroit MI Total 14,724.0 49 1,130.9 44Transportation District Commission of Hampton Roads, dba: Hampton Roads Transit(HRT) Hampton VA Total 14,681.4 50 1,019.6 46Suburban Mobility Authority for Regional Transportation(SMART) Detroit MI Total 14,547.8 51 879.2 55Pierce County Transportation Benefit Area Authority(Pierce Transit) Tacoma WA Total 14,514.6 52 902.8 54Ride-On Montgomery County Transit Rockville MD Total 14,306.0 53 1,117.7 45Metropolitan Suburban Bus Authority, dba: MTA Long Island Bus(MTA Long Island Bus) Garden City NY Total 14,013.1 54 1,203.5 43Sacramento Regional Transit District(Sacramento RT) Sacramento CA Total 13,864.7 55 1,005.0 47Suffolk County Department of Public Works - Transportation Division(ST) Yaphank NY Total 12,802.3 56 649.7 77Jacksonville Transportation Authority(JTA) Jacksonville FL Total 12,615.1 57 829.9 60Rhode Island Public Transit Authority(RIPTA) Providence RI Total 12,611.8 58 947.7 51Niagara Frontier Transportation Authority(NFT Metro) Buffalo NY Total 12,591.9 59 963.8 50Port Authority Trans-Hudson Corporation(PATH) Jersey City NJ Total 12,429.7 60 681.1 73Kansas City Area Transportation Authority(KCATA) Kansas City MO Total 12,083.1 61 809.6 62Central Ohio Transit Authority(COTA) Columbus OH Total 11,951.2 62 875.8 56Transit Authority of River City(TARC) Louisville KY Total 11,767.3 63 828.0 61
2012 Public Transportation Fact Book, Appendix B: Transit Agency and Urbanized Area Operating Statistics
Page 20
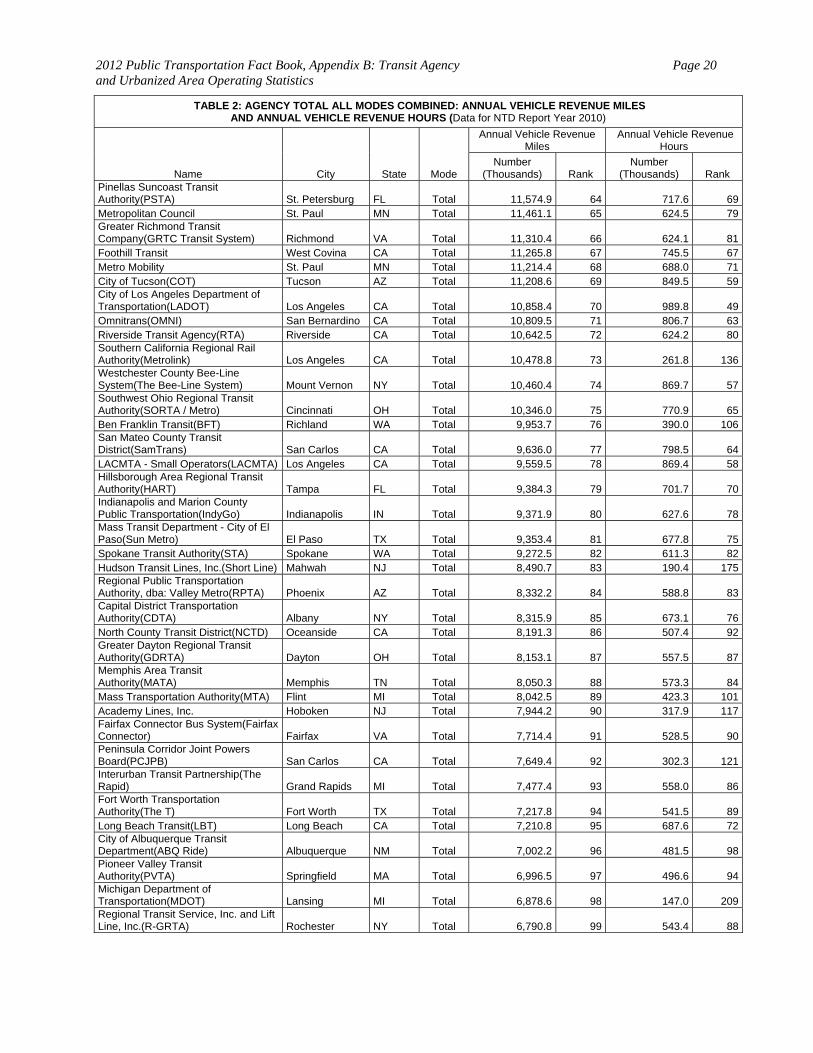
TABLE 2: AGENCY TOTAL ALL MODES COMBINED: ANNUAL VEHICLE REVENUE MILES AND ANNUAL VEHICLE REVENUE HOURS (Data for NTD Report Year 2010)
Name City State Mode
Annual Vehicle Revenue Miles
Annual Vehicle Revenue Hours
Number (Thousands) Rank
Number (Thousands) Rank
Pinellas Suncoast Transit Authority(PSTA) St. Petersburg FL Total 11,574.9 64 717.6 69Metropolitan Council St. Paul MN Total 11,461.1 65 624.5 79Greater Richmond Transit Company(GRTC Transit System) Richmond VA Total 11,310.4 66 624.1 81Foothill Transit West Covina CA Total 11,265.8 67 745.5 67Metro Mobility St. Paul MN Total 11,214.4 68 688.0 71City of Tucson(COT) Tucson AZ Total 11,208.6 69 849.5 59City of Los Angeles Department of Transportation(LADOT) Los Angeles CA Total 10,858.4 70 989.8 49Omnitrans(OMNI) San Bernardino CA Total 10,809.5 71 806.7 63Riverside Transit Agency(RTA) Riverside CA Total 10,642.5 72 624.2 80Southern California Regional Rail Authority(Metrolink) Los Angeles CA Total 10,478.8 73 261.8 136Westchester County Bee-Line System(The Bee-Line System) Mount Vernon NY Total 10,460.4 74 869.7 57Southwest Ohio Regional Transit Authority(SORTA / Metro) Cincinnati OH Total 10,346.0 75 770.9 65Ben Franklin Transit(BFT) Richland WA Total 9,953.7 76 390.0 106San Mateo County Transit District(SamTrans) San Carlos CA Total 9,636.0 77 798.5 64LACMTA - Small Operators(LACMTA) Los Angeles CA Total 9,559.5 78 869.4 58Hillsborough Area Regional Transit Authority(HART) Tampa FL Total 9,384.3 79 701.7 70Indianapolis and Marion County Public Transportation(IndyGo) Indianapolis IN Total 9,371.9 80 627.6 78Mass Transit Department - City of El Paso(Sun Metro) El Paso TX Total 9,353.4 81 677.8 75Spokane Transit Authority(STA) Spokane WA Total 9,272.5 82 611.3 82Hudson Transit Lines, Inc.(Short Line) Mahwah NJ Total 8,490.7 83 190.4 175Regional Public Transportation Authority, dba: Valley Metro(RPTA) Phoenix AZ Total 8,332.2 84 588.8 83Capital District Transportation Authority(CDTA) Albany NY Total 8,315.9 85 673.1 76North County Transit District(NCTD) Oceanside CA Total 8,191.3 86 507.4 92Greater Dayton Regional Transit Authority(GDRTA) Dayton OH Total 8,153.1 87 557.5 87Memphis Area Transit Authority(MATA) Memphis TN Total 8,050.3 88 573.3 84Mass Transportation Authority(MTA) Flint MI Total 8,042.5 89 423.3 101Academy Lines, Inc. Hoboken NJ Total 7,944.2 90 317.9 117Fairfax Connector Bus System(Fairfax Connector) Fairfax VA Total 7,714.4 91 528.5 90Peninsula Corridor Joint Powers Board(PCJPB) San Carlos CA Total 7,649.4 92 302.3 121Interurban Transit Partnership(The Rapid) Grand Rapids MI Total 7,477.4 93 558.0 86Fort Worth Transportation Authority(The T) Fort Worth TX Total 7,217.8 94 541.5 89Long Beach Transit(LBT) Long Beach CA Total 7,210.8 95 687.6 72City of Albuquerque Transit Department(ABQ Ride) Albuquerque NM Total 7,002.2 96 481.5 98Pioneer Valley Transit Authority(PVTA) Springfield MA Total 6,996.5 97 496.6 94Michigan Department of Transportation(MDOT) Lansing MI Total 6,878.6 98 147.0 209Regional Transit Service, Inc. and Lift Line, Inc.(R-GRTA) Rochester NY Total 6,790.8 99 543.4 88

2012 Public Transportation Fact Book, Appendix B: Transit Agency and Urbanized Area Operating Statistics
Page 21
TABLE 2: AGENCY TOTAL ALL MODES COMBINED: ANNUAL VEHICLE REVENUE MILES AND ANNUAL VEHICLE REVENUE HOURS (Data for NTD Report Year 2010)
Name City State Mode
Annual Vehicle Revenue Miles
Annual Vehicle Revenue Hours
Number (Thousands) Rank
Number (Thousands) Rank
Golden Gate Bridge, Highway and Transportation District(GGBHTD) San Francisco CA Total 6,735.9 100 419.4 102Metropolitan Transit Authority(MTA) Nashville TN Total 6,722.9 101 441.6 99City of Tempe Transit Division - dba Valley Metro(TIM - Tempe in Motion) Tempe AZ Total 6,701.4 102 564.8 85Metro Transit System(Metro) Madison WI Total 6,578.1 103 490.2 96Lehigh and Northampton Transportation Authority(LANTA) Allentown PA Total 6,460.6 104 367.8 108Connecticut Transit - Hartford Division(CTTransit) Hartford CT Total 6,440.8 105 497.3 93Intercity Transit(I.T.) Olympia WA Total 6,418.9 106 338.6 114Metropolitan Bus Authority(MBA) San Juan PR Total 6,365.1 107 755.4 66Fresno Area Express(FAX) Fresno CA Total 6,172.2 108 493.7 95Madison County Transit District(MCT) Granite City IL Total 6,042.6 109 284.5 127Capital Area Transportation Authority(CATA) Lansing MI Total 5,797.5 110 417.5 103Lane Transit District(LTD) Eugene OR Total 5,776.3 111 412.5 104Kings County Area Public Transit Agency(KART) Hanford CA Total 5,775.1 112 148.8 204Salem Area Mass Transit District(Cherriots) Salem OR Total 5,728.7 113 396.0 105New Orleans Regional Transit Authority(NORTA) New Orleans LA Total 5,674.9 114 485.8 97Des Moines Area Regional Transit Authority(DART) Des Moines IA Total 5,519.7 115 301.4 122Santa Monica's Big Blue Bus(Big Blue Bus ) Santa Monica CA Total 5,424.0 116 514.7 91Clark County Public Transportation Benefit Area Authority(C-Tran) Vancouver WA Total 5,263.1 117 339.4 113Phoenix - VPSI, Inc. Glendale AZ Total 5,254.6 118 127.3 235Greater Hartford Ridesharing Corporation - The Rideshare Company(GHRC) Bloomfield CT Total 5,166.1 119 122.1 248Suburban Transit Corporation(Coach USA) New Brunswick NJ Total 5,090.1 120 259.8 137County of Volusia, dba: VOTRAN(Votran) South Daytona FL Total 5,089.3 121 305.6 120Monterey-Salinas Transit(MST) Monterey CA Total 4,809.5 122 297.4 124Transit Authority of Omaha(MAT) Omaha NE Total 4,699.5 123 344.8 112Capital Area Transit(CAT) Raleigh NC Total 4,675.2 124 430.3 100CNY Centro, Inc. (CNY Centro ) Syracuse NY Total 4,622.9 125 384.7 107Kitsap Transit Bremerton WA Total 4,570.4 126 229.0 158Honolulu - VPSI, Inc. Honolulu HI Total 4,476.5 127 122.7 246Cobb County Department of Transportation Authority(CCT) Marietta GA Total 4,399.1 128 242.5 150Port Authority Transit Corporation(PATCO) Lindenwold NJ Total 4,383.4 129 141.1 218
Mountain Metropolitan Transit(MMT) Colorado Springs CO Total 4,345.6 130 250.5 144
Lee County Transit(LeeTran) Fort Myers FL Total 4,344.5 131 252.0 143Corpus Christi Regional Transportation Authority(The B) Corpus Christi TX Total 4,321.9 132 280.5 130METRO Regional Transit Authority(METRO) Akron OH Total 4,271.3 133 361.1 109Metropolitan Tulsa Transit Authority(MTTA) Tulsa OK Total 4,241.7 134 262.0 135Space Coast Area Transit(SCAT) Cocoa FL Total 4,229.6 135 194.7 172Marietta - VPSI, Inc. Marietta GA Total 4,201.9 136 103.0 285
2012 Public Transportation Fact Book, Appendix B: Transit Agency and Urbanized Area Operating Statistics
Page 22
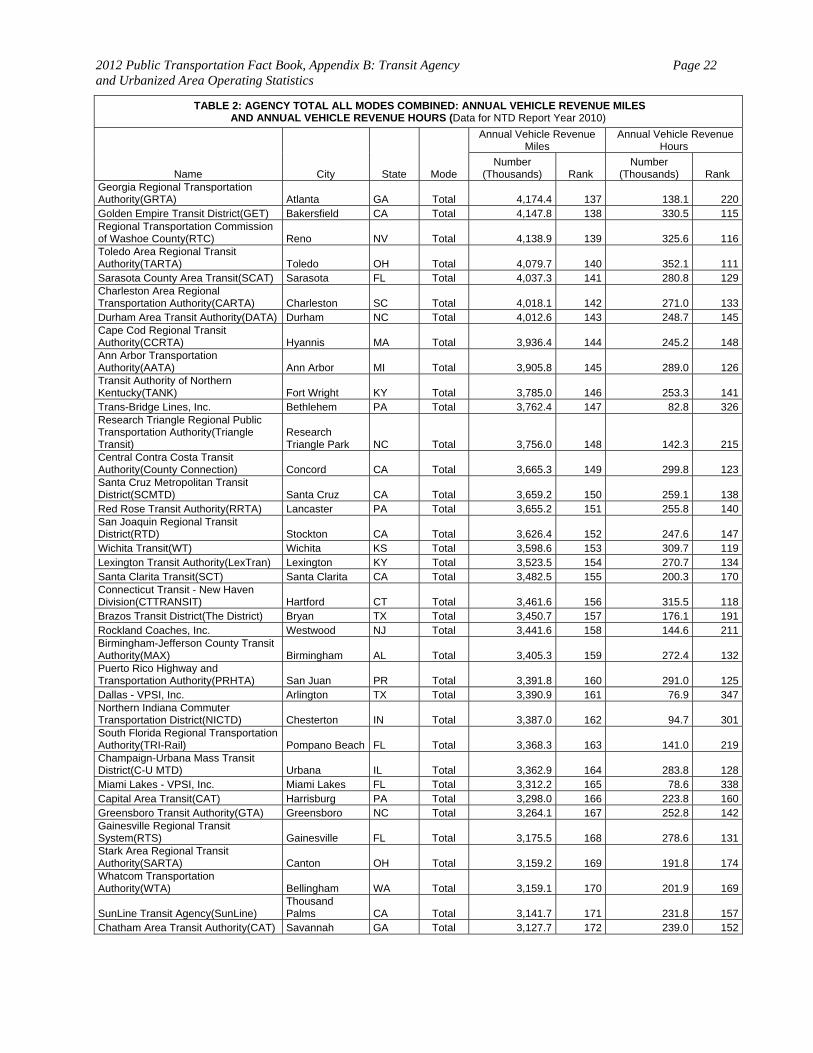
TABLE 2: AGENCY TOTAL ALL MODES COMBINED: ANNUAL VEHICLE REVENUE MILES AND ANNUAL VEHICLE REVENUE HOURS (Data for NTD Report Year 2010)
Name City State Mode
Annual Vehicle Revenue Miles
Annual Vehicle Revenue Hours
Number (Thousands) Rank
Number (Thousands) Rank
Georgia Regional Transportation Authority(GRTA) Atlanta GA Total 4,174.4 137 138.1 220Golden Empire Transit District(GET) Bakersfield CA Total 4,147.8 138 330.5 115Regional Transportation Commission of Washoe County(RTC) Reno NV Total 4,138.9 139 325.6 116Toledo Area Regional Transit Authority(TARTA) Toledo OH Total 4,079.7 140 352.1 111Sarasota County Area Transit(SCAT) Sarasota FL Total 4,037.3 141 280.8 129Charleston Area Regional Transportation Authority(CARTA) Charleston SC Total 4,018.1 142 271.0 133Durham Area Transit Authority(DATA) Durham NC Total 4,012.6 143 248.7 145Cape Cod Regional Transit Authority(CCRTA) Hyannis MA Total 3,936.4 144 245.2 148Ann Arbor Transportation Authority(AATA) Ann Arbor MI Total 3,905.8 145 289.0 126Transit Authority of Northern Kentucky(TANK) Fort Wright KY Total 3,785.0 146 253.3 141Trans-Bridge Lines, Inc. Bethlehem PA Total 3,762.4 147 82.8 326Research Triangle Regional Public Transportation Authority(Triangle Transit)
Research Triangle Park NC Total 3,756.0 148 142.3 215
Central Contra Costa Transit Authority(County Connection) Concord CA Total 3,665.3 149 299.8 123Santa Cruz Metropolitan Transit District(SCMTD) Santa Cruz CA Total 3,659.2 150 259.1 138Red Rose Transit Authority(RRTA) Lancaster PA Total 3,655.2 151 255.8 140San Joaquin Regional Transit District(RTD) Stockton CA Total 3,626.4 152 247.6 147Wichita Transit(WT) Wichita KS Total 3,598.6 153 309.7 119Lexington Transit Authority(LexTran) Lexington KY Total 3,523.5 154 270.7 134Santa Clarita Transit(SCT) Santa Clarita CA Total 3,482.5 155 200.3 170Connecticut Transit - New Haven Division(CTTRANSIT) Hartford CT Total 3,461.6 156 315.5 118Brazos Transit District(The District) Bryan TX Total 3,450.7 157 176.1 191Rockland Coaches, Inc. Westwood NJ Total 3,441.6 158 144.6 211Birmingham-Jefferson County Transit Authority(MAX) Birmingham AL Total 3,405.3 159 272.4 132Puerto Rico Highway and Transportation Authority(PRHTA) San Juan PR Total 3,391.8 160 291.0 125Dallas - VPSI, Inc. Arlington TX Total 3,390.9 161 76.9 347Northern Indiana Commuter Transportation District(NICTD) Chesterton IN Total 3,387.0 162 94.7 301South Florida Regional Transportation Authority(TRI-Rail) Pompano Beach FL Total 3,368.3 163 141.0 219Champaign-Urbana Mass Transit District(C-U MTD) Urbana IL Total 3,362.9 164 283.8 128Miami Lakes - VPSI, Inc. Miami Lakes FL Total 3,312.2 165 78.6 338Capital Area Transit(CAT) Harrisburg PA Total 3,298.0 166 223.8 160Greensboro Transit Authority(GTA) Greensboro NC Total 3,264.1 167 252.8 142Gainesville Regional Transit System(RTS) Gainesville FL Total 3,175.5 168 278.6 131Stark Area Regional Transit Authority(SARTA) Canton OH Total 3,159.2 169 191.8 174Whatcom Transportation Authority(WTA) Bellingham WA Total 3,159.1 170 201.9 169
SunLine Transit Agency(SunLine) Thousand Palms CA Total 3,141.7 171 231.8 157
Chatham Area Transit Authority(CAT) Savannah GA Total 3,127.7 172 239.0 152
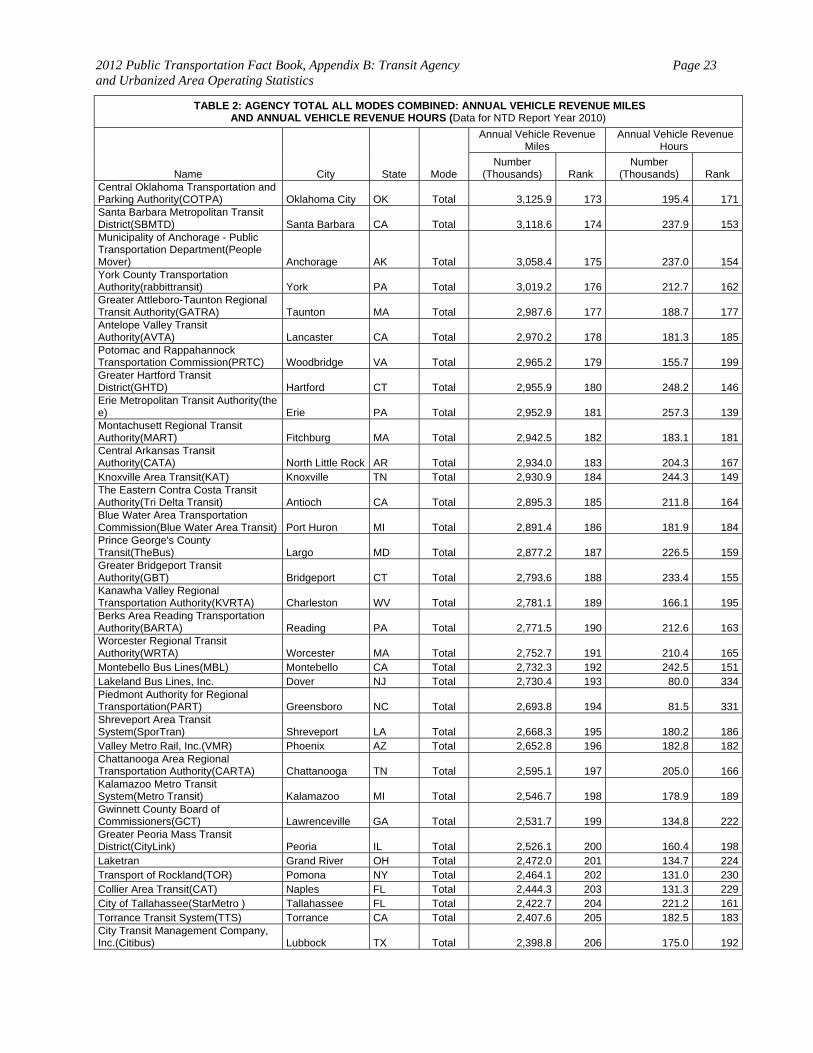
2012 Public Transportation Fact Book, Appendix B: Transit Agency and Urbanized Area Operating Statistics
Page 23
TABLE 2: AGENCY TOTAL ALL MODES COMBINED: ANNUAL VEHICLE REVENUE MILES AND ANNUAL VEHICLE REVENUE HOURS (Data for NTD Report Year 2010)
Name City State Mode
Annual Vehicle Revenue Miles
Annual Vehicle Revenue Hours
Number (Thousands) Rank
Number (Thousands) Rank
Central Oklahoma Transportation and Parking Authority(COTPA) Oklahoma City OK Total 3,125.9 173 195.4 171Santa Barbara Metropolitan Transit District(SBMTD) Santa Barbara CA Total 3,118.6 174 237.9 153Municipality of Anchorage - Public Transportation Department(People Mover) Anchorage AK Total 3,058.4 175 237.0 154York County Transportation Authority(rabbittransit) York PA Total 3,019.2 176 212.7 162Greater Attleboro-Taunton Regional Transit Authority(GATRA) Taunton MA Total 2,987.6 177 188.7 177Antelope Valley Transit Authority(AVTA) Lancaster CA Total 2,970.2 178 181.3 185Potomac and Rappahannock Transportation Commission(PRTC) Woodbridge VA Total 2,965.2 179 155.7 199Greater Hartford Transit District(GHTD) Hartford CT Total 2,955.9 180 248.2 146Erie Metropolitan Transit Authority(the e) Erie PA Total 2,952.9 181 257.3 139Montachusett Regional Transit Authority(MART) Fitchburg MA Total 2,942.5 182 183.1 181Central Arkansas Transit Authority(CATA) North Little Rock AR Total 2,934.0 183 204.3 167Knoxville Area Transit(KAT) Knoxville TN Total 2,930.9 184 244.3 149The Eastern Contra Costa Transit Authority(Tri Delta Transit) Antioch CA Total 2,895.3 185 211.8 164Blue Water Area Transportation Commission(Blue Water Area Transit) Port Huron MI Total 2,891.4 186 181.9 184Prince George's County Transit(TheBus) Largo MD Total 2,877.2 187 226.5 159Greater Bridgeport Transit Authority(GBT) Bridgeport CT Total 2,793.6 188 233.4 155Kanawha Valley Regional Transportation Authority(KVRTA) Charleston WV Total 2,781.1 189 166.1 195Berks Area Reading Transportation Authority(BARTA) Reading PA Total 2,771.5 190 212.6 163Worcester Regional Transit Authority(WRTA) Worcester MA Total 2,752.7 191 210.4 165Montebello Bus Lines(MBL) Montebello CA Total 2,732.3 192 242.5 151Lakeland Bus Lines, Inc. Dover NJ Total 2,730.4 193 80.0 334Piedmont Authority for Regional Transportation(PART) Greensboro NC Total 2,693.8 194 81.5 331Shreveport Area Transit System(SporTran) Shreveport LA Total 2,668.3 195 180.2 186Valley Metro Rail, Inc.(VMR) Phoenix AZ Total 2,652.8 196 182.8 182Chattanooga Area Regional Transportation Authority(CARTA) Chattanooga TN Total 2,595.1 197 205.0 166Kalamazoo Metro Transit System(Metro Transit) Kalamazoo MI Total 2,546.7 198 178.9 189Gwinnett County Board of Commissioners(GCT) Lawrenceville GA Total 2,531.7 199 134.8 222Greater Peoria Mass Transit District(CityLink) Peoria IL Total 2,526.1 200 160.4 198Laketran Grand River OH Total 2,472.0 201 134.7 224Transport of Rockland(TOR) Pomona NY Total 2,464.1 202 131.0 230Collier Area Transit(CAT) Naples FL Total 2,444.3 203 131.3 229City of Tallahassee(StarMetro ) Tallahassee FL Total 2,422.7 204 221.2 161Torrance Transit System(TTS) Torrance CA Total 2,407.6 205 182.5 183City Transit Management Company, Inc.(Citibus) Lubbock TX Total 2,398.8 206 175.0 192
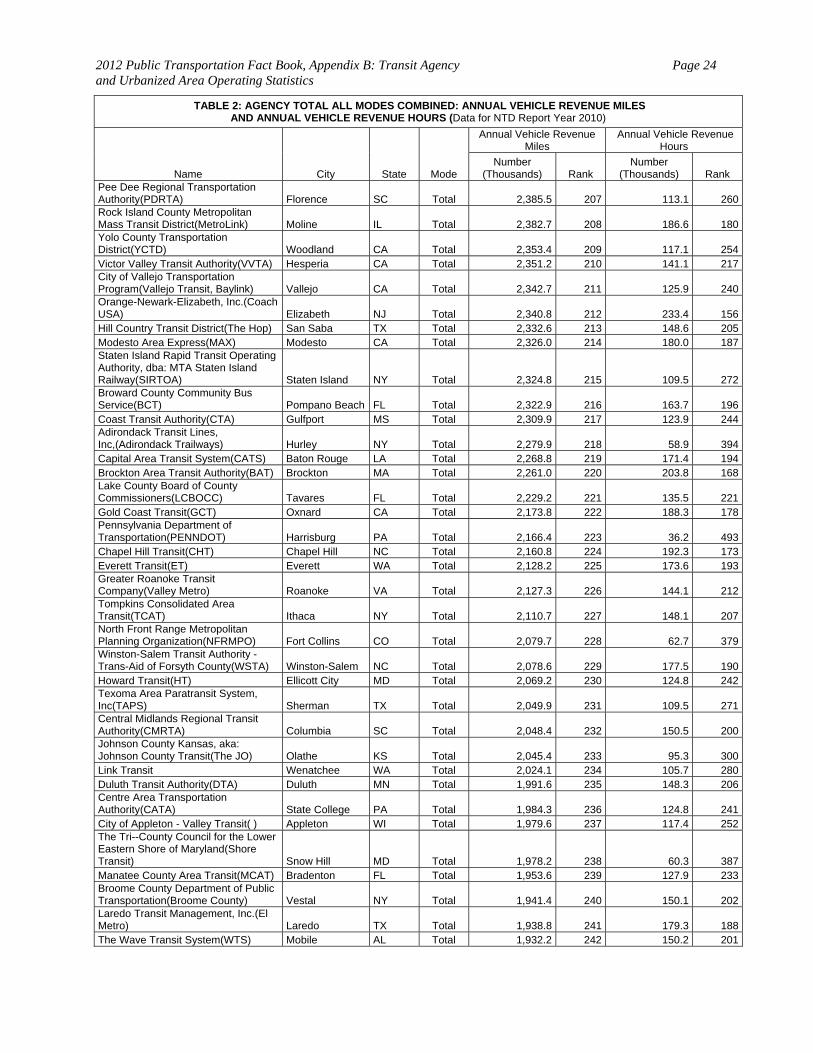
2012 Public Transportation Fact Book, Appendix B: Transit Agency and Urbanized Area Operating Statistics
Page 24
TABLE 2: AGENCY TOTAL ALL MODES COMBINED: ANNUAL VEHICLE REVENUE MILES AND ANNUAL VEHICLE REVENUE HOURS (Data for NTD Report Year 2010)
Name City State Mode
Annual Vehicle Revenue Miles
Annual Vehicle Revenue Hours
Number (Thousands) Rank
Number (Thousands) Rank
Pee Dee Regional Transportation Authority(PDRTA) Florence SC Total 2,385.5 207 113.1 260Rock Island County Metropolitan Mass Transit District(MetroLink) Moline IL Total 2,382.7 208 186.6 180Yolo County Transportation District(YCTD) Woodland CA Total 2,353.4 209 117.1 254Victor Valley Transit Authority(VVTA) Hesperia CA Total 2,351.2 210 141.1 217City of Vallejo Transportation Program(Vallejo Transit, Baylink) Vallejo CA Total 2,342.7 211 125.9 240Orange-Newark-Elizabeth, Inc.(Coach USA) Elizabeth NJ Total 2,340.8 212 233.4 156Hill Country Transit District(The Hop) San Saba TX Total 2,332.6 213 148.6 205Modesto Area Express(MAX) Modesto CA Total 2,326.0 214 180.0 187Staten Island Rapid Transit Operating Authority, dba: MTA Staten Island Railway(SIRTOA) Staten Island NY Total 2,324.8 215 109.5 272Broward County Community Bus Service(BCT) Pompano Beach FL Total 2,322.9 216 163.7 196Coast Transit Authority(CTA) Gulfport MS Total 2,309.9 217 123.9 244Adirondack Transit Lines, Inc,(Adirondack Trailways) Hurley NY Total 2,279.9 218 58.9 394Capital Area Transit System(CATS) Baton Rouge LA Total 2,268.8 219 171.4 194Brockton Area Transit Authority(BAT) Brockton MA Total 2,261.0 220 203.8 168Lake County Board of County Commissioners(LCBOCC) Tavares FL Total 2,229.2 221 135.5 221Gold Coast Transit(GCT) Oxnard CA Total 2,173.8 222 188.3 178Pennsylvania Department of Transportation(PENNDOT) Harrisburg PA Total 2,166.4 223 36.2 493Chapel Hill Transit(CHT) Chapel Hill NC Total 2,160.8 224 192.3 173Everett Transit(ET) Everett WA Total 2,128.2 225 173.6 193Greater Roanoke Transit Company(Valley Metro) Roanoke VA Total 2,127.3 226 144.1 212Tompkins Consolidated Area Transit(TCAT) Ithaca NY Total 2,110.7 227 148.1 207North Front Range Metropolitan Planning Organization(NFRMPO) Fort Collins CO Total 2,079.7 228 62.7 379Winston-Salem Transit Authority - Trans-Aid of Forsyth County(WSTA) Winston-Salem NC Total 2,078.6 229 177.5 190Howard Transit(HT) Ellicott City MD Total 2,069.2 230 124.8 242Texoma Area Paratransit System, Inc(TAPS) Sherman TX Total 2,049.9 231 109.5 271Central Midlands Regional Transit Authority(CMRTA) Columbia SC Total 2,048.4 232 150.5 200Johnson County Kansas, aka: Johnson County Transit(The JO) Olathe KS Total 2,045.4 233 95.3 300Link Transit Wenatchee WA Total 2,024.1 234 105.7 280Duluth Transit Authority(DTA) Duluth MN Total 1,991.6 235 148.3 206Centre Area Transportation Authority(CATA) State College PA Total 1,984.3 236 124.8 241City of Appleton - Valley Transit( ) Appleton WI Total 1,979.6 237 117.4 252The Tri--County Council for the Lower Eastern Shore of Maryland(Shore Transit) Snow Hill MD Total 1,978.2 238 60.3 387Manatee County Area Transit(MCAT) Bradenton FL Total 1,953.6 239 127.9 233Broome County Department of Public Transportation(Broome County) Vestal NY Total 1,941.4 240 150.1 202Laredo Transit Management, Inc.(El Metro) Laredo TX Total 1,938.8 241 179.3 188The Wave Transit System(WTS) Mobile AL Total 1,932.2 242 150.2 201
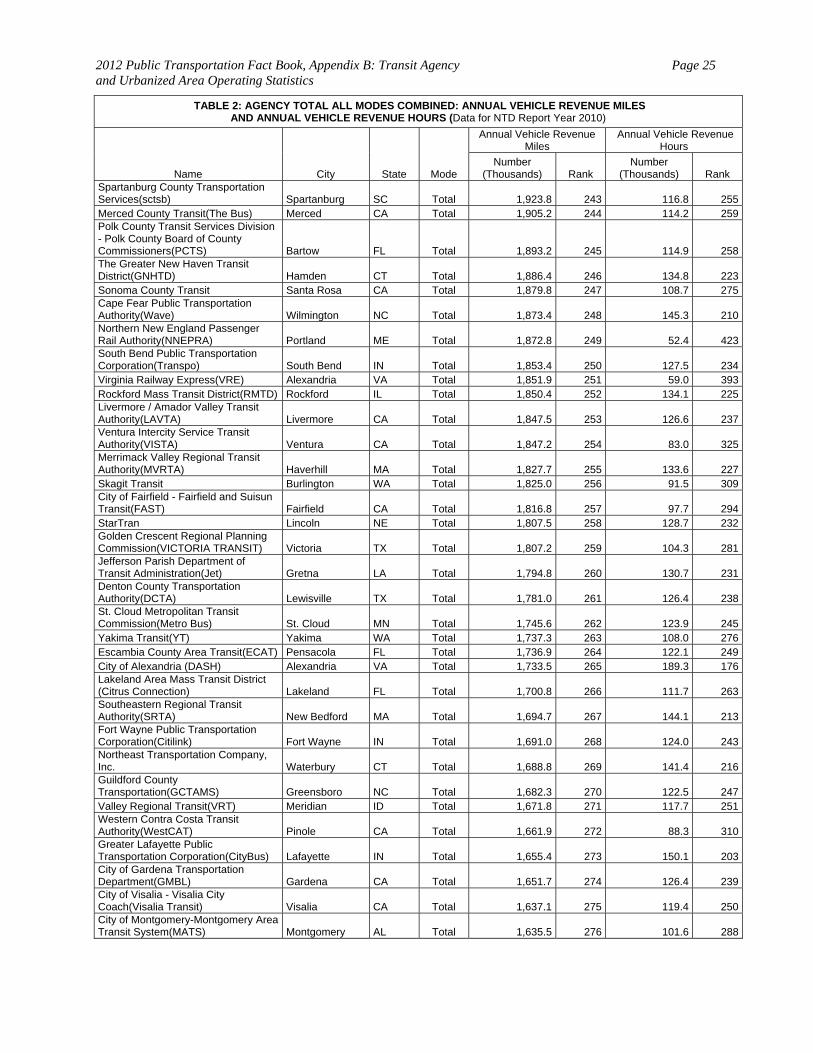
2012 Public Transportation Fact Book, Appendix B: Transit Agency and Urbanized Area Operating Statistics
Page 25
TABLE 2: AGENCY TOTAL ALL MODES COMBINED: ANNUAL VEHICLE REVENUE MILES AND ANNUAL VEHICLE REVENUE HOURS (Data for NTD Report Year 2010)
Name City State Mode
Annual Vehicle Revenue Miles
Annual Vehicle Revenue Hours
Number (Thousands) Rank
Number (Thousands) Rank
Spartanburg County Transportation Services(sctsb) Spartanburg SC Total 1,923.8 243 116.8 255Merced County Transit(The Bus) Merced CA Total 1,905.2 244 114.2 259Polk County Transit Services Division - Polk County Board of County Commissioners(PCTS) Bartow FL Total 1,893.2 245 114.9 258The Greater New Haven Transit District(GNHTD) Hamden CT Total 1,886.4 246 134.8 223Sonoma County Transit Santa Rosa CA Total 1,879.8 247 108.7 275Cape Fear Public Transportation Authority(Wave) Wilmington NC Total 1,873.4 248 145.3 210Northern New England Passenger Rail Authority(NNEPRA) Portland ME Total 1,872.8 249 52.4 423South Bend Public Transportation Corporation(Transpo) South Bend IN Total 1,853.4 250 127.5 234Virginia Railway Express(VRE) Alexandria VA Total 1,851.9 251 59.0 393Rockford Mass Transit District(RMTD) Rockford IL Total 1,850.4 252 134.1 225Livermore / Amador Valley Transit Authority(LAVTA) Livermore CA Total 1,847.5 253 126.6 237Ventura Intercity Service Transit Authority(VISTA) Ventura CA Total 1,847.2 254 83.0 325Merrimack Valley Regional Transit Authority(MVRTA) Haverhill MA Total 1,827.7 255 133.6 227Skagit Transit Burlington WA Total 1,825.0 256 91.5 309City of Fairfield - Fairfield and Suisun Transit(FAST) Fairfield CA Total 1,816.8 257 97.7 294StarTran Lincoln NE Total 1,807.5 258 128.7 232Golden Crescent Regional Planning Commission(VICTORIA TRANSIT) Victoria TX Total 1,807.2 259 104.3 281Jefferson Parish Department of Transit Administration(Jet) Gretna LA Total 1,794.8 260 130.7 231Denton County Transportation Authority(DCTA) Lewisville TX Total 1,781.0 261 126.4 238St. Cloud Metropolitan Transit Commission(Metro Bus) St. Cloud MN Total 1,745.6 262 123.9 245Yakima Transit(YT) Yakima WA Total 1,737.3 263 108.0 276Escambia County Area Transit(ECAT) Pensacola FL Total 1,736.9 264 122.1 249City of Alexandria (DASH) Alexandria VA Total 1,733.5 265 189.3 176Lakeland Area Mass Transit District (Citrus Connection) Lakeland FL Total 1,700.8 266 111.7 263Southeastern Regional Transit Authority(SRTA) New Bedford MA Total 1,694.7 267 144.1 213Fort Wayne Public Transportation Corporation(Citilink) Fort Wayne IN Total 1,691.0 268 124.0 243Northeast Transportation Company, Inc. Waterbury CT Total 1,688.8 269 141.4 216Guildford County Transportation(GCTAMS) Greensboro NC Total 1,682.3 270 122.5 247Valley Regional Transit(VRT) Meridian ID Total 1,671.8 271 117.7 251Western Contra Costa Transit Authority(WestCAT) Pinole CA Total 1,661.9 272 88.3 310Greater Lafayette Public Transportation Corporation(CityBus) Lafayette IN Total 1,655.4 273 150.1 203City of Gardena Transportation Department(GMBL) Gardena CA Total 1,651.7 274 126.4 239City of Visalia - Visalia City Coach(Visalia Transit) Visalia CA Total 1,637.1 275 119.4 250City of Montgomery-Montgomery Area Transit System(MATS) Montgomery AL Total 1,635.5 276 101.6 288
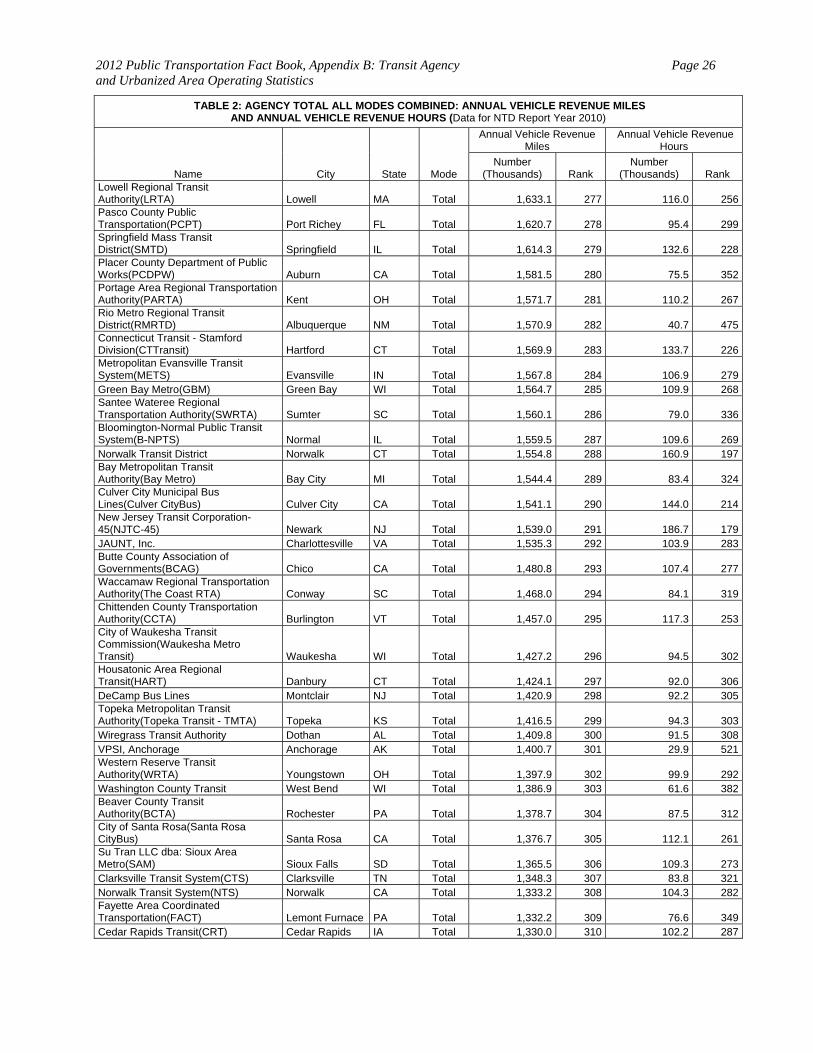
2012 Public Transportation Fact Book, Appendix B: Transit Agency and Urbanized Area Operating Statistics
Page 26
TABLE 2: AGENCY TOTAL ALL MODES COMBINED: ANNUAL VEHICLE REVENUE MILES AND ANNUAL VEHICLE REVENUE HOURS (Data for NTD Report Year 2010)
Name City State Mode
Annual Vehicle Revenue Miles
Annual Vehicle Revenue Hours
Number (Thousands) Rank
Number (Thousands) Rank
Lowell Regional Transit Authority(LRTA) Lowell MA Total 1,633.1 277 116.0 256Pasco County Public Transportation(PCPT) Port Richey FL Total 1,620.7 278 95.4 299Springfield Mass Transit District(SMTD) Springfield IL Total 1,614.3 279 132.6 228Placer County Department of Public Works(PCDPW) Auburn CA Total 1,581.5 280 75.5 352Portage Area Regional Transportation Authority(PARTA) Kent OH Total 1,571.7 281 110.2 267Rio Metro Regional Transit District(RMRTD) Albuquerque NM Total 1,570.9 282 40.7 475Connecticut Transit - Stamford Division(CTTransit) Hartford CT Total 1,569.9 283 133.7 226Metropolitan Evansville Transit System(METS) Evansville IN Total 1,567.8 284 106.9 279Green Bay Metro(GBM) Green Bay WI Total 1,564.7 285 109.9 268Santee Wateree Regional Transportation Authority(SWRTA) Sumter SC Total 1,560.1 286 79.0 336Bloomington-Normal Public Transit System(B-NPTS) Normal IL Total 1,559.5 287 109.6 269Norwalk Transit District Norwalk CT Total 1,554.8 288 160.9 197Bay Metropolitan Transit Authority(Bay Metro) Bay City MI Total 1,544.4 289 83.4 324Culver City Municipal Bus Lines(Culver CityBus) Culver City CA Total 1,541.1 290 144.0 214New Jersey Transit Corporation-45(NJTC-45) Newark NJ Total 1,539.0 291 186.7 179JAUNT, Inc. Charlottesville VA Total 1,535.3 292 103.9 283Butte County Association of Governments(BCAG) Chico CA Total 1,480.8 293 107.4 277Waccamaw Regional Transportation Authority(The Coast RTA) Conway SC Total 1,468.0 294 84.1 319Chittenden County Transportation Authority(CCTA) Burlington VT Total 1,457.0 295 117.3 253City of Waukesha Transit Commission(Waukesha Metro Transit) Waukesha WI Total 1,427.2 296 94.5 302Housatonic Area Regional Transit(HART) Danbury CT Total 1,424.1 297 92.0 306DeCamp Bus Lines Montclair NJ Total 1,420.9 298 92.2 305Topeka Metropolitan Transit Authority(Topeka Transit - TMTA) Topeka KS Total 1,416.5 299 94.3 303Wiregrass Transit Authority Dothan AL Total 1,409.8 300 91.5 308VPSI, Anchorage Anchorage AK Total 1,400.7 301 29.9 521Western Reserve Transit Authority(WRTA) Youngstown OH Total 1,397.9 302 99.9 292Washington County Transit West Bend WI Total 1,386.9 303 61.6 382Beaver County Transit Authority(BCTA) Rochester PA Total 1,378.7 304 87.5 312City of Santa Rosa(Santa Rosa CityBus) Santa Rosa CA Total 1,376.7 305 112.1 261Su Tran LLC dba: Sioux Area Metro(SAM) Sioux Falls SD Total 1,365.5 306 109.3 273Clarksville Transit System(CTS) Clarksville TN Total 1,348.3 307 83.8 321Norwalk Transit System(NTS) Norwalk CA Total 1,333.2 308 104.3 282Fayette Area Coordinated Transportation(FACT) Lemont Furnace PA Total 1,332.2 309 76.6 349Cedar Rapids Transit(CRT) Cedar Rapids IA Total 1,330.0 310 102.2 287
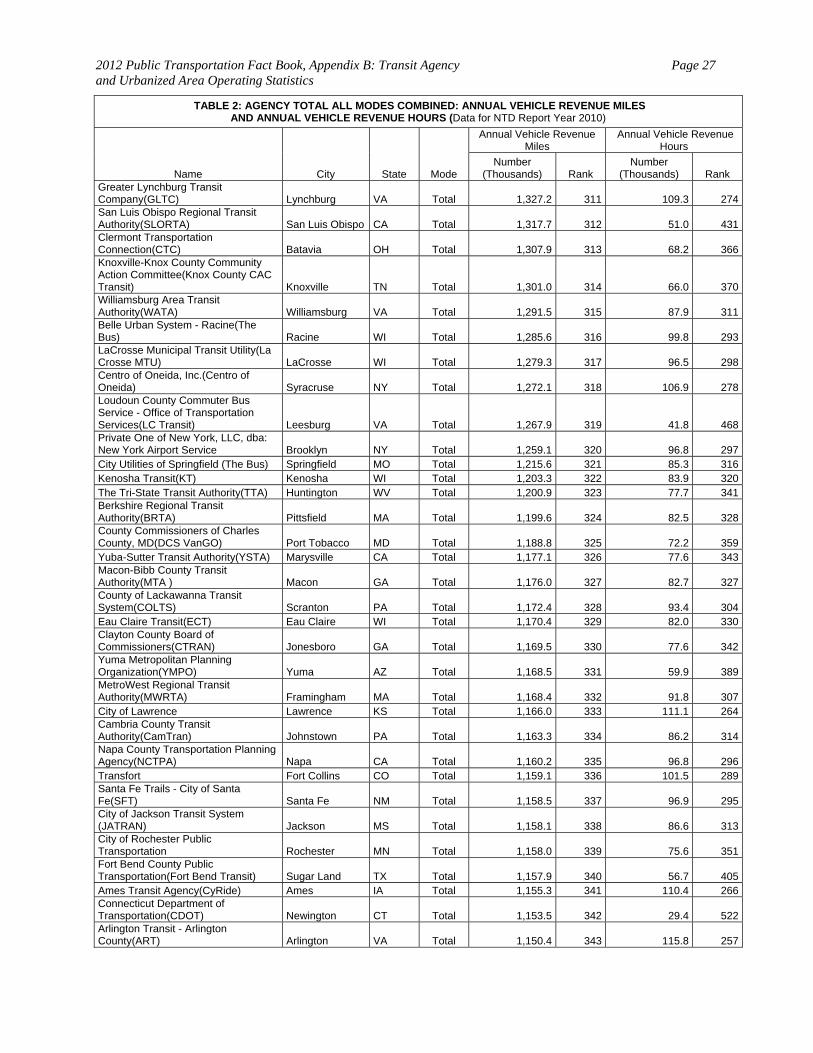
2012 Public Transportation Fact Book, Appendix B: Transit Agency and Urbanized Area Operating Statistics
Page 27
TABLE 2: AGENCY TOTAL ALL MODES COMBINED: ANNUAL VEHICLE REVENUE MILES AND ANNUAL VEHICLE REVENUE HOURS (Data for NTD Report Year 2010)
Name City State Mode
Annual Vehicle Revenue Miles
Annual Vehicle Revenue Hours
Number (Thousands) Rank
Number (Thousands) Rank
Greater Lynchburg Transit Company(GLTC) Lynchburg VA Total 1,327.2 311 109.3 274San Luis Obispo Regional Transit Authority(SLORTA) San Luis Obispo CA Total 1,317.7 312 51.0 431Clermont Transportation Connection(CTC) Batavia OH Total 1,307.9 313 68.2 366Knoxville-Knox County Community Action Committee(Knox County CAC Transit) Knoxville TN Total 1,301.0 314 66.0 370Williamsburg Area Transit Authority(WATA) Williamsburg VA Total 1,291.5 315 87.9 311Belle Urban System - Racine(The Bus) Racine WI Total 1,285.6 316 99.8 293LaCrosse Municipal Transit Utility(La Crosse MTU) LaCrosse WI Total 1,279.3 317 96.5 298Centro of Oneida, Inc.(Centro of Oneida) Syracruse NY Total 1,272.1 318 106.9 278Loudoun County Commuter Bus Service - Office of Transportation Services(LC Transit) Leesburg VA Total 1,267.9 319 41.8 468Private One of New York, LLC, dba: New York Airport Service Brooklyn NY Total 1,259.1 320 96.8 297City Utilities of Springfield (The Bus) Springfield MO Total 1,215.6 321 85.3 316Kenosha Transit(KT) Kenosha WI Total 1,203.3 322 83.9 320The Tri-State Transit Authority(TTA) Huntington WV Total 1,200.9 323 77.7 341Berkshire Regional Transit Authority(BRTA) Pittsfield MA Total 1,199.6 324 82.5 328County Commissioners of Charles County, MD(DCS VanGO) Port Tobacco MD Total 1,188.8 325 72.2 359Yuba-Sutter Transit Authority(YSTA) Marysville CA Total 1,177.1 326 77.6 343Macon-Bibb County Transit Authority(MTA ) Macon GA Total 1,176.0 327 82.7 327County of Lackawanna Transit System(COLTS) Scranton PA Total 1,172.4 328 93.4 304Eau Claire Transit(ECT) Eau Claire WI Total 1,170.4 329 82.0 330Clayton County Board of Commissioners(CTRAN) Jonesboro GA Total 1,169.5 330 77.6 342Yuma Metropolitan Planning Organization(YMPO) Yuma AZ Total 1,168.5 331 59.9 389MetroWest Regional Transit Authority(MWRTA) Framingham MA Total 1,168.4 332 91.8 307City of Lawrence Lawrence KS Total 1,166.0 333 111.1 264Cambria County Transit Authority(CamTran) Johnstown PA Total 1,163.3 334 86.2 314Napa County Transportation Planning Agency(NCTPA) Napa CA Total 1,160.2 335 96.8 296Transfort Fort Collins CO Total 1,159.1 336 101.5 289Santa Fe Trails - City of Santa Fe(SFT) Santa Fe NM Total 1,158.5 337 96.9 295City of Jackson Transit System (JATRAN) Jackson MS Total 1,158.1 338 86.6 313City of Rochester Public Transportation Rochester MN Total 1,158.0 339 75.6 351Fort Bend County Public Transportation(Fort Bend Transit) Sugar Land TX Total 1,157.9 340 56.7 405Ames Transit Agency(CyRide) Ames IA Total 1,155.3 341 110.4 266Connecticut Department of Transportation(CDOT) Newington CT Total 1,153.5 342 29.4 522Arlington Transit - Arlington County(ART) Arlington VA Total 1,150.4 343 115.8 257
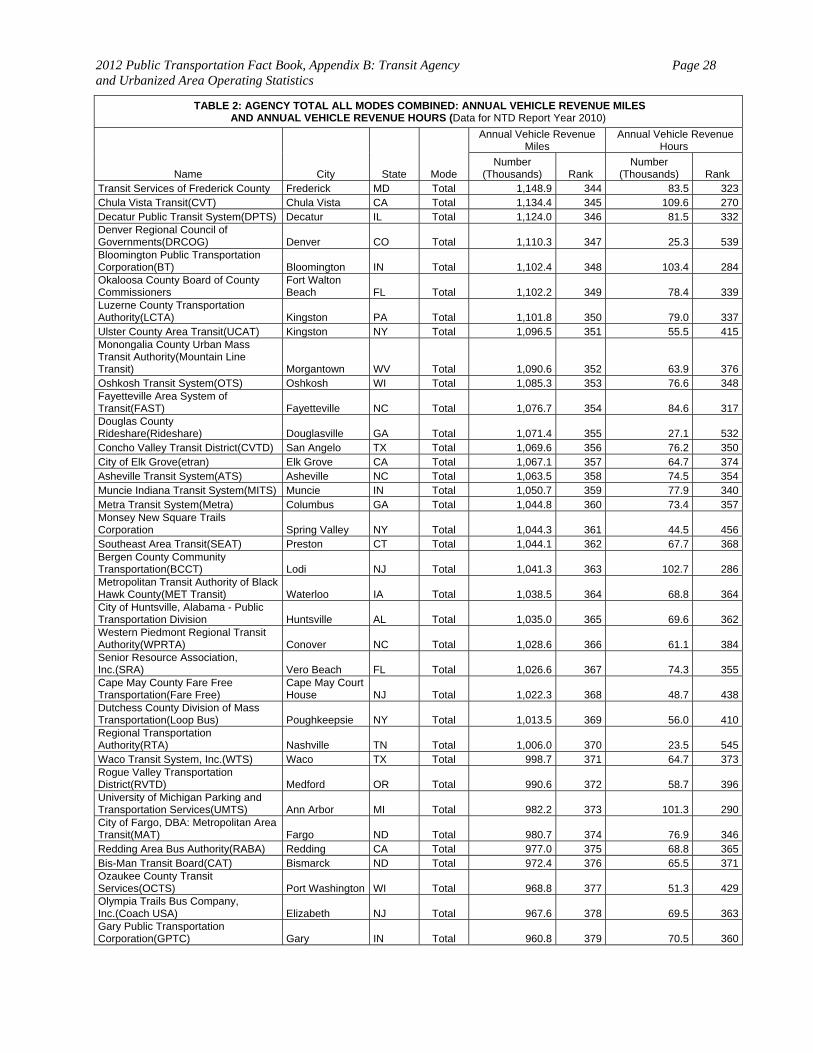
2012 Public Transportation Fact Book, Appendix B: Transit Agency and Urbanized Area Operating Statistics
Page 28
TABLE 2: AGENCY TOTAL ALL MODES COMBINED: ANNUAL VEHICLE REVENUE MILES AND ANNUAL VEHICLE REVENUE HOURS (Data for NTD Report Year 2010)
Name City State Mode
Annual Vehicle Revenue Miles
Annual Vehicle Revenue Hours
Number (Thousands) Rank
Number (Thousands) Rank
Transit Services of Frederick County Frederick MD Total 1,148.9 344 83.5 323Chula Vista Transit(CVT) Chula Vista CA Total 1,134.4 345 109.6 270Decatur Public Transit System(DPTS) Decatur IL Total 1,124.0 346 81.5 332Denver Regional Council of Governments(DRCOG) Denver CO Total 1,110.3 347 25.3 539Bloomington Public Transportation Corporation(BT) Bloomington IN Total 1,102.4 348 103.4 284Okaloosa County Board of County Commissioners
Fort Walton Beach FL Total 1,102.2 349 78.4 339
Luzerne County Transportation Authority(LCTA) Kingston PA Total 1,101.8 350 79.0 337Ulster County Area Transit(UCAT) Kingston NY Total 1,096.5 351 55.5 415Monongalia County Urban Mass Transit Authority(Mountain Line Transit) Morgantown WV Total 1,090.6 352 63.9 376Oshkosh Transit System(OTS) Oshkosh WI Total 1,085.3 353 76.6 348Fayetteville Area System of Transit(FAST) Fayetteville NC Total 1,076.7 354 84.6 317Douglas County Rideshare(Rideshare) Douglasville GA Total 1,071.4 355 27.1 532Concho Valley Transit District(CVTD) San Angelo TX Total 1,069.6 356 76.2 350City of Elk Grove(etran) Elk Grove CA Total 1,067.1 357 64.7 374Asheville Transit System(ATS) Asheville NC Total 1,063.5 358 74.5 354Muncie Indiana Transit System(MITS) Muncie IN Total 1,050.7 359 77.9 340Metra Transit System(Metra) Columbus GA Total 1,044.8 360 73.4 357Monsey New Square Trails Corporation Spring Valley NY Total 1,044.3 361 44.5 456Southeast Area Transit(SEAT) Preston CT Total 1,044.1 362 67.7 368Bergen County Community Transportation(BCCT) Lodi NJ Total 1,041.3 363 102.7 286Metropolitan Transit Authority of Black Hawk County(MET Transit) Waterloo IA Total 1,038.5 364 68.8 364City of Huntsville, Alabama - Public Transportation Division Huntsville AL Total 1,035.0 365 69.6 362Western Piedmont Regional Transit Authority(WPRTA) Conover NC Total 1,028.6 366 61.1 384Senior Resource Association, Inc.(SRA) Vero Beach FL Total 1,026.6 367 74.3 355Cape May County Fare Free Transportation(Fare Free)
Cape May Court House NJ Total 1,022.3 368 48.7 438
Dutchess County Division of Mass Transportation(Loop Bus) Poughkeepsie NY Total 1,013.5 369 56.0 410Regional Transportation Authority(RTA) Nashville TN Total 1,006.0 370 23.5 545Waco Transit System, Inc.(WTS) Waco TX Total 998.7 371 64.7 373Rogue Valley Transportation District(RVTD) Medford OR Total 990.6 372 58.7 396University of Michigan Parking and Transportation Services(UMTS) Ann Arbor MI Total 982.2 373 101.3 290City of Fargo, DBA: Metropolitan Area Transit(MAT) Fargo ND Total 980.7 374 76.9 346Redding Area Bus Authority(RABA) Redding CA Total 977.0 375 68.8 365Bis-Man Transit Board(CAT) Bismarck ND Total 972.4 376 65.5 371Ozaukee County Transit Services(OCTS) Port Washington WI Total 968.8 377 51.3 429Olympia Trails Bus Company, Inc.(Coach USA) Elizabeth NJ Total 967.6 378 69.5 363Gary Public Transportation Corporation(GPTC) Gary IN Total 960.8 379 70.5 360
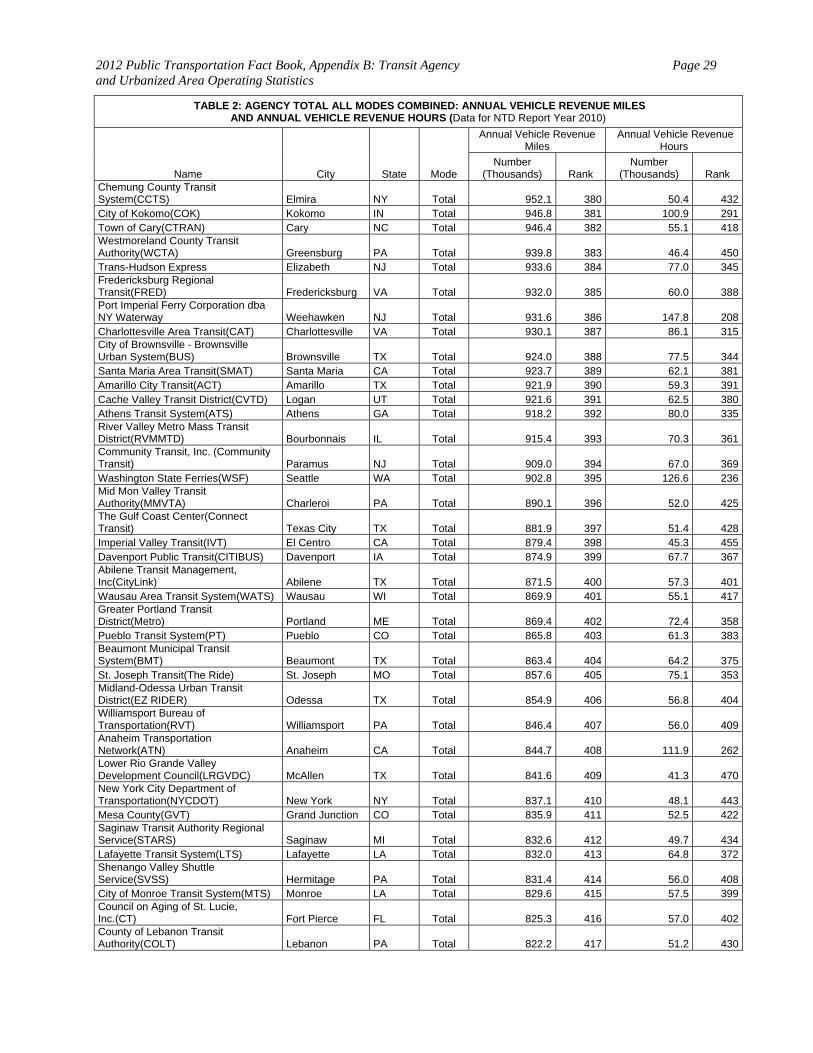
2012 Public Transportation Fact Book, Appendix B: Transit Agency and Urbanized Area Operating Statistics
Page 29
TABLE 2: AGENCY TOTAL ALL MODES COMBINED: ANNUAL VEHICLE REVENUE MILES AND ANNUAL VEHICLE REVENUE HOURS (Data for NTD Report Year 2010)
Name City State Mode
Annual Vehicle Revenue Miles
Annual Vehicle Revenue Hours
Number (Thousands) Rank
Number (Thousands) Rank
Chemung County Transit System(CCTS) Elmira NY Total 952.1 380 50.4 432City of Kokomo(COK) Kokomo IN Total 946.8 381 100.9 291Town of Cary(CTRAN) Cary NC Total 946.4 382 55.1 418Westmoreland County Transit Authority(WCTA) Greensburg PA Total 939.8 383 46.4 450Trans-Hudson Express Elizabeth NJ Total 933.6 384 77.0 345Fredericksburg Regional Transit(FRED) Fredericksburg VA Total 932.0 385 60.0 388Port Imperial Ferry Corporation dba NY Waterway Weehawken NJ Total 931.6 386 147.8 208Charlottesville Area Transit(CAT) Charlottesville VA Total 930.1 387 86.1 315City of Brownsville - Brownsville Urban System(BUS) Brownsville TX Total 924.0 388 77.5 344Santa Maria Area Transit(SMAT) Santa Maria CA Total 923.7 389 62.1 381Amarillo City Transit(ACT) Amarillo TX Total 921.9 390 59.3 391Cache Valley Transit District(CVTD) Logan UT Total 921.6 391 62.5 380Athens Transit System(ATS) Athens GA Total 918.2 392 80.0 335River Valley Metro Mass Transit District(RVMMTD) Bourbonnais IL Total 915.4 393 70.3 361Community Transit, Inc. (Community Transit) Paramus NJ Total 909.0 394 67.0 369Washington State Ferries(WSF) Seattle WA Total 902.8 395 126.6 236Mid Mon Valley Transit Authority(MMVTA) Charleroi PA Total 890.1 396 52.0 425The Gulf Coast Center(Connect Transit) Texas City TX Total 881.9 397 51.4 428Imperial Valley Transit(IVT) El Centro CA Total 879.4 398 45.3 455Davenport Public Transit(CITIBUS) Davenport IA Total 874.9 399 67.7 367Abilene Transit Management, Inc(CityLink) Abilene TX Total 871.5 400 57.3 401Wausau Area Transit System(WATS) Wausau WI Total 869.9 401 55.1 417Greater Portland Transit District(Metro) Portland ME Total 869.4 402 72.4 358Pueblo Transit System(PT) Pueblo CO Total 865.8 403 61.3 383Beaumont Municipal Transit System(BMT) Beaumont TX Total 863.4 404 64.2 375St. Joseph Transit(The Ride) St. Joseph MO Total 857.6 405 75.1 353Midland-Odessa Urban Transit District(EZ RIDER) Odessa TX Total 854.9 406 56.8 404Williamsport Bureau of Transportation(RVT) Williamsport PA Total 846.4 407 56.0 409Anaheim Transportation Network(ATN) Anaheim CA Total 844.7 408 111.9 262Lower Rio Grande Valley Development Council(LRGVDC) McAllen TX Total 841.6 409 41.3 470New York City Department of Transportation(NYCDOT) New York NY Total 837.1 410 48.1 443Mesa County(GVT) Grand Junction CO Total 835.9 411 52.5 422Saginaw Transit Authority Regional Service(STARS) Saginaw MI Total 832.6 412 49.7 434Lafayette Transit System(LTS) Lafayette LA Total 832.0 413 64.8 372Shenango Valley Shuttle Service(SVSS) Hermitage PA Total 831.4 414 56.0 408City of Monroe Transit System(MTS) Monroe LA Total 829.6 415 57.5 399Council on Aging of St. Lucie, Inc.(CT) Fort Pierce FL Total 825.3 416 57.0 402County of Lebanon Transit Authority(COLT) Lebanon PA Total 822.2 417 51.2 430
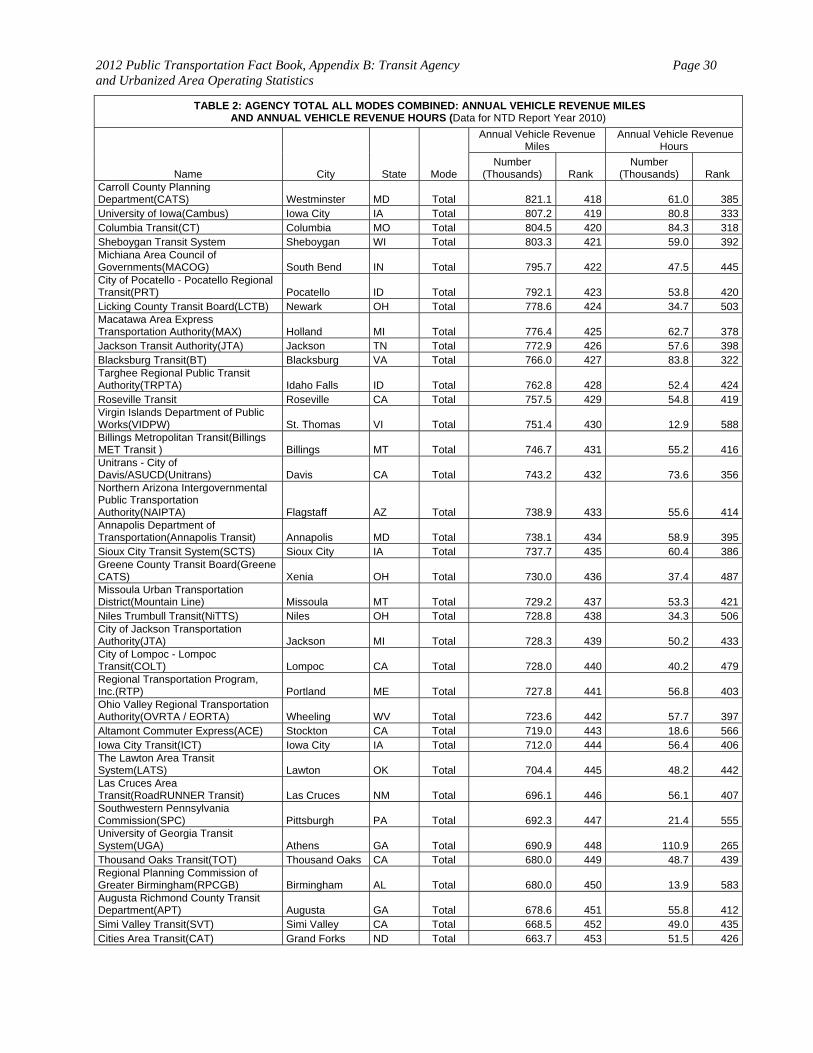
2012 Public Transportation Fact Book, Appendix B: Transit Agency and Urbanized Area Operating Statistics
Page 30
TABLE 2: AGENCY TOTAL ALL MODES COMBINED: ANNUAL VEHICLE REVENUE MILES AND ANNUAL VEHICLE REVENUE HOURS (Data for NTD Report Year 2010)
Name City State Mode
Annual Vehicle Revenue Miles
Annual Vehicle Revenue Hours
Number (Thousands) Rank
Number (Thousands) Rank
Carroll County Planning Department(CATS) Westminster MD Total 821.1 418 61.0 385University of Iowa(Cambus) Iowa City IA Total 807.2 419 80.8 333Columbia Transit(CT) Columbia MO Total 804.5 420 84.3 318Sheboygan Transit System Sheboygan WI Total 803.3 421 59.0 392Michiana Area Council of Governments(MACOG) South Bend IN Total 795.7 422 47.5 445City of Pocatello - Pocatello Regional Transit(PRT) Pocatello ID Total 792.1 423 53.8 420Licking County Transit Board(LCTB) Newark OH Total 778.6 424 34.7 503Macatawa Area Express Transportation Authority(MAX) Holland MI Total 776.4 425 62.7 378Jackson Transit Authority(JTA) Jackson TN Total 772.9 426 57.6 398Blacksburg Transit(BT) Blacksburg VA Total 766.0 427 83.8 322Targhee Regional Public Transit Authority(TRPTA) Idaho Falls ID Total 762.8 428 52.4 424Roseville Transit Roseville CA Total 757.5 429 54.8 419Virgin Islands Department of Public Works(VIDPW) St. Thomas VI Total 751.4 430 12.9 588Billings Metropolitan Transit(Billings MET Transit ) Billings MT Total 746.7 431 55.2 416Unitrans - City of Davis/ASUCD(Unitrans) Davis CA Total 743.2 432 73.6 356Northern Arizona Intergovernmental Public Transportation Authority(NAIPTA) Flagstaff AZ Total 738.9 433 55.6 414Annapolis Department of Transportation(Annapolis Transit) Annapolis MD Total 738.1 434 58.9 395Sioux City Transit System(SCTS) Sioux City IA Total 737.7 435 60.4 386Greene County Transit Board(Greene CATS) Xenia OH Total 730.0 436 37.4 487Missoula Urban Transportation District(Mountain Line) Missoula MT Total 729.2 437 53.3 421Niles Trumbull Transit(NiTTS) Niles OH Total 728.8 438 34.3 506City of Jackson Transportation Authority(JTA) Jackson MI Total 728.3 439 50.2 433City of Lompoc - Lompoc Transit(COLT) Lompoc CA Total 728.0 440 40.2 479Regional Transportation Program, Inc.(RTP) Portland ME Total 727.8 441 56.8 403Ohio Valley Regional Transportation Authority(OVRTA / EORTA) Wheeling WV Total 723.6 442 57.7 397Altamont Commuter Express(ACE) Stockton CA Total 719.0 443 18.6 566Iowa City Transit(ICT) Iowa City IA Total 712.0 444 56.4 406The Lawton Area Transit System(LATS) Lawton OK Total 704.4 445 48.2 442Las Cruces Area Transit(RoadRUNNER Transit) Las Cruces NM Total 696.1 446 56.1 407Southwestern Pennsylvania Commission(SPC) Pittsburgh PA Total 692.3 447 21.4 555University of Georgia Transit System(UGA) Athens GA Total 690.9 448 110.9 265Thousand Oaks Transit(TOT) Thousand Oaks CA Total 680.0 449 48.7 439Regional Planning Commission of Greater Birmingham(RPCGB) Birmingham AL Total 680.0 450 13.9 583Augusta Richmond County Transit Department(APT) Augusta GA Total 678.6 451 55.8 412Simi Valley Transit(SVT) Simi Valley CA Total 668.5 452 49.0 435Cities Area Transit(CAT) Grand Forks ND Total 663.7 453 51.5 426
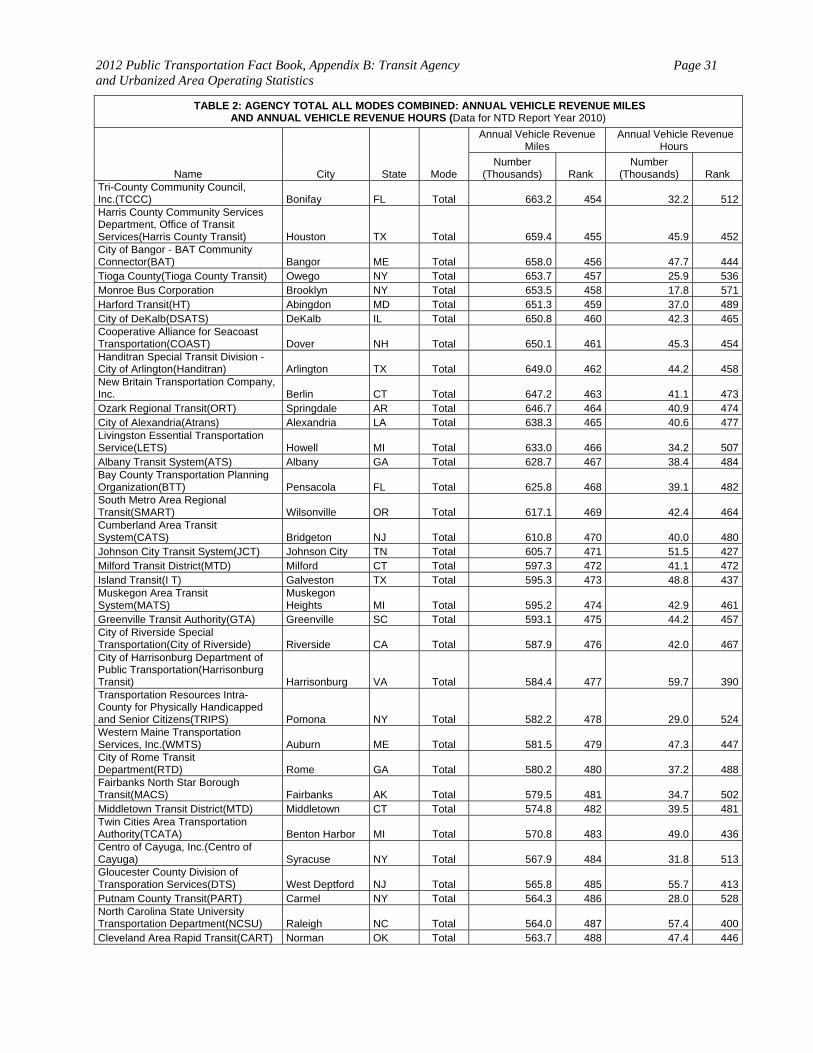
2012 Public Transportation Fact Book, Appendix B: Transit Agency and Urbanized Area Operating Statistics
Page 31
TABLE 2: AGENCY TOTAL ALL MODES COMBINED: ANNUAL VEHICLE REVENUE MILES AND ANNUAL VEHICLE REVENUE HOURS (Data for NTD Report Year 2010)
Name City State Mode
Annual Vehicle Revenue Miles
Annual Vehicle Revenue Hours
Number (Thousands) Rank
Number (Thousands) Rank
Tri-County Community Council, Inc.(TCCC) Bonifay FL Total 663.2 454 32.2 512Harris County Community Services Department, Office of Transit Services(Harris County Transit) Houston TX Total 659.4 455 45.9 452City of Bangor - BAT Community Connector(BAT) Bangor ME Total 658.0 456 47.7 444Tioga County(Tioga County Transit) Owego NY Total 653.7 457 25.9 536Monroe Bus Corporation Brooklyn NY Total 653.5 458 17.8 571Harford Transit(HT) Abingdon MD Total 651.3 459 37.0 489City of DeKalb(DSATS) DeKalb IL Total 650.8 460 42.3 465Cooperative Alliance for Seacoast Transportation(COAST) Dover NH Total 650.1 461 45.3 454Handitran Special Transit Division - City of Arlington(Handitran) Arlington TX Total 649.0 462 44.2 458New Britain Transportation Company, Inc. Berlin CT Total 647.2 463 41.1 473Ozark Regional Transit(ORT) Springdale AR Total 646.7 464 40.9 474City of Alexandria(Atrans) Alexandria LA Total 638.3 465 40.6 477Livingston Essential Transportation Service(LETS) Howell MI Total 633.0 466 34.2 507Albany Transit System(ATS) Albany GA Total 628.7 467 38.4 484Bay County Transportation Planning Organization(BTT) Pensacola FL Total 625.8 468 39.1 482South Metro Area Regional Transit(SMART) Wilsonville OR Total 617.1 469 42.4 464Cumberland Area Transit System(CATS) Bridgeton NJ Total 610.8 470 40.0 480Johnson City Transit System(JCT) Johnson City TN Total 605.7 471 51.5 427Milford Transit District(MTD) Milford CT Total 597.3 472 41.1 472Island Transit(I T) Galveston TX Total 595.3 473 48.8 437Muskegon Area Transit System(MATS)
Muskegon Heights MI Total 595.2 474 42.9 461
Greenville Transit Authority(GTA) Greenville SC Total 593.1 475 44.2 457City of Riverside Special Transportation(City of Riverside) Riverside CA Total 587.9 476 42.0 467City of Harrisonburg Department of Public Transportation(Harrisonburg Transit) Harrisonburg VA Total 584.4 477 59.7 390Transportation Resources Intra-County for Physically Handicapped and Senior Citizens(TRIPS) Pomona NY Total 582.2 478 29.0 524Western Maine Transportation Services, Inc.(WMTS) Auburn ME Total 581.5 479 47.3 447City of Rome Transit Department(RTD) Rome GA Total 580.2 480 37.2 488Fairbanks North Star Borough Transit(MACS) Fairbanks AK Total 579.5 481 34.7 502Middletown Transit District(MTD) Middletown CT Total 574.8 482 39.5 481Twin Cities Area Transportation Authority(TCATA) Benton Harbor MI Total 570.8 483 49.0 436Centro of Cayuga, Inc.(Centro of Cayuga) Syracuse NY Total 567.9 484 31.8 513Gloucester County Division of Transporation Services(DTS) West Deptford NJ Total 565.8 485 55.7 413Putnam County Transit(PART) Carmel NY Total 564.3 486 28.0 528North Carolina State University Transportation Department(NCSU) Raleigh NC Total 564.0 487 57.4 400Cleveland Area Rapid Transit(CART) Norman OK Total 563.7 488 47.4 446
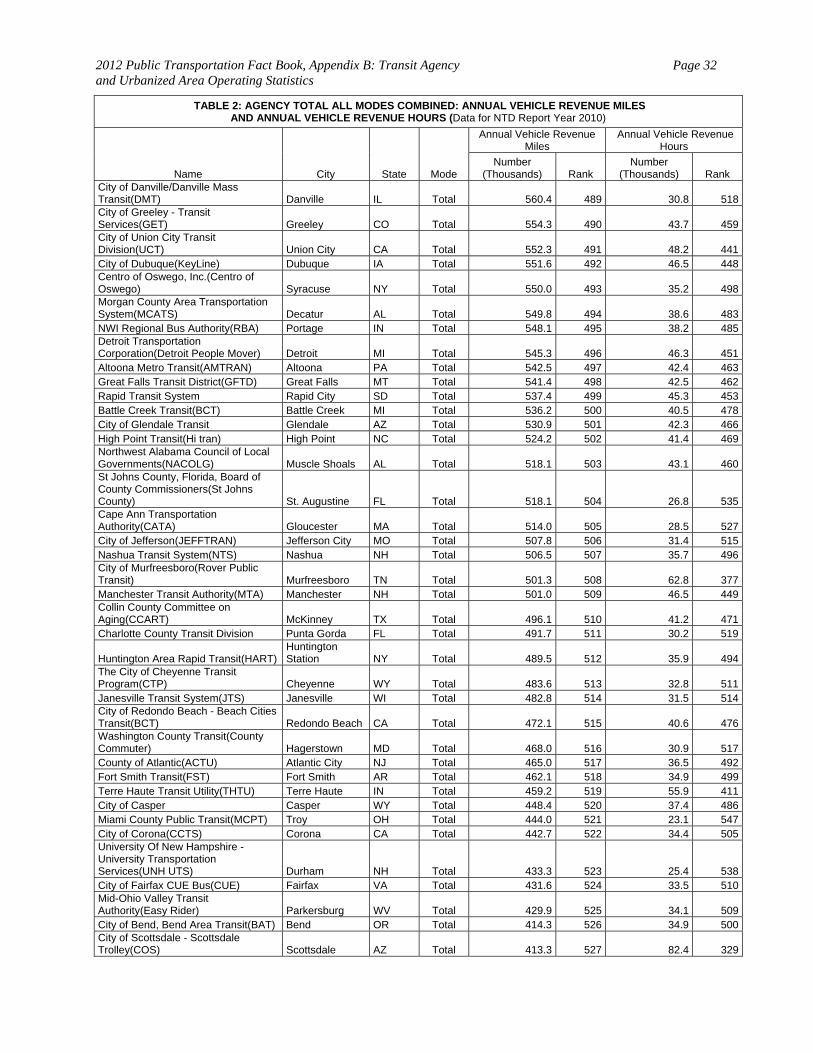
2012 Public Transportation Fact Book, Appendix B: Transit Agency and Urbanized Area Operating Statistics
Page 32
TABLE 2: AGENCY TOTAL ALL MODES COMBINED: ANNUAL VEHICLE REVENUE MILES AND ANNUAL VEHICLE REVENUE HOURS (Data for NTD Report Year 2010)
Name City State Mode
Annual Vehicle Revenue Miles
Annual Vehicle Revenue Hours
Number (Thousands) Rank
Number (Thousands) Rank
City of Danville/Danville Mass Transit(DMT) Danville IL Total 560.4 489 30.8 518City of Greeley - Transit Services(GET) Greeley CO Total 554.3 490 43.7 459City of Union City Transit Division(UCT) Union City CA Total 552.3 491 48.2 441City of Dubuque(KeyLine) Dubuque IA Total 551.6 492 46.5 448Centro of Oswego, Inc.(Centro of Oswego) Syracuse NY Total 550.0 493 35.2 498Morgan County Area Transportation System(MCATS) Decatur AL Total 549.8 494 38.6 483NWI Regional Bus Authority(RBA) Portage IN Total 548.1 495 38.2 485Detroit Transportation Corporation(Detroit People Mover) Detroit MI Total 545.3 496 46.3 451Altoona Metro Transit(AMTRAN) Altoona PA Total 542.5 497 42.4 463Great Falls Transit District(GFTD) Great Falls MT Total 541.4 498 42.5 462Rapid Transit System Rapid City SD Total 537.4 499 45.3 453Battle Creek Transit(BCT) Battle Creek MI Total 536.2 500 40.5 478City of Glendale Transit Glendale AZ Total 530.9 501 42.3 466High Point Transit(Hi tran) High Point NC Total 524.2 502 41.4 469Northwest Alabama Council of Local Governments(NACOLG) Muscle Shoals AL Total 518.1 503 43.1 460St Johns County, Florida, Board of County Commissioners(St Johns County) St. Augustine FL Total 518.1 504 26.8 535Cape Ann Transportation Authority(CATA) Gloucester MA Total 514.0 505 28.5 527City of Jefferson(JEFFTRAN) Jefferson City MO Total 507.8 506 31.4 515Nashua Transit System(NTS) Nashua NH Total 506.5 507 35.7 496City of Murfreesboro(Rover Public Transit) Murfreesboro TN Total 501.3 508 62.8 377Manchester Transit Authority(MTA) Manchester NH Total 501.0 509 46.5 449Collin County Committee on Aging(CCART) McKinney TX Total 496.1 510 41.2 471Charlotte County Transit Division Punta Gorda FL Total 491.7 511 30.2 519
Huntington Area Rapid Transit(HART) Huntington Station NY Total 489.5 512 35.9 494
The City of Cheyenne Transit Program(CTP) Cheyenne WY Total 483.6 513 32.8 511Janesville Transit System(JTS) Janesville WI Total 482.8 514 31.5 514City of Redondo Beach - Beach Cities Transit(BCT) Redondo Beach CA Total 472.1 515 40.6 476Washington County Transit(County Commuter) Hagerstown MD Total 468.0 516 30.9 517County of Atlantic(ACTU) Atlantic City NJ Total 465.0 517 36.5 492Fort Smith Transit(FST) Fort Smith AR Total 462.1 518 34.9 499Terre Haute Transit Utility(THTU) Terre Haute IN Total 459.2 519 55.9 411City of Casper Casper WY Total 448.4 520 37.4 486Miami County Public Transit(MCPT) Troy OH Total 444.0 521 23.1 547City of Corona(CCTS) Corona CA Total 442.7 522 34.4 505University Of New Hampshire - University Transportation Services(UNH UTS) Durham NH Total 433.3 523 25.4 538City of Fairfax CUE Bus(CUE) Fairfax VA Total 431.6 524 33.5 510Mid-Ohio Valley Transit Authority(Easy Rider) Parkersburg WV Total 429.9 525 34.1 509City of Bend, Bend Area Transit(BAT) Bend OR Total 414.3 526 34.9 500City of Scottsdale - Scottsdale Trolley(COS) Scottsdale AZ Total 413.3 527 82.4 329
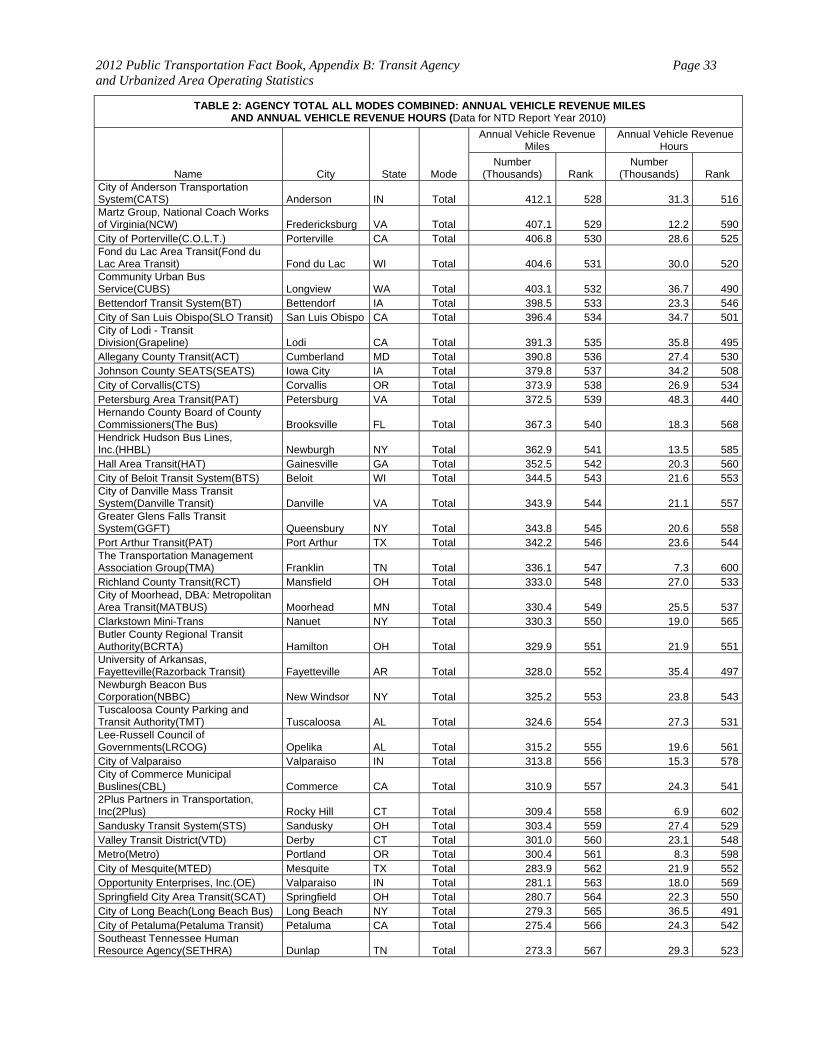
2012 Public Transportation Fact Book, Appendix B: Transit Agency and Urbanized Area Operating Statistics
Page 33
TABLE 2: AGENCY TOTAL ALL MODES COMBINED: ANNUAL VEHICLE REVENUE MILES AND ANNUAL VEHICLE REVENUE HOURS (Data for NTD Report Year 2010)
Name City State Mode
Annual Vehicle Revenue Miles
Annual Vehicle Revenue Hours
Number (Thousands) Rank
Number (Thousands) Rank
City of Anderson Transportation System(CATS) Anderson IN Total 412.1 528 31.3 516Martz Group, National Coach Works of Virginia(NCW) Fredericksburg VA Total 407.1 529 12.2 590City of Porterville(C.O.L.T.) Porterville CA Total 406.8 530 28.6 525Fond du Lac Area Transit(Fond du Lac Area Transit) Fond du Lac WI Total 404.6 531 30.0 520Community Urban Bus Service(CUBS) Longview WA Total 403.1 532 36.7 490Bettendorf Transit System(BT) Bettendorf IA Total 398.5 533 23.3 546City of San Luis Obispo(SLO Transit) San Luis Obispo CA Total 396.4 534 34.7 501City of Lodi - Transit Division(Grapeline) Lodi CA Total 391.3 535 35.8 495Allegany County Transit(ACT) Cumberland MD Total 390.8 536 27.4 530Johnson County SEATS(SEATS) Iowa City IA Total 379.8 537 34.2 508City of Corvallis(CTS) Corvallis OR Total 373.9 538 26.9 534Petersburg Area Transit(PAT) Petersburg VA Total 372.5 539 48.3 440Hernando County Board of County Commissioners(The Bus) Brooksville FL Total 367.3 540 18.3 568Hendrick Hudson Bus Lines, Inc.(HHBL) Newburgh NY Total 362.9 541 13.5 585Hall Area Transit(HAT) Gainesville GA Total 352.5 542 20.3 560City of Beloit Transit System(BTS) Beloit WI Total 344.5 543 21.6 553City of Danville Mass Transit System(Danville Transit) Danville VA Total 343.9 544 21.1 557Greater Glens Falls Transit System(GGFT) Queensbury NY Total 343.8 545 20.6 558Port Arthur Transit(PAT) Port Arthur TX Total 342.2 546 23.6 544The Transportation Management Association Group(TMA) Franklin TN Total 336.1 547 7.3 600Richland County Transit(RCT) Mansfield OH Total 333.0 548 27.0 533City of Moorhead, DBA: Metropolitan Area Transit(MATBUS) Moorhead MN Total 330.4 549 25.5 537Clarkstown Mini-Trans Nanuet NY Total 330.3 550 19.0 565Butler County Regional Transit Authority(BCRTA) Hamilton OH Total 329.9 551 21.9 551University of Arkansas, Fayetteville(Razorback Transit) Fayetteville AR Total 328.0 552 35.4 497Newburgh Beacon Bus Corporation(NBBC) New Windsor NY Total 325.2 553 23.8 543Tuscaloosa County Parking and Transit Authority(TMT) Tuscaloosa AL Total 324.6 554 27.3 531Lee-Russell Council of Governments(LRCOG) Opelika AL Total 315.2 555 19.6 561City of Valparaiso Valparaiso IN Total 313.8 556 15.3 578City of Commerce Municipal Buslines(CBL) Commerce CA Total 310.9 557 24.3 5412Plus Partners in Transportation, Inc(2Plus) Rocky Hill CT Total 309.4 558 6.9 602Sandusky Transit System(STS) Sandusky OH Total 303.4 559 27.4 529Valley Transit District(VTD) Derby CT Total 301.0 560 23.1 548Metro(Metro) Portland OR Total 300.4 561 8.3 598City of Mesquite(MTED) Mesquite TX Total 283.9 562 21.9 552Opportunity Enterprises, Inc.(OE) Valparaiso IN Total 281.1 563 18.0 569Springfield City Area Transit(SCAT) Springfield OH Total 280.7 564 22.3 550City of Long Beach(Long Beach Bus) Long Beach NY Total 279.3 565 36.5 491City of Petaluma(Petaluma Transit) Petaluma CA Total 275.4 566 24.3 542Southeast Tennessee Human Resource Agency(SETHRA) Dunlap TN Total 273.3 567 29.3 523
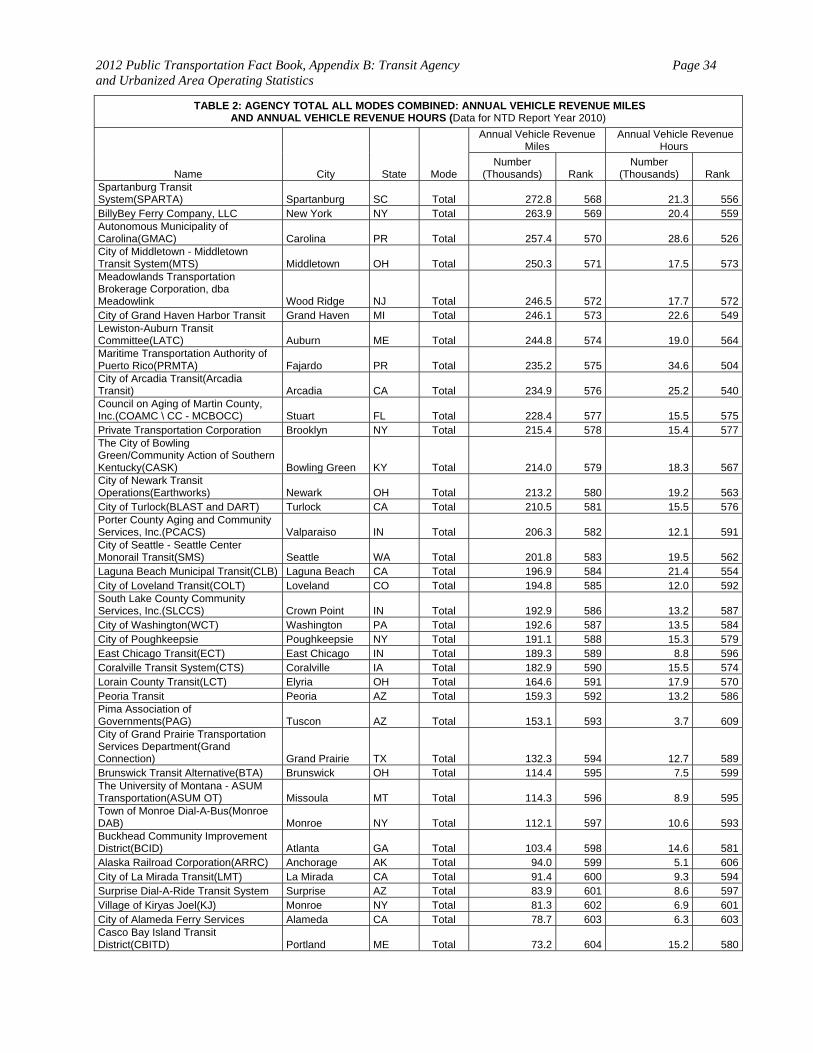
2012 Public Transportation Fact Book, Appendix B: Transit Agency and Urbanized Area Operating Statistics
Page 34
TABLE 2: AGENCY TOTAL ALL MODES COMBINED: ANNUAL VEHICLE REVENUE MILES AND ANNUAL VEHICLE REVENUE HOURS (Data for NTD Report Year 2010)
Name City State Mode
Annual Vehicle Revenue Miles
Annual Vehicle Revenue Hours
Number (Thousands) Rank
Number (Thousands) Rank
Spartanburg Transit System(SPARTA) Spartanburg SC Total 272.8 568 21.3 556BillyBey Ferry Company, LLC New York NY Total 263.9 569 20.4 559Autonomous Municipality of Carolina(GMAC) Carolina PR Total 257.4 570 28.6 526City of Middletown - Middletown Transit System(MTS) Middletown OH Total 250.3 571 17.5 573Meadowlands Transportation Brokerage Corporation, dba Meadowlink Wood Ridge NJ Total 246.5 572 17.7 572City of Grand Haven Harbor Transit Grand Haven MI Total 246.1 573 22.6 549Lewiston-Auburn Transit Committee(LATC) Auburn ME Total 244.8 574 19.0 564Maritime Transportation Authority of Puerto Rico(PRMTA) Fajardo PR Total 235.2 575 34.6 504City of Arcadia Transit(Arcadia Transit) Arcadia CA Total 234.9 576 25.2 540Council on Aging of Martin County, Inc.(COAMC \ CC - MCBOCC) Stuart FL Total 228.4 577 15.5 575Private Transportation Corporation Brooklyn NY Total 215.4 578 15.4 577The City of Bowling Green/Community Action of Southern Kentucky(CASK) Bowling Green KY Total 214.0 579 18.3 567City of Newark Transit Operations(Earthworks) Newark OH Total 213.2 580 19.2 563City of Turlock(BLAST and DART) Turlock CA Total 210.5 581 15.5 576Porter County Aging and Community Services, Inc.(PCACS) Valparaiso IN Total 206.3 582 12.1 591City of Seattle - Seattle Center Monorail Transit(SMS) Seattle WA Total 201.8 583 19.5 562Laguna Beach Municipal Transit(CLB) Laguna Beach CA Total 196.9 584 21.4 554City of Loveland Transit(COLT) Loveland CO Total 194.8 585 12.0 592South Lake County Community Services, Inc.(SLCCS) Crown Point IN Total 192.9 586 13.2 587City of Washington(WCT) Washington PA Total 192.6 587 13.5 584City of Poughkeepsie Poughkeepsie NY Total 191.1 588 15.3 579East Chicago Transit(ECT) East Chicago IN Total 189.3 589 8.8 596Coralville Transit System(CTS) Coralville IA Total 182.9 590 15.5 574Lorain County Transit(LCT) Elyria OH Total 164.6 591 17.9 570Peoria Transit Peoria AZ Total 159.3 592 13.2 586Pima Association of Governments(PAG) Tuscon AZ Total 153.1 593 3.7 609City of Grand Prairie Transportation Services Department(Grand Connection) Grand Prairie TX Total 132.3 594 12.7 589Brunswick Transit Alternative(BTA) Brunswick OH Total 114.4 595 7.5 599The University of Montana - ASUM Transportation(ASUM OT) Missoula MT Total 114.3 596 8.9 595Town of Monroe Dial-A-Bus(Monroe DAB) Monroe NY Total 112.1 597 10.6 593Buckhead Community Improvement District(BCID) Atlanta GA Total 103.4 598 14.6 581Alaska Railroad Corporation(ARRC) Anchorage AK Total 94.0 599 5.1 606City of La Mirada Transit(LMT) La Mirada CA Total 91.4 600 9.3 594Surprise Dial-A-Ride Transit System Surprise AZ Total 83.9 601 8.6 597Village of Kiryas Joel(KJ) Monroe NY Total 81.3 602 6.9 601City of Alameda Ferry Services Alameda CA Total 78.7 603 6.3 603Casco Bay Island Transit District(CBITD) Portland ME Total 73.2 604 15.2 580
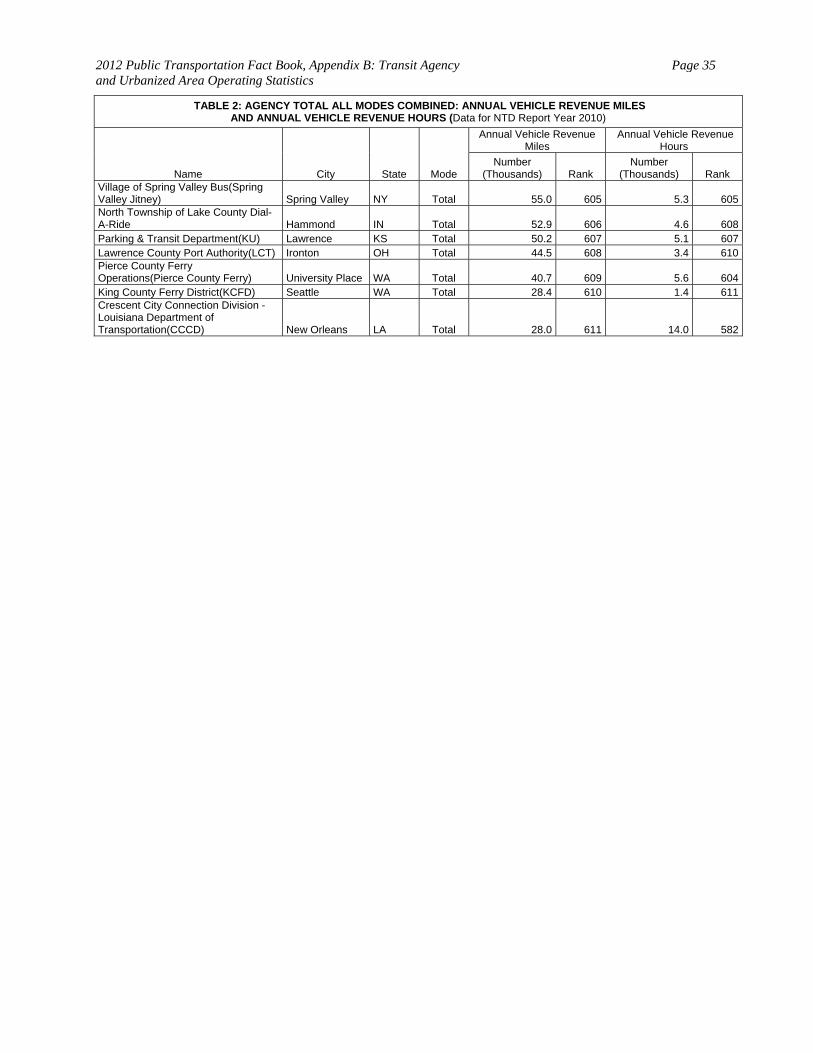
2012 Public Transportation Fact Book, Appendix B: Transit Agency and Urbanized Area Operating Statistics
Page 35
TABLE 2: AGENCY TOTAL ALL MODES COMBINED: ANNUAL VEHICLE REVENUE MILES AND ANNUAL VEHICLE REVENUE HOURS (Data for NTD Report Year 2010)
Name City State Mode
Annual Vehicle Revenue Miles
Annual Vehicle Revenue Hours
Number (Thousands) Rank
Number (Thousands) Rank
Village of Spring Valley Bus(Spring Valley Jitney) Spring Valley NY Total 55.0 605 5.3 605North Township of Lake County Dial-A-Ride Hammond IN Total 52.9 606 4.6 608Parking & Transit Department(KU) Lawrence KS Total 50.2 607 5.1 607Lawrence County Port Authority(LCT) Ironton OH Total 44.5 608 3.4 610Pierce County Ferry Operations(Pierce County Ferry) University Place WA Total 40.7 609 5.6 604King County Ferry District(KCFD) Seattle WA Total 28.4 610 1.4 611Crescent City Connection Division - Louisiana Department of Transportation(CCCD) New Orleans LA Total 28.0 611 14.0 582
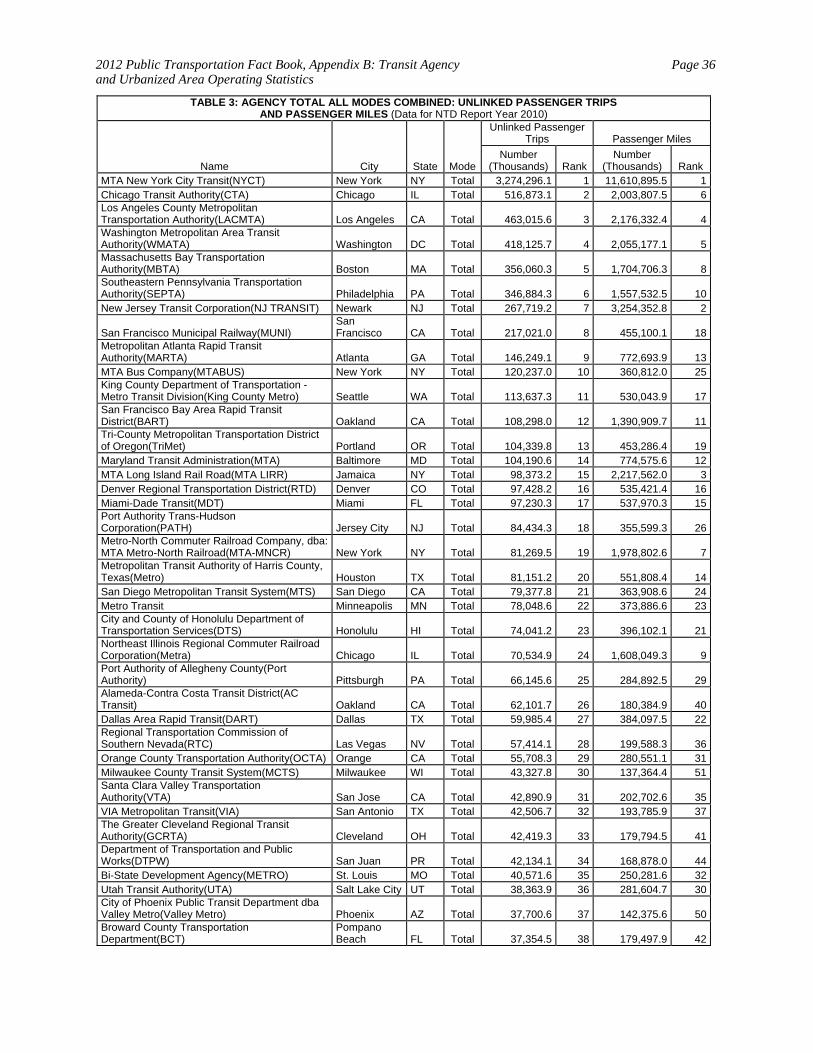
2012 Public Transportation Fact Book, Appendix B: Transit Agency and Urbanized Area Operating Statistics
Page 36
TABLE 3: AGENCY TOTAL ALL MODES COMBINED: UNLINKED PASSENGER TRIPS AND PASSENGER MILES (Data for NTD Report Year 2010)
Name City State Mode
Unlinked Passenger Trips Passenger Miles
Number (Thousands) Rank
Number (Thousands) Rank
MTA New York City Transit(NYCT) New York NY Total 3,274,296.1 1 11,610,895.5 1Chicago Transit Authority(CTA) Chicago IL Total 516,873.1 2 2,003,807.5 6Los Angeles County Metropolitan Transportation Authority(LACMTA) Los Angeles CA Total 463,015.6 3 2,176,332.4 4Washington Metropolitan Area Transit Authority(WMATA) Washington DC Total 418,125.7 4 2,055,177.1 5Massachusetts Bay Transportation Authority(MBTA) Boston MA Total 356,060.3 5 1,704,706.3 8Southeastern Pennsylvania Transportation Authority(SEPTA) Philadelphia PA Total 346,884.3 6 1,557,532.5 10New Jersey Transit Corporation(NJ TRANSIT) Newark NJ Total 267,719.2 7 3,254,352.8 2
San Francisco Municipal Railway(MUNI) San Francisco CA Total 217,021.0 8 455,100.1 18
Metropolitan Atlanta Rapid Transit Authority(MARTA) Atlanta GA Total 146,249.1 9 772,693.9 13MTA Bus Company(MTABUS) New York NY Total 120,237.0 10 360,812.0 25King County Department of Transportation - Metro Transit Division(King County Metro) Seattle WA Total 113,637.3 11 530,043.9 17San Francisco Bay Area Rapid Transit District(BART) Oakland CA Total 108,298.0 12 1,390,909.7 11Tri-County Metropolitan Transportation District of Oregon(TriMet) Portland OR Total 104,339.8 13 453,286.4 19Maryland Transit Administration(MTA) Baltimore MD Total 104,190.6 14 774,575.6 12MTA Long Island Rail Road(MTA LIRR) Jamaica NY Total 98,373.2 15 2,217,562.0 3Denver Regional Transportation District(RTD) Denver CO Total 97,428.2 16 535,421.4 16Miami-Dade Transit(MDT) Miami FL Total 97,230.3 17 537,970.3 15Port Authority Trans-Hudson Corporation(PATH) Jersey City NJ Total 84,434.3 18 355,599.3 26Metro-North Commuter Railroad Company, dba: MTA Metro-North Railroad(MTA-MNCR) New York NY Total 81,269.5 19 1,978,802.6 7Metropolitan Transit Authority of Harris County, Texas(Metro) Houston TX Total 81,151.2 20 551,808.4 14San Diego Metropolitan Transit System(MTS) San Diego CA Total 79,377.8 21 363,908.6 24Metro Transit Minneapolis MN Total 78,048.6 22 373,886.6 23City and County of Honolulu Department of Transportation Services(DTS) Honolulu HI Total 74,041.2 23 396,102.1 21Northeast Illinois Regional Commuter Railroad Corporation(Metra) Chicago IL Total 70,534.9 24 1,608,049.3 9Port Authority of Allegheny County(Port Authority) Pittsburgh PA Total 66,145.6 25 284,892.5 29Alameda-Contra Costa Transit District(AC Transit) Oakland CA Total 62,101.7 26 180,384.9 40Dallas Area Rapid Transit(DART) Dallas TX Total 59,985.4 27 384,097.5 22Regional Transportation Commission of Southern Nevada(RTC) Las Vegas NV Total 57,414.1 28 199,588.3 36Orange County Transportation Authority(OCTA) Orange CA Total 55,708.3 29 280,551.1 31Milwaukee County Transit System(MCTS) Milwaukee WI Total 43,327.8 30 137,364.4 51Santa Clara Valley Transportation Authority(VTA) San Jose CA Total 42,890.9 31 202,702.6 35VIA Metropolitan Transit(VIA) San Antonio TX Total 42,506.7 32 193,785.9 37The Greater Cleveland Regional Transit Authority(GCRTA) Cleveland OH Total 42,419.3 33 179,794.5 41Department of Transportation and Public Works(DTPW) San Juan PR Total 42,134.1 34 168,878.0 44Bi-State Development Agency(METRO) St. Louis MO Total 40,571.6 35 250,281.6 32Utah Transit Authority(UTA) Salt Lake City UT Total 38,363.9 36 281,604.7 30City of Phoenix Public Transit Department dba Valley Metro(Valley Metro) Phoenix AZ Total 37,700.6 37 142,375.6 50Broward County Transportation Department(BCT)
Pompano Beach FL Total 37,354.5 38 179,497.9 42
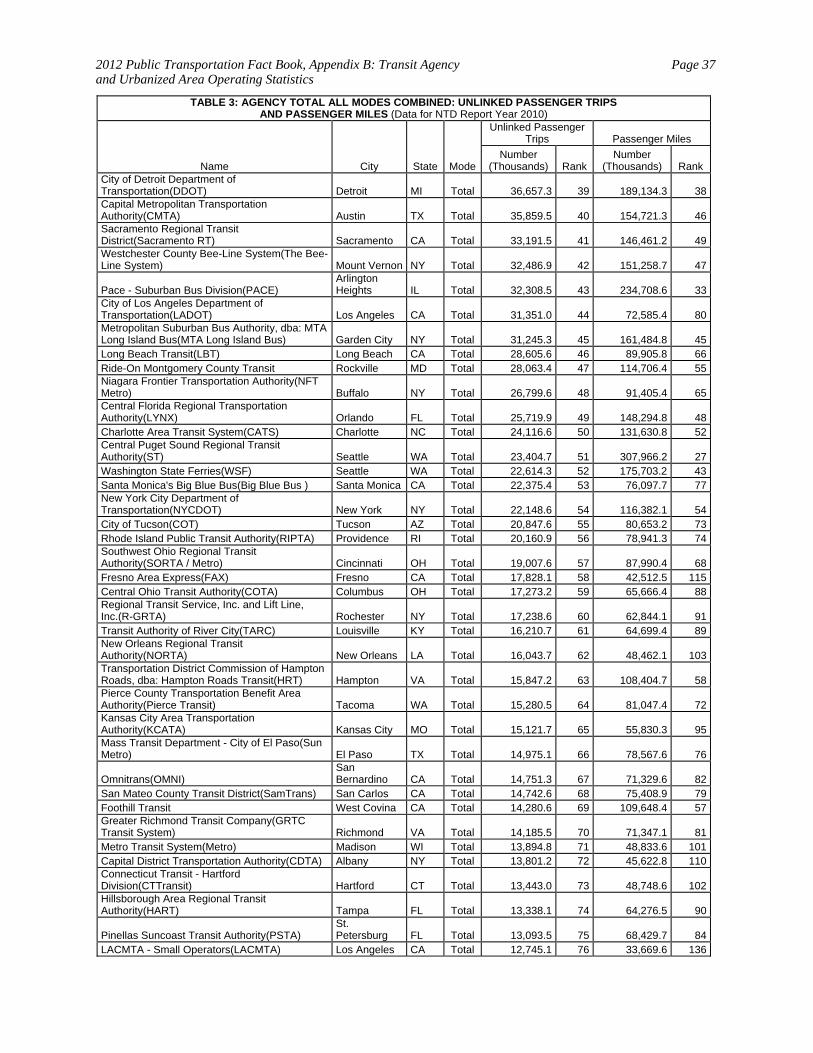
2012 Public Transportation Fact Book, Appendix B: Transit Agency and Urbanized Area Operating Statistics
Page 37
TABLE 3: AGENCY TOTAL ALL MODES COMBINED: UNLINKED PASSENGER TRIPS AND PASSENGER MILES (Data for NTD Report Year 2010)
Name City State Mode
Unlinked Passenger Trips Passenger Miles
Number (Thousands) Rank
Number (Thousands) Rank
City of Detroit Department of Transportation(DDOT) Detroit MI Total 36,657.3 39 189,134.3 38Capital Metropolitan Transportation Authority(CMTA) Austin TX Total 35,859.5 40 154,721.3 46Sacramento Regional Transit District(Sacramento RT) Sacramento CA Total 33,191.5 41 146,461.2 49Westchester County Bee-Line System(The Bee-Line System) Mount Vernon NY Total 32,486.9 42 151,258.7 47
Pace - Suburban Bus Division(PACE) Arlington Heights IL Total 32,308.5 43 234,708.6 33
City of Los Angeles Department of Transportation(LADOT) Los Angeles CA Total 31,351.0 44 72,585.4 80Metropolitan Suburban Bus Authority, dba: MTA Long Island Bus(MTA Long Island Bus) Garden City NY Total 31,245.3 45 161,484.8 45Long Beach Transit(LBT) Long Beach CA Total 28,605.6 46 89,905.8 66Ride-On Montgomery County Transit Rockville MD Total 28,063.4 47 114,706.4 55Niagara Frontier Transportation Authority(NFT Metro) Buffalo NY Total 26,799.6 48 91,405.4 65Central Florida Regional Transportation Authority(LYNX) Orlando FL Total 25,719.9 49 148,294.8 48Charlotte Area Transit System(CATS) Charlotte NC Total 24,116.6 50 131,630.8 52Central Puget Sound Regional Transit Authority(ST) Seattle WA Total 23,404.7 51 307,966.2 27Washington State Ferries(WSF) Seattle WA Total 22,614.3 52 175,703.2 43Santa Monica's Big Blue Bus(Big Blue Bus ) Santa Monica CA Total 22,375.4 53 76,097.7 77New York City Department of Transportation(NYCDOT) New York NY Total 22,148.6 54 116,382.1 54City of Tucson(COT) Tucson AZ Total 20,847.6 55 80,653.2 73Rhode Island Public Transit Authority(RIPTA) Providence RI Total 20,160.9 56 78,941.3 74Southwest Ohio Regional Transit Authority(SORTA / Metro) Cincinnati OH Total 19,007.6 57 87,990.4 68Fresno Area Express(FAX) Fresno CA Total 17,828.1 58 42,512.5 115Central Ohio Transit Authority(COTA) Columbus OH Total 17,273.2 59 65,666.4 88Regional Transit Service, Inc. and Lift Line, Inc.(R-GRTA) Rochester NY Total 17,238.6 60 62,844.1 91Transit Authority of River City(TARC) Louisville KY Total 16,210.7 61 64,699.4 89New Orleans Regional Transit Authority(NORTA) New Orleans LA Total 16,043.7 62 48,462.1 103Transportation District Commission of Hampton Roads, dba: Hampton Roads Transit(HRT) Hampton VA Total 15,847.2 63 108,404.7 58Pierce County Transportation Benefit Area Authority(Pierce Transit) Tacoma WA Total 15,280.5 64 81,047.4 72Kansas City Area Transportation Authority(KCATA) Kansas City MO Total 15,121.7 65 55,830.3 95Mass Transit Department - City of El Paso(Sun Metro) El Paso TX Total 14,975.1 66 78,567.6 76
Omnitrans(OMNI) San Bernardino CA Total 14,751.3 67 71,329.6 82
San Mateo County Transit District(SamTrans) San Carlos CA Total 14,742.6 68 75,408.9 79Foothill Transit West Covina CA Total 14,280.6 69 109,648.4 57Greater Richmond Transit Company(GRTC Transit System) Richmond VA Total 14,185.5 70 71,347.1 81Metro Transit System(Metro) Madison WI Total 13,894.8 71 48,833.6 101Capital District Transportation Authority(CDTA) Albany NY Total 13,801.2 72 45,622.8 110Connecticut Transit - Hartford Division(CTTransit) Hartford CT Total 13,443.0 73 48,748.6 102Hillsborough Area Regional Transit Authority(HART) Tampa FL Total 13,338.1 74 64,276.5 90
Pinellas Suncoast Transit Authority(PSTA) St. Petersburg FL Total 13,093.5 75 68,429.7 84
LACMTA - Small Operators(LACMTA) Los Angeles CA Total 12,745.1 76 33,669.6 136
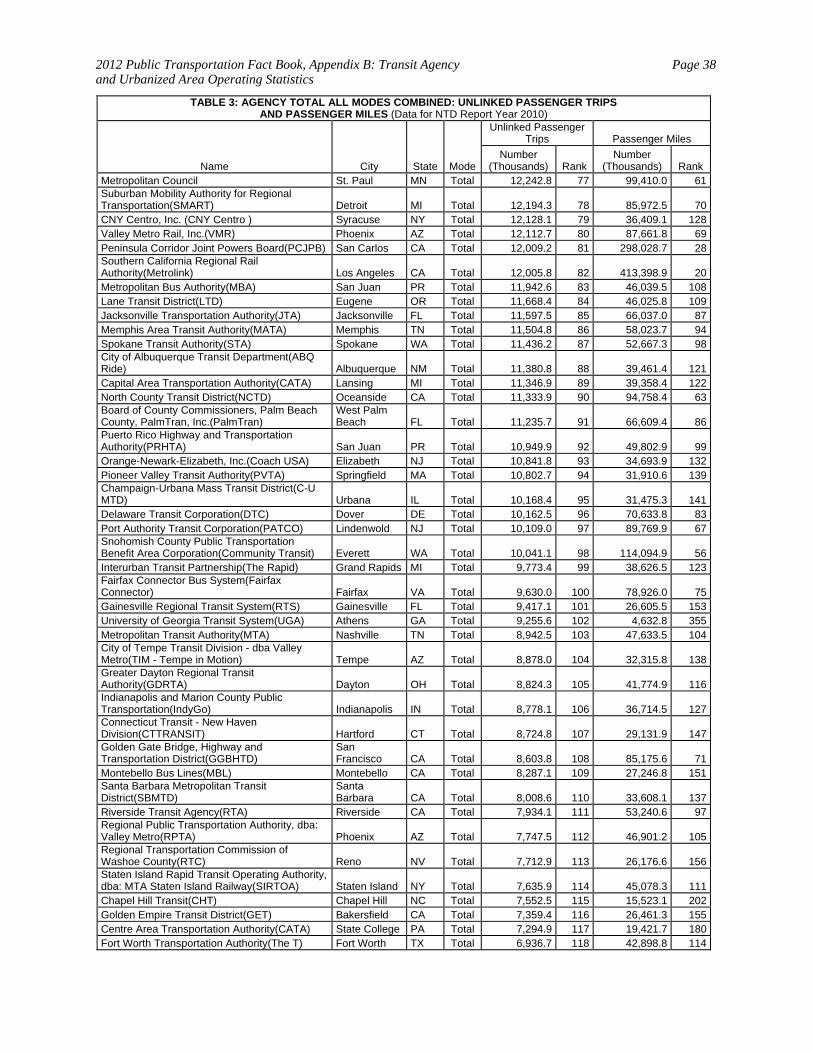
2012 Public Transportation Fact Book, Appendix B: Transit Agency and Urbanized Area Operating Statistics
Page 38
TABLE 3: AGENCY TOTAL ALL MODES COMBINED: UNLINKED PASSENGER TRIPS AND PASSENGER MILES (Data for NTD Report Year 2010)
Name City State Mode
Unlinked Passenger Trips Passenger Miles
Number (Thousands) Rank
Number (Thousands) Rank
Metropolitan Council St. Paul MN Total 12,242.8 77 99,410.0 61Suburban Mobility Authority for Regional Transportation(SMART) Detroit MI Total 12,194.3 78 85,972.5 70CNY Centro, Inc. (CNY Centro ) Syracuse NY Total 12,128.1 79 36,409.1 128Valley Metro Rail, Inc.(VMR) Phoenix AZ Total 12,112.7 80 87,661.8 69Peninsula Corridor Joint Powers Board(PCJPB) San Carlos CA Total 12,009.2 81 298,028.7 28Southern California Regional Rail Authority(Metrolink) Los Angeles CA Total 12,005.8 82 413,398.9 20Metropolitan Bus Authority(MBA) San Juan PR Total 11,942.6 83 46,039.5 108Lane Transit District(LTD) Eugene OR Total 11,668.4 84 46,025.8 109Jacksonville Transportation Authority(JTA) Jacksonville FL Total 11,597.5 85 66,037.0 87Memphis Area Transit Authority(MATA) Memphis TN Total 11,504.8 86 58,023.7 94Spokane Transit Authority(STA) Spokane WA Total 11,436.2 87 52,667.3 98City of Albuquerque Transit Department(ABQ Ride) Albuquerque NM Total 11,380.8 88 39,461.4 121Capital Area Transportation Authority(CATA) Lansing MI Total 11,346.9 89 39,358.4 122North County Transit District(NCTD) Oceanside CA Total 11,333.9 90 94,758.4 63Board of County Commissioners, Palm Beach County, PalmTran, Inc.(PalmTran)
West Palm Beach FL Total 11,235.7 91 66,609.4 86
Puerto Rico Highway and Transportation Authority(PRHTA) San Juan PR Total 10,949.9 92 49,802.9 99Orange-Newark-Elizabeth, Inc.(Coach USA) Elizabeth NJ Total 10,841.8 93 34,693.9 132Pioneer Valley Transit Authority(PVTA) Springfield MA Total 10,802.7 94 31,910.6 139Champaign-Urbana Mass Transit District(C-U MTD) Urbana IL Total 10,168.4 95 31,475.3 141Delaware Transit Corporation(DTC) Dover DE Total 10,162.5 96 70,633.8 83Port Authority Transit Corporation(PATCO) Lindenwold NJ Total 10,109.0 97 89,769.9 67Snohomish County Public Transportation Benefit Area Corporation(Community Transit) Everett WA Total 10,041.1 98 114,094.9 56Interurban Transit Partnership(The Rapid) Grand Rapids MI Total 9,773.4 99 38,626.5 123Fairfax Connector Bus System(Fairfax Connector) Fairfax VA Total 9,630.0 100 78,926.0 75Gainesville Regional Transit System(RTS) Gainesville FL Total 9,417.1 101 26,605.5 153University of Georgia Transit System(UGA) Athens GA Total 9,255.6 102 4,632.8 355Metropolitan Transit Authority(MTA) Nashville TN Total 8,942.5 103 47,633.5 104City of Tempe Transit Division - dba Valley Metro(TIM - Tempe in Motion) Tempe AZ Total 8,878.0 104 32,315.8 138Greater Dayton Regional Transit Authority(GDRTA) Dayton OH Total 8,824.3 105 41,774.9 116Indianapolis and Marion County Public Transportation(IndyGo) Indianapolis IN Total 8,778.1 106 36,714.5 127Connecticut Transit - New Haven Division(CTTRANSIT) Hartford CT Total 8,724.8 107 29,131.9 147Golden Gate Bridge, Highway and Transportation District(GGBHTD)
San Francisco CA Total 8,603.8 108 85,175.6 71
Montebello Bus Lines(MBL) Montebello CA Total 8,287.1 109 27,246.8 151Santa Barbara Metropolitan Transit District(SBMTD)
Santa Barbara CA Total 8,008.6 110 33,608.1 137
Riverside Transit Agency(RTA) Riverside CA Total 7,934.1 111 53,240.6 97Regional Public Transportation Authority, dba: Valley Metro(RPTA) Phoenix AZ Total 7,747.5 112 46,901.2 105Regional Transportation Commission of Washoe County(RTC) Reno NV Total 7,712.9 113 26,176.6 156Staten Island Rapid Transit Operating Authority, dba: MTA Staten Island Railway(SIRTOA) Staten Island NY Total 7,635.9 114 45,078.3 111Chapel Hill Transit(CHT) Chapel Hill NC Total 7,552.5 115 15,523.1 202Golden Empire Transit District(GET) Bakersfield CA Total 7,359.4 116 26,461.3 155Centre Area Transportation Authority(CATA) State College PA Total 7,294.9 117 19,421.7 180Fort Worth Transportation Authority(The T) Fort Worth TX Total 6,936.7 118 42,898.8 114
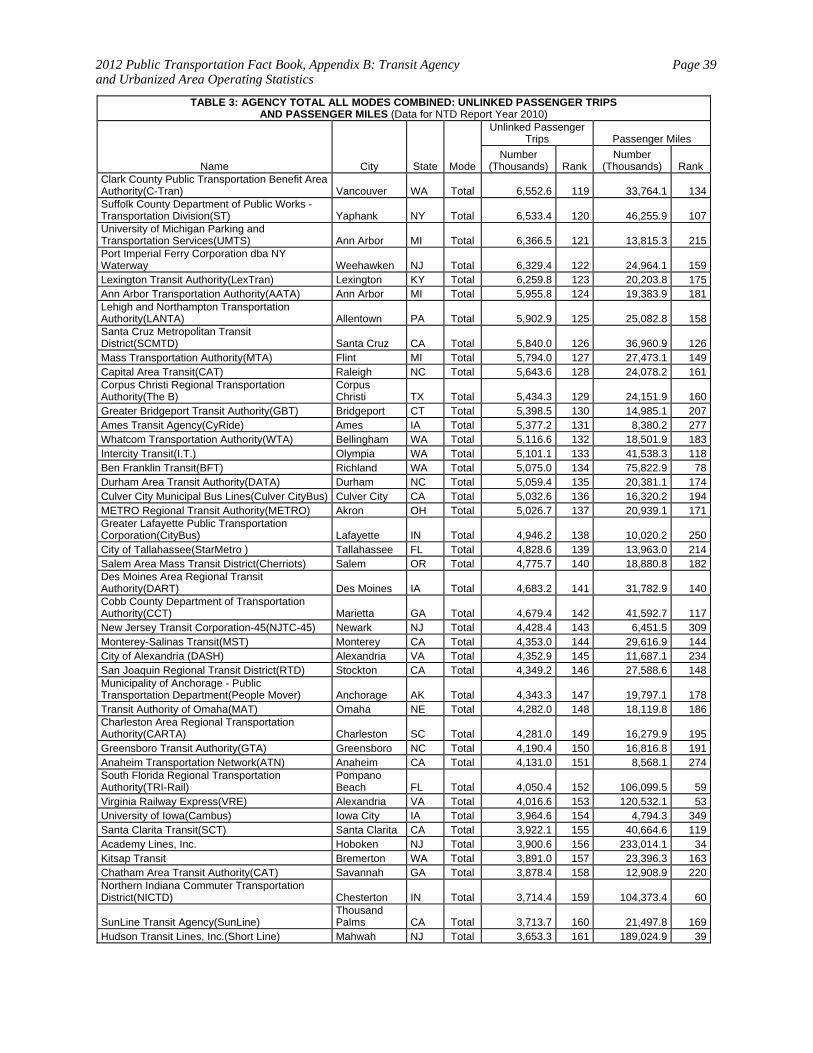
2012 Public Transportation Fact Book, Appendix B: Transit Agency and Urbanized Area Operating Statistics
Page 39
TABLE 3: AGENCY TOTAL ALL MODES COMBINED: UNLINKED PASSENGER TRIPS AND PASSENGER MILES (Data for NTD Report Year 2010)
Name City State Mode
Unlinked Passenger Trips Passenger Miles
Number (Thousands) Rank
Number (Thousands) Rank
Clark County Public Transportation Benefit Area Authority(C-Tran) Vancouver WA Total 6,552.6 119 33,764.1 134Suffolk County Department of Public Works - Transportation Division(ST) Yaphank NY Total 6,533.4 120 46,255.9 107University of Michigan Parking and Transportation Services(UMTS) Ann Arbor MI Total 6,366.5 121 13,815.3 215Port Imperial Ferry Corporation dba NY Waterway Weehawken NJ Total 6,329.4 122 24,964.1 159Lexington Transit Authority(LexTran) Lexington KY Total 6,259.8 123 20,203.8 175Ann Arbor Transportation Authority(AATA) Ann Arbor MI Total 5,955.8 124 19,383.9 181Lehigh and Northampton Transportation Authority(LANTA) Allentown PA Total 5,902.9 125 25,082.8 158Santa Cruz Metropolitan Transit District(SCMTD) Santa Cruz CA Total 5,840.0 126 36,960.9 126Mass Transportation Authority(MTA) Flint MI Total 5,794.0 127 27,473.1 149Capital Area Transit(CAT) Raleigh NC Total 5,643.6 128 24,078.2 161Corpus Christi Regional Transportation Authority(The B)
Corpus Christi TX Total 5,434.3 129 24,151.9 160
Greater Bridgeport Transit Authority(GBT) Bridgeport CT Total 5,398.5 130 14,985.1 207Ames Transit Agency(CyRide) Ames IA Total 5,377.2 131 8,380.2 277Whatcom Transportation Authority(WTA) Bellingham WA Total 5,116.6 132 18,501.9 183Intercity Transit(I.T.) Olympia WA Total 5,101.1 133 41,538.3 118Ben Franklin Transit(BFT) Richland WA Total 5,075.0 134 75,822.9 78Durham Area Transit Authority(DATA) Durham NC Total 5,059.4 135 20,381.1 174Culver City Municipal Bus Lines(Culver CityBus) Culver City CA Total 5,032.6 136 16,320.2 194METRO Regional Transit Authority(METRO) Akron OH Total 5,026.7 137 20,939.1 171Greater Lafayette Public Transportation Corporation(CityBus) Lafayette IN Total 4,946.2 138 10,020.2 250City of Tallahassee(StarMetro ) Tallahassee FL Total 4,828.6 139 13,963.0 214Salem Area Mass Transit District(Cherriots) Salem OR Total 4,775.7 140 18,880.8 182Des Moines Area Regional Transit Authority(DART) Des Moines IA Total 4,683.2 141 31,782.9 140Cobb County Department of Transportation Authority(CCT) Marietta GA Total 4,679.4 142 41,592.7 117New Jersey Transit Corporation-45(NJTC-45) Newark NJ Total 4,428.4 143 6,451.5 309Monterey-Salinas Transit(MST) Monterey CA Total 4,353.0 144 29,616.9 144City of Alexandria (DASH) Alexandria VA Total 4,352.9 145 11,687.1 234San Joaquin Regional Transit District(RTD) Stockton CA Total 4,349.2 146 27,588.6 148Municipality of Anchorage - Public Transportation Department(People Mover) Anchorage AK Total 4,343.3 147 19,797.1 178Transit Authority of Omaha(MAT) Omaha NE Total 4,282.0 148 18,119.8 186Charleston Area Regional Transportation Authority(CARTA) Charleston SC Total 4,281.0 149 16,279.9 195Greensboro Transit Authority(GTA) Greensboro NC Total 4,190.4 150 16,816.8 191Anaheim Transportation Network(ATN) Anaheim CA Total 4,131.0 151 8,568.1 274South Florida Regional Transportation Authority(TRI-Rail)
Pompano Beach FL Total 4,050.4 152 106,099.5 59
Virginia Railway Express(VRE) Alexandria VA Total 4,016.6 153 120,532.1 53University of Iowa(Cambus) Iowa City IA Total 3,964.6 154 4,794.3 349Santa Clarita Transit(SCT) Santa Clarita CA Total 3,922.1 155 40,664.6 119Academy Lines, Inc. Hoboken NJ Total 3,900.6 156 233,014.1 34Kitsap Transit Bremerton WA Total 3,891.0 157 23,396.3 163Chatham Area Transit Authority(CAT) Savannah GA Total 3,878.4 158 12,908.9 220Northern Indiana Commuter Transportation District(NICTD) Chesterton IN Total 3,714.4 159 104,373.4 60
SunLine Transit Agency(SunLine) Thousand Palms CA Total 3,713.7 160 21,497.8 169
Hudson Transit Lines, Inc.(Short Line) Mahwah NJ Total 3,653.3 161 189,024.9 39
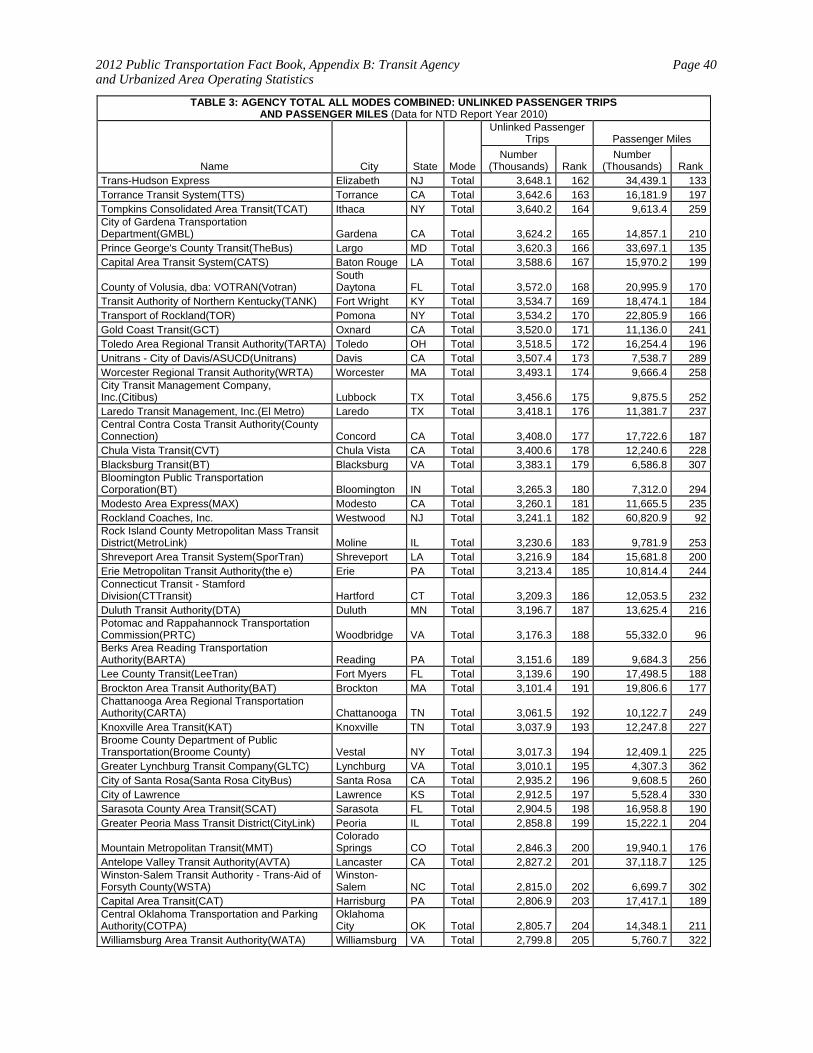
2012 Public Transportation Fact Book, Appendix B: Transit Agency and Urbanized Area Operating Statistics
Page 40
TABLE 3: AGENCY TOTAL ALL MODES COMBINED: UNLINKED PASSENGER TRIPS AND PASSENGER MILES (Data for NTD Report Year 2010)
Name City State Mode
Unlinked Passenger Trips Passenger Miles
Number (Thousands) Rank
Number (Thousands) Rank
Trans-Hudson Express Elizabeth NJ Total 3,648.1 162 34,439.1 133Torrance Transit System(TTS) Torrance CA Total 3,642.6 163 16,181.9 197Tompkins Consolidated Area Transit(TCAT) Ithaca NY Total 3,640.2 164 9,613.4 259City of Gardena Transportation Department(GMBL) Gardena CA Total 3,624.2 165 14,857.1 210Prince George's County Transit(TheBus) Largo MD Total 3,620.3 166 33,697.1 135Capital Area Transit System(CATS) Baton Rouge LA Total 3,588.6 167 15,970.2 199
County of Volusia, dba: VOTRAN(Votran) South Daytona FL Total 3,572.0 168 20,995.9 170
Transit Authority of Northern Kentucky(TANK) Fort Wright KY Total 3,534.7 169 18,474.1 184Transport of Rockland(TOR) Pomona NY Total 3,534.2 170 22,805.9 166Gold Coast Transit(GCT) Oxnard CA Total 3,520.0 171 11,136.0 241Toledo Area Regional Transit Authority(TARTA) Toledo OH Total 3,518.5 172 16,254.4 196Unitrans - City of Davis/ASUCD(Unitrans) Davis CA Total 3,507.4 173 7,538.7 289Worcester Regional Transit Authority(WRTA) Worcester MA Total 3,493.1 174 9,666.4 258City Transit Management Company, Inc.(Citibus) Lubbock TX Total 3,456.6 175 9,875.5 252Laredo Transit Management, Inc.(El Metro) Laredo TX Total 3,418.1 176 11,381.7 237Central Contra Costa Transit Authority(County Connection) Concord CA Total 3,408.0 177 17,722.6 187Chula Vista Transit(CVT) Chula Vista CA Total 3,400.6 178 12,240.6 228Blacksburg Transit(BT) Blacksburg VA Total 3,383.1 179 6,586.8 307Bloomington Public Transportation Corporation(BT) Bloomington IN Total 3,265.3 180 7,312.0 294Modesto Area Express(MAX) Modesto CA Total 3,260.1 181 11,665.5 235Rockland Coaches, Inc. Westwood NJ Total 3,241.1 182 60,820.9 92Rock Island County Metropolitan Mass Transit District(MetroLink) Moline IL Total 3,230.6 183 9,781.9 253Shreveport Area Transit System(SporTran) Shreveport LA Total 3,216.9 184 15,681.8 200Erie Metropolitan Transit Authority(the e) Erie PA Total 3,213.4 185 10,814.4 244Connecticut Transit - Stamford Division(CTTransit) Hartford CT Total 3,209.3 186 12,053.5 232Duluth Transit Authority(DTA) Duluth MN Total 3,196.7 187 13,625.4 216Potomac and Rappahannock Transportation Commission(PRTC) Woodbridge VA Total 3,176.3 188 55,332.0 96Berks Area Reading Transportation Authority(BARTA) Reading PA Total 3,151.6 189 9,684.3 256Lee County Transit(LeeTran) Fort Myers FL Total 3,139.6 190 17,498.5 188Brockton Area Transit Authority(BAT) Brockton MA Total 3,101.4 191 19,806.6 177Chattanooga Area Regional Transportation Authority(CARTA) Chattanooga TN Total 3,061.5 192 10,122.7 249Knoxville Area Transit(KAT) Knoxville TN Total 3,037.9 193 12,247.8 227Broome County Department of Public Transportation(Broome County) Vestal NY Total 3,017.3 194 12,409.1 225Greater Lynchburg Transit Company(GLTC) Lynchburg VA Total 3,010.1 195 4,307.3 362City of Santa Rosa(Santa Rosa CityBus) Santa Rosa CA Total 2,935.2 196 9,608.5 260City of Lawrence Lawrence KS Total 2,912.5 197 5,528.4 330Sarasota County Area Transit(SCAT) Sarasota FL Total 2,904.5 198 16,958.8 190Greater Peoria Mass Transit District(CityLink) Peoria IL Total 2,858.8 199 15,222.1 204
Mountain Metropolitan Transit(MMT) Colorado Springs CO Total 2,846.3 200 19,940.1 176
Antelope Valley Transit Authority(AVTA) Lancaster CA Total 2,827.2 201 37,118.7 125Winston-Salem Transit Authority - Trans-Aid of Forsyth County(WSTA)
Winston-Salem NC Total 2,815.0 202 6,699.7 302
Capital Area Transit(CAT) Harrisburg PA Total 2,806.9 203 17,417.1 189Central Oklahoma Transportation and Parking Authority(COTPA)
Oklahoma City OK Total 2,805.7 204 14,348.1 211
Williamsburg Area Transit Authority(WATA) Williamsburg VA Total 2,799.8 205 5,760.7 322
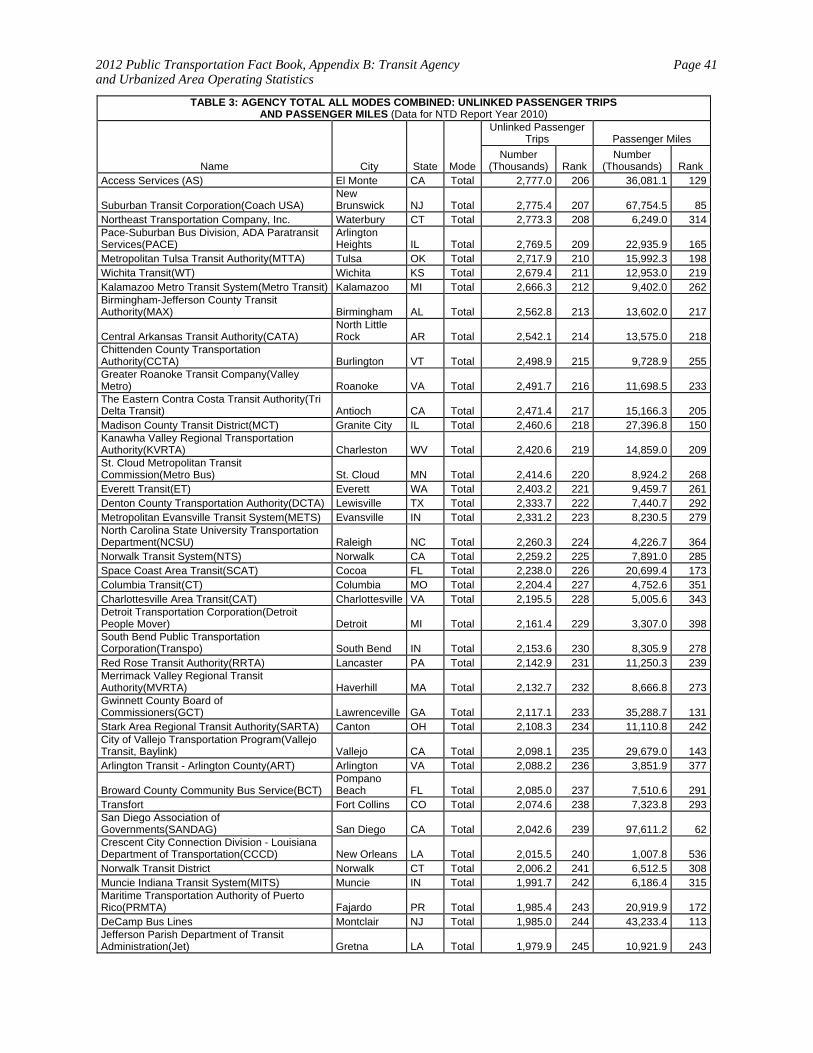
2012 Public Transportation Fact Book, Appendix B: Transit Agency and Urbanized Area Operating Statistics
Page 41
TABLE 3: AGENCY TOTAL ALL MODES COMBINED: UNLINKED PASSENGER TRIPS AND PASSENGER MILES (Data for NTD Report Year 2010)
Name City State Mode
Unlinked Passenger Trips Passenger Miles
Number (Thousands) Rank
Number (Thousands) Rank
Access Services (AS) El Monte CA Total 2,777.0 206 36,081.1 129
Suburban Transit Corporation(Coach USA) New Brunswick NJ Total 2,775.4 207 67,754.5 85
Northeast Transportation Company, Inc. Waterbury CT Total 2,773.3 208 6,249.0 314Pace-Suburban Bus Division, ADA Paratransit Services(PACE)
Arlington Heights IL Total 2,769.5 209 22,935.9 165
Metropolitan Tulsa Transit Authority(MTTA) Tulsa OK Total 2,717.9 210 15,992.3 198Wichita Transit(WT) Wichita KS Total 2,679.4 211 12,953.0 219Kalamazoo Metro Transit System(Metro Transit) Kalamazoo MI Total 2,666.3 212 9,402.0 262Birmingham-Jefferson County Transit Authority(MAX) Birmingham AL Total 2,562.8 213 13,602.0 217
Central Arkansas Transit Authority(CATA) North Little Rock AR Total 2,542.1 214 13,575.0 218
Chittenden County Transportation Authority(CCTA) Burlington VT Total 2,498.9 215 9,728.9 255Greater Roanoke Transit Company(Valley Metro) Roanoke VA Total 2,491.7 216 11,698.5 233The Eastern Contra Costa Transit Authority(Tri Delta Transit) Antioch CA Total 2,471.4 217 15,166.3 205Madison County Transit District(MCT) Granite City IL Total 2,460.6 218 27,396.8 150Kanawha Valley Regional Transportation Authority(KVRTA) Charleston WV Total 2,420.6 219 14,859.0 209St. Cloud Metropolitan Transit Commission(Metro Bus) St. Cloud MN Total 2,414.6 220 8,924.2 268Everett Transit(ET) Everett WA Total 2,403.2 221 9,459.7 261Denton County Transportation Authority(DCTA) Lewisville TX Total 2,333.7 222 7,440.7 292Metropolitan Evansville Transit System(METS) Evansville IN Total 2,331.2 223 8,230.5 279North Carolina State University Transportation Department(NCSU) Raleigh NC Total 2,260.3 224 4,226.7 364Norwalk Transit System(NTS) Norwalk CA Total 2,259.2 225 7,891.0 285Space Coast Area Transit(SCAT) Cocoa FL Total 2,238.0 226 20,699.4 173Columbia Transit(CT) Columbia MO Total 2,204.4 227 4,752.6 351Charlottesville Area Transit(CAT) Charlottesville VA Total 2,195.5 228 5,005.6 343Detroit Transportation Corporation(Detroit People Mover) Detroit MI Total 2,161.4 229 3,307.0 398South Bend Public Transportation Corporation(Transpo) South Bend IN Total 2,153.6 230 8,305.9 278Red Rose Transit Authority(RRTA) Lancaster PA Total 2,142.9 231 11,250.3 239Merrimack Valley Regional Transit Authority(MVRTA) Haverhill MA Total 2,132.7 232 8,666.8 273Gwinnett County Board of Commissioners(GCT) Lawrenceville GA Total 2,117.1 233 35,288.7 131Stark Area Regional Transit Authority(SARTA) Canton OH Total 2,108.3 234 11,110.8 242City of Vallejo Transportation Program(Vallejo Transit, Baylink) Vallejo CA Total 2,098.1 235 29,679.0 143Arlington Transit - Arlington County(ART) Arlington VA Total 2,088.2 236 3,851.9 377
Broward County Community Bus Service(BCT) Pompano Beach FL Total 2,085.0 237 7,510.6 291
Transfort Fort Collins CO Total 2,074.6 238 7,323.8 293San Diego Association of Governments(SANDAG) San Diego CA Total 2,042.6 239 97,611.2 62Crescent City Connection Division - Louisiana Department of Transportation(CCCD) New Orleans LA Total 2,015.5 240 1,007.8 536Norwalk Transit District Norwalk CT Total 2,006.2 241 6,512.5 308Muncie Indiana Transit System(MITS) Muncie IN Total 1,991.7 242 6,186.4 315Maritime Transportation Authority of Puerto Rico(PRMTA) Fajardo PR Total 1,985.4 243 20,919.9 172DeCamp Bus Lines Montclair NJ Total 1,985.0 244 43,233.4 113Jefferson Parish Department of Transit Administration(Jet) Gretna LA Total 1,979.9 245 10,921.9 243
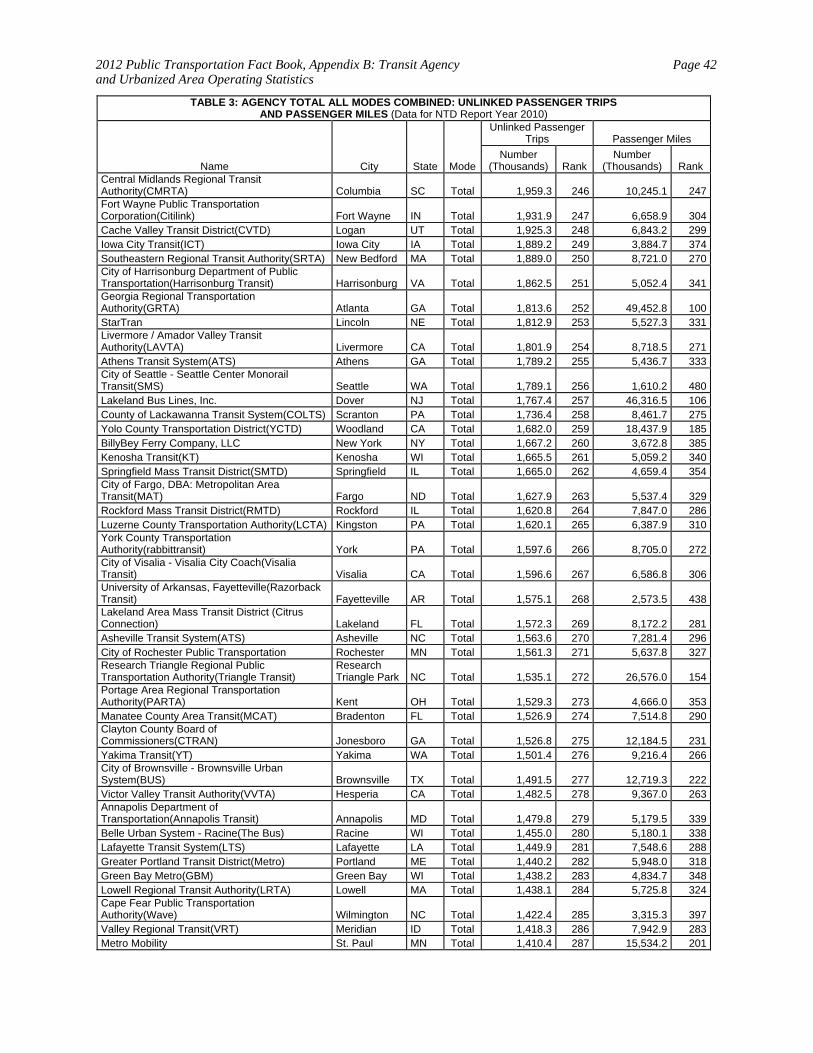
2012 Public Transportation Fact Book, Appendix B: Transit Agency and Urbanized Area Operating Statistics
Page 42
TABLE 3: AGENCY TOTAL ALL MODES COMBINED: UNLINKED PASSENGER TRIPS AND PASSENGER MILES (Data for NTD Report Year 2010)
Name City State Mode
Unlinked Passenger Trips Passenger Miles
Number (Thousands) Rank
Number (Thousands) Rank
Central Midlands Regional Transit Authority(CMRTA) Columbia SC Total 1,959.3 246 10,245.1 247Fort Wayne Public Transportation Corporation(Citilink) Fort Wayne IN Total 1,931.9 247 6,658.9 304Cache Valley Transit District(CVTD) Logan UT Total 1,925.3 248 6,843.2 299Iowa City Transit(ICT) Iowa City IA Total 1,889.2 249 3,884.7 374Southeastern Regional Transit Authority(SRTA) New Bedford MA Total 1,889.0 250 8,721.0 270City of Harrisonburg Department of Public Transportation(Harrisonburg Transit) Harrisonburg VA Total 1,862.5 251 5,052.4 341Georgia Regional Transportation Authority(GRTA) Atlanta GA Total 1,813.6 252 49,452.8 100StarTran Lincoln NE Total 1,812.9 253 5,527.3 331Livermore / Amador Valley Transit Authority(LAVTA) Livermore CA Total 1,801.9 254 8,718.5 271Athens Transit System(ATS) Athens GA Total 1,789.2 255 5,436.7 333City of Seattle - Seattle Center Monorail Transit(SMS) Seattle WA Total 1,789.1 256 1,610.2 480Lakeland Bus Lines, Inc. Dover NJ Total 1,767.4 257 46,316.5 106County of Lackawanna Transit System(COLTS) Scranton PA Total 1,736.4 258 8,461.7 275Yolo County Transportation District(YCTD) Woodland CA Total 1,682.0 259 18,437.9 185BillyBey Ferry Company, LLC New York NY Total 1,667.2 260 3,672.8 385Kenosha Transit(KT) Kenosha WI Total 1,665.5 261 5,059.2 340Springfield Mass Transit District(SMTD) Springfield IL Total 1,665.0 262 4,659.4 354City of Fargo, DBA: Metropolitan Area Transit(MAT) Fargo ND Total 1,627.9 263 5,537.4 329Rockford Mass Transit District(RMTD) Rockford IL Total 1,620.8 264 7,847.0 286Luzerne County Transportation Authority(LCTA) Kingston PA Total 1,620.1 265 6,387.9 310York County Transportation Authority(rabbittransit) York PA Total 1,597.6 266 8,705.0 272City of Visalia - Visalia City Coach(Visalia Transit) Visalia CA Total 1,596.6 267 6,586.8 306University of Arkansas, Fayetteville(Razorback Transit) Fayetteville AR Total 1,575.1 268 2,573.5 438Lakeland Area Mass Transit District (Citrus Connection) Lakeland FL Total 1,572.3 269 8,172.2 281Asheville Transit System(ATS) Asheville NC Total 1,563.6 270 7,281.4 296City of Rochester Public Transportation Rochester MN Total 1,561.3 271 5,637.8 327Research Triangle Regional Public Transportation Authority(Triangle Transit)
Research Triangle Park NC Total 1,535.1 272 26,576.0 154
Portage Area Regional Transportation Authority(PARTA) Kent OH Total 1,529.3 273 4,666.0 353Manatee County Area Transit(MCAT) Bradenton FL Total 1,526.9 274 7,514.8 290Clayton County Board of Commissioners(CTRAN) Jonesboro GA Total 1,526.8 275 12,184.5 231Yakima Transit(YT) Yakima WA Total 1,501.4 276 9,216.4 266City of Brownsville - Brownsville Urban System(BUS) Brownsville TX Total 1,491.5 277 12,719.3 222Victor Valley Transit Authority(VVTA) Hesperia CA Total 1,482.5 278 9,367.0 263Annapolis Department of Transportation(Annapolis Transit) Annapolis MD Total 1,479.8 279 5,179.5 339Belle Urban System - Racine(The Bus) Racine WI Total 1,455.0 280 5,180.1 338Lafayette Transit System(LTS) Lafayette LA Total 1,449.9 281 7,548.6 288Greater Portland Transit District(Metro) Portland ME Total 1,440.2 282 5,948.0 318Green Bay Metro(GBM) Green Bay WI Total 1,438.2 283 4,834.7 348Lowell Regional Transit Authority(LRTA) Lowell MA Total 1,438.1 284 5,725.8 324Cape Fear Public Transportation Authority(Wave) Wilmington NC Total 1,422.4 285 3,315.3 397Valley Regional Transit(VRT) Meridian ID Total 1,418.3 286 7,942.9 283Metro Mobility St. Paul MN Total 1,410.4 287 15,534.2 201
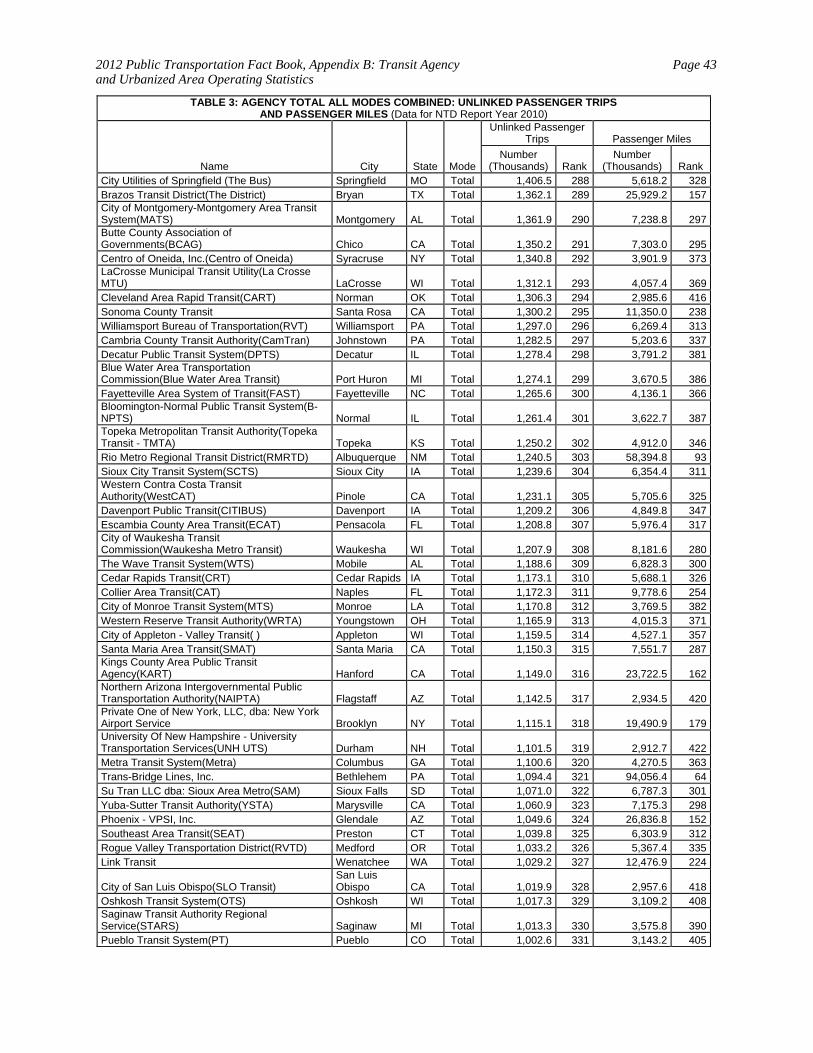
2012 Public Transportation Fact Book, Appendix B: Transit Agency and Urbanized Area Operating Statistics
Page 43
TABLE 3: AGENCY TOTAL ALL MODES COMBINED: UNLINKED PASSENGER TRIPS AND PASSENGER MILES (Data for NTD Report Year 2010)
Name City State Mode
Unlinked Passenger Trips Passenger Miles
Number (Thousands) Rank
Number (Thousands) Rank
City Utilities of Springfield (The Bus) Springfield MO Total 1,406.5 288 5,618.2 328Brazos Transit District(The District) Bryan TX Total 1,362.1 289 25,929.2 157City of Montgomery-Montgomery Area Transit System(MATS) Montgomery AL Total 1,361.9 290 7,238.8 297Butte County Association of Governments(BCAG) Chico CA Total 1,350.2 291 7,303.0 295Centro of Oneida, Inc.(Centro of Oneida) Syracruse NY Total 1,340.8 292 3,901.9 373LaCrosse Municipal Transit Utility(La Crosse MTU) LaCrosse WI Total 1,312.1 293 4,057.4 369Cleveland Area Rapid Transit(CART) Norman OK Total 1,306.3 294 2,985.6 416Sonoma County Transit Santa Rosa CA Total 1,300.2 295 11,350.0 238Williamsport Bureau of Transportation(RVT) Williamsport PA Total 1,297.0 296 6,269.4 313Cambria County Transit Authority(CamTran) Johnstown PA Total 1,282.5 297 5,203.6 337Decatur Public Transit System(DPTS) Decatur IL Total 1,278.4 298 3,791.2 381Blue Water Area Transportation Commission(Blue Water Area Transit) Port Huron MI Total 1,274.1 299 3,670.5 386Fayetteville Area System of Transit(FAST) Fayetteville NC Total 1,265.6 300 4,136.1 366Bloomington-Normal Public Transit System(B-NPTS) Normal IL Total 1,261.4 301 3,622.7 387Topeka Metropolitan Transit Authority(Topeka Transit - TMTA) Topeka KS Total 1,250.2 302 4,912.0 346Rio Metro Regional Transit District(RMRTD) Albuquerque NM Total 1,240.5 303 58,394.8 93Sioux City Transit System(SCTS) Sioux City IA Total 1,239.6 304 6,354.4 311Western Contra Costa Transit Authority(WestCAT) Pinole CA Total 1,231.1 305 5,705.6 325Davenport Public Transit(CITIBUS) Davenport IA Total 1,209.2 306 4,849.8 347Escambia County Area Transit(ECAT) Pensacola FL Total 1,208.8 307 5,976.4 317City of Waukesha Transit Commission(Waukesha Metro Transit) Waukesha WI Total 1,207.9 308 8,181.6 280The Wave Transit System(WTS) Mobile AL Total 1,188.6 309 6,828.3 300Cedar Rapids Transit(CRT) Cedar Rapids IA Total 1,173.1 310 5,688.1 326Collier Area Transit(CAT) Naples FL Total 1,172.3 311 9,778.6 254City of Monroe Transit System(MTS) Monroe LA Total 1,170.8 312 3,769.5 382Western Reserve Transit Authority(WRTA) Youngstown OH Total 1,165.9 313 4,015.3 371City of Appleton - Valley Transit( ) Appleton WI Total 1,159.5 314 4,527.1 357Santa Maria Area Transit(SMAT) Santa Maria CA Total 1,150.3 315 7,551.7 287Kings County Area Public Transit Agency(KART) Hanford CA Total 1,149.0 316 23,722.5 162Northern Arizona Intergovernmental Public Transportation Authority(NAIPTA) Flagstaff AZ Total 1,142.5 317 2,934.5 420Private One of New York, LLC, dba: New York Airport Service Brooklyn NY Total 1,115.1 318 19,490.9 179University Of New Hampshire - University Transportation Services(UNH UTS) Durham NH Total 1,101.5 319 2,912.7 422Metra Transit System(Metra) Columbus GA Total 1,100.6 320 4,270.5 363Trans-Bridge Lines, Inc. Bethlehem PA Total 1,094.4 321 94,056.4 64Su Tran LLC dba: Sioux Area Metro(SAM) Sioux Falls SD Total 1,071.0 322 6,787.3 301Yuba-Sutter Transit Authority(YSTA) Marysville CA Total 1,060.9 323 7,175.3 298Phoenix - VPSI, Inc. Glendale AZ Total 1,049.6 324 26,836.8 152Southeast Area Transit(SEAT) Preston CT Total 1,039.8 325 6,303.9 312Rogue Valley Transportation District(RVTD) Medford OR Total 1,033.2 326 5,367.4 335Link Transit Wenatchee WA Total 1,029.2 327 12,476.9 224
City of San Luis Obispo(SLO Transit) San Luis Obispo CA Total 1,019.9 328 2,957.6 418
Oshkosh Transit System(OTS) Oshkosh WI Total 1,017.3 329 3,109.2 408Saginaw Transit Authority Regional Service(STARS) Saginaw MI Total 1,013.3 330 3,575.8 390Pueblo Transit System(PT) Pueblo CO Total 1,002.6 331 3,143.2 405
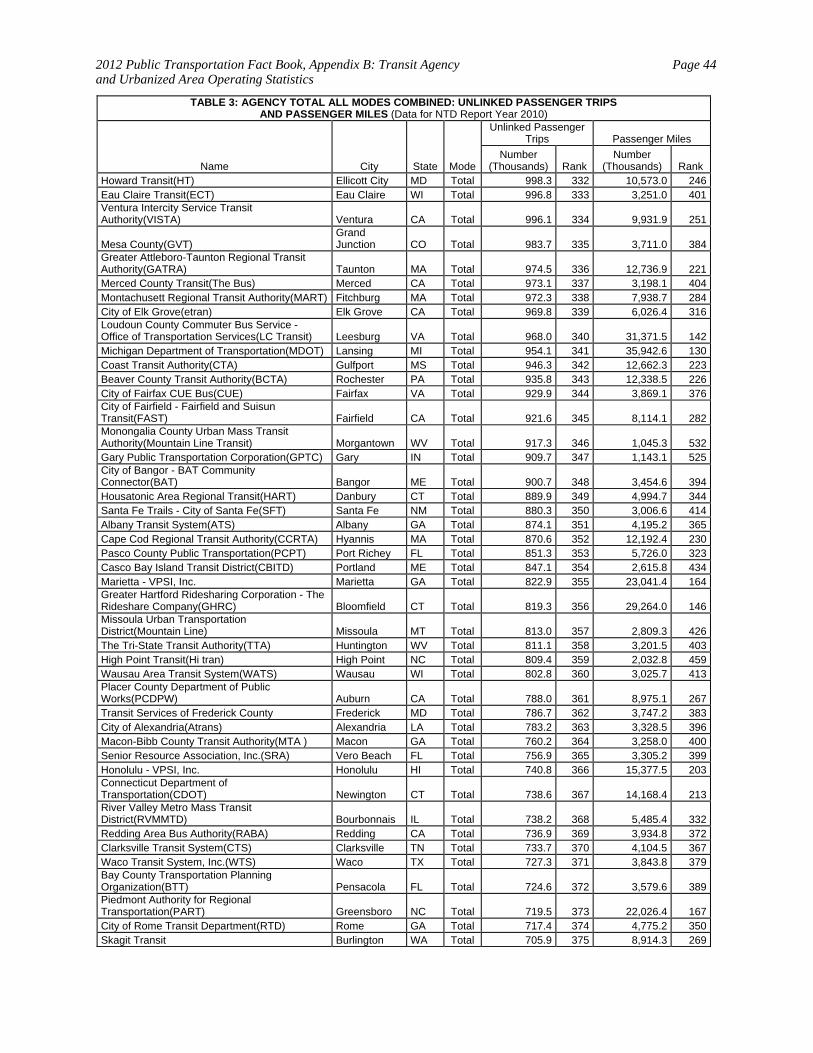
2012 Public Transportation Fact Book, Appendix B: Transit Agency and Urbanized Area Operating Statistics
Page 44
TABLE 3: AGENCY TOTAL ALL MODES COMBINED: UNLINKED PASSENGER TRIPS AND PASSENGER MILES (Data for NTD Report Year 2010)
Name City State Mode
Unlinked Passenger Trips Passenger Miles
Number (Thousands) Rank
Number (Thousands) Rank
Howard Transit(HT) Ellicott City MD Total 998.3 332 10,573.0 246Eau Claire Transit(ECT) Eau Claire WI Total 996.8 333 3,251.0 401Ventura Intercity Service Transit Authority(VISTA) Ventura CA Total 996.1 334 9,931.9 251
Mesa County(GVT) Grand Junction CO Total 983.7 335 3,711.0 384
Greater Attleboro-Taunton Regional Transit Authority(GATRA) Taunton MA Total 974.5 336 12,736.9 221Merced County Transit(The Bus) Merced CA Total 973.1 337 3,198.1 404Montachusett Regional Transit Authority(MART) Fitchburg MA Total 972.3 338 7,938.7 284City of Elk Grove(etran) Elk Grove CA Total 969.8 339 6,026.4 316Loudoun County Commuter Bus Service - Office of Transportation Services(LC Transit) Leesburg VA Total 968.0 340 31,371.5 142Michigan Department of Transportation(MDOT) Lansing MI Total 954.1 341 35,942.6 130Coast Transit Authority(CTA) Gulfport MS Total 946.3 342 12,662.3 223Beaver County Transit Authority(BCTA) Rochester PA Total 935.8 343 12,338.5 226City of Fairfax CUE Bus(CUE) Fairfax VA Total 929.9 344 3,869.1 376City of Fairfield - Fairfield and Suisun Transit(FAST) Fairfield CA Total 921.6 345 8,114.1 282Monongalia County Urban Mass Transit Authority(Mountain Line Transit) Morgantown WV Total 917.3 346 1,045.3 532Gary Public Transportation Corporation(GPTC) Gary IN Total 909.7 347 1,143.1 525City of Bangor - BAT Community Connector(BAT) Bangor ME Total 900.7 348 3,454.6 394Housatonic Area Regional Transit(HART) Danbury CT Total 889.9 349 4,994.7 344Santa Fe Trails - City of Santa Fe(SFT) Santa Fe NM Total 880.3 350 3,006.6 414Albany Transit System(ATS) Albany GA Total 874.1 351 4,195.2 365Cape Cod Regional Transit Authority(CCRTA) Hyannis MA Total 870.6 352 12,192.4 230Pasco County Public Transportation(PCPT) Port Richey FL Total 851.3 353 5,726.0 323Casco Bay Island Transit District(CBITD) Portland ME Total 847.1 354 2,615.8 434Marietta - VPSI, Inc. Marietta GA Total 822.9 355 23,041.4 164Greater Hartford Ridesharing Corporation - The Rideshare Company(GHRC) Bloomfield CT Total 819.3 356 29,264.0 146Missoula Urban Transportation District(Mountain Line) Missoula MT Total 813.0 357 2,809.3 426The Tri-State Transit Authority(TTA) Huntington WV Total 811.1 358 3,201.5 403High Point Transit(Hi tran) High Point NC Total 809.4 359 2,032.8 459Wausau Area Transit System(WATS) Wausau WI Total 802.8 360 3,025.7 413Placer County Department of Public Works(PCDPW) Auburn CA Total 788.0 361 8,975.1 267Transit Services of Frederick County Frederick MD Total 786.7 362 3,747.2 383City of Alexandria(Atrans) Alexandria LA Total 783.2 363 3,328.5 396Macon-Bibb County Transit Authority(MTA ) Macon GA Total 760.2 364 3,258.0 400Senior Resource Association, Inc.(SRA) Vero Beach FL Total 756.9 365 3,305.2 399Honolulu - VPSI, Inc. Honolulu HI Total 740.8 366 15,377.5 203Connecticut Department of Transportation(CDOT) Newington CT Total 738.6 367 14,168.4 213River Valley Metro Mass Transit District(RVMMTD) Bourbonnais IL Total 738.2 368 5,485.4 332Redding Area Bus Authority(RABA) Redding CA Total 736.9 369 3,934.8 372Clarksville Transit System(CTS) Clarksville TN Total 733.7 370 4,104.5 367Waco Transit System, Inc.(WTS) Waco TX Total 727.3 371 3,843.8 379Bay County Transportation Planning Organization(BTT) Pensacola FL Total 724.6 372 3,579.6 389Piedmont Authority for Regional Transportation(PART) Greensboro NC Total 719.5 373 22,026.4 167City of Rome Transit Department(RTD) Rome GA Total 717.4 374 4,775.2 350Skagit Transit Burlington WA Total 705.9 375 8,914.3 269
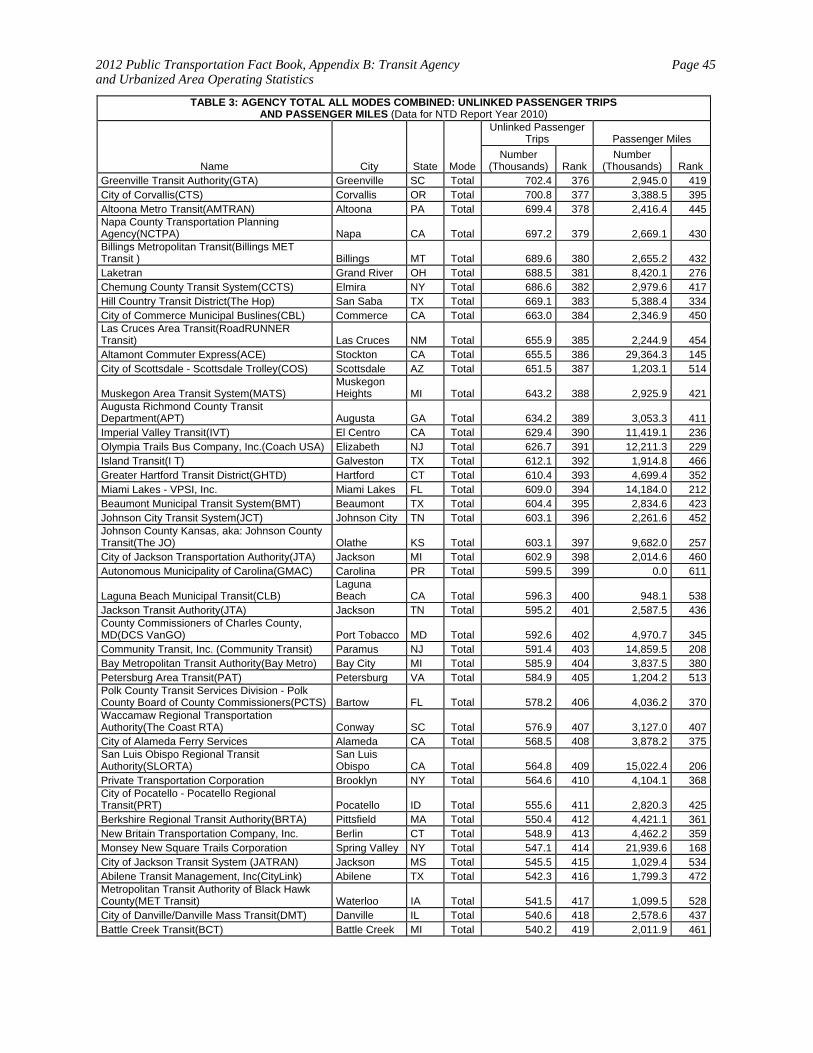
2012 Public Transportation Fact Book, Appendix B: Transit Agency and Urbanized Area Operating Statistics
Page 45
TABLE 3: AGENCY TOTAL ALL MODES COMBINED: UNLINKED PASSENGER TRIPS AND PASSENGER MILES (Data for NTD Report Year 2010)
Name City State Mode
Unlinked Passenger Trips Passenger Miles
Number (Thousands) Rank
Number (Thousands) Rank
Greenville Transit Authority(GTA) Greenville SC Total 702.4 376 2,945.0 419City of Corvallis(CTS) Corvallis OR Total 700.8 377 3,388.5 395Altoona Metro Transit(AMTRAN) Altoona PA Total 699.4 378 2,416.4 445Napa County Transportation Planning Agency(NCTPA) Napa CA Total 697.2 379 2,669.1 430Billings Metropolitan Transit(Billings MET Transit ) Billings MT Total 689.6 380 2,655.2 432Laketran Grand River OH Total 688.5 381 8,420.1 276Chemung County Transit System(CCTS) Elmira NY Total 686.6 382 2,979.6 417Hill Country Transit District(The Hop) San Saba TX Total 669.1 383 5,388.4 334City of Commerce Municipal Buslines(CBL) Commerce CA Total 663.0 384 2,346.9 450Las Cruces Area Transit(RoadRUNNER Transit) Las Cruces NM Total 655.9 385 2,244.9 454Altamont Commuter Express(ACE) Stockton CA Total 655.5 386 29,364.3 145City of Scottsdale - Scottsdale Trolley(COS) Scottsdale AZ Total 651.5 387 1,203.1 514
Muskegon Area Transit System(MATS) Muskegon Heights MI Total 643.2 388 2,925.9 421
Augusta Richmond County Transit Department(APT) Augusta GA Total 634.2 389 3,053.3 411Imperial Valley Transit(IVT) El Centro CA Total 629.4 390 11,419.1 236Olympia Trails Bus Company, Inc.(Coach USA) Elizabeth NJ Total 626.7 391 12,211.3 229Island Transit(I T) Galveston TX Total 612.1 392 1,914.8 466Greater Hartford Transit District(GHTD) Hartford CT Total 610.4 393 4,699.4 352Miami Lakes - VPSI, Inc. Miami Lakes FL Total 609.0 394 14,184.0 212Beaumont Municipal Transit System(BMT) Beaumont TX Total 604.4 395 2,834.6 423Johnson City Transit System(JCT) Johnson City TN Total 603.1 396 2,261.6 452Johnson County Kansas, aka: Johnson County Transit(The JO) Olathe KS Total 603.1 397 9,682.0 257City of Jackson Transportation Authority(JTA) Jackson MI Total 602.9 398 2,014.6 460Autonomous Municipality of Carolina(GMAC) Carolina PR Total 599.5 399 0.0 611
Laguna Beach Municipal Transit(CLB) Laguna Beach CA Total 596.3 400 948.1 538
Jackson Transit Authority(JTA) Jackson TN Total 595.2 401 2,587.5 436County Commissioners of Charles County, MD(DCS VanGO) Port Tobacco MD Total 592.6 402 4,970.7 345Community Transit, Inc. (Community Transit) Paramus NJ Total 591.4 403 14,859.5 208Bay Metropolitan Transit Authority(Bay Metro) Bay City MI Total 585.9 404 3,837.5 380Petersburg Area Transit(PAT) Petersburg VA Total 584.9 405 1,204.2 513Polk County Transit Services Division - Polk County Board of County Commissioners(PCTS) Bartow FL Total 578.2 406 4,036.2 370Waccamaw Regional Transportation Authority(The Coast RTA) Conway SC Total 576.9 407 3,127.0 407City of Alameda Ferry Services Alameda CA Total 568.5 408 3,878.2 375San Luis Obispo Regional Transit Authority(SLORTA)
San Luis Obispo CA Total 564.8 409 15,022.4 206
Private Transportation Corporation Brooklyn NY Total 564.6 410 4,104.1 368City of Pocatello - Pocatello Regional Transit(PRT) Pocatello ID Total 555.6 411 2,820.3 425Berkshire Regional Transit Authority(BRTA) Pittsfield MA Total 550.4 412 4,421.1 361New Britain Transportation Company, Inc. Berlin CT Total 548.9 413 4,462.2 359Monsey New Square Trails Corporation Spring Valley NY Total 547.1 414 21,939.6 168City of Jackson Transit System (JATRAN) Jackson MS Total 545.5 415 1,029.4 534Abilene Transit Management, Inc(CityLink) Abilene TX Total 542.3 416 1,799.3 472Metropolitan Transit Authority of Black Hawk County(MET Transit) Waterloo IA Total 541.5 417 1,099.5 528City of Danville/Danville Mass Transit(DMT) Danville IL Total 540.6 418 2,578.6 437Battle Creek Transit(BCT) Battle Creek MI Total 540.2 419 2,011.9 461
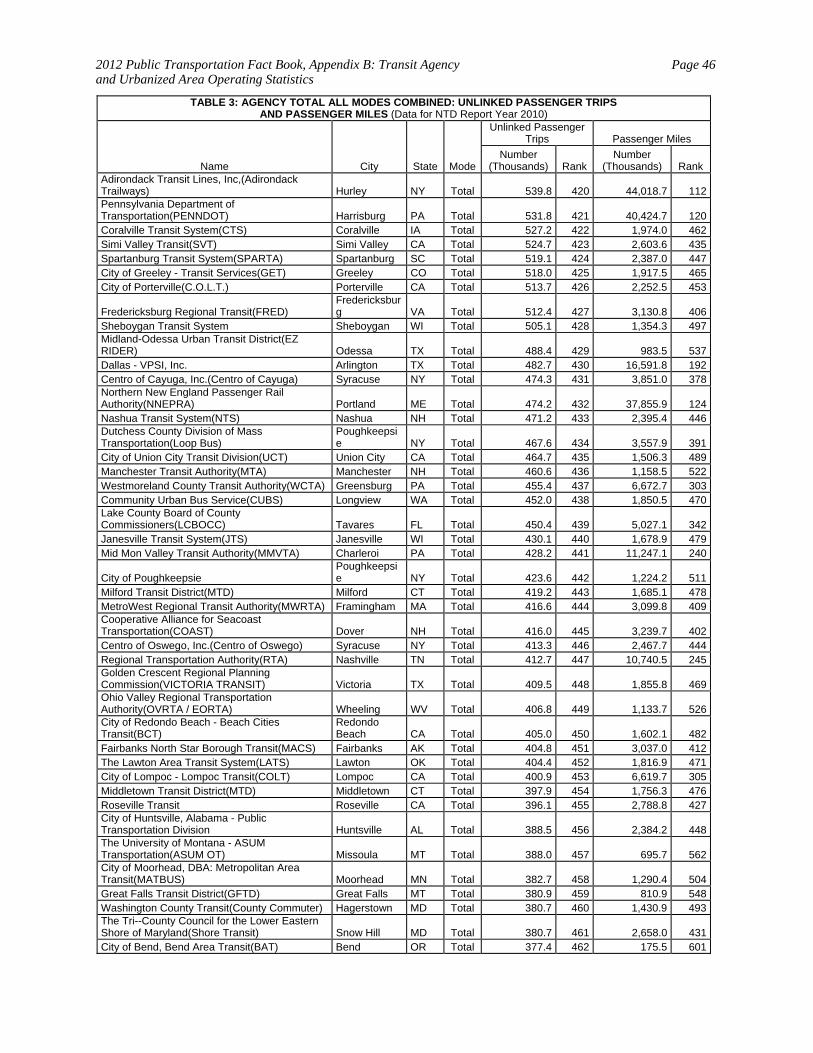
2012 Public Transportation Fact Book, Appendix B: Transit Agency and Urbanized Area Operating Statistics
Page 46
TABLE 3: AGENCY TOTAL ALL MODES COMBINED: UNLINKED PASSENGER TRIPS AND PASSENGER MILES (Data for NTD Report Year 2010)
Name City State Mode
Unlinked Passenger Trips Passenger Miles
Number (Thousands) Rank
Number (Thousands) Rank
Adirondack Transit Lines, Inc,(Adirondack Trailways) Hurley NY Total 539.8 420 44,018.7 112Pennsylvania Department of Transportation(PENNDOT) Harrisburg PA Total 531.8 421 40,424.7 120Coralville Transit System(CTS) Coralville IA Total 527.2 422 1,974.0 462Simi Valley Transit(SVT) Simi Valley CA Total 524.7 423 2,603.6 435Spartanburg Transit System(SPARTA) Spartanburg SC Total 519.1 424 2,387.0 447City of Greeley - Transit Services(GET) Greeley CO Total 518.0 425 1,917.5 465City of Porterville(C.O.L.T.) Porterville CA Total 513.7 426 2,252.5 453
Fredericksburg Regional Transit(FRED) Fredericksburg VA Total 512.4 427 3,130.8 406
Sheboygan Transit System Sheboygan WI Total 505.1 428 1,354.3 497Midland-Odessa Urban Transit District(EZ RIDER) Odessa TX Total 488.4 429 983.5 537Dallas - VPSI, Inc. Arlington TX Total 482.7 430 16,591.8 192Centro of Cayuga, Inc.(Centro of Cayuga) Syracuse NY Total 474.3 431 3,851.0 378Northern New England Passenger Rail Authority(NNEPRA) Portland ME Total 474.2 432 37,855.9 124Nashua Transit System(NTS) Nashua NH Total 471.2 433 2,395.4 446Dutchess County Division of Mass Transportation(Loop Bus)
Poughkeepsie NY Total 467.6 434 3,557.9 391
City of Union City Transit Division(UCT) Union City CA Total 464.7 435 1,506.3 489Manchester Transit Authority(MTA) Manchester NH Total 460.6 436 1,158.5 522Westmoreland County Transit Authority(WCTA) Greensburg PA Total 455.4 437 6,672.7 303Community Urban Bus Service(CUBS) Longview WA Total 452.0 438 1,850.5 470Lake County Board of County Commissioners(LCBOCC) Tavares FL Total 450.4 439 5,027.1 342Janesville Transit System(JTS) Janesville WI Total 430.1 440 1,678.9 479Mid Mon Valley Transit Authority(MMVTA) Charleroi PA Total 428.2 441 11,247.1 240
City of Poughkeepsie Poughkeepsie NY Total 423.6 442 1,224.2 511
Milford Transit District(MTD) Milford CT Total 419.2 443 1,685.1 478MetroWest Regional Transit Authority(MWRTA) Framingham MA Total 416.6 444 3,099.8 409Cooperative Alliance for Seacoast Transportation(COAST) Dover NH Total 416.0 445 3,239.7 402Centro of Oswego, Inc.(Centro of Oswego) Syracuse NY Total 413.3 446 2,467.7 444Regional Transportation Authority(RTA) Nashville TN Total 412.7 447 10,740.5 245Golden Crescent Regional Planning Commission(VICTORIA TRANSIT) Victoria TX Total 409.5 448 1,855.8 469Ohio Valley Regional Transportation Authority(OVRTA / EORTA) Wheeling WV Total 406.8 449 1,133.7 526City of Redondo Beach - Beach Cities Transit(BCT)
Redondo Beach CA Total 405.0 450 1,602.1 482
Fairbanks North Star Borough Transit(MACS) Fairbanks AK Total 404.8 451 3,037.0 412The Lawton Area Transit System(LATS) Lawton OK Total 404.4 452 1,816.9 471City of Lompoc - Lompoc Transit(COLT) Lompoc CA Total 400.9 453 6,619.7 305Middletown Transit District(MTD) Middletown CT Total 397.9 454 1,756.3 476Roseville Transit Roseville CA Total 396.1 455 2,788.8 427City of Huntsville, Alabama - Public Transportation Division Huntsville AL Total 388.5 456 2,384.2 448The University of Montana - ASUM Transportation(ASUM OT) Missoula MT Total 388.0 457 695.7 562City of Moorhead, DBA: Metropolitan Area Transit(MATBUS) Moorhead MN Total 382.7 458 1,290.4 504Great Falls Transit District(GFTD) Great Falls MT Total 380.9 459 810.9 548Washington County Transit(County Commuter) Hagerstown MD Total 380.7 460 1,430.9 493The Tri--County Council for the Lower Eastern Shore of Maryland(Shore Transit) Snow Hill MD Total 380.7 461 2,658.0 431City of Bend, Bend Area Transit(BAT) Bend OR Total 377.4 462 175.5 601
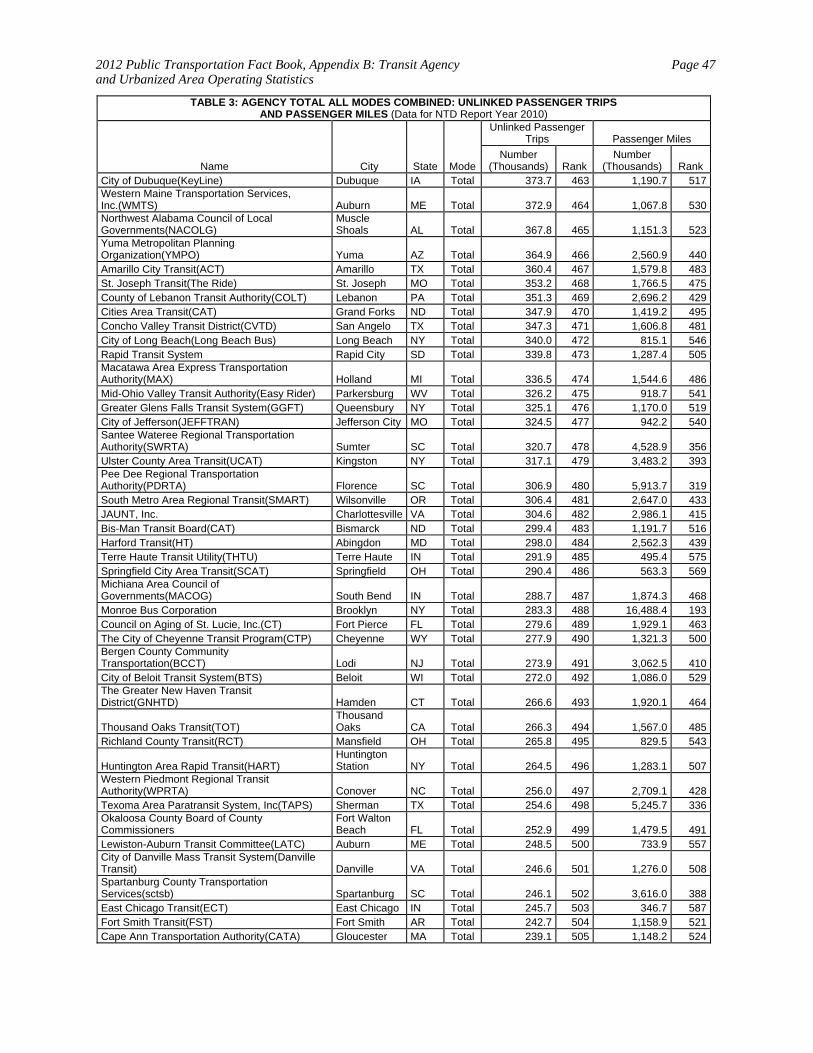
2012 Public Transportation Fact Book, Appendix B: Transit Agency and Urbanized Area Operating Statistics
Page 47
TABLE 3: AGENCY TOTAL ALL MODES COMBINED: UNLINKED PASSENGER TRIPS AND PASSENGER MILES (Data for NTD Report Year 2010)
Name City State Mode
Unlinked Passenger Trips Passenger Miles
Number (Thousands) Rank
Number (Thousands) Rank
City of Dubuque(KeyLine) Dubuque IA Total 373.7 463 1,190.7 517Western Maine Transportation Services, Inc.(WMTS) Auburn ME Total 372.9 464 1,067.8 530Northwest Alabama Council of Local Governments(NACOLG)
Muscle Shoals AL Total 367.8 465 1,151.3 523
Yuma Metropolitan Planning Organization(YMPO) Yuma AZ Total 364.9 466 2,560.9 440Amarillo City Transit(ACT) Amarillo TX Total 360.4 467 1,579.8 483St. Joseph Transit(The Ride) St. Joseph MO Total 353.2 468 1,766.5 475County of Lebanon Transit Authority(COLT) Lebanon PA Total 351.3 469 2,696.2 429Cities Area Transit(CAT) Grand Forks ND Total 347.9 470 1,419.2 495Concho Valley Transit District(CVTD) San Angelo TX Total 347.3 471 1,606.8 481City of Long Beach(Long Beach Bus) Long Beach NY Total 340.0 472 815.1 546Rapid Transit System Rapid City SD Total 339.8 473 1,287.4 505Macatawa Area Express Transportation Authority(MAX) Holland MI Total 336.5 474 1,544.6 486Mid-Ohio Valley Transit Authority(Easy Rider) Parkersburg WV Total 326.2 475 918.7 541Greater Glens Falls Transit System(GGFT) Queensbury NY Total 325.1 476 1,170.0 519City of Jefferson(JEFFTRAN) Jefferson City MO Total 324.5 477 942.2 540Santee Wateree Regional Transportation Authority(SWRTA) Sumter SC Total 320.7 478 4,528.9 356Ulster County Area Transit(UCAT) Kingston NY Total 317.1 479 3,483.2 393Pee Dee Regional Transportation Authority(PDRTA) Florence SC Total 306.9 480 5,913.7 319South Metro Area Regional Transit(SMART) Wilsonville OR Total 306.4 481 2,647.0 433JAUNT, Inc. Charlottesville VA Total 304.6 482 2,986.1 415Bis-Man Transit Board(CAT) Bismarck ND Total 299.4 483 1,191.7 516Harford Transit(HT) Abingdon MD Total 298.0 484 2,562.3 439Terre Haute Transit Utility(THTU) Terre Haute IN Total 291.9 485 495.4 575Springfield City Area Transit(SCAT) Springfield OH Total 290.4 486 563.3 569Michiana Area Council of Governments(MACOG) South Bend IN Total 288.7 487 1,874.3 468Monroe Bus Corporation Brooklyn NY Total 283.3 488 16,488.4 193Council on Aging of St. Lucie, Inc.(CT) Fort Pierce FL Total 279.6 489 1,929.1 463The City of Cheyenne Transit Program(CTP) Cheyenne WY Total 277.9 490 1,321.3 500Bergen County Community Transportation(BCCT) Lodi NJ Total 273.9 491 3,062.5 410City of Beloit Transit System(BTS) Beloit WI Total 272.0 492 1,086.0 529The Greater New Haven Transit District(GNHTD) Hamden CT Total 266.6 493 1,920.1 464
Thousand Oaks Transit(TOT) Thousand Oaks CA Total 266.3 494 1,567.0 485
Richland County Transit(RCT) Mansfield OH Total 265.8 495 829.5 543
Huntington Area Rapid Transit(HART) Huntington Station NY Total 264.5 496 1,283.1 507
Western Piedmont Regional Transit Authority(WPRTA) Conover NC Total 256.0 497 2,709.1 428Texoma Area Paratransit System, Inc(TAPS) Sherman TX Total 254.6 498 5,245.7 336Okaloosa County Board of County Commissioners
Fort Walton Beach FL Total 252.9 499 1,479.5 491
Lewiston-Auburn Transit Committee(LATC) Auburn ME Total 248.5 500 733.9 557City of Danville Mass Transit System(Danville Transit) Danville VA Total 246.6 501 1,276.0 508Spartanburg County Transportation Services(sctsb) Spartanburg SC Total 246.1 502 3,616.0 388East Chicago Transit(ECT) East Chicago IN Total 245.7 503 346.7 587Fort Smith Transit(FST) Fort Smith AR Total 242.7 504 1,158.9 521Cape Ann Transportation Authority(CATA) Gloucester MA Total 239.1 505 1,148.2 524
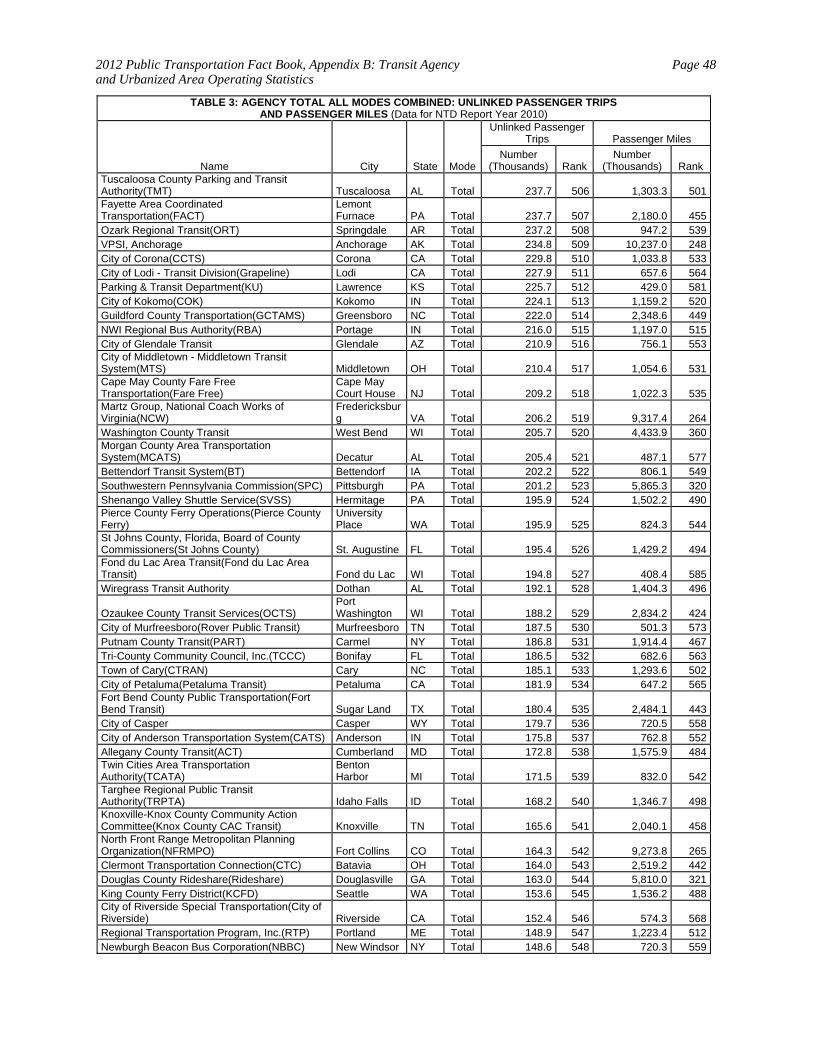
2012 Public Transportation Fact Book, Appendix B: Transit Agency and Urbanized Area Operating Statistics
Page 48
TABLE 3: AGENCY TOTAL ALL MODES COMBINED: UNLINKED PASSENGER TRIPS AND PASSENGER MILES (Data for NTD Report Year 2010)
Name City State Mode
Unlinked Passenger Trips Passenger Miles
Number (Thousands) Rank
Number (Thousands) Rank
Tuscaloosa County Parking and Transit Authority(TMT) Tuscaloosa AL Total 237.7 506 1,303.3 501Fayette Area Coordinated Transportation(FACT)
Lemont Furnace PA Total 237.7 507 2,180.0 455
Ozark Regional Transit(ORT) Springdale AR Total 237.2 508 947.2 539VPSI, Anchorage Anchorage AK Total 234.8 509 10,237.0 248City of Corona(CCTS) Corona CA Total 229.8 510 1,033.8 533City of Lodi - Transit Division(Grapeline) Lodi CA Total 227.9 511 657.6 564Parking & Transit Department(KU) Lawrence KS Total 225.7 512 429.0 581City of Kokomo(COK) Kokomo IN Total 224.1 513 1,159.2 520Guildford County Transportation(GCTAMS) Greensboro NC Total 222.0 514 2,348.6 449NWI Regional Bus Authority(RBA) Portage IN Total 216.0 515 1,197.0 515City of Glendale Transit Glendale AZ Total 210.9 516 756.1 553City of Middletown - Middletown Transit System(MTS) Middletown OH Total 210.4 517 1,054.6 531Cape May County Fare Free Transportation(Fare Free)
Cape May Court House NJ Total 209.2 518 1,022.3 535
Martz Group, National Coach Works of Virginia(NCW)
Fredericksburg VA Total 206.2 519 9,317.4 264
Washington County Transit West Bend WI Total 205.7 520 4,433.9 360Morgan County Area Transportation System(MCATS) Decatur AL Total 205.4 521 487.1 577Bettendorf Transit System(BT) Bettendorf IA Total 202.2 522 806.1 549Southwestern Pennsylvania Commission(SPC) Pittsburgh PA Total 201.2 523 5,865.3 320Shenango Valley Shuttle Service(SVSS) Hermitage PA Total 195.9 524 1,502.2 490Pierce County Ferry Operations(Pierce County Ferry)
University Place WA Total 195.9 525 824.3 544
St Johns County, Florida, Board of County Commissioners(St Johns County) St. Augustine FL Total 195.4 526 1,429.2 494Fond du Lac Area Transit(Fond du Lac Area Transit) Fond du Lac WI Total 194.8 527 408.4 585Wiregrass Transit Authority Dothan AL Total 192.1 528 1,404.3 496
Ozaukee County Transit Services(OCTS) Port Washington WI Total 188.2 529 2,834.2 424
City of Murfreesboro(Rover Public Transit) Murfreesboro TN Total 187.5 530 501.3 573Putnam County Transit(PART) Carmel NY Total 186.8 531 1,914.4 467Tri-County Community Council, Inc.(TCCC) Bonifay FL Total 186.5 532 682.6 563Town of Cary(CTRAN) Cary NC Total 185.1 533 1,293.6 502City of Petaluma(Petaluma Transit) Petaluma CA Total 181.9 534 647.2 565Fort Bend County Public Transportation(Fort Bend Transit) Sugar Land TX Total 180.4 535 2,484.1 443City of Casper Casper WY Total 179.7 536 720.5 558City of Anderson Transportation System(CATS) Anderson IN Total 175.8 537 762.8 552Allegany County Transit(ACT) Cumberland MD Total 172.8 538 1,575.9 484Twin Cities Area Transportation Authority(TCATA)
Benton Harbor MI Total 171.5 539 832.0 542
Targhee Regional Public Transit Authority(TRPTA) Idaho Falls ID Total 168.2 540 1,346.7 498Knoxville-Knox County Community Action Committee(Knox County CAC Transit) Knoxville TN Total 165.6 541 2,040.1 458North Front Range Metropolitan Planning Organization(NFRMPO) Fort Collins CO Total 164.3 542 9,273.8 265Clermont Transportation Connection(CTC) Batavia OH Total 164.0 543 2,519.2 442Douglas County Rideshare(Rideshare) Douglasville GA Total 163.0 544 5,810.0 321King County Ferry District(KCFD) Seattle WA Total 153.6 545 1,536.2 488City of Riverside Special Transportation(City of Riverside) Riverside CA Total 152.4 546 574.3 568Regional Transportation Program, Inc.(RTP) Portland ME Total 148.9 547 1,223.4 512Newburgh Beacon Bus Corporation(NBBC) New Windsor NY Total 148.6 548 720.3 559
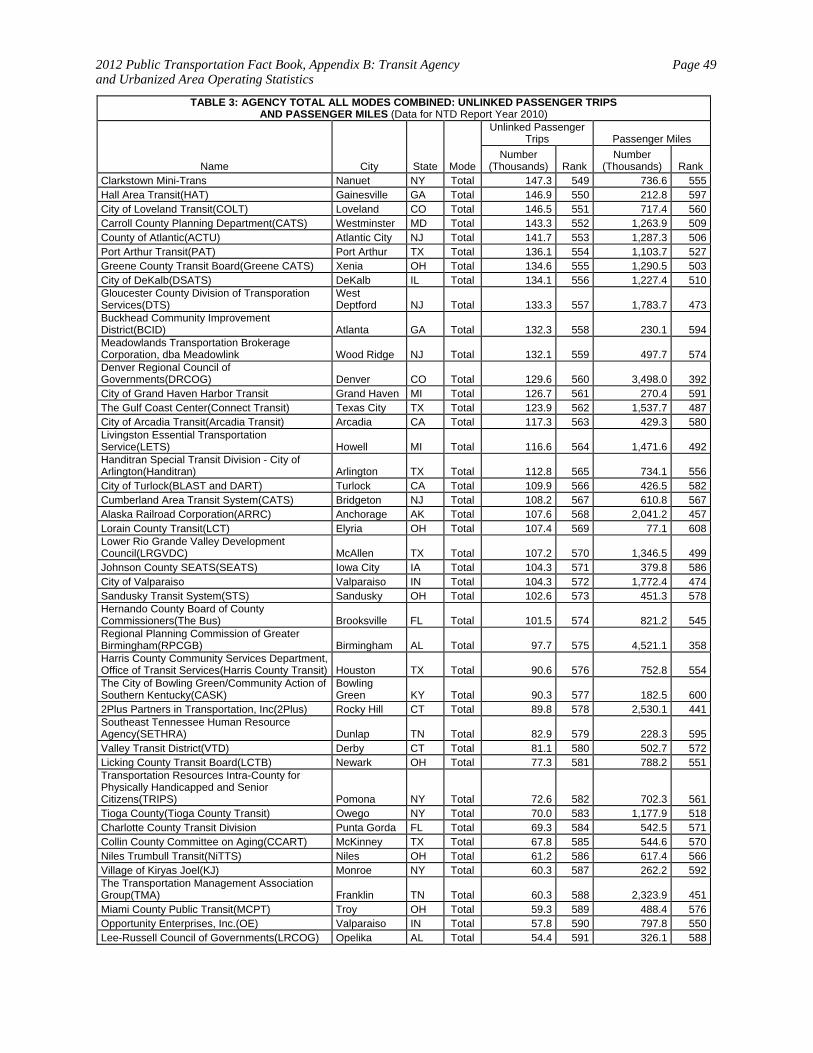
2012 Public Transportation Fact Book, Appendix B: Transit Agency and Urbanized Area Operating Statistics
Page 49
TABLE 3: AGENCY TOTAL ALL MODES COMBINED: UNLINKED PASSENGER TRIPS AND PASSENGER MILES (Data for NTD Report Year 2010)
Name City State Mode
Unlinked Passenger Trips Passenger Miles
Number (Thousands) Rank
Number (Thousands) Rank
Clarkstown Mini-Trans Nanuet NY Total 147.3 549 736.6 555Hall Area Transit(HAT) Gainesville GA Total 146.9 550 212.8 597City of Loveland Transit(COLT) Loveland CO Total 146.5 551 717.4 560Carroll County Planning Department(CATS) Westminster MD Total 143.3 552 1,263.9 509County of Atlantic(ACTU) Atlantic City NJ Total 141.7 553 1,287.3 506Port Arthur Transit(PAT) Port Arthur TX Total 136.1 554 1,103.7 527Greene County Transit Board(Greene CATS) Xenia OH Total 134.6 555 1,290.5 503City of DeKalb(DSATS) DeKalb IL Total 134.1 556 1,227.4 510Gloucester County Division of Transporation Services(DTS)
West Deptford NJ Total 133.3 557 1,783.7 473
Buckhead Community Improvement District(BCID) Atlanta GA Total 132.3 558 230.1 594Meadowlands Transportation Brokerage Corporation, dba Meadowlink Wood Ridge NJ Total 132.1 559 497.7 574Denver Regional Council of Governments(DRCOG) Denver CO Total 129.6 560 3,498.0 392City of Grand Haven Harbor Transit Grand Haven MI Total 126.7 561 270.4 591The Gulf Coast Center(Connect Transit) Texas City TX Total 123.9 562 1,537.7 487City of Arcadia Transit(Arcadia Transit) Arcadia CA Total 117.3 563 429.3 580Livingston Essential Transportation Service(LETS) Howell MI Total 116.6 564 1,471.6 492Handitran Special Transit Division - City of Arlington(Handitran) Arlington TX Total 112.8 565 734.1 556City of Turlock(BLAST and DART) Turlock CA Total 109.9 566 426.5 582Cumberland Area Transit System(CATS) Bridgeton NJ Total 108.2 567 610.8 567Alaska Railroad Corporation(ARRC) Anchorage AK Total 107.6 568 2,041.2 457Lorain County Transit(LCT) Elyria OH Total 107.4 569 77.1 608Lower Rio Grande Valley Development Council(LRGVDC) McAllen TX Total 107.2 570 1,346.5 499Johnson County SEATS(SEATS) Iowa City IA Total 104.3 571 379.8 586City of Valparaiso Valparaiso IN Total 104.3 572 1,772.4 474Sandusky Transit System(STS) Sandusky OH Total 102.6 573 451.3 578Hernando County Board of County Commissioners(The Bus) Brooksville FL Total 101.5 574 821.2 545Regional Planning Commission of Greater Birmingham(RPCGB) Birmingham AL Total 97.7 575 4,521.1 358Harris County Community Services Department, Office of Transit Services(Harris County Transit) Houston TX Total 90.6 576 752.8 554The City of Bowling Green/Community Action of Southern Kentucky(CASK)
Bowling Green KY Total 90.3 577 182.5 600
2Plus Partners in Transportation, Inc(2Plus) Rocky Hill CT Total 89.8 578 2,530.1 441Southeast Tennessee Human Resource Agency(SETHRA) Dunlap TN Total 82.9 579 228.3 595Valley Transit District(VTD) Derby CT Total 81.1 580 502.7 572Licking County Transit Board(LCTB) Newark OH Total 77.3 581 788.2 551Transportation Resources Intra-County for Physically Handicapped and Senior Citizens(TRIPS) Pomona NY Total 72.6 582 702.3 561Tioga County(Tioga County Transit) Owego NY Total 70.0 583 1,177.9 518Charlotte County Transit Division Punta Gorda FL Total 69.3 584 542.5 571Collin County Committee on Aging(CCART) McKinney TX Total 67.8 585 544.6 570Niles Trumbull Transit(NiTTS) Niles OH Total 61.2 586 617.4 566Village of Kiryas Joel(KJ) Monroe NY Total 60.3 587 262.2 592The Transportation Management Association Group(TMA) Franklin TN Total 60.3 588 2,323.9 451Miami County Public Transit(MCPT) Troy OH Total 59.3 589 488.4 576Opportunity Enterprises, Inc.(OE) Valparaiso IN Total 57.8 590 797.8 550Lee-Russell Council of Governments(LRCOG) Opelika AL Total 54.4 591 326.1 588
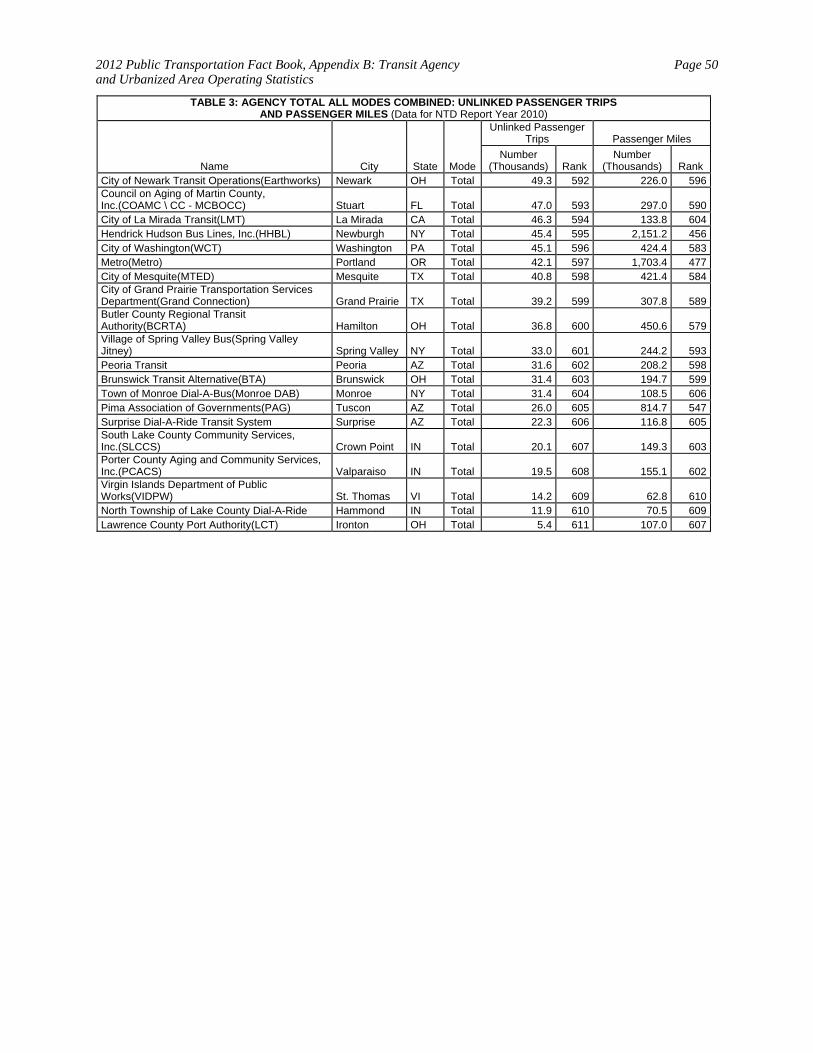
2012 Public Transportation Fact Book, Appendix B: Transit Agency and Urbanized Area Operating Statistics
Page 50
TABLE 3: AGENCY TOTAL ALL MODES COMBINED: UNLINKED PASSENGER TRIPS AND PASSENGER MILES (Data for NTD Report Year 2010)
Name City State Mode
Unlinked Passenger Trips Passenger Miles
Number (Thousands) Rank
Number (Thousands) Rank
City of Newark Transit Operations(Earthworks) Newark OH Total 49.3 592 226.0 596Council on Aging of Martin County, Inc.(COAMC \ CC - MCBOCC) Stuart FL Total 47.0 593 297.0 590City of La Mirada Transit(LMT) La Mirada CA Total 46.3 594 133.8 604Hendrick Hudson Bus Lines, Inc.(HHBL) Newburgh NY Total 45.4 595 2,151.2 456City of Washington(WCT) Washington PA Total 45.1 596 424.4 583Metro(Metro) Portland OR Total 42.1 597 1,703.4 477City of Mesquite(MTED) Mesquite TX Total 40.8 598 421.4 584City of Grand Prairie Transportation Services Department(Grand Connection) Grand Prairie TX Total 39.2 599 307.8 589Butler County Regional Transit Authority(BCRTA) Hamilton OH Total 36.8 600 450.6 579Village of Spring Valley Bus(Spring Valley Jitney) Spring Valley NY Total 33.0 601 244.2 593Peoria Transit Peoria AZ Total 31.6 602 208.2 598Brunswick Transit Alternative(BTA) Brunswick OH Total 31.4 603 194.7 599Town of Monroe Dial-A-Bus(Monroe DAB) Monroe NY Total 31.4 604 108.5 606Pima Association of Governments(PAG) Tuscon AZ Total 26.0 605 814.7 547Surprise Dial-A-Ride Transit System Surprise AZ Total 22.3 606 116.8 605South Lake County Community Services, Inc.(SLCCS) Crown Point IN Total 20.1 607 149.3 603Porter County Aging and Community Services, Inc.(PCACS) Valparaiso IN Total 19.5 608 155.1 602Virgin Islands Department of Public Works(VIDPW) St. Thomas VI Total 14.2 609 62.8 610North Township of Lake County Dial-A-Ride Hammond IN Total 11.9 610 70.5 609Lawrence County Port Authority(LCT) Ironton OH Total 5.4 611 107.0 607
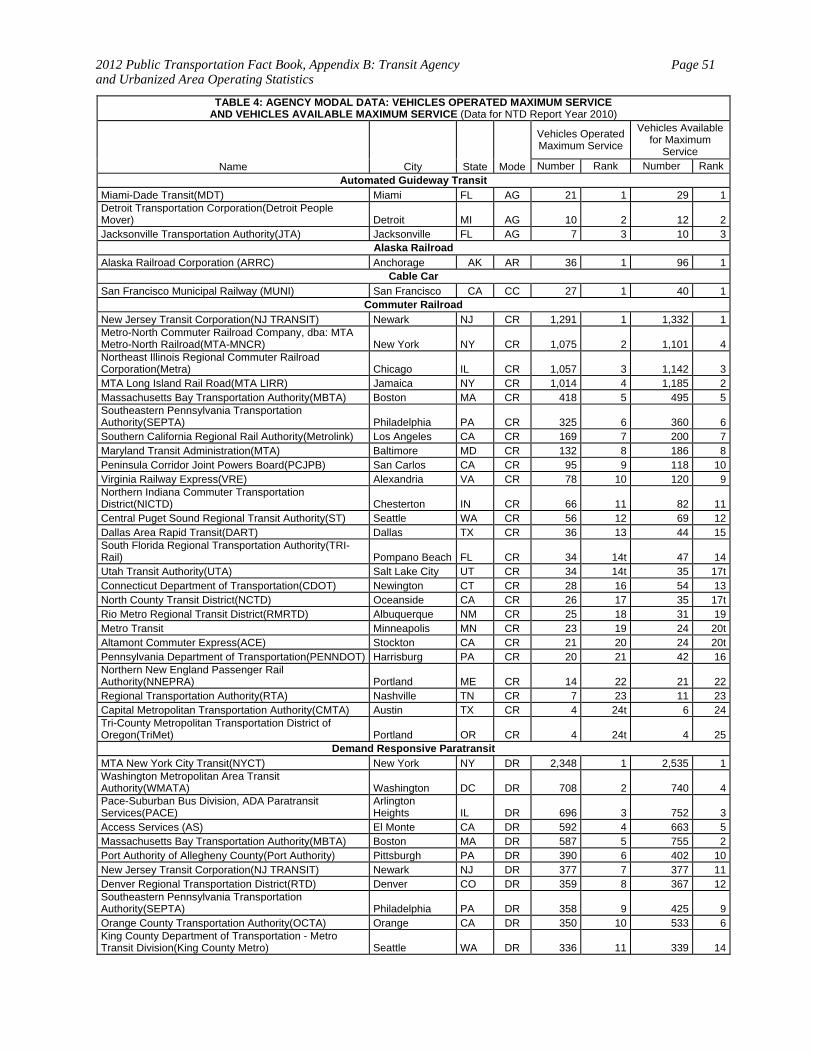
2012 Public Transportation Fact Book, Appendix B: Transit Agency and Urbanized Area Operating Statistics
Page 51
TABLE 4: AGENCY MODAL DATA: VEHICLES OPERATED MAXIMUM SERVICE AND VEHICLES AVAILABLE MAXIMUM SERVICE (Data for NTD Report Year 2010)
Name City State Mode
Vehicles Operated Maximum Service
Vehicles Available for Maximum
Service Number Rank Number Rank
Automated Guideway Transit
Miami-Dade Transit(MDT) Miami FL AG 21 1 29 1Detroit Transportation Corporation(Detroit People Mover) Detroit MI AG 10 2 12 2Jacksonville Transportation Authority(JTA) Jacksonville FL AG 7 3 10 3
Alaska Railroad
Alaska Railroad Corporation (ARRC) Anchorage AK AR 36 1 96 1Cable Car
San Francisco Municipal Railway (MUNI) San Francisco CA CC 27 1 40 1Commuter Railroad
New Jersey Transit Corporation(NJ TRANSIT) Newark NJ CR 1,291 1 1,332 1Metro-North Commuter Railroad Company, dba: MTA Metro-North Railroad(MTA-MNCR) New York NY CR 1,075 2 1,101 4Northeast Illinois Regional Commuter Railroad Corporation(Metra) Chicago IL CR 1,057 3 1,142 3MTA Long Island Rail Road(MTA LIRR) Jamaica NY CR 1,014 4 1,185 2Massachusetts Bay Transportation Authority(MBTA) Boston MA CR 418 5 495 5Southeastern Pennsylvania Transportation Authority(SEPTA) Philadelphia PA CR 325 6 360 6Southern California Regional Rail Authority(Metrolink) Los Angeles CA CR 169 7 200 7Maryland Transit Administration(MTA) Baltimore MD CR 132 8 186 8Peninsula Corridor Joint Powers Board(PCJPB) San Carlos CA CR 95 9 118 10Virginia Railway Express(VRE) Alexandria VA CR 78 10 120 9Northern Indiana Commuter Transportation District(NICTD) Chesterton IN CR 66 11 82 11Central Puget Sound Regional Transit Authority(ST) Seattle WA CR 56 12 69 12Dallas Area Rapid Transit(DART) Dallas TX CR 36 13 44 15South Florida Regional Transportation Authority(TRI-Rail) Pompano Beach FL CR 34 14t 47 14Utah Transit Authority(UTA) Salt Lake City UT CR 34 14t 35 17tConnecticut Department of Transportation(CDOT) Newington CT CR 28 16 54 13North County Transit District(NCTD) Oceanside CA CR 26 17 35 17tRio Metro Regional Transit District(RMRTD) Albuquerque NM CR 25 18 31 19Metro Transit Minneapolis MN CR 23 19 24 20tAltamont Commuter Express(ACE) Stockton CA CR 21 20 24 20tPennsylvania Department of Transportation(PENNDOT) Harrisburg PA CR 20 21 42 16Northern New England Passenger Rail Authority(NNEPRA) Portland ME CR 14 22 21 22Regional Transportation Authority(RTA) Nashville TN CR 7 23 11 23Capital Metropolitan Transportation Authority(CMTA) Austin TX CR 4 24t 6 24Tri-County Metropolitan Transportation District of Oregon(TriMet) Portland OR CR 4 24t 4 25
Demand Responsive Paratransit
MTA New York City Transit(NYCT) New York NY DR 2,348 1 2,535 1Washington Metropolitan Area Transit Authority(WMATA) Washington DC DR 708 2 740 4Pace-Suburban Bus Division, ADA Paratransit Services(PACE)
Arlington Heights IL DR 696 3 752 3
Access Services (AS) El Monte CA DR 592 4 663 5Massachusetts Bay Transportation Authority(MBTA) Boston MA DR 587 5 755 2Port Authority of Allegheny County(Port Authority) Pittsburgh PA DR 390 6 402 10New Jersey Transit Corporation(NJ TRANSIT) Newark NJ DR 377 7 377 11Denver Regional Transportation District(RTD) Denver CO DR 359 8 367 12Southeastern Pennsylvania Transportation Authority(SEPTA) Philadelphia PA DR 358 9 425 9Orange County Transportation Authority(OCTA) Orange CA DR 350 10 533 6King County Department of Transportation - Metro Transit Division(King County Metro) Seattle WA DR 336 11 339 14
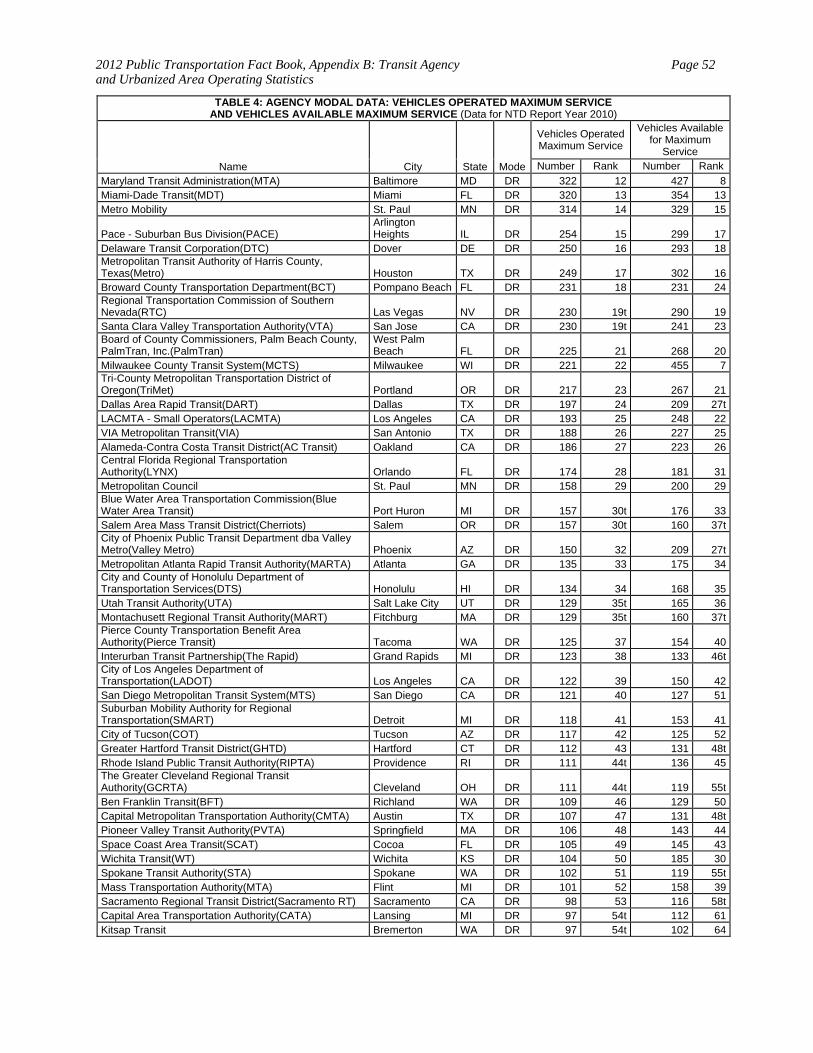
2012 Public Transportation Fact Book, Appendix B: Transit Agency and Urbanized Area Operating Statistics
Page 52
TABLE 4: AGENCY MODAL DATA: VEHICLES OPERATED MAXIMUM SERVICE AND VEHICLES AVAILABLE MAXIMUM SERVICE (Data for NTD Report Year 2010)
Name City State Mode
Vehicles Operated Maximum Service
Vehicles Available for Maximum
Service Number Rank Number Rank
Maryland Transit Administration(MTA) Baltimore MD DR 322 12 427 8Miami-Dade Transit(MDT) Miami FL DR 320 13 354 13Metro Mobility St. Paul MN DR 314 14 329 15
Pace - Suburban Bus Division(PACE) Arlington Heights IL DR 254 15 299 17
Delaware Transit Corporation(DTC) Dover DE DR 250 16 293 18Metropolitan Transit Authority of Harris County, Texas(Metro) Houston TX DR 249 17 302 16Broward County Transportation Department(BCT) Pompano Beach FL DR 231 18 231 24Regional Transportation Commission of Southern Nevada(RTC) Las Vegas NV DR 230 19t 290 19Santa Clara Valley Transportation Authority(VTA) San Jose CA DR 230 19t 241 23Board of County Commissioners, Palm Beach County, PalmTran, Inc.(PalmTran)
West Palm Beach FL DR 225 21 268 20
Milwaukee County Transit System(MCTS) Milwaukee WI DR 221 22 455 7Tri-County Metropolitan Transportation District of Oregon(TriMet) Portland OR DR 217 23 267 21Dallas Area Rapid Transit(DART) Dallas TX DR 197 24 209 27tLACMTA - Small Operators(LACMTA) Los Angeles CA DR 193 25 248 22VIA Metropolitan Transit(VIA) San Antonio TX DR 188 26 227 25Alameda-Contra Costa Transit District(AC Transit) Oakland CA DR 186 27 223 26Central Florida Regional Transportation Authority(LYNX) Orlando FL DR 174 28 181 31Metropolitan Council St. Paul MN DR 158 29 200 29Blue Water Area Transportation Commission(Blue Water Area Transit) Port Huron MI DR 157 30t 176 33Salem Area Mass Transit District(Cherriots) Salem OR DR 157 30t 160 37tCity of Phoenix Public Transit Department dba Valley Metro(Valley Metro) Phoenix AZ DR 150 32 209 27tMetropolitan Atlanta Rapid Transit Authority(MARTA) Atlanta GA DR 135 33 175 34City and County of Honolulu Department of Transportation Services(DTS) Honolulu HI DR 134 34 168 35Utah Transit Authority(UTA) Salt Lake City UT DR 129 35t 165 36Montachusett Regional Transit Authority(MART) Fitchburg MA DR 129 35t 160 37tPierce County Transportation Benefit Area Authority(Pierce Transit) Tacoma WA DR 125 37 154 40Interurban Transit Partnership(The Rapid) Grand Rapids MI DR 123 38 133 46tCity of Los Angeles Department of Transportation(LADOT) Los Angeles CA DR 122 39 150 42San Diego Metropolitan Transit System(MTS) San Diego CA DR 121 40 127 51Suburban Mobility Authority for Regional Transportation(SMART) Detroit MI DR 118 41 153 41City of Tucson(COT) Tucson AZ DR 117 42 125 52Greater Hartford Transit District(GHTD) Hartford CT DR 112 43 131 48tRhode Island Public Transit Authority(RIPTA) Providence RI DR 111 44t 136 45The Greater Cleveland Regional Transit Authority(GCRTA) Cleveland OH DR 111 44t 119 55tBen Franklin Transit(BFT) Richland WA DR 109 46 129 50Capital Metropolitan Transportation Authority(CMTA) Austin TX DR 107 47 131 48tPioneer Valley Transit Authority(PVTA) Springfield MA DR 106 48 143 44Space Coast Area Transit(SCAT) Cocoa FL DR 105 49 145 43Wichita Transit(WT) Wichita KS DR 104 50 185 30Spokane Transit Authority(STA) Spokane WA DR 102 51 119 55tMass Transportation Authority(MTA) Flint MI DR 101 52 158 39Sacramento Regional Transit District(Sacramento RT) Sacramento CA DR 98 53 116 58tCapital Area Transportation Authority(CATA) Lansing MI DR 97 54t 112 61Kitsap Transit Bremerton WA DR 97 54t 102 64
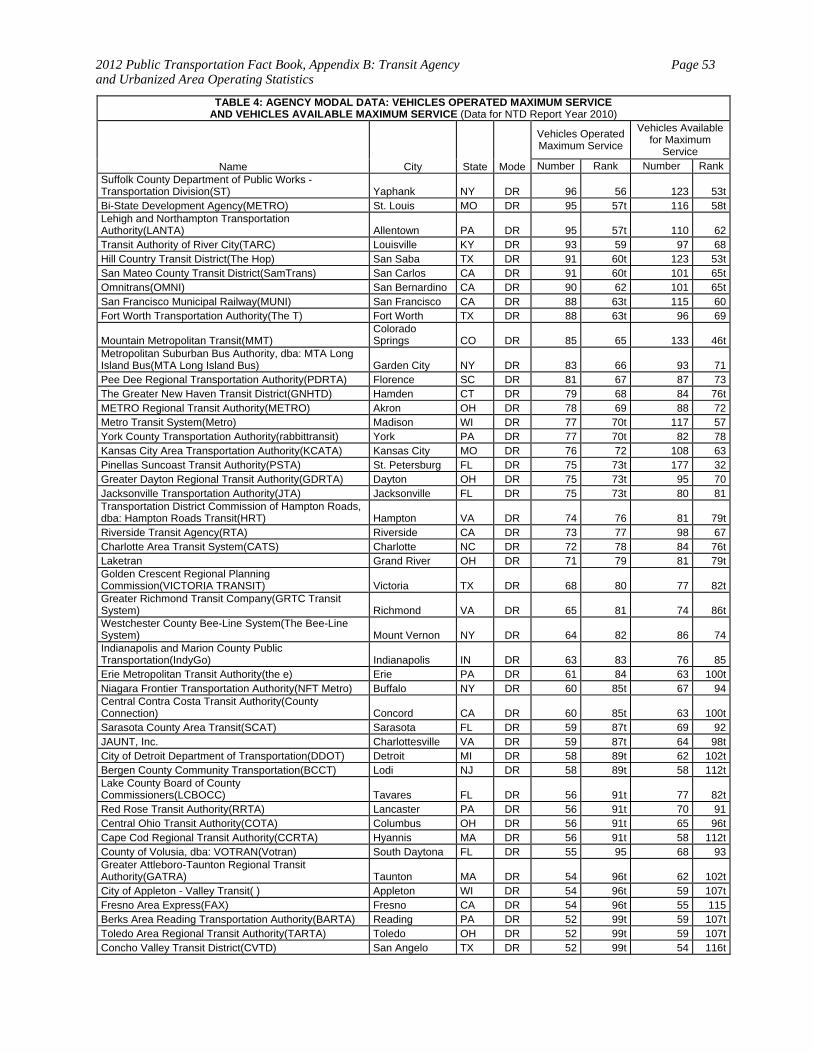
2012 Public Transportation Fact Book, Appendix B: Transit Agency and Urbanized Area Operating Statistics
Page 53
TABLE 4: AGENCY MODAL DATA: VEHICLES OPERATED MAXIMUM SERVICE AND VEHICLES AVAILABLE MAXIMUM SERVICE (Data for NTD Report Year 2010)
Name City State Mode
Vehicles Operated Maximum Service
Vehicles Available for Maximum
Service Number Rank Number Rank
Suffolk County Department of Public Works - Transportation Division(ST) Yaphank NY DR 96 56 123 53tBi-State Development Agency(METRO) St. Louis MO DR 95 57t 116 58tLehigh and Northampton Transportation Authority(LANTA) Allentown PA DR 95 57t 110 62Transit Authority of River City(TARC) Louisville KY DR 93 59 97 68Hill Country Transit District(The Hop) San Saba TX DR 91 60t 123 53tSan Mateo County Transit District(SamTrans) San Carlos CA DR 91 60t 101 65tOmnitrans(OMNI) San Bernardino CA DR 90 62 101 65tSan Francisco Municipal Railway(MUNI) San Francisco CA DR 88 63t 115 60Fort Worth Transportation Authority(The T) Fort Worth TX DR 88 63t 96 69
Mountain Metropolitan Transit(MMT) Colorado Springs CO DR 85 65 133 46t
Metropolitan Suburban Bus Authority, dba: MTA Long Island Bus(MTA Long Island Bus) Garden City NY DR 83 66 93 71Pee Dee Regional Transportation Authority(PDRTA) Florence SC DR 81 67 87 73The Greater New Haven Transit District(GNHTD) Hamden CT DR 79 68 84 76tMETRO Regional Transit Authority(METRO) Akron OH DR 78 69 88 72Metro Transit System(Metro) Madison WI DR 77 70t 117 57York County Transportation Authority(rabbittransit) York PA DR 77 70t 82 78Kansas City Area Transportation Authority(KCATA) Kansas City MO DR 76 72 108 63Pinellas Suncoast Transit Authority(PSTA) St. Petersburg FL DR 75 73t 177 32Greater Dayton Regional Transit Authority(GDRTA) Dayton OH DR 75 73t 95 70Jacksonville Transportation Authority(JTA) Jacksonville FL DR 75 73t 80 81Transportation District Commission of Hampton Roads, dba: Hampton Roads Transit(HRT) Hampton VA DR 74 76 81 79tRiverside Transit Agency(RTA) Riverside CA DR 73 77 98 67Charlotte Area Transit System(CATS) Charlotte NC DR 72 78 84 76tLaketran Grand River OH DR 71 79 81 79tGolden Crescent Regional Planning Commission(VICTORIA TRANSIT) Victoria TX DR 68 80 77 82tGreater Richmond Transit Company(GRTC Transit System) Richmond VA DR 65 81 74 86tWestchester County Bee-Line System(The Bee-Line System) Mount Vernon NY DR 64 82 86 74Indianapolis and Marion County Public Transportation(IndyGo) Indianapolis IN DR 63 83 76 85Erie Metropolitan Transit Authority(the e) Erie PA DR 61 84 63 100tNiagara Frontier Transportation Authority(NFT Metro) Buffalo NY DR 60 85t 67 94Central Contra Costa Transit Authority(County Connection) Concord CA DR 60 85t 63 100tSarasota County Area Transit(SCAT) Sarasota FL DR 59 87t 69 92JAUNT, Inc. Charlottesville VA DR 59 87t 64 98tCity of Detroit Department of Transportation(DDOT) Detroit MI DR 58 89t 62 102tBergen County Community Transportation(BCCT) Lodi NJ DR 58 89t 58 112tLake County Board of County Commissioners(LCBOCC) Tavares FL DR 56 91t 77 82tRed Rose Transit Authority(RRTA) Lancaster PA DR 56 91t 70 91Central Ohio Transit Authority(COTA) Columbus OH DR 56 91t 65 96tCape Cod Regional Transit Authority(CCRTA) Hyannis MA DR 56 91t 58 112tCounty of Volusia, dba: VOTRAN(Votran) South Daytona FL DR 55 95 68 93Greater Attleboro-Taunton Regional Transit Authority(GATRA) Taunton MA DR 54 96t 62 102tCity of Appleton - Valley Transit( ) Appleton WI DR 54 96t 59 107tFresno Area Express(FAX) Fresno CA DR 54 96t 55 115Berks Area Reading Transportation Authority(BARTA) Reading PA DR 52 99t 59 107tToledo Area Regional Transit Authority(TARTA) Toledo OH DR 52 99t 59 107tConcho Valley Transit District(CVTD) San Angelo TX DR 52 99t 54 116t
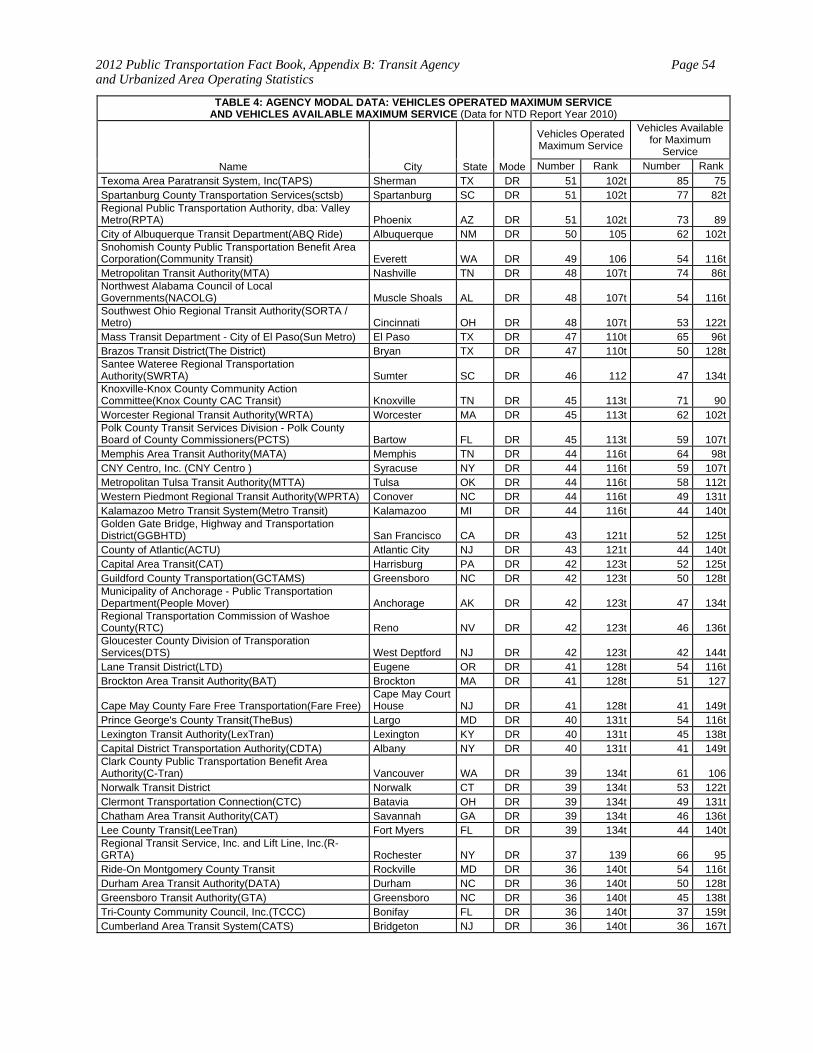
2012 Public Transportation Fact Book, Appendix B: Transit Agency and Urbanized Area Operating Statistics
Page 54
TABLE 4: AGENCY MODAL DATA: VEHICLES OPERATED MAXIMUM SERVICE AND VEHICLES AVAILABLE MAXIMUM SERVICE (Data for NTD Report Year 2010)
Name City State Mode
Vehicles Operated Maximum Service
Vehicles Available for Maximum
Service Number Rank Number Rank
Texoma Area Paratransit System, Inc(TAPS) Sherman TX DR 51 102t 85 75Spartanburg County Transportation Services(sctsb) Spartanburg SC DR 51 102t 77 82tRegional Public Transportation Authority, dba: Valley Metro(RPTA) Phoenix AZ DR 51 102t 73 89City of Albuquerque Transit Department(ABQ Ride) Albuquerque NM DR 50 105 62 102tSnohomish County Public Transportation Benefit Area Corporation(Community Transit) Everett WA DR 49 106 54 116tMetropolitan Transit Authority(MTA) Nashville TN DR 48 107t 74 86tNorthwest Alabama Council of Local Governments(NACOLG) Muscle Shoals AL DR 48 107t 54 116tSouthwest Ohio Regional Transit Authority(SORTA / Metro) Cincinnati OH DR 48 107t 53 122tMass Transit Department - City of El Paso(Sun Metro) El Paso TX DR 47 110t 65 96tBrazos Transit District(The District) Bryan TX DR 47 110t 50 128tSantee Wateree Regional Transportation Authority(SWRTA) Sumter SC DR 46 112 47 134tKnoxville-Knox County Community Action Committee(Knox County CAC Transit) Knoxville TN DR 45 113t 71 90Worcester Regional Transit Authority(WRTA) Worcester MA DR 45 113t 62 102tPolk County Transit Services Division - Polk County Board of County Commissioners(PCTS) Bartow FL DR 45 113t 59 107tMemphis Area Transit Authority(MATA) Memphis TN DR 44 116t 64 98tCNY Centro, Inc. (CNY Centro ) Syracuse NY DR 44 116t 59 107tMetropolitan Tulsa Transit Authority(MTTA) Tulsa OK DR 44 116t 58 112tWestern Piedmont Regional Transit Authority(WPRTA) Conover NC DR 44 116t 49 131tKalamazoo Metro Transit System(Metro Transit) Kalamazoo MI DR 44 116t 44 140tGolden Gate Bridge, Highway and Transportation District(GGBHTD) San Francisco CA DR 43 121t 52 125tCounty of Atlantic(ACTU) Atlantic City NJ DR 43 121t 44 140tCapital Area Transit(CAT) Harrisburg PA DR 42 123t 52 125tGuildford County Transportation(GCTAMS) Greensboro NC DR 42 123t 50 128tMunicipality of Anchorage - Public Transportation Department(People Mover) Anchorage AK DR 42 123t 47 134tRegional Transportation Commission of Washoe County(RTC) Reno NV DR 42 123t 46 136tGloucester County Division of Transporation Services(DTS) West Deptford NJ DR 42 123t 42 144tLane Transit District(LTD) Eugene OR DR 41 128t 54 116tBrockton Area Transit Authority(BAT) Brockton MA DR 41 128t 51 127
Cape May County Fare Free Transportation(Fare Free) Cape May Court House NJ DR 41 128t 41 149t
Prince George's County Transit(TheBus) Largo MD DR 40 131t 54 116tLexington Transit Authority(LexTran) Lexington KY DR 40 131t 45 138tCapital District Transportation Authority(CDTA) Albany NY DR 40 131t 41 149tClark County Public Transportation Benefit Area Authority(C-Tran) Vancouver WA DR 39 134t 61 106Norwalk Transit District Norwalk CT DR 39 134t 53 122tClermont Transportation Connection(CTC) Batavia OH DR 39 134t 49 131tChatham Area Transit Authority(CAT) Savannah GA DR 39 134t 46 136tLee County Transit(LeeTran) Fort Myers FL DR 39 134t 44 140tRegional Transit Service, Inc. and Lift Line, Inc.(R-GRTA) Rochester NY DR 37 139 66 95Ride-On Montgomery County Transit Rockville MD DR 36 140t 54 116tDurham Area Transit Authority(DATA) Durham NC DR 36 140t 50 128tGreensboro Transit Authority(GTA) Greensboro NC DR 36 140t 45 138tTri-County Community Council, Inc.(TCCC) Bonifay FL DR 36 140t 37 159tCumberland Area Transit System(CATS) Bridgeton NJ DR 36 140t 36 167t
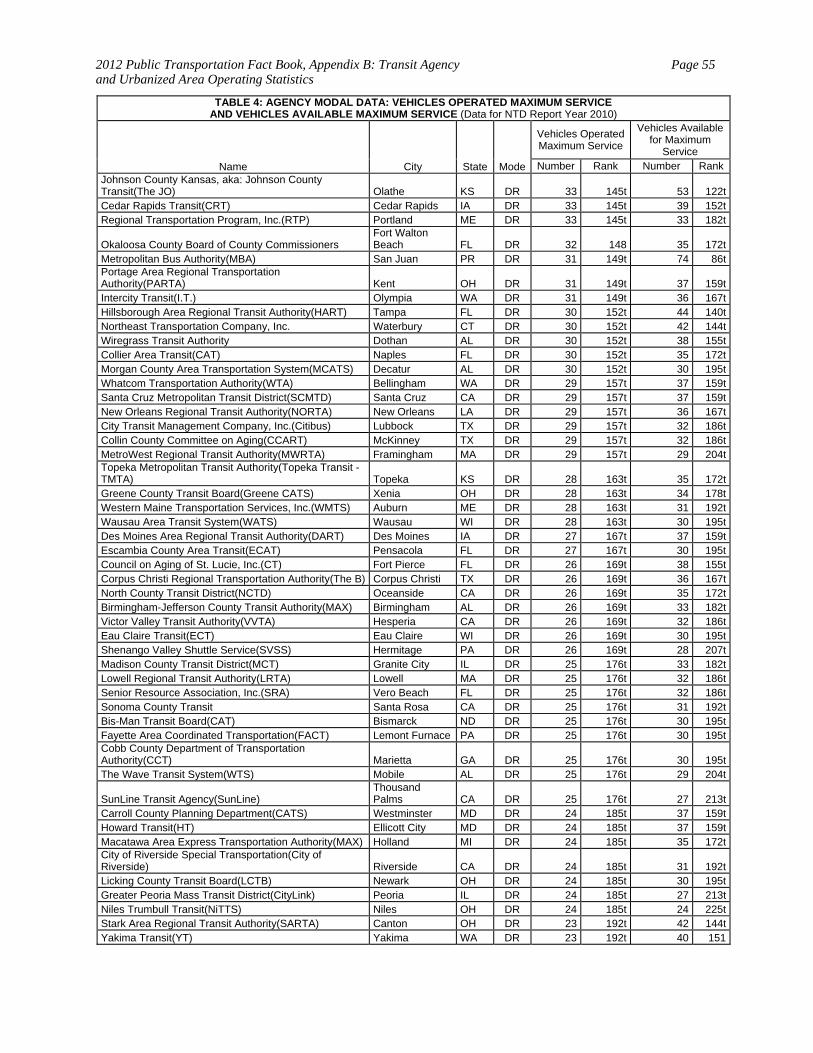
2012 Public Transportation Fact Book, Appendix B: Transit Agency and Urbanized Area Operating Statistics
Page 55
TABLE 4: AGENCY MODAL DATA: VEHICLES OPERATED MAXIMUM SERVICE AND VEHICLES AVAILABLE MAXIMUM SERVICE (Data for NTD Report Year 2010)
Name City State Mode
Vehicles Operated Maximum Service
Vehicles Available for Maximum
Service Number Rank Number Rank
Johnson County Kansas, aka: Johnson County Transit(The JO) Olathe KS DR 33 145t 53 122tCedar Rapids Transit(CRT) Cedar Rapids IA DR 33 145t 39 152tRegional Transportation Program, Inc.(RTP) Portland ME DR 33 145t 33 182t
Okaloosa County Board of County Commissioners Fort Walton Beach FL DR 32 148 35 172t
Metropolitan Bus Authority(MBA) San Juan PR DR 31 149t 74 86tPortage Area Regional Transportation Authority(PARTA) Kent OH DR 31 149t 37 159tIntercity Transit(I.T.) Olympia WA DR 31 149t 36 167tHillsborough Area Regional Transit Authority(HART) Tampa FL DR 30 152t 44 140tNortheast Transportation Company, Inc. Waterbury CT DR 30 152t 42 144tWiregrass Transit Authority Dothan AL DR 30 152t 38 155tCollier Area Transit(CAT) Naples FL DR 30 152t 35 172tMorgan County Area Transportation System(MCATS) Decatur AL DR 30 152t 30 195tWhatcom Transportation Authority(WTA) Bellingham WA DR 29 157t 37 159tSanta Cruz Metropolitan Transit District(SCMTD) Santa Cruz CA DR 29 157t 37 159tNew Orleans Regional Transit Authority(NORTA) New Orleans LA DR 29 157t 36 167tCity Transit Management Company, Inc.(Citibus) Lubbock TX DR 29 157t 32 186tCollin County Committee on Aging(CCART) McKinney TX DR 29 157t 32 186tMetroWest Regional Transit Authority(MWRTA) Framingham MA DR 29 157t 29 204tTopeka Metropolitan Transit Authority(Topeka Transit -TMTA) Topeka KS DR 28 163t 35 172tGreene County Transit Board(Greene CATS) Xenia OH DR 28 163t 34 178tWestern Maine Transportation Services, Inc.(WMTS) Auburn ME DR 28 163t 31 192tWausau Area Transit System(WATS) Wausau WI DR 28 163t 30 195tDes Moines Area Regional Transit Authority(DART) Des Moines IA DR 27 167t 37 159tEscambia County Area Transit(ECAT) Pensacola FL DR 27 167t 30 195tCouncil on Aging of St. Lucie, Inc.(CT) Fort Pierce FL DR 26 169t 38 155tCorpus Christi Regional Transportation Authority(The B) Corpus Christi TX DR 26 169t 36 167tNorth County Transit District(NCTD) Oceanside CA DR 26 169t 35 172tBirmingham-Jefferson County Transit Authority(MAX) Birmingham AL DR 26 169t 33 182tVictor Valley Transit Authority(VVTA) Hesperia CA DR 26 169t 32 186tEau Claire Transit(ECT) Eau Claire WI DR 26 169t 30 195tShenango Valley Shuttle Service(SVSS) Hermitage PA DR 26 169t 28 207tMadison County Transit District(MCT) Granite City IL DR 25 176t 33 182tLowell Regional Transit Authority(LRTA) Lowell MA DR 25 176t 32 186tSenior Resource Association, Inc.(SRA) Vero Beach FL DR 25 176t 32 186tSonoma County Transit Santa Rosa CA DR 25 176t 31 192tBis-Man Transit Board(CAT) Bismarck ND DR 25 176t 30 195tFayette Area Coordinated Transportation(FACT) Lemont Furnace PA DR 25 176t 30 195tCobb County Department of Transportation Authority(CCT) Marietta GA DR 25 176t 30 195tThe Wave Transit System(WTS) Mobile AL DR 25 176t 29 204t
SunLine Transit Agency(SunLine) Thousand Palms CA DR 25 176t 27 213t
Carroll County Planning Department(CATS) Westminster MD DR 24 185t 37 159tHoward Transit(HT) Ellicott City MD DR 24 185t 37 159tMacatawa Area Express Transportation Authority(MAX) Holland MI DR 24 185t 35 172tCity of Riverside Special Transportation(City of Riverside) Riverside CA DR 24 185t 31 192tLicking County Transit Board(LCTB) Newark OH DR 24 185t 30 195tGreater Peoria Mass Transit District(CityLink) Peoria IL DR 24 185t 27 213tNiles Trumbull Transit(NiTTS) Niles OH DR 24 185t 24 225tStark Area Regional Transit Authority(SARTA) Canton OH DR 23 192t 42 144tYakima Transit(YT) Yakima WA DR 23 192t 40 151

2012 Public Transportation Fact Book, Appendix B: Transit Agency and Urbanized Area Operating Statistics
Page 56
TABLE 4: AGENCY MODAL DATA: VEHICLES OPERATED MAXIMUM SERVICE AND VEHICLES AVAILABLE MAXIMUM SERVICE (Data for NTD Report Year 2010)
Name City State Mode
Vehicles Operated Maximum Service
Vehicles Available for Maximum
Service Number Rank Number Rank
Transfort Fort Collins CO DR 23 192t 34 178tTransit Authority of Northern Kentucky(TANK) Fort Wright KY DR 23 192t 32 186tThe Tri--County Council for the Lower Eastern Shore of Maryland(Shore Transit) Snow Hill MD DR 23 192t 28 207tWashington County Transit West Bend WI DR 23 192t 27 213tMonterey-Salinas Transit(MST) Monterey CA DR 23 192t 26 217tWinston-Salem Transit Authority - Trans-Aid of Forsyth County(WSTA) Winston-Salem NC DR 23 192t 24 225tSan Joaquin Regional Transit District(RTD) Stockton CA DR 22 200t 39 152tLink Transit Wenatchee WA DR 22 200t 33 182tJohnson County SEATS(SEATS) Iowa City IA DR 22 200t 26 217tCity of DeKalb(DSATS) DeKalb IL DR 22 200t 25 220tEverett Transit(ET) Everett WA DR 22 200t 23 238tManatee County Area Transit(MCAT) Bradenton FL DR 22 200t 23 238tRogue Valley Transportation District(RVTD) Medford OR DR 22 200t 23 238tGainesville Regional Transit System(RTS) Gainesville FL DR 21 207t 42 144tTransportation Resources Intra-County for Physically Handicapped and Senior Citizens(TRIPS) Pomona NY DR 21 207t 28 207tGreen Bay Metro(GBM) Green Bay WI DR 21 207t 28 207tTarghee Regional Public Transit Authority(TRPTA) Idaho Falls ID DR 21 207t 24 225tCape Fear Public Transportation Authority(Wave) Wilmington NC DR 21 207t 24 225tSanta Clarita Transit(SCT) Santa Clarita CA DR 21 207t 23 238tRockford Mass Transit District(RMTD) Rockford IL DR 20 213t 39 152tKnoxville Area Transit(KAT) Knoxville TN DR 20 213t 35 172tButte County Association of Governments(BCAG) Chico CA DR 20 213t 28 207tThe Eastern Contra Costa Transit Authority(Tri Delta Transit) Antioch CA DR 20 213t 24 225tLivingston Essential Transportation Service(LETS) Howell MI DR 20 213t 24 225tSu Tran LLC dba: Sioux Area Metro(SAM) Sioux Falls SD DR 20 213t 23 238tSoutheastern Regional Transit Authority(SRTA) New Bedford MA DR 20 213t 22 248tOzaukee County Transit Services(OCTS) Port Washington WI DR 20 213t 22 248tCentral Arkansas Transit Authority(CATA) North Little Rock AR DR 20 213t 22 248tWaccamaw Regional Transportation Authority(The Coast RTA) Conway SC DR 20 213t 20 262tTompkins Consolidated Area Transit(TCAT) Ithaca NY DR 19 223t 26 217tBeaver County Transit Authority(BCTA) Rochester PA DR 19 223t 25 220tChattanooga Area Regional Transportation Authority(CARTA) Chattanooga TN DR 19 223t 25 220tTransit Authority of Omaha(MAT) Omaha NE DR 19 223t 24 225tGold Coast Transit(GCT) Oxnard CA DR 19 223t 24 225tTwin Cities Area Transportation Authority(TCATA) Benton Harbor MI DR 19 223t 22 248tCentral Midlands Regional Transit Authority(CMRTA) Columbia SC DR 19 223t 21 256tThe Gulf Coast Center(Connect Transit) Texas City TX DR 18 230t 24 225tCharleston Area Regional Transportation Authority(CARTA) Charleston SC DR 18 230t 23 238tCity of Pocatello - Pocatello Regional Transit(PRT) Pocatello ID DR 18 230t 21 256tMetropolitan Transit Authority of Black Hawk County(MET Transit) Waterloo IA DR 18 230t 21 256tMerrimack Valley Regional Transit Authority(MVRTA) Haverhill MA DR 18 230t 20 262tDutchess County Division of Mass Transportation(Loop Bus) Poughkeepsie NY DR 18 230t 20 262tTown of Cary(CTRAN) Cary NC DR 18 230t 18 271tBerkshire Regional Transit Authority(BRTA) Pittsfield MA DR 17 237t 37 159tCambria County Transit Authority(CamTran) Johnstown PA DR 17 237t 28 207tGreater Bridgeport Transit Authority(GBT) Bridgeport CT DR 17 237t 25 220tAbilene Transit Management, Inc(CityLink) Abilene TX DR 17 237t 25 220tChampaign-Urbana Mass Transit District(C-U MTD) Urbana IL DR 17 237t 24 225t
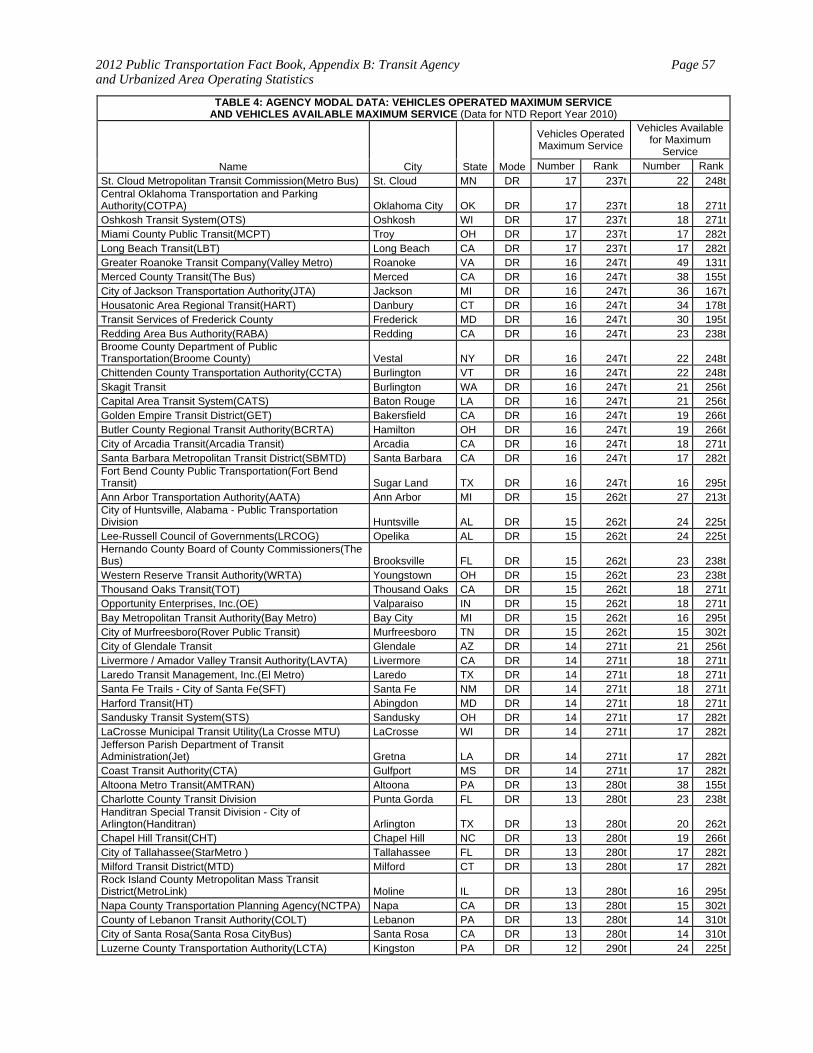
2012 Public Transportation Fact Book, Appendix B: Transit Agency and Urbanized Area Operating Statistics
Page 57
TABLE 4: AGENCY MODAL DATA: VEHICLES OPERATED MAXIMUM SERVICE AND VEHICLES AVAILABLE MAXIMUM SERVICE (Data for NTD Report Year 2010)
Name City State Mode
Vehicles Operated Maximum Service
Vehicles Available for Maximum
Service Number Rank Number Rank
St. Cloud Metropolitan Transit Commission(Metro Bus) St. Cloud MN DR 17 237t 22 248tCentral Oklahoma Transportation and Parking Authority(COTPA) Oklahoma City OK DR 17 237t 18 271tOshkosh Transit System(OTS) Oshkosh WI DR 17 237t 18 271tMiami County Public Transit(MCPT) Troy OH DR 17 237t 17 282tLong Beach Transit(LBT) Long Beach CA DR 17 237t 17 282tGreater Roanoke Transit Company(Valley Metro) Roanoke VA DR 16 247t 49 131tMerced County Transit(The Bus) Merced CA DR 16 247t 38 155tCity of Jackson Transportation Authority(JTA) Jackson MI DR 16 247t 36 167tHousatonic Area Regional Transit(HART) Danbury CT DR 16 247t 34 178tTransit Services of Frederick County Frederick MD DR 16 247t 30 195tRedding Area Bus Authority(RABA) Redding CA DR 16 247t 23 238tBroome County Department of Public Transportation(Broome County) Vestal NY DR 16 247t 22 248tChittenden County Transportation Authority(CCTA) Burlington VT DR 16 247t 22 248tSkagit Transit Burlington WA DR 16 247t 21 256tCapital Area Transit System(CATS) Baton Rouge LA DR 16 247t 21 256tGolden Empire Transit District(GET) Bakersfield CA DR 16 247t 19 266tButler County Regional Transit Authority(BCRTA) Hamilton OH DR 16 247t 19 266tCity of Arcadia Transit(Arcadia Transit) Arcadia CA DR 16 247t 18 271tSanta Barbara Metropolitan Transit District(SBMTD) Santa Barbara CA DR 16 247t 17 282tFort Bend County Public Transportation(Fort Bend Transit) Sugar Land TX DR 16 247t 16 295tAnn Arbor Transportation Authority(AATA) Ann Arbor MI DR 15 262t 27 213tCity of Huntsville, Alabama - Public Transportation Division Huntsville AL DR 15 262t 24 225tLee-Russell Council of Governments(LRCOG) Opelika AL DR 15 262t 24 225tHernando County Board of County Commissioners(The Bus) Brooksville FL DR 15 262t 23 238tWestern Reserve Transit Authority(WRTA) Youngstown OH DR 15 262t 23 238tThousand Oaks Transit(TOT) Thousand Oaks CA DR 15 262t 18 271tOpportunity Enterprises, Inc.(OE) Valparaiso IN DR 15 262t 18 271tBay Metropolitan Transit Authority(Bay Metro) Bay City MI DR 15 262t 16 295tCity of Murfreesboro(Rover Public Transit) Murfreesboro TN DR 15 262t 15 302tCity of Glendale Transit Glendale AZ DR 14 271t 21 256tLivermore / Amador Valley Transit Authority(LAVTA) Livermore CA DR 14 271t 18 271tLaredo Transit Management, Inc.(El Metro) Laredo TX DR 14 271t 18 271tSanta Fe Trails - City of Santa Fe(SFT) Santa Fe NM DR 14 271t 18 271tHarford Transit(HT) Abingdon MD DR 14 271t 18 271tSandusky Transit System(STS) Sandusky OH DR 14 271t 17 282tLaCrosse Municipal Transit Utility(La Crosse MTU) LaCrosse WI DR 14 271t 17 282tJefferson Parish Department of Transit Administration(Jet) Gretna LA DR 14 271t 17 282tCoast Transit Authority(CTA) Gulfport MS DR 14 271t 17 282tAltoona Metro Transit(AMTRAN) Altoona PA DR 13 280t 38 155tCharlotte County Transit Division Punta Gorda FL DR 13 280t 23 238tHanditran Special Transit Division - City of Arlington(Handitran) Arlington TX DR 13 280t 20 262tChapel Hill Transit(CHT) Chapel Hill NC DR 13 280t 19 266tCity of Tallahassee(StarMetro ) Tallahassee FL DR 13 280t 17 282tMilford Transit District(MTD) Milford CT DR 13 280t 17 282tRock Island County Metropolitan Mass Transit District(MetroLink) Moline IL DR 13 280t 16 295tNapa County Transportation Planning Agency(NCTPA) Napa CA DR 13 280t 15 302tCounty of Lebanon Transit Authority(COLT) Lebanon PA DR 13 280t 14 310tCity of Santa Rosa(Santa Rosa CityBus) Santa Rosa CA DR 13 280t 14 310tLuzerne County Transportation Authority(LCTA) Kingston PA DR 12 290t 24 225t
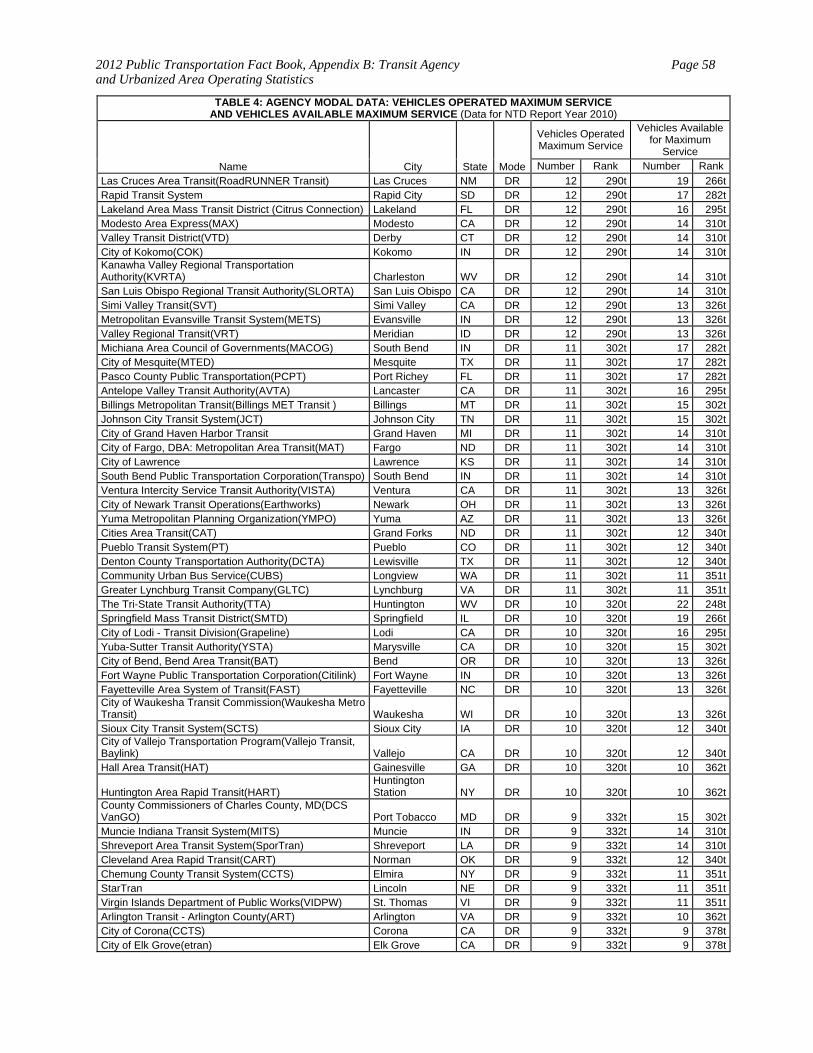
2012 Public Transportation Fact Book, Appendix B: Transit Agency and Urbanized Area Operating Statistics
Page 58
TABLE 4: AGENCY MODAL DATA: VEHICLES OPERATED MAXIMUM SERVICE AND VEHICLES AVAILABLE MAXIMUM SERVICE (Data for NTD Report Year 2010)
Name City State Mode
Vehicles Operated Maximum Service
Vehicles Available for Maximum
Service Number Rank Number Rank
Las Cruces Area Transit(RoadRUNNER Transit) Las Cruces NM DR 12 290t 19 266tRapid Transit System Rapid City SD DR 12 290t 17 282tLakeland Area Mass Transit District (Citrus Connection) Lakeland FL DR 12 290t 16 295tModesto Area Express(MAX) Modesto CA DR 12 290t 14 310tValley Transit District(VTD) Derby CT DR 12 290t 14 310tCity of Kokomo(COK) Kokomo IN DR 12 290t 14 310tKanawha Valley Regional Transportation Authority(KVRTA) Charleston WV DR 12 290t 14 310tSan Luis Obispo Regional Transit Authority(SLORTA) San Luis Obispo CA DR 12 290t 14 310tSimi Valley Transit(SVT) Simi Valley CA DR 12 290t 13 326tMetropolitan Evansville Transit System(METS) Evansville IN DR 12 290t 13 326tValley Regional Transit(VRT) Meridian ID DR 12 290t 13 326tMichiana Area Council of Governments(MACOG) South Bend IN DR 11 302t 17 282tCity of Mesquite(MTED) Mesquite TX DR 11 302t 17 282tPasco County Public Transportation(PCPT) Port Richey FL DR 11 302t 17 282tAntelope Valley Transit Authority(AVTA) Lancaster CA DR 11 302t 16 295tBillings Metropolitan Transit(Billings MET Transit ) Billings MT DR 11 302t 15 302tJohnson City Transit System(JCT) Johnson City TN DR 11 302t 15 302tCity of Grand Haven Harbor Transit Grand Haven MI DR 11 302t 14 310tCity of Fargo, DBA: Metropolitan Area Transit(MAT) Fargo ND DR 11 302t 14 310tCity of Lawrence Lawrence KS DR 11 302t 14 310tSouth Bend Public Transportation Corporation(Transpo) South Bend IN DR 11 302t 14 310tVentura Intercity Service Transit Authority(VISTA) Ventura CA DR 11 302t 13 326tCity of Newark Transit Operations(Earthworks) Newark OH DR 11 302t 13 326tYuma Metropolitan Planning Organization(YMPO) Yuma AZ DR 11 302t 13 326tCities Area Transit(CAT) Grand Forks ND DR 11 302t 12 340tPueblo Transit System(PT) Pueblo CO DR 11 302t 12 340tDenton County Transportation Authority(DCTA) Lewisville TX DR 11 302t 12 340tCommunity Urban Bus Service(CUBS) Longview WA DR 11 302t 11 351tGreater Lynchburg Transit Company(GLTC) Lynchburg VA DR 11 302t 11 351tThe Tri-State Transit Authority(TTA) Huntington WV DR 10 320t 22 248tSpringfield Mass Transit District(SMTD) Springfield IL DR 10 320t 19 266tCity of Lodi - Transit Division(Grapeline) Lodi CA DR 10 320t 16 295tYuba-Sutter Transit Authority(YSTA) Marysville CA DR 10 320t 15 302tCity of Bend, Bend Area Transit(BAT) Bend OR DR 10 320t 13 326tFort Wayne Public Transportation Corporation(Citilink) Fort Wayne IN DR 10 320t 13 326tFayetteville Area System of Transit(FAST) Fayetteville NC DR 10 320t 13 326tCity of Waukesha Transit Commission(Waukesha Metro Transit) Waukesha WI DR 10 320t 13 326tSioux City Transit System(SCTS) Sioux City IA DR 10 320t 12 340tCity of Vallejo Transportation Program(Vallejo Transit, Baylink) Vallejo CA DR 10 320t 12 340tHall Area Transit(HAT) Gainesville GA DR 10 320t 10 362t
Huntington Area Rapid Transit(HART) Huntington Station NY DR 10 320t 10 362t
County Commissioners of Charles County, MD(DCS VanGO) Port Tobacco MD DR 9 332t 15 302tMuncie Indiana Transit System(MITS) Muncie IN DR 9 332t 14 310tShreveport Area Transit System(SporTran) Shreveport LA DR 9 332t 14 310tCleveland Area Rapid Transit(CART) Norman OK DR 9 332t 12 340tChemung County Transit System(CCTS) Elmira NY DR 9 332t 11 351tStarTran Lincoln NE DR 9 332t 11 351tVirgin Islands Department of Public Works(VIDPW) St. Thomas VI DR 9 332t 11 351tArlington Transit - Arlington County(ART) Arlington VA DR 9 332t 10 362tCity of Corona(CCTS) Corona CA DR 9 332t 9 378tCity of Elk Grove(etran) Elk Grove CA DR 9 332t 9 378t
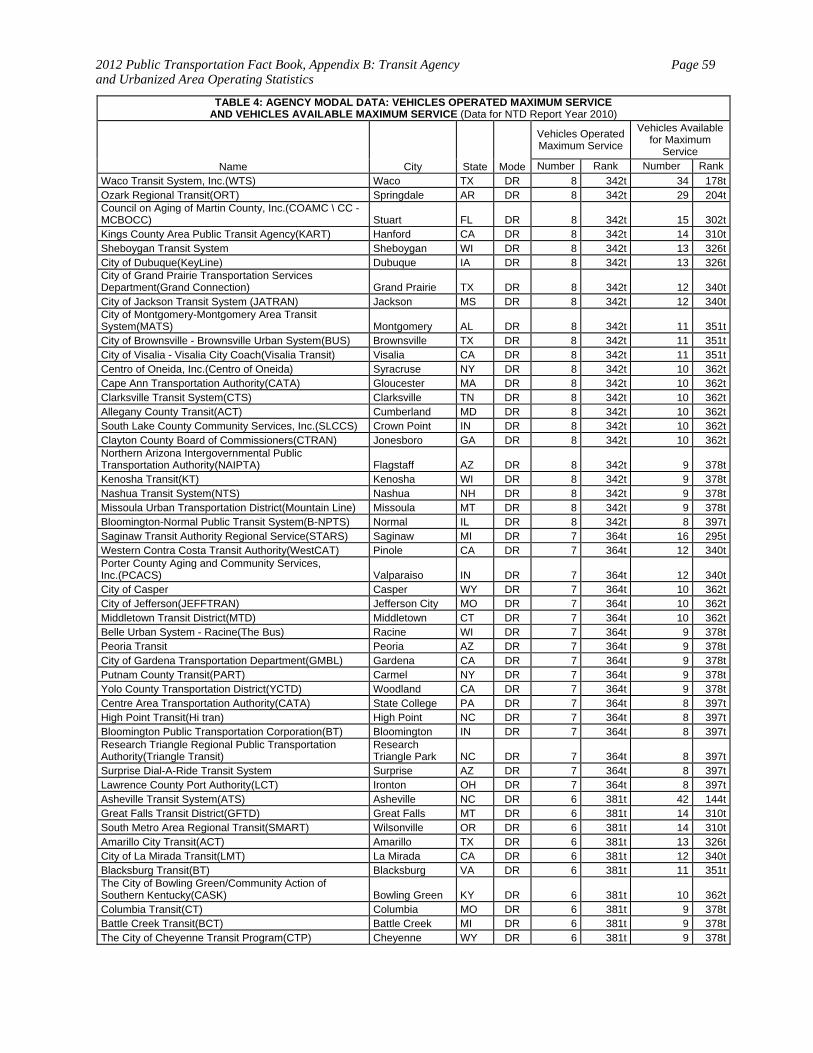
2012 Public Transportation Fact Book, Appendix B: Transit Agency and Urbanized Area Operating Statistics
Page 59
TABLE 4: AGENCY MODAL DATA: VEHICLES OPERATED MAXIMUM SERVICE AND VEHICLES AVAILABLE MAXIMUM SERVICE (Data for NTD Report Year 2010)
Name City State Mode
Vehicles Operated Maximum Service
Vehicles Available for Maximum
Service Number Rank Number Rank
Waco Transit System, Inc.(WTS) Waco TX DR 8 342t 34 178tOzark Regional Transit(ORT) Springdale AR DR 8 342t 29 204tCouncil on Aging of Martin County, Inc.(COAMC \ CC -MCBOCC) Stuart FL DR 8 342t 15 302tKings County Area Public Transit Agency(KART) Hanford CA DR 8 342t 14 310tSheboygan Transit System Sheboygan WI DR 8 342t 13 326tCity of Dubuque(KeyLine) Dubuque IA DR 8 342t 13 326tCity of Grand Prairie Transportation Services Department(Grand Connection) Grand Prairie TX DR 8 342t 12 340tCity of Jackson Transit System (JATRAN) Jackson MS DR 8 342t 12 340tCity of Montgomery-Montgomery Area Transit System(MATS) Montgomery AL DR 8 342t 11 351tCity of Brownsville - Brownsville Urban System(BUS) Brownsville TX DR 8 342t 11 351tCity of Visalia - Visalia City Coach(Visalia Transit) Visalia CA DR 8 342t 11 351tCentro of Oneida, Inc.(Centro of Oneida) Syracruse NY DR 8 342t 10 362tCape Ann Transportation Authority(CATA) Gloucester MA DR 8 342t 10 362tClarksville Transit System(CTS) Clarksville TN DR 8 342t 10 362tAllegany County Transit(ACT) Cumberland MD DR 8 342t 10 362tSouth Lake County Community Services, Inc.(SLCCS) Crown Point IN DR 8 342t 10 362tClayton County Board of Commissioners(CTRAN) Jonesboro GA DR 8 342t 10 362tNorthern Arizona Intergovernmental Public Transportation Authority(NAIPTA) Flagstaff AZ DR 8 342t 9 378tKenosha Transit(KT) Kenosha WI DR 8 342t 9 378tNashua Transit System(NTS) Nashua NH DR 8 342t 9 378tMissoula Urban Transportation District(Mountain Line) Missoula MT DR 8 342t 9 378tBloomington-Normal Public Transit System(B-NPTS) Normal IL DR 8 342t 8 397tSaginaw Transit Authority Regional Service(STARS) Saginaw MI DR 7 364t 16 295tWestern Contra Costa Transit Authority(WestCAT) Pinole CA DR 7 364t 12 340tPorter County Aging and Community Services, Inc.(PCACS) Valparaiso IN DR 7 364t 12 340tCity of Casper Casper WY DR 7 364t 10 362tCity of Jefferson(JEFFTRAN) Jefferson City MO DR 7 364t 10 362tMiddletown Transit District(MTD) Middletown CT DR 7 364t 10 362tBelle Urban System - Racine(The Bus) Racine WI DR 7 364t 9 378tPeoria Transit Peoria AZ DR 7 364t 9 378tCity of Gardena Transportation Department(GMBL) Gardena CA DR 7 364t 9 378tPutnam County Transit(PART) Carmel NY DR 7 364t 9 378tYolo County Transportation District(YCTD) Woodland CA DR 7 364t 9 378tCentre Area Transportation Authority(CATA) State College PA DR 7 364t 8 397tHigh Point Transit(Hi tran) High Point NC DR 7 364t 8 397tBloomington Public Transportation Corporation(BT) Bloomington IN DR 7 364t 8 397tResearch Triangle Regional Public Transportation Authority(Triangle Transit)
Research Triangle Park NC DR 7 364t 8 397t
Surprise Dial-A-Ride Transit System Surprise AZ DR 7 364t 8 397tLawrence County Port Authority(LCT) Ironton OH DR 7 364t 8 397tAsheville Transit System(ATS) Asheville NC DR 6 381t 42 144tGreat Falls Transit District(GFTD) Great Falls MT DR 6 381t 14 310tSouth Metro Area Regional Transit(SMART) Wilsonville OR DR 6 381t 14 310tAmarillo City Transit(ACT) Amarillo TX DR 6 381t 13 326tCity of La Mirada Transit(LMT) La Mirada CA DR 6 381t 12 340tBlacksburg Transit(BT) Blacksburg VA DR 6 381t 11 351tThe City of Bowling Green/Community Action of Southern Kentucky(CASK) Bowling Green KY DR 6 381t 10 362tColumbia Transit(CT) Columbia MO DR 6 381t 9 378tBattle Creek Transit(BCT) Battle Creek MI DR 6 381t 9 378tThe City of Cheyenne Transit Program(CTP) Cheyenne WY DR 6 381t 9 378t
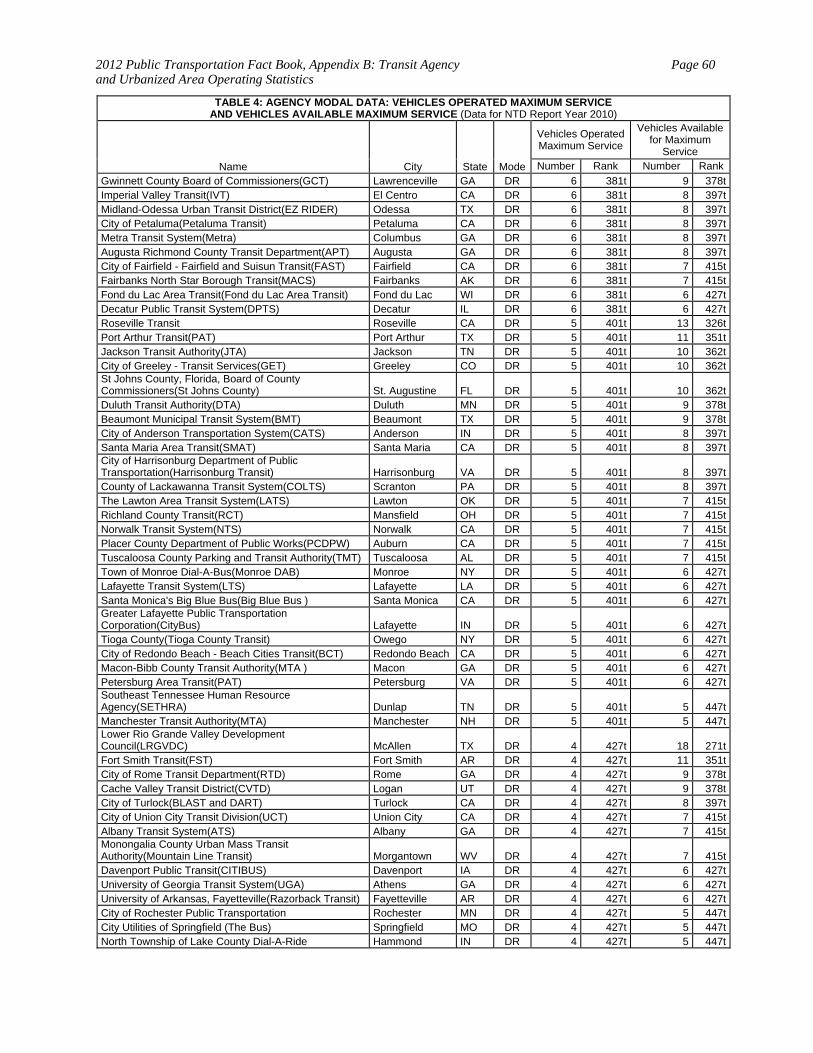
2012 Public Transportation Fact Book, Appendix B: Transit Agency and Urbanized Area Operating Statistics
Page 60
TABLE 4: AGENCY MODAL DATA: VEHICLES OPERATED MAXIMUM SERVICE AND VEHICLES AVAILABLE MAXIMUM SERVICE (Data for NTD Report Year 2010)
Name City State Mode
Vehicles Operated Maximum Service
Vehicles Available for Maximum
Service Number Rank Number Rank
Gwinnett County Board of Commissioners(GCT) Lawrenceville GA DR 6 381t 9 378tImperial Valley Transit(IVT) El Centro CA DR 6 381t 8 397tMidland-Odessa Urban Transit District(EZ RIDER) Odessa TX DR 6 381t 8 397tCity of Petaluma(Petaluma Transit) Petaluma CA DR 6 381t 8 397tMetra Transit System(Metra) Columbus GA DR 6 381t 8 397tAugusta Richmond County Transit Department(APT) Augusta GA DR 6 381t 8 397tCity of Fairfield - Fairfield and Suisun Transit(FAST) Fairfield CA DR 6 381t 7 415tFairbanks North Star Borough Transit(MACS) Fairbanks AK DR 6 381t 7 415tFond du Lac Area Transit(Fond du Lac Area Transit) Fond du Lac WI DR 6 381t 6 427tDecatur Public Transit System(DPTS) Decatur IL DR 6 381t 6 427tRoseville Transit Roseville CA DR 5 401t 13 326tPort Arthur Transit(PAT) Port Arthur TX DR 5 401t 11 351tJackson Transit Authority(JTA) Jackson TN DR 5 401t 10 362tCity of Greeley - Transit Services(GET) Greeley CO DR 5 401t 10 362tSt Johns County, Florida, Board of County Commissioners(St Johns County) St. Augustine FL DR 5 401t 10 362tDuluth Transit Authority(DTA) Duluth MN DR 5 401t 9 378tBeaumont Municipal Transit System(BMT) Beaumont TX DR 5 401t 9 378tCity of Anderson Transportation System(CATS) Anderson IN DR 5 401t 8 397tSanta Maria Area Transit(SMAT) Santa Maria CA DR 5 401t 8 397tCity of Harrisonburg Department of Public Transportation(Harrisonburg Transit) Harrisonburg VA DR 5 401t 8 397tCounty of Lackawanna Transit System(COLTS) Scranton PA DR 5 401t 8 397tThe Lawton Area Transit System(LATS) Lawton OK DR 5 401t 7 415tRichland County Transit(RCT) Mansfield OH DR 5 401t 7 415tNorwalk Transit System(NTS) Norwalk CA DR 5 401t 7 415tPlacer County Department of Public Works(PCDPW) Auburn CA DR 5 401t 7 415tTuscaloosa County Parking and Transit Authority(TMT) Tuscaloosa AL DR 5 401t 7 415tTown of Monroe Dial-A-Bus(Monroe DAB) Monroe NY DR 5 401t 6 427tLafayette Transit System(LTS) Lafayette LA DR 5 401t 6 427tSanta Monica's Big Blue Bus(Big Blue Bus ) Santa Monica CA DR 5 401t 6 427tGreater Lafayette Public Transportation Corporation(CityBus) Lafayette IN DR 5 401t 6 427tTioga County(Tioga County Transit) Owego NY DR 5 401t 6 427tCity of Redondo Beach - Beach Cities Transit(BCT) Redondo Beach CA DR 5 401t 6 427tMacon-Bibb County Transit Authority(MTA ) Macon GA DR 5 401t 6 427tPetersburg Area Transit(PAT) Petersburg VA DR 5 401t 6 427tSoutheast Tennessee Human Resource Agency(SETHRA) Dunlap TN DR 5 401t 5 447tManchester Transit Authority(MTA) Manchester NH DR 5 401t 5 447tLower Rio Grande Valley Development Council(LRGVDC) McAllen TX DR 4 427t 18 271tFort Smith Transit(FST) Fort Smith AR DR 4 427t 11 351tCity of Rome Transit Department(RTD) Rome GA DR 4 427t 9 378tCache Valley Transit District(CVTD) Logan UT DR 4 427t 9 378tCity of Turlock(BLAST and DART) Turlock CA DR 4 427t 8 397tCity of Union City Transit Division(UCT) Union City CA DR 4 427t 7 415tAlbany Transit System(ATS) Albany GA DR 4 427t 7 415tMonongalia County Urban Mass Transit Authority(Mountain Line Transit) Morgantown WV DR 4 427t 7 415tDavenport Public Transit(CITIBUS) Davenport IA DR 4 427t 6 427tUniversity of Georgia Transit System(UGA) Athens GA DR 4 427t 6 427tUniversity of Arkansas, Fayetteville(Razorback Transit) Fayetteville AR DR 4 427t 6 427tCity of Rochester Public Transportation Rochester MN DR 4 427t 5 447tCity Utilities of Springfield (The Bus) Springfield MO DR 4 427t 5 447tNorth Township of Lake County Dial-A-Ride Hammond IN DR 4 427t 5 447t
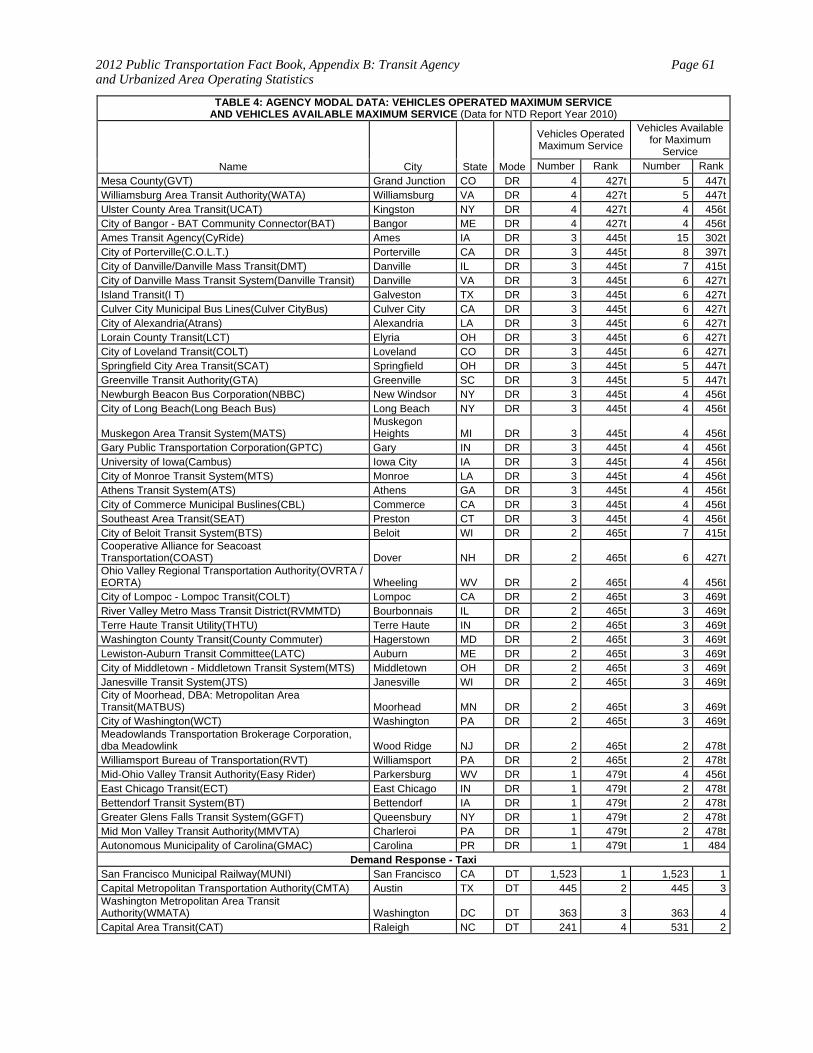
2012 Public Transportation Fact Book, Appendix B: Transit Agency and Urbanized Area Operating Statistics
Page 61
TABLE 4: AGENCY MODAL DATA: VEHICLES OPERATED MAXIMUM SERVICE AND VEHICLES AVAILABLE MAXIMUM SERVICE (Data for NTD Report Year 2010)
Name City State Mode
Vehicles Operated Maximum Service
Vehicles Available for Maximum
Service Number Rank Number Rank
Mesa County(GVT) Grand Junction CO DR 4 427t 5 447tWilliamsburg Area Transit Authority(WATA) Williamsburg VA DR 4 427t 5 447tUlster County Area Transit(UCAT) Kingston NY DR 4 427t 4 456tCity of Bangor - BAT Community Connector(BAT) Bangor ME DR 4 427t 4 456tAmes Transit Agency(CyRide) Ames IA DR 3 445t 15 302tCity of Porterville(C.O.L.T.) Porterville CA DR 3 445t 8 397tCity of Danville/Danville Mass Transit(DMT) Danville IL DR 3 445t 7 415tCity of Danville Mass Transit System(Danville Transit) Danville VA DR 3 445t 6 427tIsland Transit(I T) Galveston TX DR 3 445t 6 427tCulver City Municipal Bus Lines(Culver CityBus) Culver City CA DR 3 445t 6 427tCity of Alexandria(Atrans) Alexandria LA DR 3 445t 6 427tLorain County Transit(LCT) Elyria OH DR 3 445t 6 427tCity of Loveland Transit(COLT) Loveland CO DR 3 445t 6 427tSpringfield City Area Transit(SCAT) Springfield OH DR 3 445t 5 447tGreenville Transit Authority(GTA) Greenville SC DR 3 445t 5 447tNewburgh Beacon Bus Corporation(NBBC) New Windsor NY DR 3 445t 4 456tCity of Long Beach(Long Beach Bus) Long Beach NY DR 3 445t 4 456t
Muskegon Area Transit System(MATS) Muskegon Heights MI DR 3 445t 4 456t
Gary Public Transportation Corporation(GPTC) Gary IN DR 3 445t 4 456tUniversity of Iowa(Cambus) Iowa City IA DR 3 445t 4 456tCity of Monroe Transit System(MTS) Monroe LA DR 3 445t 4 456tAthens Transit System(ATS) Athens GA DR 3 445t 4 456tCity of Commerce Municipal Buslines(CBL) Commerce CA DR 3 445t 4 456tSoutheast Area Transit(SEAT) Preston CT DR 3 445t 4 456tCity of Beloit Transit System(BTS) Beloit WI DR 2 465t 7 415tCooperative Alliance for Seacoast Transportation(COAST) Dover NH DR 2 465t 6 427tOhio Valley Regional Transportation Authority(OVRTA / EORTA) Wheeling WV DR 2 465t 4 456tCity of Lompoc - Lompoc Transit(COLT) Lompoc CA DR 2 465t 3 469tRiver Valley Metro Mass Transit District(RVMMTD) Bourbonnais IL DR 2 465t 3 469tTerre Haute Transit Utility(THTU) Terre Haute IN DR 2 465t 3 469tWashington County Transit(County Commuter) Hagerstown MD DR 2 465t 3 469tLewiston-Auburn Transit Committee(LATC) Auburn ME DR 2 465t 3 469tCity of Middletown - Middletown Transit System(MTS) Middletown OH DR 2 465t 3 469tJanesville Transit System(JTS) Janesville WI DR 2 465t 3 469tCity of Moorhead, DBA: Metropolitan Area Transit(MATBUS) Moorhead MN DR 2 465t 3 469tCity of Washington(WCT) Washington PA DR 2 465t 3 469tMeadowlands Transportation Brokerage Corporation, dba Meadowlink Wood Ridge NJ DR 2 465t 2 478tWilliamsport Bureau of Transportation(RVT) Williamsport PA DR 2 465t 2 478tMid-Ohio Valley Transit Authority(Easy Rider) Parkersburg WV DR 1 479t 4 456tEast Chicago Transit(ECT) East Chicago IN DR 1 479t 2 478tBettendorf Transit System(BT) Bettendorf IA DR 1 479t 2 478tGreater Glens Falls Transit System(GGFT) Queensbury NY DR 1 479t 2 478tMid Mon Valley Transit Authority(MMVTA) Charleroi PA DR 1 479t 2 478tAutonomous Municipality of Carolina(GMAC) Carolina PR DR 1 479t 1 484
Demand Response - Taxi San Francisco Municipal Railway(MUNI) San Francisco CA DT 1,523 1 1,523 1Capital Metropolitan Transportation Authority(CMTA) Austin TX DT 445 2 445 3Washington Metropolitan Area Transit Authority(WMATA) Washington DC DT 363 3 363 4Capital Area Transit(CAT) Raleigh NC DT 241 4 531 2
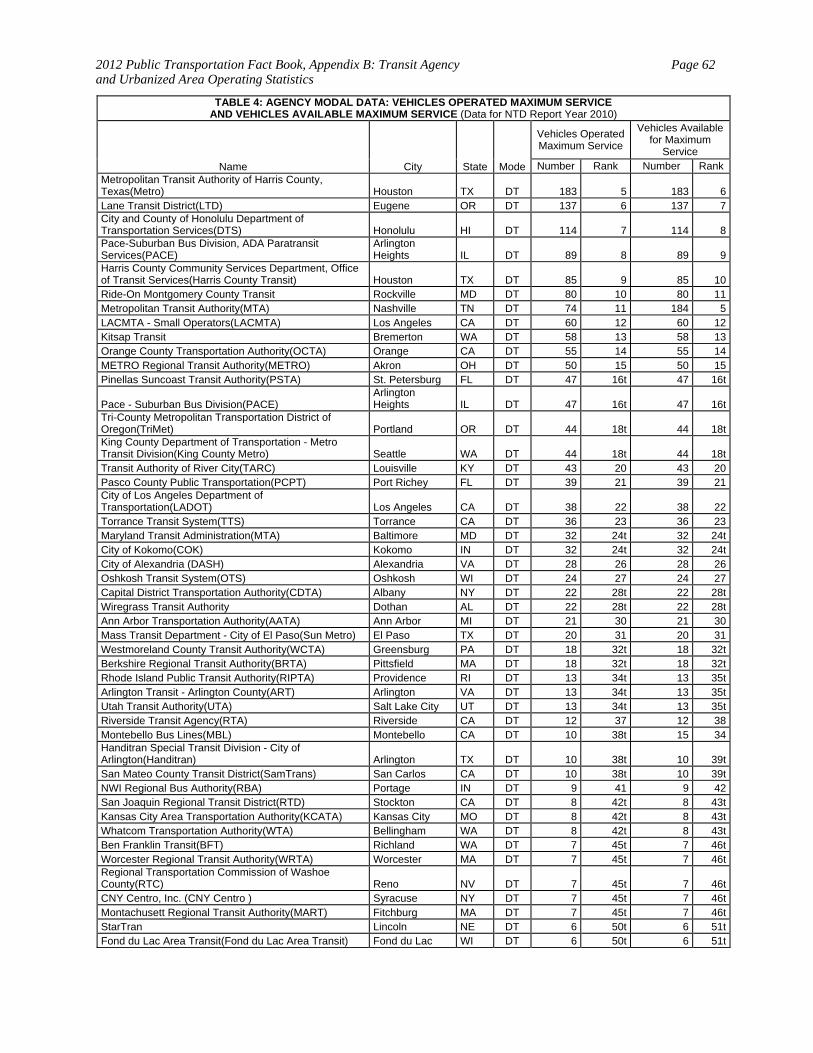
2012 Public Transportation Fact Book, Appendix B: Transit Agency and Urbanized Area Operating Statistics
Page 62
TABLE 4: AGENCY MODAL DATA: VEHICLES OPERATED MAXIMUM SERVICE AND VEHICLES AVAILABLE MAXIMUM SERVICE (Data for NTD Report Year 2010)
Name City State Mode
Vehicles Operated Maximum Service
Vehicles Available for Maximum
Service Number Rank Number Rank
Metropolitan Transit Authority of Harris County, Texas(Metro) Houston TX DT 183 5 183 6Lane Transit District(LTD) Eugene OR DT 137 6 137 7City and County of Honolulu Department of Transportation Services(DTS) Honolulu HI DT 114 7 114 8Pace-Suburban Bus Division, ADA Paratransit Services(PACE)
Arlington Heights IL DT 89 8 89 9
Harris County Community Services Department, Office of Transit Services(Harris County Transit) Houston TX DT 85 9 85 10Ride-On Montgomery County Transit Rockville MD DT 80 10 80 11Metropolitan Transit Authority(MTA) Nashville TN DT 74 11 184 5LACMTA - Small Operators(LACMTA) Los Angeles CA DT 60 12 60 12Kitsap Transit Bremerton WA DT 58 13 58 13Orange County Transportation Authority(OCTA) Orange CA DT 55 14 55 14METRO Regional Transit Authority(METRO) Akron OH DT 50 15 50 15Pinellas Suncoast Transit Authority(PSTA) St. Petersburg FL DT 47 16t 47 16t
Pace - Suburban Bus Division(PACE) Arlington Heights IL DT 47 16t 47 16t
Tri-County Metropolitan Transportation District of Oregon(TriMet) Portland OR DT 44 18t 44 18tKing County Department of Transportation - Metro Transit Division(King County Metro) Seattle WA DT 44 18t 44 18tTransit Authority of River City(TARC) Louisville KY DT 43 20 43 20Pasco County Public Transportation(PCPT) Port Richey FL DT 39 21 39 21City of Los Angeles Department of Transportation(LADOT) Los Angeles CA DT 38 22 38 22Torrance Transit System(TTS) Torrance CA DT 36 23 36 23Maryland Transit Administration(MTA) Baltimore MD DT 32 24t 32 24tCity of Kokomo(COK) Kokomo IN DT 32 24t 32 24tCity of Alexandria (DASH) Alexandria VA DT 28 26 28 26Oshkosh Transit System(OTS) Oshkosh WI DT 24 27 24 27Capital District Transportation Authority(CDTA) Albany NY DT 22 28t 22 28tWiregrass Transit Authority Dothan AL DT 22 28t 22 28tAnn Arbor Transportation Authority(AATA) Ann Arbor MI DT 21 30 21 30Mass Transit Department - City of El Paso(Sun Metro) El Paso TX DT 20 31 20 31Westmoreland County Transit Authority(WCTA) Greensburg PA DT 18 32t 18 32tBerkshire Regional Transit Authority(BRTA) Pittsfield MA DT 18 32t 18 32tRhode Island Public Transit Authority(RIPTA) Providence RI DT 13 34t 13 35tArlington Transit - Arlington County(ART) Arlington VA DT 13 34t 13 35tUtah Transit Authority(UTA) Salt Lake City UT DT 13 34t 13 35tRiverside Transit Agency(RTA) Riverside CA DT 12 37 12 38Montebello Bus Lines(MBL) Montebello CA DT 10 38t 15 34Handitran Special Transit Division - City of Arlington(Handitran) Arlington TX DT 10 38t 10 39tSan Mateo County Transit District(SamTrans) San Carlos CA DT 10 38t 10 39tNWI Regional Bus Authority(RBA) Portage IN DT 9 41 9 42San Joaquin Regional Transit District(RTD) Stockton CA DT 8 42t 8 43tKansas City Area Transportation Authority(KCATA) Kansas City MO DT 8 42t 8 43tWhatcom Transportation Authority(WTA) Bellingham WA DT 8 42t 8 43tBen Franklin Transit(BFT) Richland WA DT 7 45t 7 46tWorcester Regional Transit Authority(WRTA) Worcester MA DT 7 45t 7 46tRegional Transportation Commission of Washoe County(RTC) Reno NV DT 7 45t 7 46tCNY Centro, Inc. (CNY Centro ) Syracuse NY DT 7 45t 7 46tMontachusett Regional Transit Authority(MART) Fitchburg MA DT 7 45t 7 46tStarTran Lincoln NE DT 6 50t 6 51tFond du Lac Area Transit(Fond du Lac Area Transit) Fond du Lac WI DT 6 50t 6 51t
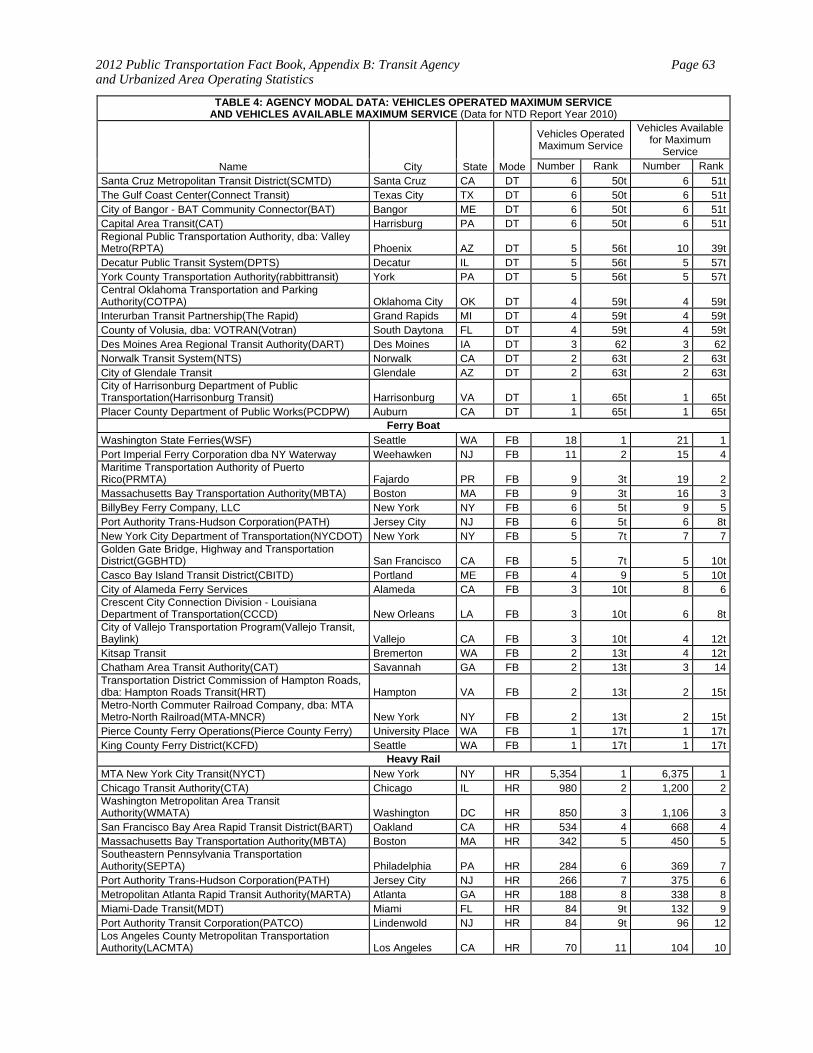
2012 Public Transportation Fact Book, Appendix B: Transit Agency and Urbanized Area Operating Statistics
Page 63
TABLE 4: AGENCY MODAL DATA: VEHICLES OPERATED MAXIMUM SERVICE AND VEHICLES AVAILABLE MAXIMUM SERVICE (Data for NTD Report Year 2010)
Name City State Mode
Vehicles Operated Maximum Service
Vehicles Available for Maximum
Service Number Rank Number Rank
Santa Cruz Metropolitan Transit District(SCMTD) Santa Cruz CA DT 6 50t 6 51tThe Gulf Coast Center(Connect Transit) Texas City TX DT 6 50t 6 51tCity of Bangor - BAT Community Connector(BAT) Bangor ME DT 6 50t 6 51tCapital Area Transit(CAT) Harrisburg PA DT 6 50t 6 51tRegional Public Transportation Authority, dba: Valley Metro(RPTA) Phoenix AZ DT 5 56t 10 39tDecatur Public Transit System(DPTS) Decatur IL DT 5 56t 5 57tYork County Transportation Authority(rabbittransit) York PA DT 5 56t 5 57tCentral Oklahoma Transportation and Parking Authority(COTPA) Oklahoma City OK DT 4 59t 4 59tInterurban Transit Partnership(The Rapid) Grand Rapids MI DT 4 59t 4 59tCounty of Volusia, dba: VOTRAN(Votran) South Daytona FL DT 4 59t 4 59tDes Moines Area Regional Transit Authority(DART) Des Moines IA DT 3 62 3 62Norwalk Transit System(NTS) Norwalk CA DT 2 63t 2 63tCity of Glendale Transit Glendale AZ DT 2 63t 2 63tCity of Harrisonburg Department of Public Transportation(Harrisonburg Transit) Harrisonburg VA DT 1 65t 1 65tPlacer County Department of Public Works(PCDPW) Auburn CA DT 1 65t 1 65t
Ferry Boat
Washington State Ferries(WSF) Seattle WA FB 18 1 21 1Port Imperial Ferry Corporation dba NY Waterway Weehawken NJ FB 11 2 15 4Maritime Transportation Authority of Puerto Rico(PRMTA) Fajardo PR FB 9 3t 19 2Massachusetts Bay Transportation Authority(MBTA) Boston MA FB 9 3t 16 3BillyBey Ferry Company, LLC New York NY FB 6 5t 9 5Port Authority Trans-Hudson Corporation(PATH) Jersey City NJ FB 6 5t 6 8tNew York City Department of Transportation(NYCDOT) New York NY FB 5 7t 7 7Golden Gate Bridge, Highway and Transportation District(GGBHTD) San Francisco CA FB 5 7t 5 10tCasco Bay Island Transit District(CBITD) Portland ME FB 4 9 5 10tCity of Alameda Ferry Services Alameda CA FB 3 10t 8 6Crescent City Connection Division - Louisiana Department of Transportation(CCCD) New Orleans LA FB 3 10t 6 8tCity of Vallejo Transportation Program(Vallejo Transit, Baylink) Vallejo CA FB 3 10t 4 12tKitsap Transit Bremerton WA FB 2 13t 4 12tChatham Area Transit Authority(CAT) Savannah GA FB 2 13t 3 14Transportation District Commission of Hampton Roads, dba: Hampton Roads Transit(HRT) Hampton VA FB 2 13t 2 15tMetro-North Commuter Railroad Company, dba: MTA Metro-North Railroad(MTA-MNCR) New York NY FB 2 13t 2 15tPierce County Ferry Operations(Pierce County Ferry) University Place WA FB 1 17t 1 17tKing County Ferry District(KCFD) Seattle WA FB 1 17t 1 17t
Heavy Rail
MTA New York City Transit(NYCT) New York NY HR 5,354 1 6,375 1Chicago Transit Authority(CTA) Chicago IL HR 980 2 1,200 2Washington Metropolitan Area Transit Authority(WMATA) Washington DC HR 850 3 1,106 3San Francisco Bay Area Rapid Transit District(BART) Oakland CA HR 534 4 668 4Massachusetts Bay Transportation Authority(MBTA) Boston MA HR 342 5 450 5Southeastern Pennsylvania Transportation Authority(SEPTA) Philadelphia PA HR 284 6 369 7Port Authority Trans-Hudson Corporation(PATH) Jersey City NJ HR 266 7 375 6Metropolitan Atlanta Rapid Transit Authority(MARTA) Atlanta GA HR 188 8 338 8Miami-Dade Transit(MDT) Miami FL HR 84 9t 132 9Port Authority Transit Corporation(PATCO) Lindenwold NJ HR 84 9t 96 12Los Angeles County Metropolitan Transportation Authority(LACMTA) Los Angeles CA HR 70 11 104 10

2012 Public Transportation Fact Book, Appendix B: Transit Agency and Urbanized Area Operating Statistics
Page 64
TABLE 4: AGENCY MODAL DATA: VEHICLES OPERATED MAXIMUM SERVICE AND VEHICLES AVAILABLE MAXIMUM SERVICE (Data for NTD Report Year 2010)
Name City State Mode
Vehicles Operated Maximum Service
Vehicles Available for Maximum
Service Number Rank Number Rank
Maryland Transit Administration(MTA) Baltimore MD HR 54 12 100 11Staten Island Rapid Transit Operating Authority, dba: MTA Staten Island Railway(SIRTOA) Staten Island NY HR 46 13 63 14Puerto Rico Highway and Transportation Authority(PRHTA) San Juan PR HR 40 14 74 13The Greater Cleveland Regional Transit Authority(GCRTA) Cleveland OH HR 22 15 60 15
Inclined Plane
Port Authority of Allegheny County(Port Authority) Pittsburgh PA IP 4 1 4 1Chattanooga Area Regional Transportation Authority(CARTA) Chattanooga TN IP 2 2t 2 2tCambria County Transit Authority(CamTran) Johnstown PA IP 2 2t 2 2t
Light Rail
Massachusetts Bay Transportation Authority(MBTA) Boston MA LR 156 1 195 1San Francisco Municipal Railway(MUNI) San Francisco CA LR 139 2 186 2Southeastern Pennsylvania Transportation Authority(SEPTA) Philadelphia PA LR 124 3 159 3Los Angeles County Metropolitan Transportation Authority(LACMTA) Los Angeles CA LR 118 4 150 4Tri-County Metropolitan Transportation District of Oregon(TriMet) Portland OR LR 110 5 141 5Denver Regional Transportation District(RTD) Denver CO LR 104 6 122 7tSan Diego Metropolitan Transit System(MTS) San Diego CA LR 93 7 134 6Dallas Area Rapid Transit(DART) Dallas TX LR 76 8 122 7tNew Jersey Transit Corporation(NJ TRANSIT) Newark NJ LR 73 9 93 10Sacramento Regional Transit District(Sacramento RT) Sacramento CA LR 56 10 76 13Port Authority of Allegheny County(Port Authority) Pittsburgh PA LR 51 11 80 12Bi-State Development Agency(METRO) St. Louis MO LR 50 12 87 11Santa Clara Valley Transportation Authority(VTA) San Jose CA LR 47 13 99 9Utah Transit Authority(UTA) Salt Lake City UT LR 43 14 55 15Maryland Transit Administration(MTA) Baltimore MD LR 38 15 53 16Valley Metro Rail, Inc.(VMR) Phoenix AZ LR 32 16 50 17Central Puget Sound Regional Transit Authority(ST) Seattle WA LR 28 17 38 19Metro Transit Minneapolis MN LR 27 18 27 20tNiagara Frontier Transportation Authority(NFT Metro) Buffalo NY LR 23 19 27 20tNew Orleans Regional Transit Authority(NORTA) New Orleans LA LR 21 20 66 14The Greater Cleveland Regional Transit Authority(GCRTA) Cleveland OH LR 17 21t 48 18Metropolitan Transit Authority of Harris County, Texas(Metro) Houston TX LR 17 21t 18 23Charlotte Area Transit System(CATS) Charlotte NC LR 16 23 19 22Memphis Area Transit Authority(MATA) Memphis TN LR 12 24 16 24North County Transit District(NCTD) Oceanside CA LR 6 25 12 25Hillsborough Area Regional Transit Authority(HART) Tampa FL LR 4 26 10 26Central Arkansas Transit Authority(CATA) North Little Rock AR LR 3 27t 5 27tKenosha Transit(KT) Kenosha WI LR 3 27t 5 27tKing County Department of Transportation - Metro Transit Division(King County Metro) Seattle WA LR 2 29 3 29
Bus
MTA New York City Transit(NYCT) New York NY MB 3,885 1 4,406 1Los Angeles County Metropolitan Transportation Authority(LACMTA) Los Angeles CA MB 2,234 2 2,609 2New Jersey Transit Corporation(NJ TRANSIT) Newark NJ MB 2,030 3 2,401 3Chicago Transit Authority(CTA) Chicago IL MB 1,707 4 2,053 4Washington Metropolitan Area Transit Authority(WMATA) Washington DC MB 1,280 5 1,495 5Southeastern Pennsylvania Transportation Authority(SEPTA) Philadelphia PA MB 1,222 6 1,460 6
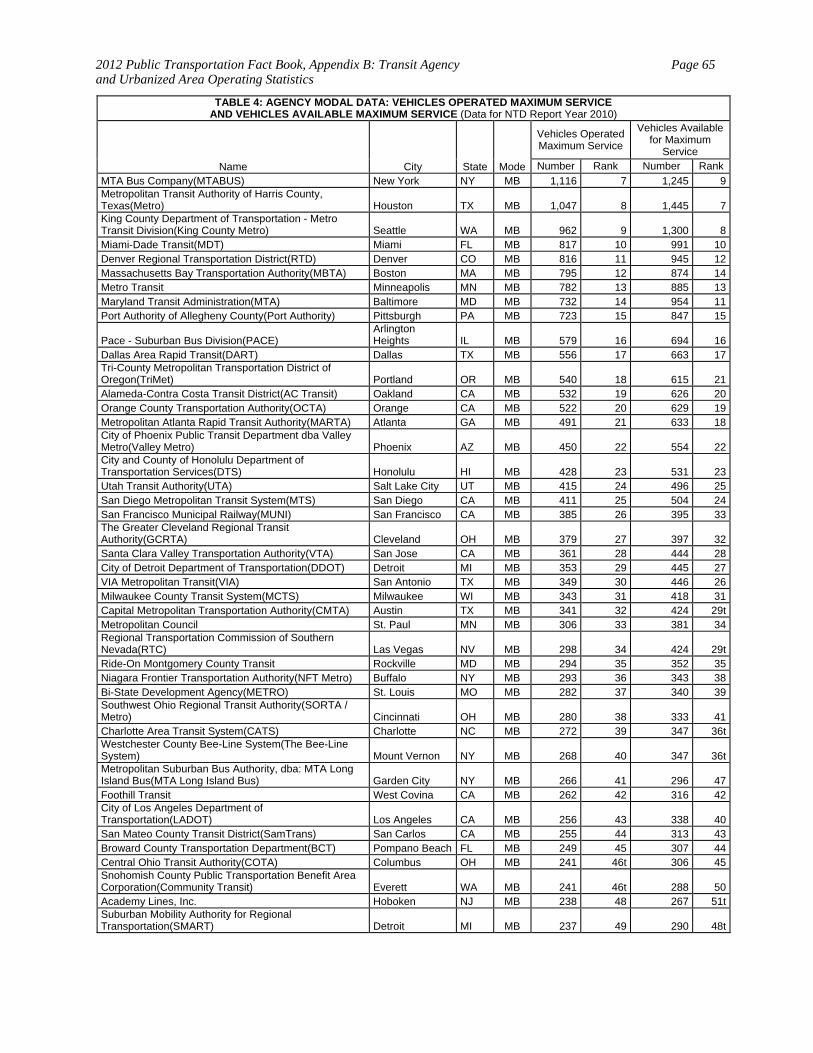
2012 Public Transportation Fact Book, Appendix B: Transit Agency and Urbanized Area Operating Statistics
Page 65
TABLE 4: AGENCY MODAL DATA: VEHICLES OPERATED MAXIMUM SERVICE AND VEHICLES AVAILABLE MAXIMUM SERVICE (Data for NTD Report Year 2010)
Name City State Mode
Vehicles Operated Maximum Service
Vehicles Available for Maximum
Service Number Rank Number Rank
MTA Bus Company(MTABUS) New York NY MB 1,116 7 1,245 9Metropolitan Transit Authority of Harris County, Texas(Metro) Houston TX MB 1,047 8 1,445 7King County Department of Transportation - Metro Transit Division(King County Metro) Seattle WA MB 962 9 1,300 8Miami-Dade Transit(MDT) Miami FL MB 817 10 991 10Denver Regional Transportation District(RTD) Denver CO MB 816 11 945 12Massachusetts Bay Transportation Authority(MBTA) Boston MA MB 795 12 874 14Metro Transit Minneapolis MN MB 782 13 885 13Maryland Transit Administration(MTA) Baltimore MD MB 732 14 954 11Port Authority of Allegheny County(Port Authority) Pittsburgh PA MB 723 15 847 15
Pace - Suburban Bus Division(PACE) Arlington Heights IL MB 579 16 694 16
Dallas Area Rapid Transit(DART) Dallas TX MB 556 17 663 17Tri-County Metropolitan Transportation District of Oregon(TriMet) Portland OR MB 540 18 615 21Alameda-Contra Costa Transit District(AC Transit) Oakland CA MB 532 19 626 20Orange County Transportation Authority(OCTA) Orange CA MB 522 20 629 19Metropolitan Atlanta Rapid Transit Authority(MARTA) Atlanta GA MB 491 21 633 18City of Phoenix Public Transit Department dba Valley Metro(Valley Metro) Phoenix AZ MB 450 22 554 22City and County of Honolulu Department of Transportation Services(DTS) Honolulu HI MB 428 23 531 23Utah Transit Authority(UTA) Salt Lake City UT MB 415 24 496 25San Diego Metropolitan Transit System(MTS) San Diego CA MB 411 25 504 24San Francisco Municipal Railway(MUNI) San Francisco CA MB 385 26 395 33The Greater Cleveland Regional Transit Authority(GCRTA) Cleveland OH MB 379 27 397 32Santa Clara Valley Transportation Authority(VTA) San Jose CA MB 361 28 444 28City of Detroit Department of Transportation(DDOT) Detroit MI MB 353 29 445 27VIA Metropolitan Transit(VIA) San Antonio TX MB 349 30 446 26Milwaukee County Transit System(MCTS) Milwaukee WI MB 343 31 418 31Capital Metropolitan Transportation Authority(CMTA) Austin TX MB 341 32 424 29tMetropolitan Council St. Paul MN MB 306 33 381 34Regional Transportation Commission of Southern Nevada(RTC) Las Vegas NV MB 298 34 424 29tRide-On Montgomery County Transit Rockville MD MB 294 35 352 35Niagara Frontier Transportation Authority(NFT Metro) Buffalo NY MB 293 36 343 38Bi-State Development Agency(METRO) St. Louis MO MB 282 37 340 39Southwest Ohio Regional Transit Authority(SORTA / Metro) Cincinnati OH MB 280 38 333 41Charlotte Area Transit System(CATS) Charlotte NC MB 272 39 347 36tWestchester County Bee-Line System(The Bee-Line System) Mount Vernon NY MB 268 40 347 36tMetropolitan Suburban Bus Authority, dba: MTA Long Island Bus(MTA Long Island Bus) Garden City NY MB 266 41 296 47Foothill Transit West Covina CA MB 262 42 316 42City of Los Angeles Department of Transportation(LADOT) Los Angeles CA MB 256 43 338 40San Mateo County Transit District(SamTrans) San Carlos CA MB 255 44 313 43Broward County Transportation Department(BCT) Pompano Beach FL MB 249 45 307 44Central Ohio Transit Authority(COTA) Columbus OH MB 241 46t 306 45Snohomish County Public Transportation Benefit Area Corporation(Community Transit) Everett WA MB 241 46t 288 50Academy Lines, Inc. Hoboken NJ MB 238 48 267 51tSuburban Mobility Authority for Regional Transportation(SMART) Detroit MI MB 237 49 290 48t
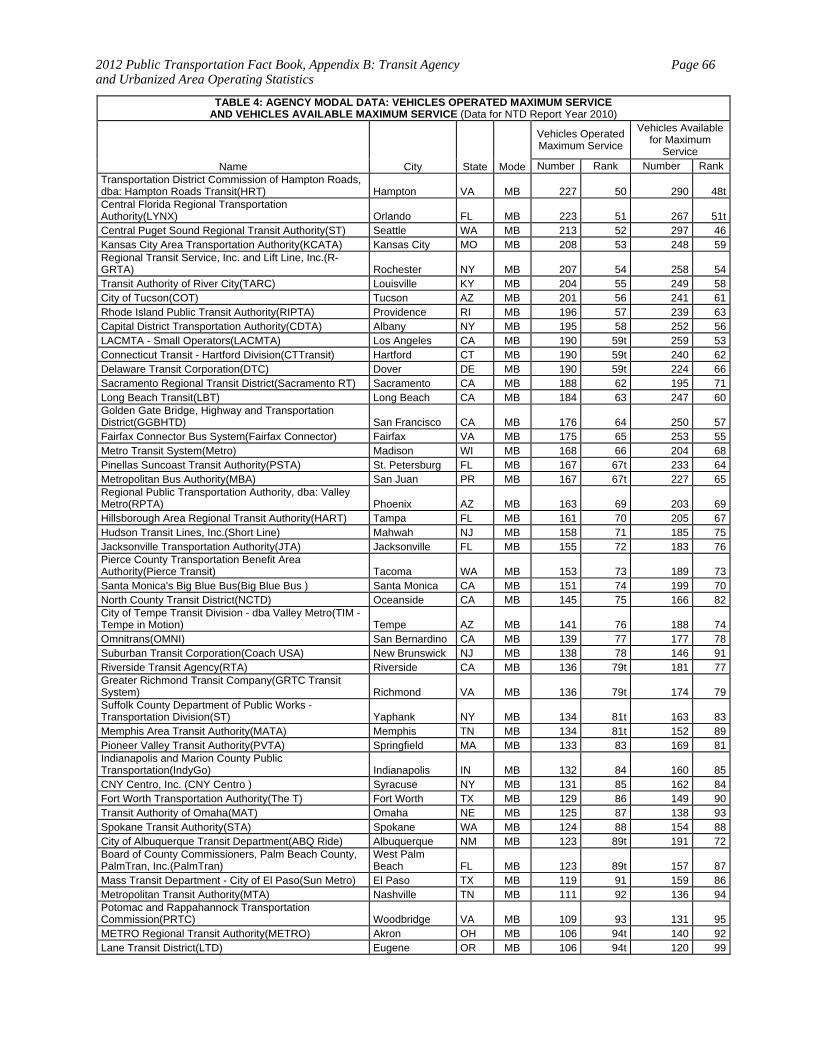
2012 Public Transportation Fact Book, Appendix B: Transit Agency and Urbanized Area Operating Statistics
Page 66
TABLE 4: AGENCY MODAL DATA: VEHICLES OPERATED MAXIMUM SERVICE AND VEHICLES AVAILABLE MAXIMUM SERVICE (Data for NTD Report Year 2010)
Name City State Mode
Vehicles Operated Maximum Service
Vehicles Available for Maximum
Service Number Rank Number Rank
Transportation District Commission of Hampton Roads, dba: Hampton Roads Transit(HRT) Hampton VA MB 227 50 290 48tCentral Florida Regional Transportation Authority(LYNX) Orlando FL MB 223 51 267 51tCentral Puget Sound Regional Transit Authority(ST) Seattle WA MB 213 52 297 46Kansas City Area Transportation Authority(KCATA) Kansas City MO MB 208 53 248 59Regional Transit Service, Inc. and Lift Line, Inc.(R-GRTA) Rochester NY MB 207 54 258 54Transit Authority of River City(TARC) Louisville KY MB 204 55 249 58City of Tucson(COT) Tucson AZ MB 201 56 241 61Rhode Island Public Transit Authority(RIPTA) Providence RI MB 196 57 239 63Capital District Transportation Authority(CDTA) Albany NY MB 195 58 252 56LACMTA - Small Operators(LACMTA) Los Angeles CA MB 190 59t 259 53Connecticut Transit - Hartford Division(CTTransit) Hartford CT MB 190 59t 240 62Delaware Transit Corporation(DTC) Dover DE MB 190 59t 224 66Sacramento Regional Transit District(Sacramento RT) Sacramento CA MB 188 62 195 71Long Beach Transit(LBT) Long Beach CA MB 184 63 247 60Golden Gate Bridge, Highway and Transportation District(GGBHTD) San Francisco CA MB 176 64 250 57Fairfax Connector Bus System(Fairfax Connector) Fairfax VA MB 175 65 253 55Metro Transit System(Metro) Madison WI MB 168 66 204 68Pinellas Suncoast Transit Authority(PSTA) St. Petersburg FL MB 167 67t 233 64Metropolitan Bus Authority(MBA) San Juan PR MB 167 67t 227 65Regional Public Transportation Authority, dba: Valley Metro(RPTA) Phoenix AZ MB 163 69 203 69Hillsborough Area Regional Transit Authority(HART) Tampa FL MB 161 70 205 67Hudson Transit Lines, Inc.(Short Line) Mahwah NJ MB 158 71 185 75Jacksonville Transportation Authority(JTA) Jacksonville FL MB 155 72 183 76Pierce County Transportation Benefit Area Authority(Pierce Transit) Tacoma WA MB 153 73 189 73Santa Monica's Big Blue Bus(Big Blue Bus ) Santa Monica CA MB 151 74 199 70North County Transit District(NCTD) Oceanside CA MB 145 75 166 82City of Tempe Transit Division - dba Valley Metro(TIM -Tempe in Motion) Tempe AZ MB 141 76 188 74Omnitrans(OMNI) San Bernardino CA MB 139 77 177 78Suburban Transit Corporation(Coach USA) New Brunswick NJ MB 138 78 146 91Riverside Transit Agency(RTA) Riverside CA MB 136 79t 181 77Greater Richmond Transit Company(GRTC Transit System) Richmond VA MB 136 79t 174 79Suffolk County Department of Public Works - Transportation Division(ST) Yaphank NY MB 134 81t 163 83Memphis Area Transit Authority(MATA) Memphis TN MB 134 81t 152 89Pioneer Valley Transit Authority(PVTA) Springfield MA MB 133 83 169 81Indianapolis and Marion County Public Transportation(IndyGo) Indianapolis IN MB 132 84 160 85CNY Centro, Inc. (CNY Centro ) Syracuse NY MB 131 85 162 84Fort Worth Transportation Authority(The T) Fort Worth TX MB 129 86 149 90Transit Authority of Omaha(MAT) Omaha NE MB 125 87 138 93Spokane Transit Authority(STA) Spokane WA MB 124 88 154 88City of Albuquerque Transit Department(ABQ Ride) Albuquerque NM MB 123 89t 191 72Board of County Commissioners, Palm Beach County, PalmTran, Inc.(PalmTran)
West Palm Beach FL MB 123 89t 157 87
Mass Transit Department - City of El Paso(Sun Metro) El Paso TX MB 119 91 159 86Metropolitan Transit Authority(MTA) Nashville TN MB 111 92 136 94Potomac and Rappahannock Transportation Commission(PRTC) Woodbridge VA MB 109 93 131 95METRO Regional Transit Authority(METRO) Akron OH MB 106 94t 140 92Lane Transit District(LTD) Eugene OR MB 106 94t 120 99

2012 Public Transportation Fact Book, Appendix B: Transit Agency and Urbanized Area Operating Statistics
Page 67
TABLE 4: AGENCY MODAL DATA: VEHICLES OPERATED MAXIMUM SERVICE AND VEHICLES AVAILABLE MAXIMUM SERVICE (Data for NTD Report Year 2010)
Name City State Mode
Vehicles Operated Maximum Service
Vehicles Available for Maximum
Service Number Rank Number Rank
Interurban Transit Partnership(The Rapid) Grand Rapids MI MB 105 96t 126 96Mass Transportation Authority(MTA) Flint MI MB 105 96t 119 100Toledo Area Regional Transit Authority(TARTA) Toledo OH MB 103 98 122 97tFresno Area Express(FAX) Fresno CA MB 95 99 122 97tSan Joaquin Regional Transit District(RTD) Stockton CA MB 94 100 109 105Des Moines Area Regional Transit Authority(DART) Des Moines IA MB 93 101 114 102Central Contra Costa Transit Authority(County Connection) Concord CA MB 92 102t 171 80Connecticut Transit - New Haven Division(CTTRANSIT) Hartford CT MB 92 102t 112 104Greater Dayton Regional Transit Authority(GDRTA) Dayton OH MB 88 104t 117 101Gainesville Regional Transit System(RTS) Gainesville FL MB 88 104t 105 108tClark County Public Transportation Benefit Area Authority(C-Tran) Vancouver WA MB 88 104t 105 108tSanta Barbara Metropolitan Transit District(SBMTD) Santa Barbara CA MB 87 107t 106 107Georgia Regional Transportation Authority(GRTA) Atlanta GA MB 87 107t 105 108tChampaign-Urbana Mass Transit District(C-U MTD) Urbana IL MB 86 109 93 117Transit Authority of Northern Kentucky(TANK) Fort Wright KY MB 84 110t 105 108tRockland Coaches, Inc. Westwood NJ MB 84 110t 103 112tCobb County Department of Transportation Authority(CCT) Marietta GA MB 84 110t 101 114Santa Cruz Metropolitan Transit District(SCMTD) Santa Cruz CA MB 82 113 85 125Kitsap Transit Bremerton WA MB 81 114t 113 103Charleston Area Regional Transportation Authority(CARTA) Charleston SC MB 81 114t 91 119Capital Area Transportation Authority(CATA) Lansing MI MB 79 116t 107 106Chapel Hill Transit(CHT) Chapel Hill NC MB 79 116t 99 116Monterey-Salinas Transit(MST) Monterey CA MB 78 118 83 126tKnoxville Area Transit(KAT) Knoxville TN MB 74 119 103 112tGolden Empire Transit District(GET) Bakersfield CA MB 70 120t 86 123tSanta Clarita Transit(SCT) Santa Clarita CA MB 70 120t 80 129tBirmingham-Jefferson County Transit Authority(MAX) Birmingham AL MB 68 122t 78 131tMadison County Transit District(MCT) Granite City IL MB 68 122t 77 134tPrince George's County Transit(TheBus) Largo MD MB 67 124t 92 118Lehigh and Northampton Transportation Authority(LANTA) Allentown PA MB 67 124t 83 126tCapital Area Transit(CAT) Harrisburg PA MB 67 124t 80 129tBen Franklin Transit(BFT) Richland WA MB 67 124t 75 136Ames Transit Agency(CyRide) Ames IA MB 64 128t 88 121City Transit Management Company, Inc.(Citibus) Lubbock TX MB 64 128t 68 147tCapital Area Transit(CAT) Raleigh NC MB 62 130t 100 115New Orleans Regional Transit Authority(NORTA) New Orleans LA MB 62 130t 86 123tAnn Arbor Transportation Authority(AATA) Ann Arbor MI MB 62 130t 78 131tErie Metropolitan Transit Authority(the e) Erie PA MB 62 130t 73 137tMontebello Bus Lines(MBL) Montebello CA MB 60 134 73 137tGwinnett County Board of Commissioners(GCT) Lawrenceville GA MB 59 135t 89 120Salem Area Mass Transit District(Cherriots) Salem OR MB 59 135t 65 157tCorpus Christi Regional Transportation Authority(The B) Corpus Christi TX MB 58 137t 77 134tBroward County Community Bus Service(BCT) Pompano Beach FL MB 58 137t 72 141tRegional Transportation Commission of Washoe County(RTC) Reno NV MB 58 137t 70 144tOrange-Newark-Elizabeth, Inc.(Coach USA) Elizabeth NJ MB 58 137t 67 154tLakeland Bus Lines, Inc. Dover NJ MB 58 137t 65 157tDeCamp Bus Lines Montclair NJ MB 56 142t 78 131tCity of Tallahassee(StarMetro ) Tallahassee FL MB 56 142t 73 137tIntercity Transit(I.T.) Olympia WA MB 56 142t 68 147t

2012 Public Transportation Fact Book, Appendix B: Transit Agency and Urbanized Area Operating Statistics
Page 68
TABLE 4: AGENCY MODAL DATA: VEHICLES OPERATED MAXIMUM SERVICE AND VEHICLES AVAILABLE MAXIMUM SERVICE (Data for NTD Report Year 2010)
Name City State Mode
Vehicles Operated Maximum Service
Vehicles Available for Maximum
Service Number Rank Number Rank
Research Triangle Regional Public Transportation Authority(Triangle Transit)
Research Triangle Park NC MB 56 142t 67 154t
Torrance Transit System(TTS) Torrance CA MB 56 142t 65 157tGreater Lafayette Public Transportation Corporation(CityBus) Lafayette IN MB 55 147 65 157tAntelope Valley Transit Authority(AVTA) Lancaster CA MB 54 148t 72 141tBrazos Transit District(The District) Bryan TX MB 54 148t 71 143Centre Area Transportation Authority(CATA) State College PA MB 54 148t 61 168tMetropolitan Tulsa Transit Authority(MTTA) Tulsa OK MB 53 151t 73 137tThe Eastern Contra Costa Transit Authority(Tri Delta Transit) Antioch CA MB 53 151t 68 147tCity of Alexandria (DASH) Alexandria VA MB 52 153t 68 147tTransport of Rockland(TOR) Pomona NY MB 52 153t 62 165tCentral Oklahoma Transportation and Parking Authority(COTPA) Oklahoma City OK MB 51 155 87 122Anaheim Transportation Network(ATN) Anaheim CA MB 50 156t 70 144tStarTran Lincoln NE MB 50 156t 60 172tLexington Transit Authority(LexTran) Lexington KY MB 50 156t 59 176tChatham Area Transit Authority(CAT) Savannah GA MB 50 156t 58 179tChattanooga Area Regional Transportation Authority(CARTA) Chattanooga TN MB 49 160t 68 147tSoutheastern Regional Transit Authority(SRTA) New Bedford MA MB 49 160t 61 168tWestmoreland County Transit Authority(WCTA) Greensburg PA MB 48 162t 69 146Johnson County Kansas, aka: Johnson County Transit(The JO) Olathe KS MB 48 162t 55 189tSpringfield Mass Transit District(SMTD) Springfield IL MB 48 162t 53 197tGreater Peoria Mass Transit District(CityLink) Peoria IL MB 47 165t 81 128Lee County Transit(LeeTran) Fort Myers FL MB 47 165t 61 168tCentral Arkansas Transit Authority(CATA) North Little Rock AR MB 47 165t 59 176tDuluth Transit Authority(DTA) Duluth MN MB 47 165t 58 179tKanawha Valley Regional Transportation Authority(KVRTA) Charleston WV MB 47 165t 57 183tKenosha Transit(KT) Kenosha WI MB 47 165t 56 187tMerrimack Valley Regional Transit Authority(MVRTA) Haverhill MA MB 47 165t 52 201tModesto Area Express(MAX) Modesto CA MB 46 172t 63 162tTrans-Bridge Lines, Inc. Bethlehem PA MB 46 172t 63 162tCounty of Volusia, dba: VOTRAN(Votran) South Daytona FL MB 46 172t 62 165tLivermore / Amador Valley Transit Authority(LAVTA) Livermore CA MB 46 172t 60 172tGreater Bridgeport Transit Authority(GBT) Bridgeport CT MB 46 172t 57 183tChittenden County Transportation Authority(CCTA) Burlington VT MB 46 172t 53 197tBay Metropolitan Transit Authority(Bay Metro) Bay City MI MB 46 172t 47 222tNorwalk Transit District Norwalk CT MB 45 179t 64 161Denton County Transportation Authority(DCTA) Lewisville TX MB 45 179t 57 183tBrockton Area Transit Authority(BAT) Brockton MA MB 45 179t 54 192tMunicipality of Anchorage - Public Transportation Department(People Mover) Anchorage AK MB 45 179t 52 201tLoudoun County Commuter Bus Service - Office of Transportation Services(LC Transit) Leesburg VA MB 45 179t 51 208Sarasota County Area Transit(SCAT) Sarasota FL MB 44 184t 58 179tSouth Bend Public Transportation Corporation(Transpo) South Bend IN MB 44 184t 56 187tGreensboro Transit Authority(GTA) Greensboro NC MB 44 184t 54 192tBerks Area Reading Transportation Authority(BARTA) Reading PA MB 44 184t 53 197t
SunLine Transit Agency(SunLine) Thousand Palms CA MB 43 188t 68 147t
Capital Area Transit System(CATS) Baton Rouge LA MB 43 188t 68 147tWhatcom Transportation Authority(WTA) Bellingham WA MB 43 188t 63 162tConnecticut Transit - Stamford Division(CTTransit) Hartford CT MB 43 188t 62 165t
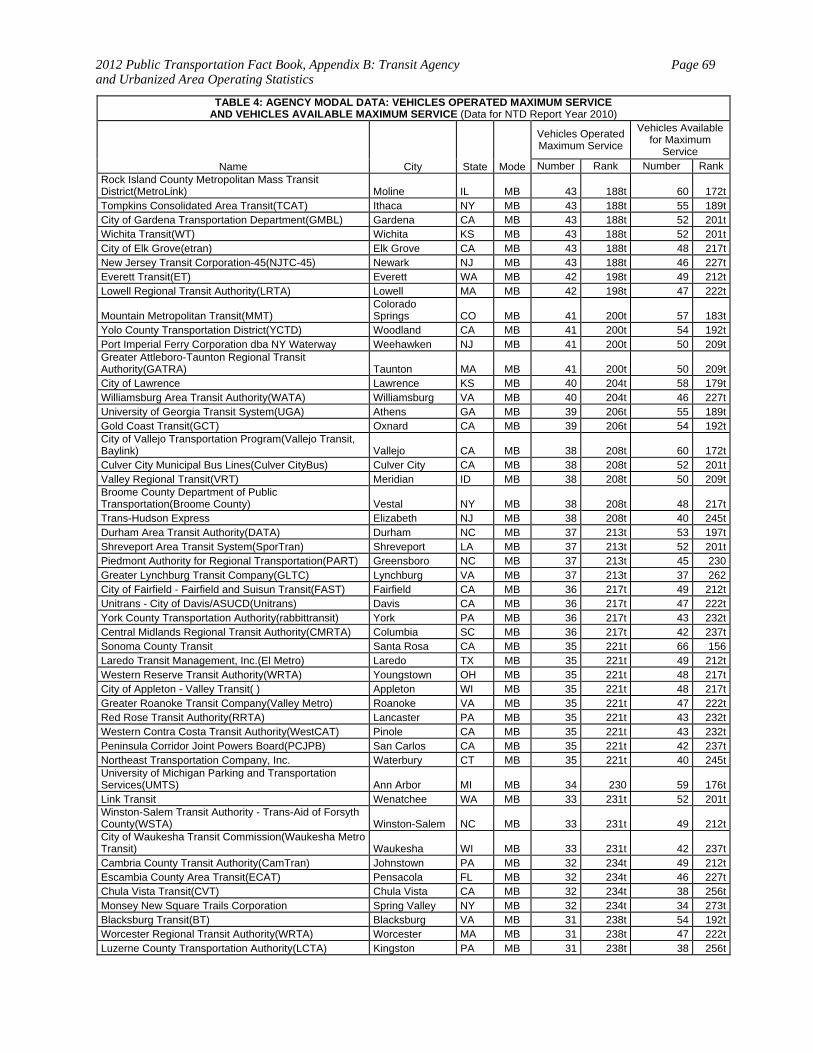
2012 Public Transportation Fact Book, Appendix B: Transit Agency and Urbanized Area Operating Statistics
Page 69
TABLE 4: AGENCY MODAL DATA: VEHICLES OPERATED MAXIMUM SERVICE AND VEHICLES AVAILABLE MAXIMUM SERVICE (Data for NTD Report Year 2010)
Name City State Mode
Vehicles Operated Maximum Service
Vehicles Available for Maximum
Service Number Rank Number Rank
Rock Island County Metropolitan Mass Transit District(MetroLink) Moline IL MB 43 188t 60 172tTompkins Consolidated Area Transit(TCAT) Ithaca NY MB 43 188t 55 189tCity of Gardena Transportation Department(GMBL) Gardena CA MB 43 188t 52 201tWichita Transit(WT) Wichita KS MB 43 188t 52 201tCity of Elk Grove(etran) Elk Grove CA MB 43 188t 48 217tNew Jersey Transit Corporation-45(NJTC-45) Newark NJ MB 43 188t 46 227tEverett Transit(ET) Everett WA MB 42 198t 49 212tLowell Regional Transit Authority(LRTA) Lowell MA MB 42 198t 47 222t
Mountain Metropolitan Transit(MMT) Colorado Springs CO MB 41 200t 57 183t
Yolo County Transportation District(YCTD) Woodland CA MB 41 200t 54 192tPort Imperial Ferry Corporation dba NY Waterway Weehawken NJ MB 41 200t 50 209tGreater Attleboro-Taunton Regional Transit Authority(GATRA) Taunton MA MB 41 200t 50 209tCity of Lawrence Lawrence KS MB 40 204t 58 179tWilliamsburg Area Transit Authority(WATA) Williamsburg VA MB 40 204t 46 227tUniversity of Georgia Transit System(UGA) Athens GA MB 39 206t 55 189tGold Coast Transit(GCT) Oxnard CA MB 39 206t 54 192tCity of Vallejo Transportation Program(Vallejo Transit, Baylink) Vallejo CA MB 38 208t 60 172tCulver City Municipal Bus Lines(Culver CityBus) Culver City CA MB 38 208t 52 201tValley Regional Transit(VRT) Meridian ID MB 38 208t 50 209tBroome County Department of Public Transportation(Broome County) Vestal NY MB 38 208t 48 217tTrans-Hudson Express Elizabeth NJ MB 38 208t 40 245tDurham Area Transit Authority(DATA) Durham NC MB 37 213t 53 197tShreveport Area Transit System(SporTran) Shreveport LA MB 37 213t 52 201tPiedmont Authority for Regional Transportation(PART) Greensboro NC MB 37 213t 45 230Greater Lynchburg Transit Company(GLTC) Lynchburg VA MB 37 213t 37 262City of Fairfield - Fairfield and Suisun Transit(FAST) Fairfield CA MB 36 217t 49 212tUnitrans - City of Davis/ASUCD(Unitrans) Davis CA MB 36 217t 47 222tYork County Transportation Authority(rabbittransit) York PA MB 36 217t 43 232tCentral Midlands Regional Transit Authority(CMRTA) Columbia SC MB 36 217t 42 237tSonoma County Transit Santa Rosa CA MB 35 221t 66 156Laredo Transit Management, Inc.(El Metro) Laredo TX MB 35 221t 49 212tWestern Reserve Transit Authority(WRTA) Youngstown OH MB 35 221t 48 217tCity of Appleton - Valley Transit( ) Appleton WI MB 35 221t 48 217tGreater Roanoke Transit Company(Valley Metro) Roanoke VA MB 35 221t 47 222tRed Rose Transit Authority(RRTA) Lancaster PA MB 35 221t 43 232tWestern Contra Costa Transit Authority(WestCAT) Pinole CA MB 35 221t 43 232tPeninsula Corridor Joint Powers Board(PCJPB) San Carlos CA MB 35 221t 42 237tNortheast Transportation Company, Inc. Waterbury CT MB 35 221t 40 245tUniversity of Michigan Parking and Transportation Services(UMTS) Ann Arbor MI MB 34 230 59 176tLink Transit Wenatchee WA MB 33 231t 52 201tWinston-Salem Transit Authority - Trans-Aid of Forsyth County(WSTA) Winston-Salem NC MB 33 231t 49 212tCity of Waukesha Transit Commission(Waukesha Metro Transit) Waukesha WI MB 33 231t 42 237tCambria County Transit Authority(CamTran) Johnstown PA MB 32 234t 49 212tEscambia County Area Transit(ECAT) Pensacola FL MB 32 234t 46 227tChula Vista Transit(CVT) Chula Vista CA MB 32 234t 38 256tMonsey New Square Trails Corporation Spring Valley NY MB 32 234t 34 273tBlacksburg Transit(BT) Blacksburg VA MB 31 238t 54 192tWorcester Regional Transit Authority(WRTA) Worcester MA MB 31 238t 47 222tLuzerne County Transportation Authority(LCTA) Kingston PA MB 31 238t 38 256t
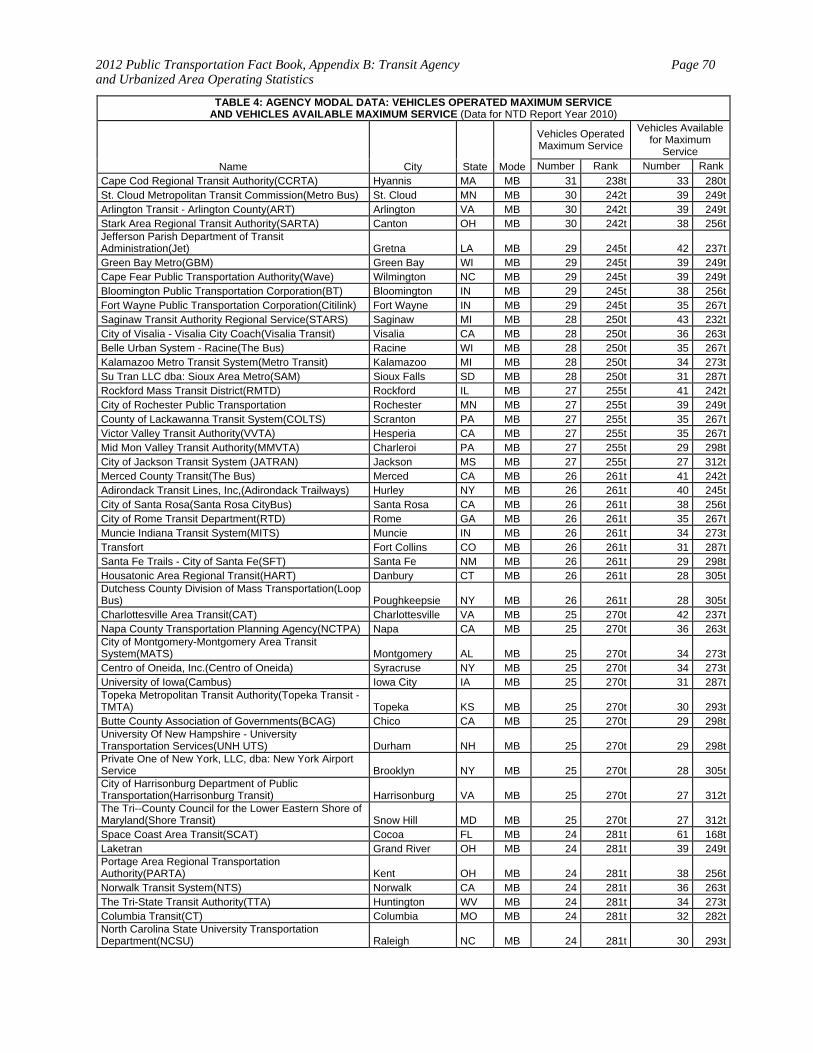
2012 Public Transportation Fact Book, Appendix B: Transit Agency and Urbanized Area Operating Statistics
Page 70
TABLE 4: AGENCY MODAL DATA: VEHICLES OPERATED MAXIMUM SERVICE AND VEHICLES AVAILABLE MAXIMUM SERVICE (Data for NTD Report Year 2010)
Name City State Mode
Vehicles Operated Maximum Service
Vehicles Available for Maximum
Service Number Rank Number Rank
Cape Cod Regional Transit Authority(CCRTA) Hyannis MA MB 31 238t 33 280tSt. Cloud Metropolitan Transit Commission(Metro Bus) St. Cloud MN MB 30 242t 39 249tArlington Transit - Arlington County(ART) Arlington VA MB 30 242t 39 249tStark Area Regional Transit Authority(SARTA) Canton OH MB 30 242t 38 256tJefferson Parish Department of Transit Administration(Jet) Gretna LA MB 29 245t 42 237tGreen Bay Metro(GBM) Green Bay WI MB 29 245t 39 249tCape Fear Public Transportation Authority(Wave) Wilmington NC MB 29 245t 39 249tBloomington Public Transportation Corporation(BT) Bloomington IN MB 29 245t 38 256tFort Wayne Public Transportation Corporation(Citilink) Fort Wayne IN MB 29 245t 35 267tSaginaw Transit Authority Regional Service(STARS) Saginaw MI MB 28 250t 43 232tCity of Visalia - Visalia City Coach(Visalia Transit) Visalia CA MB 28 250t 36 263tBelle Urban System - Racine(The Bus) Racine WI MB 28 250t 35 267tKalamazoo Metro Transit System(Metro Transit) Kalamazoo MI MB 28 250t 34 273tSu Tran LLC dba: Sioux Area Metro(SAM) Sioux Falls SD MB 28 250t 31 287tRockford Mass Transit District(RMTD) Rockford IL MB 27 255t 41 242tCity of Rochester Public Transportation Rochester MN MB 27 255t 39 249tCounty of Lackawanna Transit System(COLTS) Scranton PA MB 27 255t 35 267tVictor Valley Transit Authority(VVTA) Hesperia CA MB 27 255t 35 267tMid Mon Valley Transit Authority(MMVTA) Charleroi PA MB 27 255t 29 298tCity of Jackson Transit System (JATRAN) Jackson MS MB 27 255t 27 312tMerced County Transit(The Bus) Merced CA MB 26 261t 41 242tAdirondack Transit Lines, Inc,(Adirondack Trailways) Hurley NY MB 26 261t 40 245tCity of Santa Rosa(Santa Rosa CityBus) Santa Rosa CA MB 26 261t 38 256tCity of Rome Transit Department(RTD) Rome GA MB 26 261t 35 267tMuncie Indiana Transit System(MITS) Muncie IN MB 26 261t 34 273tTransfort Fort Collins CO MB 26 261t 31 287tSanta Fe Trails - City of Santa Fe(SFT) Santa Fe NM MB 26 261t 29 298tHousatonic Area Regional Transit(HART) Danbury CT MB 26 261t 28 305tDutchess County Division of Mass Transportation(Loop Bus) Poughkeepsie NY MB 26 261t 28 305tCharlottesville Area Transit(CAT) Charlottesville VA MB 25 270t 42 237tNapa County Transportation Planning Agency(NCTPA) Napa CA MB 25 270t 36 263tCity of Montgomery-Montgomery Area Transit System(MATS) Montgomery AL MB 25 270t 34 273tCentro of Oneida, Inc.(Centro of Oneida) Syracruse NY MB 25 270t 34 273tUniversity of Iowa(Cambus) Iowa City IA MB 25 270t 31 287tTopeka Metropolitan Transit Authority(Topeka Transit -TMTA) Topeka KS MB 25 270t 30 293tButte County Association of Governments(BCAG) Chico CA MB 25 270t 29 298tUniversity Of New Hampshire - University Transportation Services(UNH UTS) Durham NH MB 25 270t 29 298tPrivate One of New York, LLC, dba: New York Airport Service Brooklyn NY MB 25 270t 28 305tCity of Harrisonburg Department of Public Transportation(Harrisonburg Transit) Harrisonburg VA MB 25 270t 27 312tThe Tri--County Council for the Lower Eastern Shore of Maryland(Shore Transit) Snow Hill MD MB 25 270t 27 312tSpace Coast Area Transit(SCAT) Cocoa FL MB 24 281t 61 168tLaketran Grand River OH MB 24 281t 39 249tPortage Area Regional Transportation Authority(PARTA) Kent OH MB 24 281t 38 256tNorwalk Transit System(NTS) Norwalk CA MB 24 281t 36 263tThe Tri-State Transit Authority(TTA) Huntington WV MB 24 281t 34 273tColumbia Transit(CT) Columbia MO MB 24 281t 32 282tNorth Carolina State University Transportation Department(NCSU) Raleigh NC MB 24 281t 30 293t
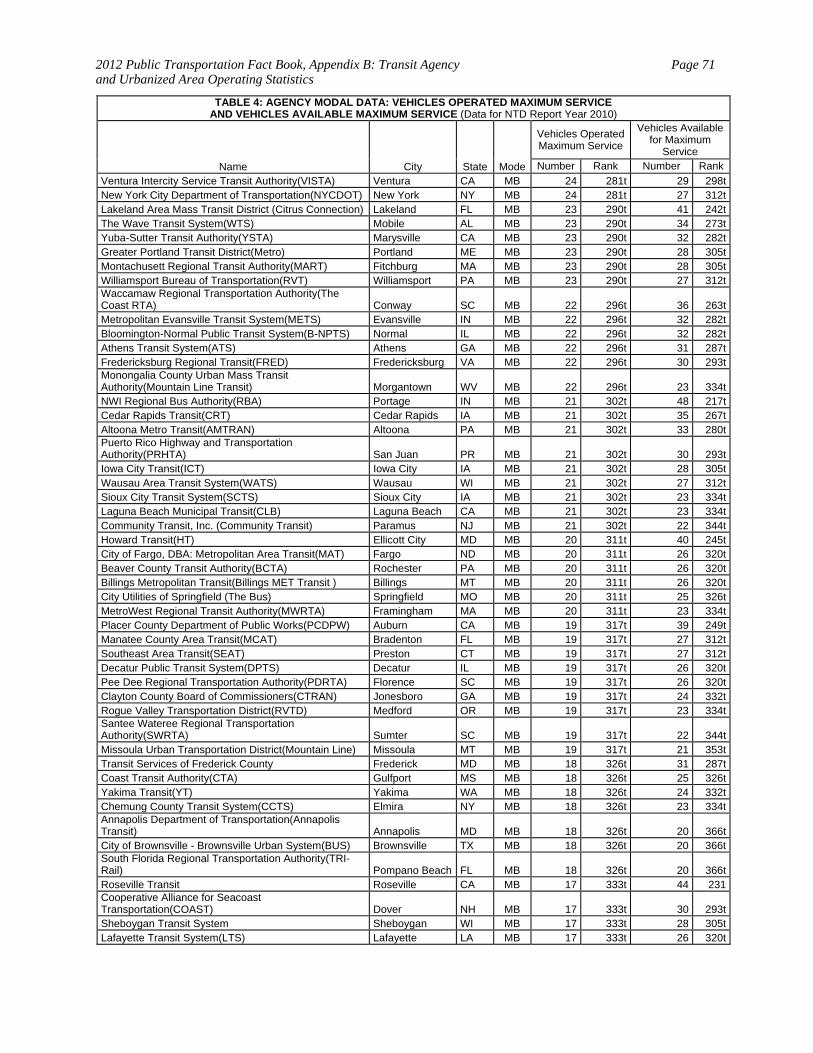
2012 Public Transportation Fact Book, Appendix B: Transit Agency and Urbanized Area Operating Statistics
Page 71
TABLE 4: AGENCY MODAL DATA: VEHICLES OPERATED MAXIMUM SERVICE AND VEHICLES AVAILABLE MAXIMUM SERVICE (Data for NTD Report Year 2010)
Name City State Mode
Vehicles Operated Maximum Service
Vehicles Available for Maximum
Service Number Rank Number Rank
Ventura Intercity Service Transit Authority(VISTA) Ventura CA MB 24 281t 29 298tNew York City Department of Transportation(NYCDOT) New York NY MB 24 281t 27 312tLakeland Area Mass Transit District (Citrus Connection) Lakeland FL MB 23 290t 41 242tThe Wave Transit System(WTS) Mobile AL MB 23 290t 34 273tYuba-Sutter Transit Authority(YSTA) Marysville CA MB 23 290t 32 282tGreater Portland Transit District(Metro) Portland ME MB 23 290t 28 305tMontachusett Regional Transit Authority(MART) Fitchburg MA MB 23 290t 28 305tWilliamsport Bureau of Transportation(RVT) Williamsport PA MB 23 290t 27 312tWaccamaw Regional Transportation Authority(The Coast RTA) Conway SC MB 22 296t 36 263tMetropolitan Evansville Transit System(METS) Evansville IN MB 22 296t 32 282tBloomington-Normal Public Transit System(B-NPTS) Normal IL MB 22 296t 32 282tAthens Transit System(ATS) Athens GA MB 22 296t 31 287tFredericksburg Regional Transit(FRED) Fredericksburg VA MB 22 296t 30 293tMonongalia County Urban Mass Transit Authority(Mountain Line Transit) Morgantown WV MB 22 296t 23 334tNWI Regional Bus Authority(RBA) Portage IN MB 21 302t 48 217tCedar Rapids Transit(CRT) Cedar Rapids IA MB 21 302t 35 267tAltoona Metro Transit(AMTRAN) Altoona PA MB 21 302t 33 280tPuerto Rico Highway and Transportation Authority(PRHTA) San Juan PR MB 21 302t 30 293tIowa City Transit(ICT) Iowa City IA MB 21 302t 28 305tWausau Area Transit System(WATS) Wausau WI MB 21 302t 27 312tSioux City Transit System(SCTS) Sioux City IA MB 21 302t 23 334tLaguna Beach Municipal Transit(CLB) Laguna Beach CA MB 21 302t 23 334tCommunity Transit, Inc. (Community Transit) Paramus NJ MB 21 302t 22 344tHoward Transit(HT) Ellicott City MD MB 20 311t 40 245tCity of Fargo, DBA: Metropolitan Area Transit(MAT) Fargo ND MB 20 311t 26 320tBeaver County Transit Authority(BCTA) Rochester PA MB 20 311t 26 320tBillings Metropolitan Transit(Billings MET Transit ) Billings MT MB 20 311t 26 320tCity Utilities of Springfield (The Bus) Springfield MO MB 20 311t 25 326tMetroWest Regional Transit Authority(MWRTA) Framingham MA MB 20 311t 23 334tPlacer County Department of Public Works(PCDPW) Auburn CA MB 19 317t 39 249tManatee County Area Transit(MCAT) Bradenton FL MB 19 317t 27 312tSoutheast Area Transit(SEAT) Preston CT MB 19 317t 27 312tDecatur Public Transit System(DPTS) Decatur IL MB 19 317t 26 320tPee Dee Regional Transportation Authority(PDRTA) Florence SC MB 19 317t 26 320tClayton County Board of Commissioners(CTRAN) Jonesboro GA MB 19 317t 24 332tRogue Valley Transportation District(RVTD) Medford OR MB 19 317t 23 334tSantee Wateree Regional Transportation Authority(SWRTA) Sumter SC MB 19 317t 22 344tMissoula Urban Transportation District(Mountain Line) Missoula MT MB 19 317t 21 353tTransit Services of Frederick County Frederick MD MB 18 326t 31 287tCoast Transit Authority(CTA) Gulfport MS MB 18 326t 25 326tYakima Transit(YT) Yakima WA MB 18 326t 24 332tChemung County Transit System(CCTS) Elmira NY MB 18 326t 23 334tAnnapolis Department of Transportation(Annapolis Transit) Annapolis MD MB 18 326t 20 366tCity of Brownsville - Brownsville Urban System(BUS) Brownsville TX MB 18 326t 20 366tSouth Florida Regional Transportation Authority(TRI-Rail) Pompano Beach FL MB 18 326t 20 366tRoseville Transit Roseville CA MB 17 333t 44 231Cooperative Alliance for Seacoast Transportation(COAST) Dover NH MB 17 333t 30 293tSheboygan Transit System Sheboygan WI MB 17 333t 28 305tLafayette Transit System(LTS) Lafayette LA MB 17 333t 26 320t
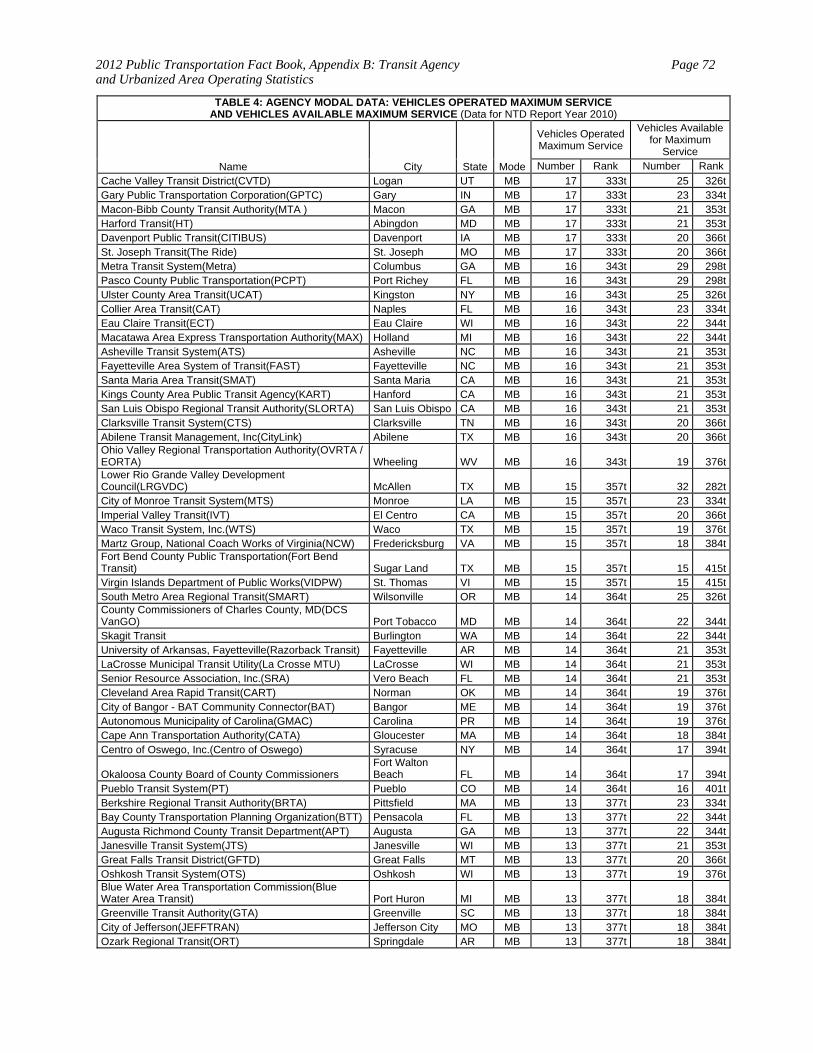
2012 Public Transportation Fact Book, Appendix B: Transit Agency and Urbanized Area Operating Statistics
Page 72
TABLE 4: AGENCY MODAL DATA: VEHICLES OPERATED MAXIMUM SERVICE AND VEHICLES AVAILABLE MAXIMUM SERVICE (Data for NTD Report Year 2010)
Name City State Mode
Vehicles Operated Maximum Service
Vehicles Available for Maximum
Service Number Rank Number Rank
Cache Valley Transit District(CVTD) Logan UT MB 17 333t 25 326tGary Public Transportation Corporation(GPTC) Gary IN MB 17 333t 23 334tMacon-Bibb County Transit Authority(MTA ) Macon GA MB 17 333t 21 353tHarford Transit(HT) Abingdon MD MB 17 333t 21 353tDavenport Public Transit(CITIBUS) Davenport IA MB 17 333t 20 366tSt. Joseph Transit(The Ride) St. Joseph MO MB 17 333t 20 366tMetra Transit System(Metra) Columbus GA MB 16 343t 29 298tPasco County Public Transportation(PCPT) Port Richey FL MB 16 343t 29 298tUlster County Area Transit(UCAT) Kingston NY MB 16 343t 25 326tCollier Area Transit(CAT) Naples FL MB 16 343t 23 334tEau Claire Transit(ECT) Eau Claire WI MB 16 343t 22 344tMacatawa Area Express Transportation Authority(MAX) Holland MI MB 16 343t 22 344tAsheville Transit System(ATS) Asheville NC MB 16 343t 21 353tFayetteville Area System of Transit(FAST) Fayetteville NC MB 16 343t 21 353tSanta Maria Area Transit(SMAT) Santa Maria CA MB 16 343t 21 353tKings County Area Public Transit Agency(KART) Hanford CA MB 16 343t 21 353tSan Luis Obispo Regional Transit Authority(SLORTA) San Luis Obispo CA MB 16 343t 21 353tClarksville Transit System(CTS) Clarksville TN MB 16 343t 20 366tAbilene Transit Management, Inc(CityLink) Abilene TX MB 16 343t 20 366tOhio Valley Regional Transportation Authority(OVRTA / EORTA) Wheeling WV MB 16 343t 19 376tLower Rio Grande Valley Development Council(LRGVDC) McAllen TX MB 15 357t 32 282tCity of Monroe Transit System(MTS) Monroe LA MB 15 357t 23 334tImperial Valley Transit(IVT) El Centro CA MB 15 357t 20 366tWaco Transit System, Inc.(WTS) Waco TX MB 15 357t 19 376tMartz Group, National Coach Works of Virginia(NCW) Fredericksburg VA MB 15 357t 18 384tFort Bend County Public Transportation(Fort Bend Transit) Sugar Land TX MB 15 357t 15 415tVirgin Islands Department of Public Works(VIDPW) St. Thomas VI MB 15 357t 15 415tSouth Metro Area Regional Transit(SMART) Wilsonville OR MB 14 364t 25 326tCounty Commissioners of Charles County, MD(DCS VanGO) Port Tobacco MD MB 14 364t 22 344tSkagit Transit Burlington WA MB 14 364t 22 344tUniversity of Arkansas, Fayetteville(Razorback Transit) Fayetteville AR MB 14 364t 21 353tLaCrosse Municipal Transit Utility(La Crosse MTU) LaCrosse WI MB 14 364t 21 353tSenior Resource Association, Inc.(SRA) Vero Beach FL MB 14 364t 21 353tCleveland Area Rapid Transit(CART) Norman OK MB 14 364t 19 376tCity of Bangor - BAT Community Connector(BAT) Bangor ME MB 14 364t 19 376tAutonomous Municipality of Carolina(GMAC) Carolina PR MB 14 364t 19 376tCape Ann Transportation Authority(CATA) Gloucester MA MB 14 364t 18 384tCentro of Oswego, Inc.(Centro of Oswego) Syracuse NY MB 14 364t 17 394t
Okaloosa County Board of County Commissioners Fort Walton Beach FL MB 14 364t 17 394t
Pueblo Transit System(PT) Pueblo CO MB 14 364t 16 401tBerkshire Regional Transit Authority(BRTA) Pittsfield MA MB 13 377t 23 334tBay County Transportation Planning Organization(BTT) Pensacola FL MB 13 377t 22 344tAugusta Richmond County Transit Department(APT) Augusta GA MB 13 377t 22 344tJanesville Transit System(JTS) Janesville WI MB 13 377t 21 353tGreat Falls Transit District(GFTD) Great Falls MT MB 13 377t 20 366tOshkosh Transit System(OTS) Oshkosh WI MB 13 377t 19 376tBlue Water Area Transportation Commission(Blue Water Area Transit) Port Huron MI MB 13 377t 18 384tGreenville Transit Authority(GTA) Greenville SC MB 13 377t 18 384tCity of Jefferson(JEFFTRAN) Jefferson City MO MB 13 377t 18 384tOzark Regional Transit(ORT) Springdale AR MB 13 377t 18 384t

2012 Public Transportation Fact Book, Appendix B: Transit Agency and Urbanized Area Operating Statistics
Page 73
TABLE 4: AGENCY MODAL DATA: VEHICLES OPERATED MAXIMUM SERVICE AND VEHICLES AVAILABLE MAXIMUM SERVICE (Data for NTD Report Year 2010)
Name City State Mode
Vehicles Operated Maximum Service
Vehicles Available for Maximum
Service Number Rank Number Rank
City of Huntsville, Alabama - Public Transportation Division Huntsville AL MB 13 377t 16 401tCounty of Lebanon Transit Authority(COLT) Lebanon PA MB 13 377t 15 415tCentro of Cayuga, Inc.(Centro of Cayuga) Syracuse NY MB 13 377t 14 424tWestern Maine Transportation Services, Inc.(WMTS) Auburn ME MB 13 377t 14 424tCity of Lompoc - Lompoc Transit(COLT) Lompoc CA MB 13 377t 13 436tJohnson City Transit System(JCT) Johnson City TN MB 12 392t 25 326tMesa County(GVT) Grand Junction CO MB 12 392t 21 353tMonroe Bus Corporation Brooklyn NY MB 12 392t 20 366tRedding Area Bus Authority(RABA) Redding CA MB 12 392t 19 376tMidland-Odessa Urban Transit District(EZ RIDER) Odessa TX MB 12 392t 19 376tBeaumont Municipal Transit System(BMT) Beaumont TX MB 12 392t 18 384tMetropolitan Transit Authority of Black Hawk County(MET Transit) Waterloo IA MB 12 392t 18 384tLas Cruces Area Transit(RoadRUNNER Transit) Las Cruces NM MB 12 392t 17 394tAmarillo City Transit(ACT) Amarillo TX MB 12 392t 17 394tCity of Union City Transit Division(UCT) Union City CA MB 12 392t 16 401tManchester Transit Authority(MTA) Manchester NH MB 12 392t 15 415tRiver Valley Metro Mass Transit District(RVMMTD) Bourbonnais IL MB 12 392t 14 424tCity of Dubuque(KeyLine) Dubuque IA MB 12 392t 12 443tHill Country Transit District(The Hop) San Saba TX MB 11 405t 31 287tNorthern Arizona Intergovernmental Public Transportation Authority(NAIPTA) Flagstaff AZ MB 11 405t 16 401tHigh Point Transit(Hi tran) High Point NC MB 11 405t 16 401tIsland Transit(I T) Galveston TX MB 11 405t 16 401tMid-Ohio Valley Transit Authority(Easy Rider) Parkersburg WV MB 11 405t 16 401tSpringfield City Area Transit(SCAT) Springfield OH MB 11 405t 16 401tCity of Scottsdale - Scottsdale Trolley(COS) Scottsdale AZ MB 11 405t 15 415t
Muskegon Area Transit System(MATS) Muskegon Heights MI MB 11 405t 15 415t
New Britain Transportation Company, Inc. Berlin CT MB 11 405t 15 415tCity of Greeley - Transit Services(GET) Greeley CO MB 11 405t 14 424tThe Gulf Coast Center(Connect Transit) Texas City TX MB 11 405t 14 424tCity of Pocatello - Pocatello Regional Transit(PRT) Pocatello ID MB 11 405t 13 436tConnecticut Department of Transportation(CDOT) Newington CT MB 11 405t 12 443tMeadowlands Transportation Brokerage Corporation, dba Meadowlink Wood Ridge NJ MB 11 405t 11 456tCity of Jackson Transportation Authority(JTA) Jackson MI MB 10 419t 17 394tCity of San Luis Obispo(SLO Transit) San Luis Obispo CA MB 10 419t 16 401tThe Lawton Area Transit System(LATS) Lawton OK MB 10 419t 16 401tThe City of Bowling Green/Community Action of Southern Kentucky(CASK) Bowling Green KY MB 10 419t 16 401tThe City of Cheyenne Transit Program(CTP) Cheyenne WY MB 10 419t 15 415tOlympia Trails Bus Company, Inc.(Coach USA) Elizabeth NJ MB 10 419t 14 424tCity of Danville/Danville Mass Transit(DMT) Danville IL MB 10 419t 14 424tPolk County Transit Services Division - Polk County Board of County Commissioners(PCTS) Bartow FL MB 10 419t 14 424tCity of Corvallis(CTS) Corvallis OR MB 10 419t 13 436tCity of Redondo Beach - Beach Cities Transit(BCT) Redondo Beach CA MB 10 419t 13 436tBettendorf Transit System(BT) Bettendorf IA MB 10 419t 12 443t
Huntington Area Rapid Transit(HART) Huntington Station NY MB 10 419t 11 456t
Terre Haute Transit Utility(THTU) Terre Haute IN MB 9 431t 22 344tJackson Transit Authority(JTA) Jackson TN MB 9 431t 16 401tMichiana Area Council of Governments(MACOG) South Bend IN MB 9 431t 16 401tCouncil on Aging of St. Lucie, Inc.(CT) Fort Pierce FL MB 9 431t 14 424tFayette Area Coordinated Transportation(FACT) Lemont Furnace PA MB 9 431t 13 436t
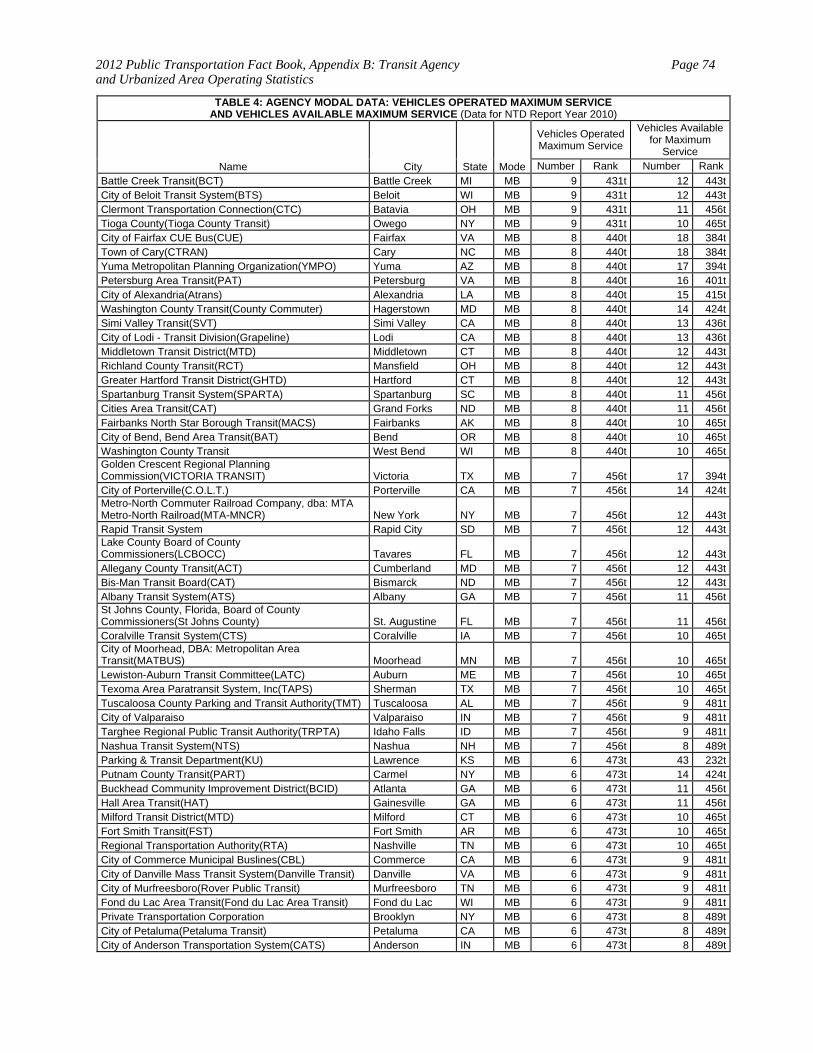
2012 Public Transportation Fact Book, Appendix B: Transit Agency and Urbanized Area Operating Statistics
Page 74
TABLE 4: AGENCY MODAL DATA: VEHICLES OPERATED MAXIMUM SERVICE AND VEHICLES AVAILABLE MAXIMUM SERVICE (Data for NTD Report Year 2010)
Name City State Mode
Vehicles Operated Maximum Service
Vehicles Available for Maximum
Service Number Rank Number Rank
Battle Creek Transit(BCT) Battle Creek MI MB 9 431t 12 443tCity of Beloit Transit System(BTS) Beloit WI MB 9 431t 12 443tClermont Transportation Connection(CTC) Batavia OH MB 9 431t 11 456tTioga County(Tioga County Transit) Owego NY MB 9 431t 10 465tCity of Fairfax CUE Bus(CUE) Fairfax VA MB 8 440t 18 384tTown of Cary(CTRAN) Cary NC MB 8 440t 18 384tYuma Metropolitan Planning Organization(YMPO) Yuma AZ MB 8 440t 17 394tPetersburg Area Transit(PAT) Petersburg VA MB 8 440t 16 401tCity of Alexandria(Atrans) Alexandria LA MB 8 440t 15 415tWashington County Transit(County Commuter) Hagerstown MD MB 8 440t 14 424tSimi Valley Transit(SVT) Simi Valley CA MB 8 440t 13 436tCity of Lodi - Transit Division(Grapeline) Lodi CA MB 8 440t 13 436tMiddletown Transit District(MTD) Middletown CT MB 8 440t 12 443tRichland County Transit(RCT) Mansfield OH MB 8 440t 12 443tGreater Hartford Transit District(GHTD) Hartford CT MB 8 440t 12 443tSpartanburg Transit System(SPARTA) Spartanburg SC MB 8 440t 11 456tCities Area Transit(CAT) Grand Forks ND MB 8 440t 11 456tFairbanks North Star Borough Transit(MACS) Fairbanks AK MB 8 440t 10 465tCity of Bend, Bend Area Transit(BAT) Bend OR MB 8 440t 10 465tWashington County Transit West Bend WI MB 8 440t 10 465tGolden Crescent Regional Planning Commission(VICTORIA TRANSIT) Victoria TX MB 7 456t 17 394tCity of Porterville(C.O.L.T.) Porterville CA MB 7 456t 14 424tMetro-North Commuter Railroad Company, dba: MTA Metro-North Railroad(MTA-MNCR) New York NY MB 7 456t 12 443tRapid Transit System Rapid City SD MB 7 456t 12 443tLake County Board of County Commissioners(LCBOCC) Tavares FL MB 7 456t 12 443tAllegany County Transit(ACT) Cumberland MD MB 7 456t 12 443tBis-Man Transit Board(CAT) Bismarck ND MB 7 456t 12 443tAlbany Transit System(ATS) Albany GA MB 7 456t 11 456tSt Johns County, Florida, Board of County Commissioners(St Johns County) St. Augustine FL MB 7 456t 11 456tCoralville Transit System(CTS) Coralville IA MB 7 456t 10 465tCity of Moorhead, DBA: Metropolitan Area Transit(MATBUS) Moorhead MN MB 7 456t 10 465tLewiston-Auburn Transit Committee(LATC) Auburn ME MB 7 456t 10 465tTexoma Area Paratransit System, Inc(TAPS) Sherman TX MB 7 456t 10 465tTuscaloosa County Parking and Transit Authority(TMT) Tuscaloosa AL MB 7 456t 9 481tCity of Valparaiso Valparaiso IN MB 7 456t 9 481tTarghee Regional Public Transit Authority(TRPTA) Idaho Falls ID MB 7 456t 9 481tNashua Transit System(NTS) Nashua NH MB 7 456t 8 489tParking & Transit Department(KU) Lawrence KS MB 6 473t 43 232tPutnam County Transit(PART) Carmel NY MB 6 473t 14 424tBuckhead Community Improvement District(BCID) Atlanta GA MB 6 473t 11 456tHall Area Transit(HAT) Gainesville GA MB 6 473t 11 456tMilford Transit District(MTD) Milford CT MB 6 473t 10 465tFort Smith Transit(FST) Fort Smith AR MB 6 473t 10 465tRegional Transportation Authority(RTA) Nashville TN MB 6 473t 10 465tCity of Commerce Municipal Buslines(CBL) Commerce CA MB 6 473t 9 481tCity of Danville Mass Transit System(Danville Transit) Danville VA MB 6 473t 9 481tCity of Murfreesboro(Rover Public Transit) Murfreesboro TN MB 6 473t 9 481tFond du Lac Area Transit(Fond du Lac Area Transit) Fond du Lac WI MB 6 473t 9 481tPrivate Transportation Corporation Brooklyn NY MB 6 473t 8 489tCity of Petaluma(Petaluma Transit) Petaluma CA MB 6 473t 8 489tCity of Anderson Transportation System(CATS) Anderson IN MB 6 473t 8 489t
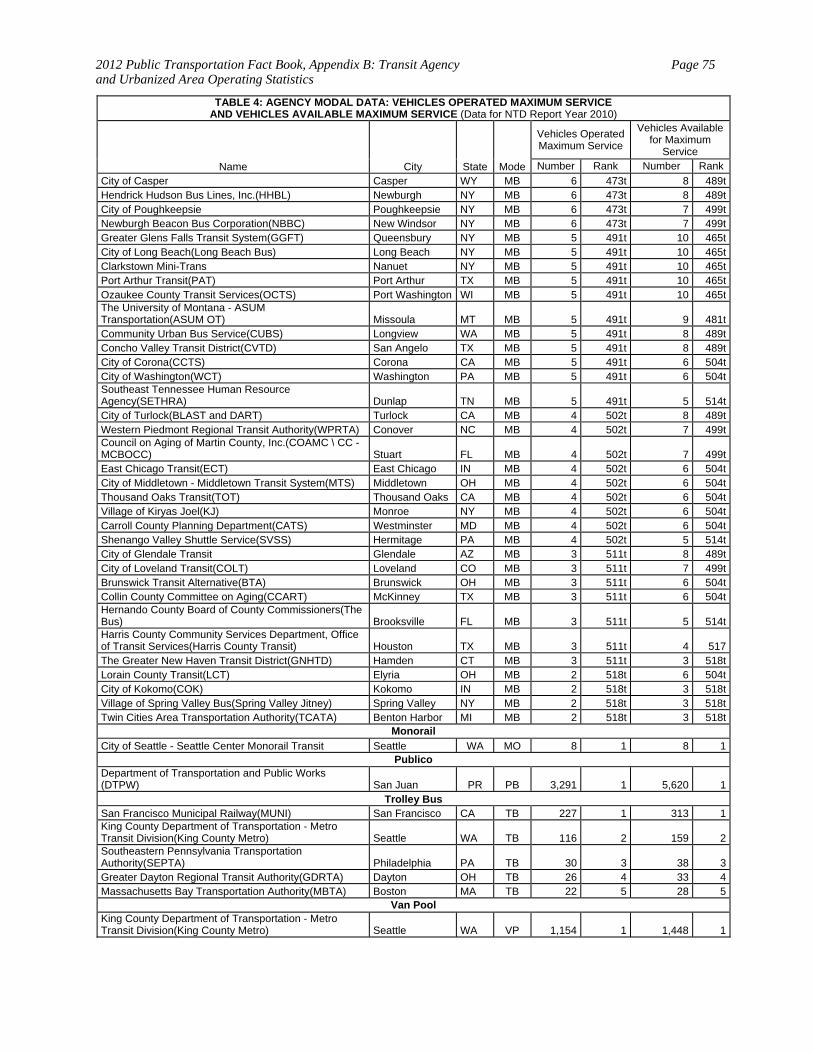
2012 Public Transportation Fact Book, Appendix B: Transit Agency and Urbanized Area Operating Statistics
Page 75
TABLE 4: AGENCY MODAL DATA: VEHICLES OPERATED MAXIMUM SERVICE AND VEHICLES AVAILABLE MAXIMUM SERVICE (Data for NTD Report Year 2010)
Name City State Mode
Vehicles Operated Maximum Service
Vehicles Available for Maximum
Service Number Rank Number Rank
City of Casper Casper WY MB 6 473t 8 489tHendrick Hudson Bus Lines, Inc.(HHBL) Newburgh NY MB 6 473t 8 489tCity of Poughkeepsie Poughkeepsie NY MB 6 473t 7 499tNewburgh Beacon Bus Corporation(NBBC) New Windsor NY MB 6 473t 7 499tGreater Glens Falls Transit System(GGFT) Queensbury NY MB 5 491t 10 465tCity of Long Beach(Long Beach Bus) Long Beach NY MB 5 491t 10 465tClarkstown Mini-Trans Nanuet NY MB 5 491t 10 465tPort Arthur Transit(PAT) Port Arthur TX MB 5 491t 10 465tOzaukee County Transit Services(OCTS) Port Washington WI MB 5 491t 10 465tThe University of Montana - ASUM Transportation(ASUM OT) Missoula MT MB 5 491t 9 481tCommunity Urban Bus Service(CUBS) Longview WA MB 5 491t 8 489tConcho Valley Transit District(CVTD) San Angelo TX MB 5 491t 8 489tCity of Corona(CCTS) Corona CA MB 5 491t 6 504tCity of Washington(WCT) Washington PA MB 5 491t 6 504tSoutheast Tennessee Human Resource Agency(SETHRA) Dunlap TN MB 5 491t 5 514tCity of Turlock(BLAST and DART) Turlock CA MB 4 502t 8 489tWestern Piedmont Regional Transit Authority(WPRTA) Conover NC MB 4 502t 7 499tCouncil on Aging of Martin County, Inc.(COAMC \ CC -MCBOCC) Stuart FL MB 4 502t 7 499tEast Chicago Transit(ECT) East Chicago IN MB 4 502t 6 504tCity of Middletown - Middletown Transit System(MTS) Middletown OH MB 4 502t 6 504tThousand Oaks Transit(TOT) Thousand Oaks CA MB 4 502t 6 504tVillage of Kiryas Joel(KJ) Monroe NY MB 4 502t 6 504tCarroll County Planning Department(CATS) Westminster MD MB 4 502t 6 504tShenango Valley Shuttle Service(SVSS) Hermitage PA MB 4 502t 5 514tCity of Glendale Transit Glendale AZ MB 3 511t 8 489tCity of Loveland Transit(COLT) Loveland CO MB 3 511t 7 499tBrunswick Transit Alternative(BTA) Brunswick OH MB 3 511t 6 504tCollin County Committee on Aging(CCART) McKinney TX MB 3 511t 6 504tHernando County Board of County Commissioners(The Bus) Brooksville FL MB 3 511t 5 514tHarris County Community Services Department, Office of Transit Services(Harris County Transit) Houston TX MB 3 511t 4 517The Greater New Haven Transit District(GNHTD) Hamden CT MB 3 511t 3 518tLorain County Transit(LCT) Elyria OH MB 2 518t 6 504tCity of Kokomo(COK) Kokomo IN MB 2 518t 3 518tVillage of Spring Valley Bus(Spring Valley Jitney) Spring Valley NY MB 2 518t 3 518tTwin Cities Area Transportation Authority(TCATA) Benton Harbor MI MB 2 518t 3 518t
Monorail
City of Seattle - Seattle Center Monorail Transit Seattle WA MO 8 1 8 1Publico
Department of Transportation and Public Works (DTPW) San Juan PR PB 3,291 1 5,620 1
Trolley Bus San Francisco Municipal Railway(MUNI) San Francisco CA TB 227 1 313 1King County Department of Transportation - Metro Transit Division(King County Metro) Seattle WA TB 116 2 159 2Southeastern Pennsylvania Transportation Authority(SEPTA) Philadelphia PA TB 30 3 38 3Greater Dayton Regional Transit Authority(GDRTA) Dayton OH TB 26 4 33 4Massachusetts Bay Transportation Authority(MBTA) Boston MA TB 22 5 28 5
Van Pool King County Department of Transportation - Metro Transit Division(King County Metro) Seattle WA VP 1,154 1 1,448 1
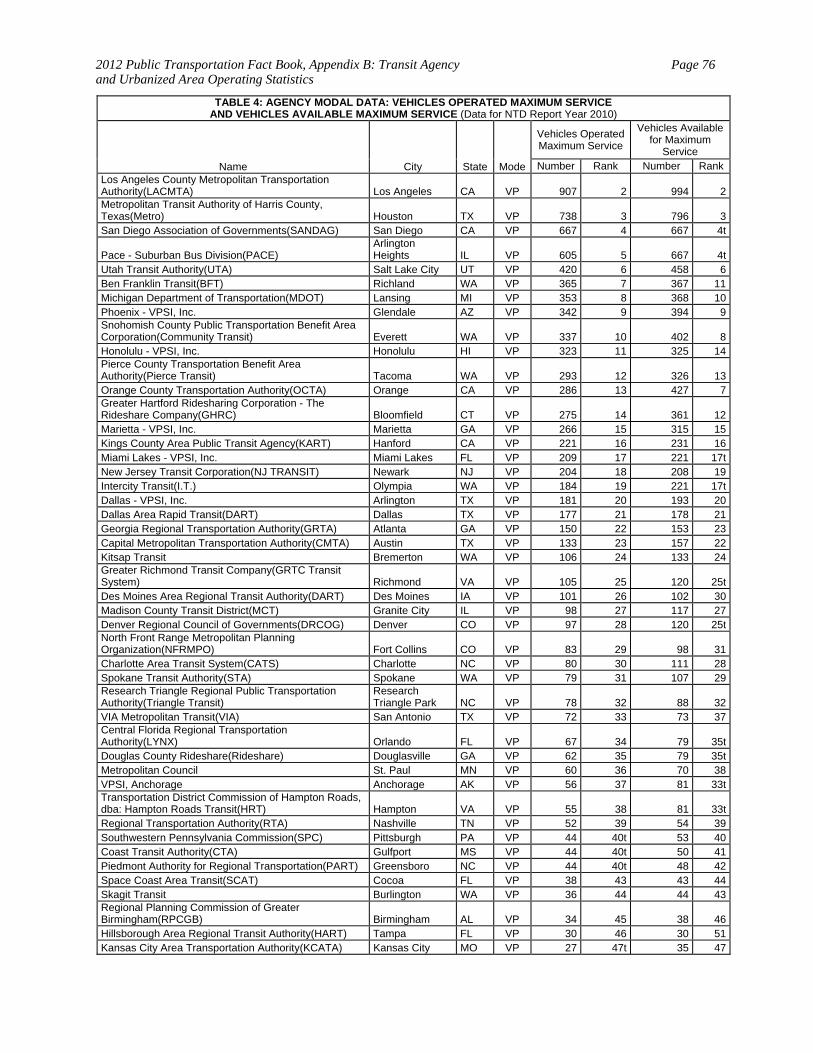
2012 Public Transportation Fact Book, Appendix B: Transit Agency and Urbanized Area Operating Statistics
Page 76
TABLE 4: AGENCY MODAL DATA: VEHICLES OPERATED MAXIMUM SERVICE AND VEHICLES AVAILABLE MAXIMUM SERVICE (Data for NTD Report Year 2010)
Name City State Mode
Vehicles Operated Maximum Service
Vehicles Available for Maximum
Service Number Rank Number Rank
Los Angeles County Metropolitan Transportation Authority(LACMTA) Los Angeles CA VP 907 2 994 2Metropolitan Transit Authority of Harris County, Texas(Metro) Houston TX VP 738 3 796 3San Diego Association of Governments(SANDAG) San Diego CA VP 667 4 667 4t
Pace - Suburban Bus Division(PACE) Arlington Heights IL VP 605 5 667 4t
Utah Transit Authority(UTA) Salt Lake City UT VP 420 6 458 6Ben Franklin Transit(BFT) Richland WA VP 365 7 367 11Michigan Department of Transportation(MDOT) Lansing MI VP 353 8 368 10Phoenix - VPSI, Inc. Glendale AZ VP 342 9 394 9Snohomish County Public Transportation Benefit Area Corporation(Community Transit) Everett WA VP 337 10 402 8Honolulu - VPSI, Inc. Honolulu HI VP 323 11 325 14Pierce County Transportation Benefit Area Authority(Pierce Transit) Tacoma WA VP 293 12 326 13Orange County Transportation Authority(OCTA) Orange CA VP 286 13 427 7Greater Hartford Ridesharing Corporation - The Rideshare Company(GHRC) Bloomfield CT VP 275 14 361 12Marietta - VPSI, Inc. Marietta GA VP 266 15 315 15Kings County Area Public Transit Agency(KART) Hanford CA VP 221 16 231 16Miami Lakes - VPSI, Inc. Miami Lakes FL VP 209 17 221 17tNew Jersey Transit Corporation(NJ TRANSIT) Newark NJ VP 204 18 208 19Intercity Transit(I.T.) Olympia WA VP 184 19 221 17tDallas - VPSI, Inc. Arlington TX VP 181 20 193 20Dallas Area Rapid Transit(DART) Dallas TX VP 177 21 178 21Georgia Regional Transportation Authority(GRTA) Atlanta GA VP 150 22 153 23Capital Metropolitan Transportation Authority(CMTA) Austin TX VP 133 23 157 22Kitsap Transit Bremerton WA VP 106 24 133 24Greater Richmond Transit Company(GRTC Transit System) Richmond VA VP 105 25 120 25tDes Moines Area Regional Transit Authority(DART) Des Moines IA VP 101 26 102 30Madison County Transit District(MCT) Granite City IL VP 98 27 117 27Denver Regional Council of Governments(DRCOG) Denver CO VP 97 28 120 25tNorth Front Range Metropolitan Planning Organization(NFRMPO) Fort Collins CO VP 83 29 98 31Charlotte Area Transit System(CATS) Charlotte NC VP 80 30 111 28Spokane Transit Authority(STA) Spokane WA VP 79 31 107 29Research Triangle Regional Public Transportation Authority(Triangle Transit)
Research Triangle Park NC VP 78 32 88 32
VIA Metropolitan Transit(VIA) San Antonio TX VP 72 33 73 37Central Florida Regional Transportation Authority(LYNX) Orlando FL VP 67 34 79 35tDouglas County Rideshare(Rideshare) Douglasville GA VP 62 35 79 35tMetropolitan Council St. Paul MN VP 60 36 70 38VPSI, Anchorage Anchorage AK VP 56 37 81 33tTransportation District Commission of Hampton Roads, dba: Hampton Roads Transit(HRT) Hampton VA VP 55 38 81 33tRegional Transportation Authority(RTA) Nashville TN VP 52 39 54 39Southwestern Pennsylvania Commission(SPC) Pittsburgh PA VP 44 40t 53 40Coast Transit Authority(CTA) Gulfport MS VP 44 40t 50 41Piedmont Authority for Regional Transportation(PART) Greensboro NC VP 44 40t 48 42Space Coast Area Transit(SCAT) Cocoa FL VP 38 43 43 44Skagit Transit Burlington WA VP 36 44 44 43Regional Planning Commission of Greater Birmingham(RPCGB) Birmingham AL VP 34 45 38 46Hillsborough Area Regional Transit Authority(HART) Tampa FL VP 30 46 30 51Kansas City Area Transportation Authority(KCATA) Kansas City MO VP 27 47t 35 47
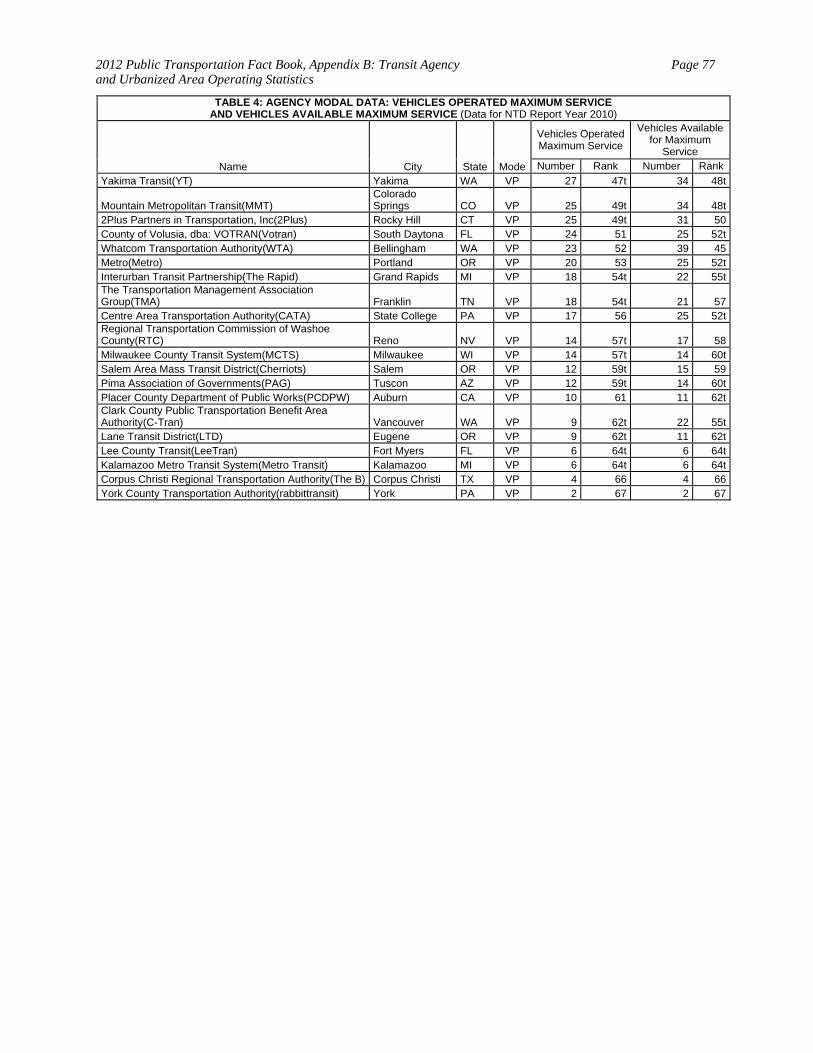
2012 Public Transportation Fact Book, Appendix B: Transit Agency and Urbanized Area Operating Statistics
Page 77
TABLE 4: AGENCY MODAL DATA: VEHICLES OPERATED MAXIMUM SERVICE AND VEHICLES AVAILABLE MAXIMUM SERVICE (Data for NTD Report Year 2010)
Name City State Mode
Vehicles Operated Maximum Service
Vehicles Available for Maximum
Service Number Rank Number Rank
Yakima Transit(YT) Yakima WA VP 27 47t 34 48t
Mountain Metropolitan Transit(MMT) Colorado Springs CO VP 25 49t 34 48t
2Plus Partners in Transportation, Inc(2Plus) Rocky Hill CT VP 25 49t 31 50County of Volusia, dba: VOTRAN(Votran) South Daytona FL VP 24 51 25 52tWhatcom Transportation Authority(WTA) Bellingham WA VP 23 52 39 45Metro(Metro) Portland OR VP 20 53 25 52tInterurban Transit Partnership(The Rapid) Grand Rapids MI VP 18 54t 22 55tThe Transportation Management Association Group(TMA) Franklin TN VP 18 54t 21 57Centre Area Transportation Authority(CATA) State College PA VP 17 56 25 52tRegional Transportation Commission of Washoe County(RTC) Reno NV VP 14 57t 17 58Milwaukee County Transit System(MCTS) Milwaukee WI VP 14 57t 14 60tSalem Area Mass Transit District(Cherriots) Salem OR VP 12 59t 15 59Pima Association of Governments(PAG) Tuscon AZ VP 12 59t 14 60tPlacer County Department of Public Works(PCDPW) Auburn CA VP 10 61 11 62tClark County Public Transportation Benefit Area Authority(C-Tran) Vancouver WA VP 9 62t 22 55tLane Transit District(LTD) Eugene OR VP 9 62t 11 62tLee County Transit(LeeTran) Fort Myers FL VP 6 64t 6 64tKalamazoo Metro Transit System(Metro Transit) Kalamazoo MI VP 6 64t 6 64tCorpus Christi Regional Transportation Authority(The B) Corpus Christi TX VP 4 66 4 66York County Transportation Authority(rabbittransit) York PA VP 2 67 2 67
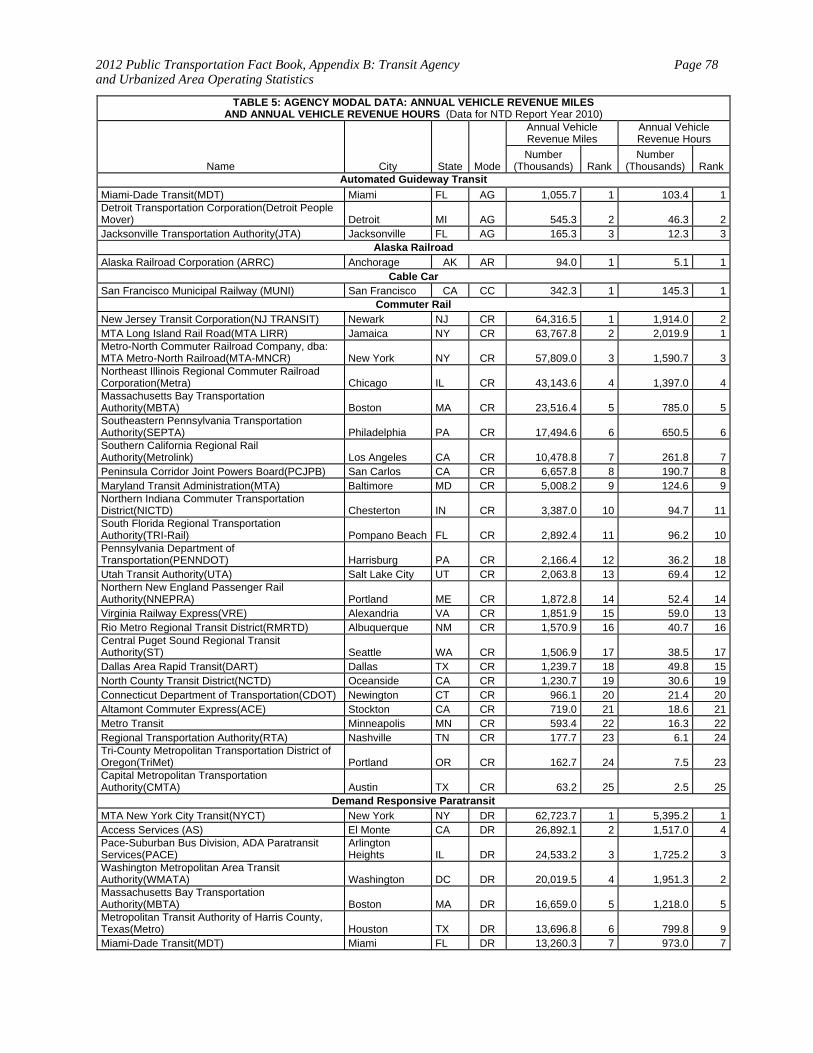
2012 Public Transportation Fact Book, Appendix B: Transit Agency and Urbanized Area Operating Statistics
Page 78
TABLE 5: AGENCY MODAL DATA: ANNUAL VEHICLE REVENUE MILES AND ANNUAL VEHICLE REVENUE HOURS (Data for NTD Report Year 2010)
Name City State Mode
Annual Vehicle Revenue Miles
Annual Vehicle Revenue Hours
Number (Thousands) Rank
Number (Thousands) Rank
Automated Guideway Transit
Miami-Dade Transit(MDT) Miami FL AG 1,055.7 1 103.4 1Detroit Transportation Corporation(Detroit People Mover) Detroit MI AG 545.3 2 46.3 2Jacksonville Transportation Authority(JTA) Jacksonville FL AG 165.3 3 12.3 3
Alaska Railroad
Alaska Railroad Corporation (ARRC) Anchorage AK AR 94.0 1 5.1 1Cable Car
San Francisco Municipal Railway (MUNI) San Francisco CA CC 342.3 1 145.3 1Commuter Rail
New Jersey Transit Corporation(NJ TRANSIT) Newark NJ CR 64,316.5 1 1,914.0 2MTA Long Island Rail Road(MTA LIRR) Jamaica NY CR 63,767.8 2 2,019.9 1Metro-North Commuter Railroad Company, dba: MTA Metro-North Railroad(MTA-MNCR) New York NY CR 57,809.0 3 1,590.7 3Northeast Illinois Regional Commuter Railroad Corporation(Metra) Chicago IL CR 43,143.6 4 1,397.0 4Massachusetts Bay Transportation Authority(MBTA) Boston MA CR 23,516.4 5 785.0 5Southeastern Pennsylvania Transportation Authority(SEPTA) Philadelphia PA CR 17,494.6 6 650.5 6Southern California Regional Rail Authority(Metrolink) Los Angeles CA CR 10,478.8 7 261.8 7Peninsula Corridor Joint Powers Board(PCJPB) San Carlos CA CR 6,657.8 8 190.7 8Maryland Transit Administration(MTA) Baltimore MD CR 5,008.2 9 124.6 9Northern Indiana Commuter Transportation District(NICTD) Chesterton IN CR 3,387.0 10 94.7 11South Florida Regional Transportation Authority(TRI-Rail) Pompano Beach FL CR 2,892.4 11 96.2 10Pennsylvania Department of Transportation(PENNDOT) Harrisburg PA CR 2,166.4 12 36.2 18Utah Transit Authority(UTA) Salt Lake City UT CR 2,063.8 13 69.4 12Northern New England Passenger Rail Authority(NNEPRA) Portland ME CR 1,872.8 14 52.4 14Virginia Railway Express(VRE) Alexandria VA CR 1,851.9 15 59.0 13Rio Metro Regional Transit District(RMRTD) Albuquerque NM CR 1,570.9 16 40.7 16Central Puget Sound Regional Transit Authority(ST) Seattle WA CR 1,506.9 17 38.5 17Dallas Area Rapid Transit(DART) Dallas TX CR 1,239.7 18 49.8 15North County Transit District(NCTD) Oceanside CA CR 1,230.7 19 30.6 19Connecticut Department of Transportation(CDOT) Newington CT CR 966.1 20 21.4 20Altamont Commuter Express(ACE) Stockton CA CR 719.0 21 18.6 21Metro Transit Minneapolis MN CR 593.4 22 16.3 22Regional Transportation Authority(RTA) Nashville TN CR 177.7 23 6.1 24Tri-County Metropolitan Transportation District of Oregon(TriMet) Portland OR CR 162.7 24 7.5 23Capital Metropolitan Transportation Authority(CMTA) Austin TX CR 63.2 25 2.5 25
Demand Responsive Paratransit
MTA New York City Transit(NYCT) New York NY DR 62,723.7 1 5,395.2 1Access Services (AS) El Monte CA DR 26,892.1 2 1,517.0 4Pace-Suburban Bus Division, ADA Paratransit Services(PACE)
Arlington Heights IL DR 24,533.2 3 1,725.2 3
Washington Metropolitan Area Transit Authority(WMATA) Washington DC DR 20,019.5 4 1,951.3 2Massachusetts Bay Transportation Authority(MBTA) Boston MA DR 16,659.0 5 1,218.0 5Metropolitan Transit Authority of Harris County, Texas(Metro) Houston TX DR 13,696.8 6 799.8 9Miami-Dade Transit(MDT) Miami FL DR 13,260.3 7 973.0 7
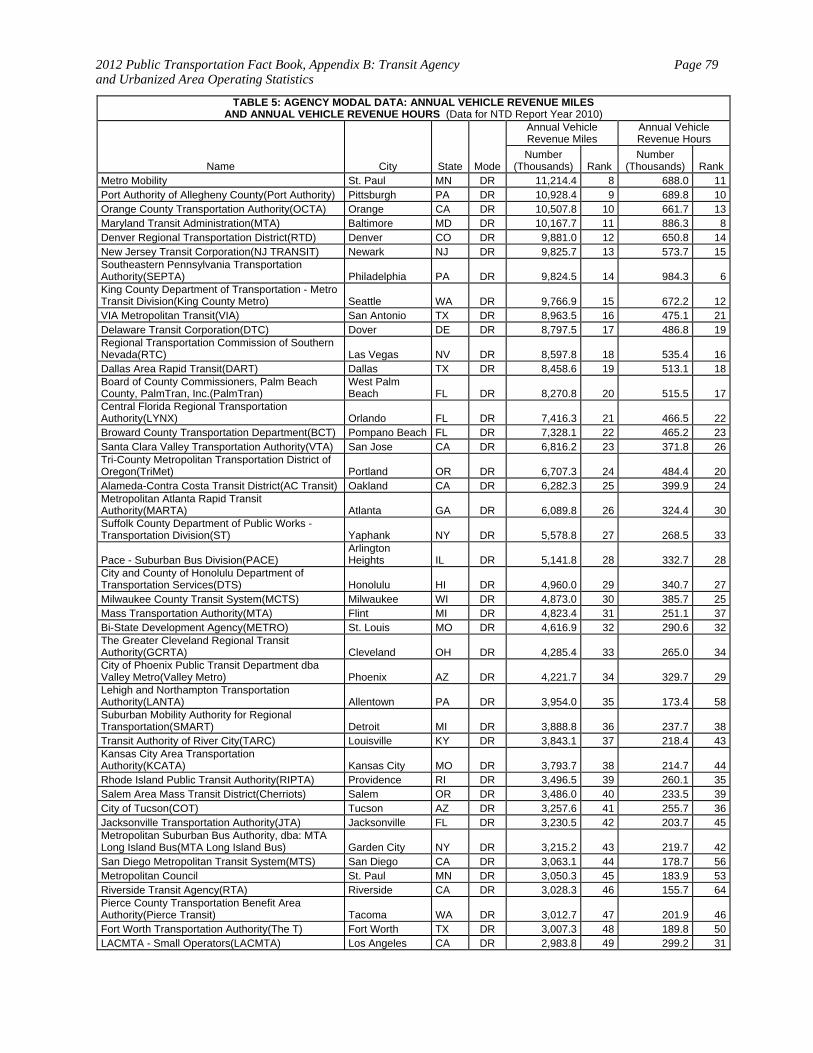
2012 Public Transportation Fact Book, Appendix B: Transit Agency and Urbanized Area Operating Statistics
Page 79
TABLE 5: AGENCY MODAL DATA: ANNUAL VEHICLE REVENUE MILES AND ANNUAL VEHICLE REVENUE HOURS (Data for NTD Report Year 2010)
Name City State Mode
Annual Vehicle Revenue Miles
Annual Vehicle Revenue Hours
Number (Thousands) Rank
Number (Thousands) Rank
Metro Mobility St. Paul MN DR 11,214.4 8 688.0 11Port Authority of Allegheny County(Port Authority) Pittsburgh PA DR 10,928.4 9 689.8 10Orange County Transportation Authority(OCTA) Orange CA DR 10,507.8 10 661.7 13Maryland Transit Administration(MTA) Baltimore MD DR 10,167.7 11 886.3 8Denver Regional Transportation District(RTD) Denver CO DR 9,881.0 12 650.8 14New Jersey Transit Corporation(NJ TRANSIT) Newark NJ DR 9,825.7 13 573.7 15Southeastern Pennsylvania Transportation Authority(SEPTA) Philadelphia PA DR 9,824.5 14 984.3 6King County Department of Transportation - Metro Transit Division(King County Metro) Seattle WA DR 9,766.9 15 672.2 12VIA Metropolitan Transit(VIA) San Antonio TX DR 8,963.5 16 475.1 21Delaware Transit Corporation(DTC) Dover DE DR 8,797.5 17 486.8 19Regional Transportation Commission of Southern Nevada(RTC) Las Vegas NV DR 8,597.8 18 535.4 16Dallas Area Rapid Transit(DART) Dallas TX DR 8,458.6 19 513.1 18Board of County Commissioners, Palm Beach County, PalmTran, Inc.(PalmTran)
West Palm Beach FL DR 8,270.8 20 515.5 17
Central Florida Regional Transportation Authority(LYNX) Orlando FL DR 7,416.3 21 466.5 22Broward County Transportation Department(BCT) Pompano Beach FL DR 7,328.1 22 465.2 23Santa Clara Valley Transportation Authority(VTA) San Jose CA DR 6,816.2 23 371.8 26Tri-County Metropolitan Transportation District of Oregon(TriMet) Portland OR DR 6,707.3 24 484.4 20Alameda-Contra Costa Transit District(AC Transit) Oakland CA DR 6,282.3 25 399.9 24Metropolitan Atlanta Rapid Transit Authority(MARTA) Atlanta GA DR 6,089.8 26 324.4 30Suffolk County Department of Public Works - Transportation Division(ST) Yaphank NY DR 5,578.8 27 268.5 33
Pace - Suburban Bus Division(PACE) Arlington Heights IL DR 5,141.8 28 332.7 28
City and County of Honolulu Department of Transportation Services(DTS) Honolulu HI DR 4,960.0 29 340.7 27Milwaukee County Transit System(MCTS) Milwaukee WI DR 4,873.0 30 385.7 25Mass Transportation Authority(MTA) Flint MI DR 4,823.4 31 251.1 37Bi-State Development Agency(METRO) St. Louis MO DR 4,616.9 32 290.6 32The Greater Cleveland Regional Transit Authority(GCRTA) Cleveland OH DR 4,285.4 33 265.0 34City of Phoenix Public Transit Department dba Valley Metro(Valley Metro) Phoenix AZ DR 4,221.7 34 329.7 29Lehigh and Northampton Transportation Authority(LANTA) Allentown PA DR 3,954.0 35 173.4 58Suburban Mobility Authority for Regional Transportation(SMART) Detroit MI DR 3,888.8 36 237.7 38Transit Authority of River City(TARC) Louisville KY DR 3,843.1 37 218.4 43Kansas City Area Transportation Authority(KCATA) Kansas City MO DR 3,793.7 38 214.7 44Rhode Island Public Transit Authority(RIPTA) Providence RI DR 3,496.5 39 260.1 35Salem Area Mass Transit District(Cherriots) Salem OR DR 3,486.0 40 233.5 39City of Tucson(COT) Tucson AZ DR 3,257.6 41 255.7 36Jacksonville Transportation Authority(JTA) Jacksonville FL DR 3,230.5 42 203.7 45Metropolitan Suburban Bus Authority, dba: MTA Long Island Bus(MTA Long Island Bus) Garden City NY DR 3,215.2 43 219.7 42San Diego Metropolitan Transit System(MTS) San Diego CA DR 3,063.1 44 178.7 56Metropolitan Council St. Paul MN DR 3,050.3 45 183.9 53Riverside Transit Agency(RTA) Riverside CA DR 3,028.3 46 155.7 64Pierce County Transportation Benefit Area Authority(Pierce Transit) Tacoma WA DR 3,012.7 47 201.9 46Fort Worth Transportation Authority(The T) Fort Worth TX DR 3,007.3 48 189.8 50LACMTA - Small Operators(LACMTA) Los Angeles CA DR 2,983.8 49 299.2 31
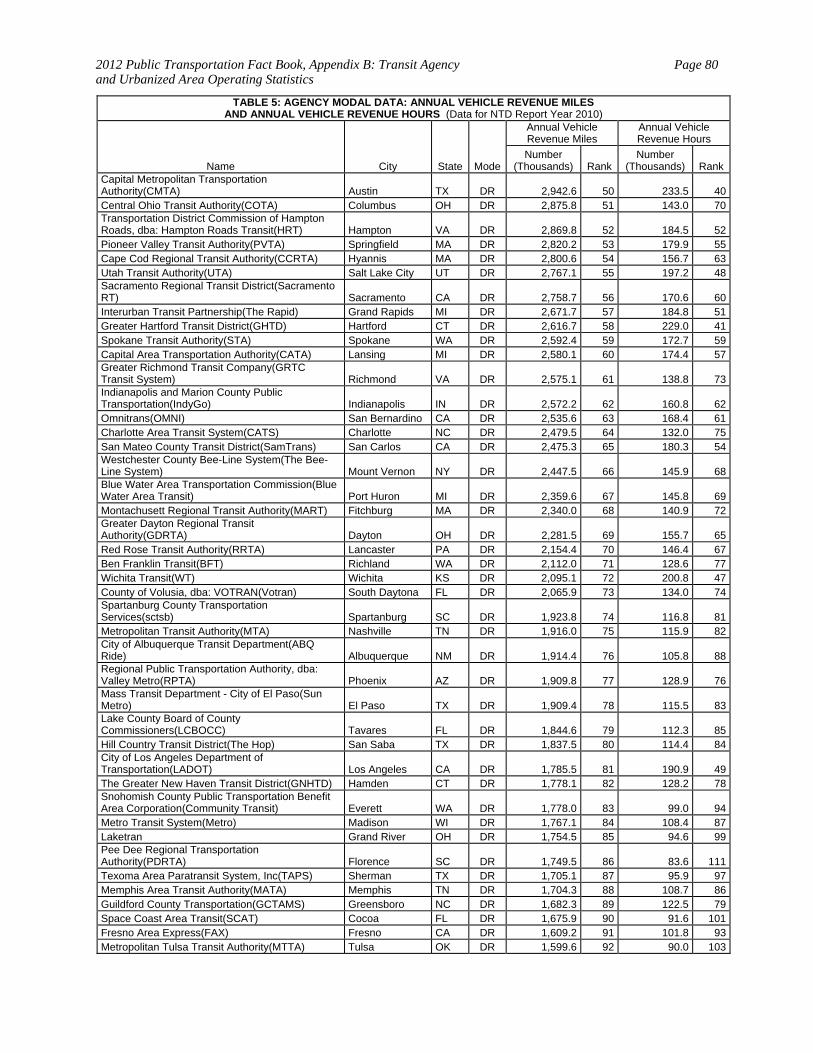
2012 Public Transportation Fact Book, Appendix B: Transit Agency and Urbanized Area Operating Statistics
Page 80
TABLE 5: AGENCY MODAL DATA: ANNUAL VEHICLE REVENUE MILES AND ANNUAL VEHICLE REVENUE HOURS (Data for NTD Report Year 2010)
Name City State Mode
Annual Vehicle Revenue Miles
Annual Vehicle Revenue Hours
Number (Thousands) Rank
Number (Thousands) Rank
Capital Metropolitan Transportation Authority(CMTA) Austin TX DR 2,942.6 50 233.5 40Central Ohio Transit Authority(COTA) Columbus OH DR 2,875.8 51 143.0 70Transportation District Commission of Hampton Roads, dba: Hampton Roads Transit(HRT) Hampton VA DR 2,869.8 52 184.5 52Pioneer Valley Transit Authority(PVTA) Springfield MA DR 2,820.2 53 179.9 55Cape Cod Regional Transit Authority(CCRTA) Hyannis MA DR 2,800.6 54 156.7 63Utah Transit Authority(UTA) Salt Lake City UT DR 2,767.1 55 197.2 48Sacramento Regional Transit District(Sacramento RT) Sacramento CA DR 2,758.7 56 170.6 60Interurban Transit Partnership(The Rapid) Grand Rapids MI DR 2,671.7 57 184.8 51Greater Hartford Transit District(GHTD) Hartford CT DR 2,616.7 58 229.0 41Spokane Transit Authority(STA) Spokane WA DR 2,592.4 59 172.7 59Capital Area Transportation Authority(CATA) Lansing MI DR 2,580.1 60 174.4 57Greater Richmond Transit Company(GRTC Transit System) Richmond VA DR 2,575.1 61 138.8 73Indianapolis and Marion County Public Transportation(IndyGo) Indianapolis IN DR 2,572.2 62 160.8 62Omnitrans(OMNI) San Bernardino CA DR 2,535.6 63 168.4 61Charlotte Area Transit System(CATS) Charlotte NC DR 2,479.5 64 132.0 75San Mateo County Transit District(SamTrans) San Carlos CA DR 2,475.3 65 180.3 54Westchester County Bee-Line System(The Bee-Line System) Mount Vernon NY DR 2,447.5 66 145.9 68Blue Water Area Transportation Commission(Blue Water Area Transit) Port Huron MI DR 2,359.6 67 145.8 69Montachusett Regional Transit Authority(MART) Fitchburg MA DR 2,340.0 68 140.9 72Greater Dayton Regional Transit Authority(GDRTA) Dayton OH DR 2,281.5 69 155.7 65Red Rose Transit Authority(RRTA) Lancaster PA DR 2,154.4 70 146.4 67Ben Franklin Transit(BFT) Richland WA DR 2,112.0 71 128.6 77Wichita Transit(WT) Wichita KS DR 2,095.1 72 200.8 47County of Volusia, dba: VOTRAN(Votran) South Daytona FL DR 2,065.9 73 134.0 74Spartanburg County Transportation Services(sctsb) Spartanburg SC DR 1,923.8 74 116.8 81Metropolitan Transit Authority(MTA) Nashville TN DR 1,916.0 75 115.9 82City of Albuquerque Transit Department(ABQ Ride) Albuquerque NM DR 1,914.4 76 105.8 88Regional Public Transportation Authority, dba: Valley Metro(RPTA) Phoenix AZ DR 1,909.8 77 128.9 76Mass Transit Department - City of El Paso(Sun Metro) El Paso TX DR 1,909.4 78 115.5 83Lake County Board of County Commissioners(LCBOCC) Tavares FL DR 1,844.6 79 112.3 85Hill Country Transit District(The Hop) San Saba TX DR 1,837.5 80 114.4 84City of Los Angeles Department of Transportation(LADOT) Los Angeles CA DR 1,785.5 81 190.9 49The Greater New Haven Transit District(GNHTD) Hamden CT DR 1,778.1 82 128.2 78Snohomish County Public Transportation Benefit Area Corporation(Community Transit) Everett WA DR 1,778.0 83 99.0 94Metro Transit System(Metro) Madison WI DR 1,767.1 84 108.4 87Laketran Grand River OH DR 1,754.5 85 94.6 99Pee Dee Regional Transportation Authority(PDRTA) Florence SC DR 1,749.5 86 83.6 111Texoma Area Paratransit System, Inc(TAPS) Sherman TX DR 1,705.1 87 95.9 97Memphis Area Transit Authority(MATA) Memphis TN DR 1,704.3 88 108.7 86Guildford County Transportation(GCTAMS) Greensboro NC DR 1,682.3 89 122.5 79Space Coast Area Transit(SCAT) Cocoa FL DR 1,675.9 90 91.6 101Fresno Area Express(FAX) Fresno CA DR 1,609.2 91 101.8 93Metropolitan Tulsa Transit Authority(MTTA) Tulsa OK DR 1,599.6 92 90.0 103

2012 Public Transportation Fact Book, Appendix B: Transit Agency and Urbanized Area Operating Statistics
Page 81
TABLE 5: AGENCY MODAL DATA: ANNUAL VEHICLE REVENUE MILES AND ANNUAL VEHICLE REVENUE HOURS (Data for NTD Report Year 2010)
Name City State Mode
Annual Vehicle Revenue Miles
Annual Vehicle Revenue Hours
Number (Thousands) Rank
Number (Thousands) Rank
Regional Transit Service, Inc. and Lift Line, Inc.(R-GRTA) Rochester NY DR 1,557.3 93 97.1 96JAUNT, Inc. Charlottesville VA DR 1,535.3 94 103.9 90
Mountain Metropolitan Transit(MMT) Colorado Springs CO DR 1,512.5 95 118.5 80
Durham Area Transit Authority(DATA) Durham NC DR 1,443.7 96 77.5 118Brazos Transit District(The District) Bryan TX DR 1,431.5 97 71.1 122Capital Area Transit(CAT) Harrisburg PA DR 1,425.7 98 84.1 108Kitsap Transit Bremerton WA DR 1,425.4 99 81.0 113Southwest Ohio Regional Transit Authority(SORTA / Metro) Cincinnati OH DR 1,422.5 100 83.6 110Corpus Christi Regional Transportation Authority(The B) Corpus Christi TX DR 1,415.3 101 65.9 133Golden Crescent Regional Planning Commission(VICTORIA TRANSIT) Victoria TX DR 1,359.7 102 72.9 121Central Contra Costa Transit Authority(County Connection) Concord CA DR 1,359.7 103 84.1 109York County Transportation Authority(rabbittransit) York PA DR 1,352.6 104 92.2 100Niagara Frontier Transportation Authority(NFT Metro) Buffalo NY DR 1,319.1 105 81.0 114San Francisco Municipal Railway(MUNI) San Francisco CA DR 1,307.0 106 152.9 66Knoxville-Knox County Community Action Committee(Knox County CAC Transit) Knoxville TN DR 1,301.0 107 66.0 132Berks Area Reading Transportation Authority(BARTA) Reading PA DR 1,292.3 108 87.3 105Greater Attleboro-Taunton Regional Transit Authority(GATRA) Taunton MA DR 1,257.2 109 101.9 92Clark County Public Transportation Benefit Area Authority(C-Tran) Vancouver WA DR 1,253.5 110 80.6 115Sarasota County Area Transit(SCAT) Sarasota FL DR 1,242.4 111 90.3 102Lexington Transit Authority(LexTran) Lexington KY DR 1,232.1 112 87.6 104Toledo Area Regional Transit Authority(TARTA) Toledo OH DR 1,228.1 113 94.8 98Greensboro Transit Authority(GTA) Greensboro NC DR 1,219.0 114 87.2 106Collier Area Transit(CAT) Naples FL DR 1,214.3 115 64.9 134Lane Transit District(LTD) Eugene OR DR 1,205.2 116 98.8 95Pinellas Suncoast Transit Authority(PSTA) St. Petersburg FL DR 1,186.9 117 42.8 181Polk County Transit Services Division - Polk County Board of County Commissioners(PCTS) Bartow FL DR 1,167.5 118 80.1 116Capital District Transportation Authority(CDTA) Albany NY DR 1,167.0 119 66.6 128Regional Transportation Commission of Washoe County(RTC) Reno NV DR 1,150.0 120 77.5 119Municipality of Anchorage - Public Transportation Department(People Mover) Anchorage AK DR 1,148.7 121 84.5 107Washington County Transit West Bend WI DR 1,133.3 122 52.7 154North County Transit District(NCTD) Oceanside CA DR 1,122.5 123 58.0 139Erie Metropolitan Transit Authority(the e) Erie PA DR 1,105.8 124 105.6 89Hillsborough Area Regional Transit Authority(HART) Tampa FL DR 1,104.2 125 69.8 123Lee County Transit(LeeTran) Fort Myers FL DR 1,102.6 126 66.5 129Clermont Transportation Connection(CTC) Batavia OH DR 1,083.2 127 59.2 138Santee Wateree Regional Transportation Authority(SWRTA) Sumter SC DR 1,076.7 128 55.0 147Stark Area Regional Transit Authority(SARTA) Canton OH DR 1,042.9 129 56.2 144Bergen County Community Transportation(BCCT) Lodi NJ DR 1,041.3 130 102.7 91Golden Gate Bridge, Highway and Transportation District(GGBHTD) San Francisco CA DR 1,038.4 131 59.2 137Cape May County Fare Free Transportation(Fare Free)
Cape May Court House NJ DR 1,022.3 132 48.7 162
Kalamazoo Metro Transit System(Metro Transit) Kalamazoo MI DR 1,017.2 133 67.0 127
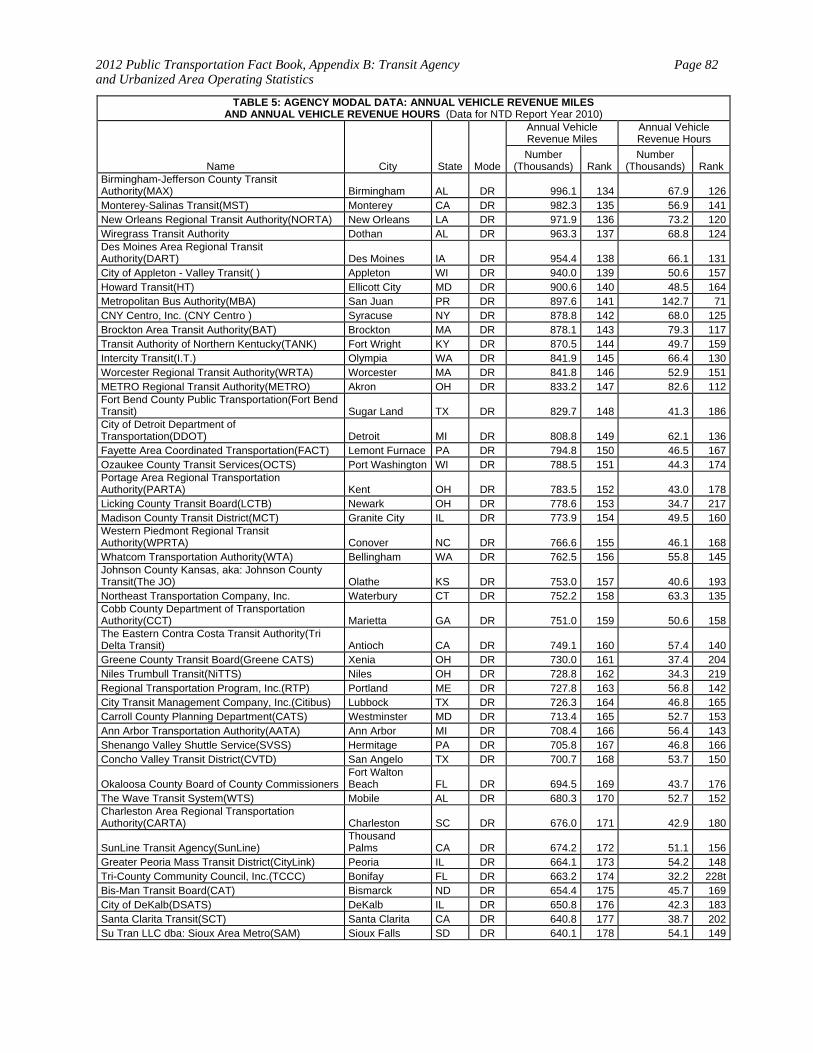
2012 Public Transportation Fact Book, Appendix B: Transit Agency and Urbanized Area Operating Statistics
Page 82
TABLE 5: AGENCY MODAL DATA: ANNUAL VEHICLE REVENUE MILES AND ANNUAL VEHICLE REVENUE HOURS (Data for NTD Report Year 2010)
Name City State Mode
Annual Vehicle Revenue Miles
Annual Vehicle Revenue Hours
Number (Thousands) Rank
Number (Thousands) Rank
Birmingham-Jefferson County Transit Authority(MAX) Birmingham AL DR 996.1 134 67.9 126Monterey-Salinas Transit(MST) Monterey CA DR 982.3 135 56.9 141New Orleans Regional Transit Authority(NORTA) New Orleans LA DR 971.9 136 73.2 120Wiregrass Transit Authority Dothan AL DR 963.3 137 68.8 124Des Moines Area Regional Transit Authority(DART) Des Moines IA DR 954.4 138 66.1 131City of Appleton - Valley Transit( ) Appleton WI DR 940.0 139 50.6 157Howard Transit(HT) Ellicott City MD DR 900.6 140 48.5 164Metropolitan Bus Authority(MBA) San Juan PR DR 897.6 141 142.7 71CNY Centro, Inc. (CNY Centro ) Syracuse NY DR 878.8 142 68.0 125Brockton Area Transit Authority(BAT) Brockton MA DR 878.1 143 79.3 117Transit Authority of Northern Kentucky(TANK) Fort Wright KY DR 870.5 144 49.7 159Intercity Transit(I.T.) Olympia WA DR 841.9 145 66.4 130Worcester Regional Transit Authority(WRTA) Worcester MA DR 841.8 146 52.9 151METRO Regional Transit Authority(METRO) Akron OH DR 833.2 147 82.6 112Fort Bend County Public Transportation(Fort Bend Transit) Sugar Land TX DR 829.7 148 41.3 186City of Detroit Department of Transportation(DDOT) Detroit MI DR 808.8 149 62.1 136Fayette Area Coordinated Transportation(FACT) Lemont Furnace PA DR 794.8 150 46.5 167Ozaukee County Transit Services(OCTS) Port Washington WI DR 788.5 151 44.3 174Portage Area Regional Transportation Authority(PARTA) Kent OH DR 783.5 152 43.0 178Licking County Transit Board(LCTB) Newark OH DR 778.6 153 34.7 217Madison County Transit District(MCT) Granite City IL DR 773.9 154 49.5 160Western Piedmont Regional Transit Authority(WPRTA) Conover NC DR 766.6 155 46.1 168Whatcom Transportation Authority(WTA) Bellingham WA DR 762.5 156 55.8 145Johnson County Kansas, aka: Johnson County Transit(The JO) Olathe KS DR 753.0 157 40.6 193Northeast Transportation Company, Inc. Waterbury CT DR 752.2 158 63.3 135Cobb County Department of Transportation Authority(CCT) Marietta GA DR 751.0 159 50.6 158The Eastern Contra Costa Transit Authority(Tri Delta Transit) Antioch CA DR 749.1 160 57.4 140Greene County Transit Board(Greene CATS) Xenia OH DR 730.0 161 37.4 204Niles Trumbull Transit(NiTTS) Niles OH DR 728.8 162 34.3 219Regional Transportation Program, Inc.(RTP) Portland ME DR 727.8 163 56.8 142City Transit Management Company, Inc.(Citibus) Lubbock TX DR 726.3 164 46.8 165Carroll County Planning Department(CATS) Westminster MD DR 713.4 165 52.7 153Ann Arbor Transportation Authority(AATA) Ann Arbor MI DR 708.4 166 56.4 143Shenango Valley Shuttle Service(SVSS) Hermitage PA DR 705.8 167 46.8 166Concho Valley Transit District(CVTD) San Angelo TX DR 700.7 168 53.7 150
Okaloosa County Board of County CommissionersFort Walton Beach FL DR 694.5 169 43.7 176
The Wave Transit System(WTS) Mobile AL DR 680.3 170 52.7 152Charleston Area Regional Transportation Authority(CARTA) Charleston SC DR 676.0 171 42.9 180
SunLine Transit Agency(SunLine) Thousand Palms CA DR 674.2 172 51.1 156
Greater Peoria Mass Transit District(CityLink) Peoria IL DR 664.1 173 54.2 148Tri-County Community Council, Inc.(TCCC) Bonifay FL DR 663.2 174 32.2 228tBis-Man Transit Board(CAT) Bismarck ND DR 654.4 175 45.7 169City of DeKalb(DSATS) DeKalb IL DR 650.8 176 42.3 183Santa Clarita Transit(SCT) Santa Clarita CA DR 640.8 177 38.7 202Su Tran LLC dba: Sioux Area Metro(SAM) Sioux Falls SD DR 640.1 178 54.1 149
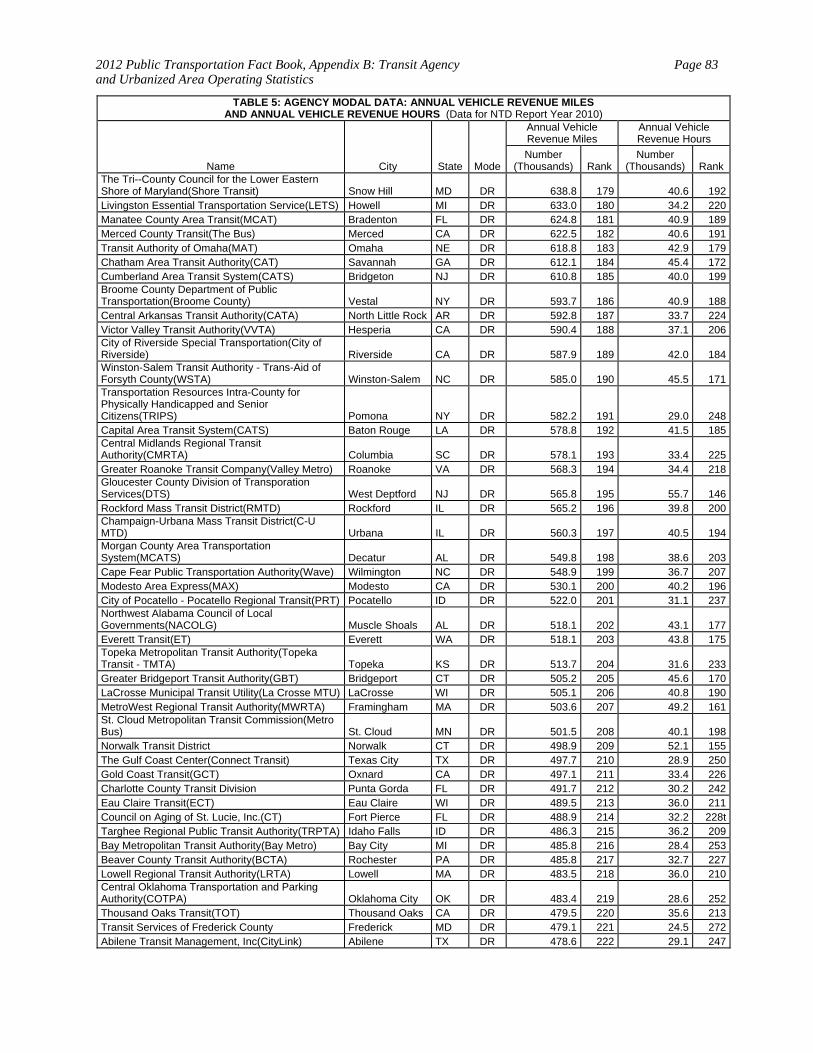
2012 Public Transportation Fact Book, Appendix B: Transit Agency and Urbanized Area Operating Statistics
Page 83
TABLE 5: AGENCY MODAL DATA: ANNUAL VEHICLE REVENUE MILES AND ANNUAL VEHICLE REVENUE HOURS (Data for NTD Report Year 2010)
Name City State Mode
Annual Vehicle Revenue Miles
Annual Vehicle Revenue Hours
Number (Thousands) Rank
Number (Thousands) Rank
The Tri--County Council for the Lower Eastern Shore of Maryland(Shore Transit) Snow Hill MD DR 638.8 179 40.6 192Livingston Essential Transportation Service(LETS) Howell MI DR 633.0 180 34.2 220Manatee County Area Transit(MCAT) Bradenton FL DR 624.8 181 40.9 189Merced County Transit(The Bus) Merced CA DR 622.5 182 40.6 191Transit Authority of Omaha(MAT) Omaha NE DR 618.8 183 42.9 179Chatham Area Transit Authority(CAT) Savannah GA DR 612.1 184 45.4 172Cumberland Area Transit System(CATS) Bridgeton NJ DR 610.8 185 40.0 199Broome County Department of Public Transportation(Broome County) Vestal NY DR 593.7 186 40.9 188Central Arkansas Transit Authority(CATA) North Little Rock AR DR 592.8 187 33.7 224Victor Valley Transit Authority(VVTA) Hesperia CA DR 590.4 188 37.1 206City of Riverside Special Transportation(City of Riverside) Riverside CA DR 587.9 189 42.0 184Winston-Salem Transit Authority - Trans-Aid of Forsyth County(WSTA) Winston-Salem NC DR 585.0 190 45.5 171Transportation Resources Intra-County for Physically Handicapped and Senior Citizens(TRIPS) Pomona NY DR 582.2 191 29.0 248Capital Area Transit System(CATS) Baton Rouge LA DR 578.8 192 41.5 185Central Midlands Regional Transit Authority(CMRTA) Columbia SC DR 578.1 193 33.4 225Greater Roanoke Transit Company(Valley Metro) Roanoke VA DR 568.3 194 34.4 218Gloucester County Division of Transporation Services(DTS) West Deptford NJ DR 565.8 195 55.7 146Rockford Mass Transit District(RMTD) Rockford IL DR 565.2 196 39.8 200Champaign-Urbana Mass Transit District(C-U MTD) Urbana IL DR 560.3 197 40.5 194Morgan County Area Transportation System(MCATS) Decatur AL DR 549.8 198 38.6 203Cape Fear Public Transportation Authority(Wave) Wilmington NC DR 548.9 199 36.7 207Modesto Area Express(MAX) Modesto CA DR 530.1 200 40.2 196City of Pocatello - Pocatello Regional Transit(PRT) Pocatello ID DR 522.0 201 31.1 237Northwest Alabama Council of Local Governments(NACOLG) Muscle Shoals AL DR 518.1 202 43.1 177Everett Transit(ET) Everett WA DR 518.1 203 43.8 175Topeka Metropolitan Transit Authority(Topeka Transit - TMTA) Topeka KS DR 513.7 204 31.6 233Greater Bridgeport Transit Authority(GBT) Bridgeport CT DR 505.2 205 45.6 170LaCrosse Municipal Transit Utility(La Crosse MTU) LaCrosse WI DR 505.1 206 40.8 190MetroWest Regional Transit Authority(MWRTA) Framingham MA DR 503.6 207 49.2 161St. Cloud Metropolitan Transit Commission(Metro Bus) St. Cloud MN DR 501.5 208 40.1 198Norwalk Transit District Norwalk CT DR 498.9 209 52.1 155The Gulf Coast Center(Connect Transit) Texas City TX DR 497.7 210 28.9 250Gold Coast Transit(GCT) Oxnard CA DR 497.1 211 33.4 226Charlotte County Transit Division Punta Gorda FL DR 491.7 212 30.2 242Eau Claire Transit(ECT) Eau Claire WI DR 489.5 213 36.0 211Council on Aging of St. Lucie, Inc.(CT) Fort Pierce FL DR 488.9 214 32.2 228tTarghee Regional Public Transit Authority(TRPTA) Idaho Falls ID DR 486.3 215 36.2 209Bay Metropolitan Transit Authority(Bay Metro) Bay City MI DR 485.8 216 28.4 253Beaver County Transit Authority(BCTA) Rochester PA DR 485.8 217 32.7 227Lowell Regional Transit Authority(LRTA) Lowell MA DR 483.5 218 36.0 210Central Oklahoma Transportation and Parking Authority(COTPA) Oklahoma City OK DR 483.4 219 28.6 252Thousand Oaks Transit(TOT) Thousand Oaks CA DR 479.5 220 35.6 213Transit Services of Frederick County Frederick MD DR 479.1 221 24.5 272Abilene Transit Management, Inc(CityLink) Abilene TX DR 478.6 222 29.1 247
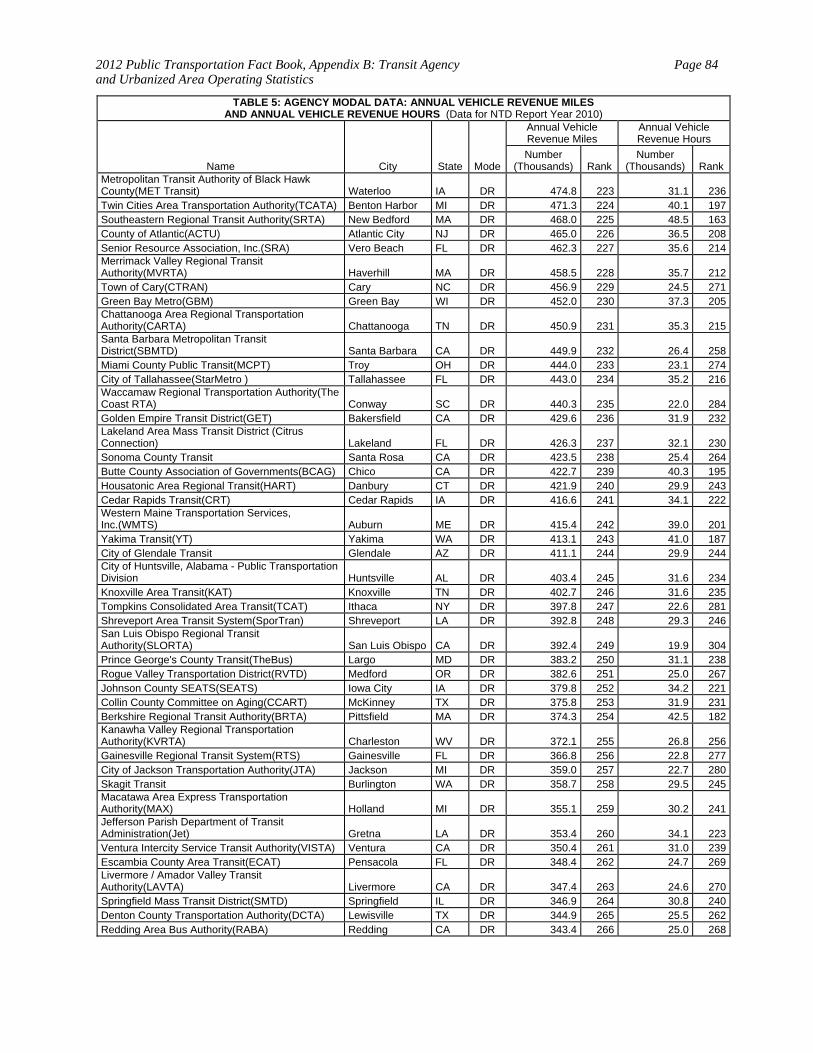
2012 Public Transportation Fact Book, Appendix B: Transit Agency and Urbanized Area Operating Statistics
Page 84
TABLE 5: AGENCY MODAL DATA: ANNUAL VEHICLE REVENUE MILES AND ANNUAL VEHICLE REVENUE HOURS (Data for NTD Report Year 2010)
Name City State Mode
Annual Vehicle Revenue Miles
Annual Vehicle Revenue Hours
Number (Thousands) Rank
Number (Thousands) Rank
Metropolitan Transit Authority of Black Hawk County(MET Transit) Waterloo IA DR 474.8 223 31.1 236Twin Cities Area Transportation Authority(TCATA) Benton Harbor MI DR 471.3 224 40.1 197Southeastern Regional Transit Authority(SRTA) New Bedford MA DR 468.0 225 48.5 163County of Atlantic(ACTU) Atlantic City NJ DR 465.0 226 36.5 208Senior Resource Association, Inc.(SRA) Vero Beach FL DR 462.3 227 35.6 214Merrimack Valley Regional Transit Authority(MVRTA) Haverhill MA DR 458.5 228 35.7 212Town of Cary(CTRAN) Cary NC DR 456.9 229 24.5 271Green Bay Metro(GBM) Green Bay WI DR 452.0 230 37.3 205Chattanooga Area Regional Transportation Authority(CARTA) Chattanooga TN DR 450.9 231 35.3 215Santa Barbara Metropolitan Transit District(SBMTD) Santa Barbara CA DR 449.9 232 26.4 258Miami County Public Transit(MCPT) Troy OH DR 444.0 233 23.1 274City of Tallahassee(StarMetro ) Tallahassee FL DR 443.0 234 35.2 216Waccamaw Regional Transportation Authority(The Coast RTA) Conway SC DR 440.3 235 22.0 284Golden Empire Transit District(GET) Bakersfield CA DR 429.6 236 31.9 232Lakeland Area Mass Transit District (Citrus Connection) Lakeland FL DR 426.3 237 32.1 230Sonoma County Transit Santa Rosa CA DR 423.5 238 25.4 264Butte County Association of Governments(BCAG) Chico CA DR 422.7 239 40.3 195Housatonic Area Regional Transit(HART) Danbury CT DR 421.9 240 29.9 243Cedar Rapids Transit(CRT) Cedar Rapids IA DR 416.6 241 34.1 222Western Maine Transportation Services, Inc.(WMTS) Auburn ME DR 415.4 242 39.0 201Yakima Transit(YT) Yakima WA DR 413.1 243 41.0 187City of Glendale Transit Glendale AZ DR 411.1 244 29.9 244City of Huntsville, Alabama - Public Transportation Division Huntsville AL DR 403.4 245 31.6 234Knoxville Area Transit(KAT) Knoxville TN DR 402.7 246 31.6 235Tompkins Consolidated Area Transit(TCAT) Ithaca NY DR 397.8 247 22.6 281Shreveport Area Transit System(SporTran) Shreveport LA DR 392.8 248 29.3 246San Luis Obispo Regional Transit Authority(SLORTA) San Luis Obispo CA DR 392.4 249 19.9 304Prince George's County Transit(TheBus) Largo MD DR 383.2 250 31.1 238Rogue Valley Transportation District(RVTD) Medford OR DR 382.6 251 25.0 267Johnson County SEATS(SEATS) Iowa City IA DR 379.8 252 34.2 221Collin County Committee on Aging(CCART) McKinney TX DR 375.8 253 31.9 231Berkshire Regional Transit Authority(BRTA) Pittsfield MA DR 374.3 254 42.5 182Kanawha Valley Regional Transportation Authority(KVRTA) Charleston WV DR 372.1 255 26.8 256Gainesville Regional Transit System(RTS) Gainesville FL DR 366.8 256 22.8 277City of Jackson Transportation Authority(JTA) Jackson MI DR 359.0 257 22.7 280Skagit Transit Burlington WA DR 358.7 258 29.5 245Macatawa Area Express Transportation Authority(MAX) Holland MI DR 355.1 259 30.2 241Jefferson Parish Department of Transit Administration(Jet) Gretna LA DR 353.4 260 34.1 223Ventura Intercity Service Transit Authority(VISTA) Ventura CA DR 350.4 261 31.0 239Escambia County Area Transit(ECAT) Pensacola FL DR 348.4 262 24.7 269Livermore / Amador Valley Transit Authority(LAVTA) Livermore CA DR 347.4 263 24.6 270Springfield Mass Transit District(SMTD) Springfield IL DR 346.9 264 30.8 240Denton County Transportation Authority(DCTA) Lewisville TX DR 344.9 265 25.5 262Redding Area Bus Authority(RABA) Redding CA DR 343.4 266 25.0 268
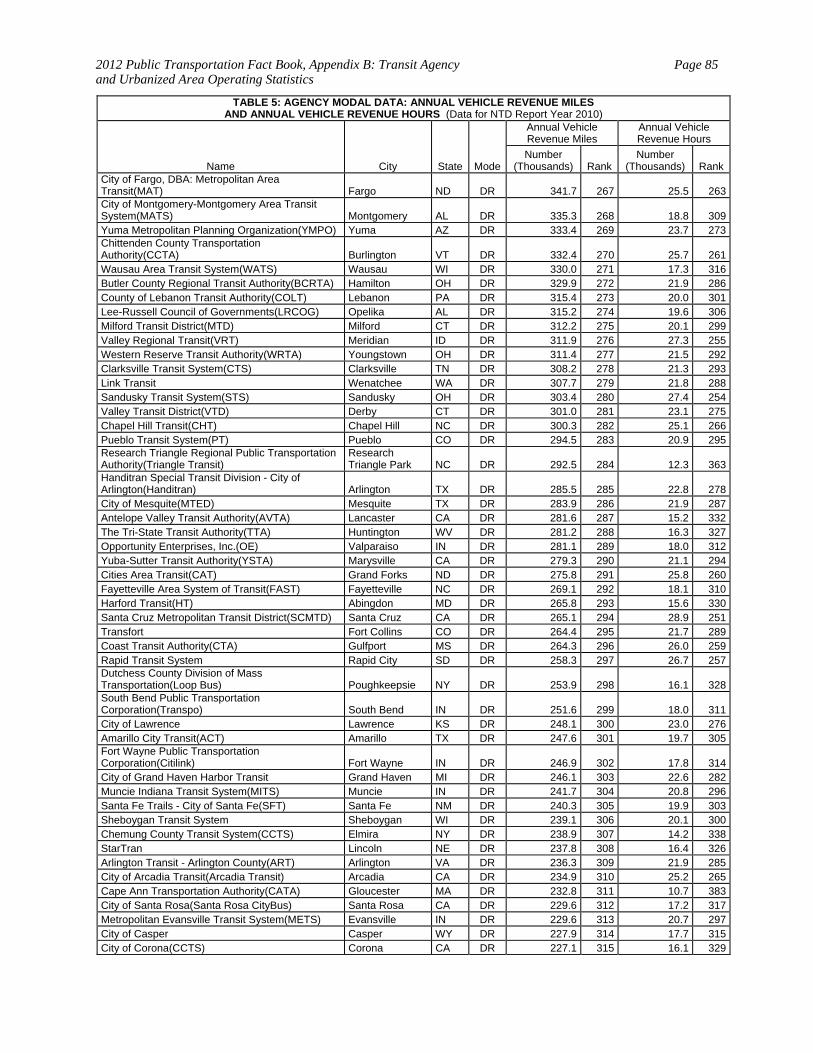
2012 Public Transportation Fact Book, Appendix B: Transit Agency and Urbanized Area Operating Statistics
Page 85
TABLE 5: AGENCY MODAL DATA: ANNUAL VEHICLE REVENUE MILES AND ANNUAL VEHICLE REVENUE HOURS (Data for NTD Report Year 2010)
Name City State Mode
Annual Vehicle Revenue Miles
Annual Vehicle Revenue Hours
Number (Thousands) Rank
Number (Thousands) Rank
City of Fargo, DBA: Metropolitan Area Transit(MAT) Fargo ND DR 341.7 267 25.5 263City of Montgomery-Montgomery Area Transit System(MATS) Montgomery AL DR 335.3 268 18.8 309Yuma Metropolitan Planning Organization(YMPO) Yuma AZ DR 333.4 269 23.7 273Chittenden County Transportation Authority(CCTA) Burlington VT DR 332.4 270 25.7 261Wausau Area Transit System(WATS) Wausau WI DR 330.0 271 17.3 316Butler County Regional Transit Authority(BCRTA) Hamilton OH DR 329.9 272 21.9 286County of Lebanon Transit Authority(COLT) Lebanon PA DR 315.4 273 20.0 301Lee-Russell Council of Governments(LRCOG) Opelika AL DR 315.2 274 19.6 306Milford Transit District(MTD) Milford CT DR 312.2 275 20.1 299Valley Regional Transit(VRT) Meridian ID DR 311.9 276 27.3 255Western Reserve Transit Authority(WRTA) Youngstown OH DR 311.4 277 21.5 292Clarksville Transit System(CTS) Clarksville TN DR 308.2 278 21.3 293Link Transit Wenatchee WA DR 307.7 279 21.8 288Sandusky Transit System(STS) Sandusky OH DR 303.4 280 27.4 254Valley Transit District(VTD) Derby CT DR 301.0 281 23.1 275Chapel Hill Transit(CHT) Chapel Hill NC DR 300.3 282 25.1 266Pueblo Transit System(PT) Pueblo CO DR 294.5 283 20.9 295Research Triangle Regional Public Transportation Authority(Triangle Transit)
Research Triangle Park NC DR 292.5 284 12.3 363
Handitran Special Transit Division - City of Arlington(Handitran) Arlington TX DR 285.5 285 22.8 278City of Mesquite(MTED) Mesquite TX DR 283.9 286 21.9 287Antelope Valley Transit Authority(AVTA) Lancaster CA DR 281.6 287 15.2 332The Tri-State Transit Authority(TTA) Huntington WV DR 281.2 288 16.3 327Opportunity Enterprises, Inc.(OE) Valparaiso IN DR 281.1 289 18.0 312Yuba-Sutter Transit Authority(YSTA) Marysville CA DR 279.3 290 21.1 294Cities Area Transit(CAT) Grand Forks ND DR 275.8 291 25.8 260Fayetteville Area System of Transit(FAST) Fayetteville NC DR 269.1 292 18.1 310Harford Transit(HT) Abingdon MD DR 265.8 293 15.6 330Santa Cruz Metropolitan Transit District(SCMTD) Santa Cruz CA DR 265.1 294 28.9 251Transfort Fort Collins CO DR 264.4 295 21.7 289Coast Transit Authority(CTA) Gulfport MS DR 264.3 296 26.0 259Rapid Transit System Rapid City SD DR 258.3 297 26.7 257Dutchess County Division of Mass Transportation(Loop Bus) Poughkeepsie NY DR 253.9 298 16.1 328South Bend Public Transportation Corporation(Transpo) South Bend IN DR 251.6 299 18.0 311City of Lawrence Lawrence KS DR 248.1 300 23.0 276Amarillo City Transit(ACT) Amarillo TX DR 247.6 301 19.7 305Fort Wayne Public Transportation Corporation(Citilink) Fort Wayne IN DR 246.9 302 17.8 314City of Grand Haven Harbor Transit Grand Haven MI DR 246.1 303 22.6 282Muncie Indiana Transit System(MITS) Muncie IN DR 241.7 304 20.8 296Santa Fe Trails - City of Santa Fe(SFT) Santa Fe NM DR 240.3 305 19.9 303Sheboygan Transit System Sheboygan WI DR 239.1 306 20.1 300Chemung County Transit System(CCTS) Elmira NY DR 238.9 307 14.2 338StarTran Lincoln NE DR 237.8 308 16.4 326Arlington Transit - Arlington County(ART) Arlington VA DR 236.3 309 21.9 285City of Arcadia Transit(Arcadia Transit) Arcadia CA DR 234.9 310 25.2 265Cape Ann Transportation Authority(CATA) Gloucester MA DR 232.8 311 10.7 383City of Santa Rosa(Santa Rosa CityBus) Santa Rosa CA DR 229.6 312 17.2 317Metropolitan Evansville Transit System(METS) Evansville IN DR 229.6 313 20.7 297City of Casper Casper WY DR 227.9 314 17.7 315City of Corona(CCTS) Corona CA DR 227.1 315 16.1 329
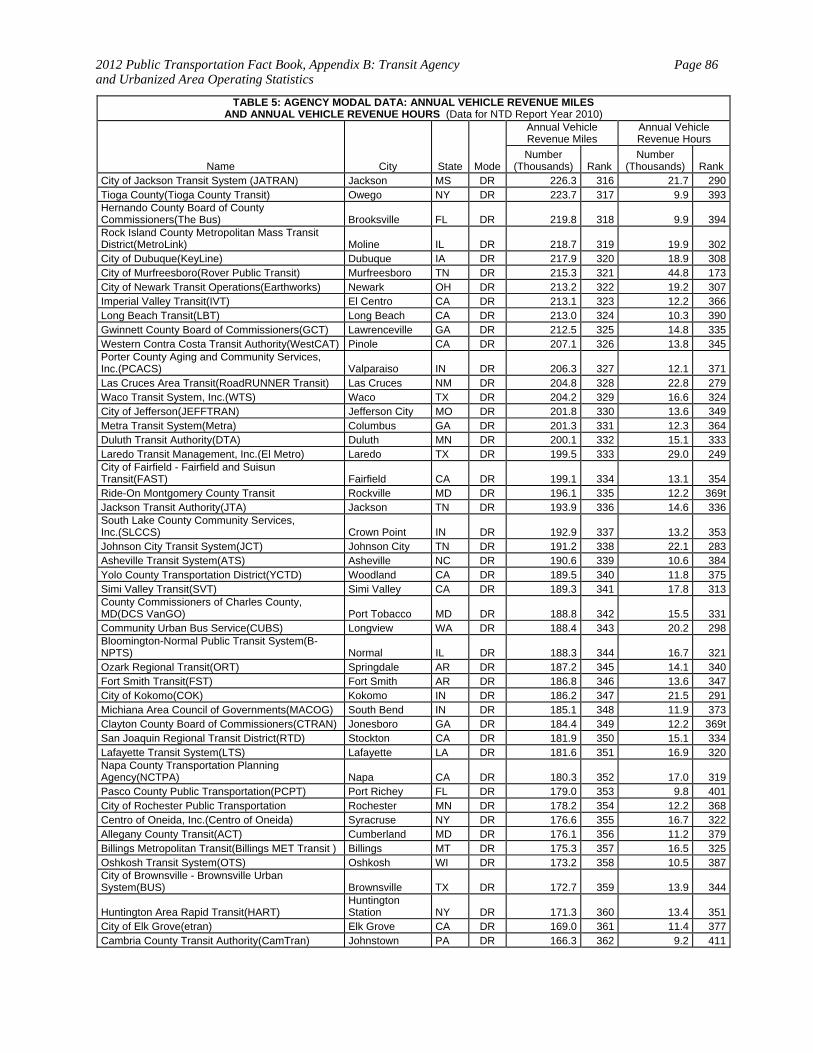
2012 Public Transportation Fact Book, Appendix B: Transit Agency and Urbanized Area Operating Statistics
Page 86
TABLE 5: AGENCY MODAL DATA: ANNUAL VEHICLE REVENUE MILES AND ANNUAL VEHICLE REVENUE HOURS (Data for NTD Report Year 2010)
Name City State Mode
Annual Vehicle Revenue Miles
Annual Vehicle Revenue Hours
Number (Thousands) Rank
Number (Thousands) Rank
City of Jackson Transit System (JATRAN) Jackson MS DR 226.3 316 21.7 290Tioga County(Tioga County Transit) Owego NY DR 223.7 317 9.9 393Hernando County Board of County Commissioners(The Bus) Brooksville FL DR 219.8 318 9.9 394Rock Island County Metropolitan Mass Transit District(MetroLink) Moline IL DR 218.7 319 19.9 302City of Dubuque(KeyLine) Dubuque IA DR 217.9 320 18.9 308City of Murfreesboro(Rover Public Transit) Murfreesboro TN DR 215.3 321 44.8 173City of Newark Transit Operations(Earthworks) Newark OH DR 213.2 322 19.2 307Imperial Valley Transit(IVT) El Centro CA DR 213.1 323 12.2 366Long Beach Transit(LBT) Long Beach CA DR 213.0 324 10.3 390Gwinnett County Board of Commissioners(GCT) Lawrenceville GA DR 212.5 325 14.8 335Western Contra Costa Transit Authority(WestCAT) Pinole CA DR 207.1 326 13.8 345Porter County Aging and Community Services, Inc.(PCACS) Valparaiso IN DR 206.3 327 12.1 371Las Cruces Area Transit(RoadRUNNER Transit) Las Cruces NM DR 204.8 328 22.8 279Waco Transit System, Inc.(WTS) Waco TX DR 204.2 329 16.6 324City of Jefferson(JEFFTRAN) Jefferson City MO DR 201.8 330 13.6 349Metra Transit System(Metra) Columbus GA DR 201.3 331 12.3 364Duluth Transit Authority(DTA) Duluth MN DR 200.1 332 15.1 333Laredo Transit Management, Inc.(El Metro) Laredo TX DR 199.5 333 29.0 249City of Fairfield - Fairfield and Suisun Transit(FAST) Fairfield CA DR 199.1 334 13.1 354Ride-On Montgomery County Transit Rockville MD DR 196.1 335 12.2 369tJackson Transit Authority(JTA) Jackson TN DR 193.9 336 14.6 336South Lake County Community Services, Inc.(SLCCS) Crown Point IN DR 192.9 337 13.2 353Johnson City Transit System(JCT) Johnson City TN DR 191.2 338 22.1 283Asheville Transit System(ATS) Asheville NC DR 190.6 339 10.6 384Yolo County Transportation District(YCTD) Woodland CA DR 189.5 340 11.8 375Simi Valley Transit(SVT) Simi Valley CA DR 189.3 341 17.8 313County Commissioners of Charles County, MD(DCS VanGO) Port Tobacco MD DR 188.8 342 15.5 331Community Urban Bus Service(CUBS) Longview WA DR 188.4 343 20.2 298Bloomington-Normal Public Transit System(B-NPTS) Normal IL DR 188.3 344 16.7 321Ozark Regional Transit(ORT) Springdale AR DR 187.2 345 14.1 340Fort Smith Transit(FST) Fort Smith AR DR 186.8 346 13.6 347City of Kokomo(COK) Kokomo IN DR 186.2 347 21.5 291Michiana Area Council of Governments(MACOG) South Bend IN DR 185.1 348 11.9 373Clayton County Board of Commissioners(CTRAN) Jonesboro GA DR 184.4 349 12.2 369tSan Joaquin Regional Transit District(RTD) Stockton CA DR 181.9 350 15.1 334Lafayette Transit System(LTS) Lafayette LA DR 181.6 351 16.9 320Napa County Transportation Planning Agency(NCTPA) Napa CA DR 180.3 352 17.0 319Pasco County Public Transportation(PCPT) Port Richey FL DR 179.0 353 9.8 401City of Rochester Public Transportation Rochester MN DR 178.2 354 12.2 368Centro of Oneida, Inc.(Centro of Oneida) Syracruse NY DR 176.6 355 16.7 322Allegany County Transit(ACT) Cumberland MD DR 176.1 356 11.2 379Billings Metropolitan Transit(Billings MET Transit ) Billings MT DR 175.3 357 16.5 325Oshkosh Transit System(OTS) Oshkosh WI DR 173.2 358 10.5 387City of Brownsville - Brownsville Urban System(BUS) Brownsville TX DR 172.7 359 13.9 344
Huntington Area Rapid Transit(HART) Huntington Station NY DR 171.3 360 13.4 351
City of Elk Grove(etran) Elk Grove CA DR 169.0 361 11.4 377Cambria County Transit Authority(CamTran) Johnstown PA DR 166.3 362 9.2 411
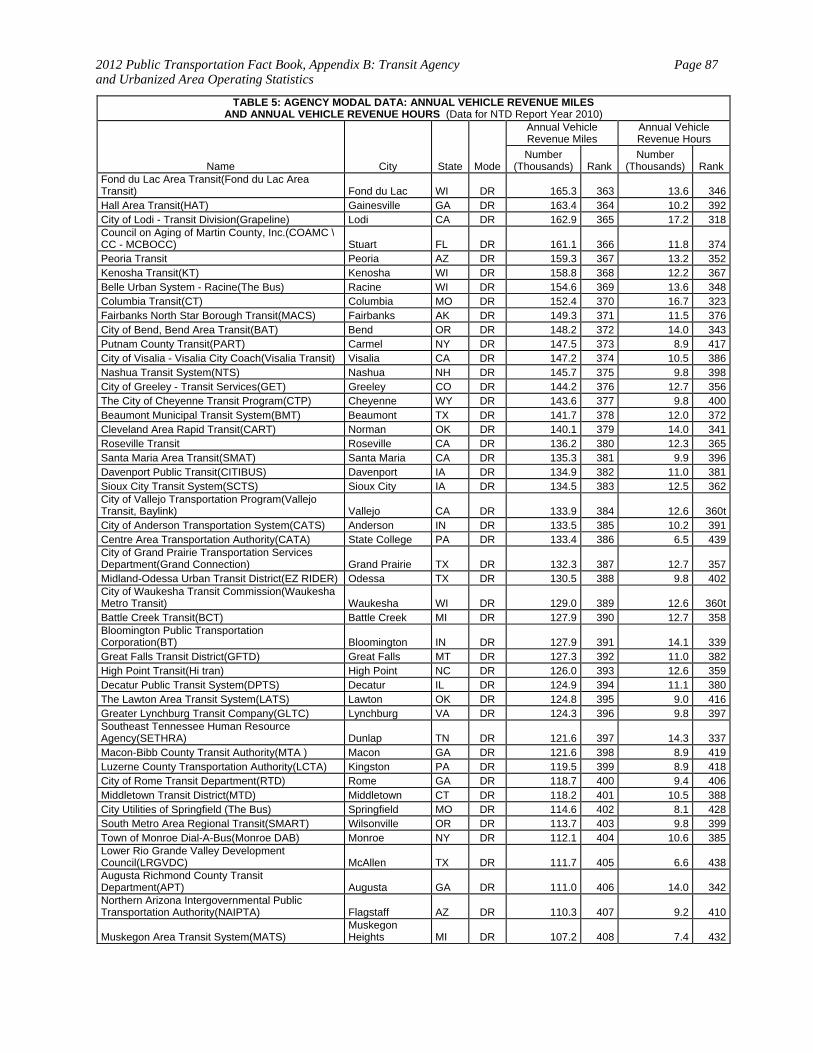
2012 Public Transportation Fact Book, Appendix B: Transit Agency and Urbanized Area Operating Statistics
Page 87
TABLE 5: AGENCY MODAL DATA: ANNUAL VEHICLE REVENUE MILES AND ANNUAL VEHICLE REVENUE HOURS (Data for NTD Report Year 2010)
Name City State Mode
Annual Vehicle Revenue Miles
Annual Vehicle Revenue Hours
Number (Thousands) Rank
Number (Thousands) Rank
Fond du Lac Area Transit(Fond du Lac Area Transit) Fond du Lac WI DR 165.3 363 13.6 346Hall Area Transit(HAT) Gainesville GA DR 163.4 364 10.2 392City of Lodi - Transit Division(Grapeline) Lodi CA DR 162.9 365 17.2 318Council on Aging of Martin County, Inc.(COAMC \CC - MCBOCC) Stuart FL DR 161.1 366 11.8 374Peoria Transit Peoria AZ DR 159.3 367 13.2 352Kenosha Transit(KT) Kenosha WI DR 158.8 368 12.2 367Belle Urban System - Racine(The Bus) Racine WI DR 154.6 369 13.6 348Columbia Transit(CT) Columbia MO DR 152.4 370 16.7 323Fairbanks North Star Borough Transit(MACS) Fairbanks AK DR 149.3 371 11.5 376City of Bend, Bend Area Transit(BAT) Bend OR DR 148.2 372 14.0 343Putnam County Transit(PART) Carmel NY DR 147.5 373 8.9 417City of Visalia - Visalia City Coach(Visalia Transit) Visalia CA DR 147.2 374 10.5 386Nashua Transit System(NTS) Nashua NH DR 145.7 375 9.8 398City of Greeley - Transit Services(GET) Greeley CO DR 144.2 376 12.7 356The City of Cheyenne Transit Program(CTP) Cheyenne WY DR 143.6 377 9.8 400Beaumont Municipal Transit System(BMT) Beaumont TX DR 141.7 378 12.0 372Cleveland Area Rapid Transit(CART) Norman OK DR 140.1 379 14.0 341Roseville Transit Roseville CA DR 136.2 380 12.3 365Santa Maria Area Transit(SMAT) Santa Maria CA DR 135.3 381 9.9 396Davenport Public Transit(CITIBUS) Davenport IA DR 134.9 382 11.0 381Sioux City Transit System(SCTS) Sioux City IA DR 134.5 383 12.5 362City of Vallejo Transportation Program(Vallejo Transit, Baylink) Vallejo CA DR 133.9 384 12.6 360tCity of Anderson Transportation System(CATS) Anderson IN DR 133.5 385 10.2 391Centre Area Transportation Authority(CATA) State College PA DR 133.4 386 6.5 439City of Grand Prairie Transportation Services Department(Grand Connection) Grand Prairie TX DR 132.3 387 12.7 357Midland-Odessa Urban Transit District(EZ RIDER) Odessa TX DR 130.5 388 9.8 402City of Waukesha Transit Commission(Waukesha Metro Transit) Waukesha WI DR 129.0 389 12.6 360tBattle Creek Transit(BCT) Battle Creek MI DR 127.9 390 12.7 358Bloomington Public Transportation Corporation(BT) Bloomington IN DR 127.9 391 14.1 339Great Falls Transit District(GFTD) Great Falls MT DR 127.3 392 11.0 382High Point Transit(Hi tran) High Point NC DR 126.0 393 12.6 359Decatur Public Transit System(DPTS) Decatur IL DR 124.9 394 11.1 380The Lawton Area Transit System(LATS) Lawton OK DR 124.8 395 9.0 416Greater Lynchburg Transit Company(GLTC) Lynchburg VA DR 124.3 396 9.8 397Southeast Tennessee Human Resource Agency(SETHRA) Dunlap TN DR 121.6 397 14.3 337Macon-Bibb County Transit Authority(MTA ) Macon GA DR 121.6 398 8.9 419Luzerne County Transportation Authority(LCTA) Kingston PA DR 119.5 399 8.9 418City of Rome Transit Department(RTD) Rome GA DR 118.7 400 9.4 406Middletown Transit District(MTD) Middletown CT DR 118.2 401 10.5 388City Utilities of Springfield (The Bus) Springfield MO DR 114.6 402 8.1 428South Metro Area Regional Transit(SMART) Wilsonville OR DR 113.7 403 9.8 399Town of Monroe Dial-A-Bus(Monroe DAB) Monroe NY DR 112.1 404 10.6 385Lower Rio Grande Valley Development Council(LRGVDC) McAllen TX DR 111.7 405 6.6 438Augusta Richmond County Transit Department(APT) Augusta GA DR 111.0 406 14.0 342Northern Arizona Intergovernmental Public Transportation Authority(NAIPTA) Flagstaff AZ DR 110.3 407 9.2 410
Muskegon Area Transit System(MATS) Muskegon Heights MI DR 107.2 408 7.4 432
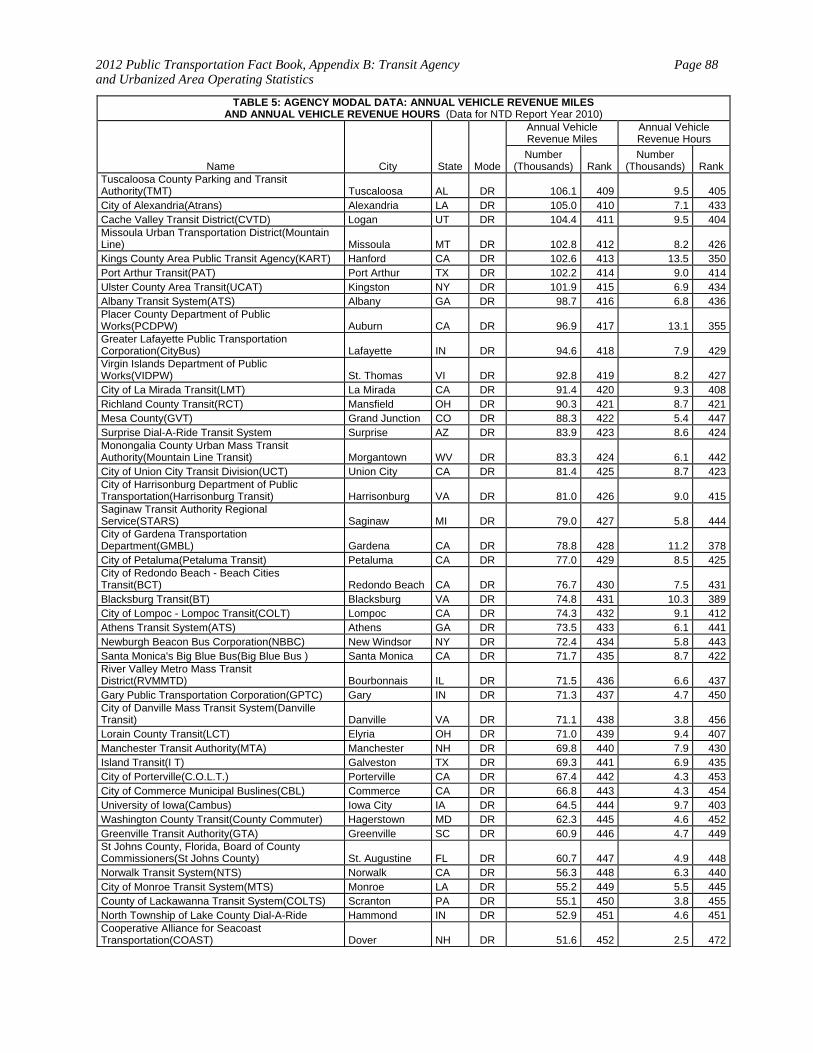
2012 Public Transportation Fact Book, Appendix B: Transit Agency and Urbanized Area Operating Statistics
Page 88
TABLE 5: AGENCY MODAL DATA: ANNUAL VEHICLE REVENUE MILES AND ANNUAL VEHICLE REVENUE HOURS (Data for NTD Report Year 2010)
Name City State Mode
Annual Vehicle Revenue Miles
Annual Vehicle Revenue Hours
Number (Thousands) Rank
Number (Thousands) Rank
Tuscaloosa County Parking and Transit Authority(TMT) Tuscaloosa AL DR 106.1 409 9.5 405City of Alexandria(Atrans) Alexandria LA DR 105.0 410 7.1 433Cache Valley Transit District(CVTD) Logan UT DR 104.4 411 9.5 404Missoula Urban Transportation District(Mountain Line) Missoula MT DR 102.8 412 8.2 426Kings County Area Public Transit Agency(KART) Hanford CA DR 102.6 413 13.5 350Port Arthur Transit(PAT) Port Arthur TX DR 102.2 414 9.0 414Ulster County Area Transit(UCAT) Kingston NY DR 101.9 415 6.9 434Albany Transit System(ATS) Albany GA DR 98.7 416 6.8 436Placer County Department of Public Works(PCDPW) Auburn CA DR 96.9 417 13.1 355Greater Lafayette Public Transportation Corporation(CityBus) Lafayette IN DR 94.6 418 7.9 429Virgin Islands Department of Public Works(VIDPW) St. Thomas VI DR 92.8 419 8.2 427City of La Mirada Transit(LMT) La Mirada CA DR 91.4 420 9.3 408Richland County Transit(RCT) Mansfield OH DR 90.3 421 8.7 421Mesa County(GVT) Grand Junction CO DR 88.3 422 5.4 447Surprise Dial-A-Ride Transit System Surprise AZ DR 83.9 423 8.6 424Monongalia County Urban Mass Transit Authority(Mountain Line Transit) Morgantown WV DR 83.3 424 6.1 442City of Union City Transit Division(UCT) Union City CA DR 81.4 425 8.7 423City of Harrisonburg Department of Public Transportation(Harrisonburg Transit) Harrisonburg VA DR 81.0 426 9.0 415Saginaw Transit Authority Regional Service(STARS) Saginaw MI DR 79.0 427 5.8 444City of Gardena Transportation Department(GMBL) Gardena CA DR 78.8 428 11.2 378City of Petaluma(Petaluma Transit) Petaluma CA DR 77.0 429 8.5 425City of Redondo Beach - Beach Cities Transit(BCT) Redondo Beach CA DR 76.7 430 7.5 431Blacksburg Transit(BT) Blacksburg VA DR 74.8 431 10.3 389City of Lompoc - Lompoc Transit(COLT) Lompoc CA DR 74.3 432 9.1 412Athens Transit System(ATS) Athens GA DR 73.5 433 6.1 441Newburgh Beacon Bus Corporation(NBBC) New Windsor NY DR 72.4 434 5.8 443Santa Monica's Big Blue Bus(Big Blue Bus ) Santa Monica CA DR 71.7 435 8.7 422River Valley Metro Mass Transit District(RVMMTD) Bourbonnais IL DR 71.5 436 6.6 437Gary Public Transportation Corporation(GPTC) Gary IN DR 71.3 437 4.7 450City of Danville Mass Transit System(Danville Transit) Danville VA DR 71.1 438 3.8 456Lorain County Transit(LCT) Elyria OH DR 71.0 439 9.4 407Manchester Transit Authority(MTA) Manchester NH DR 69.8 440 7.9 430Island Transit(I T) Galveston TX DR 69.3 441 6.9 435City of Porterville(C.O.L.T.) Porterville CA DR 67.4 442 4.3 453City of Commerce Municipal Buslines(CBL) Commerce CA DR 66.8 443 4.3 454University of Iowa(Cambus) Iowa City IA DR 64.5 444 9.7 403Washington County Transit(County Commuter) Hagerstown MD DR 62.3 445 4.6 452Greenville Transit Authority(GTA) Greenville SC DR 60.9 446 4.7 449St Johns County, Florida, Board of County Commissioners(St Johns County) St. Augustine FL DR 60.7 447 4.9 448Norwalk Transit System(NTS) Norwalk CA DR 56.3 448 6.3 440City of Monroe Transit System(MTS) Monroe LA DR 55.2 449 5.5 445County of Lackawanna Transit System(COLTS) Scranton PA DR 55.1 450 3.8 455North Township of Lake County Dial-A-Ride Hammond IN DR 52.9 451 4.6 451Cooperative Alliance for Seacoast Transportation(COAST) Dover NH DR 51.6 452 2.5 472
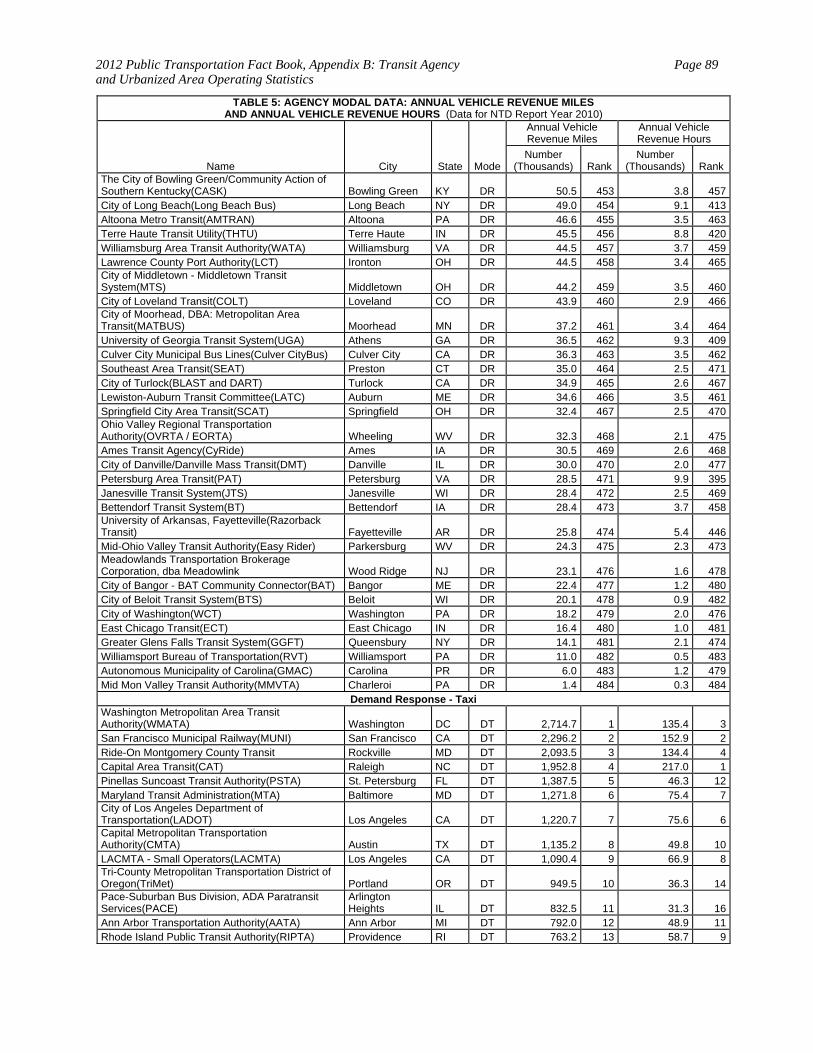
2012 Public Transportation Fact Book, Appendix B: Transit Agency and Urbanized Area Operating Statistics
Page 89
TABLE 5: AGENCY MODAL DATA: ANNUAL VEHICLE REVENUE MILES AND ANNUAL VEHICLE REVENUE HOURS (Data for NTD Report Year 2010)
Name City State Mode
Annual Vehicle Revenue Miles
Annual Vehicle Revenue Hours
Number (Thousands) Rank
Number (Thousands) Rank
The City of Bowling Green/Community Action of Southern Kentucky(CASK) Bowling Green KY DR 50.5 453 3.8 457City of Long Beach(Long Beach Bus) Long Beach NY DR 49.0 454 9.1 413Altoona Metro Transit(AMTRAN) Altoona PA DR 46.6 455 3.5 463Terre Haute Transit Utility(THTU) Terre Haute IN DR 45.5 456 8.8 420Williamsburg Area Transit Authority(WATA) Williamsburg VA DR 44.5 457 3.7 459Lawrence County Port Authority(LCT) Ironton OH DR 44.5 458 3.4 465City of Middletown - Middletown Transit System(MTS) Middletown OH DR 44.2 459 3.5 460City of Loveland Transit(COLT) Loveland CO DR 43.9 460 2.9 466City of Moorhead, DBA: Metropolitan Area Transit(MATBUS) Moorhead MN DR 37.2 461 3.4 464University of Georgia Transit System(UGA) Athens GA DR 36.5 462 9.3 409Culver City Municipal Bus Lines(Culver CityBus) Culver City CA DR 36.3 463 3.5 462Southeast Area Transit(SEAT) Preston CT DR 35.0 464 2.5 471City of Turlock(BLAST and DART) Turlock CA DR 34.9 465 2.6 467Lewiston-Auburn Transit Committee(LATC) Auburn ME DR 34.6 466 3.5 461Springfield City Area Transit(SCAT) Springfield OH DR 32.4 467 2.5 470Ohio Valley Regional Transportation Authority(OVRTA / EORTA) Wheeling WV DR 32.3 468 2.1 475Ames Transit Agency(CyRide) Ames IA DR 30.5 469 2.6 468City of Danville/Danville Mass Transit(DMT) Danville IL DR 30.0 470 2.0 477Petersburg Area Transit(PAT) Petersburg VA DR 28.5 471 9.9 395Janesville Transit System(JTS) Janesville WI DR 28.4 472 2.5 469Bettendorf Transit System(BT) Bettendorf IA DR 28.4 473 3.7 458University of Arkansas, Fayetteville(Razorback Transit) Fayetteville AR DR 25.8 474 5.4 446Mid-Ohio Valley Transit Authority(Easy Rider) Parkersburg WV DR 24.3 475 2.3 473Meadowlands Transportation Brokerage Corporation, dba Meadowlink Wood Ridge NJ DR 23.1 476 1.6 478City of Bangor - BAT Community Connector(BAT) Bangor ME DR 22.4 477 1.2 480City of Beloit Transit System(BTS) Beloit WI DR 20.1 478 0.9 482City of Washington(WCT) Washington PA DR 18.2 479 2.0 476East Chicago Transit(ECT) East Chicago IN DR 16.4 480 1.0 481Greater Glens Falls Transit System(GGFT) Queensbury NY DR 14.1 481 2.1 474Williamsport Bureau of Transportation(RVT) Williamsport PA DR 11.0 482 0.5 483Autonomous Municipality of Carolina(GMAC) Carolina PR DR 6.0 483 1.2 479Mid Mon Valley Transit Authority(MMVTA) Charleroi PA DR 1.4 484 0.3 484
Demand Response - Taxi Washington Metropolitan Area Transit Authority(WMATA) Washington DC DT 2,714.7 1 135.4 3San Francisco Municipal Railway(MUNI) San Francisco CA DT 2,296.2 2 152.9 2Ride-On Montgomery County Transit Rockville MD DT 2,093.5 3 134.4 4Capital Area Transit(CAT) Raleigh NC DT 1,952.8 4 217.0 1Pinellas Suncoast Transit Authority(PSTA) St. Petersburg FL DT 1,387.5 5 46.3 12Maryland Transit Administration(MTA) Baltimore MD DT 1,271.8 6 75.4 7City of Los Angeles Department of Transportation(LADOT) Los Angeles CA DT 1,220.7 7 75.6 6Capital Metropolitan Transportation Authority(CMTA) Austin TX DT 1,135.2 8 49.8 10LACMTA - Small Operators(LACMTA) Los Angeles CA DT 1,090.4 9 66.9 8Tri-County Metropolitan Transportation District of Oregon(TriMet) Portland OR DT 949.5 10 36.3 14Pace-Suburban Bus Division, ADA Paratransit Services(PACE)
Arlington Heights IL DT 832.5 11 31.3 16
Ann Arbor Transportation Authority(AATA) Ann Arbor MI DT 792.0 12 48.9 11Rhode Island Public Transit Authority(RIPTA) Providence RI DT 763.2 13 58.7 9

2012 Public Transportation Fact Book, Appendix B: Transit Agency and Urbanized Area Operating Statistics
Page 90
TABLE 5: AGENCY MODAL DATA: ANNUAL VEHICLE REVENUE MILES AND ANNUAL VEHICLE REVENUE HOURS (Data for NTD Report Year 2010)
Name City State Mode
Annual Vehicle Revenue Miles
Annual Vehicle Revenue Hours
Number (Thousands) Rank
Number (Thousands) Rank
Lane Transit District(LTD) Eugene OR DT 760.7 14 26.1 21City of Kokomo(COK) Kokomo IN DT 736.7 15 77.6 5Metropolitan Transit Authority of Harris County, Texas(Metro) Houston TX DT 713.8 16 28.5 17Harris County Community Services Department, Office of Transit Services(Harris County Transit) Houston TX DT 588.1 17 39.4 13
Pace - Suburban Bus Division(PACE) Arlington Heights IL DT 545.1 18 21.1 26
Metropolitan Transit Authority(MTA) Nashville TN DT 541.3 19 12.6 33King County Department of Transportation - Metro Transit Division(King County Metro) Seattle WA DT 526.0 20 20.2 28Wiregrass Transit Authority Dothan AL DT 446.5 21 22.7 23Transit Authority of River City(TARC) Louisville KY DT 433.3 22 33.1 15Ben Franklin Transit(BFT) Richland WA DT 425.7 23 18.9 29Worcester Regional Transit Authority(WRTA) Worcester MA DT 388.6 24 27.9 18METRO Regional Transit Authority(METRO) Akron OH DT 380.7 25 21.7 24Oshkosh Transit System(OTS) Oshkosh WI DT 376.0 26 26.7 20Handitran Special Transit Division - City of Arlington(Handitran) Arlington TX DT 363.5 27 21.4 25Torrance Transit System(TTS) Torrance CA DT 353.3 28 17.3 31Pasco County Public Transportation(PCPT) Port Richey FL DT 352.8 29 20.7 27City and County of Honolulu Department of Transportation Services(DTS) Honolulu HI DT 349.8 30 23.9 22City of Alexandria (DASH) Alexandria VA DT 325.7 31 27.3 19San Mateo County Transit District(SamTrans) San Carlos CA DT 303.5 32 10.7 35Arlington Transit - Arlington County(ART) Arlington VA DT 137.9 33 18.1 30StarTran Lincoln NE DT 135.4 34 6.4 39Riverside Transit Agency(RTA) Riverside CA DT 134.8 35 4.6 46Mass Transit Department - City of El Paso(Sun Metro) El Paso TX DT 121.7 36 5.4 43The Gulf Coast Center(Connect Transit) Texas City TX DT 112.7 37 7.4 38Regional Transportation Commission of Washoe County(RTC) Reno NV DT 112.6 38 2.9 54CNY Centro, Inc. (CNY Centro ) Syracuse NY DT 111.7 39 11.8 34Regional Public Transportation Authority, dba: Valley Metro(RPTA) Phoenix AZ DT 110.8 40 5.3 44Des Moines Area Regional Transit Authority(DART) Des Moines IA DT 110.1 41 6.1 41Orange County Transportation Authority(OCTA) Orange CA DT 109.3 42 9.4 36Montebello Bus Lines(MBL) Montebello CA DT 104.5 43 7.6 37Kansas City Area Transportation Authority(KCATA) Kansas City MO DT 86.3 44 3.8 48Westmoreland County Transit Authority(WCTA) Greensburg PA DT 77.6 45 3.1 53Fond du Lac Area Transit(Fond du Lac Area Transit) Fond du Lac WI DT 71.8 46 3.8 49Capital District Transportation Authority(CDTA) Albany NY DT 69.5 47 13.5 32Central Oklahoma Transportation and Parking Authority(COTPA) Oklahoma City OK DT 69.4 48 4.4 47Santa Cruz Metropolitan Transit District(SCMTD) Santa Cruz CA DT 68.9 49 5.9 42York County Transportation Authority(rabbittransit) York PA DT 68.6 50 3.4 52City of Bangor - BAT Community Connector(BAT) Bangor ME DT 67.9 51 3.4 51San Joaquin Regional Transit District(RTD) Stockton CA DT 67.8 52 2.5 55Interurban Transit Partnership(The Rapid) Grand Rapids MI DT 45.2 53 6.2 40Capital Area Transit(CAT) Harrisburg PA DT 40.7 54 1.8 59Decatur Public Transit System(DPTS) Decatur IL DT 39.3 55 2.1 57NWI Regional Bus Authority(RBA) Portage IN DT 36.8 56 2.2 56Utah Transit Authority(UTA) Salt Lake City UT DT 32.3 57 4.8 45Montachusett Regional Transit Authority(MART) Fitchburg MA DT 27.2 58 0.9 61
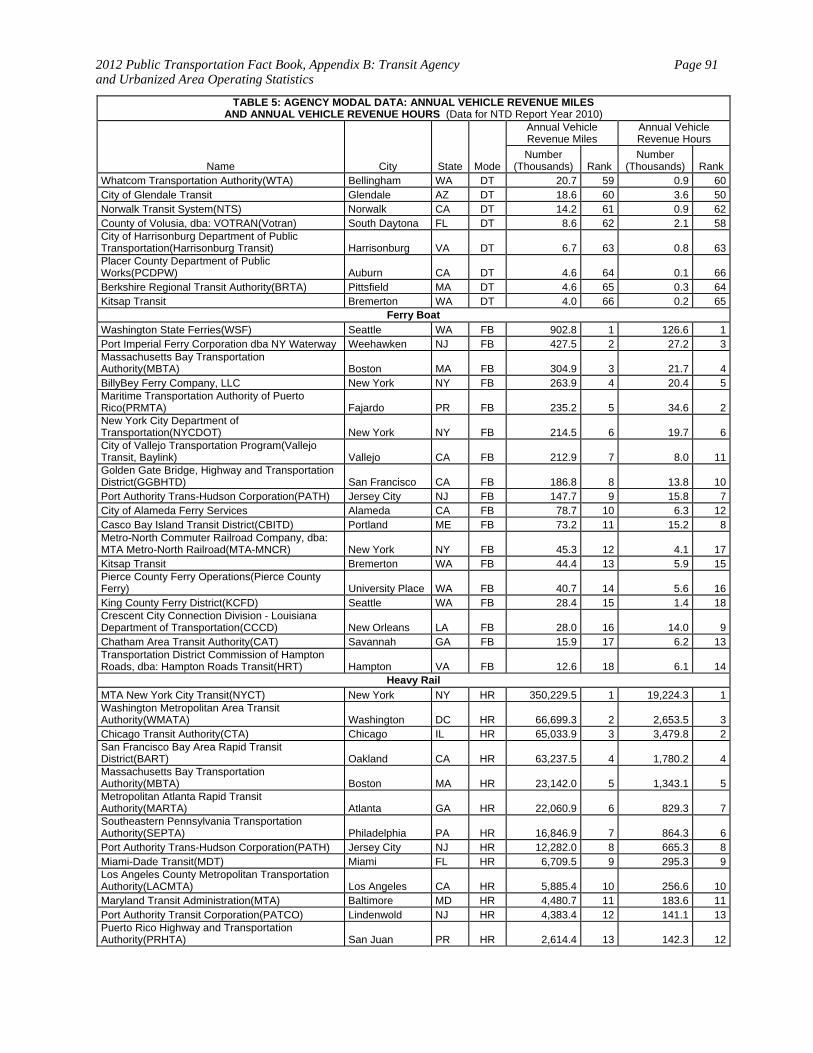
2012 Public Transportation Fact Book, Appendix B: Transit Agency and Urbanized Area Operating Statistics
Page 91
TABLE 5: AGENCY MODAL DATA: ANNUAL VEHICLE REVENUE MILES AND ANNUAL VEHICLE REVENUE HOURS (Data for NTD Report Year 2010)
Name City State Mode
Annual Vehicle Revenue Miles
Annual Vehicle Revenue Hours
Number (Thousands) Rank
Number (Thousands) Rank
Whatcom Transportation Authority(WTA) Bellingham WA DT 20.7 59 0.9 60City of Glendale Transit Glendale AZ DT 18.6 60 3.6 50Norwalk Transit System(NTS) Norwalk CA DT 14.2 61 0.9 62County of Volusia, dba: VOTRAN(Votran) South Daytona FL DT 8.6 62 2.1 58City of Harrisonburg Department of Public Transportation(Harrisonburg Transit) Harrisonburg VA DT 6.7 63 0.8 63Placer County Department of Public Works(PCDPW) Auburn CA DT 4.6 64 0.1 66Berkshire Regional Transit Authority(BRTA) Pittsfield MA DT 4.6 65 0.3 64Kitsap Transit Bremerton WA DT 4.0 66 0.2 65
Ferry Boat
Washington State Ferries(WSF) Seattle WA FB 902.8 1 126.6 1Port Imperial Ferry Corporation dba NY Waterway Weehawken NJ FB 427.5 2 27.2 3Massachusetts Bay Transportation Authority(MBTA) Boston MA FB 304.9 3 21.7 4BillyBey Ferry Company, LLC New York NY FB 263.9 4 20.4 5Maritime Transportation Authority of Puerto Rico(PRMTA) Fajardo PR FB 235.2 5 34.6 2New York City Department of Transportation(NYCDOT) New York NY FB 214.5 6 19.7 6City of Vallejo Transportation Program(Vallejo Transit, Baylink) Vallejo CA FB 212.9 7 8.0 11Golden Gate Bridge, Highway and Transportation District(GGBHTD) San Francisco CA FB 186.8 8 13.8 10Port Authority Trans-Hudson Corporation(PATH) Jersey City NJ FB 147.7 9 15.8 7City of Alameda Ferry Services Alameda CA FB 78.7 10 6.3 12Casco Bay Island Transit District(CBITD) Portland ME FB 73.2 11 15.2 8Metro-North Commuter Railroad Company, dba: MTA Metro-North Railroad(MTA-MNCR) New York NY FB 45.3 12 4.1 17Kitsap Transit Bremerton WA FB 44.4 13 5.9 15Pierce County Ferry Operations(Pierce County Ferry) University Place WA FB 40.7 14 5.6 16King County Ferry District(KCFD) Seattle WA FB 28.4 15 1.4 18Crescent City Connection Division - Louisiana Department of Transportation(CCCD) New Orleans LA FB 28.0 16 14.0 9Chatham Area Transit Authority(CAT) Savannah GA FB 15.9 17 6.2 13Transportation District Commission of Hampton Roads, dba: Hampton Roads Transit(HRT) Hampton VA FB 12.6 18 6.1 14
Heavy Rail
MTA New York City Transit(NYCT) New York NY HR 350,229.5 1 19,224.3 1Washington Metropolitan Area Transit Authority(WMATA) Washington DC HR 66,699.3 2 2,653.5 3Chicago Transit Authority(CTA) Chicago IL HR 65,033.9 3 3,479.8 2San Francisco Bay Area Rapid Transit District(BART) Oakland CA HR 63,237.5 4 1,780.2 4Massachusetts Bay Transportation Authority(MBTA) Boston MA HR 23,142.0 5 1,343.1 5Metropolitan Atlanta Rapid Transit Authority(MARTA) Atlanta GA HR 22,060.9 6 829.3 7Southeastern Pennsylvania Transportation Authority(SEPTA) Philadelphia PA HR 16,846.9 7 864.3 6Port Authority Trans-Hudson Corporation(PATH) Jersey City NJ HR 12,282.0 8 665.3 8Miami-Dade Transit(MDT) Miami FL HR 6,709.5 9 295.3 9Los Angeles County Metropolitan Transportation Authority(LACMTA) Los Angeles CA HR 5,885.4 10 256.6 10Maryland Transit Administration(MTA) Baltimore MD HR 4,480.7 11 183.6 11Port Authority Transit Corporation(PATCO) Lindenwold NJ HR 4,383.4 12 141.1 13Puerto Rico Highway and Transportation Authority(PRHTA) San Juan PR HR 2,614.4 13 142.3 12
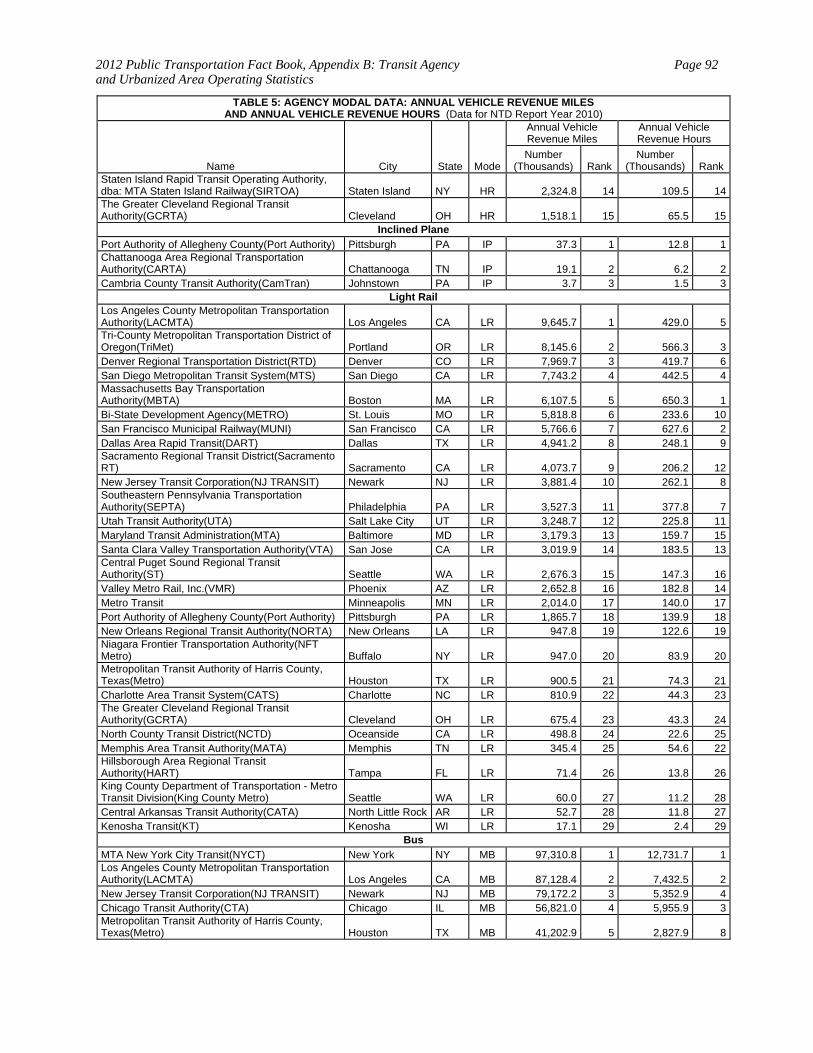
2012 Public Transportation Fact Book, Appendix B: Transit Agency and Urbanized Area Operating Statistics
Page 92
TABLE 5: AGENCY MODAL DATA: ANNUAL VEHICLE REVENUE MILES AND ANNUAL VEHICLE REVENUE HOURS (Data for NTD Report Year 2010)
Name City State Mode
Annual Vehicle Revenue Miles
Annual Vehicle Revenue Hours
Number (Thousands) Rank
Number (Thousands) Rank
Staten Island Rapid Transit Operating Authority, dba: MTA Staten Island Railway(SIRTOA) Staten Island NY HR 2,324.8 14 109.5 14The Greater Cleveland Regional Transit Authority(GCRTA) Cleveland OH HR 1,518.1 15 65.5 15
Inclined Plane
Port Authority of Allegheny County(Port Authority) Pittsburgh PA IP 37.3 1 12.8 1Chattanooga Area Regional Transportation Authority(CARTA) Chattanooga TN IP 19.1 2 6.2 2Cambria County Transit Authority(CamTran) Johnstown PA IP 3.7 3 1.5 3
Light Rail Los Angeles County Metropolitan Transportation Authority(LACMTA) Los Angeles CA LR 9,645.7 1 429.0 5Tri-County Metropolitan Transportation District of Oregon(TriMet) Portland OR LR 8,145.6 2 566.3 3Denver Regional Transportation District(RTD) Denver CO LR 7,969.7 3 419.7 6San Diego Metropolitan Transit System(MTS) San Diego CA LR 7,743.2 4 442.5 4Massachusetts Bay Transportation Authority(MBTA) Boston MA LR 6,107.5 5 650.3 1Bi-State Development Agency(METRO) St. Louis MO LR 5,818.8 6 233.6 10San Francisco Municipal Railway(MUNI) San Francisco CA LR 5,766.6 7 627.6 2Dallas Area Rapid Transit(DART) Dallas TX LR 4,941.2 8 248.1 9Sacramento Regional Transit District(Sacramento RT) Sacramento CA LR 4,073.7 9 206.2 12New Jersey Transit Corporation(NJ TRANSIT) Newark NJ LR 3,881.4 10 262.1 8Southeastern Pennsylvania Transportation Authority(SEPTA) Philadelphia PA LR 3,527.3 11 377.8 7Utah Transit Authority(UTA) Salt Lake City UT LR 3,248.7 12 225.8 11Maryland Transit Administration(MTA) Baltimore MD LR 3,179.3 13 159.7 15Santa Clara Valley Transportation Authority(VTA) San Jose CA LR 3,019.9 14 183.5 13Central Puget Sound Regional Transit Authority(ST) Seattle WA LR 2,676.3 15 147.3 16Valley Metro Rail, Inc.(VMR) Phoenix AZ LR 2,652.8 16 182.8 14Metro Transit Minneapolis MN LR 2,014.0 17 140.0 17Port Authority of Allegheny County(Port Authority) Pittsburgh PA LR 1,865.7 18 139.9 18New Orleans Regional Transit Authority(NORTA) New Orleans LA LR 947.8 19 122.6 19Niagara Frontier Transportation Authority(NFT Metro) Buffalo NY LR 947.0 20 83.9 20Metropolitan Transit Authority of Harris County, Texas(Metro) Houston TX LR 900.5 21 74.3 21Charlotte Area Transit System(CATS) Charlotte NC LR 810.9 22 44.3 23The Greater Cleveland Regional Transit Authority(GCRTA) Cleveland OH LR 675.4 23 43.3 24North County Transit District(NCTD) Oceanside CA LR 498.8 24 22.6 25Memphis Area Transit Authority(MATA) Memphis TN LR 345.4 25 54.6 22Hillsborough Area Regional Transit Authority(HART) Tampa FL LR 71.4 26 13.8 26King County Department of Transportation - Metro Transit Division(King County Metro) Seattle WA LR 60.0 27 11.2 28Central Arkansas Transit Authority(CATA) North Little Rock AR LR 52.7 28 11.8 27Kenosha Transit(KT) Kenosha WI LR 17.1 29 2.4 29
Bus
MTA New York City Transit(NYCT) New York NY MB 97,310.8 1 12,731.7 1Los Angeles County Metropolitan Transportation Authority(LACMTA) Los Angeles CA MB 87,128.4 2 7,432.5 2New Jersey Transit Corporation(NJ TRANSIT) Newark NJ MB 79,172.2 3 5,352.9 4Chicago Transit Authority(CTA) Chicago IL MB 56,821.0 4 5,955.9 3Metropolitan Transit Authority of Harris County, Texas(Metro) Houston TX MB 41,202.9 5 2,827.9 8
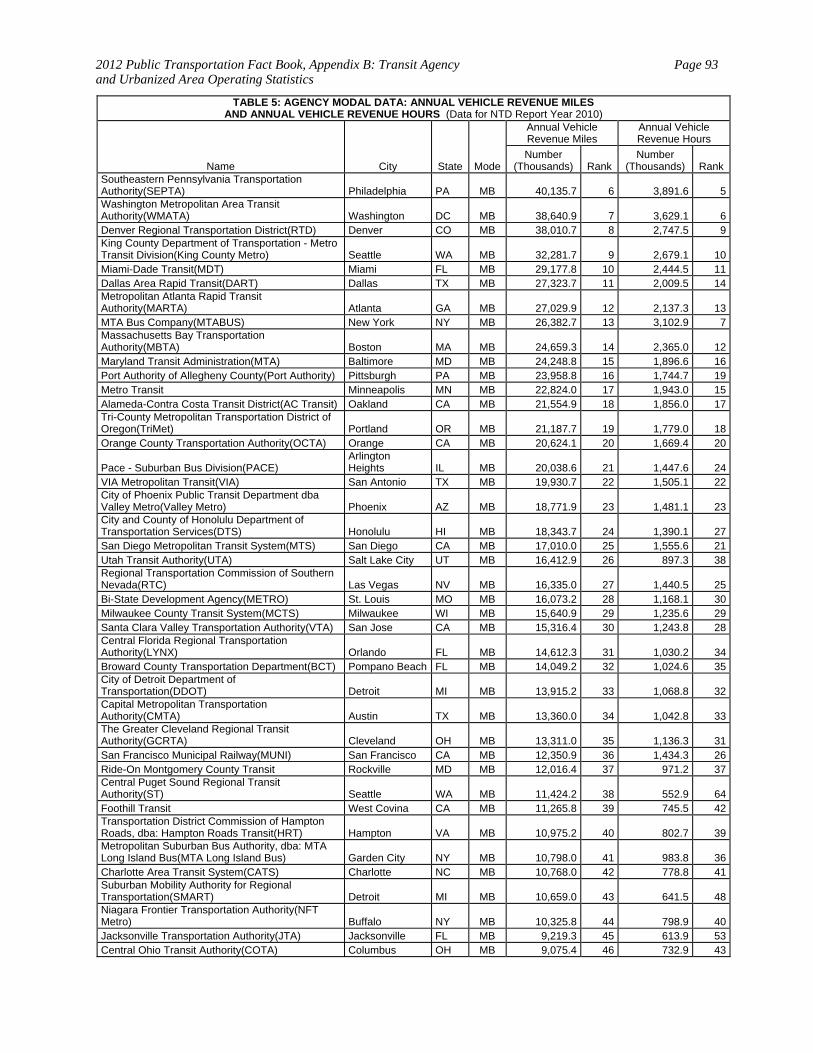
2012 Public Transportation Fact Book, Appendix B: Transit Agency and Urbanized Area Operating Statistics
Page 93
TABLE 5: AGENCY MODAL DATA: ANNUAL VEHICLE REVENUE MILES AND ANNUAL VEHICLE REVENUE HOURS (Data for NTD Report Year 2010)
Name City State Mode
Annual Vehicle Revenue Miles
Annual Vehicle Revenue Hours
Number (Thousands) Rank
Number (Thousands) Rank
Southeastern Pennsylvania Transportation Authority(SEPTA) Philadelphia PA MB 40,135.7 6 3,891.6 5Washington Metropolitan Area Transit Authority(WMATA) Washington DC MB 38,640.9 7 3,629.1 6Denver Regional Transportation District(RTD) Denver CO MB 38,010.7 8 2,747.5 9King County Department of Transportation - Metro Transit Division(King County Metro) Seattle WA MB 32,281.7 9 2,679.1 10Miami-Dade Transit(MDT) Miami FL MB 29,177.8 10 2,444.5 11Dallas Area Rapid Transit(DART) Dallas TX MB 27,323.7 11 2,009.5 14Metropolitan Atlanta Rapid Transit Authority(MARTA) Atlanta GA MB 27,029.9 12 2,137.3 13MTA Bus Company(MTABUS) New York NY MB 26,382.7 13 3,102.9 7Massachusetts Bay Transportation Authority(MBTA) Boston MA MB 24,659.3 14 2,365.0 12Maryland Transit Administration(MTA) Baltimore MD MB 24,248.8 15 1,896.6 16Port Authority of Allegheny County(Port Authority) Pittsburgh PA MB 23,958.8 16 1,744.7 19Metro Transit Minneapolis MN MB 22,824.0 17 1,943.0 15Alameda-Contra Costa Transit District(AC Transit) Oakland CA MB 21,554.9 18 1,856.0 17Tri-County Metropolitan Transportation District of Oregon(TriMet) Portland OR MB 21,187.7 19 1,779.0 18Orange County Transportation Authority(OCTA) Orange CA MB 20,624.1 20 1,669.4 20
Pace - Suburban Bus Division(PACE) Arlington Heights IL MB 20,038.6 21 1,447.6 24
VIA Metropolitan Transit(VIA) San Antonio TX MB 19,930.7 22 1,505.1 22City of Phoenix Public Transit Department dba Valley Metro(Valley Metro) Phoenix AZ MB 18,771.9 23 1,481.1 23City and County of Honolulu Department of Transportation Services(DTS) Honolulu HI MB 18,343.7 24 1,390.1 27San Diego Metropolitan Transit System(MTS) San Diego CA MB 17,010.0 25 1,555.6 21Utah Transit Authority(UTA) Salt Lake City UT MB 16,412.9 26 897.3 38Regional Transportation Commission of Southern Nevada(RTC) Las Vegas NV MB 16,335.0 27 1,440.5 25Bi-State Development Agency(METRO) St. Louis MO MB 16,073.2 28 1,168.1 30Milwaukee County Transit System(MCTS) Milwaukee WI MB 15,640.9 29 1,235.6 29Santa Clara Valley Transportation Authority(VTA) San Jose CA MB 15,316.4 30 1,243.8 28Central Florida Regional Transportation Authority(LYNX) Orlando FL MB 14,612.3 31 1,030.2 34Broward County Transportation Department(BCT) Pompano Beach FL MB 14,049.2 32 1,024.6 35City of Detroit Department of Transportation(DDOT) Detroit MI MB 13,915.2 33 1,068.8 32Capital Metropolitan Transportation Authority(CMTA) Austin TX MB 13,360.0 34 1,042.8 33The Greater Cleveland Regional Transit Authority(GCRTA) Cleveland OH MB 13,311.0 35 1,136.3 31San Francisco Municipal Railway(MUNI) San Francisco CA MB 12,350.9 36 1,434.3 26Ride-On Montgomery County Transit Rockville MD MB 12,016.4 37 971.2 37Central Puget Sound Regional Transit Authority(ST) Seattle WA MB 11,424.2 38 552.9 64Foothill Transit West Covina CA MB 11,265.8 39 745.5 42Transportation District Commission of Hampton Roads, dba: Hampton Roads Transit(HRT) Hampton VA MB 10,975.2 40 802.7 39Metropolitan Suburban Bus Authority, dba: MTA Long Island Bus(MTA Long Island Bus) Garden City NY MB 10,798.0 41 983.8 36Charlotte Area Transit System(CATS) Charlotte NC MB 10,768.0 42 778.8 41Suburban Mobility Authority for Regional Transportation(SMART) Detroit MI MB 10,659.0 43 641.5 48Niagara Frontier Transportation Authority(NFT Metro) Buffalo NY MB 10,325.8 44 798.9 40Jacksonville Transportation Authority(JTA) Jacksonville FL MB 9,219.3 45 613.9 53Central Ohio Transit Authority(COTA) Columbus OH MB 9,075.4 46 732.9 43
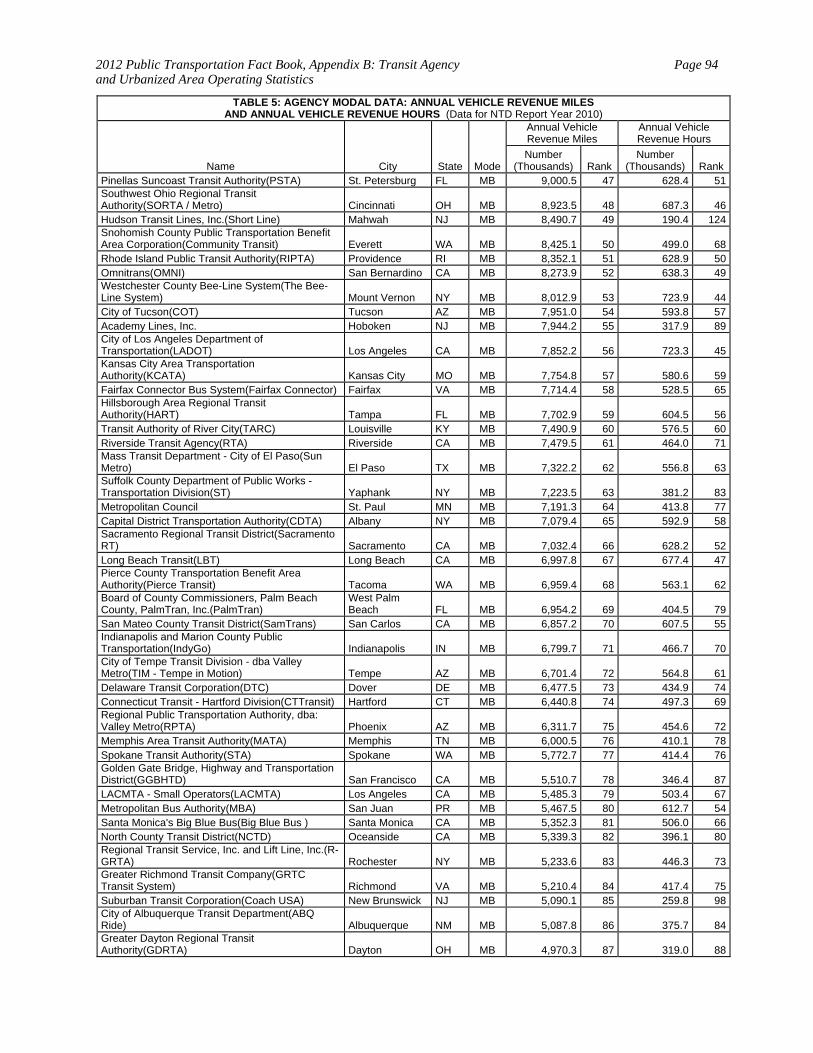
2012 Public Transportation Fact Book, Appendix B: Transit Agency and Urbanized Area Operating Statistics
Page 94
TABLE 5: AGENCY MODAL DATA: ANNUAL VEHICLE REVENUE MILES AND ANNUAL VEHICLE REVENUE HOURS (Data for NTD Report Year 2010)
Name City State Mode
Annual Vehicle Revenue Miles
Annual Vehicle Revenue Hours
Number (Thousands) Rank
Number (Thousands) Rank
Pinellas Suncoast Transit Authority(PSTA) St. Petersburg FL MB 9,000.5 47 628.4 51Southwest Ohio Regional Transit Authority(SORTA / Metro) Cincinnati OH MB 8,923.5 48 687.3 46Hudson Transit Lines, Inc.(Short Line) Mahwah NJ MB 8,490.7 49 190.4 124Snohomish County Public Transportation Benefit Area Corporation(Community Transit) Everett WA MB 8,425.1 50 499.0 68Rhode Island Public Transit Authority(RIPTA) Providence RI MB 8,352.1 51 628.9 50Omnitrans(OMNI) San Bernardino CA MB 8,273.9 52 638.3 49Westchester County Bee-Line System(The Bee-Line System) Mount Vernon NY MB 8,012.9 53 723.9 44City of Tucson(COT) Tucson AZ MB 7,951.0 54 593.8 57Academy Lines, Inc. Hoboken NJ MB 7,944.2 55 317.9 89City of Los Angeles Department of Transportation(LADOT) Los Angeles CA MB 7,852.2 56 723.3 45Kansas City Area Transportation Authority(KCATA) Kansas City MO MB 7,754.8 57 580.6 59Fairfax Connector Bus System(Fairfax Connector) Fairfax VA MB 7,714.4 58 528.5 65Hillsborough Area Regional Transit Authority(HART) Tampa FL MB 7,702.9 59 604.5 56Transit Authority of River City(TARC) Louisville KY MB 7,490.9 60 576.5 60Riverside Transit Agency(RTA) Riverside CA MB 7,479.5 61 464.0 71Mass Transit Department - City of El Paso(Sun Metro) El Paso TX MB 7,322.2 62 556.8 63Suffolk County Department of Public Works - Transportation Division(ST) Yaphank NY MB 7,223.5 63 381.2 83Metropolitan Council St. Paul MN MB 7,191.3 64 413.8 77Capital District Transportation Authority(CDTA) Albany NY MB 7,079.4 65 592.9 58Sacramento Regional Transit District(Sacramento RT) Sacramento CA MB 7,032.4 66 628.2 52Long Beach Transit(LBT) Long Beach CA MB 6,997.8 67 677.4 47Pierce County Transportation Benefit Area Authority(Pierce Transit) Tacoma WA MB 6,959.4 68 563.1 62Board of County Commissioners, Palm Beach County, PalmTran, Inc.(PalmTran)
West Palm Beach FL MB 6,954.2 69 404.5 79
San Mateo County Transit District(SamTrans) San Carlos CA MB 6,857.2 70 607.5 55Indianapolis and Marion County Public Transportation(IndyGo) Indianapolis IN MB 6,799.7 71 466.7 70City of Tempe Transit Division - dba Valley Metro(TIM - Tempe in Motion) Tempe AZ MB 6,701.4 72 564.8 61Delaware Transit Corporation(DTC) Dover DE MB 6,477.5 73 434.9 74Connecticut Transit - Hartford Division(CTTransit) Hartford CT MB 6,440.8 74 497.3 69Regional Public Transportation Authority, dba: Valley Metro(RPTA) Phoenix AZ MB 6,311.7 75 454.6 72Memphis Area Transit Authority(MATA) Memphis TN MB 6,000.5 76 410.1 78Spokane Transit Authority(STA) Spokane WA MB 5,772.7 77 414.4 76Golden Gate Bridge, Highway and Transportation District(GGBHTD) San Francisco CA MB 5,510.7 78 346.4 87LACMTA - Small Operators(LACMTA) Los Angeles CA MB 5,485.3 79 503.4 67Metropolitan Bus Authority(MBA) San Juan PR MB 5,467.5 80 612.7 54Santa Monica's Big Blue Bus(Big Blue Bus ) Santa Monica CA MB 5,352.3 81 506.0 66North County Transit District(NCTD) Oceanside CA MB 5,339.3 82 396.1 80Regional Transit Service, Inc. and Lift Line, Inc.(R-GRTA) Rochester NY MB 5,233.6 83 446.3 73Greater Richmond Transit Company(GRTC Transit System) Richmond VA MB 5,210.4 84 417.4 75Suburban Transit Corporation(Coach USA) New Brunswick NJ MB 5,090.1 85 259.8 98City of Albuquerque Transit Department(ABQ Ride) Albuquerque NM MB 5,087.8 86 375.7 84Greater Dayton Regional Transit Authority(GDRTA) Dayton OH MB 4,970.3 87 319.0 88
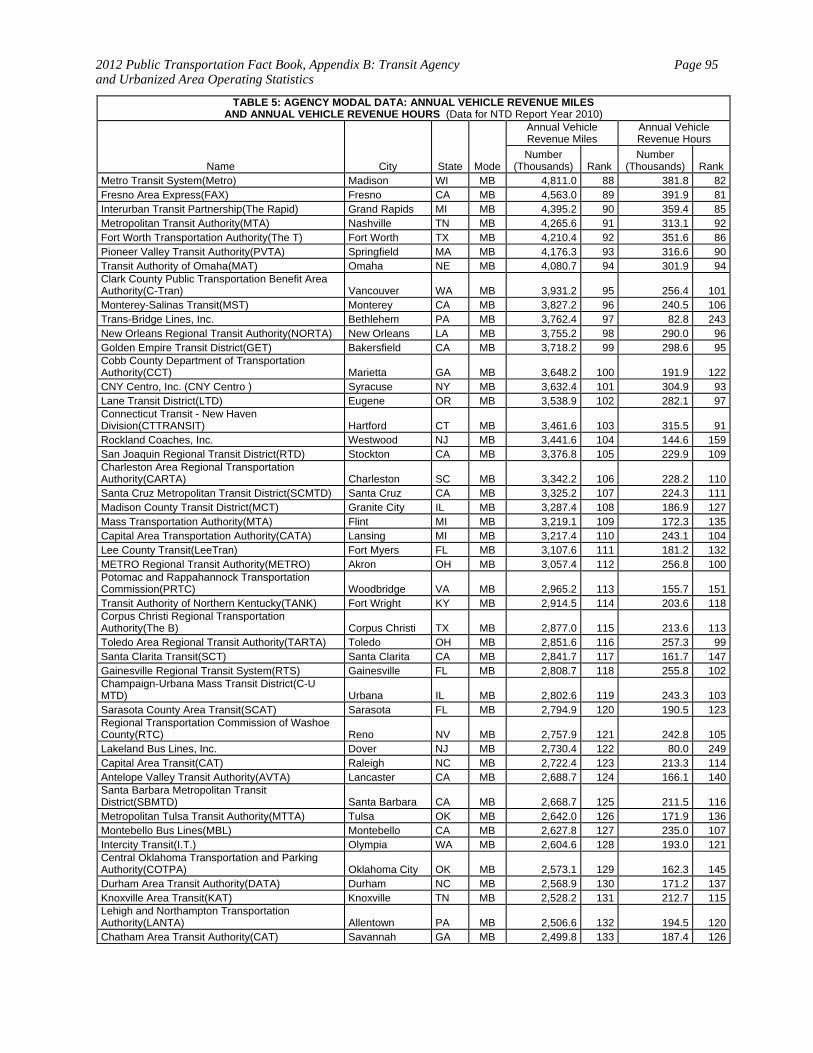
2012 Public Transportation Fact Book, Appendix B: Transit Agency and Urbanized Area Operating Statistics
Page 95
TABLE 5: AGENCY MODAL DATA: ANNUAL VEHICLE REVENUE MILES AND ANNUAL VEHICLE REVENUE HOURS (Data for NTD Report Year 2010)
Name City State Mode
Annual Vehicle Revenue Miles
Annual Vehicle Revenue Hours
Number (Thousands) Rank
Number (Thousands) Rank
Metro Transit System(Metro) Madison WI MB 4,811.0 88 381.8 82Fresno Area Express(FAX) Fresno CA MB 4,563.0 89 391.9 81Interurban Transit Partnership(The Rapid) Grand Rapids MI MB 4,395.2 90 359.4 85Metropolitan Transit Authority(MTA) Nashville TN MB 4,265.6 91 313.1 92Fort Worth Transportation Authority(The T) Fort Worth TX MB 4,210.4 92 351.6 86Pioneer Valley Transit Authority(PVTA) Springfield MA MB 4,176.3 93 316.6 90Transit Authority of Omaha(MAT) Omaha NE MB 4,080.7 94 301.9 94Clark County Public Transportation Benefit Area Authority(C-Tran) Vancouver WA MB 3,931.2 95 256.4 101Monterey-Salinas Transit(MST) Monterey CA MB 3,827.2 96 240.5 106Trans-Bridge Lines, Inc. Bethlehem PA MB 3,762.4 97 82.8 243New Orleans Regional Transit Authority(NORTA) New Orleans LA MB 3,755.2 98 290.0 96Golden Empire Transit District(GET) Bakersfield CA MB 3,718.2 99 298.6 95Cobb County Department of Transportation Authority(CCT) Marietta GA MB 3,648.2 100 191.9 122CNY Centro, Inc. (CNY Centro ) Syracuse NY MB 3,632.4 101 304.9 93Lane Transit District(LTD) Eugene OR MB 3,538.9 102 282.1 97Connecticut Transit - New Haven Division(CTTRANSIT) Hartford CT MB 3,461.6 103 315.5 91Rockland Coaches, Inc. Westwood NJ MB 3,441.6 104 144.6 159San Joaquin Regional Transit District(RTD) Stockton CA MB 3,376.8 105 229.9 109Charleston Area Regional Transportation Authority(CARTA) Charleston SC MB 3,342.2 106 228.2 110Santa Cruz Metropolitan Transit District(SCMTD) Santa Cruz CA MB 3,325.2 107 224.3 111Madison County Transit District(MCT) Granite City IL MB 3,287.4 108 186.9 127Mass Transportation Authority(MTA) Flint MI MB 3,219.1 109 172.3 135Capital Area Transportation Authority(CATA) Lansing MI MB 3,217.4 110 243.1 104Lee County Transit(LeeTran) Fort Myers FL MB 3,107.6 111 181.2 132METRO Regional Transit Authority(METRO) Akron OH MB 3,057.4 112 256.8 100Potomac and Rappahannock Transportation Commission(PRTC) Woodbridge VA MB 2,965.2 113 155.7 151Transit Authority of Northern Kentucky(TANK) Fort Wright KY MB 2,914.5 114 203.6 118Corpus Christi Regional Transportation Authority(The B) Corpus Christi TX MB 2,877.0 115 213.6 113Toledo Area Regional Transit Authority(TARTA) Toledo OH MB 2,851.6 116 257.3 99Santa Clarita Transit(SCT) Santa Clarita CA MB 2,841.7 117 161.7 147Gainesville Regional Transit System(RTS) Gainesville FL MB 2,808.7 118 255.8 102Champaign-Urbana Mass Transit District(C-U MTD) Urbana IL MB 2,802.6 119 243.3 103Sarasota County Area Transit(SCAT) Sarasota FL MB 2,794.9 120 190.5 123Regional Transportation Commission of Washoe County(RTC) Reno NV MB 2,757.9 121 242.8 105Lakeland Bus Lines, Inc. Dover NJ MB 2,730.4 122 80.0 249Capital Area Transit(CAT) Raleigh NC MB 2,722.4 123 213.3 114Antelope Valley Transit Authority(AVTA) Lancaster CA MB 2,688.7 124 166.1 140Santa Barbara Metropolitan Transit District(SBMTD) Santa Barbara CA MB 2,668.7 125 211.5 116Metropolitan Tulsa Transit Authority(MTTA) Tulsa OK MB 2,642.0 126 171.9 136Montebello Bus Lines(MBL) Montebello CA MB 2,627.8 127 235.0 107Intercity Transit(I.T.) Olympia WA MB 2,604.6 128 193.0 121Central Oklahoma Transportation and Parking Authority(COTPA) Oklahoma City OK MB 2,573.1 129 162.3 145Durham Area Transit Authority(DATA) Durham NC MB 2,568.9 130 171.2 137Knoxville Area Transit(KAT) Knoxville TN MB 2,528.2 131 212.7 115Lehigh and Northampton Transportation Authority(LANTA) Allentown PA MB 2,506.6 132 194.5 120Chatham Area Transit Authority(CAT) Savannah GA MB 2,499.8 133 187.4 126
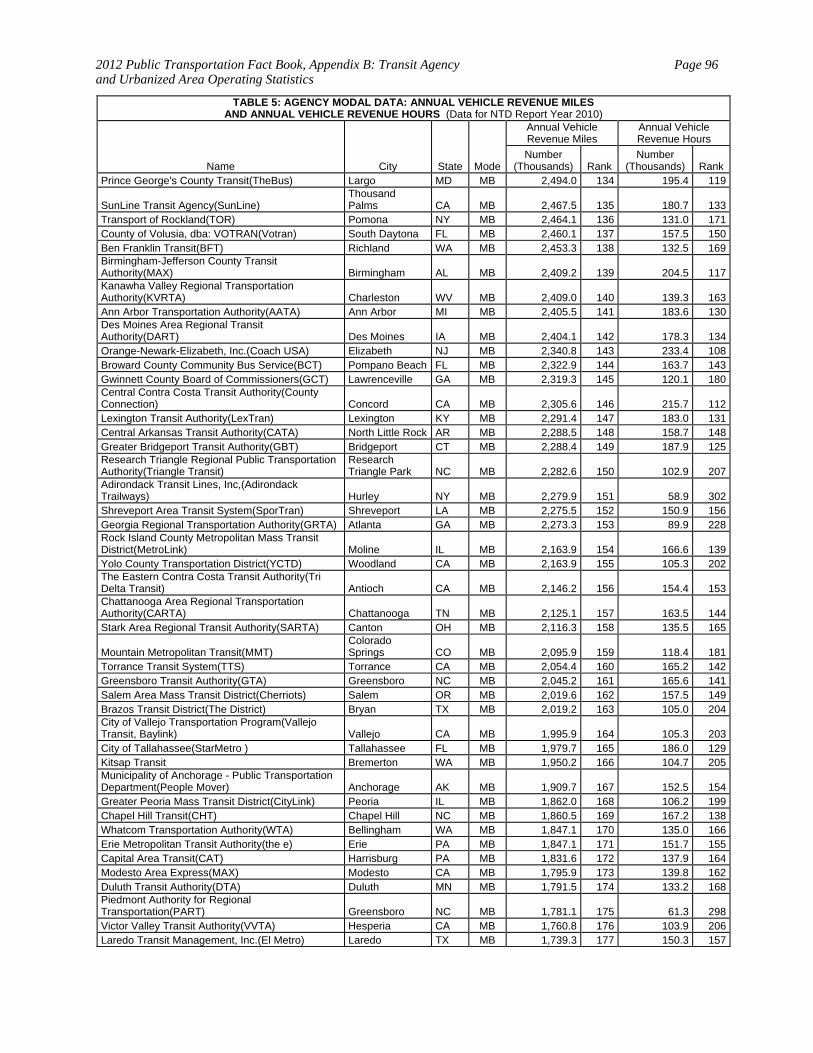
2012 Public Transportation Fact Book, Appendix B: Transit Agency and Urbanized Area Operating Statistics
Page 96
TABLE 5: AGENCY MODAL DATA: ANNUAL VEHICLE REVENUE MILES AND ANNUAL VEHICLE REVENUE HOURS (Data for NTD Report Year 2010)
Name City State Mode
Annual Vehicle Revenue Miles
Annual Vehicle Revenue Hours
Number (Thousands) Rank
Number (Thousands) Rank
Prince George's County Transit(TheBus) Largo MD MB 2,494.0 134 195.4 119
SunLine Transit Agency(SunLine) Thousand Palms CA MB 2,467.5 135 180.7 133
Transport of Rockland(TOR) Pomona NY MB 2,464.1 136 131.0 171County of Volusia, dba: VOTRAN(Votran) South Daytona FL MB 2,460.1 137 157.5 150Ben Franklin Transit(BFT) Richland WA MB 2,453.3 138 132.5 169Birmingham-Jefferson County Transit Authority(MAX) Birmingham AL MB 2,409.2 139 204.5 117Kanawha Valley Regional Transportation Authority(KVRTA) Charleston WV MB 2,409.0 140 139.3 163Ann Arbor Transportation Authority(AATA) Ann Arbor MI MB 2,405.5 141 183.6 130Des Moines Area Regional Transit Authority(DART) Des Moines IA MB 2,404.1 142 178.3 134Orange-Newark-Elizabeth, Inc.(Coach USA) Elizabeth NJ MB 2,340.8 143 233.4 108Broward County Community Bus Service(BCT) Pompano Beach FL MB 2,322.9 144 163.7 143Gwinnett County Board of Commissioners(GCT) Lawrenceville GA MB 2,319.3 145 120.1 180Central Contra Costa Transit Authority(County Connection) Concord CA MB 2,305.6 146 215.7 112Lexington Transit Authority(LexTran) Lexington KY MB 2,291.4 147 183.0 131Central Arkansas Transit Authority(CATA) North Little Rock AR MB 2,288.5 148 158.7 148Greater Bridgeport Transit Authority(GBT) Bridgeport CT MB 2,288.4 149 187.9 125Research Triangle Regional Public Transportation Authority(Triangle Transit)
Research Triangle Park NC MB 2,282.6 150 102.9 207
Adirondack Transit Lines, Inc,(Adirondack Trailways) Hurley NY MB 2,279.9 151 58.9 302Shreveport Area Transit System(SporTran) Shreveport LA MB 2,275.5 152 150.9 156Georgia Regional Transportation Authority(GRTA) Atlanta GA MB 2,273.3 153 89.9 228Rock Island County Metropolitan Mass Transit District(MetroLink) Moline IL MB 2,163.9 154 166.6 139Yolo County Transportation District(YCTD) Woodland CA MB 2,163.9 155 105.3 202The Eastern Contra Costa Transit Authority(Tri Delta Transit) Antioch CA MB 2,146.2 156 154.4 153Chattanooga Area Regional Transportation Authority(CARTA) Chattanooga TN MB 2,125.1 157 163.5 144Stark Area Regional Transit Authority(SARTA) Canton OH MB 2,116.3 158 135.5 165
Mountain Metropolitan Transit(MMT) Colorado Springs CO MB 2,095.9 159 118.4 181
Torrance Transit System(TTS) Torrance CA MB 2,054.4 160 165.2 142Greensboro Transit Authority(GTA) Greensboro NC MB 2,045.2 161 165.6 141Salem Area Mass Transit District(Cherriots) Salem OR MB 2,019.6 162 157.5 149Brazos Transit District(The District) Bryan TX MB 2,019.2 163 105.0 204City of Vallejo Transportation Program(Vallejo Transit, Baylink) Vallejo CA MB 1,995.9 164 105.3 203City of Tallahassee(StarMetro ) Tallahassee FL MB 1,979.7 165 186.0 129Kitsap Transit Bremerton WA MB 1,950.2 166 104.7 205Municipality of Anchorage - Public Transportation Department(People Mover) Anchorage AK MB 1,909.7 167 152.5 154Greater Peoria Mass Transit District(CityLink) Peoria IL MB 1,862.0 168 106.2 199Chapel Hill Transit(CHT) Chapel Hill NC MB 1,860.5 169 167.2 138Whatcom Transportation Authority(WTA) Bellingham WA MB 1,847.1 170 135.0 166Erie Metropolitan Transit Authority(the e) Erie PA MB 1,847.1 171 151.7 155Capital Area Transit(CAT) Harrisburg PA MB 1,831.6 172 137.9 164Modesto Area Express(MAX) Modesto CA MB 1,795.9 173 139.8 162Duluth Transit Authority(DTA) Duluth MN MB 1,791.5 174 133.2 168Piedmont Authority for Regional Transportation(PART) Greensboro NC MB 1,781.1 175 61.3 298Victor Valley Transit Authority(VVTA) Hesperia CA MB 1,760.8 176 103.9 206Laredo Transit Management, Inc.(El Metro) Laredo TX MB 1,739.3 177 150.3 157
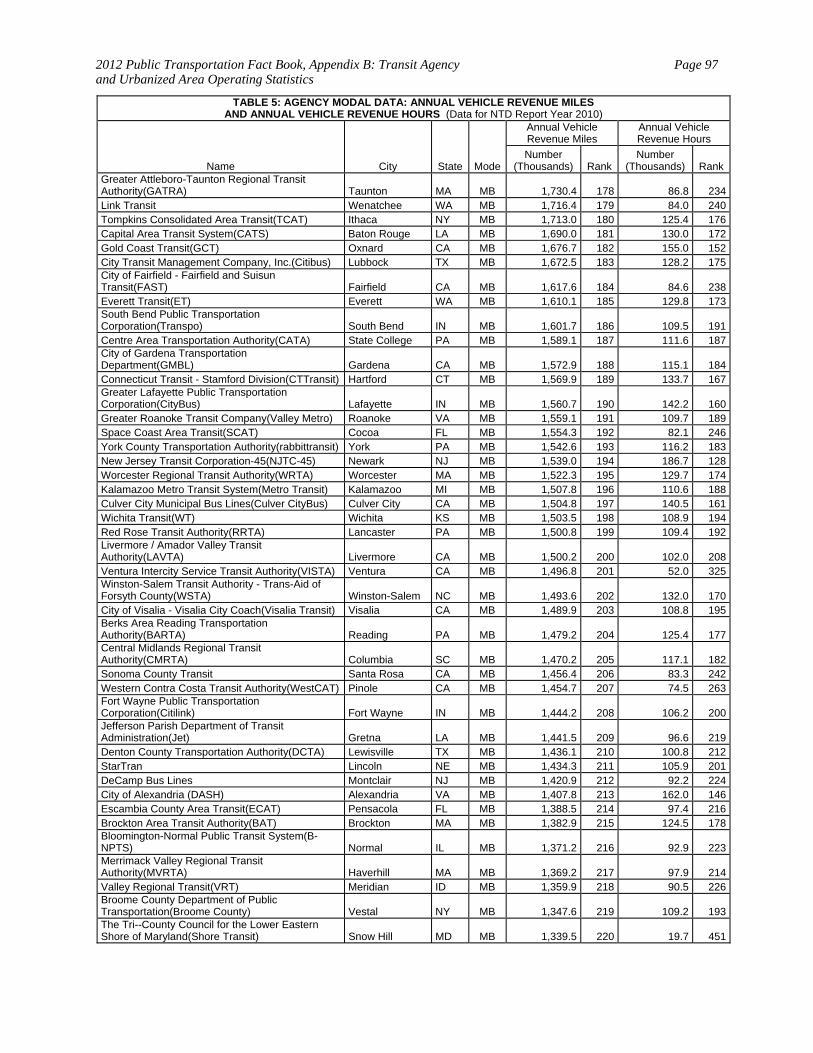
2012 Public Transportation Fact Book, Appendix B: Transit Agency and Urbanized Area Operating Statistics
Page 97
TABLE 5: AGENCY MODAL DATA: ANNUAL VEHICLE REVENUE MILES AND ANNUAL VEHICLE REVENUE HOURS (Data for NTD Report Year 2010)
Name City State Mode
Annual Vehicle Revenue Miles
Annual Vehicle Revenue Hours
Number (Thousands) Rank
Number (Thousands) Rank
Greater Attleboro-Taunton Regional Transit Authority(GATRA) Taunton MA MB 1,730.4 178 86.8 234Link Transit Wenatchee WA MB 1,716.4 179 84.0 240Tompkins Consolidated Area Transit(TCAT) Ithaca NY MB 1,713.0 180 125.4 176Capital Area Transit System(CATS) Baton Rouge LA MB 1,690.0 181 130.0 172Gold Coast Transit(GCT) Oxnard CA MB 1,676.7 182 155.0 152City Transit Management Company, Inc.(Citibus) Lubbock TX MB 1,672.5 183 128.2 175City of Fairfield - Fairfield and Suisun Transit(FAST) Fairfield CA MB 1,617.6 184 84.6 238Everett Transit(ET) Everett WA MB 1,610.1 185 129.8 173South Bend Public Transportation Corporation(Transpo) South Bend IN MB 1,601.7 186 109.5 191Centre Area Transportation Authority(CATA) State College PA MB 1,589.1 187 111.6 187City of Gardena Transportation Department(GMBL) Gardena CA MB 1,572.9 188 115.1 184Connecticut Transit - Stamford Division(CTTransit) Hartford CT MB 1,569.9 189 133.7 167Greater Lafayette Public Transportation Corporation(CityBus) Lafayette IN MB 1,560.7 190 142.2 160Greater Roanoke Transit Company(Valley Metro) Roanoke VA MB 1,559.1 191 109.7 189Space Coast Area Transit(SCAT) Cocoa FL MB 1,554.3 192 82.1 246York County Transportation Authority(rabbittransit) York PA MB 1,542.6 193 116.2 183New Jersey Transit Corporation-45(NJTC-45) Newark NJ MB 1,539.0 194 186.7 128Worcester Regional Transit Authority(WRTA) Worcester MA MB 1,522.3 195 129.7 174Kalamazoo Metro Transit System(Metro Transit) Kalamazoo MI MB 1,507.8 196 110.6 188Culver City Municipal Bus Lines(Culver CityBus) Culver City CA MB 1,504.8 197 140.5 161Wichita Transit(WT) Wichita KS MB 1,503.5 198 108.9 194Red Rose Transit Authority(RRTA) Lancaster PA MB 1,500.8 199 109.4 192Livermore / Amador Valley Transit Authority(LAVTA) Livermore CA MB 1,500.2 200 102.0 208Ventura Intercity Service Transit Authority(VISTA) Ventura CA MB 1,496.8 201 52.0 325Winston-Salem Transit Authority - Trans-Aid of Forsyth County(WSTA) Winston-Salem NC MB 1,493.6 202 132.0 170City of Visalia - Visalia City Coach(Visalia Transit) Visalia CA MB 1,489.9 203 108.8 195Berks Area Reading Transportation Authority(BARTA) Reading PA MB 1,479.2 204 125.4 177Central Midlands Regional Transit Authority(CMRTA) Columbia SC MB 1,470.2 205 117.1 182Sonoma County Transit Santa Rosa CA MB 1,456.4 206 83.3 242Western Contra Costa Transit Authority(WestCAT) Pinole CA MB 1,454.7 207 74.5 263Fort Wayne Public Transportation Corporation(Citilink) Fort Wayne IN MB 1,444.2 208 106.2 200Jefferson Parish Department of Transit Administration(Jet) Gretna LA MB 1,441.5 209 96.6 219Denton County Transportation Authority(DCTA) Lewisville TX MB 1,436.1 210 100.8 212StarTran Lincoln NE MB 1,434.3 211 105.9 201DeCamp Bus Lines Montclair NJ MB 1,420.9 212 92.2 224City of Alexandria (DASH) Alexandria VA MB 1,407.8 213 162.0 146Escambia County Area Transit(ECAT) Pensacola FL MB 1,388.5 214 97.4 216Brockton Area Transit Authority(BAT) Brockton MA MB 1,382.9 215 124.5 178Bloomington-Normal Public Transit System(B-NPTS) Normal IL MB 1,371.2 216 92.9 223Merrimack Valley Regional Transit Authority(MVRTA) Haverhill MA MB 1,369.2 217 97.9 214Valley Regional Transit(VRT) Meridian ID MB 1,359.9 218 90.5 226Broome County Department of Public Transportation(Broome County) Vestal NY MB 1,347.6 219 109.2 193The Tri--County Council for the Lower Eastern Shore of Maryland(Shore Transit) Snow Hill MD MB 1,339.5 220 19.7 451

2012 Public Transportation Fact Book, Appendix B: Transit Agency and Urbanized Area Operating Statistics
Page 98
TABLE 5: AGENCY MODAL DATA: ANNUAL VEHICLE REVENUE MILES AND ANNUAL VEHICLE REVENUE HOURS (Data for NTD Report Year 2010)
Name City State Mode
Annual Vehicle Revenue Miles
Annual Vehicle Revenue Hours
Number (Thousands) Rank
Number (Thousands) Rank
Metropolitan Evansville Transit System(METS) Evansville IN MB 1,338.1 221 86.2 235Manatee County Area Transit(MCAT) Bradenton FL MB 1,328.8 222 87.0 233Cape Fear Public Transportation Authority(Wave) Wilmington NC MB 1,324.4 223 108.6 197City of Montgomery-Montgomery Area Transit System(MATS) Montgomery AL MB 1,300.2 224 82.8 244City of Waukesha Transit Commission(Waukesha Metro Transit) Waukesha WI MB 1,298.2 225 81.8 247Johnson County Kansas, aka: Johnson County Transit(The JO) Olathe KS MB 1,292.4 226 54.7 319Rockford Mass Transit District(RMTD) Rockford IL MB 1,285.2 227 94.3 222Merced County Transit(The Bus) Merced CA MB 1,282.6 228 73.6 266Lakeland Area Mass Transit District (Citrus Connection) Lakeland FL MB 1,274.5 229 79.6 253Loudoun County Commuter Bus Service - Office of Transportation Services(LC Transit) Leesburg VA MB 1,267.9 230 41.8 351Springfield Mass Transit District(SMTD) Springfield IL MB 1,267.4 231 101.8 209Norwalk Transit System(NTS) Norwalk CA MB 1,262.6 232 97.1 217Private One of New York, LLC, dba: New York Airport Service Brooklyn NY MB 1,259.1 233 96.8 218The Wave Transit System(WTS) Mobile AL MB 1,251.8 234 97.5 215Williamsburg Area Transit Authority(WATA) Williamsburg VA MB 1,247.0 235 84.2 239St. Cloud Metropolitan Transit Commission(Metro Bus) St. Cloud MN MB 1,244.1 236 83.8 241Placer County Department of Public Works(PCDPW) Auburn CA MB 1,235.4 237 56.9 307Collier Area Transit(CAT) Naples FL MB 1,230.1 238 66.5 282Southeastern Regional Transit Authority(SRTA) New Bedford MA MB 1,226.7 239 95.5 220Greater Lynchburg Transit Company(GLTC) Lynchburg VA MB 1,202.9 240 99.4 213Coast Transit Authority(CTA) Gulfport MS MB 1,177.6 241 81.1 248Howard Transit(HT) Ellicott City MD MB 1,168.6 242 76.3 259Lowell Regional Transit Authority(LRTA) Lowell MA MB 1,149.5 243 79.9 250City of Santa Rosa(Santa Rosa CityBus) Santa Rosa CA MB 1,147.0 244 95.0 221Cape Cod Regional Transit Authority(CCRTA) Hyannis MA MB 1,135.8 245 88.5 231Chula Vista Transit(CVT) Chula Vista CA MB 1,134.4 246 109.6 190Belle Urban System - Racine(The Bus) Racine WI MB 1,131.0 247 86.2 236Ames Transit Agency(CyRide) Ames IA MB 1,124.7 248 107.8 198Chittenden County Transportation Authority(CCTA) Burlington VT MB 1,124.5 249 91.5 225County of Lackawanna Transit System(COLTS) Scranton PA MB 1,117.3 250 89.5 229Green Bay Metro(GBM) Green Bay WI MB 1,112.7 251 72.6 269City Utilities of Springfield (The Bus) Springfield MO MB 1,101.0 252 77.2 256Centro of Oneida, Inc.(Centro of Oneida) Syracruse NY MB 1,095.5 253 90.2 227Pasco County Public Transportation(PCPT) Port Richey FL MB 1,088.9 254 65.0 287Western Reserve Transit Authority(WRTA) Youngstown OH MB 1,086.6 255 78.4 254Bay Metropolitan Transit Authority(Bay Metro) Bay City MI MB 1,058.6 256 55.0 316Butte County Association of Governments(BCAG) Chico CA MB 1,058.1 257 67.2 279Norwalk Transit District Norwalk CT MB 1,055.9 258 108.8 196Macon-Bibb County Transit Authority(MTA ) Macon GA MB 1,054.4 259 73.8 265Monsey New Square Trails Corporation Spring Valley NY MB 1,044.3 260 44.5 341Clarksville Transit System(CTS) Clarksville TN MB 1,040.1 261 62.5 294City of Appleton - Valley Transit( ) Appleton WI MB 1,039.6 262 66.8 281Waccamaw Regional Transportation Authority(The Coast RTA) Conway SC MB 1,027.7 263 62.1 295Kenosha Transit(KT) Kenosha WI MB 1,027.5 264 69.3 274Southeast Area Transit(SEAT) Preston CT MB 1,009.1 265 65.2 286Monongalia County Urban Mass Transit Authority(Mountain Line Transit) Morgantown WV MB 1,007.3 266 57.7 304
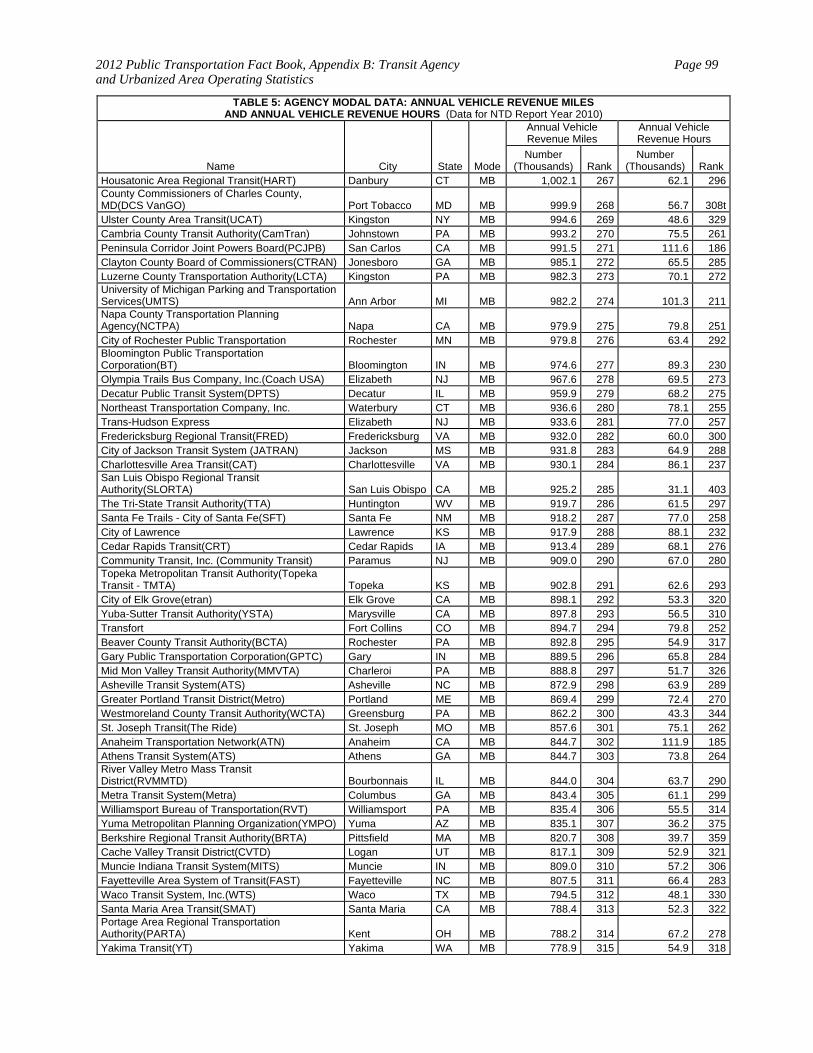
2012 Public Transportation Fact Book, Appendix B: Transit Agency and Urbanized Area Operating Statistics
Page 99
TABLE 5: AGENCY MODAL DATA: ANNUAL VEHICLE REVENUE MILES AND ANNUAL VEHICLE REVENUE HOURS (Data for NTD Report Year 2010)
Name City State Mode
Annual Vehicle Revenue Miles
Annual Vehicle Revenue Hours
Number (Thousands) Rank
Number (Thousands) Rank
Housatonic Area Regional Transit(HART) Danbury CT MB 1,002.1 267 62.1 296County Commissioners of Charles County, MD(DCS VanGO) Port Tobacco MD MB 999.9 268 56.7 308tUlster County Area Transit(UCAT) Kingston NY MB 994.6 269 48.6 329Cambria County Transit Authority(CamTran) Johnstown PA MB 993.2 270 75.5 261Peninsula Corridor Joint Powers Board(PCJPB) San Carlos CA MB 991.5 271 111.6 186Clayton County Board of Commissioners(CTRAN) Jonesboro GA MB 985.1 272 65.5 285Luzerne County Transportation Authority(LCTA) Kingston PA MB 982.3 273 70.1 272University of Michigan Parking and Transportation Services(UMTS) Ann Arbor MI MB 982.2 274 101.3 211Napa County Transportation Planning Agency(NCTPA) Napa CA MB 979.9 275 79.8 251City of Rochester Public Transportation Rochester MN MB 979.8 276 63.4 292Bloomington Public Transportation Corporation(BT) Bloomington IN MB 974.6 277 89.3 230Olympia Trails Bus Company, Inc.(Coach USA) Elizabeth NJ MB 967.6 278 69.5 273Decatur Public Transit System(DPTS) Decatur IL MB 959.9 279 68.2 275Northeast Transportation Company, Inc. Waterbury CT MB 936.6 280 78.1 255Trans-Hudson Express Elizabeth NJ MB 933.6 281 77.0 257Fredericksburg Regional Transit(FRED) Fredericksburg VA MB 932.0 282 60.0 300City of Jackson Transit System (JATRAN) Jackson MS MB 931.8 283 64.9 288Charlottesville Area Transit(CAT) Charlottesville VA MB 930.1 284 86.1 237San Luis Obispo Regional Transit Authority(SLORTA) San Luis Obispo CA MB 925.2 285 31.1 403The Tri-State Transit Authority(TTA) Huntington WV MB 919.7 286 61.5 297Santa Fe Trails - City of Santa Fe(SFT) Santa Fe NM MB 918.2 287 77.0 258City of Lawrence Lawrence KS MB 917.9 288 88.1 232Cedar Rapids Transit(CRT) Cedar Rapids IA MB 913.4 289 68.1 276Community Transit, Inc. (Community Transit) Paramus NJ MB 909.0 290 67.0 280Topeka Metropolitan Transit Authority(Topeka Transit - TMTA) Topeka KS MB 902.8 291 62.6 293City of Elk Grove(etran) Elk Grove CA MB 898.1 292 53.3 320Yuba-Sutter Transit Authority(YSTA) Marysville CA MB 897.8 293 56.5 310Transfort Fort Collins CO MB 894.7 294 79.8 252Beaver County Transit Authority(BCTA) Rochester PA MB 892.8 295 54.9 317Gary Public Transportation Corporation(GPTC) Gary IN MB 889.5 296 65.8 284Mid Mon Valley Transit Authority(MMVTA) Charleroi PA MB 888.8 297 51.7 326Asheville Transit System(ATS) Asheville NC MB 872.9 298 63.9 289Greater Portland Transit District(Metro) Portland ME MB 869.4 299 72.4 270Westmoreland County Transit Authority(WCTA) Greensburg PA MB 862.2 300 43.3 344St. Joseph Transit(The Ride) St. Joseph MO MB 857.6 301 75.1 262Anaheim Transportation Network(ATN) Anaheim CA MB 844.7 302 111.9 185Athens Transit System(ATS) Athens GA MB 844.7 303 73.8 264River Valley Metro Mass Transit District(RVMMTD) Bourbonnais IL MB 844.0 304 63.7 290Metra Transit System(Metra) Columbus GA MB 843.4 305 61.1 299Williamsport Bureau of Transportation(RVT) Williamsport PA MB 835.4 306 55.5 314Yuma Metropolitan Planning Organization(YMPO) Yuma AZ MB 835.1 307 36.2 375Berkshire Regional Transit Authority(BRTA) Pittsfield MA MB 820.7 308 39.7 359Cache Valley Transit District(CVTD) Logan UT MB 817.1 309 52.9 321Muncie Indiana Transit System(MITS) Muncie IN MB 809.0 310 57.2 306Fayetteville Area System of Transit(FAST) Fayetteville NC MB 807.5 311 66.4 283Waco Transit System, Inc.(WTS) Waco TX MB 794.5 312 48.1 330Santa Maria Area Transit(SMAT) Santa Maria CA MB 788.4 313 52.3 322Portage Area Regional Transportation Authority(PARTA) Kent OH MB 788.2 314 67.2 278Yakima Transit(YT) Yakima WA MB 778.9 315 54.9 318
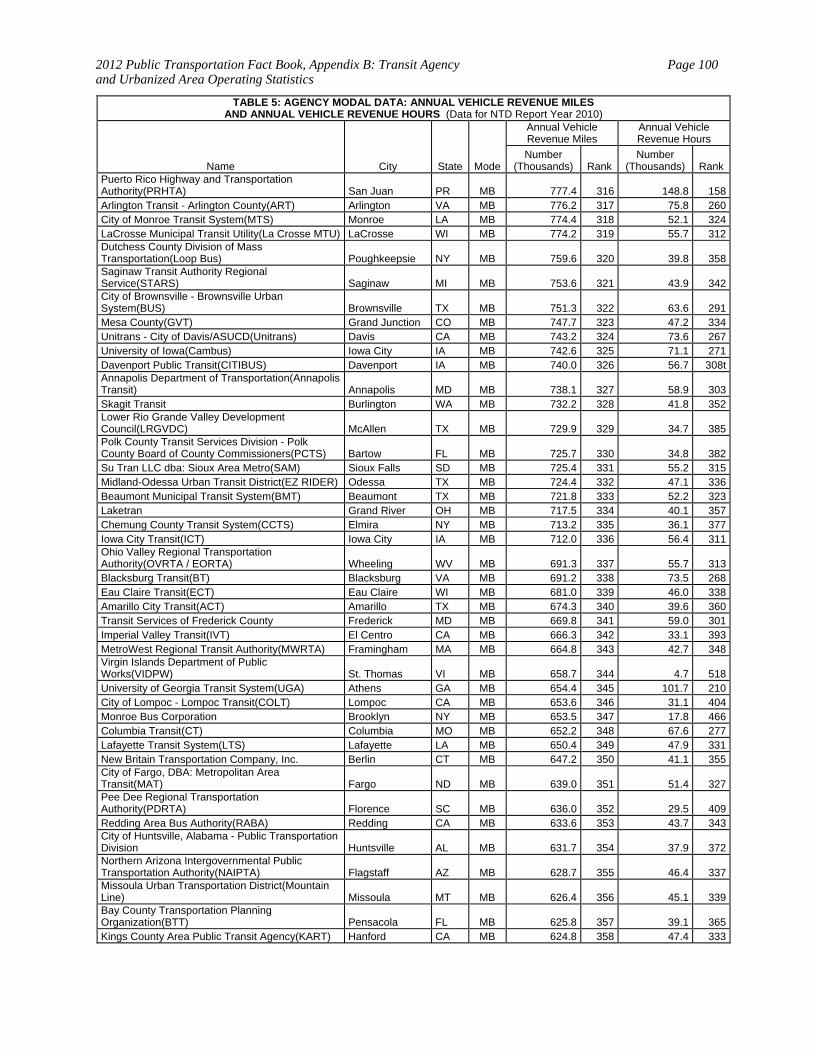
2012 Public Transportation Fact Book, Appendix B: Transit Agency and Urbanized Area Operating Statistics
Page 100
TABLE 5: AGENCY MODAL DATA: ANNUAL VEHICLE REVENUE MILES AND ANNUAL VEHICLE REVENUE HOURS (Data for NTD Report Year 2010)
Name City State Mode
Annual Vehicle Revenue Miles
Annual Vehicle Revenue Hours
Number (Thousands) Rank
Number (Thousands) Rank
Puerto Rico Highway and Transportation Authority(PRHTA) San Juan PR MB 777.4 316 148.8 158Arlington Transit - Arlington County(ART) Arlington VA MB 776.2 317 75.8 260City of Monroe Transit System(MTS) Monroe LA MB 774.4 318 52.1 324LaCrosse Municipal Transit Utility(La Crosse MTU) LaCrosse WI MB 774.2 319 55.7 312Dutchess County Division of Mass Transportation(Loop Bus) Poughkeepsie NY MB 759.6 320 39.8 358Saginaw Transit Authority Regional Service(STARS) Saginaw MI MB 753.6 321 43.9 342City of Brownsville - Brownsville Urban System(BUS) Brownsville TX MB 751.3 322 63.6 291Mesa County(GVT) Grand Junction CO MB 747.7 323 47.2 334Unitrans - City of Davis/ASUCD(Unitrans) Davis CA MB 743.2 324 73.6 267University of Iowa(Cambus) Iowa City IA MB 742.6 325 71.1 271Davenport Public Transit(CITIBUS) Davenport IA MB 740.0 326 56.7 308tAnnapolis Department of Transportation(Annapolis Transit) Annapolis MD MB 738.1 327 58.9 303Skagit Transit Burlington WA MB 732.2 328 41.8 352Lower Rio Grande Valley Development Council(LRGVDC) McAllen TX MB 729.9 329 34.7 385Polk County Transit Services Division - Polk County Board of County Commissioners(PCTS) Bartow FL MB 725.7 330 34.8 382Su Tran LLC dba: Sioux Area Metro(SAM) Sioux Falls SD MB 725.4 331 55.2 315Midland-Odessa Urban Transit District(EZ RIDER) Odessa TX MB 724.4 332 47.1 336Beaumont Municipal Transit System(BMT) Beaumont TX MB 721.8 333 52.2 323Laketran Grand River OH MB 717.5 334 40.1 357Chemung County Transit System(CCTS) Elmira NY MB 713.2 335 36.1 377Iowa City Transit(ICT) Iowa City IA MB 712.0 336 56.4 311Ohio Valley Regional Transportation Authority(OVRTA / EORTA) Wheeling WV MB 691.3 337 55.7 313Blacksburg Transit(BT) Blacksburg VA MB 691.2 338 73.5 268Eau Claire Transit(ECT) Eau Claire WI MB 681.0 339 46.0 338Amarillo City Transit(ACT) Amarillo TX MB 674.3 340 39.6 360Transit Services of Frederick County Frederick MD MB 669.8 341 59.0 301Imperial Valley Transit(IVT) El Centro CA MB 666.3 342 33.1 393MetroWest Regional Transit Authority(MWRTA) Framingham MA MB 664.8 343 42.7 348Virgin Islands Department of Public Works(VIDPW) St. Thomas VI MB 658.7 344 4.7 518University of Georgia Transit System(UGA) Athens GA MB 654.4 345 101.7 210City of Lompoc - Lompoc Transit(COLT) Lompoc CA MB 653.6 346 31.1 404Monroe Bus Corporation Brooklyn NY MB 653.5 347 17.8 466Columbia Transit(CT) Columbia MO MB 652.2 348 67.6 277Lafayette Transit System(LTS) Lafayette LA MB 650.4 349 47.9 331New Britain Transportation Company, Inc. Berlin CT MB 647.2 350 41.1 355City of Fargo, DBA: Metropolitan Area Transit(MAT) Fargo ND MB 639.0 351 51.4 327Pee Dee Regional Transportation Authority(PDRTA) Florence SC MB 636.0 352 29.5 409Redding Area Bus Authority(RABA) Redding CA MB 633.6 353 43.7 343City of Huntsville, Alabama - Public Transportation Division Huntsville AL MB 631.7 354 37.9 372Northern Arizona Intergovernmental Public Transportation Authority(NAIPTA) Flagstaff AZ MB 628.7 355 46.4 337Missoula Urban Transportation District(Mountain Line) Missoula MT MB 626.4 356 45.1 339Bay County Transportation Planning Organization(BTT) Pensacola FL MB 625.8 357 39.1 365Kings County Area Public Transit Agency(KART) Hanford CA MB 624.8 358 47.4 333
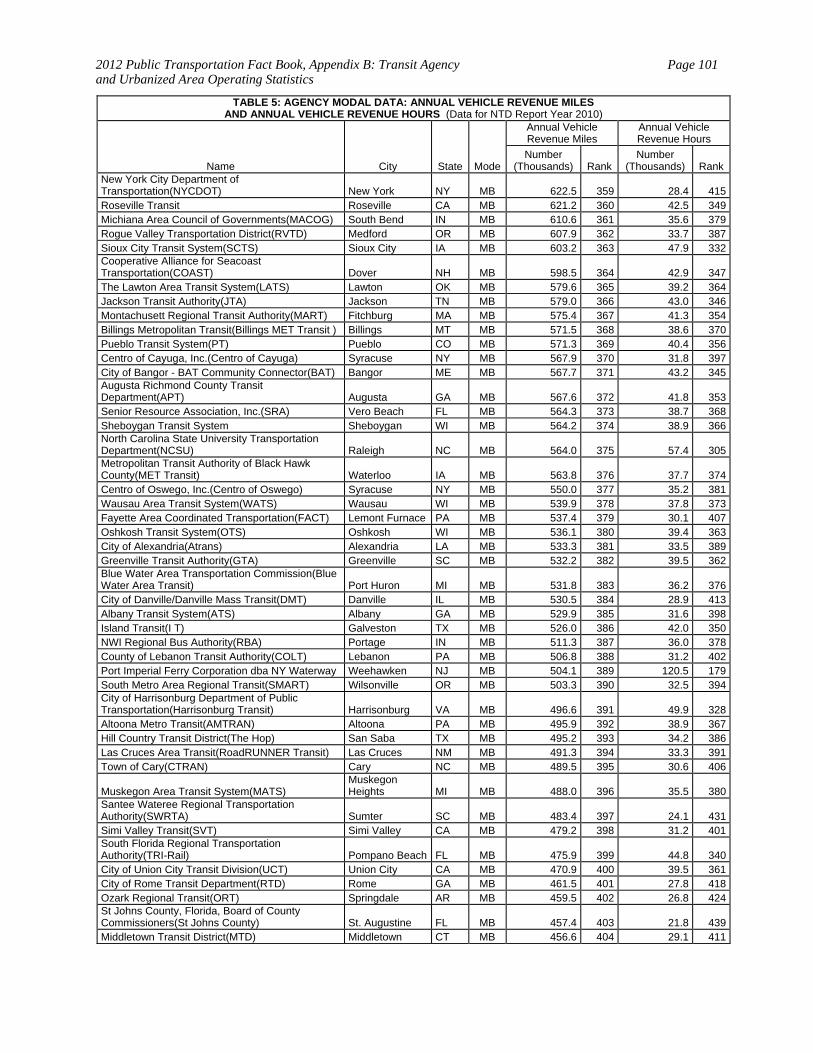
2012 Public Transportation Fact Book, Appendix B: Transit Agency and Urbanized Area Operating Statistics
Page 101
TABLE 5: AGENCY MODAL DATA: ANNUAL VEHICLE REVENUE MILES AND ANNUAL VEHICLE REVENUE HOURS (Data for NTD Report Year 2010)
Name City State Mode
Annual Vehicle Revenue Miles
Annual Vehicle Revenue Hours
Number (Thousands) Rank
Number (Thousands) Rank
New York City Department of Transportation(NYCDOT) New York NY MB 622.5 359 28.4 415Roseville Transit Roseville CA MB 621.2 360 42.5 349Michiana Area Council of Governments(MACOG) South Bend IN MB 610.6 361 35.6 379Rogue Valley Transportation District(RVTD) Medford OR MB 607.9 362 33.7 387Sioux City Transit System(SCTS) Sioux City IA MB 603.2 363 47.9 332Cooperative Alliance for Seacoast Transportation(COAST) Dover NH MB 598.5 364 42.9 347The Lawton Area Transit System(LATS) Lawton OK MB 579.6 365 39.2 364Jackson Transit Authority(JTA) Jackson TN MB 579.0 366 43.0 346Montachusett Regional Transit Authority(MART) Fitchburg MA MB 575.4 367 41.3 354Billings Metropolitan Transit(Billings MET Transit ) Billings MT MB 571.5 368 38.6 370Pueblo Transit System(PT) Pueblo CO MB 571.3 369 40.4 356Centro of Cayuga, Inc.(Centro of Cayuga) Syracuse NY MB 567.9 370 31.8 397City of Bangor - BAT Community Connector(BAT) Bangor ME MB 567.7 371 43.2 345Augusta Richmond County Transit Department(APT) Augusta GA MB 567.6 372 41.8 353Senior Resource Association, Inc.(SRA) Vero Beach FL MB 564.3 373 38.7 368Sheboygan Transit System Sheboygan WI MB 564.2 374 38.9 366North Carolina State University Transportation Department(NCSU) Raleigh NC MB 564.0 375 57.4 305Metropolitan Transit Authority of Black Hawk County(MET Transit) Waterloo IA MB 563.8 376 37.7 374Centro of Oswego, Inc.(Centro of Oswego) Syracuse NY MB 550.0 377 35.2 381Wausau Area Transit System(WATS) Wausau WI MB 539.9 378 37.8 373Fayette Area Coordinated Transportation(FACT) Lemont Furnace PA MB 537.4 379 30.1 407Oshkosh Transit System(OTS) Oshkosh WI MB 536.1 380 39.4 363City of Alexandria(Atrans) Alexandria LA MB 533.3 381 33.5 389Greenville Transit Authority(GTA) Greenville SC MB 532.2 382 39.5 362Blue Water Area Transportation Commission(Blue Water Area Transit) Port Huron MI MB 531.8 383 36.2 376City of Danville/Danville Mass Transit(DMT) Danville IL MB 530.5 384 28.9 413Albany Transit System(ATS) Albany GA MB 529.9 385 31.6 398Island Transit(I T) Galveston TX MB 526.0 386 42.0 350NWI Regional Bus Authority(RBA) Portage IN MB 511.3 387 36.0 378County of Lebanon Transit Authority(COLT) Lebanon PA MB 506.8 388 31.2 402Port Imperial Ferry Corporation dba NY Waterway Weehawken NJ MB 504.1 389 120.5 179South Metro Area Regional Transit(SMART) Wilsonville OR MB 503.3 390 32.5 394City of Harrisonburg Department of Public Transportation(Harrisonburg Transit) Harrisonburg VA MB 496.6 391 49.9 328Altoona Metro Transit(AMTRAN) Altoona PA MB 495.9 392 38.9 367Hill Country Transit District(The Hop) San Saba TX MB 495.2 393 34.2 386Las Cruces Area Transit(RoadRUNNER Transit) Las Cruces NM MB 491.3 394 33.3 391Town of Cary(CTRAN) Cary NC MB 489.5 395 30.6 406
Muskegon Area Transit System(MATS) Muskegon Heights MI MB 488.0 396 35.5 380
Santee Wateree Regional Transportation Authority(SWRTA) Sumter SC MB 483.4 397 24.1 431Simi Valley Transit(SVT) Simi Valley CA MB 479.2 398 31.2 401South Florida Regional Transportation Authority(TRI-Rail) Pompano Beach FL MB 475.9 399 44.8 340City of Union City Transit Division(UCT) Union City CA MB 470.9 400 39.5 361City of Rome Transit Department(RTD) Rome GA MB 461.5 401 27.8 418Ozark Regional Transit(ORT) Springdale AR MB 459.5 402 26.8 424St Johns County, Florida, Board of County Commissioners(St Johns County) St. Augustine FL MB 457.4 403 21.8 439Middletown Transit District(MTD) Middletown CT MB 456.6 404 29.1 411
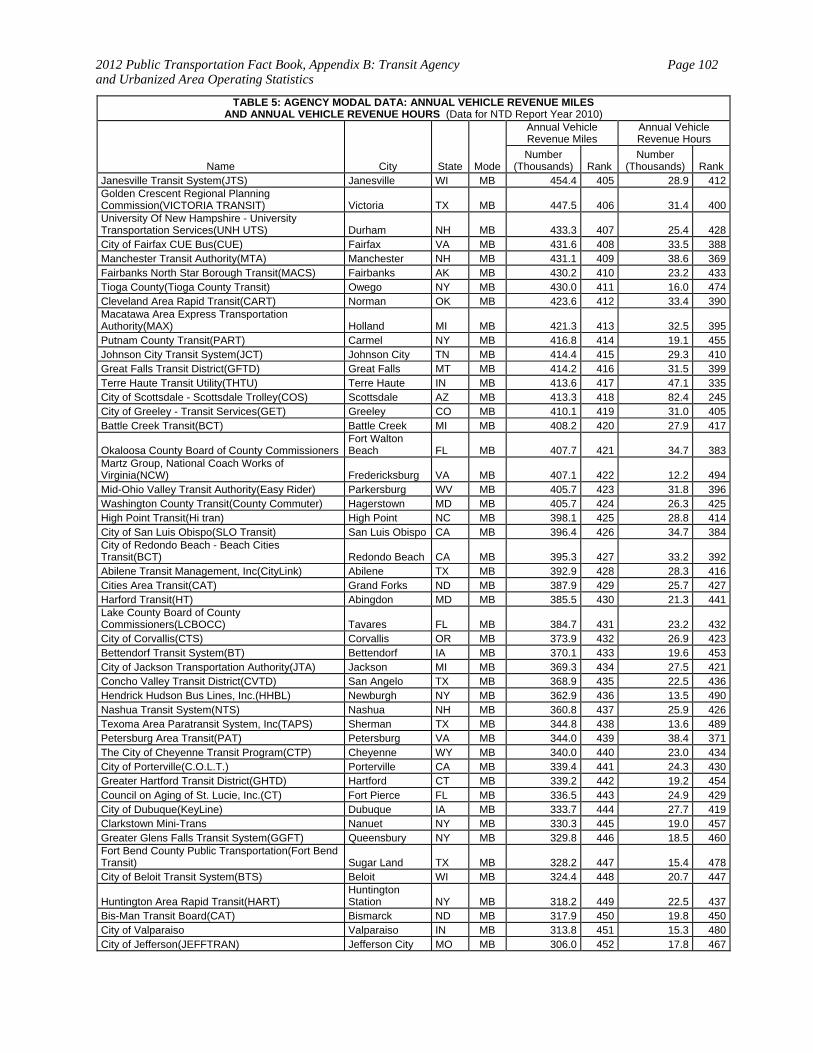
2012 Public Transportation Fact Book, Appendix B: Transit Agency and Urbanized Area Operating Statistics
Page 102
TABLE 5: AGENCY MODAL DATA: ANNUAL VEHICLE REVENUE MILES AND ANNUAL VEHICLE REVENUE HOURS (Data for NTD Report Year 2010)
Name City State Mode
Annual Vehicle Revenue Miles
Annual Vehicle Revenue Hours
Number (Thousands) Rank
Number (Thousands) Rank
Janesville Transit System(JTS) Janesville WI MB 454.4 405 28.9 412Golden Crescent Regional Planning Commission(VICTORIA TRANSIT) Victoria TX MB 447.5 406 31.4 400University Of New Hampshire - University Transportation Services(UNH UTS) Durham NH MB 433.3 407 25.4 428City of Fairfax CUE Bus(CUE) Fairfax VA MB 431.6 408 33.5 388Manchester Transit Authority(MTA) Manchester NH MB 431.1 409 38.6 369Fairbanks North Star Borough Transit(MACS) Fairbanks AK MB 430.2 410 23.2 433Tioga County(Tioga County Transit) Owego NY MB 430.0 411 16.0 474Cleveland Area Rapid Transit(CART) Norman OK MB 423.6 412 33.4 390Macatawa Area Express Transportation Authority(MAX) Holland MI MB 421.3 413 32.5 395Putnam County Transit(PART) Carmel NY MB 416.8 414 19.1 455Johnson City Transit System(JCT) Johnson City TN MB 414.4 415 29.3 410Great Falls Transit District(GFTD) Great Falls MT MB 414.2 416 31.5 399Terre Haute Transit Utility(THTU) Terre Haute IN MB 413.6 417 47.1 335City of Scottsdale - Scottsdale Trolley(COS) Scottsdale AZ MB 413.3 418 82.4 245City of Greeley - Transit Services(GET) Greeley CO MB 410.1 419 31.0 405Battle Creek Transit(BCT) Battle Creek MI MB 408.2 420 27.9 417
Okaloosa County Board of County CommissionersFort Walton Beach FL MB 407.7 421 34.7 383
Martz Group, National Coach Works of Virginia(NCW) Fredericksburg VA MB 407.1 422 12.2 494Mid-Ohio Valley Transit Authority(Easy Rider) Parkersburg WV MB 405.7 423 31.8 396Washington County Transit(County Commuter) Hagerstown MD MB 405.7 424 26.3 425High Point Transit(Hi tran) High Point NC MB 398.1 425 28.8 414City of San Luis Obispo(SLO Transit) San Luis Obispo CA MB 396.4 426 34.7 384City of Redondo Beach - Beach Cities Transit(BCT) Redondo Beach CA MB 395.3 427 33.2 392Abilene Transit Management, Inc(CityLink) Abilene TX MB 392.9 428 28.3 416Cities Area Transit(CAT) Grand Forks ND MB 387.9 429 25.7 427Harford Transit(HT) Abingdon MD MB 385.5 430 21.3 441Lake County Board of County Commissioners(LCBOCC) Tavares FL MB 384.7 431 23.2 432City of Corvallis(CTS) Corvallis OR MB 373.9 432 26.9 423Bettendorf Transit System(BT) Bettendorf IA MB 370.1 433 19.6 453City of Jackson Transportation Authority(JTA) Jackson MI MB 369.3 434 27.5 421Concho Valley Transit District(CVTD) San Angelo TX MB 368.9 435 22.5 436Hendrick Hudson Bus Lines, Inc.(HHBL) Newburgh NY MB 362.9 436 13.5 490Nashua Transit System(NTS) Nashua NH MB 360.8 437 25.9 426Texoma Area Paratransit System, Inc(TAPS) Sherman TX MB 344.8 438 13.6 489Petersburg Area Transit(PAT) Petersburg VA MB 344.0 439 38.4 371The City of Cheyenne Transit Program(CTP) Cheyenne WY MB 340.0 440 23.0 434City of Porterville(C.O.L.T.) Porterville CA MB 339.4 441 24.3 430Greater Hartford Transit District(GHTD) Hartford CT MB 339.2 442 19.2 454Council on Aging of St. Lucie, Inc.(CT) Fort Pierce FL MB 336.5 443 24.9 429City of Dubuque(KeyLine) Dubuque IA MB 333.7 444 27.7 419Clarkstown Mini-Trans Nanuet NY MB 330.3 445 19.0 457Greater Glens Falls Transit System(GGFT) Queensbury NY MB 329.8 446 18.5 460Fort Bend County Public Transportation(Fort Bend Transit) Sugar Land TX MB 328.2 447 15.4 478City of Beloit Transit System(BTS) Beloit WI MB 324.4 448 20.7 447
Huntington Area Rapid Transit(HART) Huntington Station NY MB 318.2 449 22.5 437
Bis-Man Transit Board(CAT) Bismarck ND MB 317.9 450 19.8 450City of Valparaiso Valparaiso IN MB 313.8 451 15.3 480City of Jefferson(JEFFTRAN) Jefferson City MO MB 306.0 452 17.8 467
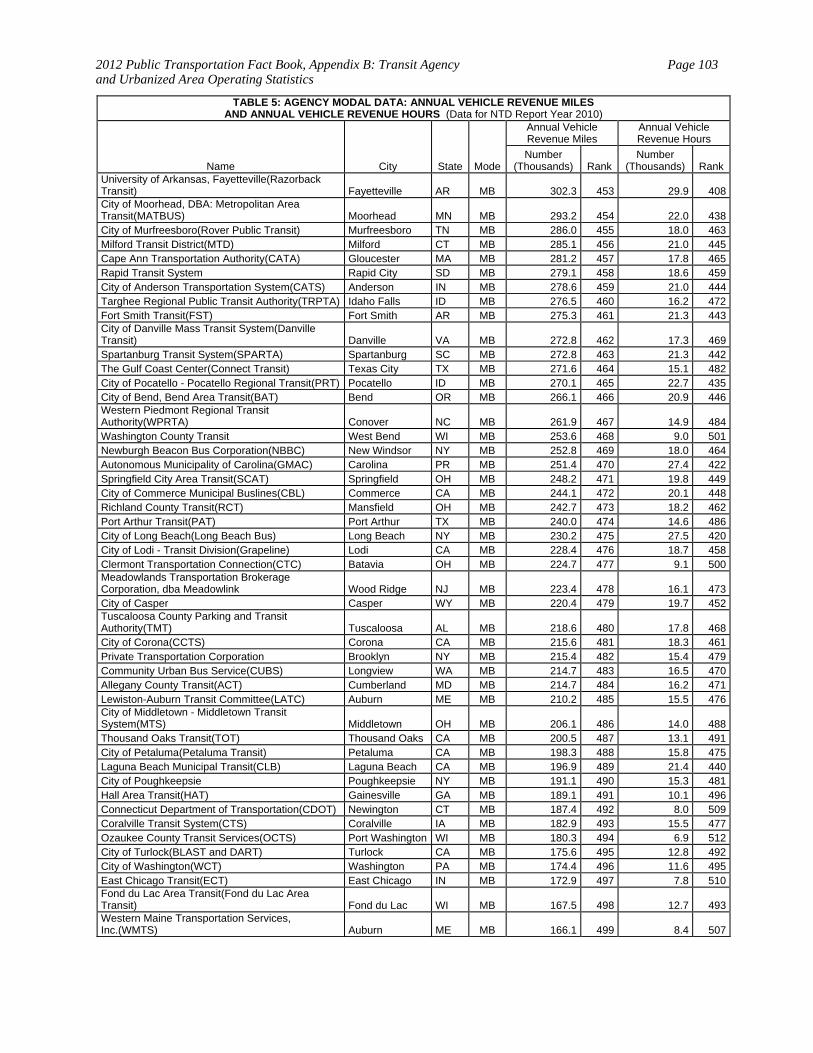
2012 Public Transportation Fact Book, Appendix B: Transit Agency and Urbanized Area Operating Statistics
Page 103
TABLE 5: AGENCY MODAL DATA: ANNUAL VEHICLE REVENUE MILES AND ANNUAL VEHICLE REVENUE HOURS (Data for NTD Report Year 2010)
Name City State Mode
Annual Vehicle Revenue Miles
Annual Vehicle Revenue Hours
Number (Thousands) Rank
Number (Thousands) Rank
University of Arkansas, Fayetteville(Razorback Transit) Fayetteville AR MB 302.3 453 29.9 408City of Moorhead, DBA: Metropolitan Area Transit(MATBUS) Moorhead MN MB 293.2 454 22.0 438City of Murfreesboro(Rover Public Transit) Murfreesboro TN MB 286.0 455 18.0 463Milford Transit District(MTD) Milford CT MB 285.1 456 21.0 445Cape Ann Transportation Authority(CATA) Gloucester MA MB 281.2 457 17.8 465Rapid Transit System Rapid City SD MB 279.1 458 18.6 459City of Anderson Transportation System(CATS) Anderson IN MB 278.6 459 21.0 444Targhee Regional Public Transit Authority(TRPTA) Idaho Falls ID MB 276.5 460 16.2 472Fort Smith Transit(FST) Fort Smith AR MB 275.3 461 21.3 443City of Danville Mass Transit System(Danville Transit) Danville VA MB 272.8 462 17.3 469Spartanburg Transit System(SPARTA) Spartanburg SC MB 272.8 463 21.3 442The Gulf Coast Center(Connect Transit) Texas City TX MB 271.6 464 15.1 482City of Pocatello - Pocatello Regional Transit(PRT) Pocatello ID MB 270.1 465 22.7 435City of Bend, Bend Area Transit(BAT) Bend OR MB 266.1 466 20.9 446Western Piedmont Regional Transit Authority(WPRTA) Conover NC MB 261.9 467 14.9 484Washington County Transit West Bend WI MB 253.6 468 9.0 501Newburgh Beacon Bus Corporation(NBBC) New Windsor NY MB 252.8 469 18.0 464Autonomous Municipality of Carolina(GMAC) Carolina PR MB 251.4 470 27.4 422Springfield City Area Transit(SCAT) Springfield OH MB 248.2 471 19.8 449City of Commerce Municipal Buslines(CBL) Commerce CA MB 244.1 472 20.1 448Richland County Transit(RCT) Mansfield OH MB 242.7 473 18.2 462Port Arthur Transit(PAT) Port Arthur TX MB 240.0 474 14.6 486City of Long Beach(Long Beach Bus) Long Beach NY MB 230.2 475 27.5 420City of Lodi - Transit Division(Grapeline) Lodi CA MB 228.4 476 18.7 458Clermont Transportation Connection(CTC) Batavia OH MB 224.7 477 9.1 500Meadowlands Transportation Brokerage Corporation, dba Meadowlink Wood Ridge NJ MB 223.4 478 16.1 473City of Casper Casper WY MB 220.4 479 19.7 452Tuscaloosa County Parking and Transit Authority(TMT) Tuscaloosa AL MB 218.6 480 17.8 468City of Corona(CCTS) Corona CA MB 215.6 481 18.3 461Private Transportation Corporation Brooklyn NY MB 215.4 482 15.4 479Community Urban Bus Service(CUBS) Longview WA MB 214.7 483 16.5 470Allegany County Transit(ACT) Cumberland MD MB 214.7 484 16.2 471Lewiston-Auburn Transit Committee(LATC) Auburn ME MB 210.2 485 15.5 476City of Middletown - Middletown Transit System(MTS) Middletown OH MB 206.1 486 14.0 488Thousand Oaks Transit(TOT) Thousand Oaks CA MB 200.5 487 13.1 491City of Petaluma(Petaluma Transit) Petaluma CA MB 198.3 488 15.8 475Laguna Beach Municipal Transit(CLB) Laguna Beach CA MB 196.9 489 21.4 440City of Poughkeepsie Poughkeepsie NY MB 191.1 490 15.3 481Hall Area Transit(HAT) Gainesville GA MB 189.1 491 10.1 496Connecticut Department of Transportation(CDOT) Newington CT MB 187.4 492 8.0 509Coralville Transit System(CTS) Coralville IA MB 182.9 493 15.5 477Ozaukee County Transit Services(OCTS) Port Washington WI MB 180.3 494 6.9 512City of Turlock(BLAST and DART) Turlock CA MB 175.6 495 12.8 492City of Washington(WCT) Washington PA MB 174.4 496 11.6 495East Chicago Transit(ECT) East Chicago IN MB 172.9 497 7.8 510Fond du Lac Area Transit(Fond du Lac Area Transit) Fond du Lac WI MB 167.5 498 12.7 493Western Maine Transportation Services, Inc.(WMTS) Auburn ME MB 166.1 499 8.4 507
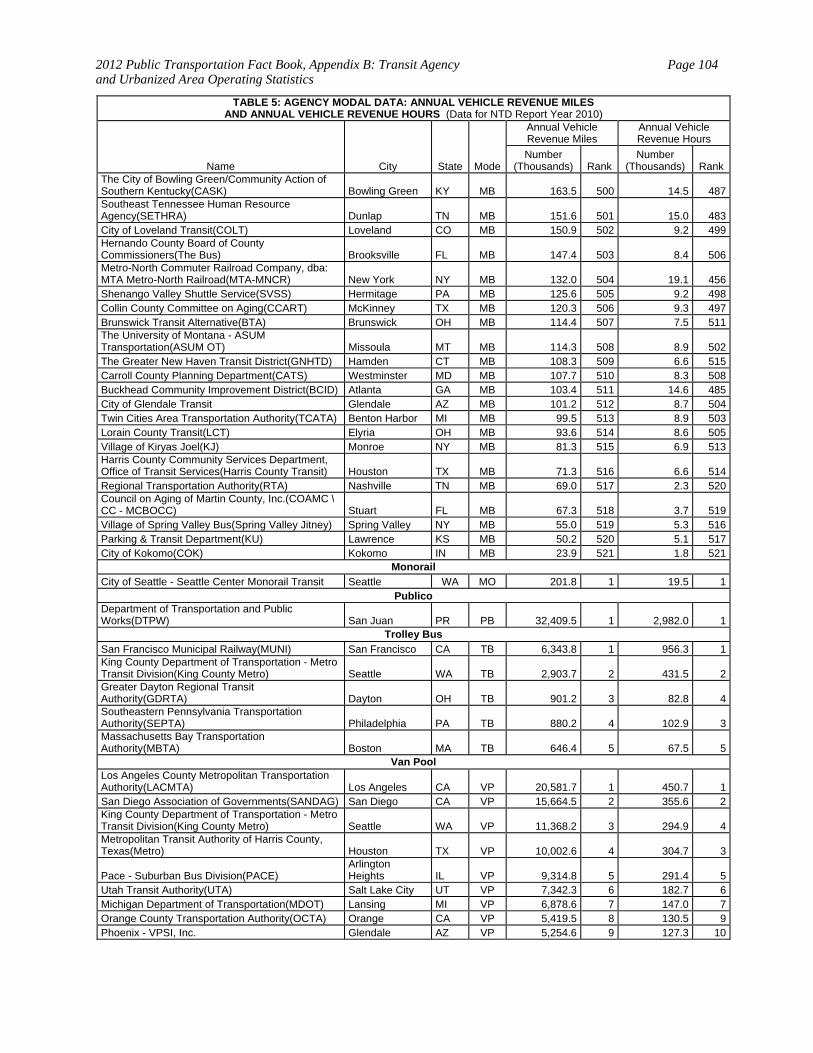
2012 Public Transportation Fact Book, Appendix B: Transit Agency and Urbanized Area Operating Statistics
Page 104
TABLE 5: AGENCY MODAL DATA: ANNUAL VEHICLE REVENUE MILES AND ANNUAL VEHICLE REVENUE HOURS (Data for NTD Report Year 2010)
Name City State Mode
Annual Vehicle Revenue Miles
Annual Vehicle Revenue Hours
Number (Thousands) Rank
Number (Thousands) Rank
The City of Bowling Green/Community Action of Southern Kentucky(CASK) Bowling Green KY MB 163.5 500 14.5 487Southeast Tennessee Human Resource Agency(SETHRA) Dunlap TN MB 151.6 501 15.0 483City of Loveland Transit(COLT) Loveland CO MB 150.9 502 9.2 499Hernando County Board of County Commissioners(The Bus) Brooksville FL MB 147.4 503 8.4 506Metro-North Commuter Railroad Company, dba: MTA Metro-North Railroad(MTA-MNCR) New York NY MB 132.0 504 19.1 456Shenango Valley Shuttle Service(SVSS) Hermitage PA MB 125.6 505 9.2 498Collin County Committee on Aging(CCART) McKinney TX MB 120.3 506 9.3 497Brunswick Transit Alternative(BTA) Brunswick OH MB 114.4 507 7.5 511The University of Montana - ASUM Transportation(ASUM OT) Missoula MT MB 114.3 508 8.9 502The Greater New Haven Transit District(GNHTD) Hamden CT MB 108.3 509 6.6 515Carroll County Planning Department(CATS) Westminster MD MB 107.7 510 8.3 508Buckhead Community Improvement District(BCID) Atlanta GA MB 103.4 511 14.6 485City of Glendale Transit Glendale AZ MB 101.2 512 8.7 504Twin Cities Area Transportation Authority(TCATA) Benton Harbor MI MB 99.5 513 8.9 503Lorain County Transit(LCT) Elyria OH MB 93.6 514 8.6 505Village of Kiryas Joel(KJ) Monroe NY MB 81.3 515 6.9 513Harris County Community Services Department, Office of Transit Services(Harris County Transit) Houston TX MB 71.3 516 6.6 514Regional Transportation Authority(RTA) Nashville TN MB 69.0 517 2.3 520Council on Aging of Martin County, Inc.(COAMC \CC - MCBOCC) Stuart FL MB 67.3 518 3.7 519Village of Spring Valley Bus(Spring Valley Jitney) Spring Valley NY MB 55.0 519 5.3 516Parking & Transit Department(KU) Lawrence KS MB 50.2 520 5.1 517City of Kokomo(COK) Kokomo IN MB 23.9 521 1.8 521
Monorail
City of Seattle - Seattle Center Monorail Transit Seattle WA MO 201.8 1 19.5 1Publico
Department of Transportation and Public Works(DTPW) San Juan PR PB 32,409.5 1 2,982.0 1
Trolley Bus
San Francisco Municipal Railway(MUNI) San Francisco CA TB 6,343.8 1 956.3 1King County Department of Transportation - Metro Transit Division(King County Metro) Seattle WA TB 2,903.7 2 431.5 2Greater Dayton Regional Transit Authority(GDRTA) Dayton OH TB 901.2 3 82.8 4Southeastern Pennsylvania Transportation Authority(SEPTA) Philadelphia PA TB 880.2 4 102.9 3Massachusetts Bay Transportation Authority(MBTA) Boston MA TB 646.4 5 67.5 5
Van Pool Los Angeles County Metropolitan Transportation Authority(LACMTA) Los Angeles CA VP 20,581.7 1 450.7 1San Diego Association of Governments(SANDAG) San Diego CA VP 15,664.5 2 355.6 2King County Department of Transportation - Metro Transit Division(King County Metro) Seattle WA VP 11,368.2 3 294.9 4Metropolitan Transit Authority of Harris County, Texas(Metro) Houston TX VP 10,002.6 4 304.7 3
Pace - Suburban Bus Division(PACE) Arlington Heights IL VP 9,314.8 5 291.4 5
Utah Transit Authority(UTA) Salt Lake City UT VP 7,342.3 6 182.7 6Michigan Department of Transportation(MDOT) Lansing MI VP 6,878.6 7 147.0 7Orange County Transportation Authority(OCTA) Orange CA VP 5,419.5 8 130.5 9Phoenix - VPSI, Inc. Glendale AZ VP 5,254.6 9 127.3 10
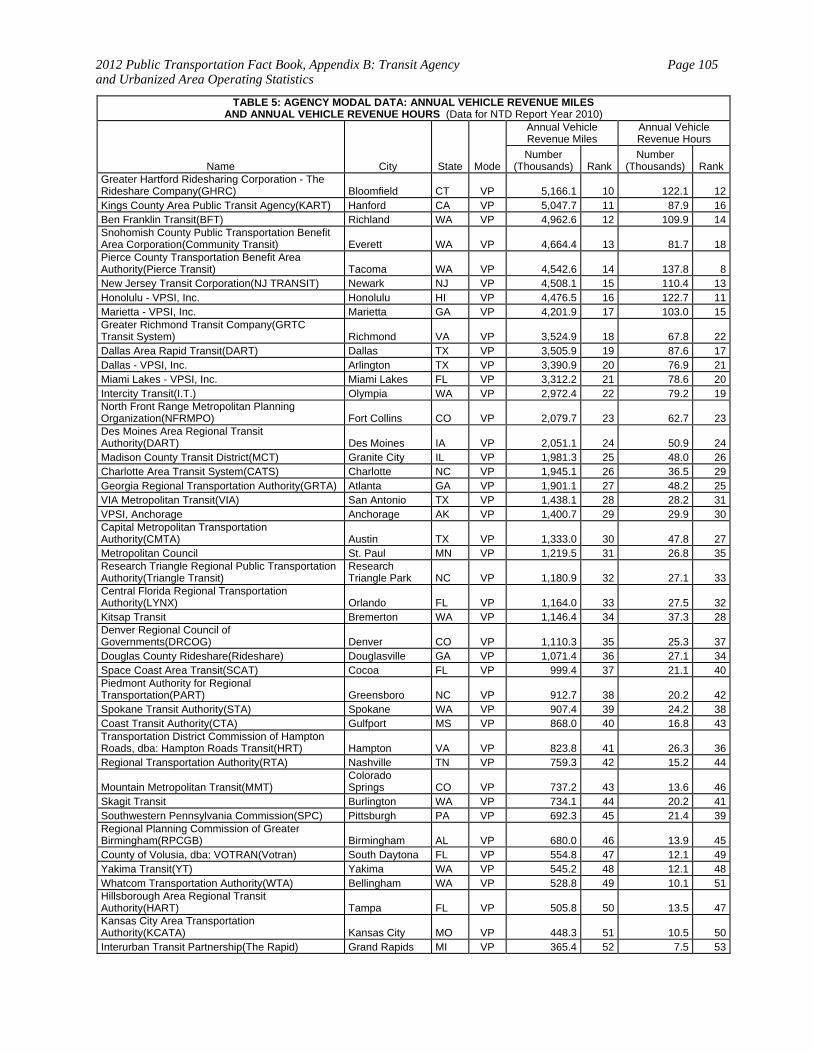
2012 Public Transportation Fact Book, Appendix B: Transit Agency and Urbanized Area Operating Statistics
Page 105
TABLE 5: AGENCY MODAL DATA: ANNUAL VEHICLE REVENUE MILES AND ANNUAL VEHICLE REVENUE HOURS (Data for NTD Report Year 2010)
Name City State Mode
Annual Vehicle Revenue Miles
Annual Vehicle Revenue Hours
Number (Thousands) Rank
Number (Thousands) Rank
Greater Hartford Ridesharing Corporation - The Rideshare Company(GHRC) Bloomfield CT VP 5,166.1 10 122.1 12Kings County Area Public Transit Agency(KART) Hanford CA VP 5,047.7 11 87.9 16Ben Franklin Transit(BFT) Richland WA VP 4,962.6 12 109.9 14Snohomish County Public Transportation Benefit Area Corporation(Community Transit) Everett WA VP 4,664.4 13 81.7 18Pierce County Transportation Benefit Area Authority(Pierce Transit) Tacoma WA VP 4,542.6 14 137.8 8New Jersey Transit Corporation(NJ TRANSIT) Newark NJ VP 4,508.1 15 110.4 13Honolulu - VPSI, Inc. Honolulu HI VP 4,476.5 16 122.7 11Marietta - VPSI, Inc. Marietta GA VP 4,201.9 17 103.0 15Greater Richmond Transit Company(GRTC Transit System) Richmond VA VP 3,524.9 18 67.8 22Dallas Area Rapid Transit(DART) Dallas TX VP 3,505.9 19 87.6 17Dallas - VPSI, Inc. Arlington TX VP 3,390.9 20 76.9 21Miami Lakes - VPSI, Inc. Miami Lakes FL VP 3,312.2 21 78.6 20Intercity Transit(I.T.) Olympia WA VP 2,972.4 22 79.2 19North Front Range Metropolitan Planning Organization(NFRMPO) Fort Collins CO VP 2,079.7 23 62.7 23Des Moines Area Regional Transit Authority(DART) Des Moines IA VP 2,051.1 24 50.9 24Madison County Transit District(MCT) Granite City IL VP 1,981.3 25 48.0 26Charlotte Area Transit System(CATS) Charlotte NC VP 1,945.1 26 36.5 29Georgia Regional Transportation Authority(GRTA) Atlanta GA VP 1,901.1 27 48.2 25VIA Metropolitan Transit(VIA) San Antonio TX VP 1,438.1 28 28.2 31VPSI, Anchorage Anchorage AK VP 1,400.7 29 29.9 30Capital Metropolitan Transportation Authority(CMTA) Austin TX VP 1,333.0 30 47.8 27Metropolitan Council St. Paul MN VP 1,219.5 31 26.8 35Research Triangle Regional Public Transportation Authority(Triangle Transit)
Research Triangle Park NC VP 1,180.9 32 27.1 33
Central Florida Regional Transportation Authority(LYNX) Orlando FL VP 1,164.0 33 27.5 32Kitsap Transit Bremerton WA VP 1,146.4 34 37.3 28Denver Regional Council of Governments(DRCOG) Denver CO VP 1,110.3 35 25.3 37Douglas County Rideshare(Rideshare) Douglasville GA VP 1,071.4 36 27.1 34Space Coast Area Transit(SCAT) Cocoa FL VP 999.4 37 21.1 40Piedmont Authority for Regional Transportation(PART) Greensboro NC VP 912.7 38 20.2 42Spokane Transit Authority(STA) Spokane WA VP 907.4 39 24.2 38Coast Transit Authority(CTA) Gulfport MS VP 868.0 40 16.8 43Transportation District Commission of Hampton Roads, dba: Hampton Roads Transit(HRT) Hampton VA VP 823.8 41 26.3 36Regional Transportation Authority(RTA) Nashville TN VP 759.3 42 15.2 44
Mountain Metropolitan Transit(MMT) Colorado Springs CO VP 737.2 43 13.6 46
Skagit Transit Burlington WA VP 734.1 44 20.2 41Southwestern Pennsylvania Commission(SPC) Pittsburgh PA VP 692.3 45 21.4 39Regional Planning Commission of Greater Birmingham(RPCGB) Birmingham AL VP 680.0 46 13.9 45County of Volusia, dba: VOTRAN(Votran) South Daytona FL VP 554.8 47 12.1 49Yakima Transit(YT) Yakima WA VP 545.2 48 12.1 48Whatcom Transportation Authority(WTA) Bellingham WA VP 528.8 49 10.1 51Hillsborough Area Regional Transit Authority(HART) Tampa FL VP 505.8 50 13.5 47Kansas City Area Transportation Authority(KCATA) Kansas City MO VP 448.3 51 10.5 50Interurban Transit Partnership(The Rapid) Grand Rapids MI VP 365.4 52 7.5 53
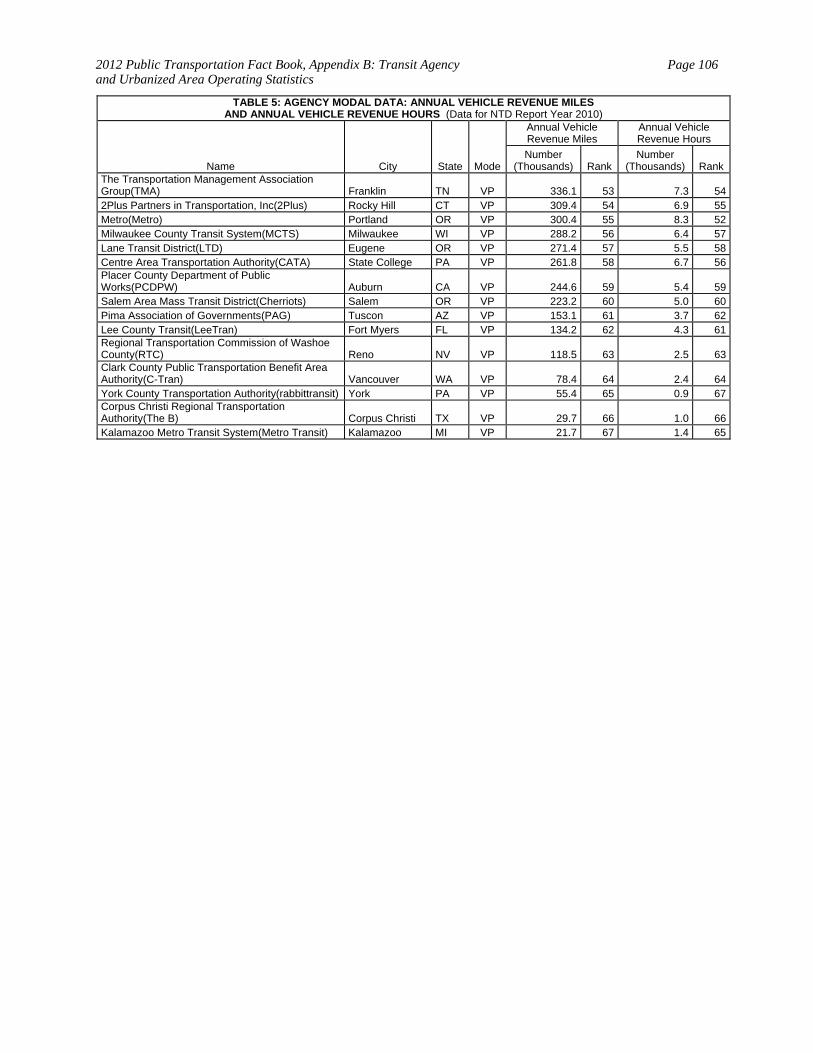
2012 Public Transportation Fact Book, Appendix B: Transit Agency and Urbanized Area Operating Statistics
Page 106
TABLE 5: AGENCY MODAL DATA: ANNUAL VEHICLE REVENUE MILES AND ANNUAL VEHICLE REVENUE HOURS (Data for NTD Report Year 2010)
Name City State Mode
Annual Vehicle Revenue Miles
Annual Vehicle Revenue Hours
Number (Thousands) Rank
Number (Thousands) Rank
The Transportation Management Association Group(TMA) Franklin TN VP 336.1 53 7.3 542Plus Partners in Transportation, Inc(2Plus) Rocky Hill CT VP 309.4 54 6.9 55Metro(Metro) Portland OR VP 300.4 55 8.3 52Milwaukee County Transit System(MCTS) Milwaukee WI VP 288.2 56 6.4 57Lane Transit District(LTD) Eugene OR VP 271.4 57 5.5 58Centre Area Transportation Authority(CATA) State College PA VP 261.8 58 6.7 56Placer County Department of Public Works(PCDPW) Auburn CA VP 244.6 59 5.4 59Salem Area Mass Transit District(Cherriots) Salem OR VP 223.2 60 5.0 60Pima Association of Governments(PAG) Tuscon AZ VP 153.1 61 3.7 62Lee County Transit(LeeTran) Fort Myers FL VP 134.2 62 4.3 61Regional Transportation Commission of Washoe County(RTC) Reno NV VP 118.5 63 2.5 63Clark County Public Transportation Benefit Area Authority(C-Tran) Vancouver WA VP 78.4 64 2.4 64York County Transportation Authority(rabbittransit) York PA VP 55.4 65 0.9 67Corpus Christi Regional Transportation Authority(The B) Corpus Christi TX VP 29.7 66 1.0 66Kalamazoo Metro Transit System(Metro Transit) Kalamazoo MI VP 21.7 67 1.4 65
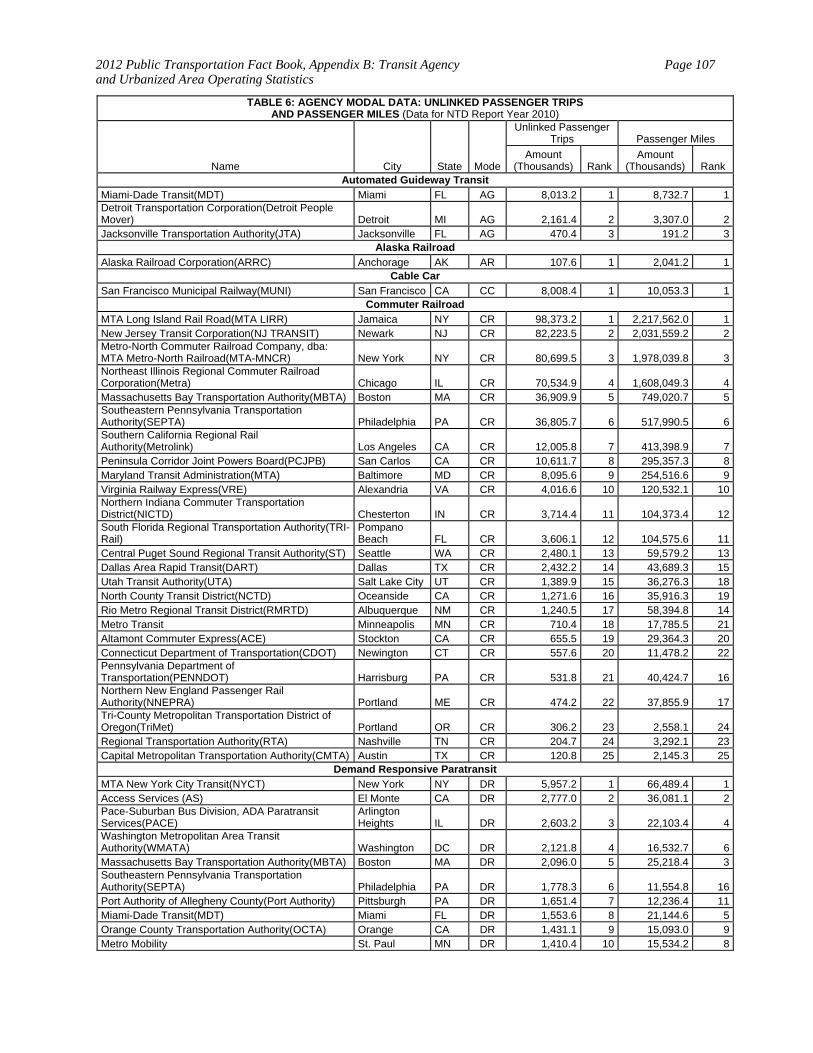
2012 Public Transportation Fact Book, Appendix B: Transit Agency and Urbanized Area Operating Statistics
Page 107
TABLE 6: AGENCY MODAL DATA: UNLINKED PASSENGER TRIPS AND PASSENGER MILES (Data for NTD Report Year 2010)
Name City State Mode
Unlinked Passenger Trips Passenger Miles
Amount (Thousands) Rank
Amount (Thousands) Rank
Automated Guideway Transit
Miami-Dade Transit(MDT) Miami FL AG 8,013.2 1 8,732.7 1Detroit Transportation Corporation(Detroit People Mover) Detroit MI AG 2,161.4 2 3,307.0 2Jacksonville Transportation Authority(JTA) Jacksonville FL AG 470.4 3 191.2 3
Alaska Railroad
Alaska Railroad Corporation(ARRC) Anchorage AK AR 107.6 1 2,041.2 1Cable Car
San Francisco Municipal Railway(MUNI) San Francisco CA CC 8,008.4 1 10,053.3 1Commuter Railroad
MTA Long Island Rail Road(MTA LIRR) Jamaica NY CR 98,373.2 1 2,217,562.0 1New Jersey Transit Corporation(NJ TRANSIT) Newark NJ CR 82,223.5 2 2,031,559.2 2Metro-North Commuter Railroad Company, dba: MTA Metro-North Railroad(MTA-MNCR) New York NY CR 80,699.5 3 1,978,039.8 3Northeast Illinois Regional Commuter Railroad Corporation(Metra) Chicago IL CR 70,534.9 4 1,608,049.3 4Massachusetts Bay Transportation Authority(MBTA) Boston MA CR 36,909.9 5 749,020.7 5Southeastern Pennsylvania Transportation Authority(SEPTA) Philadelphia PA CR 36,805.7 6 517,990.5 6Southern California Regional Rail Authority(Metrolink) Los Angeles CA CR 12,005.8 7 413,398.9 7Peninsula Corridor Joint Powers Board(PCJPB) San Carlos CA CR 10,611.7 8 295,357.3 8Maryland Transit Administration(MTA) Baltimore MD CR 8,095.6 9 254,516.6 9Virginia Railway Express(VRE) Alexandria VA CR 4,016.6 10 120,532.1 10Northern Indiana Commuter Transportation District(NICTD) Chesterton IN CR 3,714.4 11 104,373.4 12South Florida Regional Transportation Authority(TRI-Rail)
Pompano Beach FL CR 3,606.1 12 104,575.6 11
Central Puget Sound Regional Transit Authority(ST) Seattle WA CR 2,480.1 13 59,579.2 13Dallas Area Rapid Transit(DART) Dallas TX CR 2,432.2 14 43,689.3 15Utah Transit Authority(UTA) Salt Lake City UT CR 1,389.9 15 36,276.3 18North County Transit District(NCTD) Oceanside CA CR 1,271.6 16 35,916.3 19Rio Metro Regional Transit District(RMRTD) Albuquerque NM CR 1,240.5 17 58,394.8 14Metro Transit Minneapolis MN CR 710.4 18 17,785.5 21Altamont Commuter Express(ACE) Stockton CA CR 655.5 19 29,364.3 20Connecticut Department of Transportation(CDOT) Newington CT CR 557.6 20 11,478.2 22Pennsylvania Department of Transportation(PENNDOT) Harrisburg PA CR 531.8 21 40,424.7 16Northern New England Passenger Rail Authority(NNEPRA) Portland ME CR 474.2 22 37,855.9 17Tri-County Metropolitan Transportation District of Oregon(TriMet) Portland OR CR 306.2 23 2,558.1 24Regional Transportation Authority(RTA) Nashville TN CR 204.7 24 3,292.1 23Capital Metropolitan Transportation Authority(CMTA) Austin TX CR 120.8 25 2,145.3 25
Demand Responsive Paratransit
MTA New York City Transit(NYCT) New York NY DR 5,957.2 1 66,489.4 1Access Services (AS) El Monte CA DR 2,777.0 2 36,081.1 2Pace-Suburban Bus Division, ADA Paratransit Services(PACE)
Arlington Heights IL DR 2,603.2 3 22,103.4 4
Washington Metropolitan Area Transit Authority(WMATA) Washington DC DR 2,121.8 4 16,532.7 6Massachusetts Bay Transportation Authority(MBTA) Boston MA DR 2,096.0 5 25,218.4 3Southeastern Pennsylvania Transportation Authority(SEPTA) Philadelphia PA DR 1,778.3 6 11,554.8 16Port Authority of Allegheny County(Port Authority) Pittsburgh PA DR 1,651.4 7 12,236.4 11Miami-Dade Transit(MDT) Miami FL DR 1,553.6 8 21,144.6 5Orange County Transportation Authority(OCTA) Orange CA DR 1,431.1 9 15,093.0 9Metro Mobility St. Paul MN DR 1,410.4 10 15,534.2 8
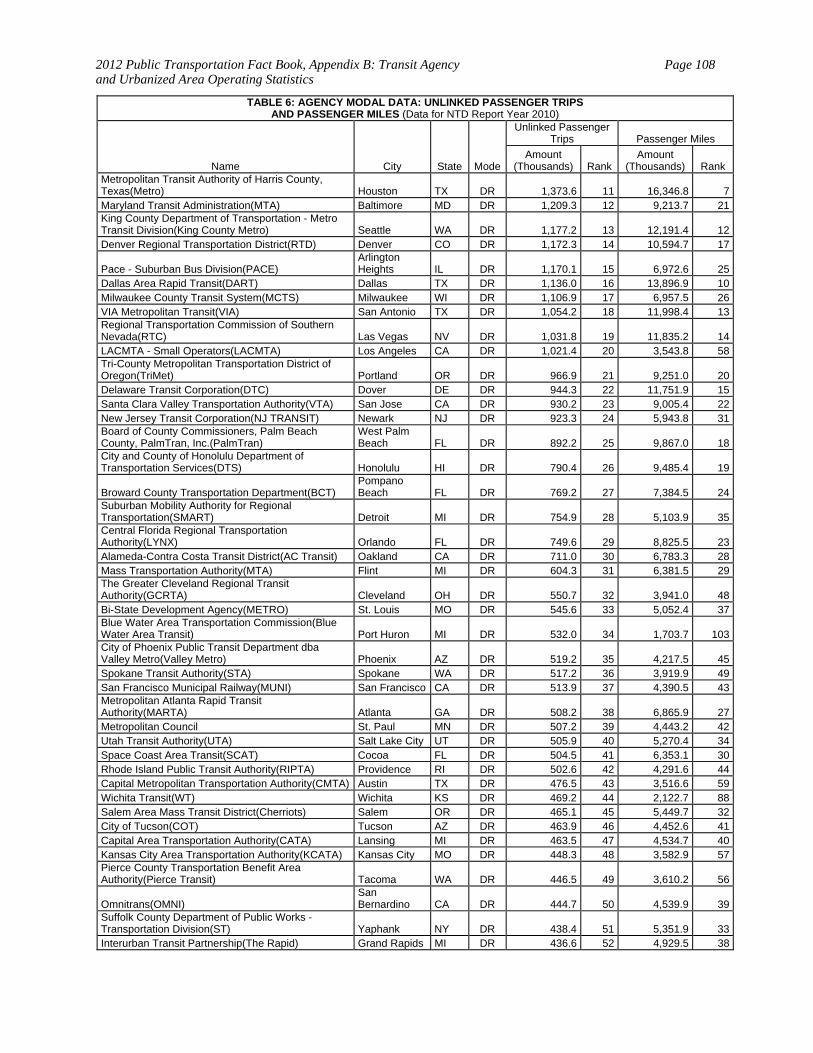
2012 Public Transportation Fact Book, Appendix B: Transit Agency and Urbanized Area Operating Statistics
Page 108
TABLE 6: AGENCY MODAL DATA: UNLINKED PASSENGER TRIPS AND PASSENGER MILES (Data for NTD Report Year 2010)
Name City State Mode
Unlinked Passenger Trips Passenger Miles
Amount (Thousands) Rank
Amount (Thousands) Rank
Metropolitan Transit Authority of Harris County, Texas(Metro) Houston TX DR 1,373.6 11 16,346.8 7Maryland Transit Administration(MTA) Baltimore MD DR 1,209.3 12 9,213.7 21King County Department of Transportation - Metro Transit Division(King County Metro) Seattle WA DR 1,177.2 13 12,191.4 12Denver Regional Transportation District(RTD) Denver CO DR 1,172.3 14 10,594.7 17
Pace - Suburban Bus Division(PACE) Arlington Heights IL DR 1,170.1 15 6,972.6 25
Dallas Area Rapid Transit(DART) Dallas TX DR 1,136.0 16 13,896.9 10Milwaukee County Transit System(MCTS) Milwaukee WI DR 1,106.9 17 6,957.5 26VIA Metropolitan Transit(VIA) San Antonio TX DR 1,054.2 18 11,998.4 13Regional Transportation Commission of Southern Nevada(RTC) Las Vegas NV DR 1,031.8 19 11,835.2 14LACMTA - Small Operators(LACMTA) Los Angeles CA DR 1,021.4 20 3,543.8 58Tri-County Metropolitan Transportation District of Oregon(TriMet) Portland OR DR 966.9 21 9,251.0 20Delaware Transit Corporation(DTC) Dover DE DR 944.3 22 11,751.9 15Santa Clara Valley Transportation Authority(VTA) San Jose CA DR 930.2 23 9,005.4 22New Jersey Transit Corporation(NJ TRANSIT) Newark NJ DR 923.3 24 5,943.8 31Board of County Commissioners, Palm Beach County, PalmTran, Inc.(PalmTran)
West Palm Beach FL DR 892.2 25 9,867.0 18
City and County of Honolulu Department of Transportation Services(DTS) Honolulu HI DR 790.4 26 9,485.4 19
Broward County Transportation Department(BCT) Pompano Beach FL DR 769.2 27 7,384.5 24
Suburban Mobility Authority for Regional Transportation(SMART) Detroit MI DR 754.9 28 5,103.9 35Central Florida Regional Transportation Authority(LYNX) Orlando FL DR 749.6 29 8,825.5 23Alameda-Contra Costa Transit District(AC Transit) Oakland CA DR 711.0 30 6,783.3 28Mass Transportation Authority(MTA) Flint MI DR 604.3 31 6,381.5 29The Greater Cleveland Regional Transit Authority(GCRTA) Cleveland OH DR 550.7 32 3,941.0 48Bi-State Development Agency(METRO) St. Louis MO DR 545.6 33 5,052.4 37Blue Water Area Transportation Commission(Blue Water Area Transit) Port Huron MI DR 532.0 34 1,703.7 103City of Phoenix Public Transit Department dba Valley Metro(Valley Metro) Phoenix AZ DR 519.2 35 4,217.5 45Spokane Transit Authority(STA) Spokane WA DR 517.2 36 3,919.9 49San Francisco Municipal Railway(MUNI) San Francisco CA DR 513.9 37 4,390.5 43Metropolitan Atlanta Rapid Transit Authority(MARTA) Atlanta GA DR 508.2 38 6,865.9 27Metropolitan Council St. Paul MN DR 507.2 39 4,443.2 42Utah Transit Authority(UTA) Salt Lake City UT DR 505.9 40 5,270.4 34Space Coast Area Transit(SCAT) Cocoa FL DR 504.5 41 6,353.1 30Rhode Island Public Transit Authority(RIPTA) Providence RI DR 502.6 42 4,291.6 44Capital Metropolitan Transportation Authority(CMTA) Austin TX DR 476.5 43 3,516.6 59Wichita Transit(WT) Wichita KS DR 469.2 44 2,122.7 88Salem Area Mass Transit District(Cherriots) Salem OR DR 465.1 45 5,449.7 32City of Tucson(COT) Tucson AZ DR 463.9 46 4,452.6 41Capital Area Transportation Authority(CATA) Lansing MI DR 463.5 47 4,534.7 40Kansas City Area Transportation Authority(KCATA) Kansas City MO DR 448.3 48 3,582.9 57Pierce County Transportation Benefit Area Authority(Pierce Transit) Tacoma WA DR 446.5 49 3,610.2 56
Omnitrans(OMNI) San Bernardino CA DR 444.7 50 4,539.9 39
Suffolk County Department of Public Works - Transportation Division(ST) Yaphank NY DR 438.4 51 5,351.9 33Interurban Transit Partnership(The Rapid) Grand Rapids MI DR 436.6 52 4,929.5 38
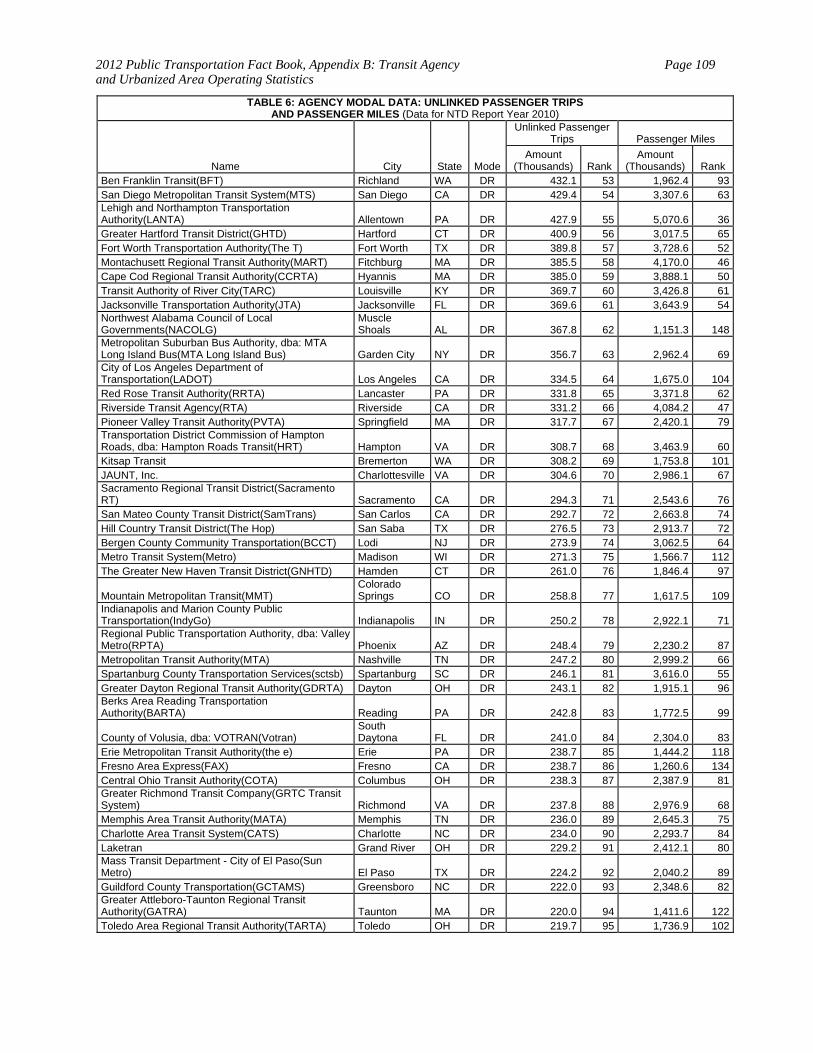
2012 Public Transportation Fact Book, Appendix B: Transit Agency and Urbanized Area Operating Statistics
Page 109
TABLE 6: AGENCY MODAL DATA: UNLINKED PASSENGER TRIPS AND PASSENGER MILES (Data for NTD Report Year 2010)
Name City State Mode
Unlinked Passenger Trips Passenger Miles
Amount (Thousands) Rank
Amount (Thousands) Rank
Ben Franklin Transit(BFT) Richland WA DR 432.1 53 1,962.4 93San Diego Metropolitan Transit System(MTS) San Diego CA DR 429.4 54 3,307.6 63Lehigh and Northampton Transportation Authority(LANTA) Allentown PA DR 427.9 55 5,070.6 36Greater Hartford Transit District(GHTD) Hartford CT DR 400.9 56 3,017.5 65Fort Worth Transportation Authority(The T) Fort Worth TX DR 389.8 57 3,728.6 52Montachusett Regional Transit Authority(MART) Fitchburg MA DR 385.5 58 4,170.0 46Cape Cod Regional Transit Authority(CCRTA) Hyannis MA DR 385.0 59 3,888.1 50Transit Authority of River City(TARC) Louisville KY DR 369.7 60 3,426.8 61Jacksonville Transportation Authority(JTA) Jacksonville FL DR 369.6 61 3,643.9 54Northwest Alabama Council of Local Governments(NACOLG)
Muscle Shoals AL DR 367.8 62 1,151.3 148
Metropolitan Suburban Bus Authority, dba: MTA Long Island Bus(MTA Long Island Bus) Garden City NY DR 356.7 63 2,962.4 69City of Los Angeles Department of Transportation(LADOT) Los Angeles CA DR 334.5 64 1,675.0 104Red Rose Transit Authority(RRTA) Lancaster PA DR 331.8 65 3,371.8 62Riverside Transit Agency(RTA) Riverside CA DR 331.2 66 4,084.2 47Pioneer Valley Transit Authority(PVTA) Springfield MA DR 317.7 67 2,420.1 79Transportation District Commission of Hampton Roads, dba: Hampton Roads Transit(HRT) Hampton VA DR 308.7 68 3,463.9 60Kitsap Transit Bremerton WA DR 308.2 69 1,753.8 101JAUNT, Inc. Charlottesville VA DR 304.6 70 2,986.1 67Sacramento Regional Transit District(Sacramento RT) Sacramento CA DR 294.3 71 2,543.6 76San Mateo County Transit District(SamTrans) San Carlos CA DR 292.7 72 2,663.8 74Hill Country Transit District(The Hop) San Saba TX DR 276.5 73 2,913.7 72Bergen County Community Transportation(BCCT) Lodi NJ DR 273.9 74 3,062.5 64Metro Transit System(Metro) Madison WI DR 271.3 75 1,566.7 112The Greater New Haven Transit District(GNHTD) Hamden CT DR 261.0 76 1,846.4 97
Mountain Metropolitan Transit(MMT) Colorado Springs CO DR 258.8 77 1,617.5 109
Indianapolis and Marion County Public Transportation(IndyGo) Indianapolis IN DR 250.2 78 2,922.1 71Regional Public Transportation Authority, dba: Valley Metro(RPTA) Phoenix AZ DR 248.4 79 2,230.2 87Metropolitan Transit Authority(MTA) Nashville TN DR 247.2 80 2,999.2 66Spartanburg County Transportation Services(sctsb) Spartanburg SC DR 246.1 81 3,616.0 55Greater Dayton Regional Transit Authority(GDRTA) Dayton OH DR 243.1 82 1,915.1 96Berks Area Reading Transportation Authority(BARTA) Reading PA DR 242.8 83 1,772.5 99
County of Volusia, dba: VOTRAN(Votran) South Daytona FL DR 241.0 84 2,304.0 83
Erie Metropolitan Transit Authority(the e) Erie PA DR 238.7 85 1,444.2 118Fresno Area Express(FAX) Fresno CA DR 238.7 86 1,260.6 134Central Ohio Transit Authority(COTA) Columbus OH DR 238.3 87 2,387.9 81Greater Richmond Transit Company(GRTC Transit System) Richmond VA DR 237.8 88 2,976.9 68Memphis Area Transit Authority(MATA) Memphis TN DR 236.0 89 2,645.3 75Charlotte Area Transit System(CATS) Charlotte NC DR 234.0 90 2,293.7 84Laketran Grand River OH DR 229.2 91 2,412.1 80Mass Transit Department - City of El Paso(Sun Metro) El Paso TX DR 224.2 92 2,040.2 89Guildford County Transportation(GCTAMS) Greensboro NC DR 222.0 93 2,348.6 82Greater Attleboro-Taunton Regional Transit Authority(GATRA) Taunton MA DR 220.0 94 1,411.6 122Toledo Area Regional Transit Authority(TARTA) Toledo OH DR 219.7 95 1,736.9 102
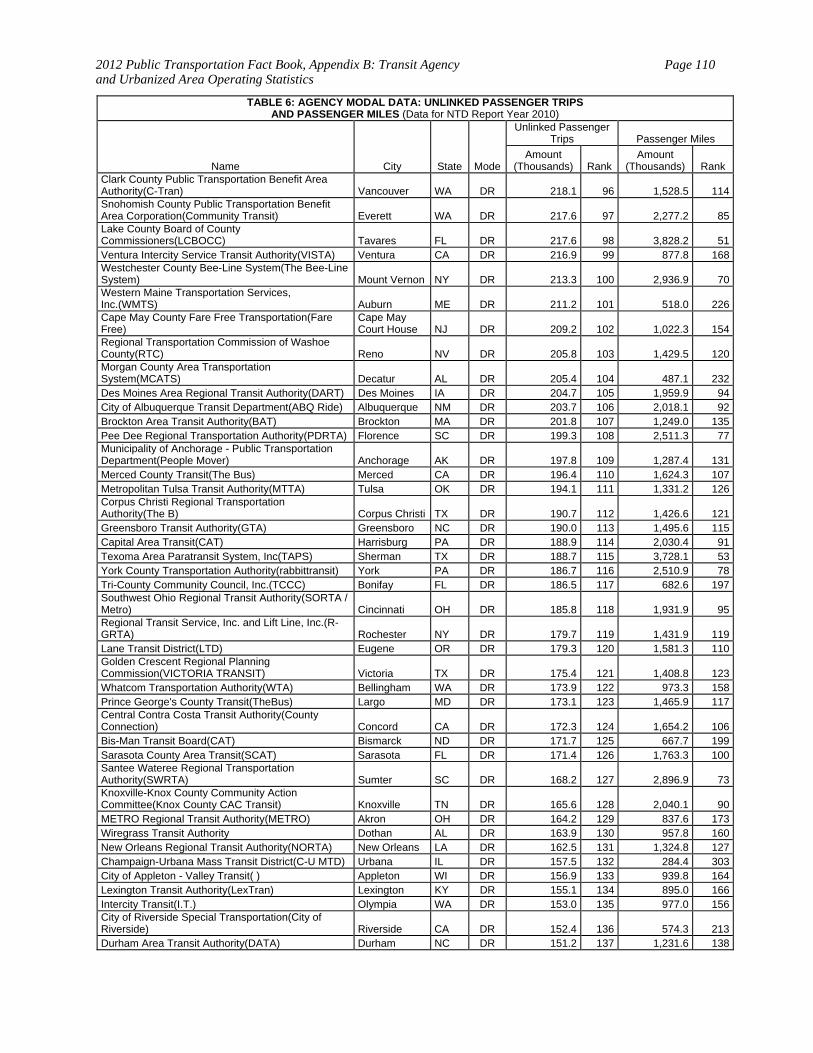
2012 Public Transportation Fact Book, Appendix B: Transit Agency and Urbanized Area Operating Statistics
Page 110
TABLE 6: AGENCY MODAL DATA: UNLINKED PASSENGER TRIPS AND PASSENGER MILES (Data for NTD Report Year 2010)
Name City State Mode
Unlinked Passenger Trips Passenger Miles
Amount (Thousands) Rank
Amount (Thousands) Rank
Clark County Public Transportation Benefit Area Authority(C-Tran) Vancouver WA DR 218.1 96 1,528.5 114Snohomish County Public Transportation Benefit Area Corporation(Community Transit) Everett WA DR 217.6 97 2,277.2 85Lake County Board of County Commissioners(LCBOCC) Tavares FL DR 217.6 98 3,828.2 51Ventura Intercity Service Transit Authority(VISTA) Ventura CA DR 216.9 99 877.8 168Westchester County Bee-Line System(The Bee-Line System) Mount Vernon NY DR 213.3 100 2,936.9 70Western Maine Transportation Services, Inc.(WMTS) Auburn ME DR 211.2 101 518.0 226Cape May County Fare Free Transportation(Fare Free)
Cape May Court House NJ DR 209.2 102 1,022.3 154
Regional Transportation Commission of Washoe County(RTC) Reno NV DR 205.8 103 1,429.5 120Morgan County Area Transportation System(MCATS) Decatur AL DR 205.4 104 487.1 232Des Moines Area Regional Transit Authority(DART) Des Moines IA DR 204.7 105 1,959.9 94City of Albuquerque Transit Department(ABQ Ride) Albuquerque NM DR 203.7 106 2,018.1 92Brockton Area Transit Authority(BAT) Brockton MA DR 201.8 107 1,249.0 135Pee Dee Regional Transportation Authority(PDRTA) Florence SC DR 199.3 108 2,511.3 77Municipality of Anchorage - Public Transportation Department(People Mover) Anchorage AK DR 197.8 109 1,287.4 131Merced County Transit(The Bus) Merced CA DR 196.4 110 1,624.3 107Metropolitan Tulsa Transit Authority(MTTA) Tulsa OK DR 194.1 111 1,331.2 126Corpus Christi Regional Transportation Authority(The B) Corpus Christi TX DR 190.7 112 1,426.6 121Greensboro Transit Authority(GTA) Greensboro NC DR 190.0 113 1,495.6 115Capital Area Transit(CAT) Harrisburg PA DR 188.9 114 2,030.4 91Texoma Area Paratransit System, Inc(TAPS) Sherman TX DR 188.7 115 3,728.1 53York County Transportation Authority(rabbittransit) York PA DR 186.7 116 2,510.9 78Tri-County Community Council, Inc.(TCCC) Bonifay FL DR 186.5 117 682.6 197Southwest Ohio Regional Transit Authority(SORTA / Metro) Cincinnati OH DR 185.8 118 1,931.9 95Regional Transit Service, Inc. and Lift Line, Inc.(R-GRTA) Rochester NY DR 179.7 119 1,431.9 119Lane Transit District(LTD) Eugene OR DR 179.3 120 1,581.3 110Golden Crescent Regional Planning Commission(VICTORIA TRANSIT) Victoria TX DR 175.4 121 1,408.8 123Whatcom Transportation Authority(WTA) Bellingham WA DR 173.9 122 973.3 158Prince George's County Transit(TheBus) Largo MD DR 173.1 123 1,465.9 117Central Contra Costa Transit Authority(County Connection) Concord CA DR 172.3 124 1,654.2 106Bis-Man Transit Board(CAT) Bismarck ND DR 171.7 125 667.7 199Sarasota County Area Transit(SCAT) Sarasota FL DR 171.4 126 1,763.3 100Santee Wateree Regional Transportation Authority(SWRTA) Sumter SC DR 168.2 127 2,896.9 73Knoxville-Knox County Community Action Committee(Knox County CAC Transit) Knoxville TN DR 165.6 128 2,040.1 90METRO Regional Transit Authority(METRO) Akron OH DR 164.2 129 837.6 173Wiregrass Transit Authority Dothan AL DR 163.9 130 957.8 160New Orleans Regional Transit Authority(NORTA) New Orleans LA DR 162.5 131 1,324.8 127Champaign-Urbana Mass Transit District(C-U MTD) Urbana IL DR 157.5 132 284.4 303City of Appleton - Valley Transit( ) Appleton WI DR 156.9 133 939.8 164Lexington Transit Authority(LexTran) Lexington KY DR 155.1 134 895.0 166Intercity Transit(I.T.) Olympia WA DR 153.0 135 977.0 156City of Riverside Special Transportation(City of Riverside) Riverside CA DR 152.4 136 574.3 213Durham Area Transit Authority(DATA) Durham NC DR 151.2 137 1,231.6 138
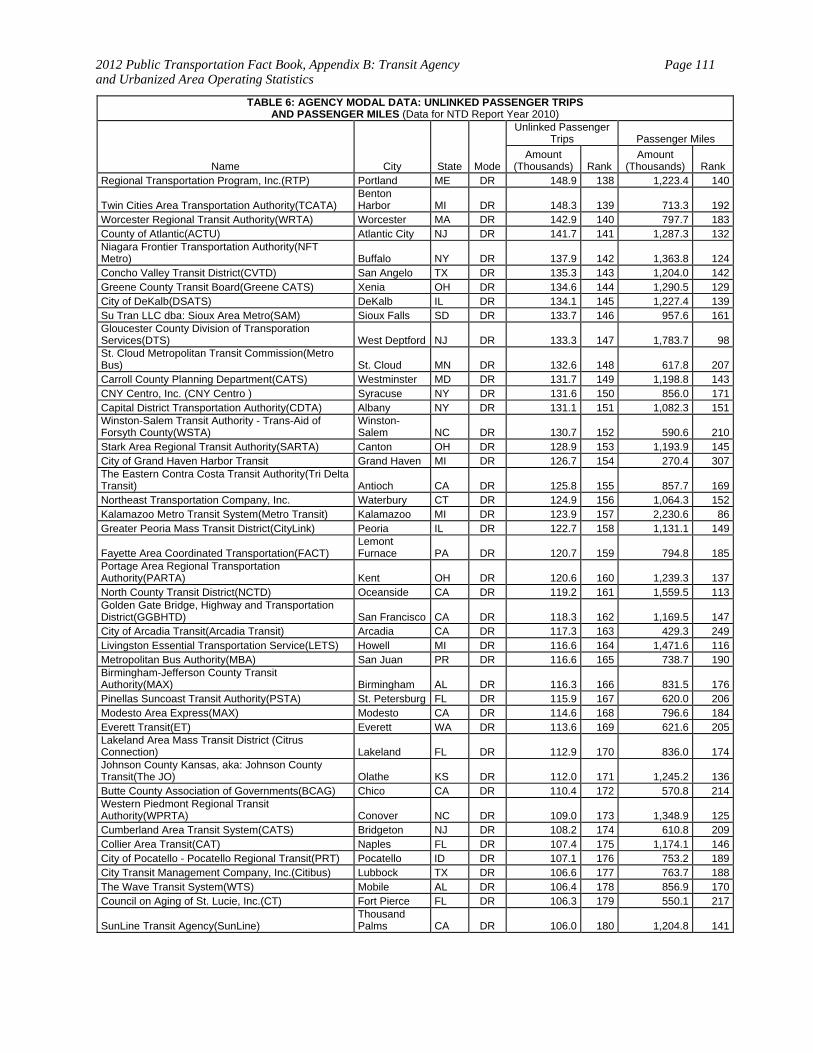
2012 Public Transportation Fact Book, Appendix B: Transit Agency and Urbanized Area Operating Statistics
Page 111
TABLE 6: AGENCY MODAL DATA: UNLINKED PASSENGER TRIPS AND PASSENGER MILES (Data for NTD Report Year 2010)
Name City State Mode
Unlinked Passenger Trips Passenger Miles
Amount (Thousands) Rank
Amount (Thousands) Rank
Regional Transportation Program, Inc.(RTP) Portland ME DR 148.9 138 1,223.4 140
Twin Cities Area Transportation Authority(TCATA) Benton Harbor MI DR 148.3 139 713.3 192
Worcester Regional Transit Authority(WRTA) Worcester MA DR 142.9 140 797.7 183County of Atlantic(ACTU) Atlantic City NJ DR 141.7 141 1,287.3 132Niagara Frontier Transportation Authority(NFT Metro) Buffalo NY DR 137.9 142 1,363.8 124Concho Valley Transit District(CVTD) San Angelo TX DR 135.3 143 1,204.0 142Greene County Transit Board(Greene CATS) Xenia OH DR 134.6 144 1,290.5 129City of DeKalb(DSATS) DeKalb IL DR 134.1 145 1,227.4 139Su Tran LLC dba: Sioux Area Metro(SAM) Sioux Falls SD DR 133.7 146 957.6 161Gloucester County Division of Transporation Services(DTS) West Deptford NJ DR 133.3 147 1,783.7 98St. Cloud Metropolitan Transit Commission(Metro Bus) St. Cloud MN DR 132.6 148 617.8 207Carroll County Planning Department(CATS) Westminster MD DR 131.7 149 1,198.8 143CNY Centro, Inc. (CNY Centro ) Syracuse NY DR 131.6 150 856.0 171Capital District Transportation Authority(CDTA) Albany NY DR 131.1 151 1,082.3 151Winston-Salem Transit Authority - Trans-Aid of Forsyth County(WSTA)
Winston-Salem NC DR 130.7 152 590.6 210
Stark Area Regional Transit Authority(SARTA) Canton OH DR 128.9 153 1,193.9 145City of Grand Haven Harbor Transit Grand Haven MI DR 126.7 154 270.4 307The Eastern Contra Costa Transit Authority(Tri Delta Transit) Antioch CA DR 125.8 155 857.7 169Northeast Transportation Company, Inc. Waterbury CT DR 124.9 156 1,064.3 152Kalamazoo Metro Transit System(Metro Transit) Kalamazoo MI DR 123.9 157 2,230.6 86Greater Peoria Mass Transit District(CityLink) Peoria IL DR 122.7 158 1,131.1 149
Fayette Area Coordinated Transportation(FACT) Lemont Furnace PA DR 120.7 159 794.8 185
Portage Area Regional Transportation Authority(PARTA) Kent OH DR 120.6 160 1,239.3 137North County Transit District(NCTD) Oceanside CA DR 119.2 161 1,559.5 113Golden Gate Bridge, Highway and Transportation District(GGBHTD) San Francisco CA DR 118.3 162 1,169.5 147City of Arcadia Transit(Arcadia Transit) Arcadia CA DR 117.3 163 429.3 249Livingston Essential Transportation Service(LETS) Howell MI DR 116.6 164 1,471.6 116Metropolitan Bus Authority(MBA) San Juan PR DR 116.6 165 738.7 190Birmingham-Jefferson County Transit Authority(MAX) Birmingham AL DR 116.3 166 831.5 176Pinellas Suncoast Transit Authority(PSTA) St. Petersburg FL DR 115.9 167 620.0 206Modesto Area Express(MAX) Modesto CA DR 114.6 168 796.6 184Everett Transit(ET) Everett WA DR 113.6 169 621.6 205Lakeland Area Mass Transit District (Citrus Connection) Lakeland FL DR 112.9 170 836.0 174Johnson County Kansas, aka: Johnson County Transit(The JO) Olathe KS DR 112.0 171 1,245.2 136Butte County Association of Governments(BCAG) Chico CA DR 110.4 172 570.8 214Western Piedmont Regional Transit Authority(WPRTA) Conover NC DR 109.0 173 1,348.9 125Cumberland Area Transit System(CATS) Bridgeton NJ DR 108.2 174 610.8 209Collier Area Transit(CAT) Naples FL DR 107.4 175 1,174.1 146City of Pocatello - Pocatello Regional Transit(PRT) Pocatello ID DR 107.1 176 753.2 189City Transit Management Company, Inc.(Citibus) Lubbock TX DR 106.6 177 763.7 188The Wave Transit System(WTS) Mobile AL DR 106.4 178 856.9 170Council on Aging of St. Lucie, Inc.(CT) Fort Pierce FL DR 106.3 179 550.1 217
SunLine Transit Agency(SunLine) Thousand Palms CA DR 106.0 180 1,204.8 141
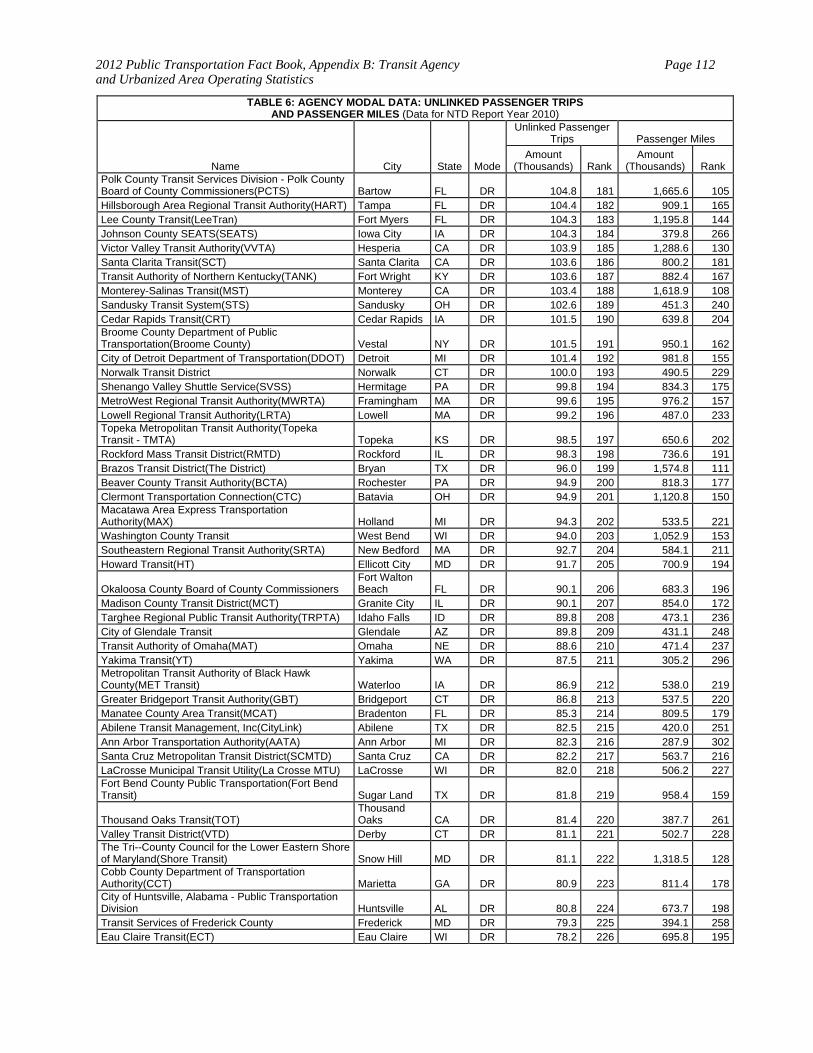
2012 Public Transportation Fact Book, Appendix B: Transit Agency and Urbanized Area Operating Statistics
Page 112
TABLE 6: AGENCY MODAL DATA: UNLINKED PASSENGER TRIPS AND PASSENGER MILES (Data for NTD Report Year 2010)
Name City State Mode
Unlinked Passenger Trips Passenger Miles
Amount (Thousands) Rank
Amount (Thousands) Rank
Polk County Transit Services Division - Polk County Board of County Commissioners(PCTS) Bartow FL DR 104.8 181 1,665.6 105Hillsborough Area Regional Transit Authority(HART) Tampa FL DR 104.4 182 909.1 165Lee County Transit(LeeTran) Fort Myers FL DR 104.3 183 1,195.8 144Johnson County SEATS(SEATS) Iowa City IA DR 104.3 184 379.8 266Victor Valley Transit Authority(VVTA) Hesperia CA DR 103.9 185 1,288.6 130Santa Clarita Transit(SCT) Santa Clarita CA DR 103.6 186 800.2 181Transit Authority of Northern Kentucky(TANK) Fort Wright KY DR 103.6 187 882.4 167Monterey-Salinas Transit(MST) Monterey CA DR 103.4 188 1,618.9 108Sandusky Transit System(STS) Sandusky OH DR 102.6 189 451.3 240Cedar Rapids Transit(CRT) Cedar Rapids IA DR 101.5 190 639.8 204Broome County Department of Public Transportation(Broome County) Vestal NY DR 101.5 191 950.1 162City of Detroit Department of Transportation(DDOT) Detroit MI DR 101.4 192 981.8 155Norwalk Transit District Norwalk CT DR 100.0 193 490.5 229Shenango Valley Shuttle Service(SVSS) Hermitage PA DR 99.8 194 834.3 175MetroWest Regional Transit Authority(MWRTA) Framingham MA DR 99.6 195 976.2 157Lowell Regional Transit Authority(LRTA) Lowell MA DR 99.2 196 487.0 233Topeka Metropolitan Transit Authority(Topeka Transit - TMTA) Topeka KS DR 98.5 197 650.6 202Rockford Mass Transit District(RMTD) Rockford IL DR 98.3 198 736.6 191Brazos Transit District(The District) Bryan TX DR 96.0 199 1,574.8 111Beaver County Transit Authority(BCTA) Rochester PA DR 94.9 200 818.3 177Clermont Transportation Connection(CTC) Batavia OH DR 94.9 201 1,120.8 150Macatawa Area Express Transportation Authority(MAX) Holland MI DR 94.3 202 533.5 221Washington County Transit West Bend WI DR 94.0 203 1,052.9 153Southeastern Regional Transit Authority(SRTA) New Bedford MA DR 92.7 204 584.1 211Howard Transit(HT) Ellicott City MD DR 91.7 205 700.9 194
Okaloosa County Board of County Commissioners Fort Walton Beach FL DR 90.1 206 683.3 196
Madison County Transit District(MCT) Granite City IL DR 90.1 207 854.0 172Targhee Regional Public Transit Authority(TRPTA) Idaho Falls ID DR 89.8 208 473.1 236City of Glendale Transit Glendale AZ DR 89.8 209 431.1 248Transit Authority of Omaha(MAT) Omaha NE DR 88.6 210 471.4 237Yakima Transit(YT) Yakima WA DR 87.5 211 305.2 296Metropolitan Transit Authority of Black Hawk County(MET Transit) Waterloo IA DR 86.9 212 538.0 219Greater Bridgeport Transit Authority(GBT) Bridgeport CT DR 86.8 213 537.5 220Manatee County Area Transit(MCAT) Bradenton FL DR 85.3 214 809.5 179Abilene Transit Management, Inc(CityLink) Abilene TX DR 82.5 215 420.0 251Ann Arbor Transportation Authority(AATA) Ann Arbor MI DR 82.3 216 287.9 302Santa Cruz Metropolitan Transit District(SCMTD) Santa Cruz CA DR 82.2 217 563.7 216LaCrosse Municipal Transit Utility(La Crosse MTU) LaCrosse WI DR 82.0 218 506.2 227Fort Bend County Public Transportation(Fort Bend Transit) Sugar Land TX DR 81.8 219 958.4 159
Thousand Oaks Transit(TOT) Thousand Oaks CA DR 81.4 220 387.7 261
Valley Transit District(VTD) Derby CT DR 81.1 221 502.7 228The Tri--County Council for the Lower Eastern Shore of Maryland(Shore Transit) Snow Hill MD DR 81.1 222 1,318.5 128Cobb County Department of Transportation Authority(CCT) Marietta GA DR 80.9 223 811.4 178City of Huntsville, Alabama - Public Transportation Division Huntsville AL DR 80.8 224 673.7 198Transit Services of Frederick County Frederick MD DR 79.3 225 394.1 258Eau Claire Transit(ECT) Eau Claire WI DR 78.2 226 695.8 195
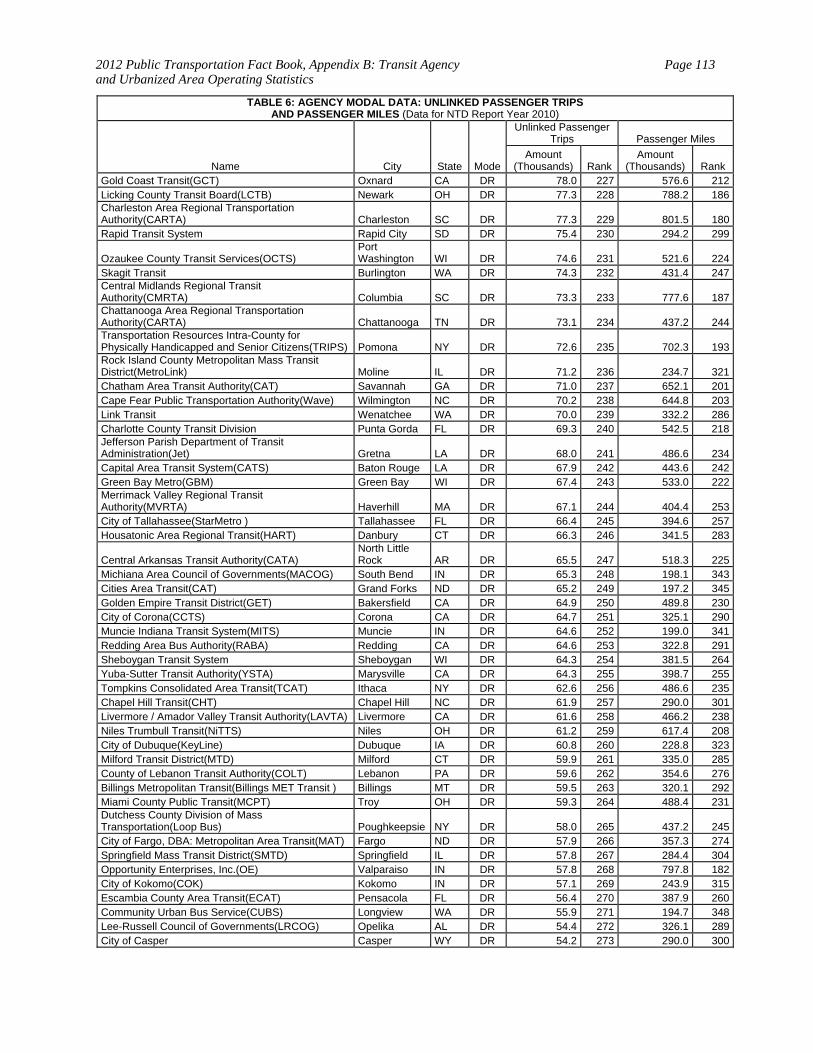
2012 Public Transportation Fact Book, Appendix B: Transit Agency and Urbanized Area Operating Statistics
Page 113
TABLE 6: AGENCY MODAL DATA: UNLINKED PASSENGER TRIPS AND PASSENGER MILES (Data for NTD Report Year 2010)
Name City State Mode
Unlinked Passenger Trips Passenger Miles
Amount (Thousands) Rank
Amount (Thousands) Rank
Gold Coast Transit(GCT) Oxnard CA DR 78.0 227 576.6 212Licking County Transit Board(LCTB) Newark OH DR 77.3 228 788.2 186Charleston Area Regional Transportation Authority(CARTA) Charleston SC DR 77.3 229 801.5 180Rapid Transit System Rapid City SD DR 75.4 230 294.2 299
Ozaukee County Transit Services(OCTS) Port Washington WI DR 74.6 231 521.6 224
Skagit Transit Burlington WA DR 74.3 232 431.4 247Central Midlands Regional Transit Authority(CMRTA) Columbia SC DR 73.3 233 777.6 187Chattanooga Area Regional Transportation Authority(CARTA) Chattanooga TN DR 73.1 234 437.2 244Transportation Resources Intra-County for Physically Handicapped and Senior Citizens(TRIPS) Pomona NY DR 72.6 235 702.3 193Rock Island County Metropolitan Mass Transit District(MetroLink) Moline IL DR 71.2 236 234.7 321Chatham Area Transit Authority(CAT) Savannah GA DR 71.0 237 652.1 201Cape Fear Public Transportation Authority(Wave) Wilmington NC DR 70.2 238 644.8 203Link Transit Wenatchee WA DR 70.0 239 332.2 286Charlotte County Transit Division Punta Gorda FL DR 69.3 240 542.5 218Jefferson Parish Department of Transit Administration(Jet) Gretna LA DR 68.0 241 486.6 234Capital Area Transit System(CATS) Baton Rouge LA DR 67.9 242 443.6 242Green Bay Metro(GBM) Green Bay WI DR 67.4 243 533.0 222Merrimack Valley Regional Transit Authority(MVRTA) Haverhill MA DR 67.1 244 404.4 253City of Tallahassee(StarMetro ) Tallahassee FL DR 66.4 245 394.6 257Housatonic Area Regional Transit(HART) Danbury CT DR 66.3 246 341.5 283
Central Arkansas Transit Authority(CATA) North Little Rock AR DR 65.5 247 518.3 225
Michiana Area Council of Governments(MACOG) South Bend IN DR 65.3 248 198.1 343Cities Area Transit(CAT) Grand Forks ND DR 65.2 249 197.2 345Golden Empire Transit District(GET) Bakersfield CA DR 64.9 250 489.8 230City of Corona(CCTS) Corona CA DR 64.7 251 325.1 290Muncie Indiana Transit System(MITS) Muncie IN DR 64.6 252 199.0 341Redding Area Bus Authority(RABA) Redding CA DR 64.6 253 322.8 291Sheboygan Transit System Sheboygan WI DR 64.3 254 381.5 264Yuba-Sutter Transit Authority(YSTA) Marysville CA DR 64.3 255 398.7 255Tompkins Consolidated Area Transit(TCAT) Ithaca NY DR 62.6 256 486.6 235Chapel Hill Transit(CHT) Chapel Hill NC DR 61.9 257 290.0 301Livermore / Amador Valley Transit Authority(LAVTA) Livermore CA DR 61.6 258 466.2 238Niles Trumbull Transit(NiTTS) Niles OH DR 61.2 259 617.4 208City of Dubuque(KeyLine) Dubuque IA DR 60.8 260 228.8 323Milford Transit District(MTD) Milford CT DR 59.9 261 335.0 285County of Lebanon Transit Authority(COLT) Lebanon PA DR 59.6 262 354.6 276Billings Metropolitan Transit(Billings MET Transit ) Billings MT DR 59.5 263 320.1 292Miami County Public Transit(MCPT) Troy OH DR 59.3 264 488.4 231Dutchess County Division of Mass Transportation(Loop Bus) Poughkeepsie NY DR 58.0 265 437.2 245City of Fargo, DBA: Metropolitan Area Transit(MAT) Fargo ND DR 57.9 266 357.3 274Springfield Mass Transit District(SMTD) Springfield IL DR 57.8 267 284.4 304Opportunity Enterprises, Inc.(OE) Valparaiso IN DR 57.8 268 797.8 182City of Kokomo(COK) Kokomo IN DR 57.1 269 243.9 315Escambia County Area Transit(ECAT) Pensacola FL DR 56.4 270 387.9 260Community Urban Bus Service(CUBS) Longview WA DR 55.9 271 194.7 348Lee-Russell Council of Governments(LRCOG) Opelika AL DR 54.4 272 326.1 289City of Casper Casper WY DR 54.2 273 290.0 300
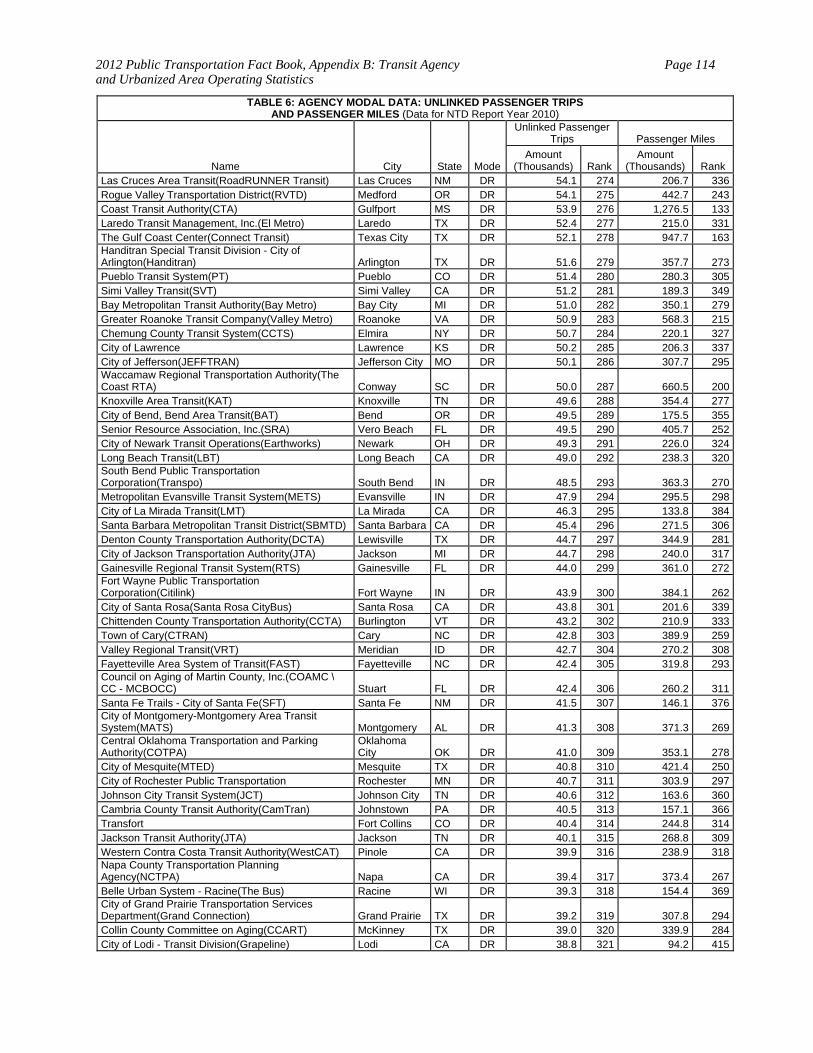
2012 Public Transportation Fact Book, Appendix B: Transit Agency and Urbanized Area Operating Statistics
Page 114
TABLE 6: AGENCY MODAL DATA: UNLINKED PASSENGER TRIPS AND PASSENGER MILES (Data for NTD Report Year 2010)
Name City State Mode
Unlinked Passenger Trips Passenger Miles
Amount (Thousands) Rank
Amount (Thousands) Rank
Las Cruces Area Transit(RoadRUNNER Transit) Las Cruces NM DR 54.1 274 206.7 336Rogue Valley Transportation District(RVTD) Medford OR DR 54.1 275 442.7 243Coast Transit Authority(CTA) Gulfport MS DR 53.9 276 1,276.5 133Laredo Transit Management, Inc.(El Metro) Laredo TX DR 52.4 277 215.0 331The Gulf Coast Center(Connect Transit) Texas City TX DR 52.1 278 947.7 163Handitran Special Transit Division - City of Arlington(Handitran) Arlington TX DR 51.6 279 357.7 273Pueblo Transit System(PT) Pueblo CO DR 51.4 280 280.3 305Simi Valley Transit(SVT) Simi Valley CA DR 51.2 281 189.3 349Bay Metropolitan Transit Authority(Bay Metro) Bay City MI DR 51.0 282 350.1 279Greater Roanoke Transit Company(Valley Metro) Roanoke VA DR 50.9 283 568.3 215Chemung County Transit System(CCTS) Elmira NY DR 50.7 284 220.1 327City of Lawrence Lawrence KS DR 50.2 285 206.3 337City of Jefferson(JEFFTRAN) Jefferson City MO DR 50.1 286 307.7 295Waccamaw Regional Transportation Authority(The Coast RTA) Conway SC DR 50.0 287 660.5 200Knoxville Area Transit(KAT) Knoxville TN DR 49.6 288 354.4 277City of Bend, Bend Area Transit(BAT) Bend OR DR 49.5 289 175.5 355Senior Resource Association, Inc.(SRA) Vero Beach FL DR 49.5 290 405.7 252City of Newark Transit Operations(Earthworks) Newark OH DR 49.3 291 226.0 324Long Beach Transit(LBT) Long Beach CA DR 49.0 292 238.3 320South Bend Public Transportation Corporation(Transpo) South Bend IN DR 48.5 293 363.3 270Metropolitan Evansville Transit System(METS) Evansville IN DR 47.9 294 295.5 298City of La Mirada Transit(LMT) La Mirada CA DR 46.3 295 133.8 384Santa Barbara Metropolitan Transit District(SBMTD) Santa Barbara CA DR 45.4 296 271.5 306Denton County Transportation Authority(DCTA) Lewisville TX DR 44.7 297 344.9 281City of Jackson Transportation Authority(JTA) Jackson MI DR 44.7 298 240.0 317Gainesville Regional Transit System(RTS) Gainesville FL DR 44.0 299 361.0 272Fort Wayne Public Transportation Corporation(Citilink) Fort Wayne IN DR 43.9 300 384.1 262City of Santa Rosa(Santa Rosa CityBus) Santa Rosa CA DR 43.8 301 201.6 339Chittenden County Transportation Authority(CCTA) Burlington VT DR 43.2 302 210.9 333Town of Cary(CTRAN) Cary NC DR 42.8 303 389.9 259Valley Regional Transit(VRT) Meridian ID DR 42.7 304 270.2 308Fayetteville Area System of Transit(FAST) Fayetteville NC DR 42.4 305 319.8 293Council on Aging of Martin County, Inc.(COAMC \CC - MCBOCC) Stuart FL DR 42.4 306 260.2 311Santa Fe Trails - City of Santa Fe(SFT) Santa Fe NM DR 41.5 307 146.1 376City of Montgomery-Montgomery Area Transit System(MATS) Montgomery AL DR 41.3 308 371.3 269Central Oklahoma Transportation and Parking Authority(COTPA)
Oklahoma City OK DR 41.0 309 353.1 278
City of Mesquite(MTED) Mesquite TX DR 40.8 310 421.4 250City of Rochester Public Transportation Rochester MN DR 40.7 311 303.9 297Johnson City Transit System(JCT) Johnson City TN DR 40.6 312 163.6 360Cambria County Transit Authority(CamTran) Johnstown PA DR 40.5 313 157.1 366Transfort Fort Collins CO DR 40.4 314 244.8 314Jackson Transit Authority(JTA) Jackson TN DR 40.1 315 268.8 309Western Contra Costa Transit Authority(WestCAT) Pinole CA DR 39.9 316 238.9 318Napa County Transportation Planning Agency(NCTPA) Napa CA DR 39.4 317 373.4 267Belle Urban System - Racine(The Bus) Racine WI DR 39.3 318 154.4 369City of Grand Prairie Transportation Services Department(Grand Connection) Grand Prairie TX DR 39.2 319 307.8 294Collin County Committee on Aging(CCART) McKinney TX DR 39.0 320 339.9 284City of Lodi - Transit Division(Grapeline) Lodi CA DR 38.8 321 94.2 415
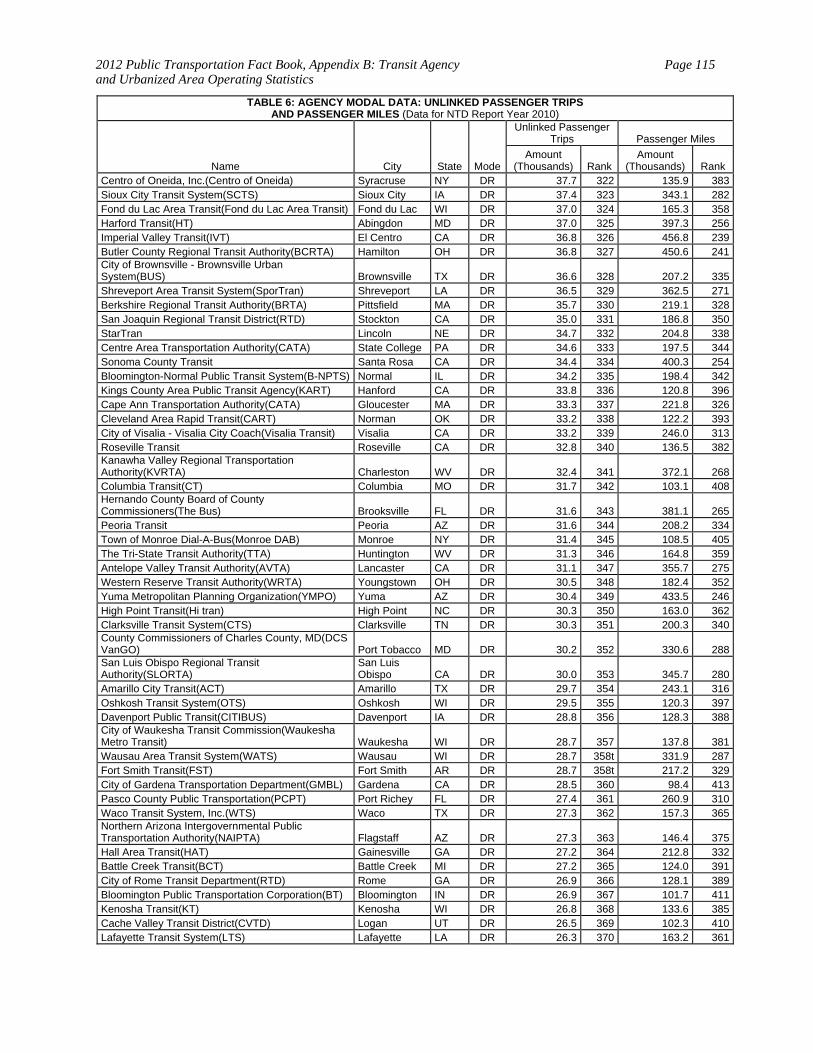
2012 Public Transportation Fact Book, Appendix B: Transit Agency and Urbanized Area Operating Statistics
Page 115
TABLE 6: AGENCY MODAL DATA: UNLINKED PASSENGER TRIPS AND PASSENGER MILES (Data for NTD Report Year 2010)
Name City State Mode
Unlinked Passenger Trips Passenger Miles
Amount (Thousands) Rank
Amount (Thousands) Rank
Centro of Oneida, Inc.(Centro of Oneida) Syracruse NY DR 37.7 322 135.9 383Sioux City Transit System(SCTS) Sioux City IA DR 37.4 323 343.1 282Fond du Lac Area Transit(Fond du Lac Area Transit) Fond du Lac WI DR 37.0 324 165.3 358Harford Transit(HT) Abingdon MD DR 37.0 325 397.3 256Imperial Valley Transit(IVT) El Centro CA DR 36.8 326 456.8 239Butler County Regional Transit Authority(BCRTA) Hamilton OH DR 36.8 327 450.6 241City of Brownsville - Brownsville Urban System(BUS) Brownsville TX DR 36.6 328 207.2 335Shreveport Area Transit System(SporTran) Shreveport LA DR 36.5 329 362.5 271Berkshire Regional Transit Authority(BRTA) Pittsfield MA DR 35.7 330 219.1 328San Joaquin Regional Transit District(RTD) Stockton CA DR 35.0 331 186.8 350StarTran Lincoln NE DR 34.7 332 204.8 338Centre Area Transportation Authority(CATA) State College PA DR 34.6 333 197.5 344Sonoma County Transit Santa Rosa CA DR 34.4 334 400.3 254Bloomington-Normal Public Transit System(B-NPTS) Normal IL DR 34.2 335 198.4 342Kings County Area Public Transit Agency(KART) Hanford CA DR 33.8 336 120.8 396Cape Ann Transportation Authority(CATA) Gloucester MA DR 33.3 337 221.8 326Cleveland Area Rapid Transit(CART) Norman OK DR 33.2 338 122.2 393City of Visalia - Visalia City Coach(Visalia Transit) Visalia CA DR 33.2 339 246.0 313Roseville Transit Roseville CA DR 32.8 340 136.5 382Kanawha Valley Regional Transportation Authority(KVRTA) Charleston WV DR 32.4 341 372.1 268Columbia Transit(CT) Columbia MO DR 31.7 342 103.1 408Hernando County Board of County Commissioners(The Bus) Brooksville FL DR 31.6 343 381.1 265Peoria Transit Peoria AZ DR 31.6 344 208.2 334Town of Monroe Dial-A-Bus(Monroe DAB) Monroe NY DR 31.4 345 108.5 405The Tri-State Transit Authority(TTA) Huntington WV DR 31.3 346 164.8 359Antelope Valley Transit Authority(AVTA) Lancaster CA DR 31.1 347 355.7 275Western Reserve Transit Authority(WRTA) Youngstown OH DR 30.5 348 182.4 352Yuma Metropolitan Planning Organization(YMPO) Yuma AZ DR 30.4 349 433.5 246High Point Transit(Hi tran) High Point NC DR 30.3 350 163.0 362Clarksville Transit System(CTS) Clarksville TN DR 30.3 351 200.3 340County Commissioners of Charles County, MD(DCS VanGO) Port Tobacco MD DR 30.2 352 330.6 288San Luis Obispo Regional Transit Authority(SLORTA)
San Luis Obispo CA DR 30.0 353 345.7 280
Amarillo City Transit(ACT) Amarillo TX DR 29.7 354 243.1 316Oshkosh Transit System(OTS) Oshkosh WI DR 29.5 355 120.3 397Davenport Public Transit(CITIBUS) Davenport IA DR 28.8 356 128.3 388City of Waukesha Transit Commission(WaukeshaMetro Transit) Waukesha WI DR 28.7 357 137.8 381Wausau Area Transit System(WATS) Wausau WI DR 28.7 358t 331.9 287Fort Smith Transit(FST) Fort Smith AR DR 28.7 358t 217.2 329City of Gardena Transportation Department(GMBL) Gardena CA DR 28.5 360 98.4 413Pasco County Public Transportation(PCPT) Port Richey FL DR 27.4 361 260.9 310Waco Transit System, Inc.(WTS) Waco TX DR 27.3 362 157.3 365Northern Arizona Intergovernmental Public Transportation Authority(NAIPTA) Flagstaff AZ DR 27.3 363 146.4 375Hall Area Transit(HAT) Gainesville GA DR 27.2 364 212.8 332Battle Creek Transit(BCT) Battle Creek MI DR 27.2 365 124.0 391City of Rome Transit Department(RTD) Rome GA DR 26.9 366 128.1 389Bloomington Public Transportation Corporation(BT) Bloomington IN DR 26.9 367 101.7 411Kenosha Transit(KT) Kenosha WI DR 26.8 368 133.6 385Cache Valley Transit District(CVTD) Logan UT DR 26.5 369 102.3 410Lafayette Transit System(LTS) Lafayette LA DR 26.3 370 163.2 361
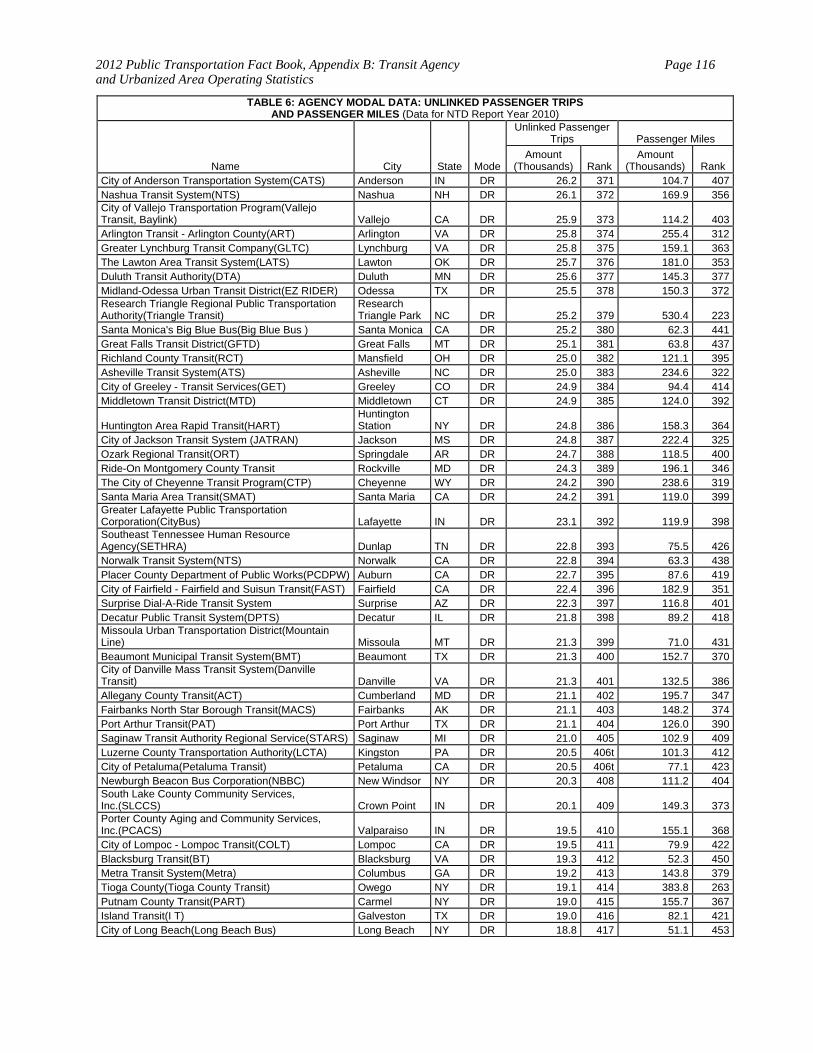
2012 Public Transportation Fact Book, Appendix B: Transit Agency and Urbanized Area Operating Statistics
Page 116
TABLE 6: AGENCY MODAL DATA: UNLINKED PASSENGER TRIPS AND PASSENGER MILES (Data for NTD Report Year 2010)
Name City State Mode
Unlinked Passenger Trips Passenger Miles
Amount (Thousands) Rank
Amount (Thousands) Rank
City of Anderson Transportation System(CATS) Anderson IN DR 26.2 371 104.7 407Nashua Transit System(NTS) Nashua NH DR 26.1 372 169.9 356City of Vallejo Transportation Program(Vallejo Transit, Baylink) Vallejo CA DR 25.9 373 114.2 403Arlington Transit - Arlington County(ART) Arlington VA DR 25.8 374 255.4 312Greater Lynchburg Transit Company(GLTC) Lynchburg VA DR 25.8 375 159.1 363The Lawton Area Transit System(LATS) Lawton OK DR 25.7 376 181.0 353Duluth Transit Authority(DTA) Duluth MN DR 25.6 377 145.3 377Midland-Odessa Urban Transit District(EZ RIDER) Odessa TX DR 25.5 378 150.3 372Research Triangle Regional Public Transportation Authority(Triangle Transit)
Research Triangle Park NC DR 25.2 379 530.4 223
Santa Monica's Big Blue Bus(Big Blue Bus ) Santa Monica CA DR 25.2 380 62.3 441Great Falls Transit District(GFTD) Great Falls MT DR 25.1 381 63.8 437Richland County Transit(RCT) Mansfield OH DR 25.0 382 121.1 395Asheville Transit System(ATS) Asheville NC DR 25.0 383 234.6 322City of Greeley - Transit Services(GET) Greeley CO DR 24.9 384 94.4 414Middletown Transit District(MTD) Middletown CT DR 24.9 385 124.0 392
Huntington Area Rapid Transit(HART) Huntington Station NY DR 24.8 386 158.3 364
City of Jackson Transit System (JATRAN) Jackson MS DR 24.8 387 222.4 325Ozark Regional Transit(ORT) Springdale AR DR 24.7 388 118.5 400Ride-On Montgomery County Transit Rockville MD DR 24.3 389 196.1 346The City of Cheyenne Transit Program(CTP) Cheyenne WY DR 24.2 390 238.6 319Santa Maria Area Transit(SMAT) Santa Maria CA DR 24.2 391 119.0 399Greater Lafayette Public Transportation Corporation(CityBus) Lafayette IN DR 23.1 392 119.9 398Southeast Tennessee Human Resource Agency(SETHRA) Dunlap TN DR 22.8 393 75.5 426Norwalk Transit System(NTS) Norwalk CA DR 22.8 394 63.3 438Placer County Department of Public Works(PCDPW) Auburn CA DR 22.7 395 87.6 419City of Fairfield - Fairfield and Suisun Transit(FAST) Fairfield CA DR 22.4 396 182.9 351Surprise Dial-A-Ride Transit System Surprise AZ DR 22.3 397 116.8 401Decatur Public Transit System(DPTS) Decatur IL DR 21.8 398 89.2 418Missoula Urban Transportation District(Mountain Line) Missoula MT DR 21.3 399 71.0 431Beaumont Municipal Transit System(BMT) Beaumont TX DR 21.3 400 152.7 370City of Danville Mass Transit System(Danville Transit) Danville VA DR 21.3 401 132.5 386Allegany County Transit(ACT) Cumberland MD DR 21.1 402 195.7 347Fairbanks North Star Borough Transit(MACS) Fairbanks AK DR 21.1 403 148.2 374Port Arthur Transit(PAT) Port Arthur TX DR 21.1 404 126.0 390Saginaw Transit Authority Regional Service(STARS) Saginaw MI DR 21.0 405 102.9 409Luzerne County Transportation Authority(LCTA) Kingston PA DR 20.5 406t 101.3 412City of Petaluma(Petaluma Transit) Petaluma CA DR 20.5 406t 77.1 423Newburgh Beacon Bus Corporation(NBBC) New Windsor NY DR 20.3 408 111.2 404South Lake County Community Services, Inc.(SLCCS) Crown Point IN DR 20.1 409 149.3 373Porter County Aging and Community Services, Inc.(PCACS) Valparaiso IN DR 19.5 410 155.1 368City of Lompoc - Lompoc Transit(COLT) Lompoc CA DR 19.5 411 79.9 422Blacksburg Transit(BT) Blacksburg VA DR 19.3 412 52.3 450Metra Transit System(Metra) Columbus GA DR 19.2 413 143.8 379Tioga County(Tioga County Transit) Owego NY DR 19.1 414 383.8 263Putnam County Transit(PART) Carmel NY DR 19.0 415 155.7 367Island Transit(I T) Galveston TX DR 19.0 416 82.1 421City of Long Beach(Long Beach Bus) Long Beach NY DR 18.8 417 51.1 453
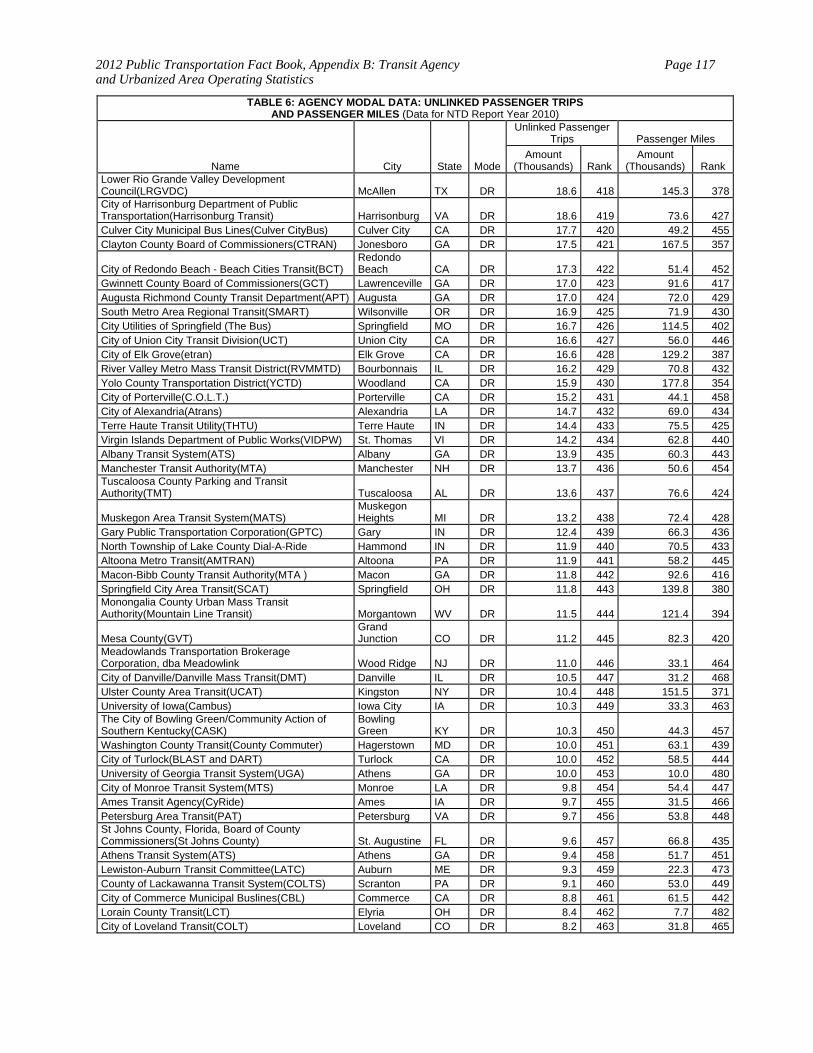
2012 Public Transportation Fact Book, Appendix B: Transit Agency and Urbanized Area Operating Statistics
Page 117
TABLE 6: AGENCY MODAL DATA: UNLINKED PASSENGER TRIPS AND PASSENGER MILES (Data for NTD Report Year 2010)
Name City State Mode
Unlinked Passenger Trips Passenger Miles
Amount (Thousands) Rank
Amount (Thousands) Rank
Lower Rio Grande Valley Development Council(LRGVDC) McAllen TX DR 18.6 418 145.3 378City of Harrisonburg Department of Public Transportation(Harrisonburg Transit) Harrisonburg VA DR 18.6 419 73.6 427Culver City Municipal Bus Lines(Culver CityBus) Culver City CA DR 17.7 420 49.2 455Clayton County Board of Commissioners(CTRAN) Jonesboro GA DR 17.5 421 167.5 357
City of Redondo Beach - Beach Cities Transit(BCT) Redondo Beach CA DR 17.3 422 51.4 452
Gwinnett County Board of Commissioners(GCT) Lawrenceville GA DR 17.0 423 91.6 417Augusta Richmond County Transit Department(APT) Augusta GA DR 17.0 424 72.0 429South Metro Area Regional Transit(SMART) Wilsonville OR DR 16.9 425 71.9 430City Utilities of Springfield (The Bus) Springfield MO DR 16.7 426 114.5 402City of Union City Transit Division(UCT) Union City CA DR 16.6 427 56.0 446City of Elk Grove(etran) Elk Grove CA DR 16.6 428 129.2 387River Valley Metro Mass Transit District(RVMMTD) Bourbonnais IL DR 16.2 429 70.8 432Yolo County Transportation District(YCTD) Woodland CA DR 15.9 430 177.8 354City of Porterville(C.O.L.T.) Porterville CA DR 15.2 431 44.1 458City of Alexandria(Atrans) Alexandria LA DR 14.7 432 69.0 434Terre Haute Transit Utility(THTU) Terre Haute IN DR 14.4 433 75.5 425Virgin Islands Department of Public Works(VIDPW) St. Thomas VI DR 14.2 434 62.8 440Albany Transit System(ATS) Albany GA DR 13.9 435 60.3 443Manchester Transit Authority(MTA) Manchester NH DR 13.7 436 50.6 454Tuscaloosa County Parking and Transit Authority(TMT) Tuscaloosa AL DR 13.6 437 76.6 424
Muskegon Area Transit System(MATS) Muskegon Heights MI DR 13.2 438 72.4 428
Gary Public Transportation Corporation(GPTC) Gary IN DR 12.4 439 66.3 436North Township of Lake County Dial-A-Ride Hammond IN DR 11.9 440 70.5 433Altoona Metro Transit(AMTRAN) Altoona PA DR 11.9 441 58.2 445Macon-Bibb County Transit Authority(MTA ) Macon GA DR 11.8 442 92.6 416Springfield City Area Transit(SCAT) Springfield OH DR 11.8 443 139.8 380Monongalia County Urban Mass Transit Authority(Mountain Line Transit) Morgantown WV DR 11.5 444 121.4 394
Mesa County(GVT) Grand Junction CO DR 11.2 445 82.3 420
Meadowlands Transportation Brokerage Corporation, dba Meadowlink Wood Ridge NJ DR 11.0 446 33.1 464City of Danville/Danville Mass Transit(DMT) Danville IL DR 10.5 447 31.2 468Ulster County Area Transit(UCAT) Kingston NY DR 10.4 448 151.5 371University of Iowa(Cambus) Iowa City IA DR 10.3 449 33.3 463The City of Bowling Green/Community Action of Southern Kentucky(CASK)
Bowling Green KY DR 10.3 450 44.3 457
Washington County Transit(County Commuter) Hagerstown MD DR 10.0 451 63.1 439City of Turlock(BLAST and DART) Turlock CA DR 10.0 452 58.5 444University of Georgia Transit System(UGA) Athens GA DR 10.0 453 10.0 480City of Monroe Transit System(MTS) Monroe LA DR 9.8 454 54.4 447Ames Transit Agency(CyRide) Ames IA DR 9.7 455 31.5 466Petersburg Area Transit(PAT) Petersburg VA DR 9.7 456 53.8 448St Johns County, Florida, Board of County Commissioners(St Johns County) St. Augustine FL DR 9.6 457 66.8 435Athens Transit System(ATS) Athens GA DR 9.4 458 51.7 451Lewiston-Auburn Transit Committee(LATC) Auburn ME DR 9.3 459 22.3 473County of Lackawanna Transit System(COLTS) Scranton PA DR 9.1 460 53.0 449City of Commerce Municipal Buslines(CBL) Commerce CA DR 8.8 461 61.5 442Lorain County Transit(LCT) Elyria OH DR 8.4 462 7.7 482City of Loveland Transit(COLT) Loveland CO DR 8.2 463 31.8 465
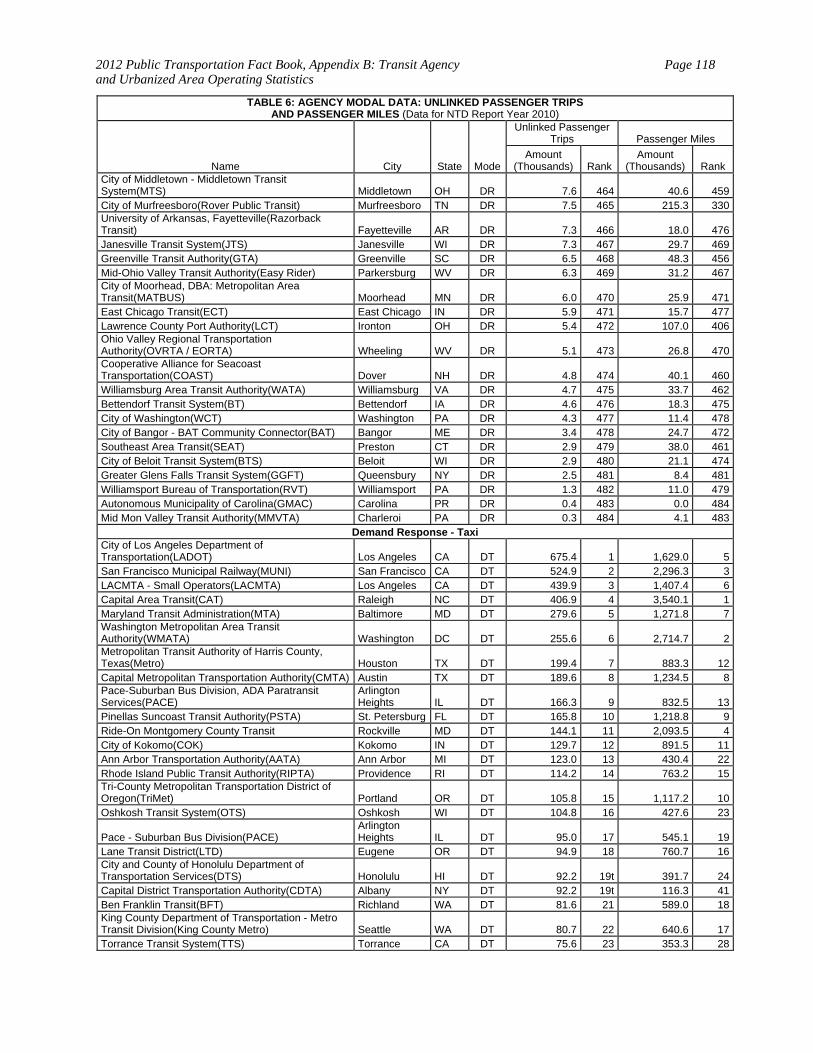
2012 Public Transportation Fact Book, Appendix B: Transit Agency and Urbanized Area Operating Statistics
Page 118
TABLE 6: AGENCY MODAL DATA: UNLINKED PASSENGER TRIPS AND PASSENGER MILES (Data for NTD Report Year 2010)
Name City State Mode
Unlinked Passenger Trips Passenger Miles
Amount (Thousands) Rank
Amount (Thousands) Rank
City of Middletown - Middletown Transit System(MTS) Middletown OH DR 7.6 464 40.6 459City of Murfreesboro(Rover Public Transit) Murfreesboro TN DR 7.5 465 215.3 330University of Arkansas, Fayetteville(Razorback Transit) Fayetteville AR DR 7.3 466 18.0 476Janesville Transit System(JTS) Janesville WI DR 7.3 467 29.7 469Greenville Transit Authority(GTA) Greenville SC DR 6.5 468 48.3 456Mid-Ohio Valley Transit Authority(Easy Rider) Parkersburg WV DR 6.3 469 31.2 467City of Moorhead, DBA: Metropolitan Area Transit(MATBUS) Moorhead MN DR 6.0 470 25.9 471East Chicago Transit(ECT) East Chicago IN DR 5.9 471 15.7 477Lawrence County Port Authority(LCT) Ironton OH DR 5.4 472 107.0 406Ohio Valley Regional Transportation Authority(OVRTA / EORTA) Wheeling WV DR 5.1 473 26.8 470Cooperative Alliance for Seacoast Transportation(COAST) Dover NH DR 4.8 474 40.1 460Williamsburg Area Transit Authority(WATA) Williamsburg VA DR 4.7 475 33.7 462Bettendorf Transit System(BT) Bettendorf IA DR 4.6 476 18.3 475City of Washington(WCT) Washington PA DR 4.3 477 11.4 478City of Bangor - BAT Community Connector(BAT) Bangor ME DR 3.4 478 24.7 472Southeast Area Transit(SEAT) Preston CT DR 2.9 479 38.0 461City of Beloit Transit System(BTS) Beloit WI DR 2.9 480 21.1 474Greater Glens Falls Transit System(GGFT) Queensbury NY DR 2.5 481 8.4 481Williamsport Bureau of Transportation(RVT) Williamsport PA DR 1.3 482 11.0 479Autonomous Municipality of Carolina(GMAC) Carolina PR DR 0.4 483 0.0 484Mid Mon Valley Transit Authority(MMVTA) Charleroi PA DR 0.3 484 4.1 483
Demand Response - Taxi City of Los Angeles Department of Transportation(LADOT) Los Angeles CA DT 675.4 1 1,629.0 5San Francisco Municipal Railway(MUNI) San Francisco CA DT 524.9 2 2,296.3 3LACMTA - Small Operators(LACMTA) Los Angeles CA DT 439.9 3 1,407.4 6Capital Area Transit(CAT) Raleigh NC DT 406.9 4 3,540.1 1Maryland Transit Administration(MTA) Baltimore MD DT 279.6 5 1,271.8 7Washington Metropolitan Area Transit Authority(WMATA) Washington DC DT 255.6 6 2,714.7 2Metropolitan Transit Authority of Harris County, Texas(Metro) Houston TX DT 199.4 7 883.3 12Capital Metropolitan Transportation Authority(CMTA) Austin TX DT 189.6 8 1,234.5 8Pace-Suburban Bus Division, ADA Paratransit Services(PACE)
Arlington Heights IL DT 166.3 9 832.5 13
Pinellas Suncoast Transit Authority(PSTA) St. Petersburg FL DT 165.8 10 1,218.8 9Ride-On Montgomery County Transit Rockville MD DT 144.1 11 2,093.5 4City of Kokomo(COK) Kokomo IN DT 129.7 12 891.5 11Ann Arbor Transportation Authority(AATA) Ann Arbor MI DT 123.0 13 430.4 22Rhode Island Public Transit Authority(RIPTA) Providence RI DT 114.2 14 763.2 15Tri-County Metropolitan Transportation District of Oregon(TriMet) Portland OR DT 105.8 15 1,117.2 10Oshkosh Transit System(OTS) Oshkosh WI DT 104.8 16 427.6 23
Pace - Suburban Bus Division(PACE) Arlington Heights IL DT 95.0 17 545.1 19
Lane Transit District(LTD) Eugene OR DT 94.9 18 760.7 16City and County of Honolulu Department of Transportation Services(DTS) Honolulu HI DT 92.2 19t 391.7 24Capital District Transportation Authority(CDTA) Albany NY DT 92.2 19t 116.3 41Ben Franklin Transit(BFT) Richland WA DT 81.6 21 589.0 18King County Department of Transportation - Metro Transit Division(King County Metro) Seattle WA DT 80.7 22 640.6 17Torrance Transit System(TTS) Torrance CA DT 75.6 23 353.3 28
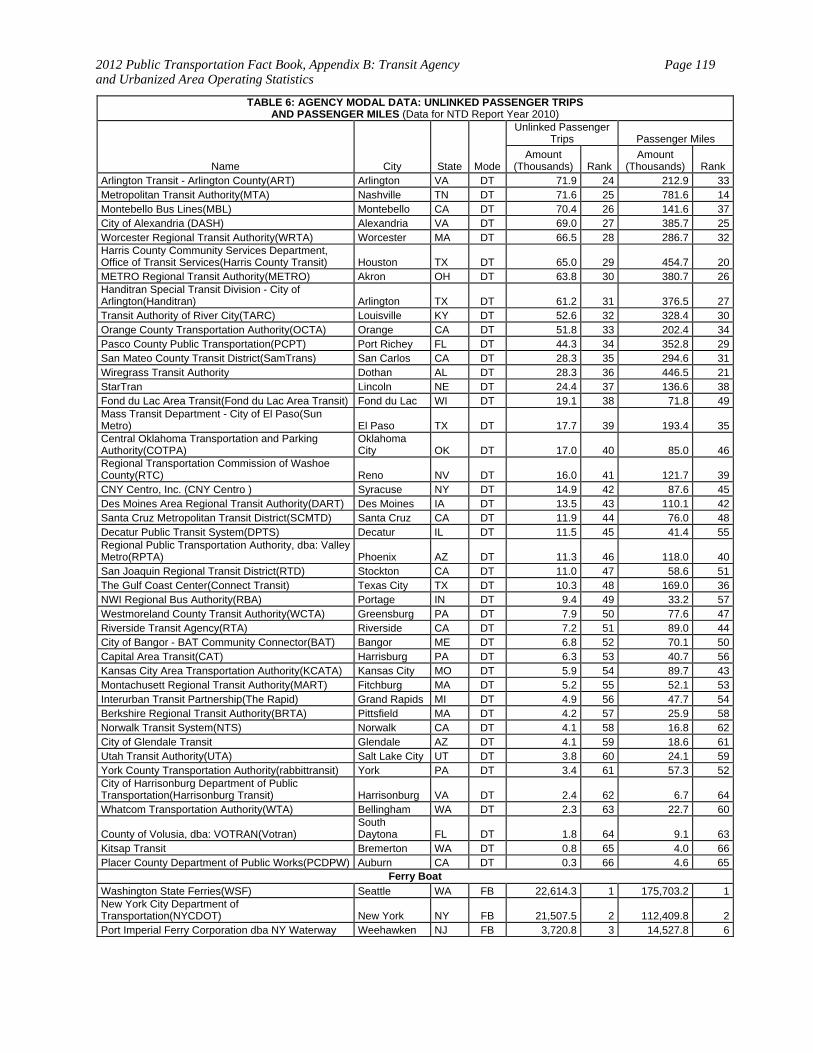
2012 Public Transportation Fact Book, Appendix B: Transit Agency and Urbanized Area Operating Statistics
Page 119
TABLE 6: AGENCY MODAL DATA: UNLINKED PASSENGER TRIPS AND PASSENGER MILES (Data for NTD Report Year 2010)
Name City State Mode
Unlinked Passenger Trips Passenger Miles
Amount (Thousands) Rank
Amount (Thousands) Rank
Arlington Transit - Arlington County(ART) Arlington VA DT 71.9 24 212.9 33Metropolitan Transit Authority(MTA) Nashville TN DT 71.6 25 781.6 14Montebello Bus Lines(MBL) Montebello CA DT 70.4 26 141.6 37City of Alexandria (DASH) Alexandria VA DT 69.0 27 385.7 25Worcester Regional Transit Authority(WRTA) Worcester MA DT 66.5 28 286.7 32Harris County Community Services Department, Office of Transit Services(Harris County Transit) Houston TX DT 65.0 29 454.7 20METRO Regional Transit Authority(METRO) Akron OH DT 63.8 30 380.7 26Handitran Special Transit Division - City of Arlington(Handitran) Arlington TX DT 61.2 31 376.5 27Transit Authority of River City(TARC) Louisville KY DT 52.6 32 328.4 30Orange County Transportation Authority(OCTA) Orange CA DT 51.8 33 202.4 34Pasco County Public Transportation(PCPT) Port Richey FL DT 44.3 34 352.8 29San Mateo County Transit District(SamTrans) San Carlos CA DT 28.3 35 294.6 31Wiregrass Transit Authority Dothan AL DT 28.3 36 446.5 21StarTran Lincoln NE DT 24.4 37 136.6 38Fond du Lac Area Transit(Fond du Lac Area Transit) Fond du Lac WI DT 19.1 38 71.8 49Mass Transit Department - City of El Paso(Sun Metro) El Paso TX DT 17.7 39 193.4 35Central Oklahoma Transportation and Parking Authority(COTPA)
Oklahoma City OK DT 17.0 40 85.0 46
Regional Transportation Commission of Washoe County(RTC) Reno NV DT 16.0 41 121.7 39CNY Centro, Inc. (CNY Centro ) Syracuse NY DT 14.9 42 87.6 45Des Moines Area Regional Transit Authority(DART) Des Moines IA DT 13.5 43 110.1 42Santa Cruz Metropolitan Transit District(SCMTD) Santa Cruz CA DT 11.9 44 76.0 48Decatur Public Transit System(DPTS) Decatur IL DT 11.5 45 41.4 55Regional Public Transportation Authority, dba: Valley Metro(RPTA) Phoenix AZ DT 11.3 46 118.0 40San Joaquin Regional Transit District(RTD) Stockton CA DT 11.0 47 58.6 51The Gulf Coast Center(Connect Transit) Texas City TX DT 10.3 48 169.0 36NWI Regional Bus Authority(RBA) Portage IN DT 9.4 49 33.2 57Westmoreland County Transit Authority(WCTA) Greensburg PA DT 7.9 50 77.6 47Riverside Transit Agency(RTA) Riverside CA DT 7.2 51 89.0 44City of Bangor - BAT Community Connector(BAT) Bangor ME DT 6.8 52 70.1 50Capital Area Transit(CAT) Harrisburg PA DT 6.3 53 40.7 56Kansas City Area Transportation Authority(KCATA) Kansas City MO DT 5.9 54 89.7 43Montachusett Regional Transit Authority(MART) Fitchburg MA DT 5.2 55 52.1 53Interurban Transit Partnership(The Rapid) Grand Rapids MI DT 4.9 56 47.7 54Berkshire Regional Transit Authority(BRTA) Pittsfield MA DT 4.2 57 25.9 58Norwalk Transit System(NTS) Norwalk CA DT 4.1 58 16.8 62City of Glendale Transit Glendale AZ DT 4.1 59 18.6 61Utah Transit Authority(UTA) Salt Lake City UT DT 3.8 60 24.1 59York County Transportation Authority(rabbittransit) York PA DT 3.4 61 57.3 52City of Harrisonburg Department of Public Transportation(Harrisonburg Transit) Harrisonburg VA DT 2.4 62 6.7 64Whatcom Transportation Authority(WTA) Bellingham WA DT 2.3 63 22.7 60
County of Volusia, dba: VOTRAN(Votran) South Daytona FL DT 1.8 64 9.1 63
Kitsap Transit Bremerton WA DT 0.8 65 4.0 66Placer County Department of Public Works(PCDPW) Auburn CA DT 0.3 66 4.6 65
Ferry Boat
Washington State Ferries(WSF) Seattle WA FB 22,614.3 1 175,703.2 1New York City Department of Transportation(NYCDOT) New York NY FB 21,507.5 2 112,409.8 2Port Imperial Ferry Corporation dba NY Waterway Weehawken NJ FB 3,720.8 3 14,527.8 6
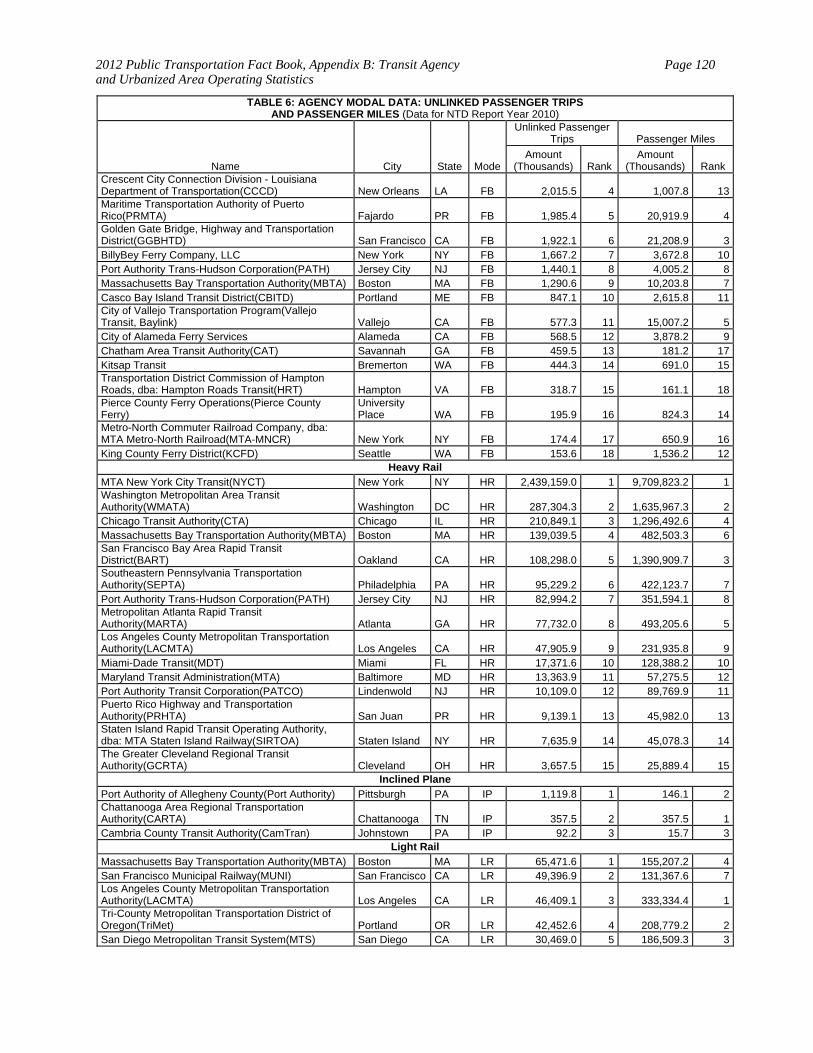
2012 Public Transportation Fact Book, Appendix B: Transit Agency and Urbanized Area Operating Statistics
Page 120
TABLE 6: AGENCY MODAL DATA: UNLINKED PASSENGER TRIPS AND PASSENGER MILES (Data for NTD Report Year 2010)
Name City State Mode
Unlinked Passenger Trips Passenger Miles
Amount (Thousands) Rank
Amount (Thousands) Rank
Crescent City Connection Division - Louisiana Department of Transportation(CCCD) New Orleans LA FB 2,015.5 4 1,007.8 13Maritime Transportation Authority of Puerto Rico(PRMTA) Fajardo PR FB 1,985.4 5 20,919.9 4Golden Gate Bridge, Highway and Transportation District(GGBHTD) San Francisco CA FB 1,922.1 6 21,208.9 3BillyBey Ferry Company, LLC New York NY FB 1,667.2 7 3,672.8 10Port Authority Trans-Hudson Corporation(PATH) Jersey City NJ FB 1,440.1 8 4,005.2 8Massachusetts Bay Transportation Authority(MBTA) Boston MA FB 1,290.6 9 10,203.8 7Casco Bay Island Transit District(CBITD) Portland ME FB 847.1 10 2,615.8 11City of Vallejo Transportation Program(Vallejo Transit, Baylink) Vallejo CA FB 577.3 11 15,007.2 5City of Alameda Ferry Services Alameda CA FB 568.5 12 3,878.2 9Chatham Area Transit Authority(CAT) Savannah GA FB 459.5 13 181.2 17Kitsap Transit Bremerton WA FB 444.3 14 691.0 15Transportation District Commission of Hampton Roads, dba: Hampton Roads Transit(HRT) Hampton VA FB 318.7 15 161.1 18Pierce County Ferry Operations(Pierce County Ferry)
University Place WA FB 195.9 16 824.3 14
Metro-North Commuter Railroad Company, dba: MTA Metro-North Railroad(MTA-MNCR) New York NY FB 174.4 17 650.9 16King County Ferry District(KCFD) Seattle WA FB 153.6 18 1,536.2 12
Heavy Rail
MTA New York City Transit(NYCT) New York NY HR 2,439,159.0 1 9,709,823.2 1Washington Metropolitan Area Transit Authority(WMATA) Washington DC HR 287,304.3 2 1,635,967.3 2Chicago Transit Authority(CTA) Chicago IL HR 210,849.1 3 1,296,492.6 4Massachusetts Bay Transportation Authority(MBTA) Boston MA HR 139,039.5 4 482,503.3 6San Francisco Bay Area Rapid Transit District(BART) Oakland CA HR 108,298.0 5 1,390,909.7 3Southeastern Pennsylvania Transportation Authority(SEPTA) Philadelphia PA HR 95,229.2 6 422,123.7 7Port Authority Trans-Hudson Corporation(PATH) Jersey City NJ HR 82,994.2 7 351,594.1 8Metropolitan Atlanta Rapid Transit Authority(MARTA) Atlanta GA HR 77,732.0 8 493,205.6 5Los Angeles County Metropolitan Transportation Authority(LACMTA) Los Angeles CA HR 47,905.9 9 231,935.8 9Miami-Dade Transit(MDT) Miami FL HR 17,371.6 10 128,388.2 10Maryland Transit Administration(MTA) Baltimore MD HR 13,363.9 11 57,275.5 12Port Authority Transit Corporation(PATCO) Lindenwold NJ HR 10,109.0 12 89,769.9 11Puerto Rico Highway and Transportation Authority(PRHTA) San Juan PR HR 9,139.1 13 45,982.0 13Staten Island Rapid Transit Operating Authority, dba: MTA Staten Island Railway(SIRTOA) Staten Island NY HR 7,635.9 14 45,078.3 14The Greater Cleveland Regional Transit Authority(GCRTA) Cleveland OH HR 3,657.5 15 25,889.4 15
Inclined Plane
Port Authority of Allegheny County(Port Authority) Pittsburgh PA IP 1,119.8 1 146.1 2Chattanooga Area Regional Transportation Authority(CARTA) Chattanooga TN IP 357.5 2 357.5 1Cambria County Transit Authority(CamTran) Johnstown PA IP 92.2 3 15.7 3
Light Rail
Massachusetts Bay Transportation Authority(MBTA) Boston MA LR 65,471.6 1 155,207.2 4San Francisco Municipal Railway(MUNI) San Francisco CA LR 49,396.9 2 131,367.6 7Los Angeles County Metropolitan Transportation Authority(LACMTA) Los Angeles CA LR 46,409.1 3 333,334.4 1Tri-County Metropolitan Transportation District of Oregon(TriMet) Portland OR LR 42,452.6 4 208,779.2 2San Diego Metropolitan Transit System(MTS) San Diego CA LR 30,469.0 5 186,509.3 3
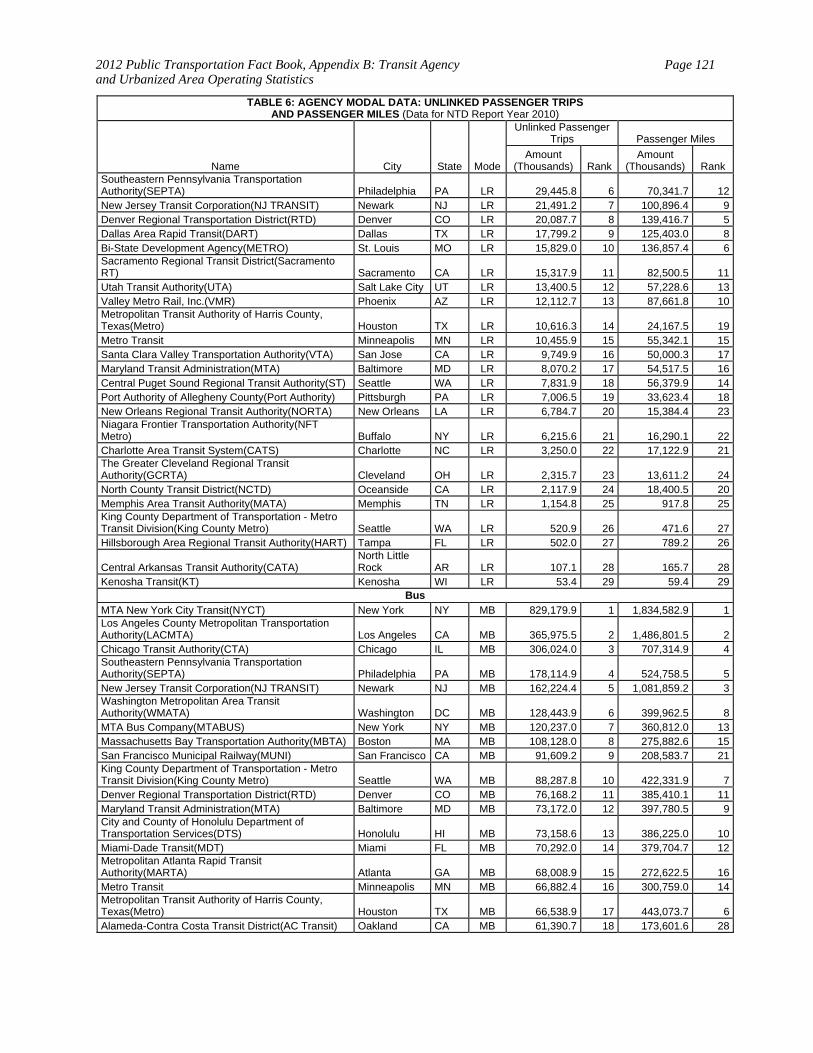
2012 Public Transportation Fact Book, Appendix B: Transit Agency and Urbanized Area Operating Statistics
Page 121
TABLE 6: AGENCY MODAL DATA: UNLINKED PASSENGER TRIPS AND PASSENGER MILES (Data for NTD Report Year 2010)
Name City State Mode
Unlinked Passenger Trips Passenger Miles
Amount (Thousands) Rank
Amount (Thousands) Rank
Southeastern Pennsylvania Transportation Authority(SEPTA) Philadelphia PA LR 29,445.8 6 70,341.7 12New Jersey Transit Corporation(NJ TRANSIT) Newark NJ LR 21,491.2 7 100,896.4 9Denver Regional Transportation District(RTD) Denver CO LR 20,087.7 8 139,416.7 5Dallas Area Rapid Transit(DART) Dallas TX LR 17,799.2 9 125,403.0 8Bi-State Development Agency(METRO) St. Louis MO LR 15,829.0 10 136,857.4 6Sacramento Regional Transit District(Sacramento RT) Sacramento CA LR 15,317.9 11 82,500.5 11Utah Transit Authority(UTA) Salt Lake City UT LR 13,400.5 12 57,228.6 13Valley Metro Rail, Inc.(VMR) Phoenix AZ LR 12,112.7 13 87,661.8 10Metropolitan Transit Authority of Harris County, Texas(Metro) Houston TX LR 10,616.3 14 24,167.5 19Metro Transit Minneapolis MN LR 10,455.9 15 55,342.1 15Santa Clara Valley Transportation Authority(VTA) San Jose CA LR 9,749.9 16 50,000.3 17Maryland Transit Administration(MTA) Baltimore MD LR 8,070.2 17 54,517.5 16Central Puget Sound Regional Transit Authority(ST) Seattle WA LR 7,831.9 18 56,379.9 14Port Authority of Allegheny County(Port Authority) Pittsburgh PA LR 7,006.5 19 33,623.4 18New Orleans Regional Transit Authority(NORTA) New Orleans LA LR 6,784.7 20 15,384.4 23Niagara Frontier Transportation Authority(NFT Metro) Buffalo NY LR 6,215.6 21 16,290.1 22Charlotte Area Transit System(CATS) Charlotte NC LR 3,250.0 22 17,122.9 21The Greater Cleveland Regional Transit Authority(GCRTA) Cleveland OH LR 2,315.7 23 13,611.2 24North County Transit District(NCTD) Oceanside CA LR 2,117.9 24 18,400.5 20Memphis Area Transit Authority(MATA) Memphis TN LR 1,154.8 25 917.8 25King County Department of Transportation - Metro Transit Division(King County Metro) Seattle WA LR 520.9 26 471.6 27Hillsborough Area Regional Transit Authority(HART) Tampa FL LR 502.0 27 789.2 26
Central Arkansas Transit Authority(CATA) North Little Rock AR LR 107.1 28 165.7 28
Kenosha Transit(KT) Kenosha WI LR 53.4 29 59.4 29Bus
MTA New York City Transit(NYCT) New York NY MB 829,179.9 1 1,834,582.9 1Los Angeles County Metropolitan Transportation Authority(LACMTA) Los Angeles CA MB 365,975.5 2 1,486,801.5 2Chicago Transit Authority(CTA) Chicago IL MB 306,024.0 3 707,314.9 4Southeastern Pennsylvania Transportation Authority(SEPTA) Philadelphia PA MB 178,114.9 4 524,758.5 5New Jersey Transit Corporation(NJ TRANSIT) Newark NJ MB 162,224.4 5 1,081,859.2 3Washington Metropolitan Area Transit Authority(WMATA) Washington DC MB 128,443.9 6 399,962.5 8MTA Bus Company(MTABUS) New York NY MB 120,237.0 7 360,812.0 13Massachusetts Bay Transportation Authority(MBTA) Boston MA MB 108,128.0 8 275,882.6 15San Francisco Municipal Railway(MUNI) San Francisco CA MB 91,609.2 9 208,583.7 21King County Department of Transportation - Metro Transit Division(King County Metro) Seattle WA MB 88,287.8 10 422,331.9 7Denver Regional Transportation District(RTD) Denver CO MB 76,168.2 11 385,410.1 11Maryland Transit Administration(MTA) Baltimore MD MB 73,172.0 12 397,780.5 9City and County of Honolulu Department of Transportation Services(DTS) Honolulu HI MB 73,158.6 13 386,225.0 10Miami-Dade Transit(MDT) Miami FL MB 70,292.0 14 379,704.7 12Metropolitan Atlanta Rapid Transit Authority(MARTA) Atlanta GA MB 68,008.9 15 272,622.5 16Metro Transit Minneapolis MN MB 66,882.4 16 300,759.0 14Metropolitan Transit Authority of Harris County, Texas(Metro) Houston TX MB 66,538.9 17 443,073.7 6Alameda-Contra Costa Transit District(AC Transit) Oakland CA MB 61,390.7 18 173,601.6 28
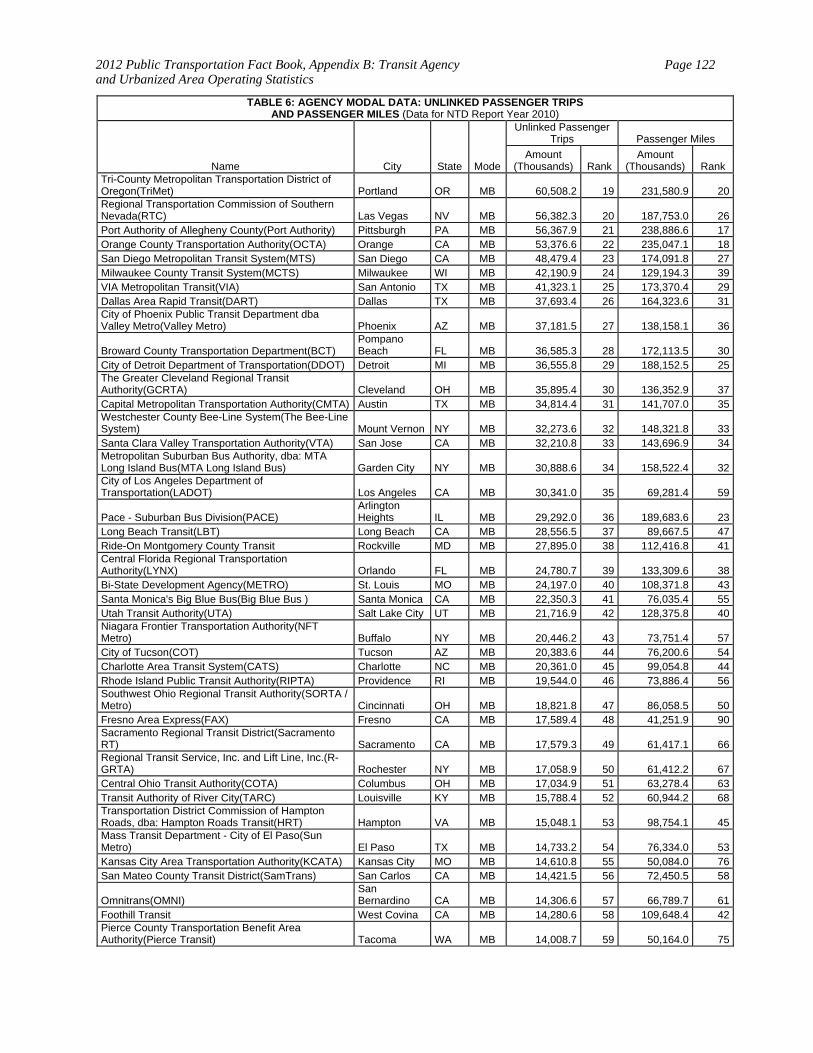
2012 Public Transportation Fact Book, Appendix B: Transit Agency and Urbanized Area Operating Statistics
Page 122
TABLE 6: AGENCY MODAL DATA: UNLINKED PASSENGER TRIPS AND PASSENGER MILES (Data for NTD Report Year 2010)
Name City State Mode
Unlinked Passenger Trips Passenger Miles
Amount (Thousands) Rank
Amount (Thousands) Rank
Tri-County Metropolitan Transportation District of Oregon(TriMet) Portland OR MB 60,508.2 19 231,580.9 20Regional Transportation Commission of Southern Nevada(RTC) Las Vegas NV MB 56,382.3 20 187,753.0 26Port Authority of Allegheny County(Port Authority) Pittsburgh PA MB 56,367.9 21 238,886.6 17Orange County Transportation Authority(OCTA) Orange CA MB 53,376.6 22 235,047.1 18San Diego Metropolitan Transit System(MTS) San Diego CA MB 48,479.4 23 174,091.8 27Milwaukee County Transit System(MCTS) Milwaukee WI MB 42,190.9 24 129,194.3 39VIA Metropolitan Transit(VIA) San Antonio TX MB 41,323.1 25 173,370.4 29Dallas Area Rapid Transit(DART) Dallas TX MB 37,693.4 26 164,323.6 31City of Phoenix Public Transit Department dba Valley Metro(Valley Metro) Phoenix AZ MB 37,181.5 27 138,158.1 36
Broward County Transportation Department(BCT) Pompano Beach FL MB 36,585.3 28 172,113.5 30
City of Detroit Department of Transportation(DDOT) Detroit MI MB 36,555.8 29 188,152.5 25The Greater Cleveland Regional Transit Authority(GCRTA) Cleveland OH MB 35,895.4 30 136,352.9 37Capital Metropolitan Transportation Authority(CMTA) Austin TX MB 34,814.4 31 141,707.0 35Westchester County Bee-Line System(The Bee-Line System) Mount Vernon NY MB 32,273.6 32 148,321.8 33Santa Clara Valley Transportation Authority(VTA) San Jose CA MB 32,210.8 33 143,696.9 34Metropolitan Suburban Bus Authority, dba: MTA Long Island Bus(MTA Long Island Bus) Garden City NY MB 30,888.6 34 158,522.4 32City of Los Angeles Department of Transportation(LADOT) Los Angeles CA MB 30,341.0 35 69,281.4 59
Pace - Suburban Bus Division(PACE) Arlington Heights IL MB 29,292.0 36 189,683.6 23
Long Beach Transit(LBT) Long Beach CA MB 28,556.5 37 89,667.5 47Ride-On Montgomery County Transit Rockville MD MB 27,895.0 38 112,416.8 41Central Florida Regional Transportation Authority(LYNX) Orlando FL MB 24,780.7 39 133,309.6 38Bi-State Development Agency(METRO) St. Louis MO MB 24,197.0 40 108,371.8 43Santa Monica's Big Blue Bus(Big Blue Bus ) Santa Monica CA MB 22,350.3 41 76,035.4 55Utah Transit Authority(UTA) Salt Lake City UT MB 21,716.9 42 128,375.8 40Niagara Frontier Transportation Authority(NFT Metro) Buffalo NY MB 20,446.2 43 73,751.4 57City of Tucson(COT) Tucson AZ MB 20,383.6 44 76,200.6 54Charlotte Area Transit System(CATS) Charlotte NC MB 20,361.0 45 99,054.8 44Rhode Island Public Transit Authority(RIPTA) Providence RI MB 19,544.0 46 73,886.4 56Southwest Ohio Regional Transit Authority(SORTA / Metro) Cincinnati OH MB 18,821.8 47 86,058.5 50Fresno Area Express(FAX) Fresno CA MB 17,589.4 48 41,251.9 90Sacramento Regional Transit District(Sacramento RT) Sacramento CA MB 17,579.3 49 61,417.1 66Regional Transit Service, Inc. and Lift Line, Inc.(R-GRTA) Rochester NY MB 17,058.9 50 61,412.2 67Central Ohio Transit Authority(COTA) Columbus OH MB 17,034.9 51 63,278.4 63Transit Authority of River City(TARC) Louisville KY MB 15,788.4 52 60,944.2 68Transportation District Commission of Hampton Roads, dba: Hampton Roads Transit(HRT) Hampton VA MB 15,048.1 53 98,754.1 45Mass Transit Department - City of El Paso(Sun Metro) El Paso TX MB 14,733.2 54 76,334.0 53Kansas City Area Transportation Authority(KCATA) Kansas City MO MB 14,610.8 55 50,084.0 76San Mateo County Transit District(SamTrans) San Carlos CA MB 14,421.5 56 72,450.5 58
Omnitrans(OMNI) San Bernardino CA MB 14,306.6 57 66,789.7 61
Foothill Transit West Covina CA MB 14,280.6 58 109,648.4 42Pierce County Transportation Benefit Area Authority(Pierce Transit) Tacoma WA MB 14,008.7 59 50,164.0 75
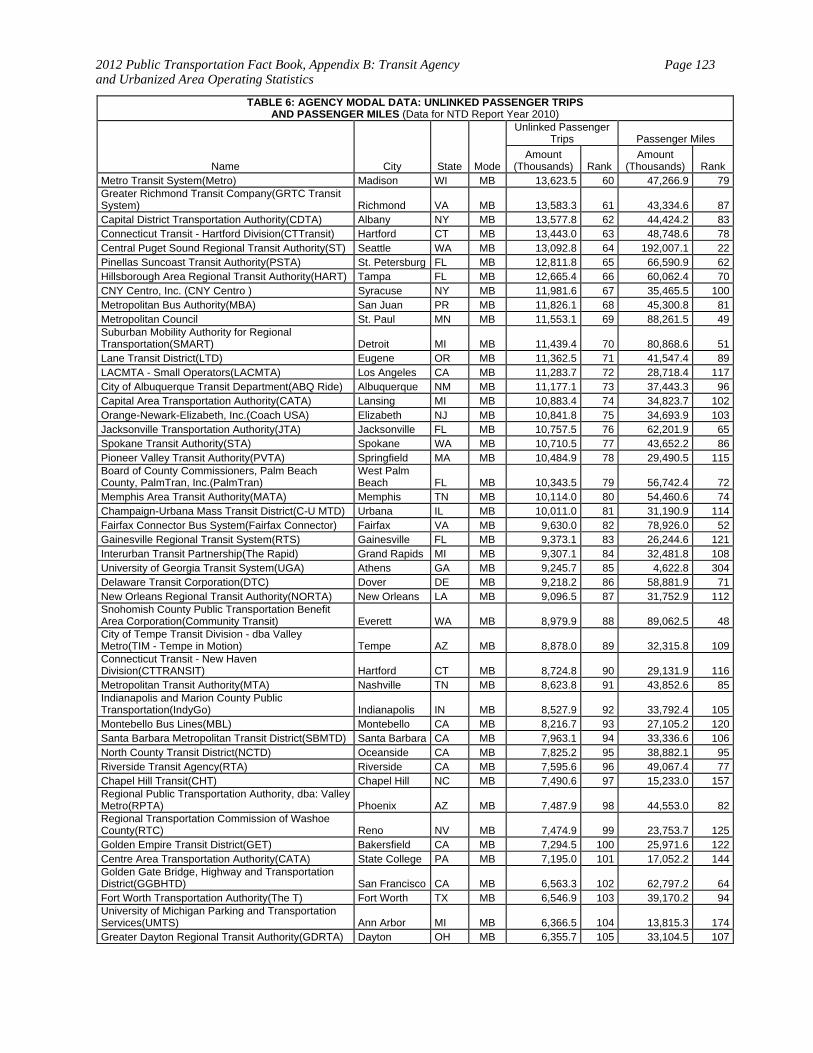
2012 Public Transportation Fact Book, Appendix B: Transit Agency and Urbanized Area Operating Statistics
Page 123
TABLE 6: AGENCY MODAL DATA: UNLINKED PASSENGER TRIPS AND PASSENGER MILES (Data for NTD Report Year 2010)
Name City State Mode
Unlinked Passenger Trips Passenger Miles
Amount (Thousands) Rank
Amount (Thousands) Rank
Metro Transit System(Metro) Madison WI MB 13,623.5 60 47,266.9 79Greater Richmond Transit Company(GRTC Transit System) Richmond VA MB 13,583.3 61 43,334.6 87Capital District Transportation Authority(CDTA) Albany NY MB 13,577.8 62 44,424.2 83Connecticut Transit - Hartford Division(CTTransit) Hartford CT MB 13,443.0 63 48,748.6 78Central Puget Sound Regional Transit Authority(ST) Seattle WA MB 13,092.8 64 192,007.1 22Pinellas Suncoast Transit Authority(PSTA) St. Petersburg FL MB 12,811.8 65 66,590.9 62Hillsborough Area Regional Transit Authority(HART) Tampa FL MB 12,665.4 66 60,062.4 70CNY Centro, Inc. (CNY Centro ) Syracuse NY MB 11,981.6 67 35,465.5 100Metropolitan Bus Authority(MBA) San Juan PR MB 11,826.1 68 45,300.8 81Metropolitan Council St. Paul MN MB 11,553.1 69 88,261.5 49Suburban Mobility Authority for Regional Transportation(SMART) Detroit MI MB 11,439.4 70 80,868.6 51Lane Transit District(LTD) Eugene OR MB 11,362.5 71 41,547.4 89LACMTA - Small Operators(LACMTA) Los Angeles CA MB 11,283.7 72 28,718.4 117City of Albuquerque Transit Department(ABQ Ride) Albuquerque NM MB 11,177.1 73 37,443.3 96Capital Area Transportation Authority(CATA) Lansing MI MB 10,883.4 74 34,823.7 102Orange-Newark-Elizabeth, Inc.(Coach USA) Elizabeth NJ MB 10,841.8 75 34,693.9 103Jacksonville Transportation Authority(JTA) Jacksonville FL MB 10,757.5 76 62,201.9 65Spokane Transit Authority(STA) Spokane WA MB 10,710.5 77 43,652.2 86Pioneer Valley Transit Authority(PVTA) Springfield MA MB 10,484.9 78 29,490.5 115Board of County Commissioners, Palm Beach County, PalmTran, Inc.(PalmTran)
West Palm Beach FL MB 10,343.5 79 56,742.4 72
Memphis Area Transit Authority(MATA) Memphis TN MB 10,114.0 80 54,460.6 74Champaign-Urbana Mass Transit District(C-U MTD) Urbana IL MB 10,011.0 81 31,190.9 114Fairfax Connector Bus System(Fairfax Connector) Fairfax VA MB 9,630.0 82 78,926.0 52Gainesville Regional Transit System(RTS) Gainesville FL MB 9,373.1 83 26,244.6 121Interurban Transit Partnership(The Rapid) Grand Rapids MI MB 9,307.1 84 32,481.8 108University of Georgia Transit System(UGA) Athens GA MB 9,245.7 85 4,622.8 304Delaware Transit Corporation(DTC) Dover DE MB 9,218.2 86 58,881.9 71New Orleans Regional Transit Authority(NORTA) New Orleans LA MB 9,096.5 87 31,752.9 112Snohomish County Public Transportation Benefit Area Corporation(Community Transit) Everett WA MB 8,979.9 88 89,062.5 48City of Tempe Transit Division - dba Valley Metro(TIM - Tempe in Motion) Tempe AZ MB 8,878.0 89 32,315.8 109Connecticut Transit - New Haven Division(CTTRANSIT) Hartford CT MB 8,724.8 90 29,131.9 116Metropolitan Transit Authority(MTA) Nashville TN MB 8,623.8 91 43,852.6 85Indianapolis and Marion County Public Transportation(IndyGo) Indianapolis IN MB 8,527.9 92 33,792.4 105Montebello Bus Lines(MBL) Montebello CA MB 8,216.7 93 27,105.2 120Santa Barbara Metropolitan Transit District(SBMTD) Santa Barbara CA MB 7,963.1 94 33,336.6 106North County Transit District(NCTD) Oceanside CA MB 7,825.2 95 38,882.1 95Riverside Transit Agency(RTA) Riverside CA MB 7,595.6 96 49,067.4 77Chapel Hill Transit(CHT) Chapel Hill NC MB 7,490.6 97 15,233.0 157Regional Public Transportation Authority, dba: Valley Metro(RPTA) Phoenix AZ MB 7,487.9 98 44,553.0 82Regional Transportation Commission of Washoe County(RTC) Reno NV MB 7,474.9 99 23,753.7 125Golden Empire Transit District(GET) Bakersfield CA MB 7,294.5 100 25,971.6 122Centre Area Transportation Authority(CATA) State College PA MB 7,195.0 101 17,052.2 144Golden Gate Bridge, Highway and Transportation District(GGBHTD) San Francisco CA MB 6,563.3 102 62,797.2 64Fort Worth Transportation Authority(The T) Fort Worth TX MB 6,546.9 103 39,170.2 94University of Michigan Parking and Transportation Services(UMTS) Ann Arbor MI MB 6,366.5 104 13,815.3 174Greater Dayton Regional Transit Authority(GDRTA) Dayton OH MB 6,355.7 105 33,104.5 107
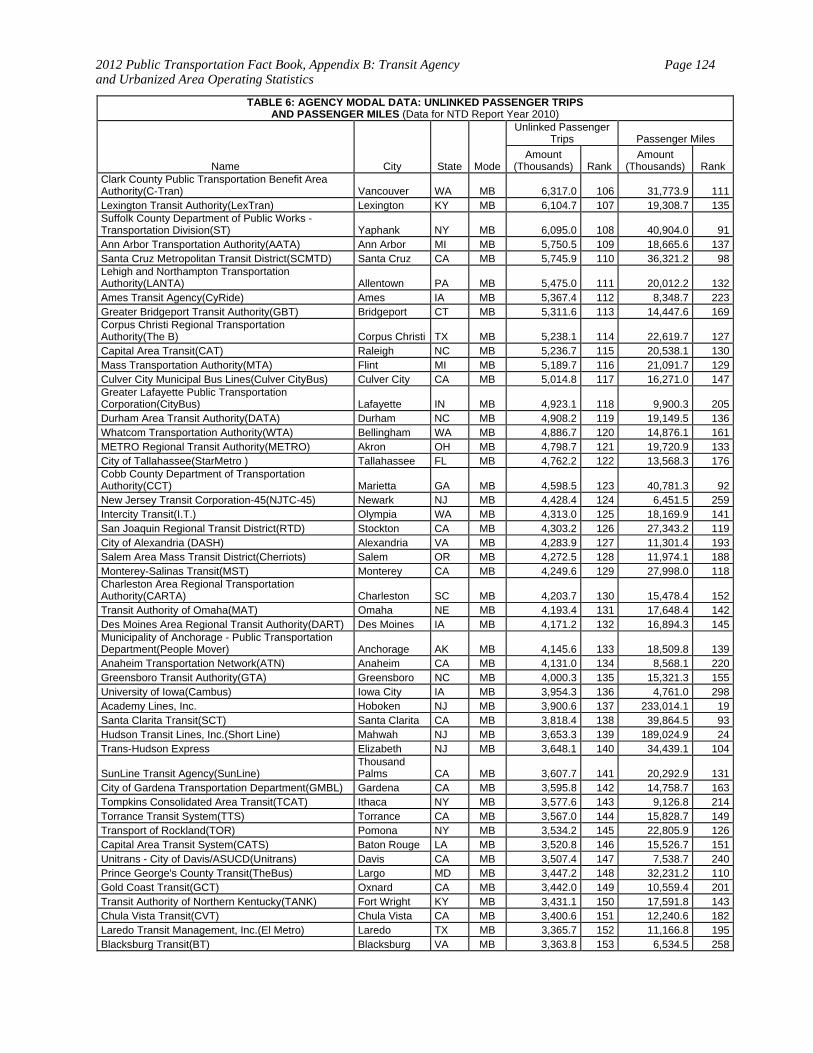
2012 Public Transportation Fact Book, Appendix B: Transit Agency and Urbanized Area Operating Statistics
Page 124
TABLE 6: AGENCY MODAL DATA: UNLINKED PASSENGER TRIPS AND PASSENGER MILES (Data for NTD Report Year 2010)
Name City State Mode
Unlinked Passenger Trips Passenger Miles
Amount (Thousands) Rank
Amount (Thousands) Rank
Clark County Public Transportation Benefit Area Authority(C-Tran) Vancouver WA MB 6,317.0 106 31,773.9 111Lexington Transit Authority(LexTran) Lexington KY MB 6,104.7 107 19,308.7 135Suffolk County Department of Public Works - Transportation Division(ST) Yaphank NY MB 6,095.0 108 40,904.0 91Ann Arbor Transportation Authority(AATA) Ann Arbor MI MB 5,750.5 109 18,665.6 137Santa Cruz Metropolitan Transit District(SCMTD) Santa Cruz CA MB 5,745.9 110 36,321.2 98Lehigh and Northampton Transportation Authority(LANTA) Allentown PA MB 5,475.0 111 20,012.2 132Ames Transit Agency(CyRide) Ames IA MB 5,367.4 112 8,348.7 223Greater Bridgeport Transit Authority(GBT) Bridgeport CT MB 5,311.6 113 14,447.6 169Corpus Christi Regional Transportation Authority(The B) Corpus Christi TX MB 5,238.1 114 22,619.7 127Capital Area Transit(CAT) Raleigh NC MB 5,236.7 115 20,538.1 130Mass Transportation Authority(MTA) Flint MI MB 5,189.7 116 21,091.7 129Culver City Municipal Bus Lines(Culver CityBus) Culver City CA MB 5,014.8 117 16,271.0 147Greater Lafayette Public Transportation Corporation(CityBus) Lafayette IN MB 4,923.1 118 9,900.3 205Durham Area Transit Authority(DATA) Durham NC MB 4,908.2 119 19,149.5 136Whatcom Transportation Authority(WTA) Bellingham WA MB 4,886.7 120 14,876.1 161METRO Regional Transit Authority(METRO) Akron OH MB 4,798.7 121 19,720.9 133City of Tallahassee(StarMetro ) Tallahassee FL MB 4,762.2 122 13,568.3 176Cobb County Department of Transportation Authority(CCT) Marietta GA MB 4,598.5 123 40,781.3 92New Jersey Transit Corporation-45(NJTC-45) Newark NJ MB 4,428.4 124 6,451.5 259Intercity Transit(I.T.) Olympia WA MB 4,313.0 125 18,169.9 141San Joaquin Regional Transit District(RTD) Stockton CA MB 4,303.2 126 27,343.2 119City of Alexandria (DASH) Alexandria VA MB 4,283.9 127 11,301.4 193Salem Area Mass Transit District(Cherriots) Salem OR MB 4,272.5 128 11,974.1 188Monterey-Salinas Transit(MST) Monterey CA MB 4,249.6 129 27,998.0 118Charleston Area Regional Transportation Authority(CARTA) Charleston SC MB 4,203.7 130 15,478.4 152Transit Authority of Omaha(MAT) Omaha NE MB 4,193.4 131 17,648.4 142Des Moines Area Regional Transit Authority(DART) Des Moines IA MB 4,171.2 132 16,894.3 145Municipality of Anchorage - Public Transportation Department(People Mover) Anchorage AK MB 4,145.6 133 18,509.8 139Anaheim Transportation Network(ATN) Anaheim CA MB 4,131.0 134 8,568.1 220Greensboro Transit Authority(GTA) Greensboro NC MB 4,000.3 135 15,321.3 155University of Iowa(Cambus) Iowa City IA MB 3,954.3 136 4,761.0 298Academy Lines, Inc. Hoboken NJ MB 3,900.6 137 233,014.1 19Santa Clarita Transit(SCT) Santa Clarita CA MB 3,818.4 138 39,864.5 93Hudson Transit Lines, Inc.(Short Line) Mahwah NJ MB 3,653.3 139 189,024.9 24Trans-Hudson Express Elizabeth NJ MB 3,648.1 140 34,439.1 104
SunLine Transit Agency(SunLine) Thousand Palms CA MB 3,607.7 141 20,292.9 131
City of Gardena Transportation Department(GMBL) Gardena CA MB 3,595.8 142 14,758.7 163Tompkins Consolidated Area Transit(TCAT) Ithaca NY MB 3,577.6 143 9,126.8 214Torrance Transit System(TTS) Torrance CA MB 3,567.0 144 15,828.7 149Transport of Rockland(TOR) Pomona NY MB 3,534.2 145 22,805.9 126Capital Area Transit System(CATS) Baton Rouge LA MB 3,520.8 146 15,526.7 151Unitrans - City of Davis/ASUCD(Unitrans) Davis CA MB 3,507.4 147 7,538.7 240Prince George's County Transit(TheBus) Largo MD MB 3,447.2 148 32,231.2 110Gold Coast Transit(GCT) Oxnard CA MB 3,442.0 149 10,559.4 201Transit Authority of Northern Kentucky(TANK) Fort Wright KY MB 3,431.1 150 17,591.8 143Chula Vista Transit(CVT) Chula Vista CA MB 3,400.6 151 12,240.6 182Laredo Transit Management, Inc.(El Metro) Laredo TX MB 3,365.7 152 11,166.8 195Blacksburg Transit(BT) Blacksburg VA MB 3,363.8 153 6,534.5 258
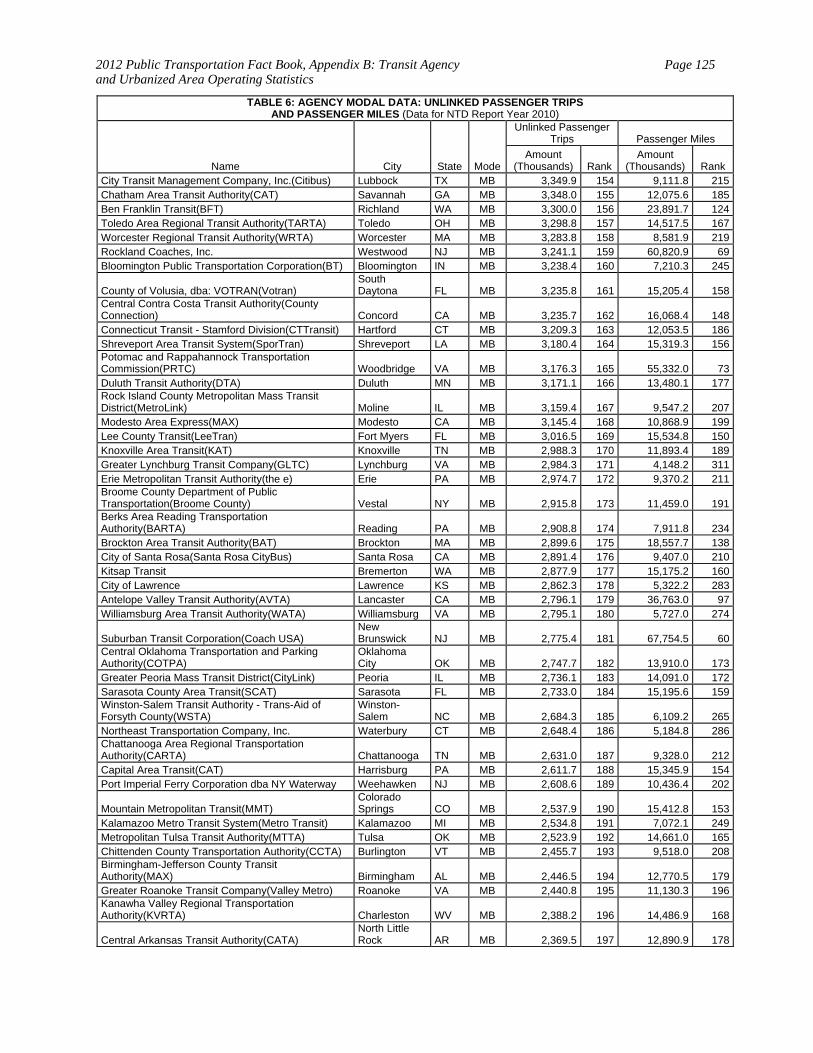
2012 Public Transportation Fact Book, Appendix B: Transit Agency and Urbanized Area Operating Statistics
Page 125
TABLE 6: AGENCY MODAL DATA: UNLINKED PASSENGER TRIPS AND PASSENGER MILES (Data for NTD Report Year 2010)
Name City State Mode
Unlinked Passenger Trips Passenger Miles
Amount (Thousands) Rank
Amount (Thousands) Rank
City Transit Management Company, Inc.(Citibus) Lubbock TX MB 3,349.9 154 9,111.8 215Chatham Area Transit Authority(CAT) Savannah GA MB 3,348.0 155 12,075.6 185Ben Franklin Transit(BFT) Richland WA MB 3,300.0 156 23,891.7 124Toledo Area Regional Transit Authority(TARTA) Toledo OH MB 3,298.8 157 14,517.5 167Worcester Regional Transit Authority(WRTA) Worcester MA MB 3,283.8 158 8,581.9 219Rockland Coaches, Inc. Westwood NJ MB 3,241.1 159 60,820.9 69Bloomington Public Transportation Corporation(BT) Bloomington IN MB 3,238.4 160 7,210.3 245
County of Volusia, dba: VOTRAN(Votran) South Daytona FL MB 3,235.8 161 15,205.4 158
Central Contra Costa Transit Authority(County Connection) Concord CA MB 3,235.7 162 16,068.4 148Connecticut Transit - Stamford Division(CTTransit) Hartford CT MB 3,209.3 163 12,053.5 186Shreveport Area Transit System(SporTran) Shreveport LA MB 3,180.4 164 15,319.3 156Potomac and Rappahannock Transportation Commission(PRTC) Woodbridge VA MB 3,176.3 165 55,332.0 73Duluth Transit Authority(DTA) Duluth MN MB 3,171.1 166 13,480.1 177Rock Island County Metropolitan Mass Transit District(MetroLink) Moline IL MB 3,159.4 167 9,547.2 207Modesto Area Express(MAX) Modesto CA MB 3,145.4 168 10,868.9 199Lee County Transit(LeeTran) Fort Myers FL MB 3,016.5 169 15,534.8 150Knoxville Area Transit(KAT) Knoxville TN MB 2,988.3 170 11,893.4 189Greater Lynchburg Transit Company(GLTC) Lynchburg VA MB 2,984.3 171 4,148.2 311Erie Metropolitan Transit Authority(the e) Erie PA MB 2,974.7 172 9,370.2 211Broome County Department of Public Transportation(Broome County) Vestal NY MB 2,915.8 173 11,459.0 191Berks Area Reading Transportation Authority(BARTA) Reading PA MB 2,908.8 174 7,911.8 234Brockton Area Transit Authority(BAT) Brockton MA MB 2,899.6 175 18,557.7 138City of Santa Rosa(Santa Rosa CityBus) Santa Rosa CA MB 2,891.4 176 9,407.0 210Kitsap Transit Bremerton WA MB 2,877.9 177 15,175.2 160City of Lawrence Lawrence KS MB 2,862.3 178 5,322.2 283Antelope Valley Transit Authority(AVTA) Lancaster CA MB 2,796.1 179 36,763.0 97Williamsburg Area Transit Authority(WATA) Williamsburg VA MB 2,795.1 180 5,727.0 274
Suburban Transit Corporation(Coach USA) New Brunswick NJ MB 2,775.4 181 67,754.5 60
Central Oklahoma Transportation and Parking Authority(COTPA)
Oklahoma City OK MB 2,747.7 182 13,910.0 173
Greater Peoria Mass Transit District(CityLink) Peoria IL MB 2,736.1 183 14,091.0 172Sarasota County Area Transit(SCAT) Sarasota FL MB 2,733.0 184 15,195.6 159Winston-Salem Transit Authority - Trans-Aid of Forsyth County(WSTA)
Winston-Salem NC MB 2,684.3 185 6,109.2 265
Northeast Transportation Company, Inc. Waterbury CT MB 2,648.4 186 5,184.8 286Chattanooga Area Regional Transportation Authority(CARTA) Chattanooga TN MB 2,631.0 187 9,328.0 212Capital Area Transit(CAT) Harrisburg PA MB 2,611.7 188 15,345.9 154Port Imperial Ferry Corporation dba NY Waterway Weehawken NJ MB 2,608.6 189 10,436.4 202
Mountain Metropolitan Transit(MMT) Colorado Springs CO MB 2,537.9 190 15,412.8 153
Kalamazoo Metro Transit System(Metro Transit) Kalamazoo MI MB 2,534.8 191 7,072.1 249Metropolitan Tulsa Transit Authority(MTTA) Tulsa OK MB 2,523.9 192 14,661.0 165Chittenden County Transportation Authority(CCTA) Burlington VT MB 2,455.7 193 9,518.0 208Birmingham-Jefferson County Transit Authority(MAX) Birmingham AL MB 2,446.5 194 12,770.5 179Greater Roanoke Transit Company(Valley Metro) Roanoke VA MB 2,440.8 195 11,130.3 196Kanawha Valley Regional Transportation Authority(KVRTA) Charleston WV MB 2,388.2 196 14,486.9 168
Central Arkansas Transit Authority(CATA) North Little Rock AR MB 2,369.5 197 12,890.9 178
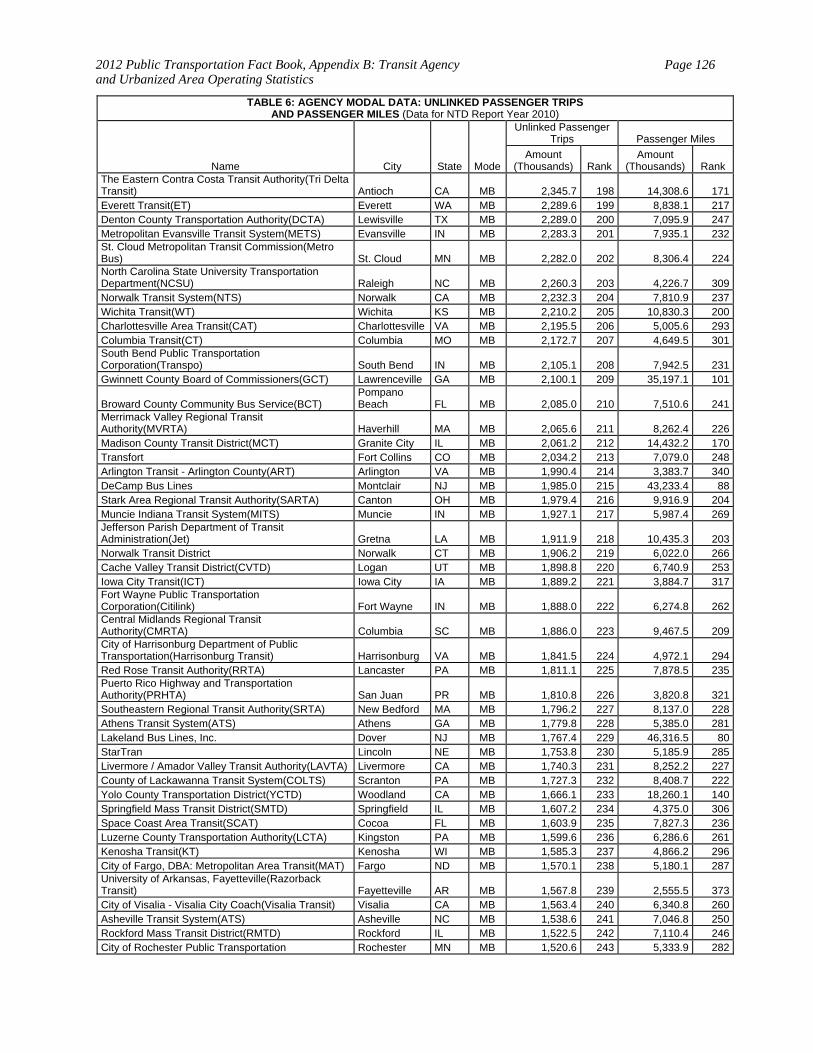
2012 Public Transportation Fact Book, Appendix B: Transit Agency and Urbanized Area Operating Statistics
Page 126
TABLE 6: AGENCY MODAL DATA: UNLINKED PASSENGER TRIPS AND PASSENGER MILES (Data for NTD Report Year 2010)
Name City State Mode
Unlinked Passenger Trips Passenger Miles
Amount (Thousands) Rank
Amount (Thousands) Rank
The Eastern Contra Costa Transit Authority(Tri Delta Transit) Antioch CA MB 2,345.7 198 14,308.6 171Everett Transit(ET) Everett WA MB 2,289.6 199 8,838.1 217Denton County Transportation Authority(DCTA) Lewisville TX MB 2,289.0 200 7,095.9 247Metropolitan Evansville Transit System(METS) Evansville IN MB 2,283.3 201 7,935.1 232St. Cloud Metropolitan Transit Commission(Metro Bus) St. Cloud MN MB 2,282.0 202 8,306.4 224North Carolina State University Transportation Department(NCSU) Raleigh NC MB 2,260.3 203 4,226.7 309Norwalk Transit System(NTS) Norwalk CA MB 2,232.3 204 7,810.9 237Wichita Transit(WT) Wichita KS MB 2,210.2 205 10,830.3 200Charlottesville Area Transit(CAT) Charlottesville VA MB 2,195.5 206 5,005.6 293Columbia Transit(CT) Columbia MO MB 2,172.7 207 4,649.5 301South Bend Public Transportation Corporation(Transpo) South Bend IN MB 2,105.1 208 7,942.5 231Gwinnett County Board of Commissioners(GCT) Lawrenceville GA MB 2,100.1 209 35,197.1 101
Broward County Community Bus Service(BCT) Pompano Beach FL MB 2,085.0 210 7,510.6 241
Merrimack Valley Regional Transit Authority(MVRTA) Haverhill MA MB 2,065.6 211 8,262.4 226Madison County Transit District(MCT) Granite City IL MB 2,061.2 212 14,432.2 170Transfort Fort Collins CO MB 2,034.2 213 7,079.0 248Arlington Transit - Arlington County(ART) Arlington VA MB 1,990.4 214 3,383.7 340DeCamp Bus Lines Montclair NJ MB 1,985.0 215 43,233.4 88Stark Area Regional Transit Authority(SARTA) Canton OH MB 1,979.4 216 9,916.9 204Muncie Indiana Transit System(MITS) Muncie IN MB 1,927.1 217 5,987.4 269Jefferson Parish Department of Transit Administration(Jet) Gretna LA MB 1,911.9 218 10,435.3 203Norwalk Transit District Norwalk CT MB 1,906.2 219 6,022.0 266Cache Valley Transit District(CVTD) Logan UT MB 1,898.8 220 6,740.9 253Iowa City Transit(ICT) Iowa City IA MB 1,889.2 221 3,884.7 317Fort Wayne Public Transportation Corporation(Citilink) Fort Wayne IN MB 1,888.0 222 6,274.8 262Central Midlands Regional Transit Authority(CMRTA) Columbia SC MB 1,886.0 223 9,467.5 209City of Harrisonburg Department of Public Transportation(Harrisonburg Transit) Harrisonburg VA MB 1,841.5 224 4,972.1 294Red Rose Transit Authority(RRTA) Lancaster PA MB 1,811.1 225 7,878.5 235Puerto Rico Highway and Transportation Authority(PRHTA) San Juan PR MB 1,810.8 226 3,820.8 321Southeastern Regional Transit Authority(SRTA) New Bedford MA MB 1,796.2 227 8,137.0 228Athens Transit System(ATS) Athens GA MB 1,779.8 228 5,385.0 281Lakeland Bus Lines, Inc. Dover NJ MB 1,767.4 229 46,316.5 80StarTran Lincoln NE MB 1,753.8 230 5,185.9 285Livermore / Amador Valley Transit Authority(LAVTA) Livermore CA MB 1,740.3 231 8,252.2 227County of Lackawanna Transit System(COLTS) Scranton PA MB 1,727.3 232 8,408.7 222Yolo County Transportation District(YCTD) Woodland CA MB 1,666.1 233 18,260.1 140Springfield Mass Transit District(SMTD) Springfield IL MB 1,607.2 234 4,375.0 306Space Coast Area Transit(SCAT) Cocoa FL MB 1,603.9 235 7,827.3 236Luzerne County Transportation Authority(LCTA) Kingston PA MB 1,599.6 236 6,286.6 261Kenosha Transit(KT) Kenosha WI MB 1,585.3 237 4,866.2 296City of Fargo, DBA: Metropolitan Area Transit(MAT) Fargo ND MB 1,570.1 238 5,180.1 287University of Arkansas, Fayetteville(Razorback Transit) Fayetteville AR MB 1,567.8 239 2,555.5 373City of Visalia - Visalia City Coach(Visalia Transit) Visalia CA MB 1,563.4 240 6,340.8 260Asheville Transit System(ATS) Asheville NC MB 1,538.6 241 7,046.8 250Rockford Mass Transit District(RMTD) Rockford IL MB 1,522.5 242 7,110.4 246City of Rochester Public Transportation Rochester MN MB 1,520.6 243 5,333.9 282
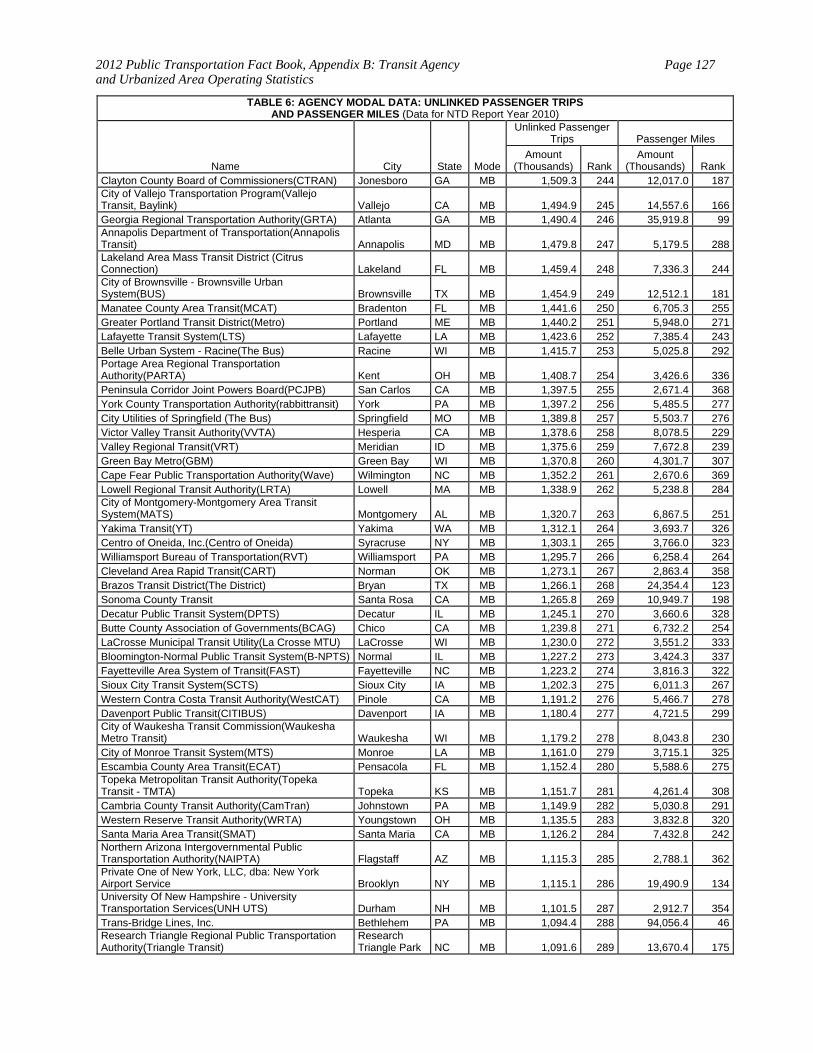
2012 Public Transportation Fact Book, Appendix B: Transit Agency and Urbanized Area Operating Statistics
Page 127
TABLE 6: AGENCY MODAL DATA: UNLINKED PASSENGER TRIPS AND PASSENGER MILES (Data for NTD Report Year 2010)
Name City State Mode
Unlinked Passenger Trips Passenger Miles
Amount (Thousands) Rank
Amount (Thousands) Rank
Clayton County Board of Commissioners(CTRAN) Jonesboro GA MB 1,509.3 244 12,017.0 187City of Vallejo Transportation Program(Vallejo Transit, Baylink) Vallejo CA MB 1,494.9 245 14,557.6 166Georgia Regional Transportation Authority(GRTA) Atlanta GA MB 1,490.4 246 35,919.8 99Annapolis Department of Transportation(Annapolis Transit) Annapolis MD MB 1,479.8 247 5,179.5 288Lakeland Area Mass Transit District (Citrus Connection) Lakeland FL MB 1,459.4 248 7,336.3 244City of Brownsville - Brownsville Urban System(BUS) Brownsville TX MB 1,454.9 249 12,512.1 181Manatee County Area Transit(MCAT) Bradenton FL MB 1,441.6 250 6,705.3 255Greater Portland Transit District(Metro) Portland ME MB 1,440.2 251 5,948.0 271Lafayette Transit System(LTS) Lafayette LA MB 1,423.6 252 7,385.4 243Belle Urban System - Racine(The Bus) Racine WI MB 1,415.7 253 5,025.8 292Portage Area Regional Transportation Authority(PARTA) Kent OH MB 1,408.7 254 3,426.6 336Peninsula Corridor Joint Powers Board(PCJPB) San Carlos CA MB 1,397.5 255 2,671.4 368York County Transportation Authority(rabbittransit) York PA MB 1,397.2 256 5,485.5 277City Utilities of Springfield (The Bus) Springfield MO MB 1,389.8 257 5,503.7 276Victor Valley Transit Authority(VVTA) Hesperia CA MB 1,378.6 258 8,078.5 229Valley Regional Transit(VRT) Meridian ID MB 1,375.6 259 7,672.8 239Green Bay Metro(GBM) Green Bay WI MB 1,370.8 260 4,301.7 307Cape Fear Public Transportation Authority(Wave) Wilmington NC MB 1,352.2 261 2,670.6 369Lowell Regional Transit Authority(LRTA) Lowell MA MB 1,338.9 262 5,238.8 284City of Montgomery-Montgomery Area Transit System(MATS) Montgomery AL MB 1,320.7 263 6,867.5 251Yakima Transit(YT) Yakima WA MB 1,312.1 264 3,693.7 326Centro of Oneida, Inc.(Centro of Oneida) Syracruse NY MB 1,303.1 265 3,766.0 323Williamsport Bureau of Transportation(RVT) Williamsport PA MB 1,295.7 266 6,258.4 264Cleveland Area Rapid Transit(CART) Norman OK MB 1,273.1 267 2,863.4 358Brazos Transit District(The District) Bryan TX MB 1,266.1 268 24,354.4 123Sonoma County Transit Santa Rosa CA MB 1,265.8 269 10,949.7 198Decatur Public Transit System(DPTS) Decatur IL MB 1,245.1 270 3,660.6 328Butte County Association of Governments(BCAG) Chico CA MB 1,239.8 271 6,732.2 254LaCrosse Municipal Transit Utility(La Crosse MTU) LaCrosse WI MB 1,230.0 272 3,551.2 333Bloomington-Normal Public Transit System(B-NPTS) Normal IL MB 1,227.2 273 3,424.3 337Fayetteville Area System of Transit(FAST) Fayetteville NC MB 1,223.2 274 3,816.3 322Sioux City Transit System(SCTS) Sioux City IA MB 1,202.3 275 6,011.3 267Western Contra Costa Transit Authority(WestCAT) Pinole CA MB 1,191.2 276 5,466.7 278Davenport Public Transit(CITIBUS) Davenport IA MB 1,180.4 277 4,721.5 299City of Waukesha Transit Commission(Waukesha Metro Transit) Waukesha WI MB 1,179.2 278 8,043.8 230City of Monroe Transit System(MTS) Monroe LA MB 1,161.0 279 3,715.1 325Escambia County Area Transit(ECAT) Pensacola FL MB 1,152.4 280 5,588.6 275Topeka Metropolitan Transit Authority(Topeka Transit - TMTA) Topeka KS MB 1,151.7 281 4,261.4 308Cambria County Transit Authority(CamTran) Johnstown PA MB 1,149.9 282 5,030.8 291Western Reserve Transit Authority(WRTA) Youngstown OH MB 1,135.5 283 3,832.8 320Santa Maria Area Transit(SMAT) Santa Maria CA MB 1,126.2 284 7,432.8 242Northern Arizona Intergovernmental Public Transportation Authority(NAIPTA) Flagstaff AZ MB 1,115.3 285 2,788.1 362Private One of New York, LLC, dba: New York Airport Service Brooklyn NY MB 1,115.1 286 19,490.9 134University Of New Hampshire - University Transportation Services(UNH UTS) Durham NH MB 1,101.5 287 2,912.7 354Trans-Bridge Lines, Inc. Bethlehem PA MB 1,094.4 288 94,056.4 46Research Triangle Regional Public Transportation Authority(Triangle Transit)
Research Triangle Park NC MB 1,091.6 289 13,670.4 175
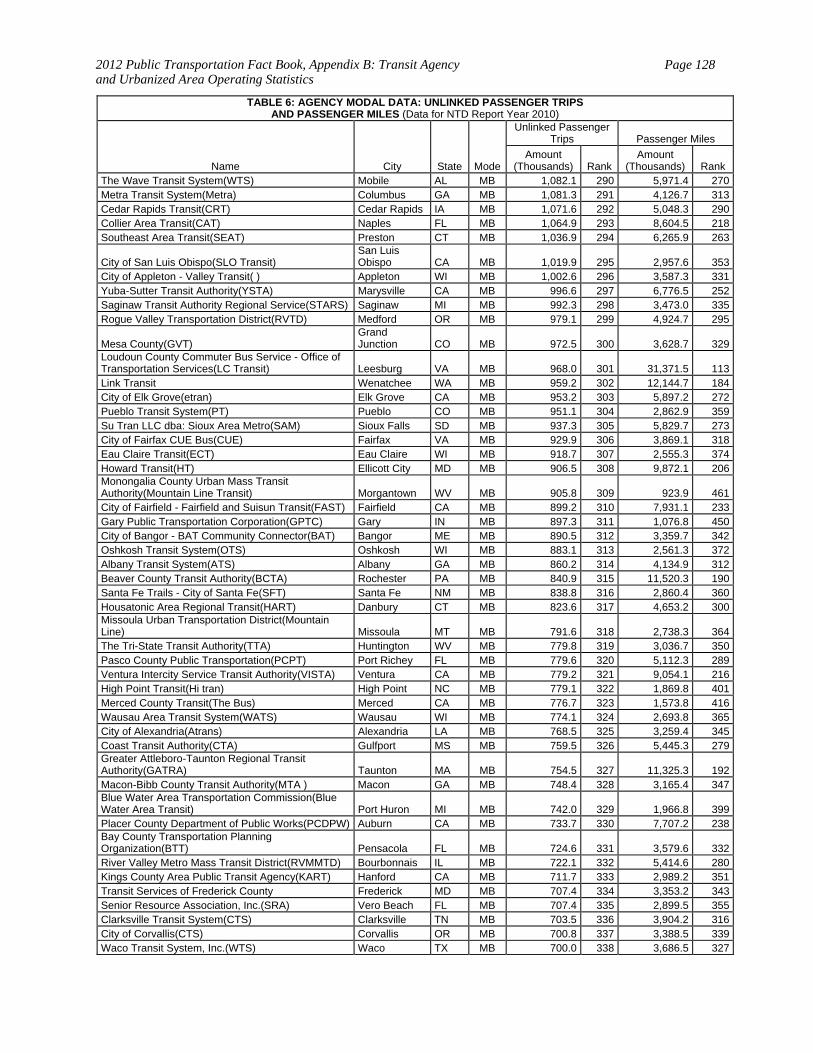
2012 Public Transportation Fact Book, Appendix B: Transit Agency and Urbanized Area Operating Statistics
Page 128
TABLE 6: AGENCY MODAL DATA: UNLINKED PASSENGER TRIPS AND PASSENGER MILES (Data for NTD Report Year 2010)
Name City State Mode
Unlinked Passenger Trips Passenger Miles
Amount (Thousands) Rank
Amount (Thousands) Rank
The Wave Transit System(WTS) Mobile AL MB 1,082.1 290 5,971.4 270Metra Transit System(Metra) Columbus GA MB 1,081.3 291 4,126.7 313Cedar Rapids Transit(CRT) Cedar Rapids IA MB 1,071.6 292 5,048.3 290Collier Area Transit(CAT) Naples FL MB 1,064.9 293 8,604.5 218Southeast Area Transit(SEAT) Preston CT MB 1,036.9 294 6,265.9 263
City of San Luis Obispo(SLO Transit) San Luis Obispo CA MB 1,019.9 295 2,957.6 353
City of Appleton - Valley Transit( ) Appleton WI MB 1,002.6 296 3,587.3 331Yuba-Sutter Transit Authority(YSTA) Marysville CA MB 996.6 297 6,776.5 252Saginaw Transit Authority Regional Service(STARS) Saginaw MI MB 992.3 298 3,473.0 335Rogue Valley Transportation District(RVTD) Medford OR MB 979.1 299 4,924.7 295
Mesa County(GVT) Grand Junction CO MB 972.5 300 3,628.7 329
Loudoun County Commuter Bus Service - Office of Transportation Services(LC Transit) Leesburg VA MB 968.0 301 31,371.5 113Link Transit Wenatchee WA MB 959.2 302 12,144.7 184City of Elk Grove(etran) Elk Grove CA MB 953.2 303 5,897.2 272Pueblo Transit System(PT) Pueblo CO MB 951.1 304 2,862.9 359Su Tran LLC dba: Sioux Area Metro(SAM) Sioux Falls SD MB 937.3 305 5,829.7 273City of Fairfax CUE Bus(CUE) Fairfax VA MB 929.9 306 3,869.1 318Eau Claire Transit(ECT) Eau Claire WI MB 918.7 307 2,555.3 374Howard Transit(HT) Ellicott City MD MB 906.5 308 9,872.1 206Monongalia County Urban Mass Transit Authority(Mountain Line Transit) Morgantown WV MB 905.8 309 923.9 461City of Fairfield - Fairfield and Suisun Transit(FAST) Fairfield CA MB 899.2 310 7,931.1 233Gary Public Transportation Corporation(GPTC) Gary IN MB 897.3 311 1,076.8 450City of Bangor - BAT Community Connector(BAT) Bangor ME MB 890.5 312 3,359.7 342Oshkosh Transit System(OTS) Oshkosh WI MB 883.1 313 2,561.3 372Albany Transit System(ATS) Albany GA MB 860.2 314 4,134.9 312Beaver County Transit Authority(BCTA) Rochester PA MB 840.9 315 11,520.3 190Santa Fe Trails - City of Santa Fe(SFT) Santa Fe NM MB 838.8 316 2,860.4 360Housatonic Area Regional Transit(HART) Danbury CT MB 823.6 317 4,653.2 300Missoula Urban Transportation District(Mountain Line) Missoula MT MB 791.6 318 2,738.3 364The Tri-State Transit Authority(TTA) Huntington WV MB 779.8 319 3,036.7 350Pasco County Public Transportation(PCPT) Port Richey FL MB 779.6 320 5,112.3 289Ventura Intercity Service Transit Authority(VISTA) Ventura CA MB 779.2 321 9,054.1 216High Point Transit(Hi tran) High Point NC MB 779.1 322 1,869.8 401Merced County Transit(The Bus) Merced CA MB 776.7 323 1,573.8 416Wausau Area Transit System(WATS) Wausau WI MB 774.1 324 2,693.8 365City of Alexandria(Atrans) Alexandria LA MB 768.5 325 3,259.4 345Coast Transit Authority(CTA) Gulfport MS MB 759.5 326 5,445.3 279Greater Attleboro-Taunton Regional Transit Authority(GATRA) Taunton MA MB 754.5 327 11,325.3 192Macon-Bibb County Transit Authority(MTA ) Macon GA MB 748.4 328 3,165.4 347Blue Water Area Transportation Commission(Blue Water Area Transit) Port Huron MI MB 742.0 329 1,966.8 399Placer County Department of Public Works(PCDPW) Auburn CA MB 733.7 330 7,707.2 238Bay County Transportation Planning Organization(BTT) Pensacola FL MB 724.6 331 3,579.6 332River Valley Metro Mass Transit District(RVMMTD) Bourbonnais IL MB 722.1 332 5,414.6 280Kings County Area Public Transit Agency(KART) Hanford CA MB 711.7 333 2,989.2 351Transit Services of Frederick County Frederick MD MB 707.4 334 3,353.2 343Senior Resource Association, Inc.(SRA) Vero Beach FL MB 707.4 335 2,899.5 355Clarksville Transit System(CTS) Clarksville TN MB 703.5 336 3,904.2 316City of Corvallis(CTS) Corvallis OR MB 700.8 337 3,388.5 339Waco Transit System, Inc.(WTS) Waco TX MB 700.0 338 3,686.5 327

2012 Public Transportation Fact Book, Appendix B: Transit Agency and Urbanized Area Operating Statistics
Page 129
TABLE 6: AGENCY MODAL DATA: UNLINKED PASSENGER TRIPS AND PASSENGER MILES (Data for NTD Report Year 2010)
Name City State Mode
Unlinked Passenger Trips Passenger Miles
Amount (Thousands) Rank
Amount (Thousands) Rank
Greenville Transit Authority(GTA) Greenville SC MB 696.0 339 2,896.7 356City of Rome Transit Department(RTD) Rome GA MB 690.5 340 4,647.1 302Altoona Metro Transit(AMTRAN) Altoona PA MB 687.5 341 2,358.2 382Redding Area Bus Authority(RABA) Redding CA MB 672.4 342 3,612.1 330Napa County Transportation Planning Agency(NCTPA) Napa CA MB 657.8 343 2,295.7 387City of Commerce Municipal Buslines(CBL) Commerce CA MB 654.2 344 2,285.4 388City of Scottsdale - Scottsdale Trolley(COS) Scottsdale AZ MB 651.5 345 1,203.1 438New York City Department of Transportation(NYCDOT) New York NY MB 641.1 346 3,972.3 315Chemung County Transit System(CCTS) Elmira NY MB 635.8 347 2,759.5 363Billings Metropolitan Transit(Billings MET Transit ) Billings MT MB 630.1 348 2,335.1 384
Muskegon Area Transit System(MATS) Muskegon Heights MI MB 629.9 349 2,853.6 361
Olympia Trails Bus Company, Inc.(Coach USA) Elizabeth NJ MB 626.7 350 12,211.3 183Augusta Richmond County Transit Department(APT) Augusta GA MB 617.3 351 2,981.4 352Las Cruces Area Transit(RoadRUNNER Transit) Las Cruces NM MB 601.8 352 2,038.2 397Autonomous Municipality of Carolina(GMAC) Carolina PR MB 599.1 353 0.0 518tLaguna Beach Municipal Transit(CLB) Laguna Beach CA MB 596.3 354 948.1 458Island Transit(I T) Galveston TX MB 593.1 355 1,832.7 402Imperial Valley Transit(IVT) El Centro CA MB 592.6 356 10,962.3 197Community Transit, Inc. (Community Transit) Paramus NJ MB 591.4 357 14,859.5 162Beaumont Municipal Transit System(BMT) Beaumont TX MB 583.1 358 2,682.0 367Montachusett Regional Transit Authority(MART) Fitchburg MA MB 581.6 359 3,716.5 324Petersburg Area Transit(PAT) Petersburg VA MB 575.2 360 1,150.4 444Private Transportation Corporation Brooklyn NY MB 564.6 361 4,104.1 314Johnson City Transit System(JCT) Johnson City TN MB 562.5 362 2,098.0 395County Commissioners of Charles County, MD(DCS VanGO) Port Tobacco MD MB 562.4 363 4,640.1 303City of Jackson Transportation Authority(JTA) Jackson MI MB 558.2 364 1,774.6 404Jackson Transit Authority(JTA) Jackson TN MB 555.1 365 2,318.7 385New Britain Transportation Company, Inc. Berlin CT MB 548.9 366 4,462.2 305Monsey New Square Trails Corporation Spring Valley NY MB 547.1 367 21,939.6 128Skagit Transit Burlington WA MB 544.3 368 4,827.8 297Adirondack Transit Lines, Inc,(Adirondack Trailways) Hurley NY MB 539.8 369 44,018.7 84Bay Metropolitan Transit Authority(Bay Metro) Bay City MI MB 534.9 370 3,487.4 334San Luis Obispo Regional Transit Authority(SLORTA)
San Luis Obispo CA MB 534.7 371 14,676.7 164
City of Danville/Danville Mass Transit(DMT) Danville IL MB 530.1 372 2,547.3 375Coralville Transit System(CTS) Coralville IA MB 527.2 373 1,974.0 398Waccamaw Regional Transportation Authority(The Coast RTA) Conway SC MB 527.0 374 2,466.5 378City of Jackson Transit System (JATRAN) Jackson MS MB 520.6 375 807.0 467Spartanburg Transit System(SPARTA) Spartanburg SC MB 519.1 376 2,387.0 380Battle Creek Transit(BCT) Battle Creek MI MB 513.0 377 1,887.9 400
Fredericksburg Regional Transit(FRED) Fredericksburg VA MB 512.4 378 3,130.8 348
Berkshire Regional Transit Authority(BRTA) Pittsfield MA MB 510.5 379 4,176.1 310City of Porterville(C.O.L.T.) Porterville CA MB 498.5 380 2,208.4 390City of Greeley - Transit Services(GET) Greeley CO MB 493.1 381 1,823.1 403Johnson County Kansas, aka: Johnson County Transit(The JO) Olathe KS MB 491.0 382 8,436.8 221Piedmont Authority for Regional Transportation(PART) Greensboro NC MB 485.7 383 12,716.8 180Cape Cod Regional Transit Authority(CCRTA) Hyannis MA MB 485.6 384 8,304.3 225Centro of Cayuga, Inc.(Centro of Cayuga) Syracuse NY MB 474.3 385 3,851.0 319Simi Valley Transit(SVT) Simi Valley CA MB 473.5 386 2,414.3 379
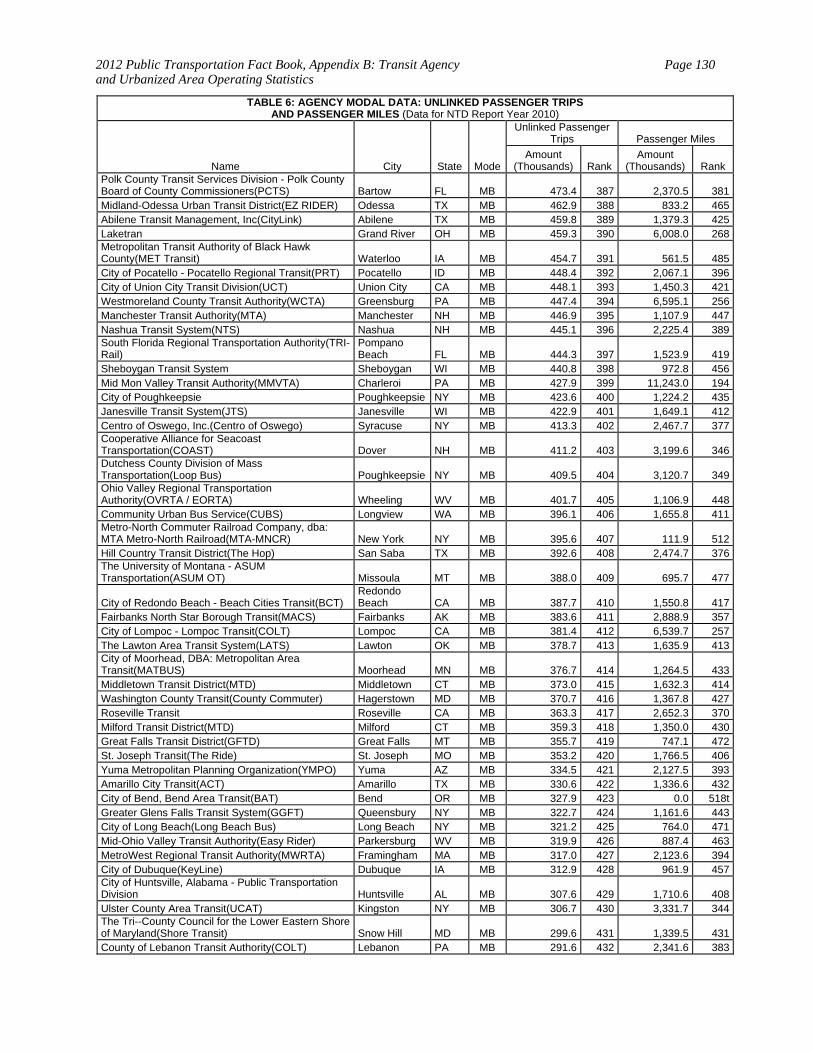
2012 Public Transportation Fact Book, Appendix B: Transit Agency and Urbanized Area Operating Statistics
Page 130
TABLE 6: AGENCY MODAL DATA: UNLINKED PASSENGER TRIPS AND PASSENGER MILES (Data for NTD Report Year 2010)
Name City State Mode
Unlinked Passenger Trips Passenger Miles
Amount (Thousands) Rank
Amount (Thousands) Rank
Polk County Transit Services Division - Polk County Board of County Commissioners(PCTS) Bartow FL MB 473.4 387 2,370.5 381Midland-Odessa Urban Transit District(EZ RIDER) Odessa TX MB 462.9 388 833.2 465Abilene Transit Management, Inc(CityLink) Abilene TX MB 459.8 389 1,379.3 425Laketran Grand River OH MB 459.3 390 6,008.0 268Metropolitan Transit Authority of Black Hawk County(MET Transit) Waterloo IA MB 454.7 391 561.5 485City of Pocatello - Pocatello Regional Transit(PRT) Pocatello ID MB 448.4 392 2,067.1 396City of Union City Transit Division(UCT) Union City CA MB 448.1 393 1,450.3 421Westmoreland County Transit Authority(WCTA) Greensburg PA MB 447.4 394 6,595.1 256Manchester Transit Authority(MTA) Manchester NH MB 446.9 395 1,107.9 447Nashua Transit System(NTS) Nashua NH MB 445.1 396 2,225.4 389South Florida Regional Transportation Authority(TRI-Rail)
Pompano Beach FL MB 444.3 397 1,523.9 419
Sheboygan Transit System Sheboygan WI MB 440.8 398 972.8 456Mid Mon Valley Transit Authority(MMVTA) Charleroi PA MB 427.9 399 11,243.0 194City of Poughkeepsie Poughkeepsie NY MB 423.6 400 1,224.2 435Janesville Transit System(JTS) Janesville WI MB 422.9 401 1,649.1 412Centro of Oswego, Inc.(Centro of Oswego) Syracuse NY MB 413.3 402 2,467.7 377Cooperative Alliance for Seacoast Transportation(COAST) Dover NH MB 411.2 403 3,199.6 346Dutchess County Division of Mass Transportation(Loop Bus) Poughkeepsie NY MB 409.5 404 3,120.7 349Ohio Valley Regional Transportation Authority(OVRTA / EORTA) Wheeling WV MB 401.7 405 1,106.9 448Community Urban Bus Service(CUBS) Longview WA MB 396.1 406 1,655.8 411Metro-North Commuter Railroad Company, dba: MTA Metro-North Railroad(MTA-MNCR) New York NY MB 395.6 407 111.9 512Hill Country Transit District(The Hop) San Saba TX MB 392.6 408 2,474.7 376The University of Montana - ASUM Transportation(ASUM OT) Missoula MT MB 388.0 409 695.7 477
City of Redondo Beach - Beach Cities Transit(BCT) Redondo Beach CA MB 387.7 410 1,550.8 417
Fairbanks North Star Borough Transit(MACS) Fairbanks AK MB 383.6 411 2,888.9 357City of Lompoc - Lompoc Transit(COLT) Lompoc CA MB 381.4 412 6,539.7 257The Lawton Area Transit System(LATS) Lawton OK MB 378.7 413 1,635.9 413City of Moorhead, DBA: Metropolitan Area Transit(MATBUS) Moorhead MN MB 376.7 414 1,264.5 433Middletown Transit District(MTD) Middletown CT MB 373.0 415 1,632.3 414Washington County Transit(County Commuter) Hagerstown MD MB 370.7 416 1,367.8 427Roseville Transit Roseville CA MB 363.3 417 2,652.3 370Milford Transit District(MTD) Milford CT MB 359.3 418 1,350.0 430Great Falls Transit District(GFTD) Great Falls MT MB 355.7 419 747.1 472St. Joseph Transit(The Ride) St. Joseph MO MB 353.2 420 1,766.5 406Yuma Metropolitan Planning Organization(YMPO) Yuma AZ MB 334.5 421 2,127.5 393Amarillo City Transit(ACT) Amarillo TX MB 330.6 422 1,336.6 432City of Bend, Bend Area Transit(BAT) Bend OR MB 327.9 423 0.0 518tGreater Glens Falls Transit System(GGFT) Queensbury NY MB 322.7 424 1,161.6 443City of Long Beach(Long Beach Bus) Long Beach NY MB 321.2 425 764.0 471Mid-Ohio Valley Transit Authority(Easy Rider) Parkersburg WV MB 319.9 426 887.4 463MetroWest Regional Transit Authority(MWRTA) Framingham MA MB 317.0 427 2,123.6 394City of Dubuque(KeyLine) Dubuque IA MB 312.9 428 961.9 457City of Huntsville, Alabama - Public Transportation Division Huntsville AL MB 307.6 429 1,710.6 408Ulster County Area Transit(UCAT) Kingston NY MB 306.7 430 3,331.7 344The Tri--County Council for the Lower Eastern Shore of Maryland(Shore Transit) Snow Hill MD MB 299.6 431 1,339.5 431County of Lebanon Transit Authority(COLT) Lebanon PA MB 291.6 432 2,341.6 383
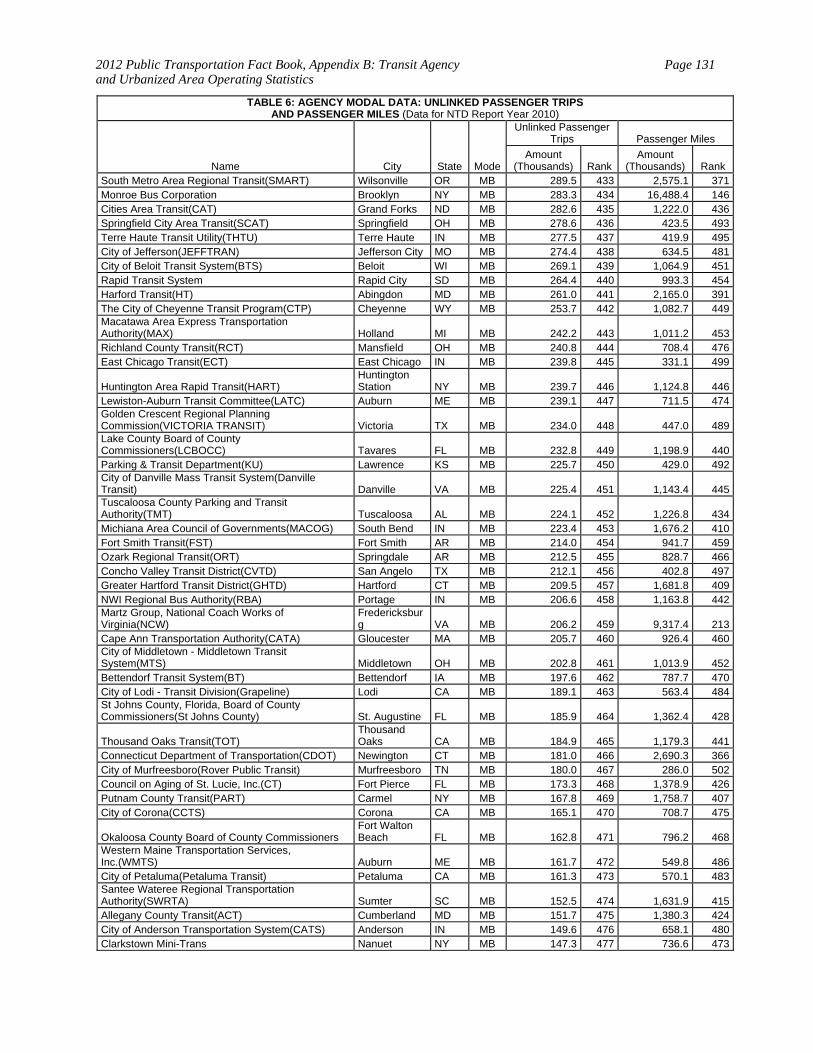
2012 Public Transportation Fact Book, Appendix B: Transit Agency and Urbanized Area Operating Statistics
Page 131
TABLE 6: AGENCY MODAL DATA: UNLINKED PASSENGER TRIPS AND PASSENGER MILES (Data for NTD Report Year 2010)
Name City State Mode
Unlinked Passenger Trips Passenger Miles
Amount (Thousands) Rank
Amount (Thousands) Rank
South Metro Area Regional Transit(SMART) Wilsonville OR MB 289.5 433 2,575.1 371Monroe Bus Corporation Brooklyn NY MB 283.3 434 16,488.4 146Cities Area Transit(CAT) Grand Forks ND MB 282.6 435 1,222.0 436Springfield City Area Transit(SCAT) Springfield OH MB 278.6 436 423.5 493Terre Haute Transit Utility(THTU) Terre Haute IN MB 277.5 437 419.9 495City of Jefferson(JEFFTRAN) Jefferson City MO MB 274.4 438 634.5 481City of Beloit Transit System(BTS) Beloit WI MB 269.1 439 1,064.9 451Rapid Transit System Rapid City SD MB 264.4 440 993.3 454Harford Transit(HT) Abingdon MD MB 261.0 441 2,165.0 391The City of Cheyenne Transit Program(CTP) Cheyenne WY MB 253.7 442 1,082.7 449Macatawa Area Express Transportation Authority(MAX) Holland MI MB 242.2 443 1,011.2 453Richland County Transit(RCT) Mansfield OH MB 240.8 444 708.4 476East Chicago Transit(ECT) East Chicago IN MB 239.8 445 331.1 499
Huntington Area Rapid Transit(HART) Huntington Station NY MB 239.7 446 1,124.8 446
Lewiston-Auburn Transit Committee(LATC) Auburn ME MB 239.1 447 711.5 474Golden Crescent Regional Planning Commission(VICTORIA TRANSIT) Victoria TX MB 234.0 448 447.0 489Lake County Board of County Commissioners(LCBOCC) Tavares FL MB 232.8 449 1,198.9 440Parking & Transit Department(KU) Lawrence KS MB 225.7 450 429.0 492City of Danville Mass Transit System(Danville Transit) Danville VA MB 225.4 451 1,143.4 445Tuscaloosa County Parking and Transit Authority(TMT) Tuscaloosa AL MB 224.1 452 1,226.8 434Michiana Area Council of Governments(MACOG) South Bend IN MB 223.4 453 1,676.2 410Fort Smith Transit(FST) Fort Smith AR MB 214.0 454 941.7 459Ozark Regional Transit(ORT) Springdale AR MB 212.5 455 828.7 466Concho Valley Transit District(CVTD) San Angelo TX MB 212.1 456 402.8 497Greater Hartford Transit District(GHTD) Hartford CT MB 209.5 457 1,681.8 409NWI Regional Bus Authority(RBA) Portage IN MB 206.6 458 1,163.8 442Martz Group, National Coach Works of Virginia(NCW)
Fredericksburg VA MB 206.2 459 9,317.4 213
Cape Ann Transportation Authority(CATA) Gloucester MA MB 205.7 460 926.4 460City of Middletown - Middletown Transit System(MTS) Middletown OH MB 202.8 461 1,013.9 452Bettendorf Transit System(BT) Bettendorf IA MB 197.6 462 787.7 470City of Lodi - Transit Division(Grapeline) Lodi CA MB 189.1 463 563.4 484St Johns County, Florida, Board of County Commissioners(St Johns County) St. Augustine FL MB 185.9 464 1,362.4 428
Thousand Oaks Transit(TOT) Thousand Oaks CA MB 184.9 465 1,179.3 441
Connecticut Department of Transportation(CDOT) Newington CT MB 181.0 466 2,690.3 366City of Murfreesboro(Rover Public Transit) Murfreesboro TN MB 180.0 467 286.0 502Council on Aging of St. Lucie, Inc.(CT) Fort Pierce FL MB 173.3 468 1,378.9 426Putnam County Transit(PART) Carmel NY MB 167.8 469 1,758.7 407City of Corona(CCTS) Corona CA MB 165.1 470 708.7 475
Okaloosa County Board of County Commissioners Fort Walton Beach FL MB 162.8 471 796.2 468
Western Maine Transportation Services, Inc.(WMTS) Auburn ME MB 161.7 472 549.8 486City of Petaluma(Petaluma Transit) Petaluma CA MB 161.3 473 570.1 483Santee Wateree Regional Transportation Authority(SWRTA) Sumter SC MB 152.5 474 1,631.9 415Allegany County Transit(ACT) Cumberland MD MB 151.7 475 1,380.3 424City of Anderson Transportation System(CATS) Anderson IN MB 149.6 476 658.1 480Clarkstown Mini-Trans Nanuet NY MB 147.3 477 736.6 473
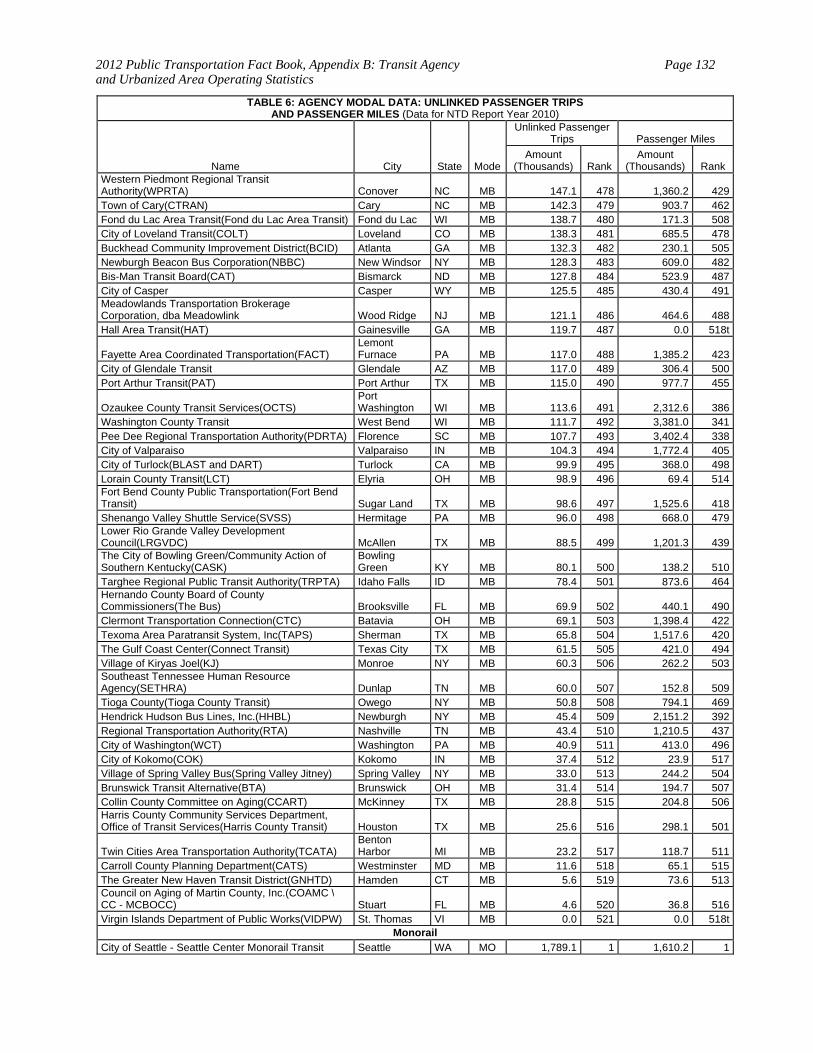
2012 Public Transportation Fact Book, Appendix B: Transit Agency and Urbanized Area Operating Statistics
Page 132
TABLE 6: AGENCY MODAL DATA: UNLINKED PASSENGER TRIPS AND PASSENGER MILES (Data for NTD Report Year 2010)
Name City State Mode
Unlinked Passenger Trips Passenger Miles
Amount (Thousands) Rank
Amount (Thousands) Rank
Western Piedmont Regional Transit Authority(WPRTA) Conover NC MB 147.1 478 1,360.2 429Town of Cary(CTRAN) Cary NC MB 142.3 479 903.7 462Fond du Lac Area Transit(Fond du Lac Area Transit) Fond du Lac WI MB 138.7 480 171.3 508City of Loveland Transit(COLT) Loveland CO MB 138.3 481 685.5 478Buckhead Community Improvement District(BCID) Atlanta GA MB 132.3 482 230.1 505Newburgh Beacon Bus Corporation(NBBC) New Windsor NY MB 128.3 483 609.0 482Bis-Man Transit Board(CAT) Bismarck ND MB 127.8 484 523.9 487City of Casper Casper WY MB 125.5 485 430.4 491Meadowlands Transportation Brokerage Corporation, dba Meadowlink Wood Ridge NJ MB 121.1 486 464.6 488Hall Area Transit(HAT) Gainesville GA MB 119.7 487 0.0 518t
Fayette Area Coordinated Transportation(FACT) Lemont Furnace PA MB 117.0 488 1,385.2 423
City of Glendale Transit Glendale AZ MB 117.0 489 306.4 500Port Arthur Transit(PAT) Port Arthur TX MB 115.0 490 977.7 455
Ozaukee County Transit Services(OCTS) Port Washington WI MB 113.6 491 2,312.6 386
Washington County Transit West Bend WI MB 111.7 492 3,381.0 341Pee Dee Regional Transportation Authority(PDRTA) Florence SC MB 107.7 493 3,402.4 338City of Valparaiso Valparaiso IN MB 104.3 494 1,772.4 405City of Turlock(BLAST and DART) Turlock CA MB 99.9 495 368.0 498Lorain County Transit(LCT) Elyria OH MB 98.9 496 69.4 514Fort Bend County Public Transportation(Fort Bend Transit) Sugar Land TX MB 98.6 497 1,525.6 418Shenango Valley Shuttle Service(SVSS) Hermitage PA MB 96.0 498 668.0 479Lower Rio Grande Valley Development Council(LRGVDC) McAllen TX MB 88.5 499 1,201.3 439The City of Bowling Green/Community Action of Southern Kentucky(CASK)
Bowling Green KY MB 80.1 500 138.2 510
Targhee Regional Public Transit Authority(TRPTA) Idaho Falls ID MB 78.4 501 873.6 464Hernando County Board of County Commissioners(The Bus) Brooksville FL MB 69.9 502 440.1 490Clermont Transportation Connection(CTC) Batavia OH MB 69.1 503 1,398.4 422Texoma Area Paratransit System, Inc(TAPS) Sherman TX MB 65.8 504 1,517.6 420The Gulf Coast Center(Connect Transit) Texas City TX MB 61.5 505 421.0 494Village of Kiryas Joel(KJ) Monroe NY MB 60.3 506 262.2 503Southeast Tennessee Human Resource Agency(SETHRA) Dunlap TN MB 60.0 507 152.8 509Tioga County(Tioga County Transit) Owego NY MB 50.8 508 794.1 469Hendrick Hudson Bus Lines, Inc.(HHBL) Newburgh NY MB 45.4 509 2,151.2 392Regional Transportation Authority(RTA) Nashville TN MB 43.4 510 1,210.5 437City of Washington(WCT) Washington PA MB 40.9 511 413.0 496City of Kokomo(COK) Kokomo IN MB 37.4 512 23.9 517Village of Spring Valley Bus(Spring Valley Jitney) Spring Valley NY MB 33.0 513 244.2 504Brunswick Transit Alternative(BTA) Brunswick OH MB 31.4 514 194.7 507Collin County Committee on Aging(CCART) McKinney TX MB 28.8 515 204.8 506Harris County Community Services Department, Office of Transit Services(Harris County Transit) Houston TX MB 25.6 516 298.1 501
Twin Cities Area Transportation Authority(TCATA) Benton Harbor MI MB 23.2 517 118.7 511
Carroll County Planning Department(CATS) Westminster MD MB 11.6 518 65.1 515The Greater New Haven Transit District(GNHTD) Hamden CT MB 5.6 519 73.6 513Council on Aging of Martin County, Inc.(COAMC \CC - MCBOCC) Stuart FL MB 4.6 520 36.8 516Virgin Islands Department of Public Works(VIDPW) St. Thomas VI MB 0.0 521 0.0 518t
Monorail
City of Seattle - Seattle Center Monorail Transit Seattle WA MO 1,789.1 1 1,610.2 1

2012 Public Transportation Fact Book, Appendix B: Transit Agency and Urbanized Area Operating Statistics
Page 133
TABLE 6: AGENCY MODAL DATA: UNLINKED PASSENGER TRIPS AND PASSENGER MILES (Data for NTD Report Year 2010)
Name City State Mode
Unlinked Passenger Trips Passenger Miles
Amount (Thousands) Rank
Amount (Thousands) Rank
Publico Department of Transportation and Public Works(DTPW) San Juan PR PB 42,134.1 1 168,878.0 1
Trolley Bus
San Francisco Municipal Railway(MUNI) San Francisco CA TB 66,967.7 1 98,408.6 1King County Department of Transportation - Metro Transit Division(King County Metro) Seattle WA TB 20,721.1 2 36,274.4 2Southeastern Pennsylvania Transportation Authority(SEPTA) Philadelphia PA TB 5,510.4 3 10,763.4 3Massachusetts Bay Transportation Authority(MBTA) Boston MA TB 3,124.7 4 6,670.3 5Greater Dayton Regional Transit Authority(GDRTA) Dayton OH TB 2,225.5 5 6,755.3 4
Van Pool King County Department of Transportation - Metro Transit Division(King County Metro) Seattle WA VP 2,849.6 1 58,134.0 4Los Angeles County Metropolitan Transportation Authority(LACMTA) Los Angeles CA VP 2,725.1 2 124,260.7 1Metropolitan Transit Authority of Harris County, Texas(Metro) Houston TX VP 2,423.0 3 67,337.1 3San Diego Association of Governments(SANDAG) San Diego CA VP 2,042.6 4 97,611.2 2
Pace - Suburban Bus Division(PACE) Arlington Heights IL VP 1,751.4 5 37,507.2 7
Utah Transit Authority(UTA) Salt Lake City UT VP 1,346.9 6 54,429.4 5Ben Franklin Transit(BFT) Richland WA VP 1,261.3 7 49,379.8 6Phoenix - VPSI, Inc. Glendale AZ VP 1,049.6 8 26,836.8 14Michigan Department of Transportation(MDOT) Lansing MI VP 954.1 9 35,942.6 9Dallas Area Rapid Transit(DART) Dallas TX VP 924.6 10 36,784.7 8New Jersey Transit Corporation(NJ TRANSIT) Newark NJ VP 856.8 11 34,094.4 10Orange County Transportation Authority(OCTA) Orange CA VP 848.7 12 30,208.6 11Snohomish County Public Transportation Benefit Area Corporation(Community Transit) Everett WA VP 843.6 13 22,755.2 17Pierce County Transportation Benefit Area Authority(Pierce Transit) Tacoma WA VP 825.3 14 27,273.2 13Marietta - VPSI, Inc. Marietta GA VP 822.9 15 23,041.4 16Greater Hartford Ridesharing Corporation - The Rideshare Company(GHRC) Bloomfield CT VP 819.3 16 29,264.0 12Honolulu - VPSI, Inc. Honolulu HI VP 740.8 17 15,377.5 21Intercity Transit(I.T.) Olympia WA VP 635.1 18 22,391.4 18Miami Lakes - VPSI, Inc. Miami Lakes FL VP 609.0 19 14,184.0 22Dallas - VPSI, Inc. Arlington TX VP 482.7 20 16,591.8 20Research Triangle Regional Public Transportation Authority(Triangle Transit)
Research Triangle Park NC VP 418.2 21 12,375.2 26
Kings County Area Public Transit Agency(KART) Hanford CA VP 403.6 22 20,612.6 19Greater Richmond Transit Company(GRTC Transit System) Richmond VA VP 364.4 23 25,035.6 15Georgia Regional Transportation Authority(GRTA) Atlanta GA VP 323.2 24 13,532.9 23Madison County Transit District(MCT) Granite City IL VP 309.3 25 12,110.6 27Des Moines Area Regional Transit Authority(DART) Des Moines IA VP 293.9 26 12,818.6 25Charlotte Area Transit System(CATS) Charlotte NC VP 271.6 27 13,159.4 24Kitsap Transit Bremerton WA VP 259.7 28 5,772.2 41Capital Metropolitan Transportation Authority(CMTA) Austin TX VP 258.3 29 6,117.8 36VPSI, Anchorage Anchorage AK VP 234.8 30 10,237.0 28Piedmont Authority for Regional Transportation(PART) Greensboro NC VP 233.7 31 9,309.6 29Spokane Transit Authority(STA) Spokane WA VP 208.5 32 5,095.2 43Southwestern Pennsylvania Commission(SPC) Pittsburgh PA VP 201.2 33 5,865.3 39Central Florida Regional Transportation Authority(LYNX) Orlando FL VP 189.6 34 6,159.7 35Metropolitan Council St. Paul MN VP 182.5 35 6,705.3 32
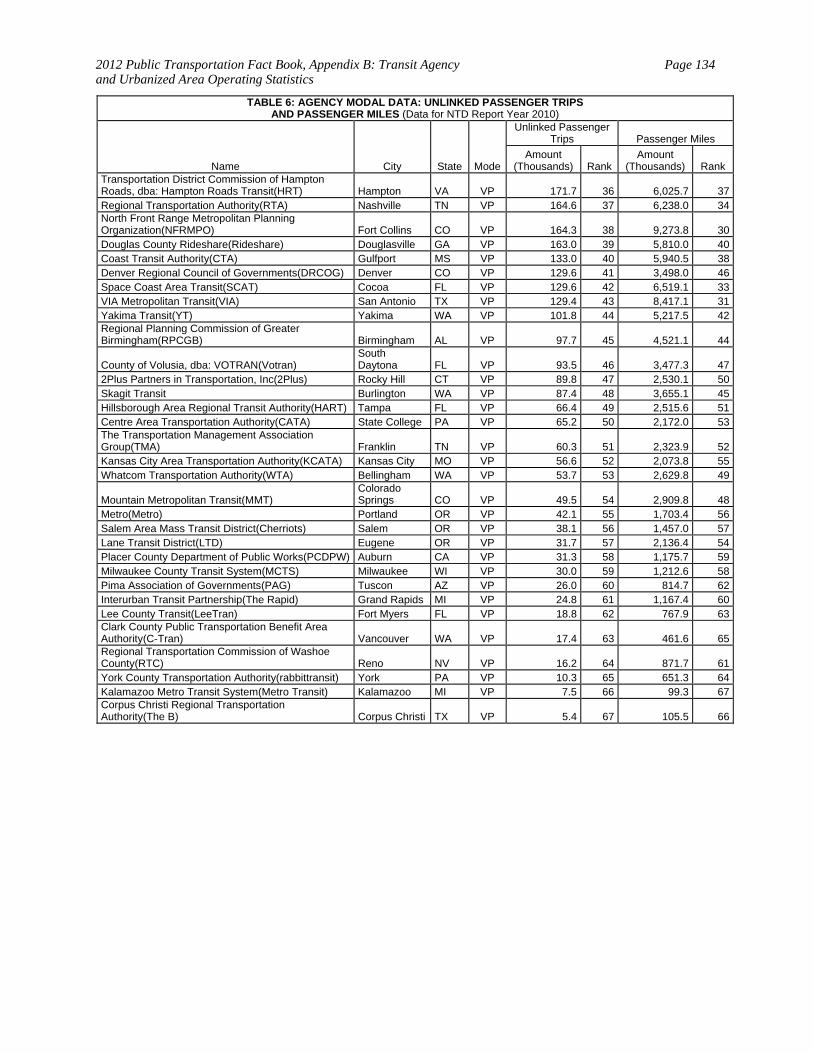
2012 Public Transportation Fact Book, Appendix B: Transit Agency and Urbanized Area Operating Statistics
Page 134
TABLE 6: AGENCY MODAL DATA: UNLINKED PASSENGER TRIPS AND PASSENGER MILES (Data for NTD Report Year 2010)
Name City State Mode
Unlinked Passenger Trips Passenger Miles
Amount (Thousands) Rank
Amount (Thousands) Rank
Transportation District Commission of Hampton Roads, dba: Hampton Roads Transit(HRT) Hampton VA VP 171.7 36 6,025.7 37Regional Transportation Authority(RTA) Nashville TN VP 164.6 37 6,238.0 34North Front Range Metropolitan Planning Organization(NFRMPO) Fort Collins CO VP 164.3 38 9,273.8 30Douglas County Rideshare(Rideshare) Douglasville GA VP 163.0 39 5,810.0 40Coast Transit Authority(CTA) Gulfport MS VP 133.0 40 5,940.5 38Denver Regional Council of Governments(DRCOG) Denver CO VP 129.6 41 3,498.0 46Space Coast Area Transit(SCAT) Cocoa FL VP 129.6 42 6,519.1 33VIA Metropolitan Transit(VIA) San Antonio TX VP 129.4 43 8,417.1 31Yakima Transit(YT) Yakima WA VP 101.8 44 5,217.5 42Regional Planning Commission of Greater Birmingham(RPCGB) Birmingham AL VP 97.7 45 4,521.1 44
County of Volusia, dba: VOTRAN(Votran) South Daytona FL VP 93.5 46 3,477.3 47
2Plus Partners in Transportation, Inc(2Plus) Rocky Hill CT VP 89.8 47 2,530.1 50Skagit Transit Burlington WA VP 87.4 48 3,655.1 45Hillsborough Area Regional Transit Authority(HART) Tampa FL VP 66.4 49 2,515.6 51Centre Area Transportation Authority(CATA) State College PA VP 65.2 50 2,172.0 53The Transportation Management Association Group(TMA) Franklin TN VP 60.3 51 2,323.9 52Kansas City Area Transportation Authority(KCATA) Kansas City MO VP 56.6 52 2,073.8 55Whatcom Transportation Authority(WTA) Bellingham WA VP 53.7 53 2,629.8 49
Mountain Metropolitan Transit(MMT) Colorado Springs CO VP 49.5 54 2,909.8 48
Metro(Metro) Portland OR VP 42.1 55 1,703.4 56Salem Area Mass Transit District(Cherriots) Salem OR VP 38.1 56 1,457.0 57Lane Transit District(LTD) Eugene OR VP 31.7 57 2,136.4 54Placer County Department of Public Works(PCDPW) Auburn CA VP 31.3 58 1,175.7 59Milwaukee County Transit System(MCTS) Milwaukee WI VP 30.0 59 1,212.6 58Pima Association of Governments(PAG) Tuscon AZ VP 26.0 60 814.7 62Interurban Transit Partnership(The Rapid) Grand Rapids MI VP 24.8 61 1,167.4 60Lee County Transit(LeeTran) Fort Myers FL VP 18.8 62 767.9 63Clark County Public Transportation Benefit Area Authority(C-Tran) Vancouver WA VP 17.4 63 461.6 65Regional Transportation Commission of Washoe County(RTC) Reno NV VP 16.2 64 871.7 61York County Transportation Authority(rabbittransit) York PA VP 10.3 65 651.3 64Kalamazoo Metro Transit System(Metro Transit) Kalamazoo MI VP 7.5 66 99.3 67Corpus Christi Regional Transportation Authority(The B) Corpus Christi TX VP 5.4 67 105.5 66
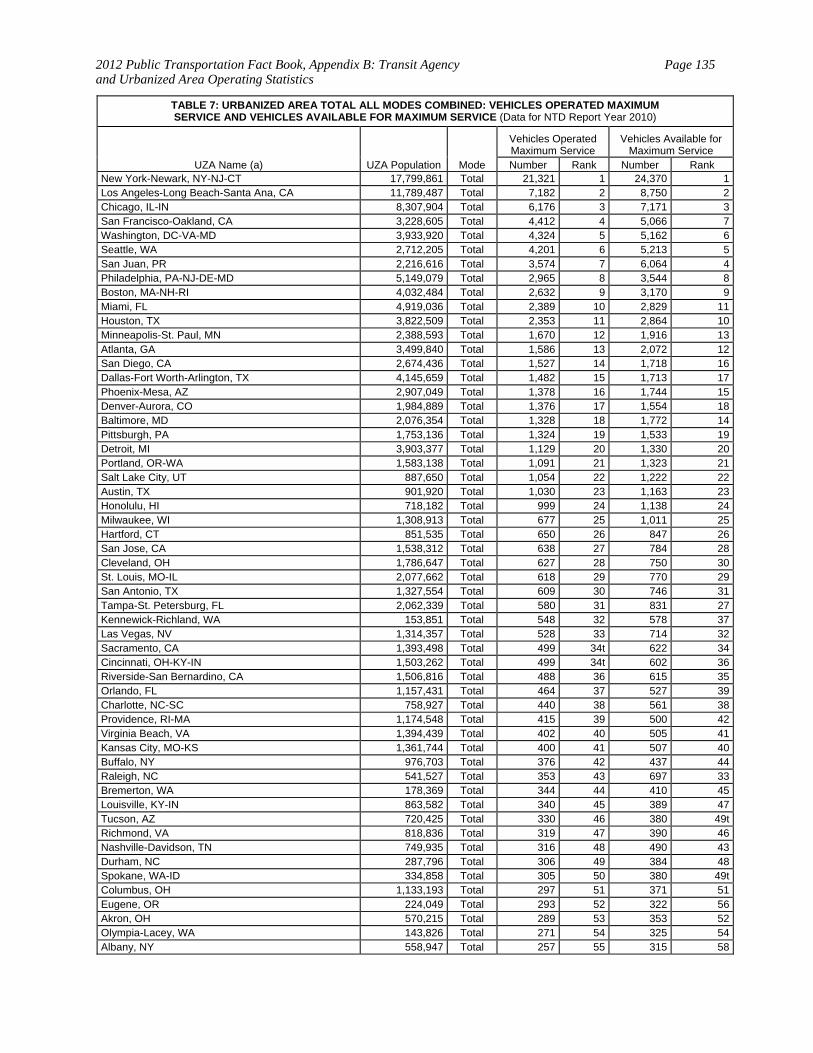
2012 Public Transportation Fact Book, Appendix B: Transit Agency and Urbanized Area Operating Statistics
Page 135
TABLE 7: URBANIZED AREA TOTAL ALL MODES COMBINED: VEHICLES OPERATED MAXIMUM SERVICE AND VEHICLES AVAILABLE FOR MAXIMUM SERVICE (Data for NTD Report Year 2010)
UZA Name (a) UZA Population Mode
Vehicles Operated Maximum Service
Vehicles Available for Maximum Service
Number Rank Number Rank New York-Newark, NY-NJ-CT 17,799,861 Total 21,321 1 24,370 1Los Angeles-Long Beach-Santa Ana, CA 11,789,487 Total 7,182 2 8,750 2Chicago, IL-IN 8,307,904 Total 6,176 3 7,171 3San Francisco-Oakland, CA 3,228,605 Total 4,412 4 5,066 7Washington, DC-VA-MD 3,933,920 Total 4,324 5 5,162 6Seattle, WA 2,712,205 Total 4,201 6 5,213 5San Juan, PR 2,216,616 Total 3,574 7 6,064 4Philadelphia, PA-NJ-DE-MD 5,149,079 Total 2,965 8 3,544 8Boston, MA-NH-RI 4,032,484 Total 2,632 9 3,170 9Miami, FL 4,919,036 Total 2,389 10 2,829 11Houston, TX 3,822,509 Total 2,353 11 2,864 10Minneapolis-St. Paul, MN 2,388,593 Total 1,670 12 1,916 13Atlanta, GA 3,499,840 Total 1,586 13 2,072 12San Diego, CA 2,674,436 Total 1,527 14 1,718 16Dallas-Fort Worth-Arlington, TX 4,145,659 Total 1,482 15 1,713 17Phoenix-Mesa, AZ 2,907,049 Total 1,378 16 1,744 15Denver-Aurora, CO 1,984,889 Total 1,376 17 1,554 18Baltimore, MD 2,076,354 Total 1,328 18 1,772 14Pittsburgh, PA 1,753,136 Total 1,324 19 1,533 19Detroit, MI 3,903,377 Total 1,129 20 1,330 20Portland, OR-WA 1,583,138 Total 1,091 21 1,323 21Salt Lake City, UT 887,650 Total 1,054 22 1,222 22Austin, TX 901,920 Total 1,030 23 1,163 23Honolulu, HI 718,182 Total 999 24 1,138 24Milwaukee, WI 1,308,913 Total 677 25 1,011 25Hartford, CT 851,535 Total 650 26 847 26San Jose, CA 1,538,312 Total 638 27 784 28Cleveland, OH 1,786,647 Total 627 28 750 30St. Louis, MO-IL 2,077,662 Total 618 29 770 29San Antonio, TX 1,327,554 Total 609 30 746 31Tampa-St. Petersburg, FL 2,062,339 Total 580 31 831 27Kennewick-Richland, WA 153,851 Total 548 32 578 37Las Vegas, NV 1,314,357 Total 528 33 714 32Sacramento, CA 1,393,498 Total 499 34t 622 34Cincinnati, OH-KY-IN 1,503,262 Total 499 34t 602 36Riverside-San Bernardino, CA 1,506,816 Total 488 36 615 35Orlando, FL 1,157,431 Total 464 37 527 39Charlotte, NC-SC 758,927 Total 440 38 561 38Providence, RI-MA 1,174,548 Total 415 39 500 42Virginia Beach, VA 1,394,439 Total 402 40 505 41Kansas City, MO-KS 1,361,744 Total 400 41 507 40Buffalo, NY 976,703 Total 376 42 437 44Raleigh, NC 541,527 Total 353 43 697 33Bremerton, WA 178,369 Total 344 44 410 45Louisville, KY-IN 863,582 Total 340 45 389 47Tucson, AZ 720,425 Total 330 46 380 49tRichmond, VA 818,836 Total 319 47 390 46Nashville-Davidson, TN 749,935 Total 316 48 490 43Durham, NC 287,796 Total 306 49 384 48Spokane, WA-ID 334,858 Total 305 50 380 49tColumbus, OH 1,133,193 Total 297 51 371 51Eugene, OR 224,049 Total 293 52 322 56Akron, OH 570,215 Total 289 53 353 52Olympia-Lacey, WA 143,826 Total 271 54 325 54Albany, NY 558,947 Total 257 55 315 58
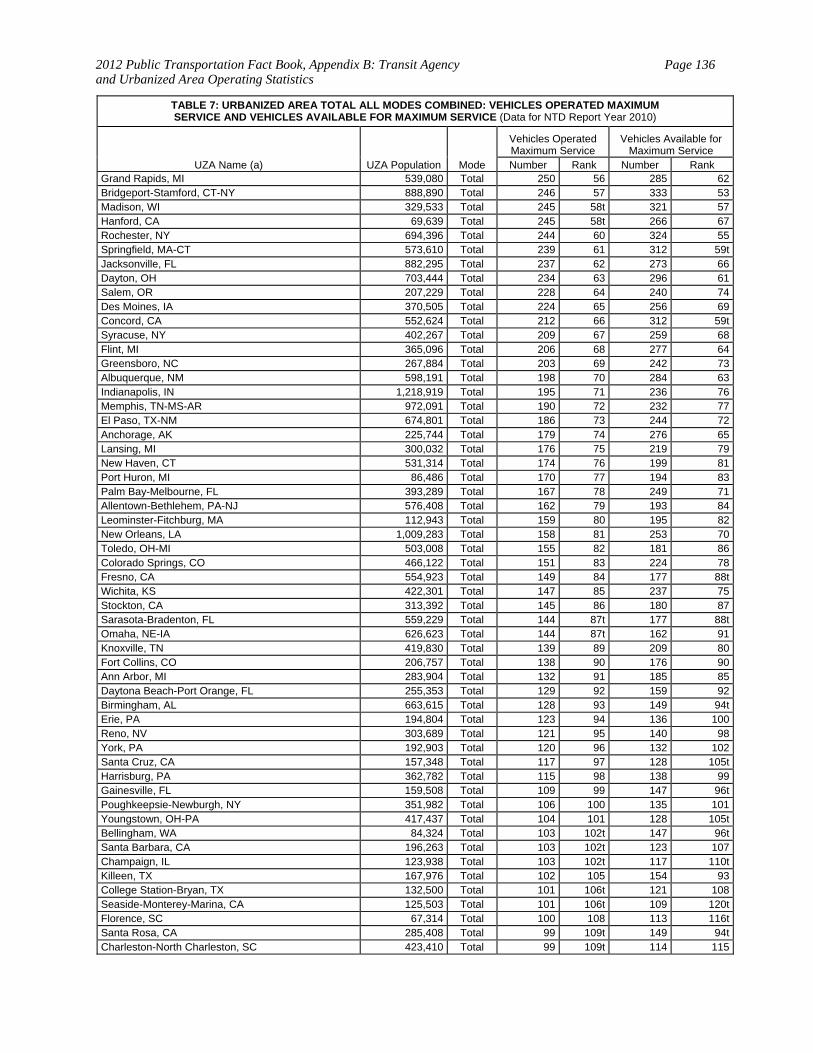
2012 Public Transportation Fact Book, Appendix B: Transit Agency and Urbanized Area Operating Statistics
Page 136
TABLE 7: URBANIZED AREA TOTAL ALL MODES COMBINED: VEHICLES OPERATED MAXIMUM SERVICE AND VEHICLES AVAILABLE FOR MAXIMUM SERVICE (Data for NTD Report Year 2010)
UZA Name (a) UZA Population Mode
Vehicles Operated Maximum Service
Vehicles Available for Maximum Service
Number Rank Number Rank Grand Rapids, MI 539,080 Total 250 56 285 62Bridgeport-Stamford, CT-NY 888,890 Total 246 57 333 53Madison, WI 329,533 Total 245 58t 321 57Hanford, CA 69,639 Total 245 58t 266 67Rochester, NY 694,396 Total 244 60 324 55Springfield, MA-CT 573,610 Total 239 61 312 59tJacksonville, FL 882,295 Total 237 62 273 66Dayton, OH 703,444 Total 234 63 296 61Salem, OR 207,229 Total 228 64 240 74Des Moines, IA 370,505 Total 224 65 256 69Concord, CA 552,624 Total 212 66 312 59tSyracuse, NY 402,267 Total 209 67 259 68Flint, MI 365,096 Total 206 68 277 64Greensboro, NC 267,884 Total 203 69 242 73Albuquerque, NM 598,191 Total 198 70 284 63Indianapolis, IN 1,218,919 Total 195 71 236 76Memphis, TN-MS-AR 972,091 Total 190 72 232 77El Paso, TX-NM 674,801 Total 186 73 244 72Anchorage, AK 225,744 Total 179 74 276 65Lansing, MI 300,032 Total 176 75 219 79New Haven, CT 531,314 Total 174 76 199 81Port Huron, MI 86,486 Total 170 77 194 83Palm Bay-Melbourne, FL 393,289 Total 167 78 249 71Allentown-Bethlehem, PA-NJ 576,408 Total 162 79 193 84Leominster-Fitchburg, MA 112,943 Total 159 80 195 82New Orleans, LA 1,009,283 Total 158 81 253 70Toledo, OH-MI 503,008 Total 155 82 181 86Colorado Springs, CO 466,122 Total 151 83 224 78Fresno, CA 554,923 Total 149 84 177 88tWichita, KS 422,301 Total 147 85 237 75Stockton, CA 313,392 Total 145 86 180 87Sarasota-Bradenton, FL 559,229 Total 144 87t 177 88tOmaha, NE-IA 626,623 Total 144 87t 162 91Knoxville, TN 419,830 Total 139 89 209 80Fort Collins, CO 206,757 Total 138 90 176 90Ann Arbor, MI 283,904 Total 132 91 185 85Daytona Beach-Port Orange, FL 255,353 Total 129 92 159 92Birmingham, AL 663,615 Total 128 93 149 94tErie, PA 194,804 Total 123 94 136 100Reno, NV 303,689 Total 121 95 140 98York, PA 192,903 Total 120 96 132 102Santa Cruz, CA 157,348 Total 117 97 128 105tHarrisburg, PA 362,782 Total 115 98 138 99Gainesville, FL 159,508 Total 109 99 147 96tPoughkeepsie-Newburgh, NY 351,982 Total 106 100 135 101Youngstown, OH-PA 417,437 Total 104 101 128 105tBellingham, WA 84,324 Total 103 102t 147 96tSanta Barbara, CA 196,263 Total 103 102t 123 107Champaign, IL 123,938 Total 103 102t 117 110tKilleen, TX 167,976 Total 102 105 154 93College Station-Bryan, TX 132,500 Total 101 106t 121 108Seaside-Monterey-Marina, CA 125,503 Total 101 106t 109 120tFlorence, SC 67,314 Total 100 108 113 116tSanta Rosa, CA 285,408 Total 99 109t 149 94tCharleston-North Charleston, SC 423,410 Total 99 109t 114 115
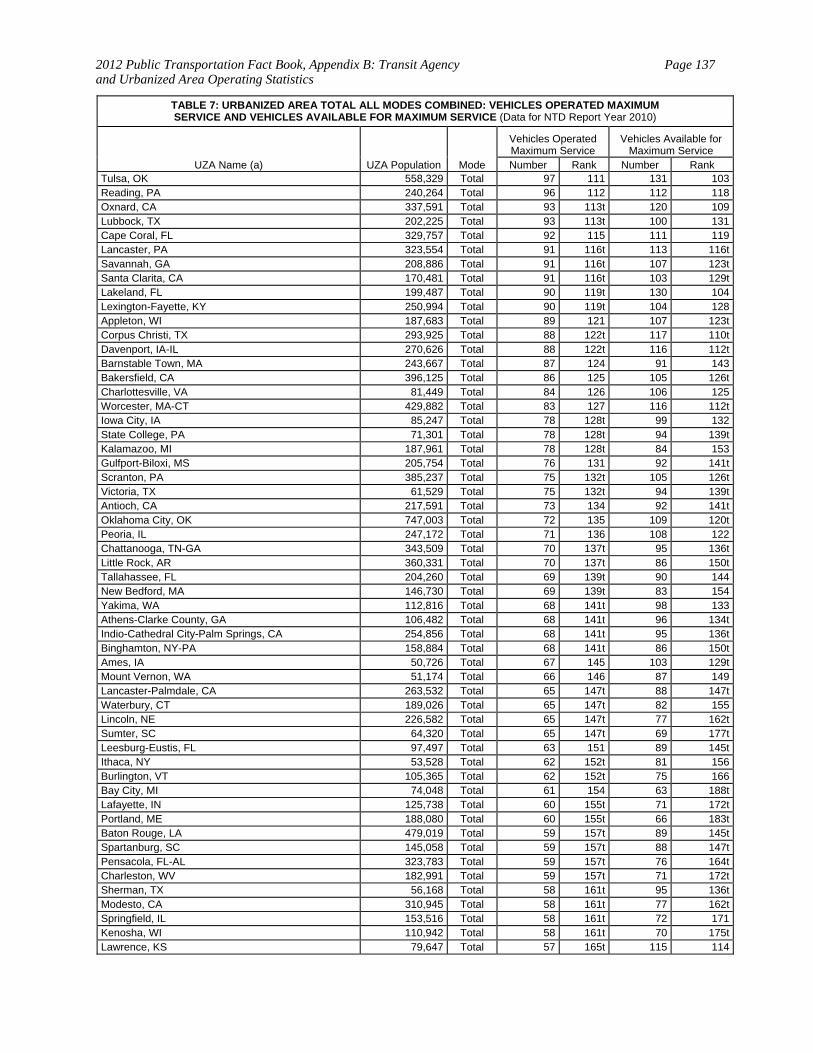
2012 Public Transportation Fact Book, Appendix B: Transit Agency and Urbanized Area Operating Statistics
Page 137
TABLE 7: URBANIZED AREA TOTAL ALL MODES COMBINED: VEHICLES OPERATED MAXIMUM SERVICE AND VEHICLES AVAILABLE FOR MAXIMUM SERVICE (Data for NTD Report Year 2010)
UZA Name (a) UZA Population Mode
Vehicles Operated Maximum Service
Vehicles Available for Maximum Service
Number Rank Number Rank Tulsa, OK 558,329 Total 97 111 131 103Reading, PA 240,264 Total 96 112 112 118Oxnard, CA 337,591 Total 93 113t 120 109Lubbock, TX 202,225 Total 93 113t 100 131Cape Coral, FL 329,757 Total 92 115 111 119Lancaster, PA 323,554 Total 91 116t 113 116tSavannah, GA 208,886 Total 91 116t 107 123tSanta Clarita, CA 170,481 Total 91 116t 103 129tLakeland, FL 199,487 Total 90 119t 130 104Lexington-Fayette, KY 250,994 Total 90 119t 104 128Appleton, WI 187,683 Total 89 121 107 123tCorpus Christi, TX 293,925 Total 88 122t 117 110tDavenport, IA-IL 270,626 Total 88 122t 116 112tBarnstable Town, MA 243,667 Total 87 124 91 143Bakersfield, CA 396,125 Total 86 125 105 126tCharlottesville, VA 81,449 Total 84 126 106 125Worcester, MA-CT 429,882 Total 83 127 116 112tIowa City, IA 85,247 Total 78 128t 99 132State College, PA 71,301 Total 78 128t 94 139tKalamazoo, MI 187,961 Total 78 128t 84 153Gulfport-Biloxi, MS 205,754 Total 76 131 92 141tScranton, PA 385,237 Total 75 132t 105 126tVictoria, TX 61,529 Total 75 132t 94 139tAntioch, CA 217,591 Total 73 134 92 141tOklahoma City, OK 747,003 Total 72 135 109 120tPeoria, IL 247,172 Total 71 136 108 122Chattanooga, TN-GA 343,509 Total 70 137t 95 136tLittle Rock, AR 360,331 Total 70 137t 86 150tTallahassee, FL 204,260 Total 69 139t 90 144New Bedford, MA 146,730 Total 69 139t 83 154Yakima, WA 112,816 Total 68 141t 98 133Athens-Clarke County, GA 106,482 Total 68 141t 96 134tIndio-Cathedral City-Palm Springs, CA 254,856 Total 68 141t 95 136tBinghamton, NY-PA 158,884 Total 68 141t 86 150tAmes, IA 50,726 Total 67 145 103 129tMount Vernon, WA 51,174 Total 66 146 87 149Lancaster-Palmdale, CA 263,532 Total 65 147t 88 147tWaterbury, CT 189,026 Total 65 147t 82 155Lincoln, NE 226,582 Total 65 147t 77 162tSumter, SC 64,320 Total 65 147t 69 177tLeesburg-Eustis, FL 97,497 Total 63 151 89 145tIthaca, NY 53,528 Total 62 152t 81 156Burlington, VT 105,365 Total 62 152t 75 166Bay City, MI 74,048 Total 61 154 63 188tLafayette, IN 125,738 Total 60 155t 71 172tPortland, ME 188,080 Total 60 155t 66 183tBaton Rouge, LA 479,019 Total 59 157t 89 145tSpartanburg, SC 145,058 Total 59 157t 88 147tPensacola, FL-AL 323,783 Total 59 157t 76 164tCharleston, WV 182,991 Total 59 157t 71 172tSherman, TX 56,168 Total 58 161t 95 136tModesto, CA 310,945 Total 58 161t 77 162tSpringfield, IL 153,516 Total 58 161t 72 171Kenosha, WI 110,942 Total 58 161t 70 175tLawrence, KS 79,647 Total 57 165t 115 114
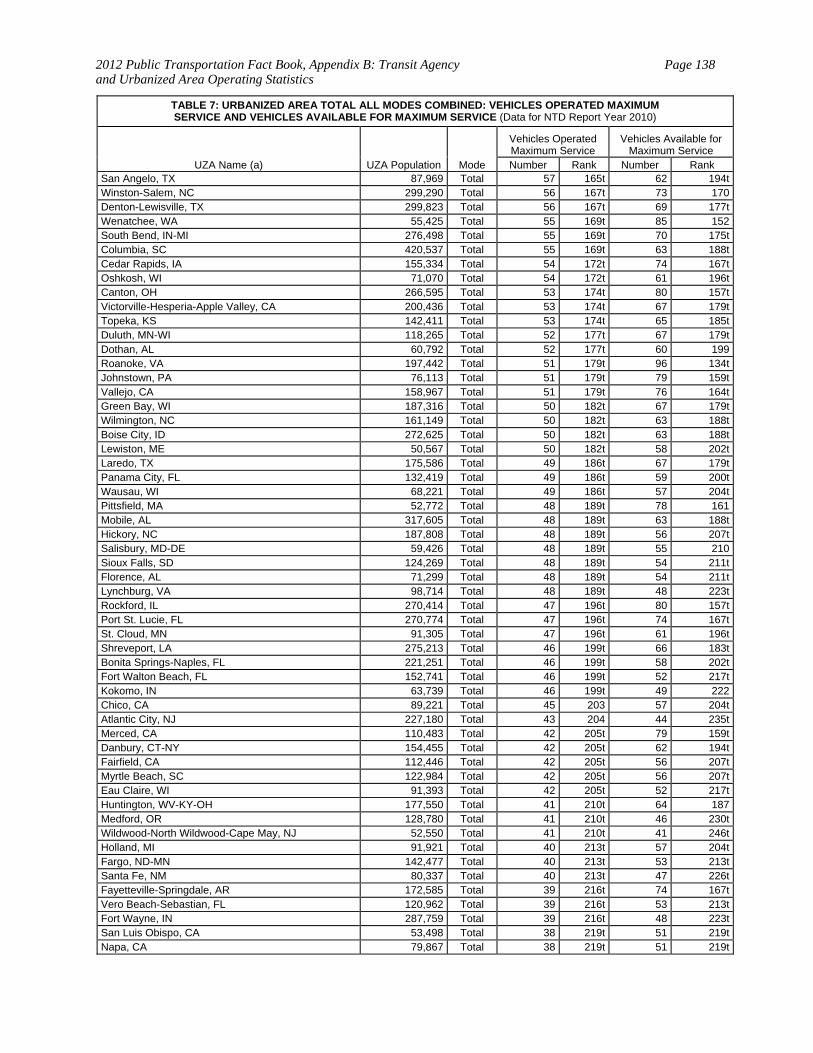
2012 Public Transportation Fact Book, Appendix B: Transit Agency and Urbanized Area Operating Statistics
Page 138
TABLE 7: URBANIZED AREA TOTAL ALL MODES COMBINED: VEHICLES OPERATED MAXIMUM SERVICE AND VEHICLES AVAILABLE FOR MAXIMUM SERVICE (Data for NTD Report Year 2010)
UZA Name (a) UZA Population Mode
Vehicles Operated Maximum Service
Vehicles Available for Maximum Service
Number Rank Number Rank San Angelo, TX 87,969 Total 57 165t 62 194tWinston-Salem, NC 299,290 Total 56 167t 73 170Denton-Lewisville, TX 299,823 Total 56 167t 69 177tWenatchee, WA 55,425 Total 55 169t 85 152South Bend, IN-MI 276,498 Total 55 169t 70 175tColumbia, SC 420,537 Total 55 169t 63 188tCedar Rapids, IA 155,334 Total 54 172t 74 167tOshkosh, WI 71,070 Total 54 172t 61 196tCanton, OH 266,595 Total 53 174t 80 157tVictorville-Hesperia-Apple Valley, CA 200,436 Total 53 174t 67 179tTopeka, KS 142,411 Total 53 174t 65 185tDuluth, MN-WI 118,265 Total 52 177t 67 179tDothan, AL 60,792 Total 52 177t 60 199Roanoke, VA 197,442 Total 51 179t 96 134tJohnstown, PA 76,113 Total 51 179t 79 159tVallejo, CA 158,967 Total 51 179t 76 164tGreen Bay, WI 187,316 Total 50 182t 67 179tWilmington, NC 161,149 Total 50 182t 63 188tBoise City, ID 272,625 Total 50 182t 63 188tLewiston, ME 50,567 Total 50 182t 58 202tLaredo, TX 175,586 Total 49 186t 67 179tPanama City, FL 132,419 Total 49 186t 59 200tWausau, WI 68,221 Total 49 186t 57 204tPittsfield, MA 52,772 Total 48 189t 78 161Mobile, AL 317,605 Total 48 189t 63 188tHickory, NC 187,808 Total 48 189t 56 207tSalisbury, MD-DE 59,426 Total 48 189t 55 210Sioux Falls, SD 124,269 Total 48 189t 54 211tFlorence, AL 71,299 Total 48 189t 54 211tLynchburg, VA 98,714 Total 48 189t 48 223tRockford, IL 270,414 Total 47 196t 80 157tPort St. Lucie, FL 270,774 Total 47 196t 74 167tSt. Cloud, MN 91,305 Total 47 196t 61 196tShreveport, LA 275,213 Total 46 199t 66 183tBonita Springs-Naples, FL 221,251 Total 46 199t 58 202tFort Walton Beach, FL 152,741 Total 46 199t 52 217tKokomo, IN 63,739 Total 46 199t 49 222Chico, CA 89,221 Total 45 203 57 204tAtlantic City, NJ 227,180 Total 43 204 44 235tMerced, CA 110,483 Total 42 205t 79 159tDanbury, CT-NY 154,455 Total 42 205t 62 194tFairfield, CA 112,446 Total 42 205t 56 207tMyrtle Beach, SC 122,984 Total 42 205t 56 207tEau Claire, WI 91,393 Total 42 205t 52 217tHuntington, WV-KY-OH 177,550 Total 41 210t 64 187Medford, OR 128,780 Total 41 210t 46 230tWildwood-North Wildwood-Cape May, NJ 52,550 Total 41 210t 41 246tHolland, MI 91,921 Total 40 213t 57 204tFargo, ND-MN 142,477 Total 40 213t 53 213tSanta Fe, NM 80,337 Total 40 213t 47 226tFayetteville-Springdale, AR 172,585 Total 39 216t 74 167tVero Beach-Sebastian, FL 120,962 Total 39 216t 53 213tFort Wayne, IN 287,759 Total 39 216t 48 223tSan Luis Obispo, CA 53,498 Total 38 219t 51 219tNapa, CA 79,867 Total 38 219t 51 219t
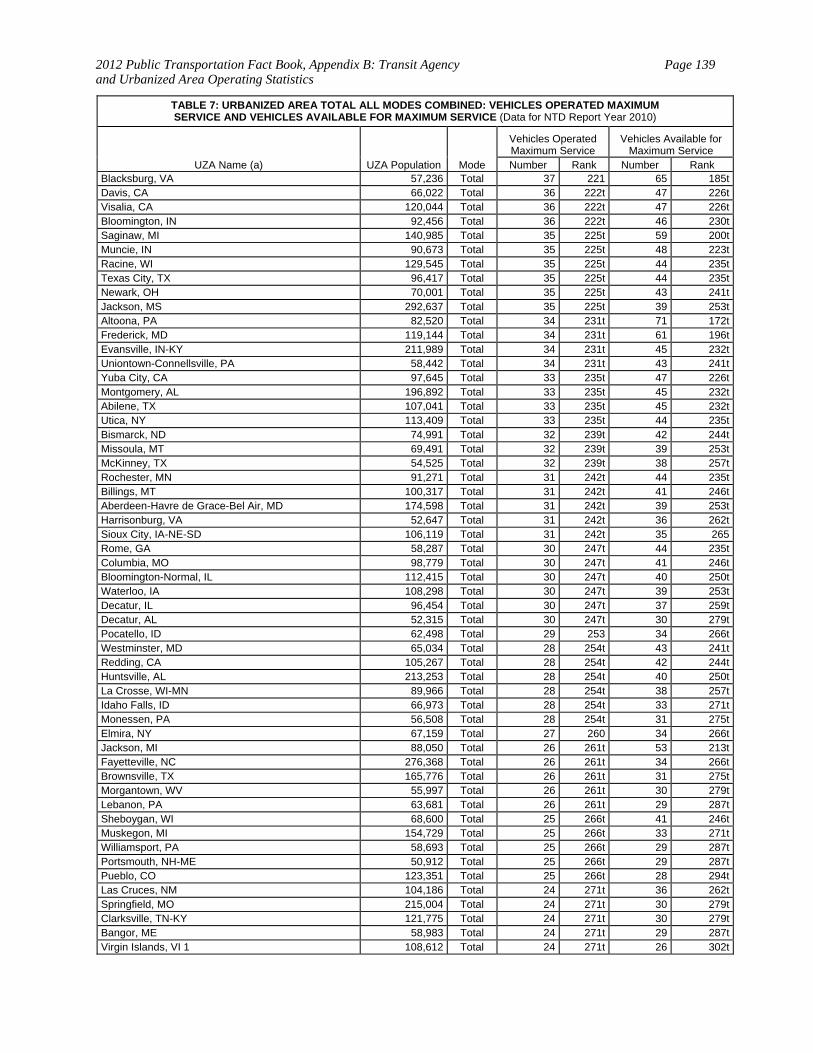
2012 Public Transportation Fact Book, Appendix B: Transit Agency and Urbanized Area Operating Statistics
Page 139
TABLE 7: URBANIZED AREA TOTAL ALL MODES COMBINED: VEHICLES OPERATED MAXIMUM SERVICE AND VEHICLES AVAILABLE FOR MAXIMUM SERVICE (Data for NTD Report Year 2010)
UZA Name (a) UZA Population Mode
Vehicles Operated Maximum Service
Vehicles Available for Maximum Service
Number Rank Number Rank Blacksburg, VA 57,236 Total 37 221 65 185tDavis, CA 66,022 Total 36 222t 47 226tVisalia, CA 120,044 Total 36 222t 47 226tBloomington, IN 92,456 Total 36 222t 46 230tSaginaw, MI 140,985 Total 35 225t 59 200tMuncie, IN 90,673 Total 35 225t 48 223tRacine, WI 129,545 Total 35 225t 44 235tTexas City, TX 96,417 Total 35 225t 44 235tNewark, OH 70,001 Total 35 225t 43 241tJackson, MS 292,637 Total 35 225t 39 253tAltoona, PA 82,520 Total 34 231t 71 172tFrederick, MD 119,144 Total 34 231t 61 196tEvansville, IN-KY 211,989 Total 34 231t 45 232tUniontown-Connellsville, PA 58,442 Total 34 231t 43 241tYuba City, CA 97,645 Total 33 235t 47 226tMontgomery, AL 196,892 Total 33 235t 45 232tAbilene, TX 107,041 Total 33 235t 45 232tUtica, NY 113,409 Total 33 235t 44 235tBismarck, ND 74,991 Total 32 239t 42 244tMissoula, MT 69,491 Total 32 239t 39 253tMcKinney, TX 54,525 Total 32 239t 38 257tRochester, MN 91,271 Total 31 242t 44 235tBillings, MT 100,317 Total 31 242t 41 246tAberdeen-Havre de Grace-Bel Air, MD 174,598 Total 31 242t 39 253tHarrisonburg, VA 52,647 Total 31 242t 36 262tSioux City, IA-NE-SD 106,119 Total 31 242t 35 265Rome, GA 58,287 Total 30 247t 44 235tColumbia, MO 98,779 Total 30 247t 41 246tBloomington-Normal, IL 112,415 Total 30 247t 40 250tWaterloo, IA 108,298 Total 30 247t 39 253tDecatur, IL 96,454 Total 30 247t 37 259tDecatur, AL 52,315 Total 30 247t 30 279tPocatello, ID 62,498 Total 29 253 34 266tWestminster, MD 65,034 Total 28 254t 43 241tRedding, CA 105,267 Total 28 254t 42 244tHuntsville, AL 213,253 Total 28 254t 40 250tLa Crosse, WI-MN 89,966 Total 28 254t 38 257tIdaho Falls, ID 66,973 Total 28 254t 33 271tMonessen, PA 56,508 Total 28 254t 31 275tElmira, NY 67,159 Total 27 260 34 266tJackson, MI 88,050 Total 26 261t 53 213tFayetteville, NC 276,368 Total 26 261t 34 266tBrownsville, TX 165,776 Total 26 261t 31 275tMorgantown, WV 55,997 Total 26 261t 30 279tLebanon, PA 63,681 Total 26 261t 29 287tSheboygan, WI 68,600 Total 25 266t 41 246tMuskegon, MI 154,729 Total 25 266t 33 271tWilliamsport, PA 58,693 Total 25 266t 29 287tPortsmouth, NH-ME 50,912 Total 25 266t 29 287tPueblo, CO 123,351 Total 25 266t 28 294tLas Cruces, NM 104,186 Total 24 271t 36 262tSpringfield, MO 215,004 Total 24 271t 30 279tClarksville, TN-KY 121,775 Total 24 271t 30 279tBangor, ME 58,983 Total 24 271t 29 287tVirgin Islands, VI 1 108,612 Total 24 271t 26 302t

2012 Public Transportation Fact Book, Appendix B: Transit Agency and Urbanized Area Operating Statistics
Page 140
TABLE 7: URBANIZED AREA TOTAL ALL MODES COMBINED: VEHICLES OPERATED MAXIMUM SERVICE AND VEHICLES AVAILABLE FOR MAXIMUM SERVICE (Data for NTD Report Year 2010)
UZA Name (a) UZA Population Mode
Vehicles Operated Maximum Service
Vehicles Available for Maximum Service
Number Rank Number Rank Waco, TX 153,198 Total 23 276t 53 213tJohnson City, TN 102,456 Total 23 276t 40 250tSt. Charles, MD 74,765 Total 23 276t 37 259tNorman, OK 86,478 Total 23 276t 31 275tAsheville, NC 221,570 Total 22 280t 63 188tColumbus, GA-AL 242,324 Total 22 280t 37 259tLafayette, LA 178,079 Total 22 280t 32 274Norwich-New London, CT 173,160 Total 22 280t 31 275tFredericksburg, VA 97,102 Total 22 280t 30 279tMacon, GA 135,170 Total 22 280t 27 298tDeKalb, IL 55,805 Total 22 280t 25 307tLogan, UT 76,187 Total 21 287t 34 266tSanta Maria, CA 120,297 Total 21 287t 29 287tEl Centro, CA 52,954 Total 21 287t 28 294tBenton Harbor-St. Joseph, MI 61,745 Total 21 287t 25 307tMurfreesboro, TN 135,855 Total 21 287t 24 312tElkhart, IN-MI 131,226 Total 20 292t 33 271tJefferson City, MO 53,714 Total 20 292t 28 294tSimi Valley, CA 112,345 Total 20 292t 26 302tDubuque, IA-IL 65,251 Total 20 292t 25 307tSouth Lyon-Howell-Brighton, MI 106,139 Total 20 292t 24 312tMcAllen, TX 523,144 Total 19 297t 50 221Dover-Rochester, NH-ME 80,456 Total 19 297t 36 262tGreat Falls, MT 64,387 Total 19 297t 34 266tAugusta-Richmond County, GA-SC 335,630 Total 19 297t 30 279tYuma, AZ-CA 94,950 Total 19 297t 30 279tRapid City, SD 66,780 Total 19 297t 29 287tFlagstaff, AZ 57,050 Total 19 297t 25 307tThousand Oaks, CA 210,990 Total 19 297t 24 312tGrand Forks, ND-MN 56,573 Total 19 297t 23 320tAmarillo, TX 179,312 Total 18 306t 30 279tLodi, CA 83,735 Total 18 306t 29 287tBrooksville, FL 102,193 Total 18 306t 28 294tMonroe, LA 113,818 Total 18 306t 27 298tOdessa, TX 111,395 Total 18 306t 27 298tHigh Point, NC 132,844 Total 18 306t 24 312tWheeling, WV-OH 87,613 Total 18 306t 23 320tBend, OR 57,525 Total 18 306t 23 320tFond du Lac, WI 50,058 Total 18 306t 21 329tBeaumont, TX 139,304 Total 17 315t 27 298tManchester, NH 143,549 Total 17 315t 20 338tSt. Joseph, MO-KS 77,231 Total 17 315t 20 338tGrand Junction, CO 92,362 Total 16 318t 26 302tBowling Green, KY 58,314 Total 16 318t 26 302tGreeley, CO 93,879 Total 16 318t 24 312tCheyenne, WY 68,202 Total 16 318t 24 312tGreenville, SC 302,194 Total 16 318t 23 320tGainesville, GA 88,680 Total 16 318t 21 329tLongview, WA-OR 60,443 Total 16 318t 19 341tJanesville, WI 66,034 Total 15 325t 24 312tAuburn, AL 60,137 Total 15 325t 24 312tLawton, OK 89,556 Total 15 325t 23 320tCumberland, MD--WV 52,115 Total 15 325t 22 326tBattle Creek, MI 79,135 Total 15 325t 21 329tNashua, NH-MA 197,155 Total 15 325t 17 346t
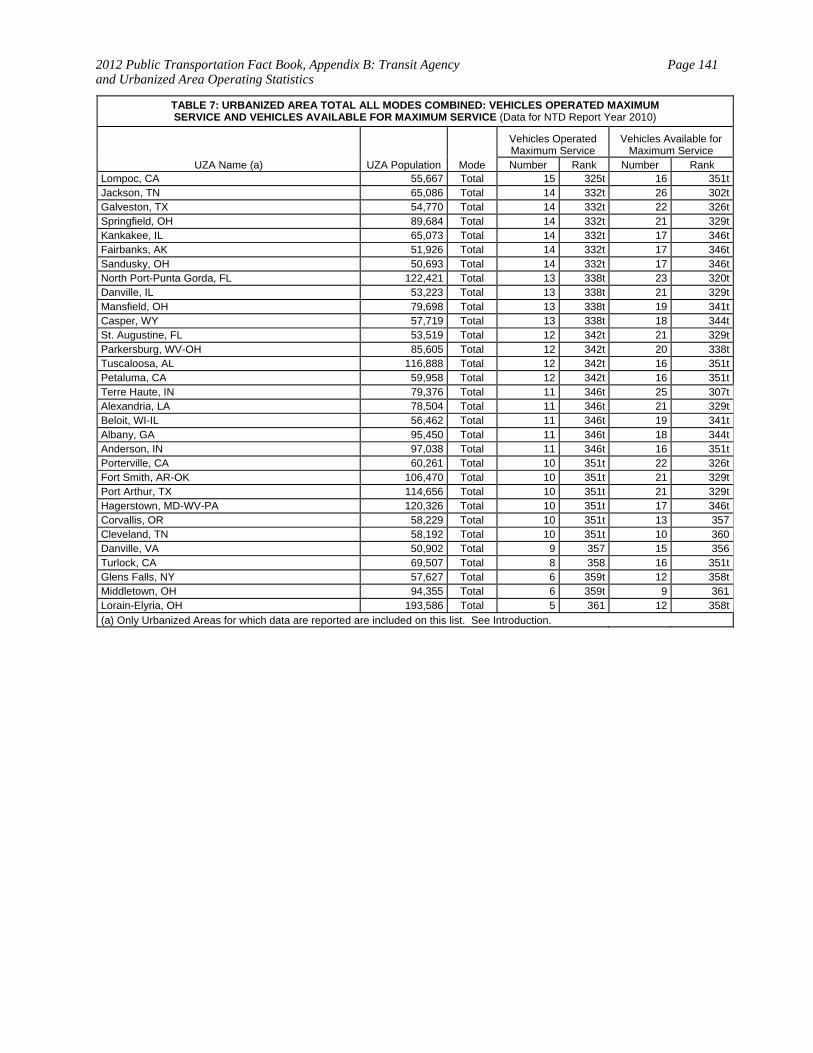
2012 Public Transportation Fact Book, Appendix B: Transit Agency and Urbanized Area Operating Statistics
Page 141
TABLE 7: URBANIZED AREA TOTAL ALL MODES COMBINED: VEHICLES OPERATED MAXIMUM SERVICE AND VEHICLES AVAILABLE FOR MAXIMUM SERVICE (Data for NTD Report Year 2010)
UZA Name (a) UZA Population Mode
Vehicles Operated Maximum Service
Vehicles Available for Maximum Service
Number Rank Number Rank Lompoc, CA 55,667 Total 15 325t 16 351tJackson, TN 65,086 Total 14 332t 26 302tGalveston, TX 54,770 Total 14 332t 22 326tSpringfield, OH 89,684 Total 14 332t 21 329tKankakee, IL 65,073 Total 14 332t 17 346tFairbanks, AK 51,926 Total 14 332t 17 346tSandusky, OH 50,693 Total 14 332t 17 346tNorth Port-Punta Gorda, FL 122,421 Total 13 338t 23 320tDanville, IL 53,223 Total 13 338t 21 329tMansfield, OH 79,698 Total 13 338t 19 341tCasper, WY 57,719 Total 13 338t 18 344tSt. Augustine, FL 53,519 Total 12 342t 21 329tParkersburg, WV-OH 85,605 Total 12 342t 20 338tTuscaloosa, AL 116,888 Total 12 342t 16 351tPetaluma, CA 59,958 Total 12 342t 16 351tTerre Haute, IN 79,376 Total 11 346t 25 307tAlexandria, LA 78,504 Total 11 346t 21 329tBeloit, WI-IL 56,462 Total 11 346t 19 341tAlbany, GA 95,450 Total 11 346t 18 344tAnderson, IN 97,038 Total 11 346t 16 351tPorterville, CA 60,261 Total 10 351t 22 326tFort Smith, AR-OK 106,470 Total 10 351t 21 329tPort Arthur, TX 114,656 Total 10 351t 21 329tHagerstown, MD-WV-PA 120,326 Total 10 351t 17 346tCorvallis, OR 58,229 Total 10 351t 13 357Cleveland, TN 58,192 Total 10 351t 10 360Danville, VA 50,902 Total 9 357 15 356Turlock, CA 69,507 Total 8 358 16 351tGlens Falls, NY 57,627 Total 6 359t 12 358tMiddletown, OH 94,355 Total 6 359t 9 361Lorain-Elyria, OH 193,586 Total 5 361 12 358t
(a) Only Urbanized Areas for which data are reported are included on this list. See Introduction.

2012 Public Transportation Fact Book, Appendix B: Transit Agency and Urbanized Area Operating Statistics
Page 142
TABLE 8: URBANIZED AREA TOTAL ALL MODES COMBINED: ANNUAL VEHCILE REVENUE MILESAND ANNUAL VEHICLE REVENEUE HOURS (Data for NTD Report Year 2010)
UZA Name (a) UZA Population Mode
Annual Vehicle Revenue Miles
Annual Vehicle Revenue Hours
Number (Thousands) Rank
Number (Thousands) Rank
New York-Newark, NY-NJ-CT 17,799,861 Total 924,589.3 1 58,452.6 1 Los Angeles-Long Beach-Santa Ana, CA 11,789,487 Total 253,407.7 2 17,658.3 2 Chicago, IL-IN 8,307,904 Total 231,536.7 3 14,957.4 3 Washington, DC-VA-MD 3,933,920 Total 164,848.6 4 10,974.0 4 San Francisco-Oakland, CA 3,228,605 Total 145,795.8 5 9,168.4 5 Philadelphia, PA-NJ-DE-MD 5,149,079 Total 111,710.6 6 8,066.1 6 Seattle, WA 2,712,205 Total 105,198.0 7 6,757.1 8 Boston, MA-NH-RI 4,032,484 Total 104,312.4 8 7,076.7 7 Miami, FL 4,919,036 Total 95,808.8 9 6,609.3 9 Atlanta, GA 3,499,840 Total 72,832.1 10 4,028.8 12 Houston, TX 3,822,509 Total 68,334.0 11 4,137.9 10 Dallas-Fort Worth-Arlington, TX 4,145,659 Total 57,142.9 12 3,605.3 14 Denver-Aurora, CO 1,984,889 Total 56,971.7 13 3,843.3 13 San Diego, CA 2,674,436 Total 52,806.6 14 3,149.3 19 Baltimore, MD 2,076,354 Total 49,094.7 15 3,385.1 17 Minneapolis-St. Paul, MN 2,388,593 Total 48,106.9 16 3,411.9 16 Phoenix-Mesa, AZ 2,907,049 Total 47,121.8 17 3,421.0 15 Portland, OR-WA 1,583,138 Total 43,333.3 18 3,263.5 18 San Juan, PR 2,216,616 Total 42,659.1 19 4,091.6 11 Pittsburgh, PA 1,753,136 Total 39,993.5 20 2,756.1 20 Detroit, MI 3,903,377 Total 36,695.8 21 2,203.3 21 St. Louis, MO-IL 2,077,662 Total 32,551.5 22 1,976.8 23 Salt Lake City, UT 887,650 Total 31,867.1 23 1,577.2 29 San Antonio, TX 1,327,554 Total 30,332.2 24 2,008.3 22 Honolulu, HI 718,182 Total 28,130.1 25 1,877.4 25 San Jose, CA 1,538,312 Total 25,152.5 26 1,799.0 27 Las Vegas, NV 1,314,357 Total 24,932.8 27 1,975.9 24 Milwaukee, WI 1,308,913 Total 24,584.9 28 1,835.1 26 Orlando, FL 1,157,431 Total 23,192.6 29 1,524.3 30 Tampa-St. Petersburg, FL 2,062,339 Total 22,579.9 30 1,514.7 31 Riverside-San Bernardino, CA 1,506,816 Total 22,482.7 31 1,507.3 32 Cleveland, OH 1,786,647 Total 22,376.3 32 1,652.2 28 Sacramento, CA 1,393,498 Total 19,624.2 33 1,317.1 34 Austin, TX 901,920 Total 18,834.0 34 1,376.4 33 Hartford, CT 851,535 Total 16,938.3 35 977.6 39 Charlotte, NC-SC 758,927 Total 16,003.6 36 991.6 38 Virginia Beach, VA 1,394,439 Total 15,972.9 37 1,107.5 37 Cincinnati, OH-KY-IN 1,503,262 Total 15,768.8 38 1,114.3 36 Providence, RI-MA 1,174,548 Total 15,599.4 39 1,136.4 35 Kansas City, MO-KS 1,361,744 Total 14,128.5 40 904.9 41 Jacksonville, FL 882,295 Total 12,615.1 41 829.9 44 Buffalo, NY 976,703 Total 12,591.9 42 963.8 40 Columbus, OH 1,133,193 Total 11,951.2 43 875.8 42 Louisville, KY-IN 863,582 Total 11,767.3 44 828.0 45 Richmond, VA 818,836 Total 11,682.9 45 672.4 48 Tucson, AZ 720,425 Total 11,361.7 46 853.1 43 Kennewick-Richland, WA 153,851 Total 9,953.7 47 390.0 75 Durham, NC 287,796 Total 9,929.4 48 583.4 54 Indianapolis, IN 1,218,919 Total 9,371.9 49 627.6 50 El Paso, TX-NM 674,801 Total 9,353.4 50 677.8 46 Dayton, OH 703,444 Total 9,327.1 51 618.0 51 Spokane, WA-ID 334,858 Total 9,272.5 52 611.3 52 Albuquerque, NM 598,191 Total 8,573.1 53 522.2 59 Albany, NY 558,947 Total 8,315.9 54 673.1 47 Nashville-Davidson, TN 749,935 Total 8,065.0 55 472.4 63
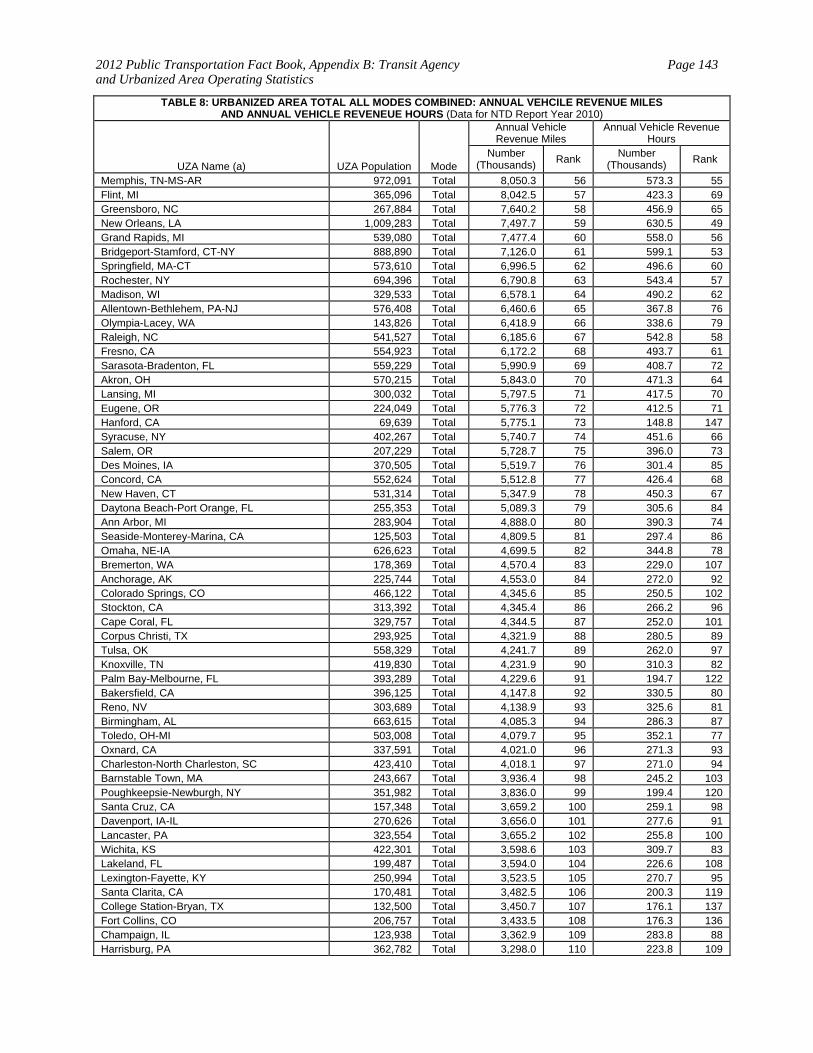
2012 Public Transportation Fact Book, Appendix B: Transit Agency and Urbanized Area Operating Statistics
Page 143
TABLE 8: URBANIZED AREA TOTAL ALL MODES COMBINED: ANNUAL VEHCILE REVENUE MILESAND ANNUAL VEHICLE REVENEUE HOURS (Data for NTD Report Year 2010)
UZA Name (a) UZA Population Mode
Annual Vehicle Revenue Miles
Annual Vehicle Revenue Hours
Number (Thousands) Rank
Number (Thousands) Rank
Memphis, TN-MS-AR 972,091 Total 8,050.3 56 573.3 55 Flint, MI 365,096 Total 8,042.5 57 423.3 69 Greensboro, NC 267,884 Total 7,640.2 58 456.9 65 New Orleans, LA 1,009,283 Total 7,497.7 59 630.5 49 Grand Rapids, MI 539,080 Total 7,477.4 60 558.0 56 Bridgeport-Stamford, CT-NY 888,890 Total 7,126.0 61 599.1 53 Springfield, MA-CT 573,610 Total 6,996.5 62 496.6 60 Rochester, NY 694,396 Total 6,790.8 63 543.4 57 Madison, WI 329,533 Total 6,578.1 64 490.2 62 Allentown-Bethlehem, PA-NJ 576,408 Total 6,460.6 65 367.8 76 Olympia-Lacey, WA 143,826 Total 6,418.9 66 338.6 79 Raleigh, NC 541,527 Total 6,185.6 67 542.8 58 Fresno, CA 554,923 Total 6,172.2 68 493.7 61 Sarasota-Bradenton, FL 559,229 Total 5,990.9 69 408.7 72 Akron, OH 570,215 Total 5,843.0 70 471.3 64 Lansing, MI 300,032 Total 5,797.5 71 417.5 70 Eugene, OR 224,049 Total 5,776.3 72 412.5 71 Hanford, CA 69,639 Total 5,775.1 73 148.8 147 Syracuse, NY 402,267 Total 5,740.7 74 451.6 66 Salem, OR 207,229 Total 5,728.7 75 396.0 73 Des Moines, IA 370,505 Total 5,519.7 76 301.4 85 Concord, CA 552,624 Total 5,512.8 77 426.4 68 New Haven, CT 531,314 Total 5,347.9 78 450.3 67 Daytona Beach-Port Orange, FL 255,353 Total 5,089.3 79 305.6 84 Ann Arbor, MI 283,904 Total 4,888.0 80 390.3 74 Seaside-Monterey-Marina, CA 125,503 Total 4,809.5 81 297.4 86 Omaha, NE-IA 626,623 Total 4,699.5 82 344.8 78 Bremerton, WA 178,369 Total 4,570.4 83 229.0 107 Anchorage, AK 225,744 Total 4,553.0 84 272.0 92 Colorado Springs, CO 466,122 Total 4,345.6 85 250.5 102 Stockton, CA 313,392 Total 4,345.4 86 266.2 96 Cape Coral, FL 329,757 Total 4,344.5 87 252.0 101 Corpus Christi, TX 293,925 Total 4,321.9 88 280.5 89 Tulsa, OK 558,329 Total 4,241.7 89 262.0 97 Knoxville, TN 419,830 Total 4,231.9 90 310.3 82 Palm Bay-Melbourne, FL 393,289 Total 4,229.6 91 194.7 122 Bakersfield, CA 396,125 Total 4,147.8 92 330.5 80 Reno, NV 303,689 Total 4,138.9 93 325.6 81 Birmingham, AL 663,615 Total 4,085.3 94 286.3 87 Toledo, OH-MI 503,008 Total 4,079.7 95 352.1 77 Oxnard, CA 337,591 Total 4,021.0 96 271.3 93 Charleston-North Charleston, SC 423,410 Total 4,018.1 97 271.0 94 Barnstable Town, MA 243,667 Total 3,936.4 98 245.2 103 Poughkeepsie-Newburgh, NY 351,982 Total 3,836.0 99 199.4 120 Santa Cruz, CA 157,348 Total 3,659.2 100 259.1 98 Davenport, IA-IL 270,626 Total 3,656.0 101 277.6 91 Lancaster, PA 323,554 Total 3,655.2 102 255.8 100 Wichita, KS 422,301 Total 3,598.6 103 309.7 83 Lakeland, FL 199,487 Total 3,594.0 104 226.6 108 Lexington-Fayette, KY 250,994 Total 3,523.5 105 270.7 95 Santa Clarita, CA 170,481 Total 3,482.5 106 200.3 119 College Station-Bryan, TX 132,500 Total 3,450.7 107 176.1 137 Fort Collins, CO 206,757 Total 3,433.5 108 176.3 136 Champaign, IL 123,938 Total 3,362.9 109 283.8 88 Harrisburg, PA 362,782 Total 3,298.0 110 223.8 109

2012 Public Transportation Fact Book, Appendix B: Transit Agency and Urbanized Area Operating Statistics
Page 144
TABLE 8: URBANIZED AREA TOTAL ALL MODES COMBINED: ANNUAL VEHCILE REVENUE MILESAND ANNUAL VEHICLE REVENEUE HOURS (Data for NTD Report Year 2010)
UZA Name (a) UZA Population Mode
Annual Vehicle Revenue Miles
Annual Vehicle Revenue Hours
Number (Thousands) Rank
Number (Thousands) Rank
Santa Rosa, CA 285,408 Total 3,256.5 111 220.8 111 Gainesville, FL 159,508 Total 3,175.5 112 278.6 90 Canton, OH 266,595 Total 3,159.2 113 191.8 123 Bellingham, WA 84,324 Total 3,159.1 114 201.9 118 Indio-Cathedral City-Palm Springs, CA 254,856 Total 3,141.7 115 231.8 106 Savannah, GA 208,886 Total 3,127.7 116 239.0 104 Oklahoma City, OK 747,003 Total 3,125.9 117 195.4 121 Santa Barbara, CA 196,263 Total 3,118.6 118 237.9 105 York, PA 192,903 Total 3,019.2 119 212.7 112 Lancaster-Palmdale, CA 263,532 Total 2,970.2 120 181.3 130 Youngstown, OH-PA 417,437 Total 2,958.2 121 190.1 125 Erie, PA 194,804 Total 2,952.9 122 257.3 99 Leominster-Fitchburg, MA 112,943 Total 2,942.5 123 183.1 128 Little Rock, AR 360,331 Total 2,934.0 124 204.3 117 Antioch, CA 217,591 Total 2,895.3 125 211.8 114 Port Huron, MI 86,486 Total 2,891.4 126 181.9 129 Charleston, WV 182,991 Total 2,781.1 127 166.1 142 Reading, PA 240,264 Total 2,771.5 128 212.6 113 Worcester, MA-CT 429,882 Total 2,752.7 129 210.4 115 Shreveport, LA 275,213 Total 2,668.3 130 180.2 131 Chattanooga, TN-GA 343,509 Total 2,595.1 131 205.0 116 Binghamton, NY-PA 158,884 Total 2,595.1 132 176.0 138 Kalamazoo, MI 187,961 Total 2,546.7 133 178.9 134 Peoria, IL 247,172 Total 2,526.1 134 160.4 143 Charlottesville, VA 81,449 Total 2,465.4 135 190.1 126 Bonita Springs-Naples, FL 221,251 Total 2,444.3 136 131.3 161 Tallahassee, FL 204,260 Total 2,422.7 137 221.2 110 Lubbock, TX 202,225 Total 2,398.8 138 175.0 139 Florence, SC 67,314 Total 2,385.5 139 113.1 177 Victorville-Hesperia-Apple Valley, CA 200,436 Total 2,351.2 140 141.1 156 Vallejo, CA 158,967 Total 2,342.7 141 125.9 165 Killeen, TX 167,976 Total 2,332.6 142 148.6 148 Modesto, CA 310,945 Total 2,326.0 143 180.0 132 Gulfport-Biloxi, MS 205,754 Total 2,309.9 144 123.9 168 Scranton, PA 385,237 Total 2,274.1 145 172.3 140 Baton Rouge, LA 479,019 Total 2,268.8 146 171.4 141 Leesburg-Eustis, FL 97,497 Total 2,229.2 147 135.5 158 Spartanburg, SC 145,058 Total 2,196.6 148 138.1 157 Roanoke, VA 197,442 Total 2,127.3 149 144.1 153 Ithaca, NY 53,528 Total 2,110.7 150 148.1 150 Iowa City, IA 85,247 Total 2,081.9 151 186.8 127 Winston-Salem, NC 299,290 Total 2,078.6 152 177.5 135 Sherman, TX 56,168 Total 2,049.9 153 109.5 181 Columbia, SC 420,537 Total 2,048.4 154 150.5 144 Wenatchee, WA 55,425 Total 2,024.1 155 105.7 188 Duluth, MN-WI 118,265 Total 1,991.6 156 148.3 149 State College, PA 71,301 Total 1,984.3 157 124.8 166 Appleton, WI 187,683 Total 1,979.6 158 117.4 173 Salisbury, MD-DE 59,426 Total 1,978.2 159 60.3 260 Laredo, TX 175,586 Total 1,938.8 160 179.3 133 Mobile, AL 317,605 Total 1,932.2 161 150.2 145 Merced, CA 110,483 Total 1,905.2 162 114.2 176 Wilmington, NC 161,149 Total 1,873.4 163 145.3 151 South Bend, IN-MI 276,498 Total 1,853.4 164 127.5 163 Rockford, IL 270,414 Total 1,850.4 165 134.1 159
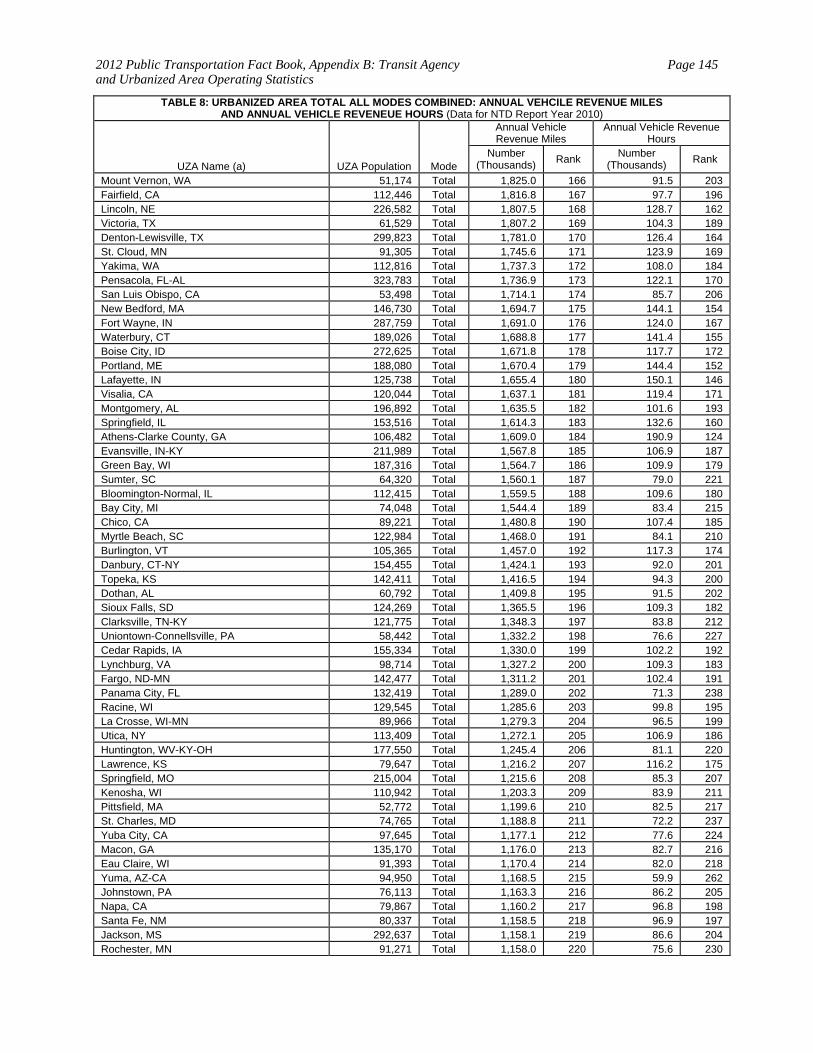
2012 Public Transportation Fact Book, Appendix B: Transit Agency and Urbanized Area Operating Statistics
Page 145
TABLE 8: URBANIZED AREA TOTAL ALL MODES COMBINED: ANNUAL VEHCILE REVENUE MILESAND ANNUAL VEHICLE REVENEUE HOURS (Data for NTD Report Year 2010)
UZA Name (a) UZA Population Mode
Annual Vehicle Revenue Miles
Annual Vehicle Revenue Hours
Number (Thousands) Rank
Number (Thousands) Rank
Mount Vernon, WA 51,174 Total 1,825.0 166 91.5 203 Fairfield, CA 112,446 Total 1,816.8 167 97.7 196 Lincoln, NE 226,582 Total 1,807.5 168 128.7 162 Victoria, TX 61,529 Total 1,807.2 169 104.3 189 Denton-Lewisville, TX 299,823 Total 1,781.0 170 126.4 164 St. Cloud, MN 91,305 Total 1,745.6 171 123.9 169 Yakima, WA 112,816 Total 1,737.3 172 108.0 184 Pensacola, FL-AL 323,783 Total 1,736.9 173 122.1 170 San Luis Obispo, CA 53,498 Total 1,714.1 174 85.7 206 New Bedford, MA 146,730 Total 1,694.7 175 144.1 154 Fort Wayne, IN 287,759 Total 1,691.0 176 124.0 167 Waterbury, CT 189,026 Total 1,688.8 177 141.4 155 Boise City, ID 272,625 Total 1,671.8 178 117.7 172 Portland, ME 188,080 Total 1,670.4 179 144.4 152 Lafayette, IN 125,738 Total 1,655.4 180 150.1 146 Visalia, CA 120,044 Total 1,637.1 181 119.4 171 Montgomery, AL 196,892 Total 1,635.5 182 101.6 193 Springfield, IL 153,516 Total 1,614.3 183 132.6 160 Athens-Clarke County, GA 106,482 Total 1,609.0 184 190.9 124 Evansville, IN-KY 211,989 Total 1,567.8 185 106.9 187 Green Bay, WI 187,316 Total 1,564.7 186 109.9 179 Sumter, SC 64,320 Total 1,560.1 187 79.0 221 Bloomington-Normal, IL 112,415 Total 1,559.5 188 109.6 180 Bay City, MI 74,048 Total 1,544.4 189 83.4 215 Chico, CA 89,221 Total 1,480.8 190 107.4 185 Myrtle Beach, SC 122,984 Total 1,468.0 191 84.1 210 Burlington, VT 105,365 Total 1,457.0 192 117.3 174 Danbury, CT-NY 154,455 Total 1,424.1 193 92.0 201 Topeka, KS 142,411 Total 1,416.5 194 94.3 200 Dothan, AL 60,792 Total 1,409.8 195 91.5 202 Sioux Falls, SD 124,269 Total 1,365.5 196 109.3 182 Clarksville, TN-KY 121,775 Total 1,348.3 197 83.8 212 Uniontown-Connellsville, PA 58,442 Total 1,332.2 198 76.6 227 Cedar Rapids, IA 155,334 Total 1,330.0 199 102.2 192 Lynchburg, VA 98,714 Total 1,327.2 200 109.3 183 Fargo, ND-MN 142,477 Total 1,311.2 201 102.4 191 Panama City, FL 132,419 Total 1,289.0 202 71.3 238 Racine, WI 129,545 Total 1,285.6 203 99.8 195 La Crosse, WI-MN 89,966 Total 1,279.3 204 96.5 199 Utica, NY 113,409 Total 1,272.1 205 106.9 186 Huntington, WV-KY-OH 177,550 Total 1,245.4 206 81.1 220 Lawrence, KS 79,647 Total 1,216.2 207 116.2 175 Springfield, MO 215,004 Total 1,215.6 208 85.3 207 Kenosha, WI 110,942 Total 1,203.3 209 83.9 211 Pittsfield, MA 52,772 Total 1,199.6 210 82.5 217 St. Charles, MD 74,765 Total 1,188.8 211 72.2 237 Yuba City, CA 97,645 Total 1,177.1 212 77.6 224 Macon, GA 135,170 Total 1,176.0 213 82.7 216 Eau Claire, WI 91,393 Total 1,170.4 214 82.0 218 Yuma, AZ-CA 94,950 Total 1,168.5 215 59.9 262 Johnstown, PA 76,113 Total 1,163.3 216 86.2 205 Napa, CA 79,867 Total 1,160.2 217 96.8 198 Santa Fe, NM 80,337 Total 1,158.5 218 96.9 197 Jackson, MS 292,637 Total 1,158.1 219 86.6 204 Rochester, MN 91,271 Total 1,158.0 220 75.6 230
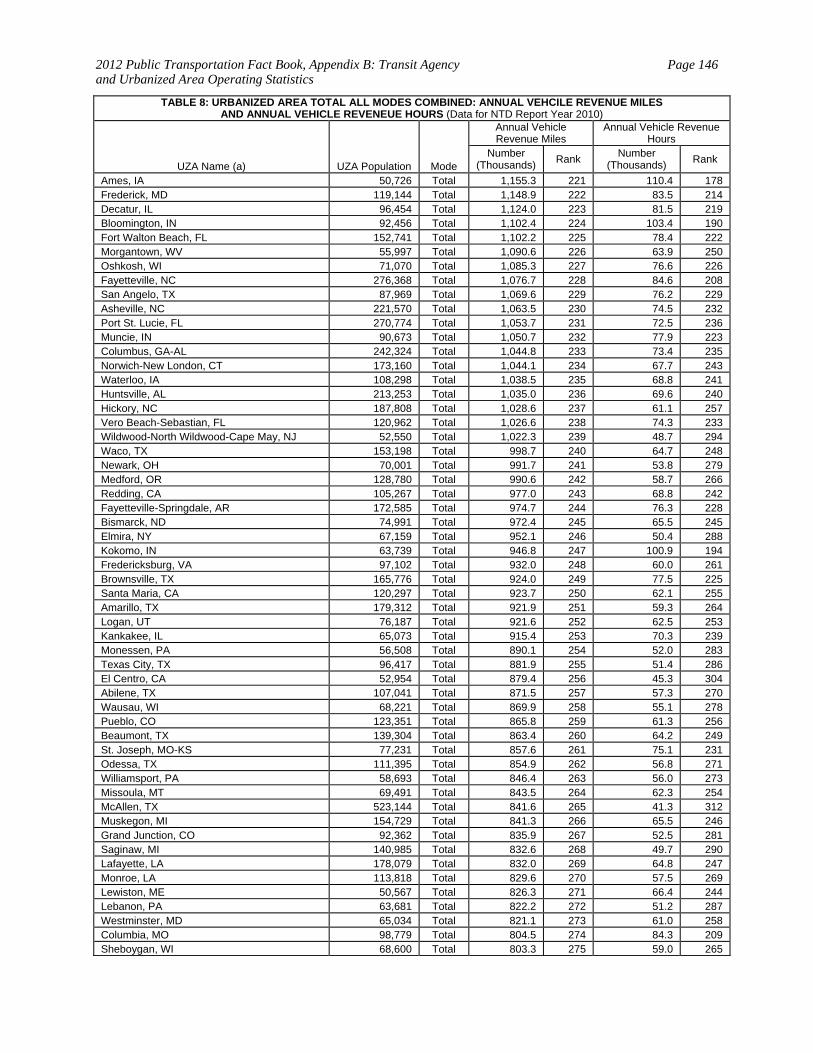
2012 Public Transportation Fact Book, Appendix B: Transit Agency and Urbanized Area Operating Statistics
Page 146
TABLE 8: URBANIZED AREA TOTAL ALL MODES COMBINED: ANNUAL VEHCILE REVENUE MILESAND ANNUAL VEHICLE REVENEUE HOURS (Data for NTD Report Year 2010)
UZA Name (a) UZA Population Mode
Annual Vehicle Revenue Miles
Annual Vehicle Revenue Hours
Number (Thousands) Rank
Number (Thousands) Rank
Ames, IA 50,726 Total 1,155.3 221 110.4 178 Frederick, MD 119,144 Total 1,148.9 222 83.5 214 Decatur, IL 96,454 Total 1,124.0 223 81.5 219 Bloomington, IN 92,456 Total 1,102.4 224 103.4 190 Fort Walton Beach, FL 152,741 Total 1,102.2 225 78.4 222 Morgantown, WV 55,997 Total 1,090.6 226 63.9 250 Oshkosh, WI 71,070 Total 1,085.3 227 76.6 226 Fayetteville, NC 276,368 Total 1,076.7 228 84.6 208 San Angelo, TX 87,969 Total 1,069.6 229 76.2 229 Asheville, NC 221,570 Total 1,063.5 230 74.5 232 Port St. Lucie, FL 270,774 Total 1,053.7 231 72.5 236 Muncie, IN 90,673 Total 1,050.7 232 77.9 223 Columbus, GA-AL 242,324 Total 1,044.8 233 73.4 235 Norwich-New London, CT 173,160 Total 1,044.1 234 67.7 243 Waterloo, IA 108,298 Total 1,038.5 235 68.8 241 Huntsville, AL 213,253 Total 1,035.0 236 69.6 240 Hickory, NC 187,808 Total 1,028.6 237 61.1 257 Vero Beach-Sebastian, FL 120,962 Total 1,026.6 238 74.3 233 Wildwood-North Wildwood-Cape May, NJ 52,550 Total 1,022.3 239 48.7 294 Waco, TX 153,198 Total 998.7 240 64.7 248 Newark, OH 70,001 Total 991.7 241 53.8 279 Medford, OR 128,780 Total 990.6 242 58.7 266 Redding, CA 105,267 Total 977.0 243 68.8 242 Fayetteville-Springdale, AR 172,585 Total 974.7 244 76.3 228 Bismarck, ND 74,991 Total 972.4 245 65.5 245 Elmira, NY 67,159 Total 952.1 246 50.4 288 Kokomo, IN 63,739 Total 946.8 247 100.9 194 Fredericksburg, VA 97,102 Total 932.0 248 60.0 261 Brownsville, TX 165,776 Total 924.0 249 77.5 225 Santa Maria, CA 120,297 Total 923.7 250 62.1 255 Amarillo, TX 179,312 Total 921.9 251 59.3 264 Logan, UT 76,187 Total 921.6 252 62.5 253 Kankakee, IL 65,073 Total 915.4 253 70.3 239 Monessen, PA 56,508 Total 890.1 254 52.0 283 Texas City, TX 96,417 Total 881.9 255 51.4 286 El Centro, CA 52,954 Total 879.4 256 45.3 304 Abilene, TX 107,041 Total 871.5 257 57.3 270 Wausau, WI 68,221 Total 869.9 258 55.1 278 Pueblo, CO 123,351 Total 865.8 259 61.3 256 Beaumont, TX 139,304 Total 863.4 260 64.2 249 St. Joseph, MO-KS 77,231 Total 857.6 261 75.1 231 Odessa, TX 111,395 Total 854.9 262 56.8 271 Williamsport, PA 58,693 Total 846.4 263 56.0 273 Missoula, MT 69,491 Total 843.5 264 62.3 254 McAllen, TX 523,144 Total 841.6 265 41.3 312 Muskegon, MI 154,729 Total 841.3 266 65.5 246 Grand Junction, CO 92,362 Total 835.9 267 52.5 281 Saginaw, MI 140,985 Total 832.6 268 49.7 290 Lafayette, LA 178,079 Total 832.0 269 64.8 247 Monroe, LA 113,818 Total 829.6 270 57.5 269 Lewiston, ME 50,567 Total 826.3 271 66.4 244 Lebanon, PA 63,681 Total 822.2 272 51.2 287 Westminster, MD 65,034 Total 821.1 273 61.0 258 Columbia, MO 98,779 Total 804.5 274 84.3 209 Sheboygan, WI 68,600 Total 803.3 275 59.0 265
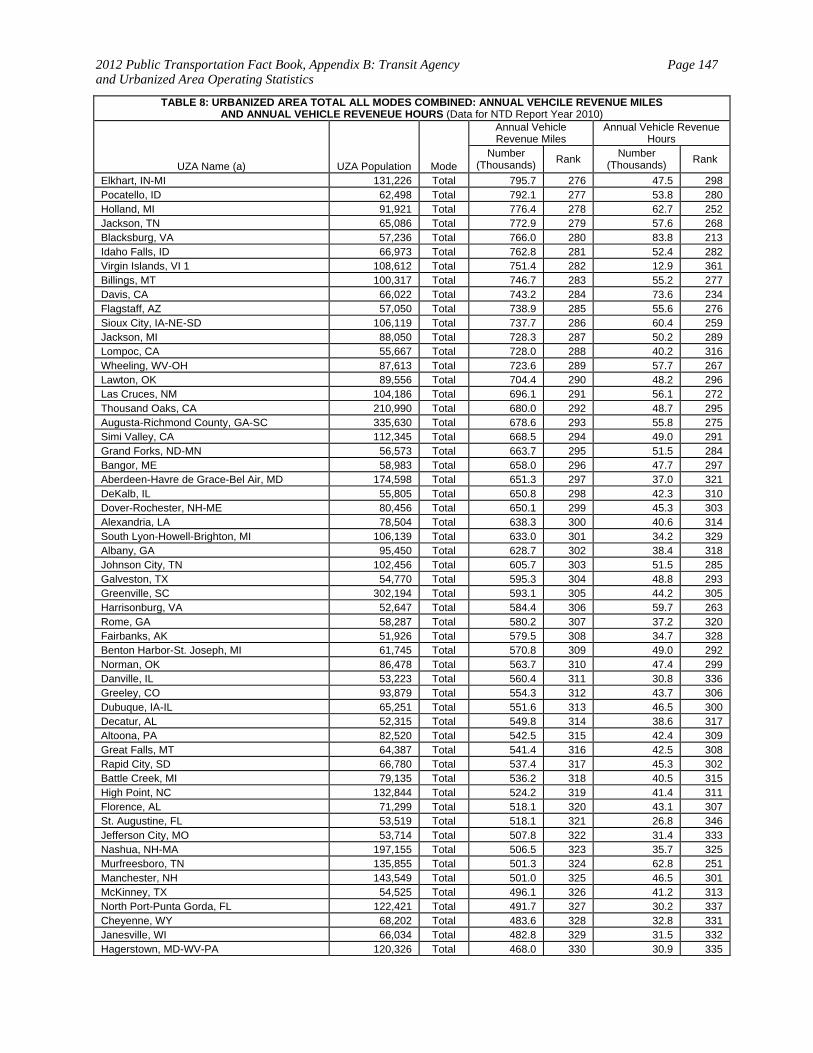
2012 Public Transportation Fact Book, Appendix B: Transit Agency and Urbanized Area Operating Statistics
Page 147
TABLE 8: URBANIZED AREA TOTAL ALL MODES COMBINED: ANNUAL VEHCILE REVENUE MILESAND ANNUAL VEHICLE REVENEUE HOURS (Data for NTD Report Year 2010)
UZA Name (a) UZA Population Mode
Annual Vehicle Revenue Miles
Annual Vehicle Revenue Hours
Number (Thousands) Rank
Number (Thousands) Rank
Elkhart, IN-MI 131,226 Total 795.7 276 47.5 298 Pocatello, ID 62,498 Total 792.1 277 53.8 280 Holland, MI 91,921 Total 776.4 278 62.7 252 Jackson, TN 65,086 Total 772.9 279 57.6 268 Blacksburg, VA 57,236 Total 766.0 280 83.8 213 Idaho Falls, ID 66,973 Total 762.8 281 52.4 282 Virgin Islands, VI 1 108,612 Total 751.4 282 12.9 361 Billings, MT 100,317 Total 746.7 283 55.2 277 Davis, CA 66,022 Total 743.2 284 73.6 234 Flagstaff, AZ 57,050 Total 738.9 285 55.6 276 Sioux City, IA-NE-SD 106,119 Total 737.7 286 60.4 259 Jackson, MI 88,050 Total 728.3 287 50.2 289 Lompoc, CA 55,667 Total 728.0 288 40.2 316 Wheeling, WV-OH 87,613 Total 723.6 289 57.7 267 Lawton, OK 89,556 Total 704.4 290 48.2 296 Las Cruces, NM 104,186 Total 696.1 291 56.1 272 Thousand Oaks, CA 210,990 Total 680.0 292 48.7 295 Augusta-Richmond County, GA-SC 335,630 Total 678.6 293 55.8 275 Simi Valley, CA 112,345 Total 668.5 294 49.0 291 Grand Forks, ND-MN 56,573 Total 663.7 295 51.5 284 Bangor, ME 58,983 Total 658.0 296 47.7 297 Aberdeen-Havre de Grace-Bel Air, MD 174,598 Total 651.3 297 37.0 321 DeKalb, IL 55,805 Total 650.8 298 42.3 310 Dover-Rochester, NH-ME 80,456 Total 650.1 299 45.3 303 Alexandria, LA 78,504 Total 638.3 300 40.6 314 South Lyon-Howell-Brighton, MI 106,139 Total 633.0 301 34.2 329 Albany, GA 95,450 Total 628.7 302 38.4 318 Johnson City, TN 102,456 Total 605.7 303 51.5 285 Galveston, TX 54,770 Total 595.3 304 48.8 293 Greenville, SC 302,194 Total 593.1 305 44.2 305 Harrisonburg, VA 52,647 Total 584.4 306 59.7 263 Rome, GA 58,287 Total 580.2 307 37.2 320 Fairbanks, AK 51,926 Total 579.5 308 34.7 328 Benton Harbor-St. Joseph, MI 61,745 Total 570.8 309 49.0 292 Norman, OK 86,478 Total 563.7 310 47.4 299 Danville, IL 53,223 Total 560.4 311 30.8 336 Greeley, CO 93,879 Total 554.3 312 43.7 306 Dubuque, IA-IL 65,251 Total 551.6 313 46.5 300 Decatur, AL 52,315 Total 549.8 314 38.6 317 Altoona, PA 82,520 Total 542.5 315 42.4 309 Great Falls, MT 64,387 Total 541.4 316 42.5 308 Rapid City, SD 66,780 Total 537.4 317 45.3 302 Battle Creek, MI 79,135 Total 536.2 318 40.5 315 High Point, NC 132,844 Total 524.2 319 41.4 311 Florence, AL 71,299 Total 518.1 320 43.1 307 St. Augustine, FL 53,519 Total 518.1 321 26.8 346 Jefferson City, MO 53,714 Total 507.8 322 31.4 333 Nashua, NH-MA 197,155 Total 506.5 323 35.7 325 Murfreesboro, TN 135,855 Total 501.3 324 62.8 251 Manchester, NH 143,549 Total 501.0 325 46.5 301 McKinney, TX 54,525 Total 496.1 326 41.2 313 North Port-Punta Gorda, FL 122,421 Total 491.7 327 30.2 337 Cheyenne, WY 68,202 Total 483.6 328 32.8 331 Janesville, WI 66,034 Total 482.8 329 31.5 332 Hagerstown, MD-WV-PA 120,326 Total 468.0 330 30.9 335

2012 Public Transportation Fact Book, Appendix B: Transit Agency and Urbanized Area Operating Statistics
Page 148
TABLE 8: URBANIZED AREA TOTAL ALL MODES COMBINED: ANNUAL VEHCILE REVENUE MILESAND ANNUAL VEHICLE REVENEUE HOURS (Data for NTD Report Year 2010)
UZA Name (a) UZA Population Mode
Annual Vehicle Revenue Miles
Annual Vehicle Revenue Hours
Number (Thousands) Rank
Number (Thousands) Rank
Atlantic City, NJ 227,180 Total 465.0 331 36.5 323 Fort Smith, AR-OK 106,470 Total 462.1 332 34.9 326 Terre Haute, IN 79,376 Total 459.2 333 55.9 274 Casper, WY 57,719 Total 448.4 334 37.4 319 Portsmouth, NH-ME 50,912 Total 433.3 335 25.4 347 Parkersburg, WV-OH 85,605 Total 429.9 336 34.1 330 Bend, OR 57,525 Total 414.3 337 34.9 327 Anderson, IN 97,038 Total 412.1 338 31.3 334 Porterville, CA 60,261 Total 406.8 339 28.6 340 Fond du Lac, WI 50,058 Total 404.6 340 30.0 338 Longview, WA-OR 60,443 Total 403.1 341 36.7 322 Lodi, CA 83,735 Total 391.3 342 35.8 324 Cumberland, MD--WV 52,115 Total 390.8 343 27.4 342 Corvallis, OR 58,229 Total 373.9 344 26.9 345 Brooksville, FL 102,193 Total 367.3 345 18.3 357 Gainesville, GA 88,680 Total 352.5 346 20.3 354 Beloit, WI-IL 56,462 Total 344.5 347 21.6 351 Danville, VA 50,902 Total 343.9 348 21.1 352 Glens Falls, NY 57,627 Total 343.8 349 20.6 353 Port Arthur, TX 114,656 Total 342.2 350 23.6 349 Mansfield, OH 79,698 Total 333.0 351 27.0 344 Tuscaloosa, AL 116,888 Total 324.6 352 27.3 343 Auburn, AL 60,137 Total 315.2 353 19.6 355 Sandusky, OH 50,693 Total 303.4 354 27.4 341 Springfield, OH 89,684 Total 280.7 355 22.3 350 Petaluma, CA 59,958 Total 275.4 356 24.3 348 Cleveland, TN 58,192 Total 273.3 357 29.3 339 Middletown, OH 94,355 Total 250.3 358 17.5 359 Bowling Green, KY 58,314 Total 214.0 359 18.3 356 Turlock, CA 69,507 Total 210.5 360 15.5 360 Lorain-Elyria, OH 193,586 Total 164.6 361 17.9 358 (a) Only Urbanized Areas for which data are reported are included on this list. See Introduction.
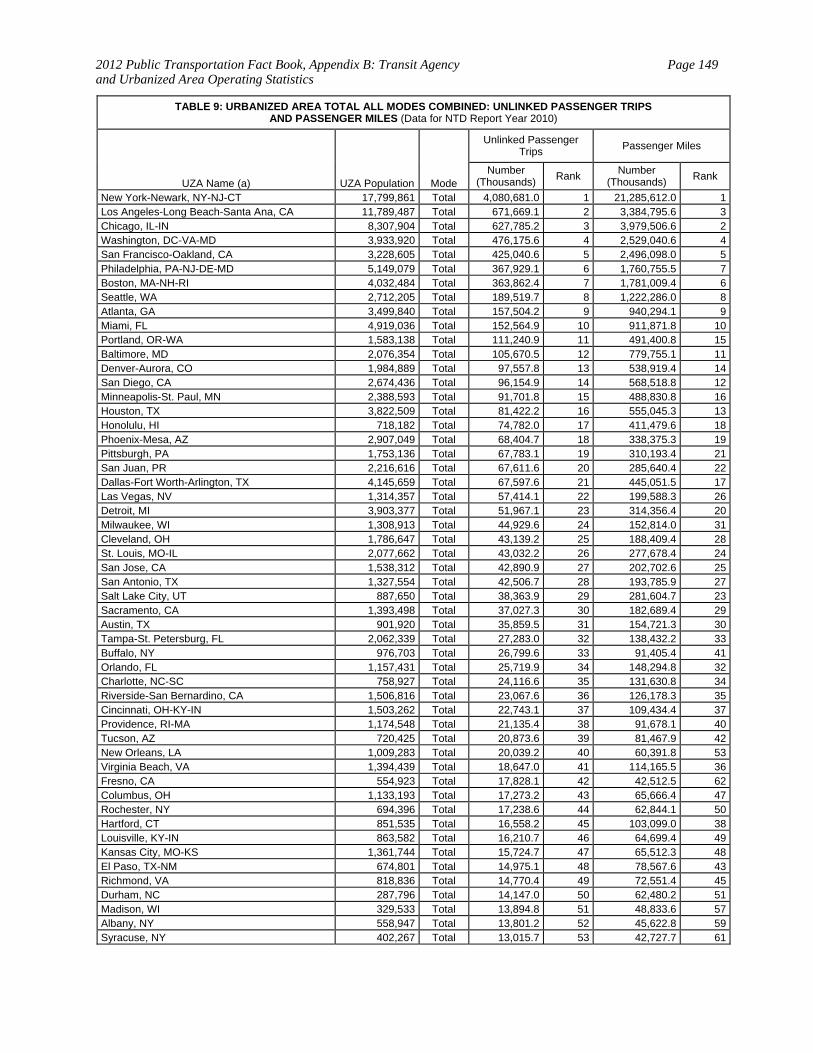
2012 Public Transportation Fact Book, Appendix B: Transit Agency and Urbanized Area Operating Statistics
Page 149
TABLE 9: URBANIZED AREA TOTAL ALL MODES COMBINED: UNLINKED PASSENGER TRIPS AND PASSENGER MILES (Data for NTD Report Year 2010)
UZA Name (a) UZA Population Mode
Unlinked Passenger Trips Passenger Miles
Number (Thousands)
Rank Number (Thousands)
Rank
New York-Newark, NY-NJ-CT 17,799,861 Total 4,080,681.0 1 21,285,612.0 1Los Angeles-Long Beach-Santa Ana, CA 11,789,487 Total 671,669.1 2 3,384,795.6 3Chicago, IL-IN 8,307,904 Total 627,785.2 3 3,979,506.6 2Washington, DC-VA-MD 3,933,920 Total 476,175.6 4 2,529,040.6 4San Francisco-Oakland, CA 3,228,605 Total 425,040.6 5 2,496,098.0 5Philadelphia, PA-NJ-DE-MD 5,149,079 Total 367,929.1 6 1,760,755.5 7Boston, MA-NH-RI 4,032,484 Total 363,862.4 7 1,781,009.4 6Seattle, WA 2,712,205 Total 189,519.7 8 1,222,286.0 8Atlanta, GA 3,499,840 Total 157,504.2 9 940,294.1 9Miami, FL 4,919,036 Total 152,564.9 10 911,871.8 10Portland, OR-WA 1,583,138 Total 111,240.9 11 491,400.8 15Baltimore, MD 2,076,354 Total 105,670.5 12 779,755.1 11Denver-Aurora, CO 1,984,889 Total 97,557.8 13 538,919.4 14San Diego, CA 2,674,436 Total 96,154.9 14 568,518.8 12Minneapolis-St. Paul, MN 2,388,593 Total 91,701.8 15 488,830.8 16Houston, TX 3,822,509 Total 81,422.2 16 555,045.3 13Honolulu, HI 718,182 Total 74,782.0 17 411,479.6 18Phoenix-Mesa, AZ 2,907,049 Total 68,404.7 18 338,375.3 19Pittsburgh, PA 1,753,136 Total 67,783.1 19 310,193.4 21San Juan, PR 2,216,616 Total 67,611.6 20 285,640.4 22Dallas-Fort Worth-Arlington, TX 4,145,659 Total 67,597.6 21 445,051.5 17Las Vegas, NV 1,314,357 Total 57,414.1 22 199,588.3 26Detroit, MI 3,903,377 Total 51,967.1 23 314,356.4 20Milwaukee, WI 1,308,913 Total 44,929.6 24 152,814.0 31Cleveland, OH 1,786,647 Total 43,139.2 25 188,409.4 28St. Louis, MO-IL 2,077,662 Total 43,032.2 26 277,678.4 24San Jose, CA 1,538,312 Total 42,890.9 27 202,702.6 25San Antonio, TX 1,327,554 Total 42,506.7 28 193,785.9 27Salt Lake City, UT 887,650 Total 38,363.9 29 281,604.7 23Sacramento, CA 1,393,498 Total 37,027.3 30 182,689.4 29Austin, TX 901,920 Total 35,859.5 31 154,721.3 30Tampa-St. Petersburg, FL 2,062,339 Total 27,283.0 32 138,432.2 33Buffalo, NY 976,703 Total 26,799.6 33 91,405.4 41Orlando, FL 1,157,431 Total 25,719.9 34 148,294.8 32Charlotte, NC-SC 758,927 Total 24,116.6 35 131,630.8 34Riverside-San Bernardino, CA 1,506,816 Total 23,067.6 36 126,178.3 35Cincinnati, OH-KY-IN 1,503,262 Total 22,743.1 37 109,434.4 37Providence, RI-MA 1,174,548 Total 21,135.4 38 91,678.1 40Tucson, AZ 720,425 Total 20,873.6 39 81,467.9 42New Orleans, LA 1,009,283 Total 20,039.2 40 60,391.8 53Virginia Beach, VA 1,394,439 Total 18,647.0 41 114,165.5 36Fresno, CA 554,923 Total 17,828.1 42 42,512.5 62Columbus, OH 1,133,193 Total 17,273.2 43 65,666.4 47Rochester, NY 694,396 Total 17,238.6 44 62,844.1 50Hartford, CT 851,535 Total 16,558.2 45 103,099.0 38Louisville, KY-IN 863,582 Total 16,210.7 46 64,699.4 49Kansas City, MO-KS 1,361,744 Total 15,724.7 47 65,512.3 48El Paso, TX-NM 674,801 Total 14,975.1 48 78,567.6 43Richmond, VA 818,836 Total 14,770.4 49 72,551.4 45Durham, NC 287,796 Total 14,147.0 50 62,480.2 51Madison, WI 329,533 Total 13,894.8 51 48,833.6 57Albany, NY 558,947 Total 13,801.2 52 45,622.8 59Syracuse, NY 402,267 Total 13,015.7 53 42,727.7 61
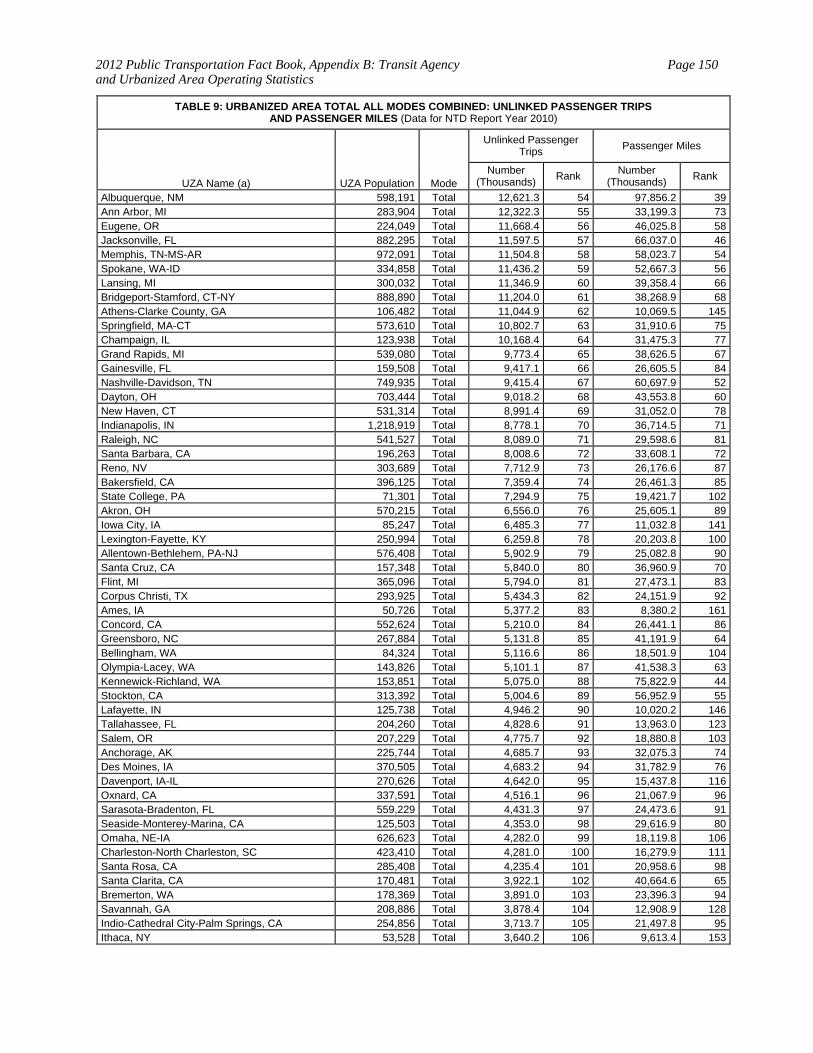
2012 Public Transportation Fact Book, Appendix B: Transit Agency and Urbanized Area Operating Statistics
Page 150
TABLE 9: URBANIZED AREA TOTAL ALL MODES COMBINED: UNLINKED PASSENGER TRIPS AND PASSENGER MILES (Data for NTD Report Year 2010)
UZA Name (a) UZA Population Mode
Unlinked Passenger Trips Passenger Miles
Number (Thousands)
Rank Number (Thousands)
Rank
Albuquerque, NM 598,191 Total 12,621.3 54 97,856.2 39Ann Arbor, MI 283,904 Total 12,322.3 55 33,199.3 73Eugene, OR 224,049 Total 11,668.4 56 46,025.8 58Jacksonville, FL 882,295 Total 11,597.5 57 66,037.0 46Memphis, TN-MS-AR 972,091 Total 11,504.8 58 58,023.7 54Spokane, WA-ID 334,858 Total 11,436.2 59 52,667.3 56Lansing, MI 300,032 Total 11,346.9 60 39,358.4 66Bridgeport-Stamford, CT-NY 888,890 Total 11,204.0 61 38,268.9 68Athens-Clarke County, GA 106,482 Total 11,044.9 62 10,069.5 145Springfield, MA-CT 573,610 Total 10,802.7 63 31,910.6 75Champaign, IL 123,938 Total 10,168.4 64 31,475.3 77Grand Rapids, MI 539,080 Total 9,773.4 65 38,626.5 67Gainesville, FL 159,508 Total 9,417.1 66 26,605.5 84Nashville-Davidson, TN 749,935 Total 9,415.4 67 60,697.9 52Dayton, OH 703,444 Total 9,018.2 68 43,553.8 60New Haven, CT 531,314 Total 8,991.4 69 31,052.0 78Indianapolis, IN 1,218,919 Total 8,778.1 70 36,714.5 71Raleigh, NC 541,527 Total 8,089.0 71 29,598.6 81Santa Barbara, CA 196,263 Total 8,008.6 72 33,608.1 72Reno, NV 303,689 Total 7,712.9 73 26,176.6 87Bakersfield, CA 396,125 Total 7,359.4 74 26,461.3 85State College, PA 71,301 Total 7,294.9 75 19,421.7 102Akron, OH 570,215 Total 6,556.0 76 25,605.1 89Iowa City, IA 85,247 Total 6,485.3 77 11,032.8 141Lexington-Fayette, KY 250,994 Total 6,259.8 78 20,203.8 100Allentown-Bethlehem, PA-NJ 576,408 Total 5,902.9 79 25,082.8 90Santa Cruz, CA 157,348 Total 5,840.0 80 36,960.9 70Flint, MI 365,096 Total 5,794.0 81 27,473.1 83Corpus Christi, TX 293,925 Total 5,434.3 82 24,151.9 92Ames, IA 50,726 Total 5,377.2 83 8,380.2 161Concord, CA 552,624 Total 5,210.0 84 26,441.1 86Greensboro, NC 267,884 Total 5,131.8 85 41,191.9 64Bellingham, WA 84,324 Total 5,116.6 86 18,501.9 104Olympia-Lacey, WA 143,826 Total 5,101.1 87 41,538.3 63Kennewick-Richland, WA 153,851 Total 5,075.0 88 75,822.9 44Stockton, CA 313,392 Total 5,004.6 89 56,952.9 55Lafayette, IN 125,738 Total 4,946.2 90 10,020.2 146Tallahassee, FL 204,260 Total 4,828.6 91 13,963.0 123Salem, OR 207,229 Total 4,775.7 92 18,880.8 103Anchorage, AK 225,744 Total 4,685.7 93 32,075.3 74Des Moines, IA 370,505 Total 4,683.2 94 31,782.9 76Davenport, IA-IL 270,626 Total 4,642.0 95 15,437.8 116Oxnard, CA 337,591 Total 4,516.1 96 21,067.9 96Sarasota-Bradenton, FL 559,229 Total 4,431.3 97 24,473.6 91Seaside-Monterey-Marina, CA 125,503 Total 4,353.0 98 29,616.9 80Omaha, NE-IA 626,623 Total 4,282.0 99 18,119.8 106Charleston-North Charleston, SC 423,410 Total 4,281.0 100 16,279.9 111Santa Rosa, CA 285,408 Total 4,235.4 101 20,958.6 98Santa Clarita, CA 170,481 Total 3,922.1 102 40,664.6 65Bremerton, WA 178,369 Total 3,891.0 103 23,396.3 94Savannah, GA 208,886 Total 3,878.4 104 12,908.9 128Indio-Cathedral City-Palm Springs, CA 254,856 Total 3,713.7 105 21,497.8 95Ithaca, NY 53,528 Total 3,640.2 106 9,613.4 153
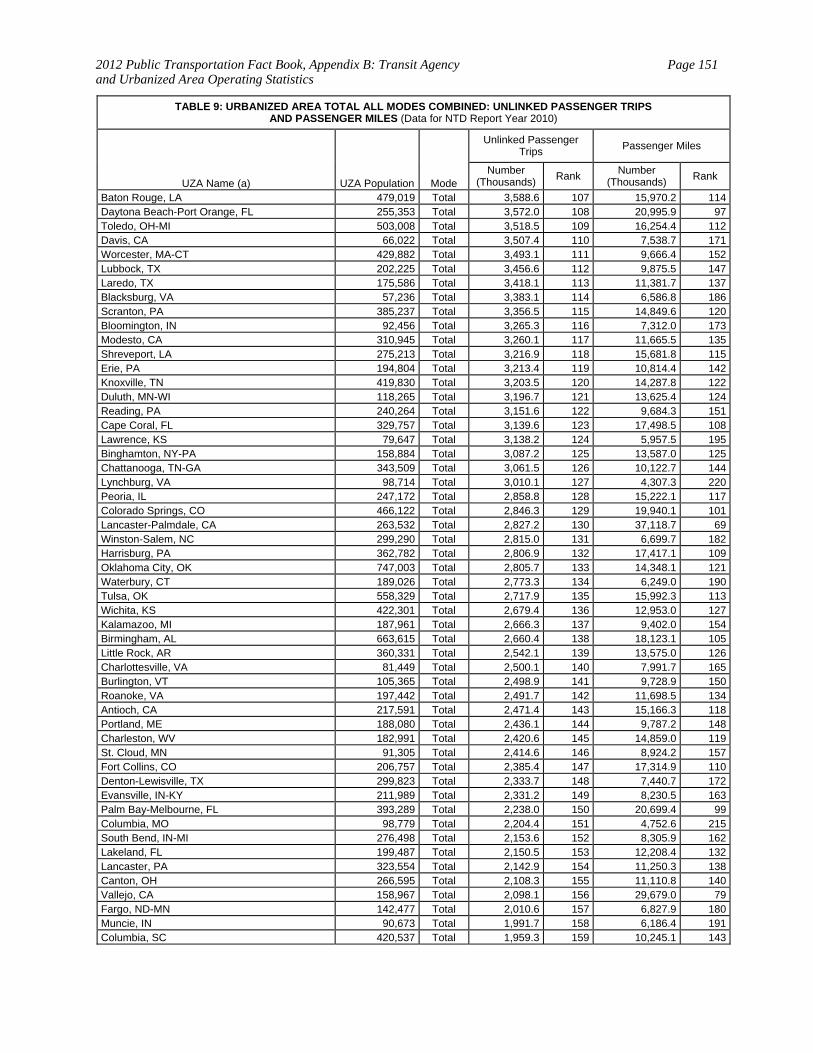
2012 Public Transportation Fact Book, Appendix B: Transit Agency and Urbanized Area Operating Statistics
Page 151
TABLE 9: URBANIZED AREA TOTAL ALL MODES COMBINED: UNLINKED PASSENGER TRIPS AND PASSENGER MILES (Data for NTD Report Year 2010)
UZA Name (a) UZA Population Mode
Unlinked Passenger Trips Passenger Miles
Number (Thousands)
Rank Number (Thousands)
Rank
Baton Rouge, LA 479,019 Total 3,588.6 107 15,970.2 114Daytona Beach-Port Orange, FL 255,353 Total 3,572.0 108 20,995.9 97Toledo, OH-MI 503,008 Total 3,518.5 109 16,254.4 112Davis, CA 66,022 Total 3,507.4 110 7,538.7 171Worcester, MA-CT 429,882 Total 3,493.1 111 9,666.4 152Lubbock, TX 202,225 Total 3,456.6 112 9,875.5 147Laredo, TX 175,586 Total 3,418.1 113 11,381.7 137Blacksburg, VA 57,236 Total 3,383.1 114 6,586.8 186Scranton, PA 385,237 Total 3,356.5 115 14,849.6 120Bloomington, IN 92,456 Total 3,265.3 116 7,312.0 173Modesto, CA 310,945 Total 3,260.1 117 11,665.5 135Shreveport, LA 275,213 Total 3,216.9 118 15,681.8 115Erie, PA 194,804 Total 3,213.4 119 10,814.4 142Knoxville, TN 419,830 Total 3,203.5 120 14,287.8 122Duluth, MN-WI 118,265 Total 3,196.7 121 13,625.4 124Reading, PA 240,264 Total 3,151.6 122 9,684.3 151Cape Coral, FL 329,757 Total 3,139.6 123 17,498.5 108Lawrence, KS 79,647 Total 3,138.2 124 5,957.5 195Binghamton, NY-PA 158,884 Total 3,087.2 125 13,587.0 125Chattanooga, TN-GA 343,509 Total 3,061.5 126 10,122.7 144Lynchburg, VA 98,714 Total 3,010.1 127 4,307.3 220Peoria, IL 247,172 Total 2,858.8 128 15,222.1 117Colorado Springs, CO 466,122 Total 2,846.3 129 19,940.1 101Lancaster-Palmdale, CA 263,532 Total 2,827.2 130 37,118.7 69Winston-Salem, NC 299,290 Total 2,815.0 131 6,699.7 182Harrisburg, PA 362,782 Total 2,806.9 132 17,417.1 109Oklahoma City, OK 747,003 Total 2,805.7 133 14,348.1 121Waterbury, CT 189,026 Total 2,773.3 134 6,249.0 190Tulsa, OK 558,329 Total 2,717.9 135 15,992.3 113Wichita, KS 422,301 Total 2,679.4 136 12,953.0 127Kalamazoo, MI 187,961 Total 2,666.3 137 9,402.0 154Birmingham, AL 663,615 Total 2,660.4 138 18,123.1 105Little Rock, AR 360,331 Total 2,542.1 139 13,575.0 126Charlottesville, VA 81,449 Total 2,500.1 140 7,991.7 165Burlington, VT 105,365 Total 2,498.9 141 9,728.9 150Roanoke, VA 197,442 Total 2,491.7 142 11,698.5 134Antioch, CA 217,591 Total 2,471.4 143 15,166.3 118Portland, ME 188,080 Total 2,436.1 144 9,787.2 148Charleston, WV 182,991 Total 2,420.6 145 14,859.0 119St. Cloud, MN 91,305 Total 2,414.6 146 8,924.2 157Fort Collins, CO 206,757 Total 2,385.4 147 17,314.9 110Denton-Lewisville, TX 299,823 Total 2,333.7 148 7,440.7 172Evansville, IN-KY 211,989 Total 2,331.2 149 8,230.5 163Palm Bay-Melbourne, FL 393,289 Total 2,238.0 150 20,699.4 99Columbia, MO 98,779 Total 2,204.4 151 4,752.6 215South Bend, IN-MI 276,498 Total 2,153.6 152 8,305.9 162Lakeland, FL 199,487 Total 2,150.5 153 12,208.4 132Lancaster, PA 323,554 Total 2,142.9 154 11,250.3 138Canton, OH 266,595 Total 2,108.3 155 11,110.8 140Vallejo, CA 158,967 Total 2,098.1 156 29,679.0 79Fargo, ND-MN 142,477 Total 2,010.6 157 6,827.9 180Muncie, IN 90,673 Total 1,991.7 158 6,186.4 191Columbia, SC 420,537 Total 1,959.3 159 10,245.1 143

2012 Public Transportation Fact Book, Appendix B: Transit Agency and Urbanized Area Operating Statistics
Page 152
TABLE 9: URBANIZED AREA TOTAL ALL MODES COMBINED: UNLINKED PASSENGER TRIPS AND PASSENGER MILES (Data for NTD Report Year 2010)
UZA Name (a) UZA Population Mode
Unlinked Passenger Trips Passenger Miles
Number (Thousands)
Rank Number (Thousands)
Rank
Fort Wayne, IN 287,759 Total 1,931.9 160 6,658.9 183Logan, UT 76,187 Total 1,925.3 161 6,843.2 178New Bedford, MA 146,730 Total 1,889.0 162 8,721.0 159Harrisonburg, VA 52,647 Total 1,862.5 163 5,052.4 208Lincoln, NE 226,582 Total 1,812.9 164 5,527.3 200Fayetteville-Springdale, AR 172,585 Total 1,812.3 165 3,520.8 238Poughkeepsie-Newburgh, NY 351,982 Total 1,777.3 166 27,995.8 82Kenosha, WI 110,942 Total 1,665.5 167 5,059.2 207Springfield, IL 153,516 Total 1,665.0 168 4,659.4 216Rockford, IL 270,414 Total 1,620.8 169 7,847.0 168York, PA 192,903 Total 1,597.6 170 8,705.0 160Visalia, CA 120,044 Total 1,596.6 171 6,586.8 185San Luis Obispo, CA 53,498 Total 1,584.6 172 17,980.0 107Asheville, NC 221,570 Total 1,563.6 173 7,281.4 175Rochester, MN 91,271 Total 1,561.3 174 5,637.8 198Yakima, WA 112,816 Total 1,501.4 175 9,216.4 156Brownsville, TX 165,776 Total 1,491.5 176 12,719.3 129Victorville-Hesperia-Apple Valley, CA 200,436 Total 1,482.5 177 9,367.0 155Racine, WI 129,545 Total 1,455.0 178 5,180.1 206Lafayette, LA 178,079 Total 1,449.9 179 7,548.6 170Green Bay, WI 187,316 Total 1,438.2 180 4,834.7 213Youngstown, OH-PA 417,437 Total 1,423.0 181 6,135.0 192Wilmington, NC 161,149 Total 1,422.4 182 3,315.3 243Boise City, ID 272,625 Total 1,418.3 183 7,942.9 166Springfield, MO 215,004 Total 1,406.5 184 5,618.2 199College Station-Bryan, TX 132,500 Total 1,362.1 185 25,929.2 88Montgomery, AL 196,892 Total 1,361.9 186 7,238.8 176Chico, CA 89,221 Total 1,350.2 187 7,303.0 174Utica, NY 113,409 Total 1,340.8 188 3,901.9 228La Crosse, WI-MN 89,966 Total 1,312.1 189 4,057.4 226Norman, OK 86,478 Total 1,306.3 190 2,985.6 259Williamsport, PA 58,693 Total 1,297.0 191 6,269.4 189Johnstown, PA 76,113 Total 1,282.5 192 5,203.6 205Decatur, IL 96,454 Total 1,278.4 193 3,791.2 231Port Huron, MI 86,486 Total 1,274.1 194 3,670.5 235Fayetteville, NC 276,368 Total 1,265.6 195 4,136.1 224Bloomington-Normal, IL 112,415 Total 1,261.4 196 3,622.7 236Topeka, KS 142,411 Total 1,250.2 197 4,912.0 212Sioux City, IA-NE-SD 106,119 Total 1,239.6 198 6,354.4 187Pensacola, FL-AL 323,783 Total 1,208.8 199 5,976.4 194Missoula, MT 69,491 Total 1,201.0 200 3,505.0 239Mobile, AL 317,605 Total 1,188.6 201 6,828.3 179Cedar Rapids, IA 155,334 Total 1,173.1 202 5,688.1 197Bonita Springs-Naples, FL 221,251 Total 1,172.3 203 9,778.6 149Monroe, LA 113,818 Total 1,170.8 204 3,769.5 232Appleton, WI 187,683 Total 1,159.5 205 4,527.1 218Santa Maria, CA 120,297 Total 1,150.3 206 7,551.7 169Hanford, CA 69,639 Total 1,149.0 207 23,722.5 93Flagstaff, AZ 57,050 Total 1,142.5 208 2,934.5 262Portsmouth, NH-ME 50,912 Total 1,101.5 209 2,912.7 263Columbus, GA-AL 242,324 Total 1,100.6 210 4,270.5 221Sioux Falls, SD 124,269 Total 1,071.0 211 6,787.3 181Yuba City, CA 97,645 Total 1,060.9 212 7,175.3 177
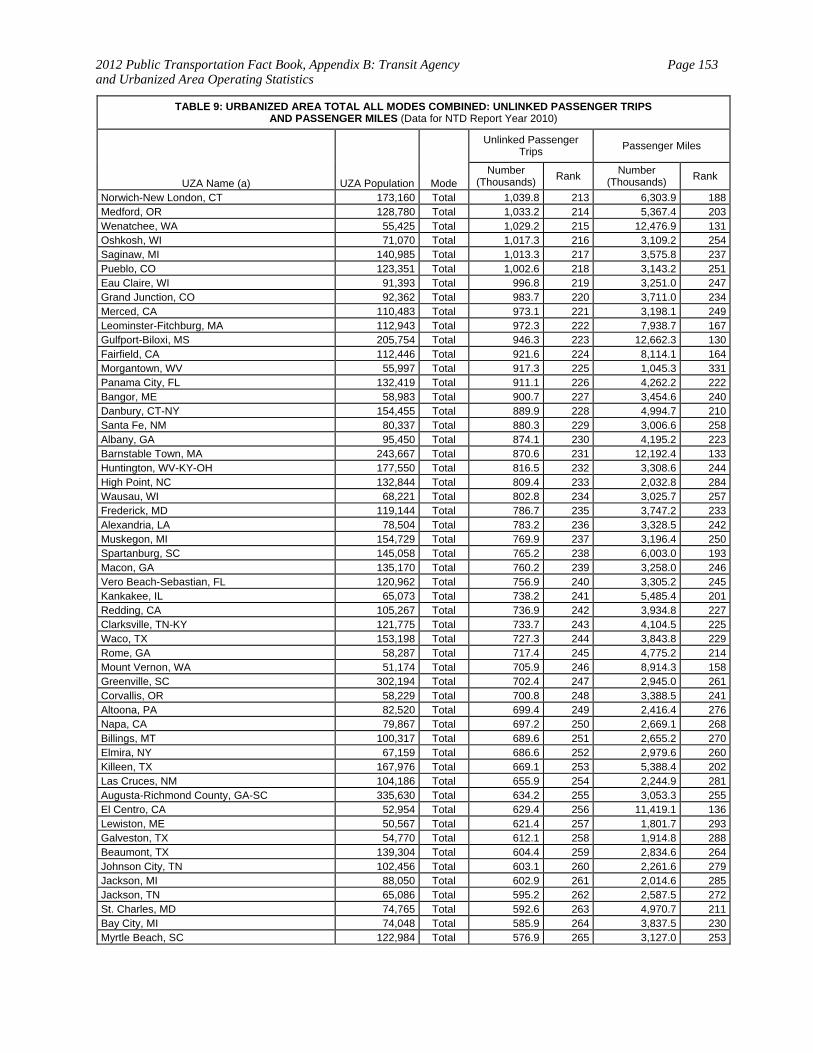
2012 Public Transportation Fact Book, Appendix B: Transit Agency and Urbanized Area Operating Statistics
Page 153
TABLE 9: URBANIZED AREA TOTAL ALL MODES COMBINED: UNLINKED PASSENGER TRIPS AND PASSENGER MILES (Data for NTD Report Year 2010)
UZA Name (a) UZA Population Mode
Unlinked Passenger Trips Passenger Miles
Number (Thousands)
Rank Number (Thousands)
Rank
Norwich-New London, CT 173,160 Total 1,039.8 213 6,303.9 188Medford, OR 128,780 Total 1,033.2 214 5,367.4 203Wenatchee, WA 55,425 Total 1,029.2 215 12,476.9 131Oshkosh, WI 71,070 Total 1,017.3 216 3,109.2 254Saginaw, MI 140,985 Total 1,013.3 217 3,575.8 237Pueblo, CO 123,351 Total 1,002.6 218 3,143.2 251Eau Claire, WI 91,393 Total 996.8 219 3,251.0 247Grand Junction, CO 92,362 Total 983.7 220 3,711.0 234Merced, CA 110,483 Total 973.1 221 3,198.1 249Leominster-Fitchburg, MA 112,943 Total 972.3 222 7,938.7 167Gulfport-Biloxi, MS 205,754 Total 946.3 223 12,662.3 130Fairfield, CA 112,446 Total 921.6 224 8,114.1 164Morgantown, WV 55,997 Total 917.3 225 1,045.3 331Panama City, FL 132,419 Total 911.1 226 4,262.2 222Bangor, ME 58,983 Total 900.7 227 3,454.6 240Danbury, CT-NY 154,455 Total 889.9 228 4,994.7 210Santa Fe, NM 80,337 Total 880.3 229 3,006.6 258Albany, GA 95,450 Total 874.1 230 4,195.2 223Barnstable Town, MA 243,667 Total 870.6 231 12,192.4 133Huntington, WV-KY-OH 177,550 Total 816.5 232 3,308.6 244High Point, NC 132,844 Total 809.4 233 2,032.8 284Wausau, WI 68,221 Total 802.8 234 3,025.7 257Frederick, MD 119,144 Total 786.7 235 3,747.2 233Alexandria, LA 78,504 Total 783.2 236 3,328.5 242Muskegon, MI 154,729 Total 769.9 237 3,196.4 250Spartanburg, SC 145,058 Total 765.2 238 6,003.0 193Macon, GA 135,170 Total 760.2 239 3,258.0 246Vero Beach-Sebastian, FL 120,962 Total 756.9 240 3,305.2 245Kankakee, IL 65,073 Total 738.2 241 5,485.4 201Redding, CA 105,267 Total 736.9 242 3,934.8 227Clarksville, TN-KY 121,775 Total 733.7 243 4,104.5 225Waco, TX 153,198 Total 727.3 244 3,843.8 229Rome, GA 58,287 Total 717.4 245 4,775.2 214Mount Vernon, WA 51,174 Total 705.9 246 8,914.3 158Greenville, SC 302,194 Total 702.4 247 2,945.0 261Corvallis, OR 58,229 Total 700.8 248 3,388.5 241Altoona, PA 82,520 Total 699.4 249 2,416.4 276Napa, CA 79,867 Total 697.2 250 2,669.1 268Billings, MT 100,317 Total 689.6 251 2,655.2 270Elmira, NY 67,159 Total 686.6 252 2,979.6 260Killeen, TX 167,976 Total 669.1 253 5,388.4 202Las Cruces, NM 104,186 Total 655.9 254 2,244.9 281Augusta-Richmond County, GA-SC 335,630 Total 634.2 255 3,053.3 255El Centro, CA 52,954 Total 629.4 256 11,419.1 136Lewiston, ME 50,567 Total 621.4 257 1,801.7 293Galveston, TX 54,770 Total 612.1 258 1,914.8 288Beaumont, TX 139,304 Total 604.4 259 2,834.6 264Johnson City, TN 102,456 Total 603.1 260 2,261.6 279Jackson, MI 88,050 Total 602.9 261 2,014.6 285Jackson, TN 65,086 Total 595.2 262 2,587.5 272St. Charles, MD 74,765 Total 592.6 263 4,970.7 211Bay City, MI 74,048 Total 585.9 264 3,837.5 230Myrtle Beach, SC 122,984 Total 576.9 265 3,127.0 253

2012 Public Transportation Fact Book, Appendix B: Transit Agency and Urbanized Area Operating Statistics
Page 154
TABLE 9: URBANIZED AREA TOTAL ALL MODES COMBINED: UNLINKED PASSENGER TRIPS AND PASSENGER MILES (Data for NTD Report Year 2010)
UZA Name (a) UZA Population Mode
Unlinked Passenger Trips Passenger Miles
Number (Thousands)
Rank Number (Thousands)
Rank
Pocatello, ID 62,498 Total 555.6 266 2,820.3 265Pittsfield, MA 52,772 Total 550.4 267 4,421.1 219Jackson, MS 292,637 Total 545.5 268 1,029.4 332Abilene, TX 107,041 Total 542.3 269 1,799.3 294Waterloo, IA 108,298 Total 541.5 270 1,099.5 328Danville, IL 53,223 Total 540.6 271 2,578.6 273Battle Creek, MI 79,135 Total 540.2 272 2,011.9 286Simi Valley, CA 112,345 Total 524.7 273 2,603.6 271Greeley, CO 93,879 Total 518.0 274 1,917.5 287Porterville, CA 60,261 Total 513.7 275 2,252.5 280Fredericksburg, VA 97,102 Total 512.4 276 3,130.8 252Sheboygan, WI 68,600 Total 505.1 277 1,354.3 309Odessa, TX 111,395 Total 488.4 278 983.5 335Nashua, NH-MA 197,155 Total 471.2 279 2,395.4 277Manchester, NH 143,549 Total 460.6 280 1,158.5 324Longview, WA-OR 60,443 Total 452.0 281 1,850.5 291Leesburg-Eustis, FL 97,497 Total 450.4 282 5,027.1 209Janesville, WI 66,034 Total 430.1 283 1,678.9 296Monessen, PA 56,508 Total 428.2 284 11,247.1 139Dover-Rochester, NH-ME 80,456 Total 416.0 285 3,239.7 248Victoria, TX 61,529 Total 409.5 286 1,855.8 290Wheeling, WV-OH 87,613 Total 406.8 287 1,133.7 326Fairbanks, AK 51,926 Total 404.8 288 3,037.0 256Lawton, OK 89,556 Total 404.4 289 1,816.9 292Lompoc, CA 55,667 Total 400.9 290 6,619.7 184Huntsville, AL 213,253 Total 388.5 291 2,384.2 278Great Falls, MT 64,387 Total 380.9 292 810.9 341Hagerstown, MD-WV-PA 120,326 Total 380.7 293 1,430.9 305Salisbury, MD-DE 59,426 Total 380.7 294 2,658.0 269Bend, OR 57,525 Total 377.4 295 175.5 359Dubuque, IA-IL 65,251 Total 373.7 296 1,190.7 320Florence, AL 71,299 Total 367.8 297 1,151.3 325Yuma, AZ-CA 94,950 Total 364.9 298 2,560.9 275Amarillo, TX 179,312 Total 360.4 299 1,579.8 298St. Joseph, MO-KS 77,231 Total 353.2 300 1,766.5 295Lebanon, PA 63,681 Total 351.3 301 2,696.2 267Grand Forks, ND-MN 56,573 Total 347.9 302 1,419.2 307San Angelo, TX 87,969 Total 347.3 303 1,606.8 297Rapid City, SD 66,780 Total 339.8 304 1,287.4 314Holland, MI 91,921 Total 336.5 305 1,544.6 301Port St. Lucie, FL 270,774 Total 326.6 306 2,226.1 282Parkersburg, WV-OH 85,605 Total 326.2 307 918.7 337Glens Falls, NY 57,627 Total 325.1 308 1,170.0 321Jefferson City, MO 53,714 Total 324.5 309 942.2 336Sumter, SC 64,320 Total 320.7 310 4,528.9 217Florence, SC 67,314 Total 306.9 311 5,913.7 196Bismarck, ND 74,991 Total 299.4 312 1,191.7 319Aberdeen-Havre de Grace-Bel Air, MD 174,598 Total 298.0 313 2,562.3 274Terre Haute, IN 79,376 Total 291.9 314 495.4 350Springfield, OH 89,684 Total 290.4 315 563.3 346Elkhart, IN-MI 131,226 Total 288.7 316 1,874.3 289Cheyenne, WY 68,202 Total 277.9 317 1,321.3 312Beloit, WI-IL 56,462 Total 272.0 318 1,086.0 329
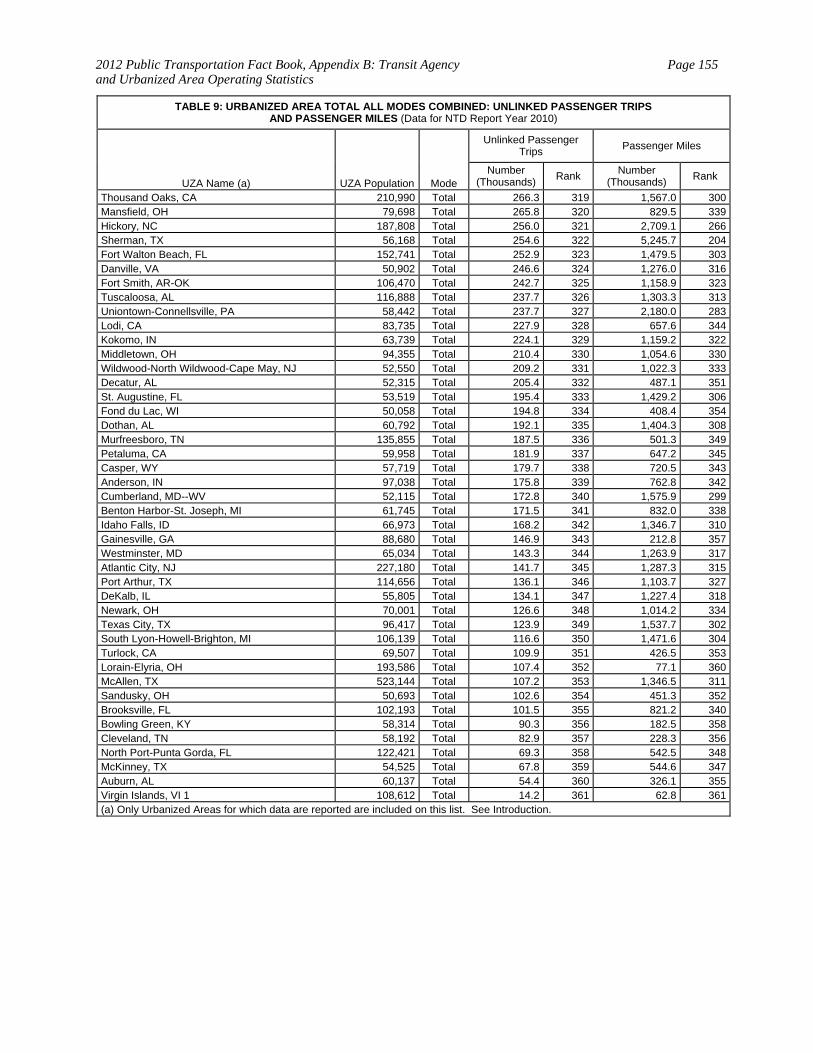
2012 Public Transportation Fact Book, Appendix B: Transit Agency and Urbanized Area Operating Statistics
Page 155
TABLE 9: URBANIZED AREA TOTAL ALL MODES COMBINED: UNLINKED PASSENGER TRIPS AND PASSENGER MILES (Data for NTD Report Year 2010)
UZA Name (a) UZA Population Mode
Unlinked Passenger Trips Passenger Miles
Number (Thousands)
Rank Number (Thousands)
Rank
Thousand Oaks, CA 210,990 Total 266.3 319 1,567.0 300Mansfield, OH 79,698 Total 265.8 320 829.5 339Hickory, NC 187,808 Total 256.0 321 2,709.1 266Sherman, TX 56,168 Total 254.6 322 5,245.7 204Fort Walton Beach, FL 152,741 Total 252.9 323 1,479.5 303Danville, VA 50,902 Total 246.6 324 1,276.0 316Fort Smith, AR-OK 106,470 Total 242.7 325 1,158.9 323Tuscaloosa, AL 116,888 Total 237.7 326 1,303.3 313Uniontown-Connellsville, PA 58,442 Total 237.7 327 2,180.0 283Lodi, CA 83,735 Total 227.9 328 657.6 344Kokomo, IN 63,739 Total 224.1 329 1,159.2 322Middletown, OH 94,355 Total 210.4 330 1,054.6 330Wildwood-North Wildwood-Cape May, NJ 52,550 Total 209.2 331 1,022.3 333Decatur, AL 52,315 Total 205.4 332 487.1 351St. Augustine, FL 53,519 Total 195.4 333 1,429.2 306Fond du Lac, WI 50,058 Total 194.8 334 408.4 354Dothan, AL 60,792 Total 192.1 335 1,404.3 308Murfreesboro, TN 135,855 Total 187.5 336 501.3 349Petaluma, CA 59,958 Total 181.9 337 647.2 345Casper, WY 57,719 Total 179.7 338 720.5 343Anderson, IN 97,038 Total 175.8 339 762.8 342Cumberland, MD--WV 52,115 Total 172.8 340 1,575.9 299Benton Harbor-St. Joseph, MI 61,745 Total 171.5 341 832.0 338Idaho Falls, ID 66,973 Total 168.2 342 1,346.7 310Gainesville, GA 88,680 Total 146.9 343 212.8 357Westminster, MD 65,034 Total 143.3 344 1,263.9 317Atlantic City, NJ 227,180 Total 141.7 345 1,287.3 315Port Arthur, TX 114,656 Total 136.1 346 1,103.7 327DeKalb, IL 55,805 Total 134.1 347 1,227.4 318Newark, OH 70,001 Total 126.6 348 1,014.2 334Texas City, TX 96,417 Total 123.9 349 1,537.7 302South Lyon-Howell-Brighton, MI 106,139 Total 116.6 350 1,471.6 304Turlock, CA 69,507 Total 109.9 351 426.5 353Lorain-Elyria, OH 193,586 Total 107.4 352 77.1 360McAllen, TX 523,144 Total 107.2 353 1,346.5 311Sandusky, OH 50,693 Total 102.6 354 451.3 352Brooksville, FL 102,193 Total 101.5 355 821.2 340Bowling Green, KY 58,314 Total 90.3 356 182.5 358Cleveland, TN 58,192 Total 82.9 357 228.3 356North Port-Punta Gorda, FL 122,421 Total 69.3 358 542.5 348McKinney, TX 54,525 Total 67.8 359 544.6 347Auburn, AL 60,137 Total 54.4 360 326.1 355Virgin Islands, VI 1 108,612 Total 14.2 361 62.8 361(a) Only Urbanized Areas for which data are reported are included on this list. See Introduction.
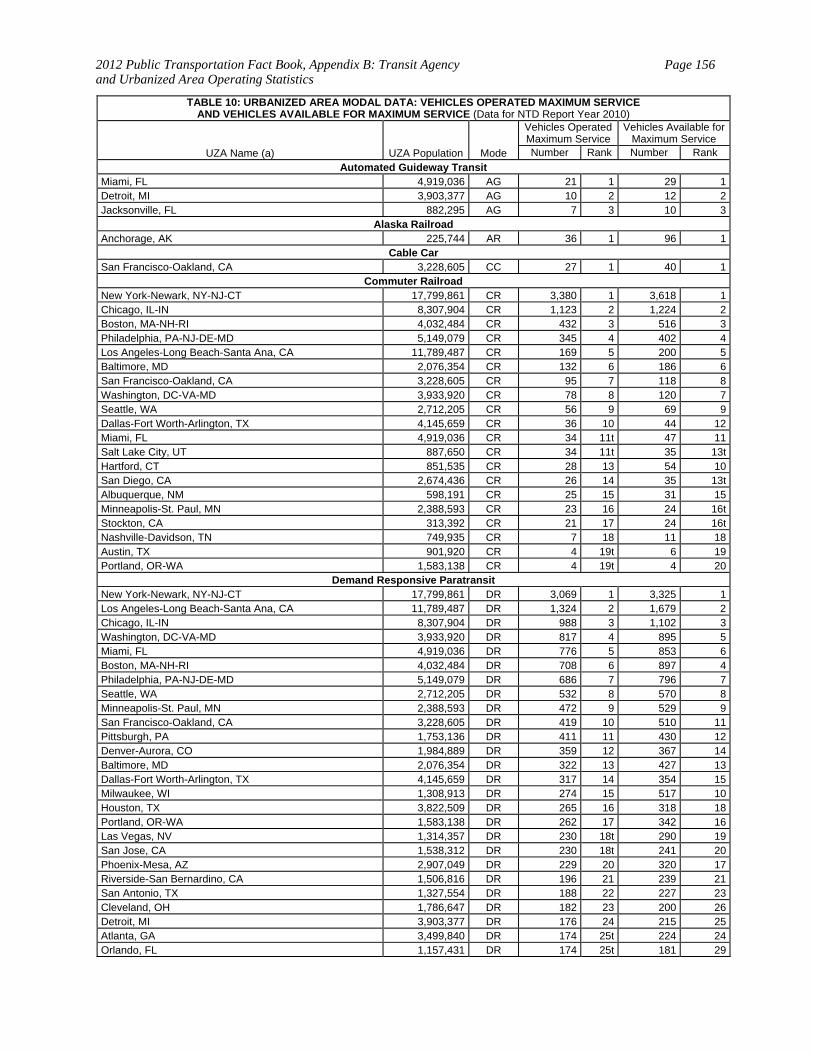
2012 Public Transportation Fact Book, Appendix B: Transit Agency and Urbanized Area Operating Statistics
Page 156
TABLE 10: URBANIZED AREA MODAL DATA: VEHICLES OPERATED MAXIMUM SERVICE AND VEHICLES AVAILABLE FOR MAXIMUM SERVICE (Data for NTD Report Year 2010)
UZA Name (a) UZA Population Mode
Vehicles Operated Maximum Service
Vehicles Available for Maximum Service
Number Rank Number Rank
Automated Guideway Transit Miami, FL 4,919,036 AG 21 1 29 1Detroit, MI 3,903,377 AG 10 2 12 2Jacksonville, FL 882,295 AG 7 3 10 3
Alaska Railroad Anchorage, AK 225,744 AR 36 1 96 1
Cable Car San Francisco-Oakland, CA 3,228,605 CC 27 1 40 1
Commuter Railroad New York-Newark, NY-NJ-CT 17,799,861 CR 3,380 1 3,618 1Chicago, IL-IN 8,307,904 CR 1,123 2 1,224 2Boston, MA-NH-RI 4,032,484 CR 432 3 516 3Philadelphia, PA-NJ-DE-MD 5,149,079 CR 345 4 402 4Los Angeles-Long Beach-Santa Ana, CA 11,789,487 CR 169 5 200 5Baltimore, MD 2,076,354 CR 132 6 186 6San Francisco-Oakland, CA 3,228,605 CR 95 7 118 8Washington, DC-VA-MD 3,933,920 CR 78 8 120 7Seattle, WA 2,712,205 CR 56 9 69 9Dallas-Fort Worth-Arlington, TX 4,145,659 CR 36 10 44 12Miami, FL 4,919,036 CR 34 11t 47 11Salt Lake City, UT 887,650 CR 34 11t 35 13tHartford, CT 851,535 CR 28 13 54 10San Diego, CA 2,674,436 CR 26 14 35 13tAlbuquerque, NM 598,191 CR 25 15 31 15Minneapolis-St. Paul, MN 2,388,593 CR 23 16 24 16tStockton, CA 313,392 CR 21 17 24 16tNashville-Davidson, TN 749,935 CR 7 18 11 18Austin, TX 901,920 CR 4 19t 6 19Portland, OR-WA 1,583,138 CR 4 19t 4 20
Demand Responsive Paratransit New York-Newark, NY-NJ-CT 17,799,861 DR 3,069 1 3,325 1Los Angeles-Long Beach-Santa Ana, CA 11,789,487 DR 1,324 2 1,679 2Chicago, IL-IN 8,307,904 DR 988 3 1,102 3Washington, DC-VA-MD 3,933,920 DR 817 4 895 5Miami, FL 4,919,036 DR 776 5 853 6Boston, MA-NH-RI 4,032,484 DR 708 6 897 4Philadelphia, PA-NJ-DE-MD 5,149,079 DR 686 7 796 7Seattle, WA 2,712,205 DR 532 8 570 8Minneapolis-St. Paul, MN 2,388,593 DR 472 9 529 9San Francisco-Oakland, CA 3,228,605 DR 419 10 510 11Pittsburgh, PA 1,753,136 DR 411 11 430 12Denver-Aurora, CO 1,984,889 DR 359 12 367 14Baltimore, MD 2,076,354 DR 322 13 427 13Dallas-Fort Worth-Arlington, TX 4,145,659 DR 317 14 354 15Milwaukee, WI 1,308,913 DR 274 15 517 10Houston, TX 3,822,509 DR 265 16 318 18Portland, OR-WA 1,583,138 DR 262 17 342 16Las Vegas, NV 1,314,357 DR 230 18t 290 19San Jose, CA 1,538,312 DR 230 18t 241 20Phoenix-Mesa, AZ 2,907,049 DR 229 20 320 17Riverside-San Bernardino, CA 1,506,816 DR 196 21 239 21San Antonio, TX 1,327,554 DR 188 22 227 23Cleveland, OH 1,786,647 DR 182 23 200 26Detroit, MI 3,903,377 DR 176 24 215 25Atlanta, GA 3,499,840 DR 174 25t 224 24Orlando, FL 1,157,431 DR 174 25t 181 29
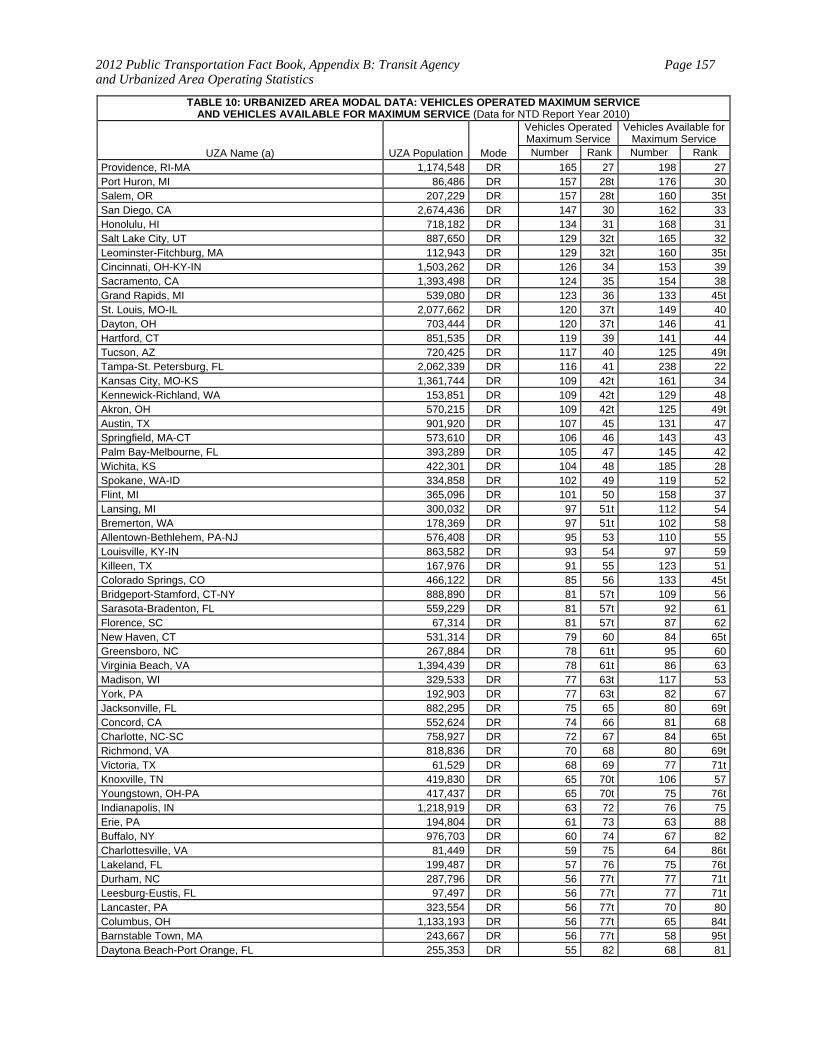
2012 Public Transportation Fact Book, Appendix B: Transit Agency and Urbanized Area Operating Statistics
Page 157
TABLE 10: URBANIZED AREA MODAL DATA: VEHICLES OPERATED MAXIMUM SERVICE AND VEHICLES AVAILABLE FOR MAXIMUM SERVICE (Data for NTD Report Year 2010)
UZA Name (a) UZA Population Mode
Vehicles Operated Maximum Service
Vehicles Available for Maximum Service
Number Rank Number Rank
Providence, RI-MA 1,174,548 DR 165 27 198 27Port Huron, MI 86,486 DR 157 28t 176 30Salem, OR 207,229 DR 157 28t 160 35tSan Diego, CA 2,674,436 DR 147 30 162 33Honolulu, HI 718,182 DR 134 31 168 31Salt Lake City, UT 887,650 DR 129 32t 165 32Leominster-Fitchburg, MA 112,943 DR 129 32t 160 35tCincinnati, OH-KY-IN 1,503,262 DR 126 34 153 39Sacramento, CA 1,393,498 DR 124 35 154 38Grand Rapids, MI 539,080 DR 123 36 133 45tSt. Louis, MO-IL 2,077,662 DR 120 37t 149 40Dayton, OH 703,444 DR 120 37t 146 41Hartford, CT 851,535 DR 119 39 141 44Tucson, AZ 720,425 DR 117 40 125 49tTampa-St. Petersburg, FL 2,062,339 DR 116 41 238 22Kansas City, MO-KS 1,361,744 DR 109 42t 161 34Kennewick-Richland, WA 153,851 DR 109 42t 129 48Akron, OH 570,215 DR 109 42t 125 49tAustin, TX 901,920 DR 107 45 131 47Springfield, MA-CT 573,610 DR 106 46 143 43Palm Bay-Melbourne, FL 393,289 DR 105 47 145 42Wichita, KS 422,301 DR 104 48 185 28Spokane, WA-ID 334,858 DR 102 49 119 52Flint, MI 365,096 DR 101 50 158 37Lansing, MI 300,032 DR 97 51t 112 54Bremerton, WA 178,369 DR 97 51t 102 58Allentown-Bethlehem, PA-NJ 576,408 DR 95 53 110 55Louisville, KY-IN 863,582 DR 93 54 97 59Killeen, TX 167,976 DR 91 55 123 51Colorado Springs, CO 466,122 DR 85 56 133 45tBridgeport-Stamford, CT-NY 888,890 DR 81 57t 109 56Sarasota-Bradenton, FL 559,229 DR 81 57t 92 61Florence, SC 67,314 DR 81 57t 87 62New Haven, CT 531,314 DR 79 60 84 65tGreensboro, NC 267,884 DR 78 61t 95 60Virginia Beach, VA 1,394,439 DR 78 61t 86 63Madison, WI 329,533 DR 77 63t 117 53York, PA 192,903 DR 77 63t 82 67Jacksonville, FL 882,295 DR 75 65 80 69tConcord, CA 552,624 DR 74 66 81 68Charlotte, NC-SC 758,927 DR 72 67 84 65tRichmond, VA 818,836 DR 70 68 80 69tVictoria, TX 61,529 DR 68 69 77 71tKnoxville, TN 419,830 DR 65 70t 106 57Youngstown, OH-PA 417,437 DR 65 70t 75 76tIndianapolis, IN 1,218,919 DR 63 72 76 75Erie, PA 194,804 DR 61 73 63 88Buffalo, NY 976,703 DR 60 74 67 82Charlottesville, VA 81,449 DR 59 75 64 86tLakeland, FL 199,487 DR 57 76 75 76tDurham, NC 287,796 DR 56 77t 77 71tLeesburg-Eustis, FL 97,497 DR 56 77t 77 71tLancaster, PA 323,554 DR 56 77t 70 80Columbus, OH 1,133,193 DR 56 77t 65 84tBarnstable Town, MA 243,667 DR 56 77t 58 95tDaytona Beach-Port Orange, FL 255,353 DR 55 82 68 81
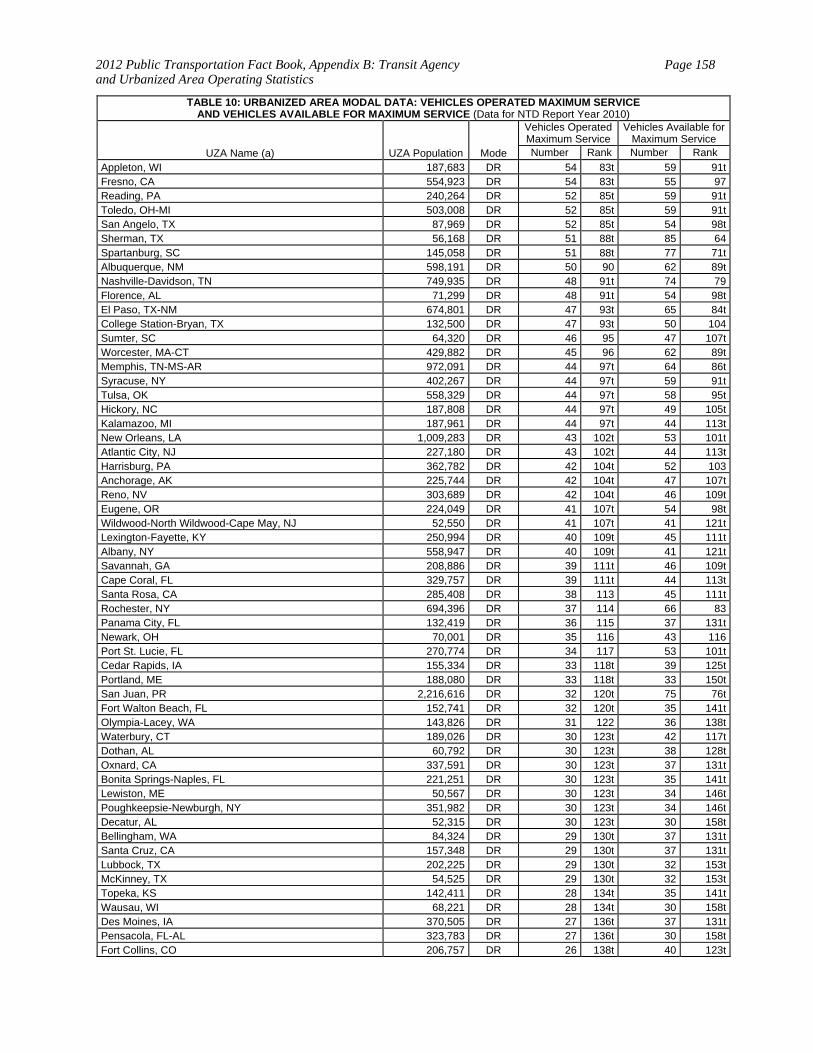
2012 Public Transportation Fact Book, Appendix B: Transit Agency and Urbanized Area Operating Statistics
Page 158
TABLE 10: URBANIZED AREA MODAL DATA: VEHICLES OPERATED MAXIMUM SERVICE AND VEHICLES AVAILABLE FOR MAXIMUM SERVICE (Data for NTD Report Year 2010)
UZA Name (a) UZA Population Mode
Vehicles Operated Maximum Service
Vehicles Available for Maximum Service
Number Rank Number Rank
Appleton, WI 187,683 DR 54 83t 59 91tFresno, CA 554,923 DR 54 83t 55 97Reading, PA 240,264 DR 52 85t 59 91tToledo, OH-MI 503,008 DR 52 85t 59 91tSan Angelo, TX 87,969 DR 52 85t 54 98tSherman, TX 56,168 DR 51 88t 85 64Spartanburg, SC 145,058 DR 51 88t 77 71tAlbuquerque, NM 598,191 DR 50 90 62 89tNashville-Davidson, TN 749,935 DR 48 91t 74 79Florence, AL 71,299 DR 48 91t 54 98tEl Paso, TX-NM 674,801 DR 47 93t 65 84tCollege Station-Bryan, TX 132,500 DR 47 93t 50 104Sumter, SC 64,320 DR 46 95 47 107tWorcester, MA-CT 429,882 DR 45 96 62 89tMemphis, TN-MS-AR 972,091 DR 44 97t 64 86tSyracuse, NY 402,267 DR 44 97t 59 91tTulsa, OK 558,329 DR 44 97t 58 95tHickory, NC 187,808 DR 44 97t 49 105tKalamazoo, MI 187,961 DR 44 97t 44 113tNew Orleans, LA 1,009,283 DR 43 102t 53 101tAtlantic City, NJ 227,180 DR 43 102t 44 113tHarrisburg, PA 362,782 DR 42 104t 52 103Anchorage, AK 225,744 DR 42 104t 47 107tReno, NV 303,689 DR 42 104t 46 109tEugene, OR 224,049 DR 41 107t 54 98tWildwood-North Wildwood-Cape May, NJ 52,550 DR 41 107t 41 121tLexington-Fayette, KY 250,994 DR 40 109t 45 111tAlbany, NY 558,947 DR 40 109t 41 121tSavannah, GA 208,886 DR 39 111t 46 109tCape Coral, FL 329,757 DR 39 111t 44 113tSanta Rosa, CA 285,408 DR 38 113 45 111tRochester, NY 694,396 DR 37 114 66 83Panama City, FL 132,419 DR 36 115 37 131tNewark, OH 70,001 DR 35 116 43 116Port St. Lucie, FL 270,774 DR 34 117 53 101tCedar Rapids, IA 155,334 DR 33 118t 39 125tPortland, ME 188,080 DR 33 118t 33 150tSan Juan, PR 2,216,616 DR 32 120t 75 76tFort Walton Beach, FL 152,741 DR 32 120t 35 141tOlympia-Lacey, WA 143,826 DR 31 122 36 138tWaterbury, CT 189,026 DR 30 123t 42 117tDothan, AL 60,792 DR 30 123t 38 128tOxnard, CA 337,591 DR 30 123t 37 131tBonita Springs-Naples, FL 221,251 DR 30 123t 35 141tLewiston, ME 50,567 DR 30 123t 34 146tPoughkeepsie-Newburgh, NY 351,982 DR 30 123t 34 146tDecatur, AL 52,315 DR 30 123t 30 158tBellingham, WA 84,324 DR 29 130t 37 131tSanta Cruz, CA 157,348 DR 29 130t 37 131tLubbock, TX 202,225 DR 29 130t 32 153tMcKinney, TX 54,525 DR 29 130t 32 153tTopeka, KS 142,411 DR 28 134t 35 141tWausau, WI 68,221 DR 28 134t 30 158tDes Moines, IA 370,505 DR 27 136t 37 131tPensacola, FL-AL 323,783 DR 27 136t 30 158tFort Collins, CO 206,757 DR 26 138t 40 123t
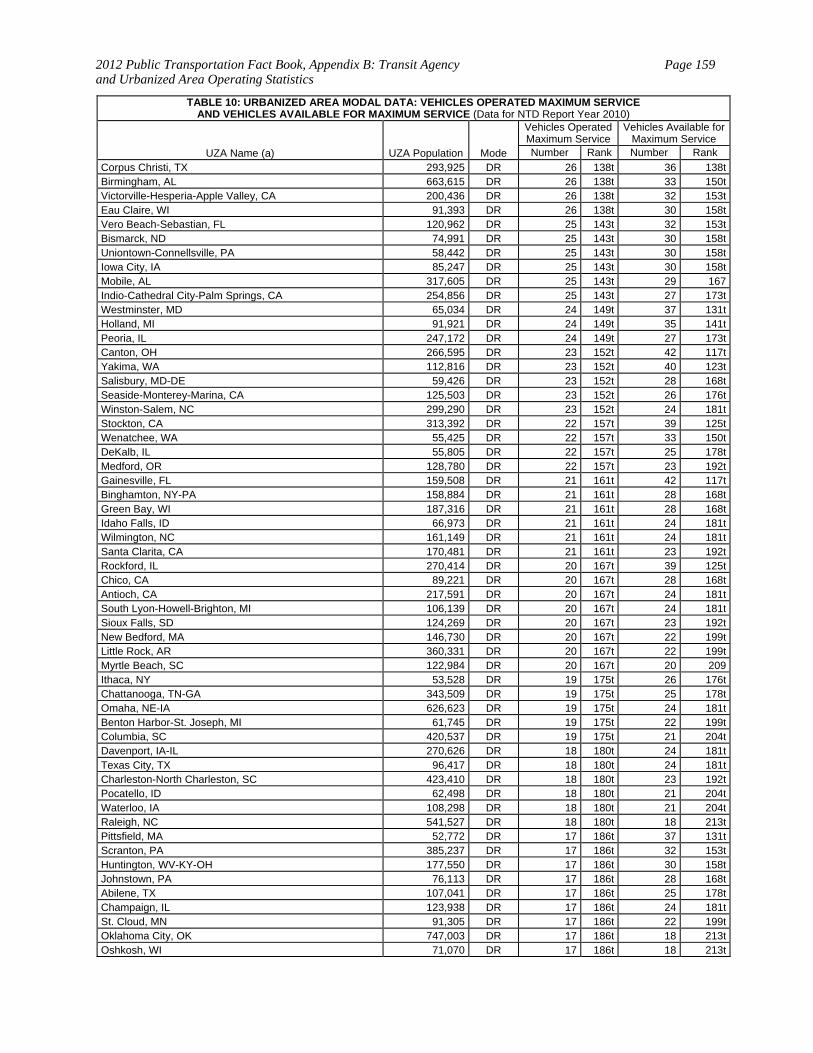
2012 Public Transportation Fact Book, Appendix B: Transit Agency and Urbanized Area Operating Statistics
Page 159
TABLE 10: URBANIZED AREA MODAL DATA: VEHICLES OPERATED MAXIMUM SERVICE AND VEHICLES AVAILABLE FOR MAXIMUM SERVICE (Data for NTD Report Year 2010)
UZA Name (a) UZA Population Mode
Vehicles Operated Maximum Service
Vehicles Available for Maximum Service
Number Rank Number Rank
Corpus Christi, TX 293,925 DR 26 138t 36 138tBirmingham, AL 663,615 DR 26 138t 33 150tVictorville-Hesperia-Apple Valley, CA 200,436 DR 26 138t 32 153tEau Claire, WI 91,393 DR 26 138t 30 158tVero Beach-Sebastian, FL 120,962 DR 25 143t 32 153tBismarck, ND 74,991 DR 25 143t 30 158tUniontown-Connellsville, PA 58,442 DR 25 143t 30 158tIowa City, IA 85,247 DR 25 143t 30 158tMobile, AL 317,605 DR 25 143t 29 167Indio-Cathedral City-Palm Springs, CA 254,856 DR 25 143t 27 173tWestminster, MD 65,034 DR 24 149t 37 131tHolland, MI 91,921 DR 24 149t 35 141tPeoria, IL 247,172 DR 24 149t 27 173tCanton, OH 266,595 DR 23 152t 42 117tYakima, WA 112,816 DR 23 152t 40 123tSalisbury, MD-DE 59,426 DR 23 152t 28 168tSeaside-Monterey-Marina, CA 125,503 DR 23 152t 26 176tWinston-Salem, NC 299,290 DR 23 152t 24 181tStockton, CA 313,392 DR 22 157t 39 125tWenatchee, WA 55,425 DR 22 157t 33 150tDeKalb, IL 55,805 DR 22 157t 25 178tMedford, OR 128,780 DR 22 157t 23 192tGainesville, FL 159,508 DR 21 161t 42 117tBinghamton, NY-PA 158,884 DR 21 161t 28 168tGreen Bay, WI 187,316 DR 21 161t 28 168tIdaho Falls, ID 66,973 DR 21 161t 24 181tWilmington, NC 161,149 DR 21 161t 24 181tSanta Clarita, CA 170,481 DR 21 161t 23 192tRockford, IL 270,414 DR 20 167t 39 125tChico, CA 89,221 DR 20 167t 28 168tAntioch, CA 217,591 DR 20 167t 24 181tSouth Lyon-Howell-Brighton, MI 106,139 DR 20 167t 24 181tSioux Falls, SD 124,269 DR 20 167t 23 192tNew Bedford, MA 146,730 DR 20 167t 22 199tLittle Rock, AR 360,331 DR 20 167t 22 199tMyrtle Beach, SC 122,984 DR 20 167t 20 209Ithaca, NY 53,528 DR 19 175t 26 176tChattanooga, TN-GA 343,509 DR 19 175t 25 178tOmaha, NE-IA 626,623 DR 19 175t 24 181tBenton Harbor-St. Joseph, MI 61,745 DR 19 175t 22 199tColumbia, SC 420,537 DR 19 175t 21 204tDavenport, IA-IL 270,626 DR 18 180t 24 181tTexas City, TX 96,417 DR 18 180t 24 181tCharleston-North Charleston, SC 423,410 DR 18 180t 23 192tPocatello, ID 62,498 DR 18 180t 21 204tWaterloo, IA 108,298 DR 18 180t 21 204tRaleigh, NC 541,527 DR 18 180t 18 213tPittsfield, MA 52,772 DR 17 186t 37 131tScranton, PA 385,237 DR 17 186t 32 153tHuntington, WV-KY-OH 177,550 DR 17 186t 30 158tJohnstown, PA 76,113 DR 17 186t 28 168tAbilene, TX 107,041 DR 17 186t 25 178tChampaign, IL 123,938 DR 17 186t 24 181tSt. Cloud, MN 91,305 DR 17 186t 22 199tOklahoma City, OK 747,003 DR 17 186t 18 213tOshkosh, WI 71,070 DR 17 186t 18 213t

2012 Public Transportation Fact Book, Appendix B: Transit Agency and Urbanized Area Operating Statistics
Page 160
TABLE 10: URBANIZED AREA MODAL DATA: VEHICLES OPERATED MAXIMUM SERVICE AND VEHICLES AVAILABLE FOR MAXIMUM SERVICE (Data for NTD Report Year 2010)
UZA Name (a) UZA Population Mode
Vehicles Operated Maximum Service
Vehicles Available for Maximum Service
Number Rank Number Rank
Roanoke, VA 197,442 DR 16 195t 49 105tMerced, CA 110,483 DR 16 195t 38 128tJackson, MI 88,050 DR 16 195t 36 138tDanbury, CT-NY 154,455 DR 16 195t 34 146tFrederick, MD 119,144 DR 16 195t 30 158tRedding, CA 105,267 DR 16 195t 23 192tBurlington, VT 105,365 DR 16 195t 22 199tMount Vernon, WA 51,174 DR 16 195t 21 204tBaton Rouge, LA 479,019 DR 16 195t 21 204tBakersfield, CA 396,125 DR 16 195t 19 210tSanta Barbara, CA 196,263 DR 16 195t 17 222tAnn Arbor, MI 283,904 DR 15 206t 27 173tHuntsville, AL 213,253 DR 15 206t 24 181tAuburn, AL 60,137 DR 15 206t 24 181tBrooksville, FL 102,193 DR 15 206t 23 192tThousand Oaks, CA 210,990 DR 15 206t 18 213tBay City, MI 74,048 DR 15 206t 16 230tMurfreesboro, TN 135,855 DR 15 206t 15 234tMuskegon, MI 154,729 DR 14 213t 18 213tLaredo, TX 175,586 DR 14 213t 18 213tSanta Fe, NM 80,337 DR 14 213t 18 213tAberdeen-Havre de Grace-Bel Air, MD 174,598 DR 14 213t 18 213tSandusky, OH 50,693 DR 14 213t 17 222tLa Crosse, WI-MN 89,966 DR 14 213t 17 222tGulfport-Biloxi, MS 205,754 DR 14 213t 17 222tAltoona, PA 82,520 DR 13 220t 38 128tNorth Port-Punta Gorda, FL 122,421 DR 13 220t 23 192tTallahassee, FL 204,260 DR 13 220t 17 222tFargo, ND-MN 142,477 DR 13 220t 17 222tNapa, CA 79,867 DR 13 220t 15 234tLebanon, PA 63,681 DR 13 220t 14 241tFayetteville-Springdale, AR 172,585 DR 12 226t 35 141tLas Cruces, NM 104,186 DR 12 226t 19 210tRapid City, SD 66,780 DR 12 226t 17 222tModesto, CA 310,945 DR 12 226t 14 241tKokomo, IN 63,739 DR 12 226t 14 241tCharleston, WV 182,991 DR 12 226t 14 241tSan Luis Obispo, CA 53,498 DR 12 226t 14 241tSimi Valley, CA 112,345 DR 12 226t 13 252tEvansville, IN-KY 211,989 DR 12 226t 13 252tBoise City, ID 272,625 DR 12 226t 13 252tElkhart, IN-MI 131,226 DR 11 236t 17 222tLancaster-Palmdale, CA 263,532 DR 11 236t 16 230tBillings, MT 100,317 DR 11 236t 15 234tJohnson City, TN 102,456 DR 11 236t 15 234tLawrence, KS 79,647 DR 11 236t 14 241tSouth Bend, IN-MI 276,498 DR 11 236t 14 241tYuma, AZ-CA 94,950 DR 11 236t 13 252tGrand Forks, ND-MN 56,573 DR 11 236t 12 262tPueblo, CO 123,351 DR 11 236t 12 262tDenton-Lewisville, TX 299,823 DR 11 236t 12 262tLongview, WA-OR 60,443 DR 11 236t 11 269tLynchburg, VA 98,714 DR 11 236t 11 269tSpringfield, IL 153,516 DR 10 248t 19 210tLodi, CA 83,735 DR 10 248t 16 230tYuba City, CA 97,645 DR 10 248t 15 234t
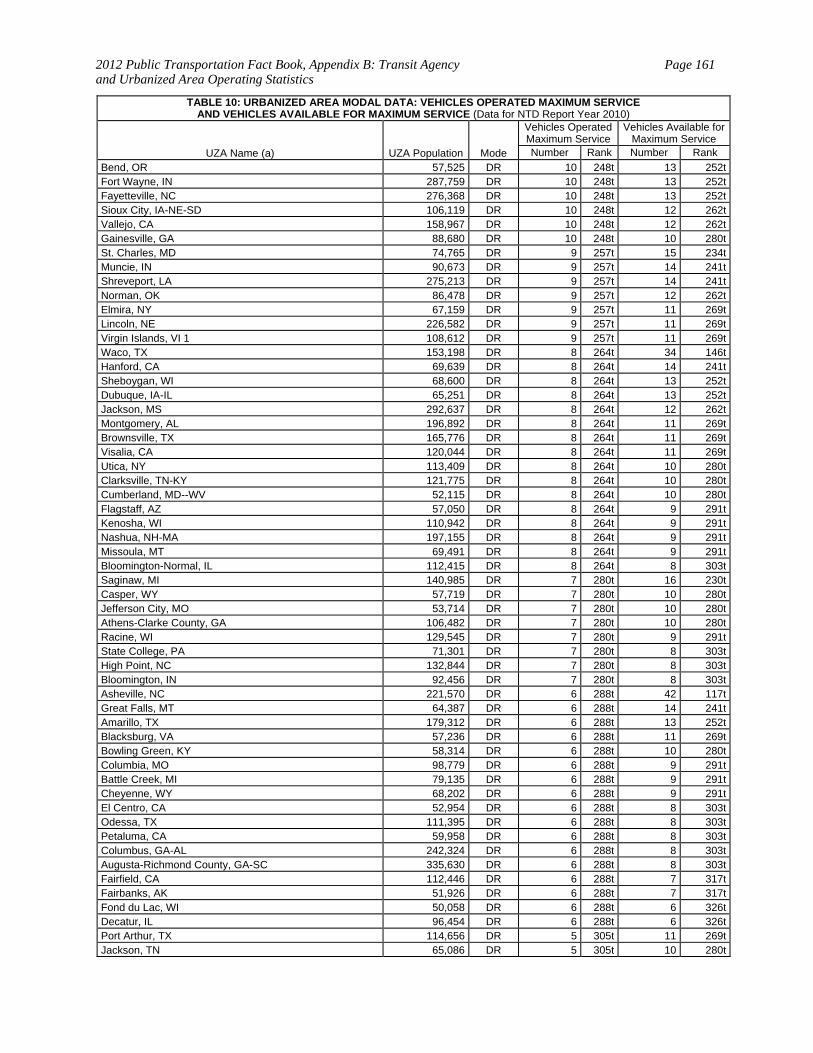
2012 Public Transportation Fact Book, Appendix B: Transit Agency and Urbanized Area Operating Statistics
Page 161
TABLE 10: URBANIZED AREA MODAL DATA: VEHICLES OPERATED MAXIMUM SERVICE AND VEHICLES AVAILABLE FOR MAXIMUM SERVICE (Data for NTD Report Year 2010)
UZA Name (a) UZA Population Mode
Vehicles Operated Maximum Service
Vehicles Available for Maximum Service
Number Rank Number Rank
Bend, OR 57,525 DR 10 248t 13 252tFort Wayne, IN 287,759 DR 10 248t 13 252tFayetteville, NC 276,368 DR 10 248t 13 252tSioux City, IA-NE-SD 106,119 DR 10 248t 12 262tVallejo, CA 158,967 DR 10 248t 12 262tGainesville, GA 88,680 DR 10 248t 10 280tSt. Charles, MD 74,765 DR 9 257t 15 234tMuncie, IN 90,673 DR 9 257t 14 241tShreveport, LA 275,213 DR 9 257t 14 241tNorman, OK 86,478 DR 9 257t 12 262tElmira, NY 67,159 DR 9 257t 11 269tLincoln, NE 226,582 DR 9 257t 11 269tVirgin Islands, VI 1 108,612 DR 9 257t 11 269tWaco, TX 153,198 DR 8 264t 34 146tHanford, CA 69,639 DR 8 264t 14 241tSheboygan, WI 68,600 DR 8 264t 13 252tDubuque, IA-IL 65,251 DR 8 264t 13 252tJackson, MS 292,637 DR 8 264t 12 262tMontgomery, AL 196,892 DR 8 264t 11 269tBrownsville, TX 165,776 DR 8 264t 11 269tVisalia, CA 120,044 DR 8 264t 11 269tUtica, NY 113,409 DR 8 264t 10 280tClarksville, TN-KY 121,775 DR 8 264t 10 280tCumberland, MD--WV 52,115 DR 8 264t 10 280tFlagstaff, AZ 57,050 DR 8 264t 9 291tKenosha, WI 110,942 DR 8 264t 9 291tNashua, NH-MA 197,155 DR 8 264t 9 291tMissoula, MT 69,491 DR 8 264t 9 291tBloomington-Normal, IL 112,415 DR 8 264t 8 303tSaginaw, MI 140,985 DR 7 280t 16 230tCasper, WY 57,719 DR 7 280t 10 280tJefferson City, MO 53,714 DR 7 280t 10 280tAthens-Clarke County, GA 106,482 DR 7 280t 10 280tRacine, WI 129,545 DR 7 280t 9 291tState College, PA 71,301 DR 7 280t 8 303tHigh Point, NC 132,844 DR 7 280t 8 303tBloomington, IN 92,456 DR 7 280t 8 303tAsheville, NC 221,570 DR 6 288t 42 117tGreat Falls, MT 64,387 DR 6 288t 14 241tAmarillo, TX 179,312 DR 6 288t 13 252tBlacksburg, VA 57,236 DR 6 288t 11 269tBowling Green, KY 58,314 DR 6 288t 10 280tColumbia, MO 98,779 DR 6 288t 9 291tBattle Creek, MI 79,135 DR 6 288t 9 291tCheyenne, WY 68,202 DR 6 288t 9 291tEl Centro, CA 52,954 DR 6 288t 8 303tOdessa, TX 111,395 DR 6 288t 8 303tPetaluma, CA 59,958 DR 6 288t 8 303tColumbus, GA-AL 242,324 DR 6 288t 8 303tAugusta-Richmond County, GA-SC 335,630 DR 6 288t 8 303tFairfield, CA 112,446 DR 6 288t 7 317tFairbanks, AK 51,926 DR 6 288t 7 317tFond du Lac, WI 50,058 DR 6 288t 6 326tDecatur, IL 96,454 DR 6 288t 6 326tPort Arthur, TX 114,656 DR 5 305t 11 269tJackson, TN 65,086 DR 5 305t 10 280t
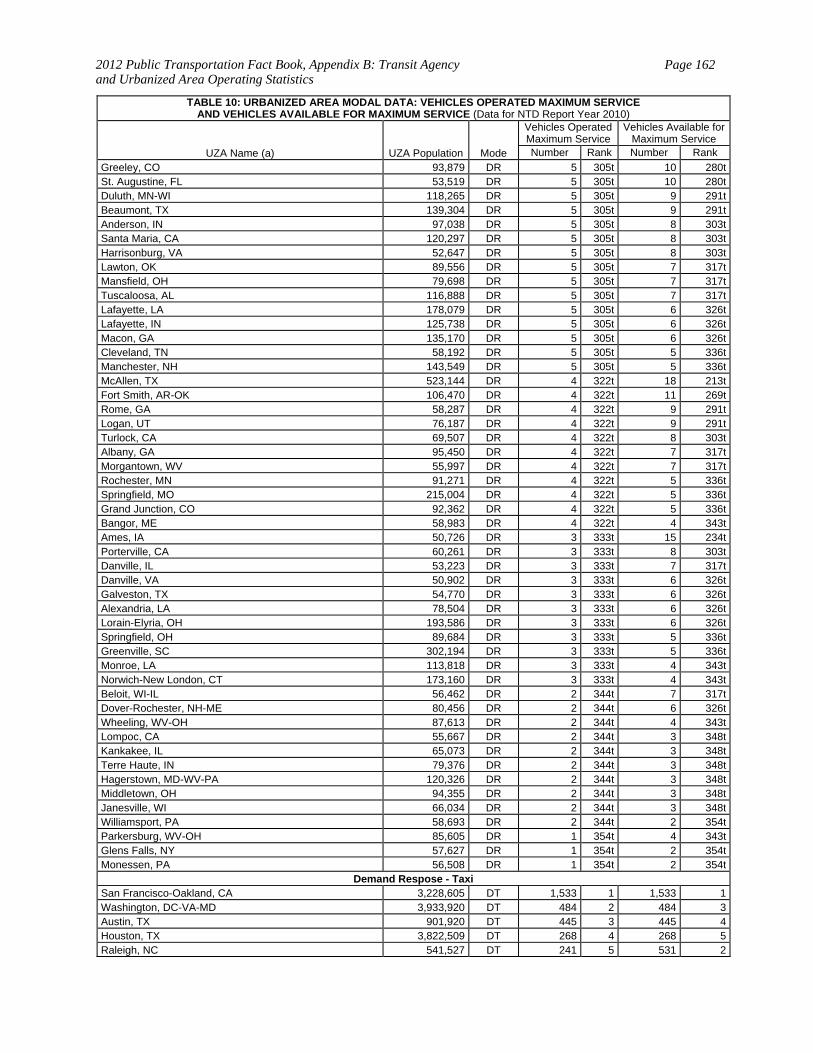
2012 Public Transportation Fact Book, Appendix B: Transit Agency and Urbanized Area Operating Statistics
Page 162
TABLE 10: URBANIZED AREA MODAL DATA: VEHICLES OPERATED MAXIMUM SERVICE AND VEHICLES AVAILABLE FOR MAXIMUM SERVICE (Data for NTD Report Year 2010)
UZA Name (a) UZA Population Mode
Vehicles Operated Maximum Service
Vehicles Available for Maximum Service
Number Rank Number Rank
Greeley, CO 93,879 DR 5 305t 10 280tSt. Augustine, FL 53,519 DR 5 305t 10 280tDuluth, MN-WI 118,265 DR 5 305t 9 291tBeaumont, TX 139,304 DR 5 305t 9 291tAnderson, IN 97,038 DR 5 305t 8 303tSanta Maria, CA 120,297 DR 5 305t 8 303tHarrisonburg, VA 52,647 DR 5 305t 8 303tLawton, OK 89,556 DR 5 305t 7 317tMansfield, OH 79,698 DR 5 305t 7 317tTuscaloosa, AL 116,888 DR 5 305t 7 317tLafayette, LA 178,079 DR 5 305t 6 326tLafayette, IN 125,738 DR 5 305t 6 326tMacon, GA 135,170 DR 5 305t 6 326tCleveland, TN 58,192 DR 5 305t 5 336tManchester, NH 143,549 DR 5 305t 5 336tMcAllen, TX 523,144 DR 4 322t 18 213tFort Smith, AR-OK 106,470 DR 4 322t 11 269tRome, GA 58,287 DR 4 322t 9 291tLogan, UT 76,187 DR 4 322t 9 291tTurlock, CA 69,507 DR 4 322t 8 303tAlbany, GA 95,450 DR 4 322t 7 317tMorgantown, WV 55,997 DR 4 322t 7 317tRochester, MN 91,271 DR 4 322t 5 336tSpringfield, MO 215,004 DR 4 322t 5 336tGrand Junction, CO 92,362 DR 4 322t 5 336tBangor, ME 58,983 DR 4 322t 4 343tAmes, IA 50,726 DR 3 333t 15 234tPorterville, CA 60,261 DR 3 333t 8 303tDanville, IL 53,223 DR 3 333t 7 317tDanville, VA 50,902 DR 3 333t 6 326tGalveston, TX 54,770 DR 3 333t 6 326tAlexandria, LA 78,504 DR 3 333t 6 326tLorain-Elyria, OH 193,586 DR 3 333t 6 326tSpringfield, OH 89,684 DR 3 333t 5 336tGreenville, SC 302,194 DR 3 333t 5 336tMonroe, LA 113,818 DR 3 333t 4 343tNorwich-New London, CT 173,160 DR 3 333t 4 343tBeloit, WI-IL 56,462 DR 2 344t 7 317tDover-Rochester, NH-ME 80,456 DR 2 344t 6 326tWheeling, WV-OH 87,613 DR 2 344t 4 343tLompoc, CA 55,667 DR 2 344t 3 348tKankakee, IL 65,073 DR 2 344t 3 348tTerre Haute, IN 79,376 DR 2 344t 3 348tHagerstown, MD-WV-PA 120,326 DR 2 344t 3 348tMiddletown, OH 94,355 DR 2 344t 3 348tJanesville, WI 66,034 DR 2 344t 3 348tWilliamsport, PA 58,693 DR 2 344t 2 354tParkersburg, WV-OH 85,605 DR 1 354t 4 343tGlens Falls, NY 57,627 DR 1 354t 2 354tMonessen, PA 56,508 DR 1 354t 2 354t
Demand Respose - Taxi San Francisco-Oakland, CA 3,228,605 DT 1,533 1 1,533 1Washington, DC-VA-MD 3,933,920 DT 484 2 484 3Austin, TX 901,920 DT 445 3 445 4Houston, TX 3,822,509 DT 268 4 268 5Raleigh, NC 541,527 DT 241 5 531 2
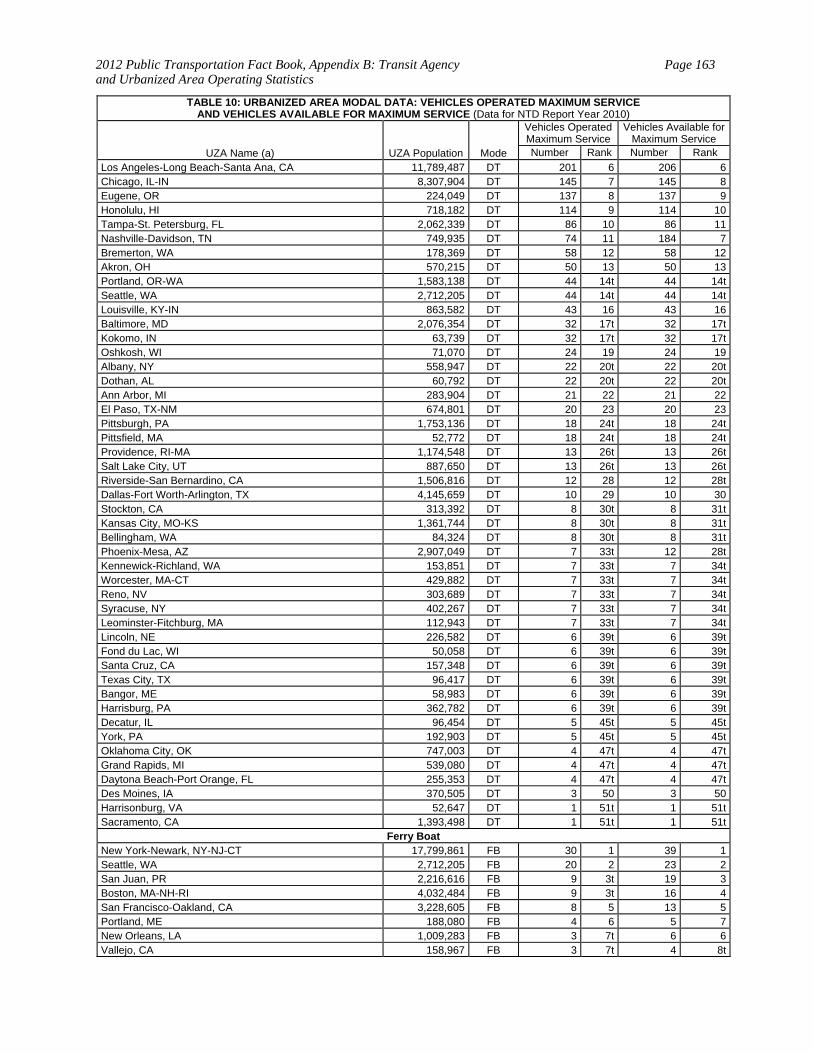
2012 Public Transportation Fact Book, Appendix B: Transit Agency and Urbanized Area Operating Statistics
Page 163
TABLE 10: URBANIZED AREA MODAL DATA: VEHICLES OPERATED MAXIMUM SERVICE AND VEHICLES AVAILABLE FOR MAXIMUM SERVICE (Data for NTD Report Year 2010)
UZA Name (a) UZA Population Mode
Vehicles Operated Maximum Service
Vehicles Available for Maximum Service
Number Rank Number Rank
Los Angeles-Long Beach-Santa Ana, CA 11,789,487 DT 201 6 206 6Chicago, IL-IN 8,307,904 DT 145 7 145 8Eugene, OR 224,049 DT 137 8 137 9Honolulu, HI 718,182 DT 114 9 114 10Tampa-St. Petersburg, FL 2,062,339 DT 86 10 86 11Nashville-Davidson, TN 749,935 DT 74 11 184 7Bremerton, WA 178,369 DT 58 12 58 12Akron, OH 570,215 DT 50 13 50 13Portland, OR-WA 1,583,138 DT 44 14t 44 14tSeattle, WA 2,712,205 DT 44 14t 44 14tLouisville, KY-IN 863,582 DT 43 16 43 16Baltimore, MD 2,076,354 DT 32 17t 32 17tKokomo, IN 63,739 DT 32 17t 32 17tOshkosh, WI 71,070 DT 24 19 24 19Albany, NY 558,947 DT 22 20t 22 20tDothan, AL 60,792 DT 22 20t 22 20tAnn Arbor, MI 283,904 DT 21 22 21 22El Paso, TX-NM 674,801 DT 20 23 20 23Pittsburgh, PA 1,753,136 DT 18 24t 18 24tPittsfield, MA 52,772 DT 18 24t 18 24tProvidence, RI-MA 1,174,548 DT 13 26t 13 26tSalt Lake City, UT 887,650 DT 13 26t 13 26tRiverside-San Bernardino, CA 1,506,816 DT 12 28 12 28tDallas-Fort Worth-Arlington, TX 4,145,659 DT 10 29 10 30Stockton, CA 313,392 DT 8 30t 8 31tKansas City, MO-KS 1,361,744 DT 8 30t 8 31tBellingham, WA 84,324 DT 8 30t 8 31tPhoenix-Mesa, AZ 2,907,049 DT 7 33t 12 28tKennewick-Richland, WA 153,851 DT 7 33t 7 34tWorcester, MA-CT 429,882 DT 7 33t 7 34tReno, NV 303,689 DT 7 33t 7 34tSyracuse, NY 402,267 DT 7 33t 7 34tLeominster-Fitchburg, MA 112,943 DT 7 33t 7 34tLincoln, NE 226,582 DT 6 39t 6 39tFond du Lac, WI 50,058 DT 6 39t 6 39tSanta Cruz, CA 157,348 DT 6 39t 6 39tTexas City, TX 96,417 DT 6 39t 6 39tBangor, ME 58,983 DT 6 39t 6 39tHarrisburg, PA 362,782 DT 6 39t 6 39tDecatur, IL 96,454 DT 5 45t 5 45tYork, PA 192,903 DT 5 45t 5 45tOklahoma City, OK 747,003 DT 4 47t 4 47tGrand Rapids, MI 539,080 DT 4 47t 4 47tDaytona Beach-Port Orange, FL 255,353 DT 4 47t 4 47tDes Moines, IA 370,505 DT 3 50 3 50Harrisonburg, VA 52,647 DT 1 51t 1 51tSacramento, CA 1,393,498 DT 1 51t 1 51t
Ferry Boat New York-Newark, NY-NJ-CT 17,799,861 FB 30 1 39 1Seattle, WA 2,712,205 FB 20 2 23 2San Juan, PR 2,216,616 FB 9 3t 19 3Boston, MA-NH-RI 4,032,484 FB 9 3t 16 4San Francisco-Oakland, CA 3,228,605 FB 8 5 13 5Portland, ME 188,080 FB 4 6 5 7New Orleans, LA 1,009,283 FB 3 7t 6 6Vallejo, CA 158,967 FB 3 7t 4 8t
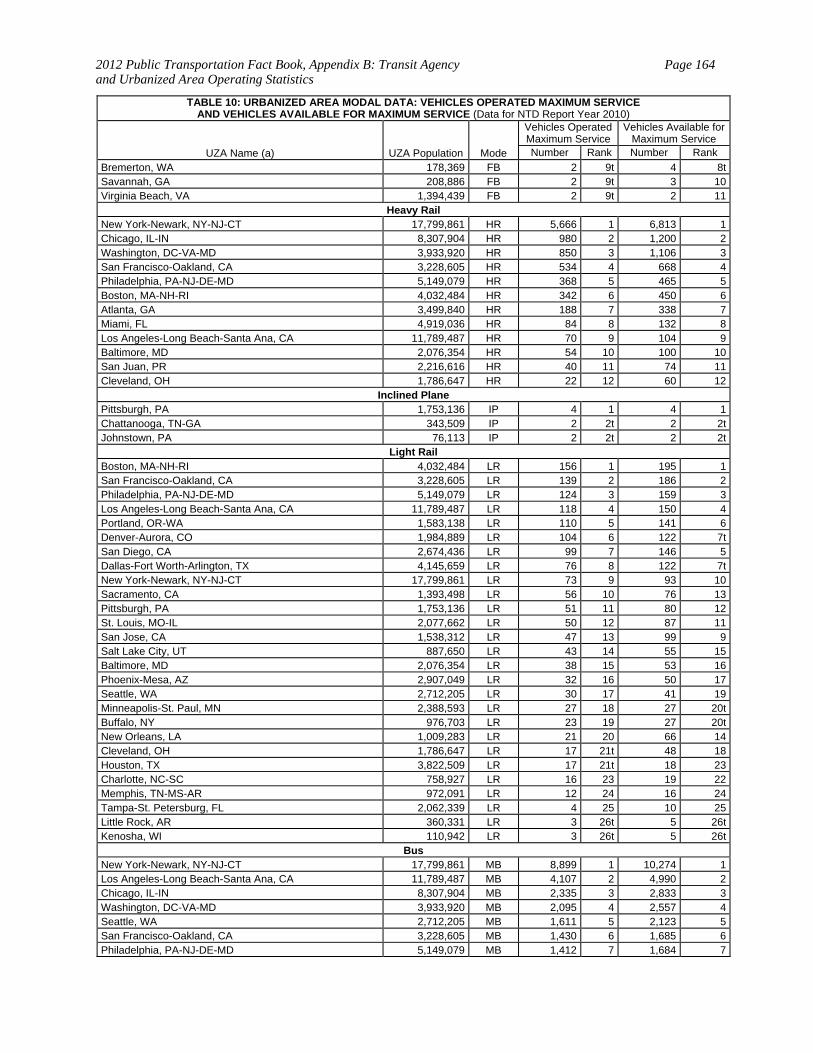
2012 Public Transportation Fact Book, Appendix B: Transit Agency and Urbanized Area Operating Statistics
Page 164
TABLE 10: URBANIZED AREA MODAL DATA: VEHICLES OPERATED MAXIMUM SERVICE AND VEHICLES AVAILABLE FOR MAXIMUM SERVICE (Data for NTD Report Year 2010)
UZA Name (a) UZA Population Mode
Vehicles Operated Maximum Service
Vehicles Available for Maximum Service
Number Rank Number Rank
Bremerton, WA 178,369 FB 2 9t 4 8tSavannah, GA 208,886 FB 2 9t 3 10Virginia Beach, VA 1,394,439 FB 2 9t 2 11
Heavy Rail New York-Newark, NY-NJ-CT 17,799,861 HR 5,666 1 6,813 1Chicago, IL-IN 8,307,904 HR 980 2 1,200 2Washington, DC-VA-MD 3,933,920 HR 850 3 1,106 3San Francisco-Oakland, CA 3,228,605 HR 534 4 668 4Philadelphia, PA-NJ-DE-MD 5,149,079 HR 368 5 465 5Boston, MA-NH-RI 4,032,484 HR 342 6 450 6Atlanta, GA 3,499,840 HR 188 7 338 7Miami, FL 4,919,036 HR 84 8 132 8Los Angeles-Long Beach-Santa Ana, CA 11,789,487 HR 70 9 104 9Baltimore, MD 2,076,354 HR 54 10 100 10San Juan, PR 2,216,616 HR 40 11 74 11Cleveland, OH 1,786,647 HR 22 12 60 12
Inclined Plane Pittsburgh, PA 1,753,136 IP 4 1 4 1Chattanooga, TN-GA 343,509 IP 2 2t 2 2tJohnstown, PA 76,113 IP 2 2t 2 2t
Light Rail Boston, MA-NH-RI 4,032,484 LR 156 1 195 1San Francisco-Oakland, CA 3,228,605 LR 139 2 186 2Philadelphia, PA-NJ-DE-MD 5,149,079 LR 124 3 159 3Los Angeles-Long Beach-Santa Ana, CA 11,789,487 LR 118 4 150 4Portland, OR-WA 1,583,138 LR 110 5 141 6Denver-Aurora, CO 1,984,889 LR 104 6 122 7tSan Diego, CA 2,674,436 LR 99 7 146 5Dallas-Fort Worth-Arlington, TX 4,145,659 LR 76 8 122 7tNew York-Newark, NY-NJ-CT 17,799,861 LR 73 9 93 10Sacramento, CA 1,393,498 LR 56 10 76 13Pittsburgh, PA 1,753,136 LR 51 11 80 12St. Louis, MO-IL 2,077,662 LR 50 12 87 11San Jose, CA 1,538,312 LR 47 13 99 9Salt Lake City, UT 887,650 LR 43 14 55 15Baltimore, MD 2,076,354 LR 38 15 53 16Phoenix-Mesa, AZ 2,907,049 LR 32 16 50 17Seattle, WA 2,712,205 LR 30 17 41 19Minneapolis-St. Paul, MN 2,388,593 LR 27 18 27 20tBuffalo, NY 976,703 LR 23 19 27 20tNew Orleans, LA 1,009,283 LR 21 20 66 14Cleveland, OH 1,786,647 LR 17 21t 48 18Houston, TX 3,822,509 LR 17 21t 18 23Charlotte, NC-SC 758,927 LR 16 23 19 22Memphis, TN-MS-AR 972,091 LR 12 24 16 24Tampa-St. Petersburg, FL 2,062,339 LR 4 25 10 25Little Rock, AR 360,331 LR 3 26t 5 26tKenosha, WI 110,942 LR 3 26t 5 26t
Bus New York-Newark, NY-NJ-CT 17,799,861 MB 8,899 1 10,274 1Los Angeles-Long Beach-Santa Ana, CA 11,789,487 MB 4,107 2 4,990 2Chicago, IL-IN 8,307,904 MB 2,335 3 2,833 3Washington, DC-VA-MD 3,933,920 MB 2,095 4 2,557 4Seattle, WA 2,712,205 MB 1,611 5 2,123 5San Francisco-Oakland, CA 3,228,605 MB 1,430 6 1,685 6Philadelphia, PA-NJ-DE-MD 5,149,079 MB 1,412 7 1,684 7
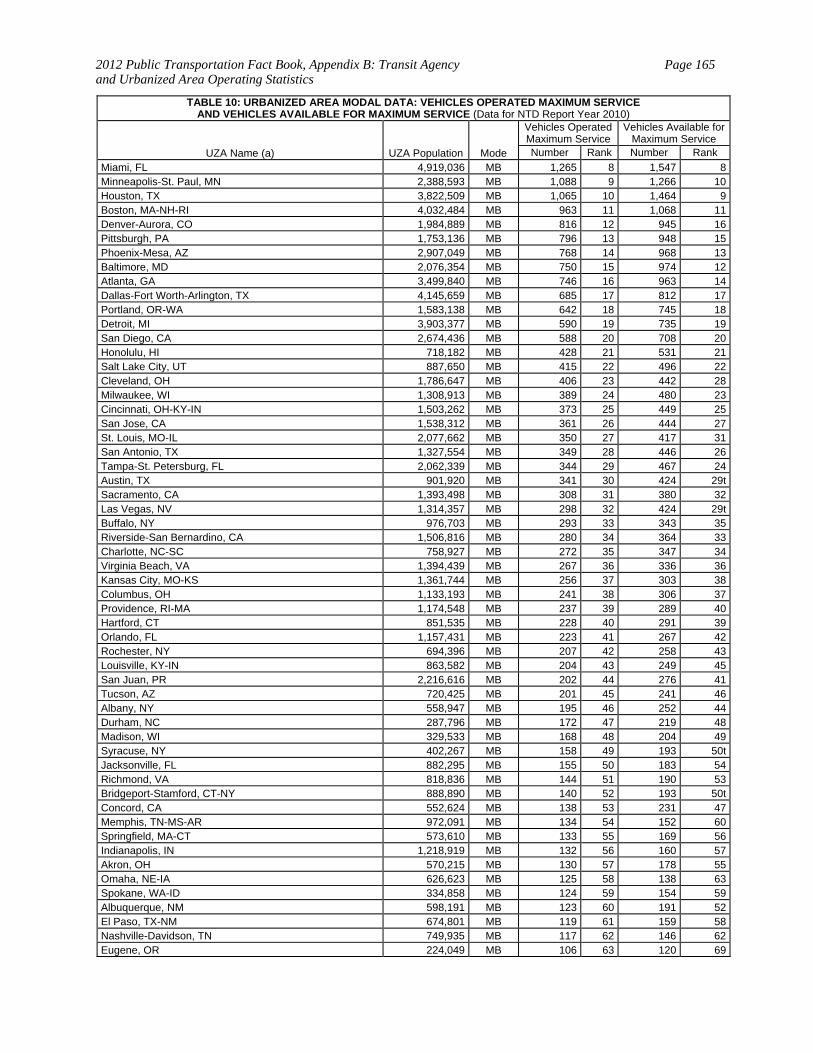
2012 Public Transportation Fact Book, Appendix B: Transit Agency and Urbanized Area Operating Statistics
Page 165
TABLE 10: URBANIZED AREA MODAL DATA: VEHICLES OPERATED MAXIMUM SERVICE AND VEHICLES AVAILABLE FOR MAXIMUM SERVICE (Data for NTD Report Year 2010)
UZA Name (a) UZA Population Mode
Vehicles Operated Maximum Service
Vehicles Available for Maximum Service
Number Rank Number Rank
Miami, FL 4,919,036 MB 1,265 8 1,547 8Minneapolis-St. Paul, MN 2,388,593 MB 1,088 9 1,266 10Houston, TX 3,822,509 MB 1,065 10 1,464 9Boston, MA-NH-RI 4,032,484 MB 963 11 1,068 11Denver-Aurora, CO 1,984,889 MB 816 12 945 16Pittsburgh, PA 1,753,136 MB 796 13 948 15Phoenix-Mesa, AZ 2,907,049 MB 768 14 968 13Baltimore, MD 2,076,354 MB 750 15 974 12Atlanta, GA 3,499,840 MB 746 16 963 14Dallas-Fort Worth-Arlington, TX 4,145,659 MB 685 17 812 17Portland, OR-WA 1,583,138 MB 642 18 745 18Detroit, MI 3,903,377 MB 590 19 735 19San Diego, CA 2,674,436 MB 588 20 708 20Honolulu, HI 718,182 MB 428 21 531 21Salt Lake City, UT 887,650 MB 415 22 496 22Cleveland, OH 1,786,647 MB 406 23 442 28Milwaukee, WI 1,308,913 MB 389 24 480 23Cincinnati, OH-KY-IN 1,503,262 MB 373 25 449 25San Jose, CA 1,538,312 MB 361 26 444 27St. Louis, MO-IL 2,077,662 MB 350 27 417 31San Antonio, TX 1,327,554 MB 349 28 446 26Tampa-St. Petersburg, FL 2,062,339 MB 344 29 467 24Austin, TX 901,920 MB 341 30 424 29tSacramento, CA 1,393,498 MB 308 31 380 32Las Vegas, NV 1,314,357 MB 298 32 424 29tBuffalo, NY 976,703 MB 293 33 343 35Riverside-San Bernardino, CA 1,506,816 MB 280 34 364 33Charlotte, NC-SC 758,927 MB 272 35 347 34Virginia Beach, VA 1,394,439 MB 267 36 336 36Kansas City, MO-KS 1,361,744 MB 256 37 303 38Columbus, OH 1,133,193 MB 241 38 306 37Providence, RI-MA 1,174,548 MB 237 39 289 40Hartford, CT 851,535 MB 228 40 291 39Orlando, FL 1,157,431 MB 223 41 267 42Rochester, NY 694,396 MB 207 42 258 43Louisville, KY-IN 863,582 MB 204 43 249 45San Juan, PR 2,216,616 MB 202 44 276 41Tucson, AZ 720,425 MB 201 45 241 46Albany, NY 558,947 MB 195 46 252 44Durham, NC 287,796 MB 172 47 219 48Madison, WI 329,533 MB 168 48 204 49Syracuse, NY 402,267 MB 158 49 193 50tJacksonville, FL 882,295 MB 155 50 183 54Richmond, VA 818,836 MB 144 51 190 53Bridgeport-Stamford, CT-NY 888,890 MB 140 52 193 50tConcord, CA 552,624 MB 138 53 231 47Memphis, TN-MS-AR 972,091 MB 134 54 152 60Springfield, MA-CT 573,610 MB 133 55 169 56Indianapolis, IN 1,218,919 MB 132 56 160 57Akron, OH 570,215 MB 130 57 178 55Omaha, NE-IA 626,623 MB 125 58 138 63Spokane, WA-ID 334,858 MB 124 59 154 59Albuquerque, NM 598,191 MB 123 60 191 52El Paso, TX-NM 674,801 MB 119 61 159 58Nashville-Davidson, TN 749,935 MB 117 62 146 62Eugene, OR 224,049 MB 106 63 120 69

2012 Public Transportation Fact Book, Appendix B: Transit Agency and Urbanized Area Operating Statistics
Page 166
TABLE 10: URBANIZED AREA MODAL DATA: VEHICLES OPERATED MAXIMUM SERVICE AND VEHICLES AVAILABLE FOR MAXIMUM SERVICE (Data for NTD Report Year 2010)
UZA Name (a) UZA Population Mode
Vehicles Operated Maximum Service
Vehicles Available for Maximum Service
Number Rank Number Rank
Grand Rapids, MI 539,080 MB 105 64t 126 66Flint, MI 365,096 MB 105 64t 119 70Toledo, OH-MI 503,008 MB 103 66 122 67tAnn Arbor, MI 283,904 MB 96 67 137 64Fresno, CA 554,923 MB 95 68t 122 67tNew Haven, CT 531,314 MB 95 68t 115 72Raleigh, NC 541,527 MB 94 70t 148 61Stockton, CA 313,392 MB 94 70t 109 75Des Moines, IA 370,505 MB 93 72 114 73New Orleans, LA 1,009,283 MB 91 73 128 65Dayton, OH 703,444 MB 88 74t 117 71Gainesville, FL 159,508 MB 88 74t 105 78Santa Barbara, CA 196,263 MB 87 76 106 77Champaign, IL 123,938 MB 86 77 93 84Santa Cruz, CA 157,348 MB 82 78 85 91tBremerton, WA 178,369 MB 81 79t 113 74Greensboro, NC 267,884 MB 81 79t 99 83Charleston-North Charleston, SC 423,410 MB 81 79t 91 86Lansing, MI 300,032 MB 79 82 107 76Seaside-Monterey-Marina, CA 125,503 MB 78 83 83 93tPoughkeepsie-Newburgh, NY 351,982 MB 76 84 101 81tKnoxville, TN 419,830 MB 74 85 103 80Davenport, IA-IL 270,626 MB 70 86t 92 85Bakersfield, CA 396,125 MB 70 86t 86 89tSanta Clarita, CA 170,481 MB 70 86t 80 97tBirmingham, AL 663,615 MB 68 89 78 99Allentown-Bethlehem, PA-NJ 576,408 MB 67 90t 83 93tHarrisburg, PA 362,782 MB 67 90t 80 97tKennewick-Richland, WA 153,851 MB 67 90t 75 101Ames, IA 50,726 MB 64 93t 88 87Lubbock, TX 202,225 MB 64 93t 68 110tSarasota-Bradenton, FL 559,229 MB 63 95t 85 91tOxnard, CA 337,591 MB 63 95t 83 93tErie, PA 194,804 MB 62 97 73 102tSanta Rosa, CA 285,408 MB 61 98t 104 79Athens-Clarke County, GA 106,482 MB 61 98t 86 89tSalem, OR 207,229 MB 59 100 65 116tCorpus Christi, TX 293,925 MB 58 101t 77 100Scranton, PA 385,237 MB 58 101t 73 102tReno, NV 303,689 MB 58 101t 70 108Tallahassee, FL 204,260 MB 56 104t 73 102tOlympia-Lacey, WA 143,826 MB 56 104t 68 110tLafayette, IN 125,738 MB 55 106 65 116tLancaster-Palmdale, CA 263,532 MB 54 107t 72 106College Station-Bryan, TX 132,500 MB 54 107t 71 107State College, PA 71,301 MB 54 107t 61 121tTulsa, OK 558,329 MB 53 110t 73 102tIowa City, IA 85,247 MB 53 110t 69 109Antioch, CA 217,591 MB 53 110t 68 110tOklahoma City, OK 747,003 MB 51 113 87 88Lincoln, NE 226,582 MB 50 114t 60 125tLexington-Fayette, KY 250,994 MB 50 114t 59 127tSavannah, GA 208,886 MB 50 114t 58 129tChattanooga, TN-GA 343,509 MB 49 117t 68 110tNew Bedford, MA 146,730 MB 49 117t 61 121tSpringfield, IL 153,516 MB 48 119 53 140t
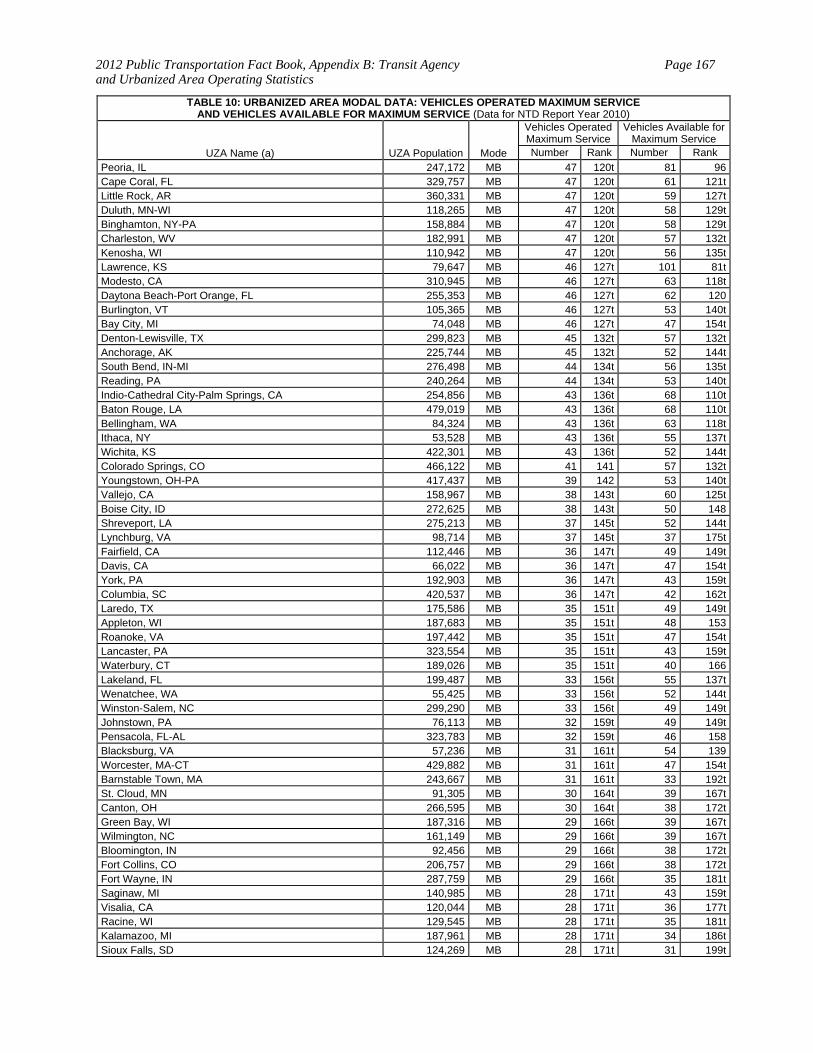
2012 Public Transportation Fact Book, Appendix B: Transit Agency and Urbanized Area Operating Statistics
Page 167
TABLE 10: URBANIZED AREA MODAL DATA: VEHICLES OPERATED MAXIMUM SERVICE AND VEHICLES AVAILABLE FOR MAXIMUM SERVICE (Data for NTD Report Year 2010)
UZA Name (a) UZA Population Mode
Vehicles Operated Maximum Service
Vehicles Available for Maximum Service
Number Rank Number Rank
Peoria, IL 247,172 MB 47 120t 81 96Cape Coral, FL 329,757 MB 47 120t 61 121tLittle Rock, AR 360,331 MB 47 120t 59 127tDuluth, MN-WI 118,265 MB 47 120t 58 129tBinghamton, NY-PA 158,884 MB 47 120t 58 129tCharleston, WV 182,991 MB 47 120t 57 132tKenosha, WI 110,942 MB 47 120t 56 135tLawrence, KS 79,647 MB 46 127t 101 81tModesto, CA 310,945 MB 46 127t 63 118tDaytona Beach-Port Orange, FL 255,353 MB 46 127t 62 120Burlington, VT 105,365 MB 46 127t 53 140tBay City, MI 74,048 MB 46 127t 47 154tDenton-Lewisville, TX 299,823 MB 45 132t 57 132tAnchorage, AK 225,744 MB 45 132t 52 144tSouth Bend, IN-MI 276,498 MB 44 134t 56 135tReading, PA 240,264 MB 44 134t 53 140tIndio-Cathedral City-Palm Springs, CA 254,856 MB 43 136t 68 110tBaton Rouge, LA 479,019 MB 43 136t 68 110tBellingham, WA 84,324 MB 43 136t 63 118tIthaca, NY 53,528 MB 43 136t 55 137tWichita, KS 422,301 MB 43 136t 52 144tColorado Springs, CO 466,122 MB 41 141 57 132tYoungstown, OH-PA 417,437 MB 39 142 53 140tVallejo, CA 158,967 MB 38 143t 60 125tBoise City, ID 272,625 MB 38 143t 50 148Shreveport, LA 275,213 MB 37 145t 52 144tLynchburg, VA 98,714 MB 37 145t 37 175tFairfield, CA 112,446 MB 36 147t 49 149tDavis, CA 66,022 MB 36 147t 47 154tYork, PA 192,903 MB 36 147t 43 159tColumbia, SC 420,537 MB 36 147t 42 162tLaredo, TX 175,586 MB 35 151t 49 149tAppleton, WI 187,683 MB 35 151t 48 153Roanoke, VA 197,442 MB 35 151t 47 154tLancaster, PA 323,554 MB 35 151t 43 159tWaterbury, CT 189,026 MB 35 151t 40 166Lakeland, FL 199,487 MB 33 156t 55 137tWenatchee, WA 55,425 MB 33 156t 52 144tWinston-Salem, NC 299,290 MB 33 156t 49 149tJohnstown, PA 76,113 MB 32 159t 49 149tPensacola, FL-AL 323,783 MB 32 159t 46 158Blacksburg, VA 57,236 MB 31 161t 54 139Worcester, MA-CT 429,882 MB 31 161t 47 154tBarnstable Town, MA 243,667 MB 31 161t 33 192tSt. Cloud, MN 91,305 MB 30 164t 39 167tCanton, OH 266,595 MB 30 164t 38 172tGreen Bay, WI 187,316 MB 29 166t 39 167tWilmington, NC 161,149 MB 29 166t 39 167tBloomington, IN 92,456 MB 29 166t 38 172tFort Collins, CO 206,757 MB 29 166t 38 172tFort Wayne, IN 287,759 MB 29 166t 35 181tSaginaw, MI 140,985 MB 28 171t 43 159tVisalia, CA 120,044 MB 28 171t 36 177tRacine, WI 129,545 MB 28 171t 35 181tKalamazoo, MI 187,961 MB 28 171t 34 186tSioux Falls, SD 124,269 MB 28 171t 31 199t

2012 Public Transportation Fact Book, Appendix B: Transit Agency and Urbanized Area Operating Statistics
Page 168
TABLE 10: URBANIZED AREA MODAL DATA: VEHICLES OPERATED MAXIMUM SERVICE AND VEHICLES AVAILABLE FOR MAXIMUM SERVICE (Data for NTD Report Year 2010)
UZA Name (a) UZA Population Mode
Vehicles Operated Maximum Service
Vehicles Available for Maximum Service
Number Rank Number Rank
Rockford, IL 270,414 MB 27 176t 41 164tFayetteville-Springdale, AR 172,585 MB 27 176t 39 167tRochester, MN 91,271 MB 27 176t 39 167tFargo, ND-MN 142,477 MB 27 176t 36 177tVictorville-Hesperia-Apple Valley, CA 200,436 MB 27 176t 35 181tMonessen, PA 56,508 MB 27 176t 29 206tJackson, MS 292,637 MB 27 176t 27 215tMerced, CA 110,483 MB 26 183t 41 164tSan Luis Obispo, CA 53,498 MB 26 183t 37 175tRome, GA 58,287 MB 26 183t 35 181tMuncie, IN 90,673 MB 26 183t 34 186tSanta Fe, NM 80,337 MB 26 183t 29 206tDanbury, CT-NY 154,455 MB 26 183t 28 211tCharlottesville, VA 81,449 MB 25 189t 42 162tNapa, CA 79,867 MB 25 189t 36 177tMontgomery, AL 196,892 MB 25 189t 34 186tUtica, NY 113,409 MB 25 189t 34 186tTopeka, KS 142,411 MB 25 189t 30 202tChico, CA 89,221 MB 25 189t 29 206tPortsmouth, NH-ME 50,912 MB 25 189t 29 206tHarrisonburg, VA 52,647 MB 25 189t 27 215tSalisbury, MD-DE 59,426 MB 25 189t 27 215tPalm Bay-Melbourne, FL 393,289 MB 24 198t 61 121tHuntington, WV-KY-OH 177,550 MB 24 198t 34 186tColumbia, MO 98,779 MB 24 198t 32 194tMissoula, MT 69,491 MB 24 198t 30 202tMobile, AL 317,605 MB 23 202t 34 186tYuba City, CA 97,645 MB 23 202t 32 194tPortland, ME 188,080 MB 23 202t 28 211tLeominster-Fitchburg, MA 112,943 MB 23 202t 28 211tWilliamsport, PA 58,693 MB 23 202t 27 215tMyrtle Beach, SC 122,984 MB 22 207t 36 177tEvansville, IN-KY 211,989 MB 22 207t 32 194tBloomington-Normal, IL 112,415 MB 22 207t 32 194tFredericksburg, VA 97,102 MB 22 207t 30 202tMorgantown, WV 55,997 MB 22 207t 23 231tCedar Rapids, IA 155,334 MB 21 212t 35 181tAltoona, PA 82,520 MB 21 212t 33 192tWausau, WI 68,221 MB 21 212t 27 215tSioux City, IA-NE-SD 106,119 MB 21 212t 23 231tBillings, MT 100,317 MB 20 216t 26 221tSpringfield, MO 215,004 MB 20 216t 25 225tLewiston, ME 50,567 MB 20 216t 24 229tNorwich-New London, CT 173,160 MB 19 219t 27 215tDecatur, IL 96,454 MB 19 219t 26 221tFlorence, SC 67,314 MB 19 219t 26 221tMedford, OR 128,780 MB 19 219t 23 231tSumter, SC 64,320 MB 19 219t 22 238tFrederick, MD 119,144 MB 18 224t 31 199tGulfport-Biloxi, MS 205,754 MB 18 224t 25 225tYakima, WA 112,816 MB 18 224t 24 229tElmira, NY 67,159 MB 18 224t 23 231tBrownsville, TX 165,776 MB 18 224t 20 257tDover-Rochester, NH-ME 80,456 MB 17 229t 30 202tSheboygan, WI 68,600 MB 17 229t 28 211tLafayette, LA 178,079 MB 17 229t 26 221t

2012 Public Transportation Fact Book, Appendix B: Transit Agency and Urbanized Area Operating Statistics
Page 169
TABLE 10: URBANIZED AREA MODAL DATA: VEHICLES OPERATED MAXIMUM SERVICE AND VEHICLES AVAILABLE FOR MAXIMUM SERVICE (Data for NTD Report Year 2010)
UZA Name (a) UZA Population Mode
Vehicles Operated Maximum Service
Vehicles Available for Maximum Service
Number Rank Number Rank
Logan, UT 76,187 MB 17 229t 25 225tMacon, GA 135,170 MB 17 229t 21 246tAberdeen-Havre de Grace-Bel Air, MD 174,598 MB 17 229t 21 246tSt. Joseph, MO-KS 77,231 MB 17 229t 20 257tColumbus, GA-AL 242,324 MB 16 236t 29 206tBonita Springs-Naples, FL 221,251 MB 16 236t 23 231tEau Claire, WI 91,393 MB 16 236t 22 238tHolland, MI 91,921 MB 16 236t 22 238tAsheville, NC 221,570 MB 16 236t 21 246tFayetteville, NC 276,368 MB 16 236t 21 246tSanta Maria, CA 120,297 MB 16 236t 21 246tHanford, CA 69,639 MB 16 236t 21 246tClarksville, TN-KY 121,775 MB 16 236t 20 257tAbilene, TX 107,041 MB 16 236t 20 257tWheeling, WV-OH 87,613 MB 16 236t 19 263tMcAllen, TX 523,144 MB 15 247t 32 194tMonroe, LA 113,818 MB 15 247t 23 231tEl Centro, CA 52,954 MB 15 247t 20 257tWaco, TX 153,198 MB 15 247t 19 263tVirgin Islands, VI 1 108,612 MB 15 247t 15 292tSt. Charles, MD 74,765 MB 14 252t 22 238tMount Vernon, WA 51,174 MB 14 252t 22 238tLa Crosse, WI-MN 89,966 MB 14 252t 21 246tVero Beach-Sebastian, FL 120,962 MB 14 252t 21 246tNorman, OK 86,478 MB 14 252t 19 263tBangor, ME 58,983 MB 14 252t 19 263tFort Walton Beach, FL 152,741 MB 14 252t 17 275tPueblo, CO 123,351 MB 14 252t 16 281tPittsfield, MA 52,772 MB 13 260t 23 231tPanama City, FL 132,419 MB 13 260t 22 238tAugusta-Richmond County, GA-SC 335,630 MB 13 260t 22 238tJanesville, WI 66,034 MB 13 260t 21 246tPort St. Lucie, FL 270,774 MB 13 260t 21 246tGreat Falls, MT 64,387 MB 13 260t 20 257tOshkosh, WI 71,070 MB 13 260t 19 263tPort Huron, MI 86,486 MB 13 260t 18 270tGreenville, SC 302,194 MB 13 260t 18 270tJefferson City, MO 53,714 MB 13 260t 18 270tHuntsville, AL 213,253 MB 13 260t 16 281tLebanon, PA 63,681 MB 13 260t 15 292tLompoc, CA 55,667 MB 13 260t 13 304tJohnson City, TN 102,456 MB 12 273t 25 225tGrand Junction, CO 92,362 MB 12 273t 21 246tRedding, CA 105,267 MB 12 273t 19 263tOdessa, TX 111,395 MB 12 273t 19 263tBeaumont, TX 139,304 MB 12 273t 18 270tWaterloo, IA 108,298 MB 12 273t 18 270tLas Cruces, NM 104,186 MB 12 273t 17 275tAmarillo, TX 179,312 MB 12 273t 17 275tManchester, NH 143,549 MB 12 273t 15 292tKankakee, IL 65,073 MB 12 273t 14 298tDubuque, IA-IL 65,251 MB 12 273t 12 310tKilleen, TX 167,976 MB 11 284t 31 199tFlagstaff, AZ 57,050 MB 11 284t 16 281tHigh Point, NC 132,844 MB 11 284t 16 281tGalveston, TX 54,770 MB 11 284t 16 281t
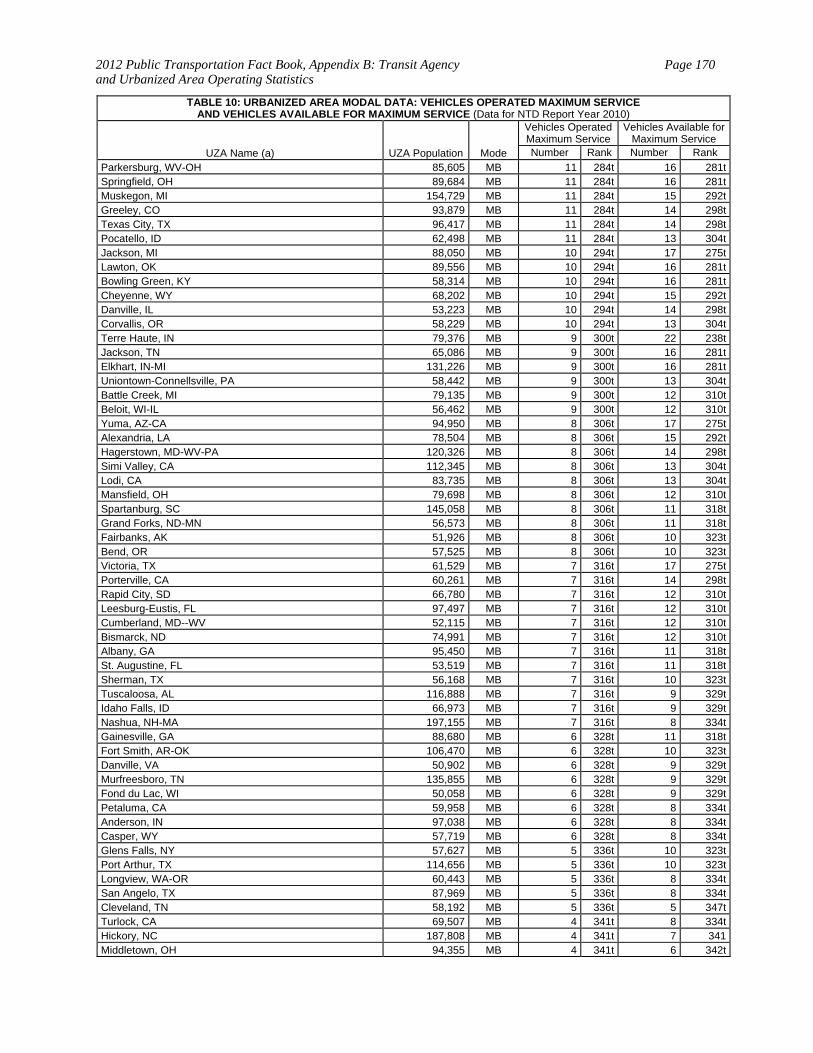
2012 Public Transportation Fact Book, Appendix B: Transit Agency and Urbanized Area Operating Statistics
Page 170
TABLE 10: URBANIZED AREA MODAL DATA: VEHICLES OPERATED MAXIMUM SERVICE AND VEHICLES AVAILABLE FOR MAXIMUM SERVICE (Data for NTD Report Year 2010)
UZA Name (a) UZA Population Mode
Vehicles Operated Maximum Service
Vehicles Available for Maximum Service
Number Rank Number Rank
Parkersburg, WV-OH 85,605 MB 11 284t 16 281tSpringfield, OH 89,684 MB 11 284t 16 281tMuskegon, MI 154,729 MB 11 284t 15 292tGreeley, CO 93,879 MB 11 284t 14 298tTexas City, TX 96,417 MB 11 284t 14 298tPocatello, ID 62,498 MB 11 284t 13 304tJackson, MI 88,050 MB 10 294t 17 275tLawton, OK 89,556 MB 10 294t 16 281tBowling Green, KY 58,314 MB 10 294t 16 281tCheyenne, WY 68,202 MB 10 294t 15 292tDanville, IL 53,223 MB 10 294t 14 298tCorvallis, OR 58,229 MB 10 294t 13 304tTerre Haute, IN 79,376 MB 9 300t 22 238tJackson, TN 65,086 MB 9 300t 16 281tElkhart, IN-MI 131,226 MB 9 300t 16 281tUniontown-Connellsville, PA 58,442 MB 9 300t 13 304tBattle Creek, MI 79,135 MB 9 300t 12 310tBeloit, WI-IL 56,462 MB 9 300t 12 310tYuma, AZ-CA 94,950 MB 8 306t 17 275tAlexandria, LA 78,504 MB 8 306t 15 292tHagerstown, MD-WV-PA 120,326 MB 8 306t 14 298tSimi Valley, CA 112,345 MB 8 306t 13 304tLodi, CA 83,735 MB 8 306t 13 304tMansfield, OH 79,698 MB 8 306t 12 310tSpartanburg, SC 145,058 MB 8 306t 11 318tGrand Forks, ND-MN 56,573 MB 8 306t 11 318tFairbanks, AK 51,926 MB 8 306t 10 323tBend, OR 57,525 MB 8 306t 10 323tVictoria, TX 61,529 MB 7 316t 17 275tPorterville, CA 60,261 MB 7 316t 14 298tRapid City, SD 66,780 MB 7 316t 12 310tLeesburg-Eustis, FL 97,497 MB 7 316t 12 310tCumberland, MD--WV 52,115 MB 7 316t 12 310tBismarck, ND 74,991 MB 7 316t 12 310tAlbany, GA 95,450 MB 7 316t 11 318tSt. Augustine, FL 53,519 MB 7 316t 11 318tSherman, TX 56,168 MB 7 316t 10 323tTuscaloosa, AL 116,888 MB 7 316t 9 329tIdaho Falls, ID 66,973 MB 7 316t 9 329tNashua, NH-MA 197,155 MB 7 316t 8 334tGainesville, GA 88,680 MB 6 328t 11 318tFort Smith, AR-OK 106,470 MB 6 328t 10 323tDanville, VA 50,902 MB 6 328t 9 329tMurfreesboro, TN 135,855 MB 6 328t 9 329tFond du Lac, WI 50,058 MB 6 328t 9 329tPetaluma, CA 59,958 MB 6 328t 8 334tAnderson, IN 97,038 MB 6 328t 8 334tCasper, WY 57,719 MB 6 328t 8 334tGlens Falls, NY 57,627 MB 5 336t 10 323tPort Arthur, TX 114,656 MB 5 336t 10 323tLongview, WA-OR 60,443 MB 5 336t 8 334tSan Angelo, TX 87,969 MB 5 336t 8 334tCleveland, TN 58,192 MB 5 336t 5 347tTurlock, CA 69,507 MB 4 341t 8 334tHickory, NC 187,808 MB 4 341t 7 341Middletown, OH 94,355 MB 4 341t 6 342t
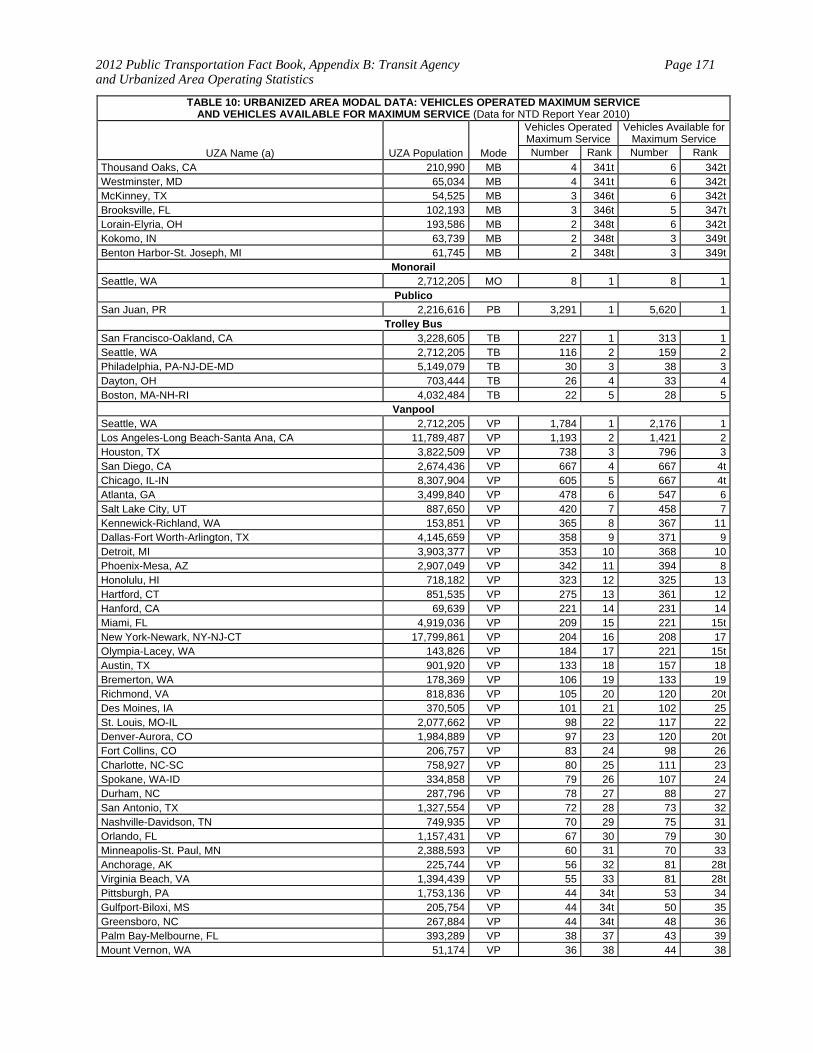
2012 Public Transportation Fact Book, Appendix B: Transit Agency and Urbanized Area Operating Statistics
Page 171
TABLE 10: URBANIZED AREA MODAL DATA: VEHICLES OPERATED MAXIMUM SERVICE AND VEHICLES AVAILABLE FOR MAXIMUM SERVICE (Data for NTD Report Year 2010)
UZA Name (a) UZA Population Mode
Vehicles Operated Maximum Service
Vehicles Available for Maximum Service
Number Rank Number Rank
Thousand Oaks, CA 210,990 MB 4 341t 6 342tWestminster, MD 65,034 MB 4 341t 6 342tMcKinney, TX 54,525 MB 3 346t 6 342tBrooksville, FL 102,193 MB 3 346t 5 347tLorain-Elyria, OH 193,586 MB 2 348t 6 342tKokomo, IN 63,739 MB 2 348t 3 349tBenton Harbor-St. Joseph, MI 61,745 MB 2 348t 3 349t
Monorail Seattle, WA 2,712,205 MO 8 1 8 1
Publico San Juan, PR 2,216,616 PB 3,291 1 5,620 1
Trolley Bus San Francisco-Oakland, CA 3,228,605 TB 227 1 313 1Seattle, WA 2,712,205 TB 116 2 159 2Philadelphia, PA-NJ-DE-MD 5,149,079 TB 30 3 38 3Dayton, OH 703,444 TB 26 4 33 4Boston, MA-NH-RI 4,032,484 TB 22 5 28 5
Vanpool Seattle, WA 2,712,205 VP 1,784 1 2,176 1Los Angeles-Long Beach-Santa Ana, CA 11,789,487 VP 1,193 2 1,421 2Houston, TX 3,822,509 VP 738 3 796 3San Diego, CA 2,674,436 VP 667 4 667 4tChicago, IL-IN 8,307,904 VP 605 5 667 4tAtlanta, GA 3,499,840 VP 478 6 547 6Salt Lake City, UT 887,650 VP 420 7 458 7Kennewick-Richland, WA 153,851 VP 365 8 367 11Dallas-Fort Worth-Arlington, TX 4,145,659 VP 358 9 371 9Detroit, MI 3,903,377 VP 353 10 368 10Phoenix-Mesa, AZ 2,907,049 VP 342 11 394 8Honolulu, HI 718,182 VP 323 12 325 13Hartford, CT 851,535 VP 275 13 361 12Hanford, CA 69,639 VP 221 14 231 14Miami, FL 4,919,036 VP 209 15 221 15tNew York-Newark, NY-NJ-CT 17,799,861 VP 204 16 208 17Olympia-Lacey, WA 143,826 VP 184 17 221 15tAustin, TX 901,920 VP 133 18 157 18Bremerton, WA 178,369 VP 106 19 133 19Richmond, VA 818,836 VP 105 20 120 20tDes Moines, IA 370,505 VP 101 21 102 25St. Louis, MO-IL 2,077,662 VP 98 22 117 22Denver-Aurora, CO 1,984,889 VP 97 23 120 20tFort Collins, CO 206,757 VP 83 24 98 26Charlotte, NC-SC 758,927 VP 80 25 111 23Spokane, WA-ID 334,858 VP 79 26 107 24Durham, NC 287,796 VP 78 27 88 27San Antonio, TX 1,327,554 VP 72 28 73 32Nashville-Davidson, TN 749,935 VP 70 29 75 31Orlando, FL 1,157,431 VP 67 30 79 30Minneapolis-St. Paul, MN 2,388,593 VP 60 31 70 33Anchorage, AK 225,744 VP 56 32 81 28tVirginia Beach, VA 1,394,439 VP 55 33 81 28tPittsburgh, PA 1,753,136 VP 44 34t 53 34Gulfport-Biloxi, MS 205,754 VP 44 34t 50 35Greensboro, NC 267,884 VP 44 34t 48 36Palm Bay-Melbourne, FL 393,289 VP 38 37 43 39Mount Vernon, WA 51,174 VP 36 38 44 38
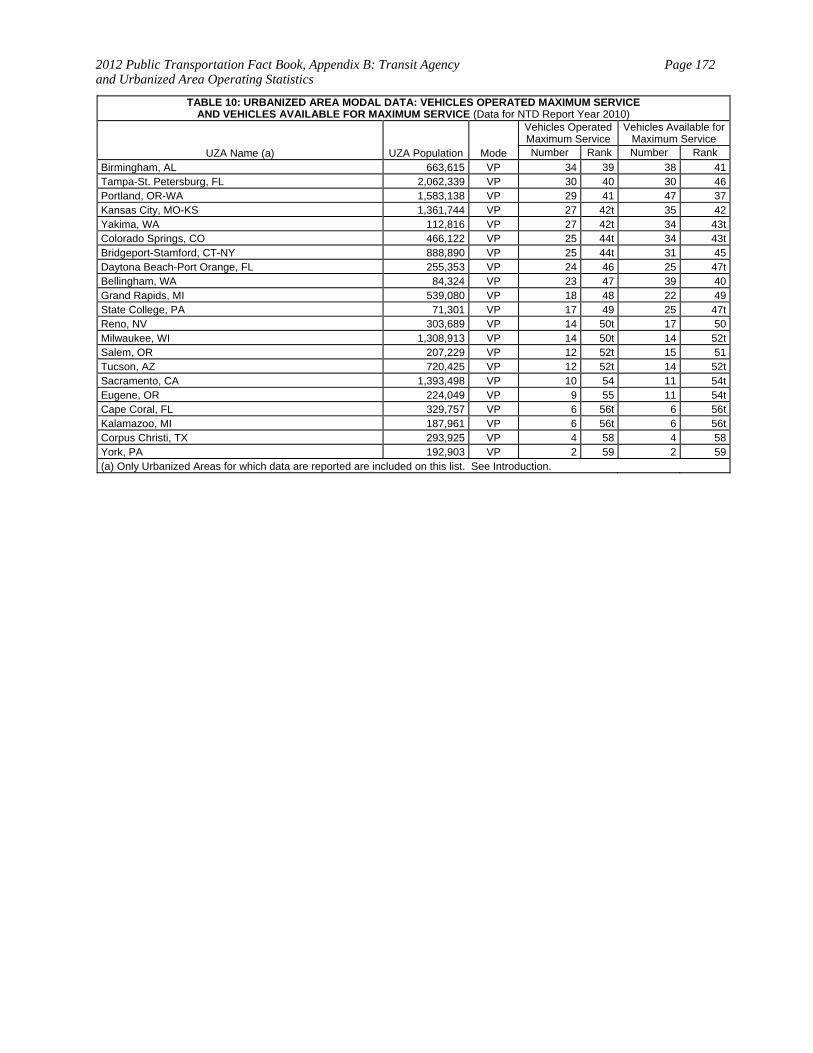
2012 Public Transportation Fact Book, Appendix B: Transit Agency and Urbanized Area Operating Statistics
Page 172
TABLE 10: URBANIZED AREA MODAL DATA: VEHICLES OPERATED MAXIMUM SERVICE AND VEHICLES AVAILABLE FOR MAXIMUM SERVICE (Data for NTD Report Year 2010)
UZA Name (a) UZA Population Mode
Vehicles Operated Maximum Service
Vehicles Available for Maximum Service
Number Rank Number Rank
Birmingham, AL 663,615 VP 34 39 38 41Tampa-St. Petersburg, FL 2,062,339 VP 30 40 30 46Portland, OR-WA 1,583,138 VP 29 41 47 37Kansas City, MO-KS 1,361,744 VP 27 42t 35 42Yakima, WA 112,816 VP 27 42t 34 43tColorado Springs, CO 466,122 VP 25 44t 34 43tBridgeport-Stamford, CT-NY 888,890 VP 25 44t 31 45Daytona Beach-Port Orange, FL 255,353 VP 24 46 25 47tBellingham, WA 84,324 VP 23 47 39 40Grand Rapids, MI 539,080 VP 18 48 22 49State College, PA 71,301 VP 17 49 25 47tReno, NV 303,689 VP 14 50t 17 50Milwaukee, WI 1,308,913 VP 14 50t 14 52tSalem, OR 207,229 VP 12 52t 15 51Tucson, AZ 720,425 VP 12 52t 14 52tSacramento, CA 1,393,498 VP 10 54 11 54tEugene, OR 224,049 VP 9 55 11 54tCape Coral, FL 329,757 VP 6 56t 6 56tKalamazoo, MI 187,961 VP 6 56t 6 56tCorpus Christi, TX 293,925 VP 4 58 4 58York, PA 192,903 VP 2 59 2 59(a) Only Urbanized Areas for which data are reported are included on this list. See Introduction.
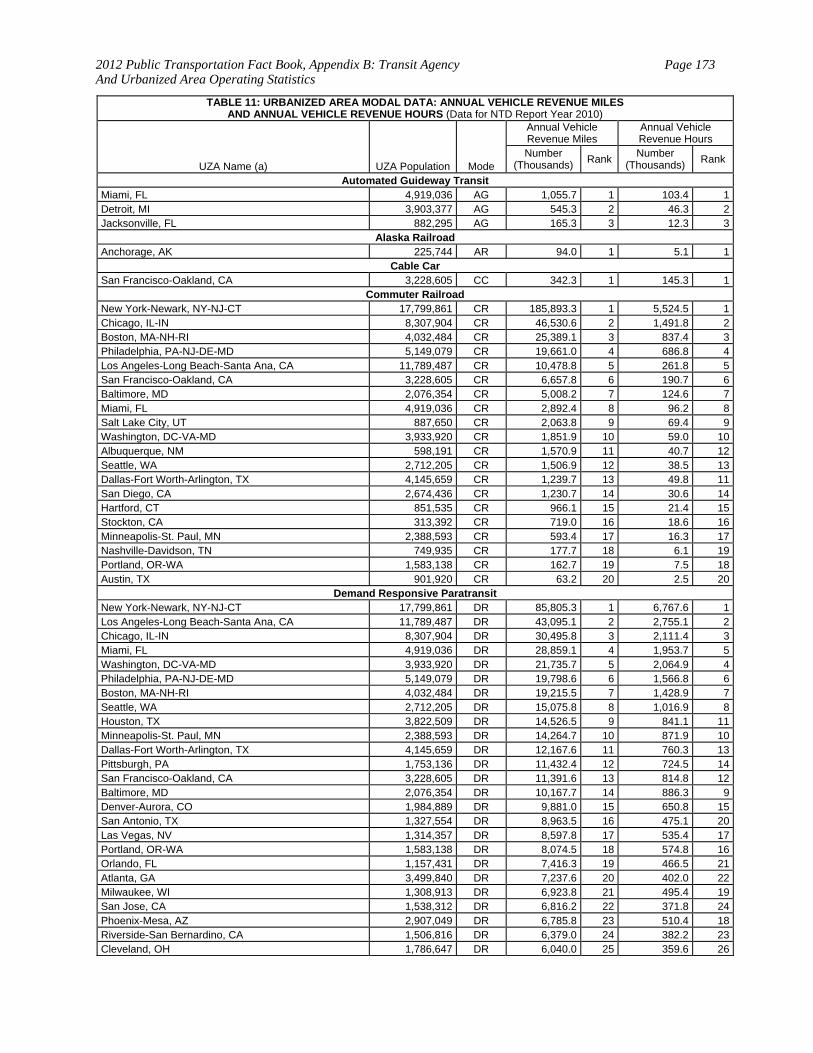
2012 Public Transportation Fact Book, Appendix B: Transit Agency And Urbanized Area Operating Statistics
Page 173
TABLE 11: URBANIZED AREA MODAL DATA: ANNUAL VEHICLE REVENUE MILES AND ANNUAL VEHICLE REVENUE HOURS (Data for NTD Report Year 2010)
UZA Name (a) UZA Population Mode
Annual Vehicle Revenue Miles
Annual Vehicle Revenue Hours
Number (Thousands) Rank
Number (Thousands) Rank
Automated Guideway Transit Miami, FL 4,919,036 AG 1,055.7 1 103.4 1Detroit, MI 3,903,377 AG 545.3 2 46.3 2Jacksonville, FL 882,295 AG 165.3 3 12.3 3
Alaska Railroad Anchorage, AK 225,744 AR 94.0 1 5.1 1
Cable Car San Francisco-Oakland, CA 3,228,605 CC 342.3 1 145.3 1
Commuter Railroad New York-Newark, NY-NJ-CT 17,799,861 CR 185,893.3 1 5,524.5 1Chicago, IL-IN 8,307,904 CR 46,530.6 2 1,491.8 2Boston, MA-NH-RI 4,032,484 CR 25,389.1 3 837.4 3Philadelphia, PA-NJ-DE-MD 5,149,079 CR 19,661.0 4 686.8 4Los Angeles-Long Beach-Santa Ana, CA 11,789,487 CR 10,478.8 5 261.8 5San Francisco-Oakland, CA 3,228,605 CR 6,657.8 6 190.7 6Baltimore, MD 2,076,354 CR 5,008.2 7 124.6 7Miami, FL 4,919,036 CR 2,892.4 8 96.2 8Salt Lake City, UT 887,650 CR 2,063.8 9 69.4 9Washington, DC-VA-MD 3,933,920 CR 1,851.9 10 59.0 10Albuquerque, NM 598,191 CR 1,570.9 11 40.7 12Seattle, WA 2,712,205 CR 1,506.9 12 38.5 13Dallas-Fort Worth-Arlington, TX 4,145,659 CR 1,239.7 13 49.8 11San Diego, CA 2,674,436 CR 1,230.7 14 30.6 14Hartford, CT 851,535 CR 966.1 15 21.4 15Stockton, CA 313,392 CR 719.0 16 18.6 16Minneapolis-St. Paul, MN 2,388,593 CR 593.4 17 16.3 17Nashville-Davidson, TN 749,935 CR 177.7 18 6.1 19Portland, OR-WA 1,583,138 CR 162.7 19 7.5 18Austin, TX 901,920 CR 63.2 20 2.5 20
Demand Responsive Paratransit New York-Newark, NY-NJ-CT 17,799,861 DR 85,805.3 1 6,767.6 1Los Angeles-Long Beach-Santa Ana, CA 11,789,487 DR 43,095.1 2 2,755.1 2Chicago, IL-IN 8,307,904 DR 30,495.8 3 2,111.4 3Miami, FL 4,919,036 DR 28,859.1 4 1,953.7 5Washington, DC-VA-MD 3,933,920 DR 21,735.7 5 2,064.9 4Philadelphia, PA-NJ-DE-MD 5,149,079 DR 19,798.6 6 1,566.8 6Boston, MA-NH-RI 4,032,484 DR 19,215.5 7 1,428.9 7Seattle, WA 2,712,205 DR 15,075.8 8 1,016.9 8Houston, TX 3,822,509 DR 14,526.5 9 841.1 11Minneapolis-St. Paul, MN 2,388,593 DR 14,264.7 10 871.9 10Dallas-Fort Worth-Arlington, TX 4,145,659 DR 12,167.6 11 760.3 13Pittsburgh, PA 1,753,136 DR 11,432.4 12 724.5 14San Francisco-Oakland, CA 3,228,605 DR 11,391.6 13 814.8 12Baltimore, MD 2,076,354 DR 10,167.7 14 886.3 9Denver-Aurora, CO 1,984,889 DR 9,881.0 15 650.8 15San Antonio, TX 1,327,554 DR 8,963.5 16 475.1 20Las Vegas, NV 1,314,357 DR 8,597.8 17 535.4 17Portland, OR-WA 1,583,138 DR 8,074.5 18 574.8 16Orlando, FL 1,157,431 DR 7,416.3 19 466.5 21Atlanta, GA 3,499,840 DR 7,237.6 20 402.0 22Milwaukee, WI 1,308,913 DR 6,923.8 21 495.4 19San Jose, CA 1,538,312 DR 6,816.2 22 371.8 24Phoenix-Mesa, AZ 2,907,049 DR 6,785.8 23 510.4 18Riverside-San Bernardino, CA 1,506,816 DR 6,379.0 24 382.2 23Cleveland, OH 1,786,647 DR 6,040.0 25 359.6 26
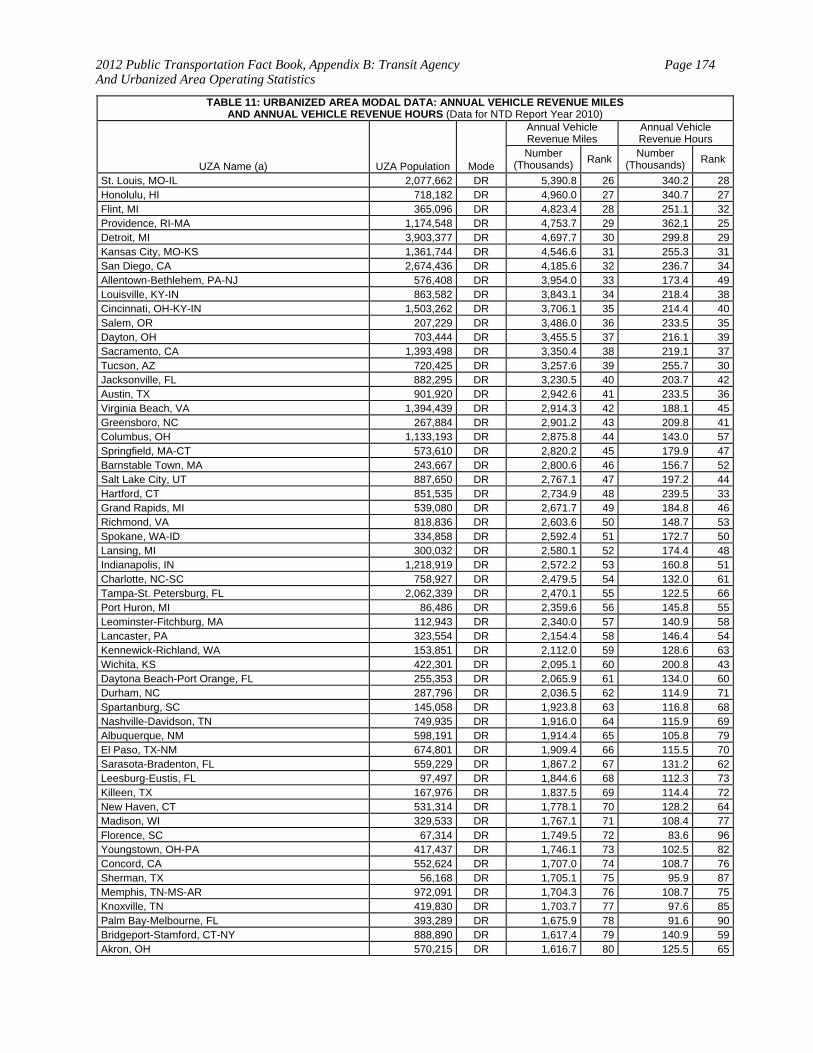
2012 Public Transportation Fact Book, Appendix B: Transit Agency And Urbanized Area Operating Statistics
Page 174
TABLE 11: URBANIZED AREA MODAL DATA: ANNUAL VEHICLE REVENUE MILES AND ANNUAL VEHICLE REVENUE HOURS (Data for NTD Report Year 2010)
UZA Name (a) UZA Population Mode
Annual Vehicle Revenue Miles
Annual Vehicle Revenue Hours
Number (Thousands) Rank
Number (Thousands) Rank
St. Louis, MO-IL 2,077,662 DR 5,390.8 26 340.2 28Honolulu, HI 718,182 DR 4,960.0 27 340.7 27Flint, MI 365,096 DR 4,823.4 28 251.1 32Providence, RI-MA 1,174,548 DR 4,753.7 29 362.1 25Detroit, MI 3,903,377 DR 4,697.7 30 299.8 29Kansas City, MO-KS 1,361,744 DR 4,546.6 31 255.3 31San Diego, CA 2,674,436 DR 4,185.6 32 236.7 34Allentown-Bethlehem, PA-NJ 576,408 DR 3,954.0 33 173.4 49Louisville, KY-IN 863,582 DR 3,843.1 34 218.4 38Cincinnati, OH-KY-IN 1,503,262 DR 3,706.1 35 214.4 40Salem, OR 207,229 DR 3,486.0 36 233.5 35Dayton, OH 703,444 DR 3,455.5 37 216.1 39Sacramento, CA 1,393,498 DR 3,350.4 38 219.1 37Tucson, AZ 720,425 DR 3,257.6 39 255.7 30Jacksonville, FL 882,295 DR 3,230.5 40 203.7 42Austin, TX 901,920 DR 2,942.6 41 233.5 36Virginia Beach, VA 1,394,439 DR 2,914.3 42 188.1 45Greensboro, NC 267,884 DR 2,901.2 43 209.8 41Columbus, OH 1,133,193 DR 2,875.8 44 143.0 57Springfield, MA-CT 573,610 DR 2,820.2 45 179.9 47Barnstable Town, MA 243,667 DR 2,800.6 46 156.7 52Salt Lake City, UT 887,650 DR 2,767.1 47 197.2 44Hartford, CT 851,535 DR 2,734.9 48 239.5 33Grand Rapids, MI 539,080 DR 2,671.7 49 184.8 46Richmond, VA 818,836 DR 2,603.6 50 148.7 53Spokane, WA-ID 334,858 DR 2,592.4 51 172.7 50Lansing, MI 300,032 DR 2,580.1 52 174.4 48Indianapolis, IN 1,218,919 DR 2,572.2 53 160.8 51Charlotte, NC-SC 758,927 DR 2,479.5 54 132.0 61Tampa-St. Petersburg, FL 2,062,339 DR 2,470.1 55 122.5 66Port Huron, MI 86,486 DR 2,359.6 56 145.8 55Leominster-Fitchburg, MA 112,943 DR 2,340.0 57 140.9 58Lancaster, PA 323,554 DR 2,154.4 58 146.4 54Kennewick-Richland, WA 153,851 DR 2,112.0 59 128.6 63Wichita, KS 422,301 DR 2,095.1 60 200.8 43Daytona Beach-Port Orange, FL 255,353 DR 2,065.9 61 134.0 60Durham, NC 287,796 DR 2,036.5 62 114.9 71Spartanburg, SC 145,058 DR 1,923.8 63 116.8 68Nashville-Davidson, TN 749,935 DR 1,916.0 64 115.9 69Albuquerque, NM 598,191 DR 1,914.4 65 105.8 79El Paso, TX-NM 674,801 DR 1,909.4 66 115.5 70Sarasota-Bradenton, FL 559,229 DR 1,867.2 67 131.2 62Leesburg-Eustis, FL 97,497 DR 1,844.6 68 112.3 73Killeen, TX 167,976 DR 1,837.5 69 114.4 72New Haven, CT 531,314 DR 1,778.1 70 128.2 64Madison, WI 329,533 DR 1,767.1 71 108.4 77Florence, SC 67,314 DR 1,749.5 72 83.6 96Youngstown, OH-PA 417,437 DR 1,746.1 73 102.5 82Concord, CA 552,624 DR 1,707.0 74 108.7 76Sherman, TX 56,168 DR 1,705.1 75 95.9 87Memphis, TN-MS-AR 972,091 DR 1,704.3 76 108.7 75Knoxville, TN 419,830 DR 1,703.7 77 97.6 85Palm Bay-Melbourne, FL 393,289 DR 1,675.9 78 91.6 90Bridgeport-Stamford, CT-NY 888,890 DR 1,617.4 79 140.9 59Akron, OH 570,215 DR 1,616.7 80 125.5 65
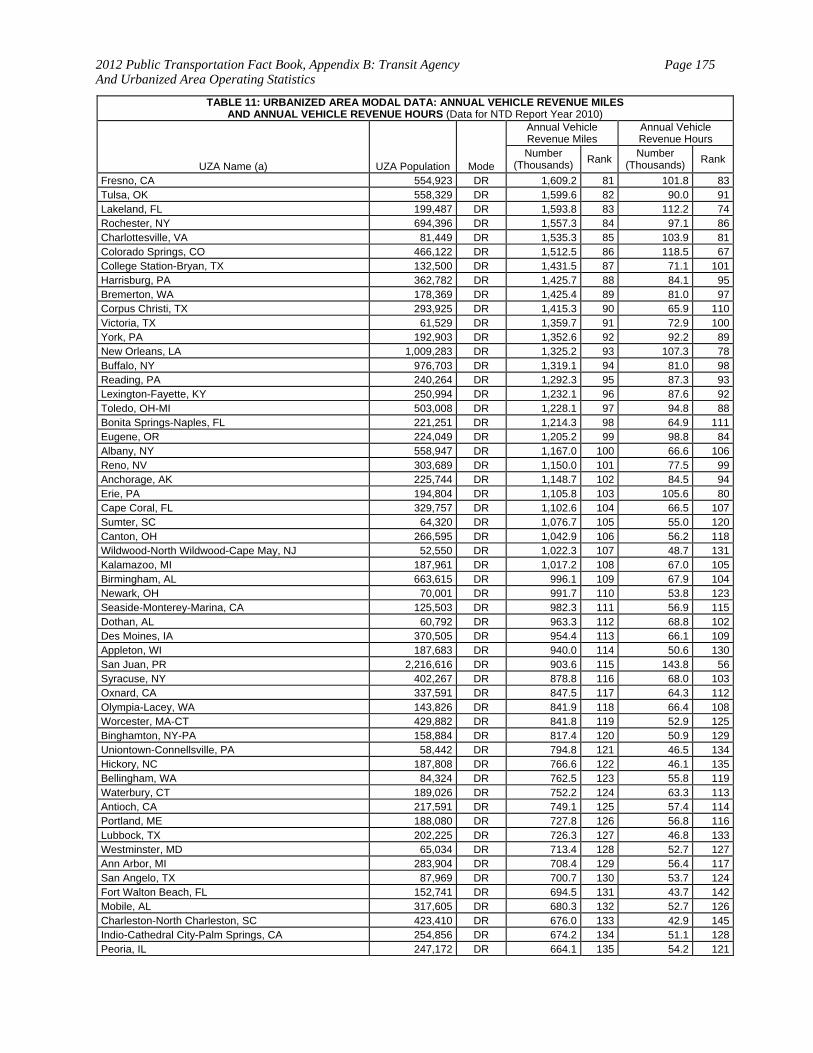
2012 Public Transportation Fact Book, Appendix B: Transit Agency And Urbanized Area Operating Statistics
Page 175
TABLE 11: URBANIZED AREA MODAL DATA: ANNUAL VEHICLE REVENUE MILES AND ANNUAL VEHICLE REVENUE HOURS (Data for NTD Report Year 2010)
UZA Name (a) UZA Population Mode
Annual Vehicle Revenue Miles
Annual Vehicle Revenue Hours
Number (Thousands) Rank
Number (Thousands) Rank
Fresno, CA 554,923 DR 1,609.2 81 101.8 83Tulsa, OK 558,329 DR 1,599.6 82 90.0 91Lakeland, FL 199,487 DR 1,593.8 83 112.2 74Rochester, NY 694,396 DR 1,557.3 84 97.1 86Charlottesville, VA 81,449 DR 1,535.3 85 103.9 81Colorado Springs, CO 466,122 DR 1,512.5 86 118.5 67College Station-Bryan, TX 132,500 DR 1,431.5 87 71.1 101Harrisburg, PA 362,782 DR 1,425.7 88 84.1 95Bremerton, WA 178,369 DR 1,425.4 89 81.0 97Corpus Christi, TX 293,925 DR 1,415.3 90 65.9 110Victoria, TX 61,529 DR 1,359.7 91 72.9 100York, PA 192,903 DR 1,352.6 92 92.2 89New Orleans, LA 1,009,283 DR 1,325.2 93 107.3 78Buffalo, NY 976,703 DR 1,319.1 94 81.0 98Reading, PA 240,264 DR 1,292.3 95 87.3 93Lexington-Fayette, KY 250,994 DR 1,232.1 96 87.6 92Toledo, OH-MI 503,008 DR 1,228.1 97 94.8 88Bonita Springs-Naples, FL 221,251 DR 1,214.3 98 64.9 111Eugene, OR 224,049 DR 1,205.2 99 98.8 84Albany, NY 558,947 DR 1,167.0 100 66.6 106Reno, NV 303,689 DR 1,150.0 101 77.5 99Anchorage, AK 225,744 DR 1,148.7 102 84.5 94Erie, PA 194,804 DR 1,105.8 103 105.6 80Cape Coral, FL 329,757 DR 1,102.6 104 66.5 107Sumter, SC 64,320 DR 1,076.7 105 55.0 120Canton, OH 266,595 DR 1,042.9 106 56.2 118Wildwood-North Wildwood-Cape May, NJ 52,550 DR 1,022.3 107 48.7 131Kalamazoo, MI 187,961 DR 1,017.2 108 67.0 105Birmingham, AL 663,615 DR 996.1 109 67.9 104Newark, OH 70,001 DR 991.7 110 53.8 123Seaside-Monterey-Marina, CA 125,503 DR 982.3 111 56.9 115Dothan, AL 60,792 DR 963.3 112 68.8 102Des Moines, IA 370,505 DR 954.4 113 66.1 109Appleton, WI 187,683 DR 940.0 114 50.6 130San Juan, PR 2,216,616 DR 903.6 115 143.8 56Syracuse, NY 402,267 DR 878.8 116 68.0 103Oxnard, CA 337,591 DR 847.5 117 64.3 112Olympia-Lacey, WA 143,826 DR 841.9 118 66.4 108Worcester, MA-CT 429,882 DR 841.8 119 52.9 125Binghamton, NY-PA 158,884 DR 817.4 120 50.9 129Uniontown-Connellsville, PA 58,442 DR 794.8 121 46.5 134Hickory, NC 187,808 DR 766.6 122 46.1 135Bellingham, WA 84,324 DR 762.5 123 55.8 119Waterbury, CT 189,026 DR 752.2 124 63.3 113Antioch, CA 217,591 DR 749.1 125 57.4 114Portland, ME 188,080 DR 727.8 126 56.8 116Lubbock, TX 202,225 DR 726.3 127 46.8 133Westminster, MD 65,034 DR 713.4 128 52.7 127Ann Arbor, MI 283,904 DR 708.4 129 56.4 117San Angelo, TX 87,969 DR 700.7 130 53.7 124Fort Walton Beach, FL 152,741 DR 694.5 131 43.7 142Mobile, AL 317,605 DR 680.3 132 52.7 126Charleston-North Charleston, SC 423,410 DR 676.0 133 42.9 145Indio-Cathedral City-Palm Springs, CA 254,856 DR 674.2 134 51.1 128Peoria, IL 247,172 DR 664.1 135 54.2 121
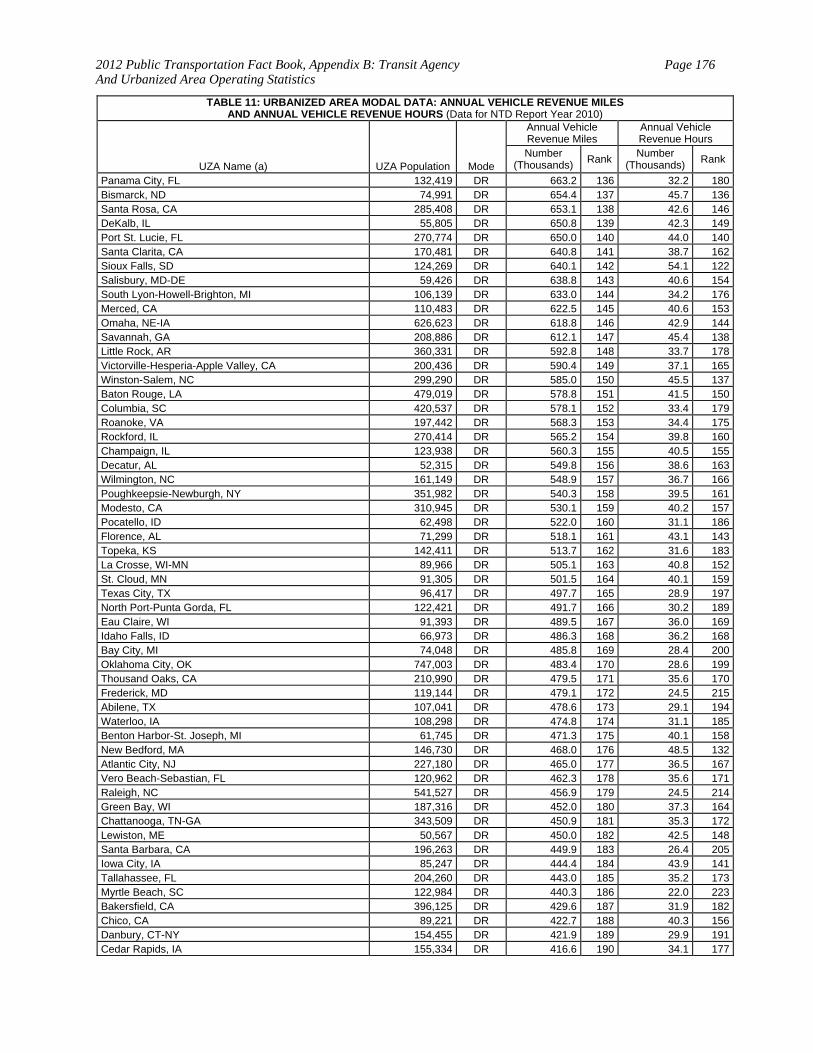
2012 Public Transportation Fact Book, Appendix B: Transit Agency And Urbanized Area Operating Statistics
Page 176
TABLE 11: URBANIZED AREA MODAL DATA: ANNUAL VEHICLE REVENUE MILES AND ANNUAL VEHICLE REVENUE HOURS (Data for NTD Report Year 2010)
UZA Name (a) UZA Population Mode
Annual Vehicle Revenue Miles
Annual Vehicle Revenue Hours
Number (Thousands) Rank
Number (Thousands) Rank
Panama City, FL 132,419 DR 663.2 136 32.2 180Bismarck, ND 74,991 DR 654.4 137 45.7 136Santa Rosa, CA 285,408 DR 653.1 138 42.6 146DeKalb, IL 55,805 DR 650.8 139 42.3 149Port St. Lucie, FL 270,774 DR 650.0 140 44.0 140Santa Clarita, CA 170,481 DR 640.8 141 38.7 162Sioux Falls, SD 124,269 DR 640.1 142 54.1 122Salisbury, MD-DE 59,426 DR 638.8 143 40.6 154South Lyon-Howell-Brighton, MI 106,139 DR 633.0 144 34.2 176Merced, CA 110,483 DR 622.5 145 40.6 153Omaha, NE-IA 626,623 DR 618.8 146 42.9 144Savannah, GA 208,886 DR 612.1 147 45.4 138Little Rock, AR 360,331 DR 592.8 148 33.7 178Victorville-Hesperia-Apple Valley, CA 200,436 DR 590.4 149 37.1 165Winston-Salem, NC 299,290 DR 585.0 150 45.5 137Baton Rouge, LA 479,019 DR 578.8 151 41.5 150Columbia, SC 420,537 DR 578.1 152 33.4 179Roanoke, VA 197,442 DR 568.3 153 34.4 175Rockford, IL 270,414 DR 565.2 154 39.8 160Champaign, IL 123,938 DR 560.3 155 40.5 155Decatur, AL 52,315 DR 549.8 156 38.6 163Wilmington, NC 161,149 DR 548.9 157 36.7 166Poughkeepsie-Newburgh, NY 351,982 DR 540.3 158 39.5 161Modesto, CA 310,945 DR 530.1 159 40.2 157Pocatello, ID 62,498 DR 522.0 160 31.1 186Florence, AL 71,299 DR 518.1 161 43.1 143Topeka, KS 142,411 DR 513.7 162 31.6 183La Crosse, WI-MN 89,966 DR 505.1 163 40.8 152St. Cloud, MN 91,305 DR 501.5 164 40.1 159Texas City, TX 96,417 DR 497.7 165 28.9 197North Port-Punta Gorda, FL 122,421 DR 491.7 166 30.2 189Eau Claire, WI 91,393 DR 489.5 167 36.0 169Idaho Falls, ID 66,973 DR 486.3 168 36.2 168Bay City, MI 74,048 DR 485.8 169 28.4 200Oklahoma City, OK 747,003 DR 483.4 170 28.6 199Thousand Oaks, CA 210,990 DR 479.5 171 35.6 170Frederick, MD 119,144 DR 479.1 172 24.5 215Abilene, TX 107,041 DR 478.6 173 29.1 194Waterloo, IA 108,298 DR 474.8 174 31.1 185Benton Harbor-St. Joseph, MI 61,745 DR 471.3 175 40.1 158New Bedford, MA 146,730 DR 468.0 176 48.5 132Atlantic City, NJ 227,180 DR 465.0 177 36.5 167Vero Beach-Sebastian, FL 120,962 DR 462.3 178 35.6 171Raleigh, NC 541,527 DR 456.9 179 24.5 214Green Bay, WI 187,316 DR 452.0 180 37.3 164Chattanooga, TN-GA 343,509 DR 450.9 181 35.3 172Lewiston, ME 50,567 DR 450.0 182 42.5 148Santa Barbara, CA 196,263 DR 449.9 183 26.4 205Iowa City, IA 85,247 DR 444.4 184 43.9 141Tallahassee, FL 204,260 DR 443.0 185 35.2 173Myrtle Beach, SC 122,984 DR 440.3 186 22.0 223Bakersfield, CA 396,125 DR 429.6 187 31.9 182Chico, CA 89,221 DR 422.7 188 40.3 156Danbury, CT-NY 154,455 DR 421.9 189 29.9 191Cedar Rapids, IA 155,334 DR 416.6 190 34.1 177
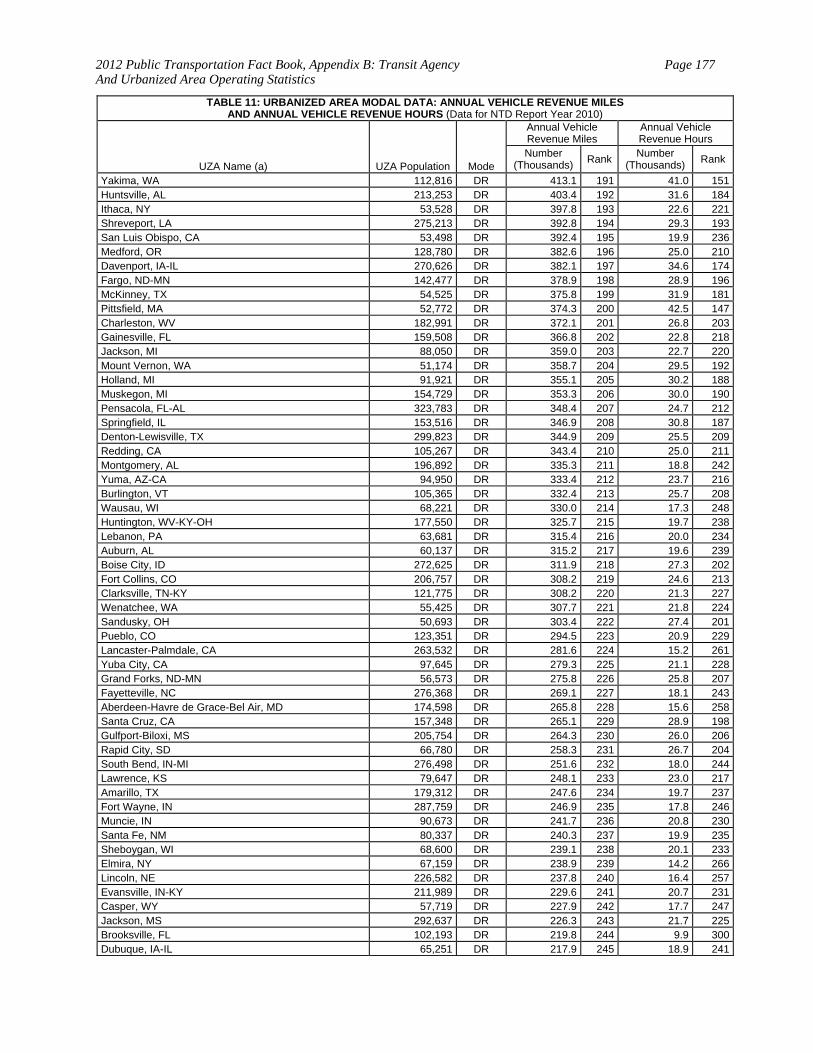
2012 Public Transportation Fact Book, Appendix B: Transit Agency And Urbanized Area Operating Statistics
Page 177
TABLE 11: URBANIZED AREA MODAL DATA: ANNUAL VEHICLE REVENUE MILES AND ANNUAL VEHICLE REVENUE HOURS (Data for NTD Report Year 2010)
UZA Name (a) UZA Population Mode
Annual Vehicle Revenue Miles
Annual Vehicle Revenue Hours
Number (Thousands) Rank
Number (Thousands) Rank
Yakima, WA 112,816 DR 413.1 191 41.0 151Huntsville, AL 213,253 DR 403.4 192 31.6 184Ithaca, NY 53,528 DR 397.8 193 22.6 221Shreveport, LA 275,213 DR 392.8 194 29.3 193San Luis Obispo, CA 53,498 DR 392.4 195 19.9 236Medford, OR 128,780 DR 382.6 196 25.0 210Davenport, IA-IL 270,626 DR 382.1 197 34.6 174Fargo, ND-MN 142,477 DR 378.9 198 28.9 196McKinney, TX 54,525 DR 375.8 199 31.9 181Pittsfield, MA 52,772 DR 374.3 200 42.5 147Charleston, WV 182,991 DR 372.1 201 26.8 203Gainesville, FL 159,508 DR 366.8 202 22.8 218Jackson, MI 88,050 DR 359.0 203 22.7 220Mount Vernon, WA 51,174 DR 358.7 204 29.5 192Holland, MI 91,921 DR 355.1 205 30.2 188Muskegon, MI 154,729 DR 353.3 206 30.0 190Pensacola, FL-AL 323,783 DR 348.4 207 24.7 212Springfield, IL 153,516 DR 346.9 208 30.8 187Denton-Lewisville, TX 299,823 DR 344.9 209 25.5 209Redding, CA 105,267 DR 343.4 210 25.0 211Montgomery, AL 196,892 DR 335.3 211 18.8 242Yuma, AZ-CA 94,950 DR 333.4 212 23.7 216Burlington, VT 105,365 DR 332.4 213 25.7 208Wausau, WI 68,221 DR 330.0 214 17.3 248Huntington, WV-KY-OH 177,550 DR 325.7 215 19.7 238Lebanon, PA 63,681 DR 315.4 216 20.0 234Auburn, AL 60,137 DR 315.2 217 19.6 239Boise City, ID 272,625 DR 311.9 218 27.3 202Fort Collins, CO 206,757 DR 308.2 219 24.6 213Clarksville, TN-KY 121,775 DR 308.2 220 21.3 227Wenatchee, WA 55,425 DR 307.7 221 21.8 224Sandusky, OH 50,693 DR 303.4 222 27.4 201Pueblo, CO 123,351 DR 294.5 223 20.9 229Lancaster-Palmdale, CA 263,532 DR 281.6 224 15.2 261Yuba City, CA 97,645 DR 279.3 225 21.1 228Grand Forks, ND-MN 56,573 DR 275.8 226 25.8 207Fayetteville, NC 276,368 DR 269.1 227 18.1 243Aberdeen-Havre de Grace-Bel Air, MD 174,598 DR 265.8 228 15.6 258Santa Cruz, CA 157,348 DR 265.1 229 28.9 198Gulfport-Biloxi, MS 205,754 DR 264.3 230 26.0 206Rapid City, SD 66,780 DR 258.3 231 26.7 204South Bend, IN-MI 276,498 DR 251.6 232 18.0 244Lawrence, KS 79,647 DR 248.1 233 23.0 217Amarillo, TX 179,312 DR 247.6 234 19.7 237Fort Wayne, IN 287,759 DR 246.9 235 17.8 246Muncie, IN 90,673 DR 241.7 236 20.8 230Santa Fe, NM 80,337 DR 240.3 237 19.9 235Sheboygan, WI 68,600 DR 239.1 238 20.1 233Elmira, NY 67,159 DR 238.9 239 14.2 266Lincoln, NE 226,582 DR 237.8 240 16.4 257Evansville, IN-KY 211,989 DR 229.6 241 20.7 231Casper, WY 57,719 DR 227.9 242 17.7 247Jackson, MS 292,637 DR 226.3 243 21.7 225Brooksville, FL 102,193 DR 219.8 244 9.9 300Dubuque, IA-IL 65,251 DR 217.9 245 18.9 241

2012 Public Transportation Fact Book, Appendix B: Transit Agency And Urbanized Area Operating Statistics
Page 178
TABLE 11: URBANIZED AREA MODAL DATA: ANNUAL VEHICLE REVENUE MILES AND ANNUAL VEHICLE REVENUE HOURS (Data for NTD Report Year 2010)
UZA Name (a) UZA Population Mode
Annual Vehicle Revenue Miles
Annual Vehicle Revenue Hours
Number (Thousands) Rank
Number (Thousands) Rank
Murfreesboro, TN 135,855 DR 215.3 246 44.8 139El Centro, CA 52,954 DR 213.1 247 12.2 285Fayetteville-Springdale, AR 172,585 DR 213.0 248 19.5 240Las Cruces, NM 104,186 DR 204.8 249 22.8 219Waco, TX 153,198 DR 204.2 250 16.6 255Jefferson City, MO 53,714 DR 201.8 251 13.6 275Columbus, GA-AL 242,324 DR 201.3 252 12.3 284Duluth, MN-WI 118,265 DR 200.1 253 15.1 262Laredo, TX 175,586 DR 199.5 254 29.0 195Fairfield, CA 112,446 DR 199.1 255 13.1 277Jackson, TN 65,086 DR 193.9 256 14.6 264Johnson City, TN 102,456 DR 191.2 257 22.1 222Asheville, NC 221,570 DR 190.6 258 10.6 294Simi Valley, CA 112,345 DR 189.3 259 17.8 245St. Charles, MD 74,765 DR 188.8 260 15.5 259Longview, WA-OR 60,443 DR 188.4 261 20.2 232Bloomington-Normal, IL 112,415 DR 188.3 262 16.7 252Fort Smith, AR-OK 106,470 DR 186.8 263 13.6 273Kokomo, IN 63,739 DR 186.2 264 21.5 226Elkhart, IN-MI 131,226 DR 185.1 265 11.9 289Stockton, CA 313,392 DR 181.9 266 15.1 263Lafayette, LA 178,079 DR 181.6 267 16.9 251Napa, CA 79,867 DR 180.3 268 17.0 250Rochester, MN 91,271 DR 178.2 269 12.2 287Utica, NY 113,409 DR 176.6 270 16.7 253Cumberland, MD--WV 52,115 DR 176.1 271 11.2 291Billings, MT 100,317 DR 175.3 272 16.5 256Scranton, PA 385,237 DR 174.6 273 12.7 279Oshkosh, WI 71,070 DR 173.2 274 10.5 296Brownsville, TX 165,776 DR 172.7 275 13.9 271Johnstown, PA 76,113 DR 166.3 276 9.2 311Fond du Lac, WI 50,058 DR 165.3 277 13.6 272Gainesville, GA 88,680 DR 163.4 278 10.2 299Lodi, CA 83,735 DR 162.9 279 17.2 249Kenosha, WI 110,942 DR 158.8 280 12.2 286Racine, WI 129,545 DR 154.6 281 13.6 274Columbia, MO 98,779 DR 152.4 282 16.7 254Fairbanks, AK 51,926 DR 149.3 283 11.5 290Bend, OR 57,525 DR 148.2 284 14.0 270Visalia, CA 120,044 DR 147.2 285 10.5 295Nashua, NH-MA 197,155 DR 145.7 286 9.8 303Greeley, CO 93,879 DR 144.2 287 12.7 278Cheyenne, WY 68,202 DR 143.6 288 9.8 304Beaumont, TX 139,304 DR 141.7 289 12.0 288Norman, OK 86,478 DR 140.1 290 14.0 268Santa Maria, CA 120,297 DR 135.3 291 9.9 301Sioux City, IA-NE-SD 106,119 DR 134.5 292 12.5 283Vallejo, CA 158,967 DR 133.9 293 12.6 282Anderson, IN 97,038 DR 133.5 294 10.2 298State College, PA 71,301 DR 133.4 295 6.5 330Odessa, TX 111,395 DR 130.5 296 9.8 305Battle Creek, MI 79,135 DR 127.9 297 12.7 280Bloomington, IN 92,456 DR 127.9 298 14.1 267Great Falls, MT 64,387 DR 127.3 299 11.0 293High Point, NC 132,844 DR 126.0 300 12.6 281
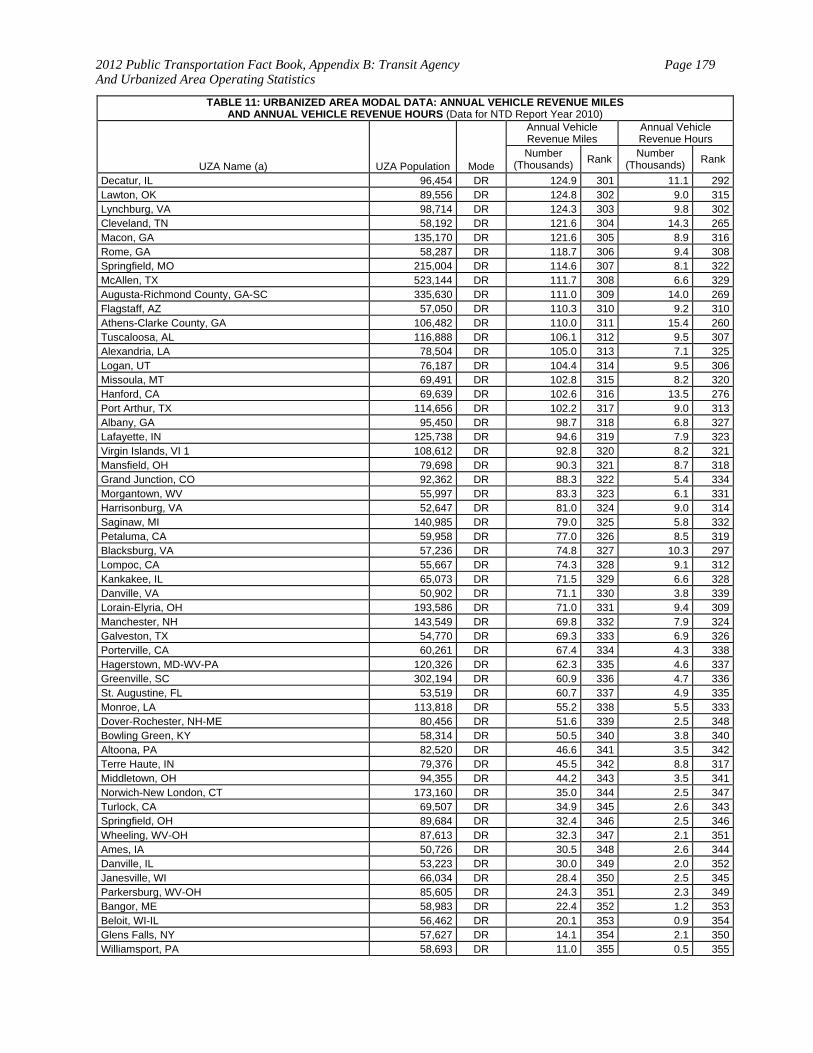
2012 Public Transportation Fact Book, Appendix B: Transit Agency And Urbanized Area Operating Statistics
Page 179
TABLE 11: URBANIZED AREA MODAL DATA: ANNUAL VEHICLE REVENUE MILES AND ANNUAL VEHICLE REVENUE HOURS (Data for NTD Report Year 2010)
UZA Name (a) UZA Population Mode
Annual Vehicle Revenue Miles
Annual Vehicle Revenue Hours
Number (Thousands) Rank
Number (Thousands) Rank
Decatur, IL 96,454 DR 124.9 301 11.1 292Lawton, OK 89,556 DR 124.8 302 9.0 315Lynchburg, VA 98,714 DR 124.3 303 9.8 302Cleveland, TN 58,192 DR 121.6 304 14.3 265Macon, GA 135,170 DR 121.6 305 8.9 316Rome, GA 58,287 DR 118.7 306 9.4 308Springfield, MO 215,004 DR 114.6 307 8.1 322McAllen, TX 523,144 DR 111.7 308 6.6 329Augusta-Richmond County, GA-SC 335,630 DR 111.0 309 14.0 269Flagstaff, AZ 57,050 DR 110.3 310 9.2 310Athens-Clarke County, GA 106,482 DR 110.0 311 15.4 260Tuscaloosa, AL 116,888 DR 106.1 312 9.5 307Alexandria, LA 78,504 DR 105.0 313 7.1 325Logan, UT 76,187 DR 104.4 314 9.5 306Missoula, MT 69,491 DR 102.8 315 8.2 320Hanford, CA 69,639 DR 102.6 316 13.5 276Port Arthur, TX 114,656 DR 102.2 317 9.0 313Albany, GA 95,450 DR 98.7 318 6.8 327Lafayette, IN 125,738 DR 94.6 319 7.9 323Virgin Islands, VI 1 108,612 DR 92.8 320 8.2 321Mansfield, OH 79,698 DR 90.3 321 8.7 318Grand Junction, CO 92,362 DR 88.3 322 5.4 334Morgantown, WV 55,997 DR 83.3 323 6.1 331Harrisonburg, VA 52,647 DR 81.0 324 9.0 314Saginaw, MI 140,985 DR 79.0 325 5.8 332Petaluma, CA 59,958 DR 77.0 326 8.5 319Blacksburg, VA 57,236 DR 74.8 327 10.3 297Lompoc, CA 55,667 DR 74.3 328 9.1 312Kankakee, IL 65,073 DR 71.5 329 6.6 328Danville, VA 50,902 DR 71.1 330 3.8 339Lorain-Elyria, OH 193,586 DR 71.0 331 9.4 309Manchester, NH 143,549 DR 69.8 332 7.9 324Galveston, TX 54,770 DR 69.3 333 6.9 326Porterville, CA 60,261 DR 67.4 334 4.3 338Hagerstown, MD-WV-PA 120,326 DR 62.3 335 4.6 337Greenville, SC 302,194 DR 60.9 336 4.7 336St. Augustine, FL 53,519 DR 60.7 337 4.9 335Monroe, LA 113,818 DR 55.2 338 5.5 333Dover-Rochester, NH-ME 80,456 DR 51.6 339 2.5 348Bowling Green, KY 58,314 DR 50.5 340 3.8 340Altoona, PA 82,520 DR 46.6 341 3.5 342Terre Haute, IN 79,376 DR 45.5 342 8.8 317Middletown, OH 94,355 DR 44.2 343 3.5 341Norwich-New London, CT 173,160 DR 35.0 344 2.5 347Turlock, CA 69,507 DR 34.9 345 2.6 343Springfield, OH 89,684 DR 32.4 346 2.5 346Wheeling, WV-OH 87,613 DR 32.3 347 2.1 351Ames, IA 50,726 DR 30.5 348 2.6 344Danville, IL 53,223 DR 30.0 349 2.0 352Janesville, WI 66,034 DR 28.4 350 2.5 345Parkersburg, WV-OH 85,605 DR 24.3 351 2.3 349Bangor, ME 58,983 DR 22.4 352 1.2 353Beloit, WI-IL 56,462 DR 20.1 353 0.9 354Glens Falls, NY 57,627 DR 14.1 354 2.1 350Williamsport, PA 58,693 DR 11.0 355 0.5 355
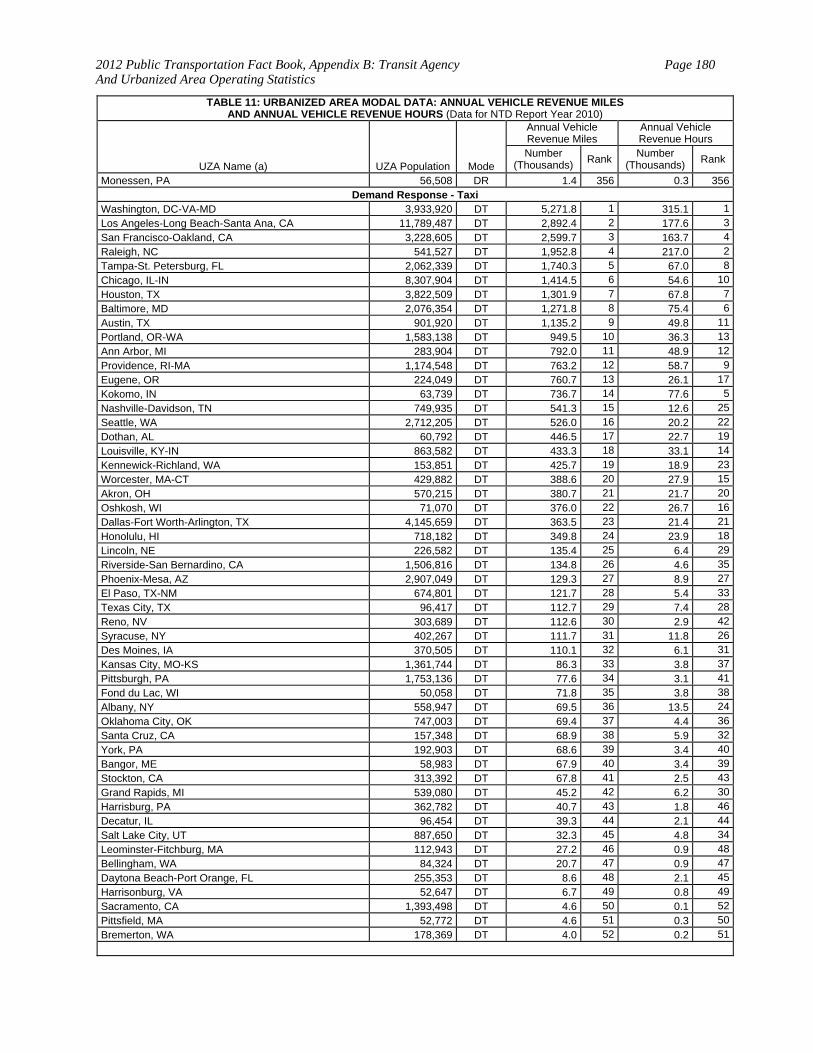
2012 Public Transportation Fact Book, Appendix B: Transit Agency And Urbanized Area Operating Statistics
Page 180
TABLE 11: URBANIZED AREA MODAL DATA: ANNUAL VEHICLE REVENUE MILES AND ANNUAL VEHICLE REVENUE HOURS (Data for NTD Report Year 2010)
UZA Name (a) UZA Population Mode
Annual Vehicle Revenue Miles
Annual Vehicle Revenue Hours
Number (Thousands) Rank
Number (Thousands) Rank
Monessen, PA 56,508 DR 1.4 356 0.3 356Demand Response - Taxi
Washington, DC-VA-MD 3,933,920 DT 5,271.8 1 315.1 1
Los Angeles-Long Beach-Santa Ana, CA 11,789,487 DT 2,892.4 2 177.6 3
San Francisco-Oakland, CA 3,228,605 DT 2,599.7 3 163.7 4
Raleigh, NC 541,527 DT 1,952.8 4 217.0 2
Tampa-St. Petersburg, FL 2,062,339 DT 1,740.3 5 67.0 8
Chicago, IL-IN 8,307,904 DT 1,414.5 6 54.6 10
Houston, TX 3,822,509 DT 1,301.9 7 67.8 7
Baltimore, MD 2,076,354 DT 1,271.8 8 75.4 6
Austin, TX 901,920 DT 1,135.2 9 49.8 11
Portland, OR-WA 1,583,138 DT 949.5 10 36.3 13
Ann Arbor, MI 283,904 DT 792.0 11 48.9 12
Providence, RI-MA 1,174,548 DT 763.2 12 58.7 9
Eugene, OR 224,049 DT 760.7 13 26.1 17
Kokomo, IN 63,739 DT 736.7 14 77.6 5
Nashville-Davidson, TN 749,935 DT 541.3 15 12.6 25
Seattle, WA 2,712,205 DT 526.0 16 20.2 22
Dothan, AL 60,792 DT 446.5 17 22.7 19
Louisville, KY-IN 863,582 DT 433.3 18 33.1 14
Kennewick-Richland, WA 153,851 DT 425.7 19 18.9 23
Worcester, MA-CT 429,882 DT 388.6 20 27.9 15
Akron, OH 570,215 DT 380.7 21 21.7 20
Oshkosh, WI 71,070 DT 376.0 22 26.7 16
Dallas-Fort Worth-Arlington, TX 4,145,659 DT 363.5 23 21.4 21
Honolulu, HI 718,182 DT 349.8 24 23.9 18
Lincoln, NE 226,582 DT 135.4 25 6.4 29
Riverside-San Bernardino, CA 1,506,816 DT 134.8 26 4.6 35
Phoenix-Mesa, AZ 2,907,049 DT 129.3 27 8.9 27
El Paso, TX-NM 674,801 DT 121.7 28 5.4 33
Texas City, TX 96,417 DT 112.7 29 7.4 28
Reno, NV 303,689 DT 112.6 30 2.9 42
Syracuse, NY 402,267 DT 111.7 31 11.8 26
Des Moines, IA 370,505 DT 110.1 32 6.1 31
Kansas City, MO-KS 1,361,744 DT 86.3 33 3.8 37
Pittsburgh, PA 1,753,136 DT 77.6 34 3.1 41
Fond du Lac, WI 50,058 DT 71.8 35 3.8 38
Albany, NY 558,947 DT 69.5 36 13.5 24
Oklahoma City, OK 747,003 DT 69.4 37 4.4 36
Santa Cruz, CA 157,348 DT 68.9 38 5.9 32
York, PA 192,903 DT 68.6 39 3.4 40
Bangor, ME 58,983 DT 67.9 40 3.4 39
Stockton, CA 313,392 DT 67.8 41 2.5 43
Grand Rapids, MI 539,080 DT 45.2 42 6.2 30
Harrisburg, PA 362,782 DT 40.7 43 1.8 46
Decatur, IL 96,454 DT 39.3 44 2.1 44
Salt Lake City, UT 887,650 DT 32.3 45 4.8 34
Leominster-Fitchburg, MA 112,943 DT 27.2 46 0.9 48
Bellingham, WA 84,324 DT 20.7 47 0.9 47
Daytona Beach-Port Orange, FL 255,353 DT 8.6 48 2.1 45
Harrisonburg, VA 52,647 DT 6.7 49 0.8 49
Sacramento, CA 1,393,498 DT 4.6 50 0.1 52
Pittsfield, MA 52,772 DT 4.6 51 0.3 50
Bremerton, WA 178,369 DT 4.0 52 0.2 51
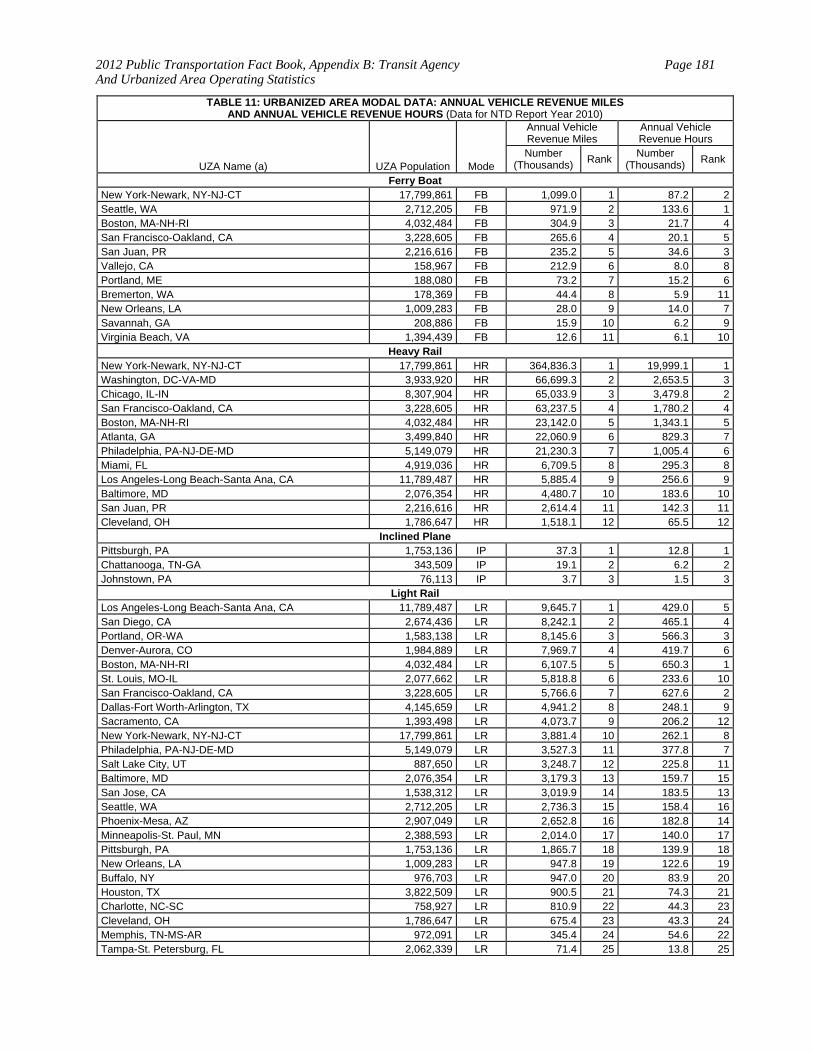
2012 Public Transportation Fact Book, Appendix B: Transit Agency And Urbanized Area Operating Statistics
Page 181
TABLE 11: URBANIZED AREA MODAL DATA: ANNUAL VEHICLE REVENUE MILES AND ANNUAL VEHICLE REVENUE HOURS (Data for NTD Report Year 2010)
UZA Name (a) UZA Population Mode
Annual Vehicle Revenue Miles
Annual Vehicle Revenue Hours
Number (Thousands) Rank
Number (Thousands) Rank
Ferry Boat New York-Newark, NY-NJ-CT 17,799,861 FB 1,099.0 1 87.2 2Seattle, WA 2,712,205 FB 971.9 2 133.6 1Boston, MA-NH-RI 4,032,484 FB 304.9 3 21.7 4San Francisco-Oakland, CA 3,228,605 FB 265.6 4 20.1 5San Juan, PR 2,216,616 FB 235.2 5 34.6 3Vallejo, CA 158,967 FB 212.9 6 8.0 8Portland, ME 188,080 FB 73.2 7 15.2 6Bremerton, WA 178,369 FB 44.4 8 5.9 11New Orleans, LA 1,009,283 FB 28.0 9 14.0 7Savannah, GA 208,886 FB 15.9 10 6.2 9Virginia Beach, VA 1,394,439 FB 12.6 11 6.1 10
Heavy Rail New York-Newark, NY-NJ-CT 17,799,861 HR 364,836.3 1 19,999.1 1Washington, DC-VA-MD 3,933,920 HR 66,699.3 2 2,653.5 3Chicago, IL-IN 8,307,904 HR 65,033.9 3 3,479.8 2San Francisco-Oakland, CA 3,228,605 HR 63,237.5 4 1,780.2 4Boston, MA-NH-RI 4,032,484 HR 23,142.0 5 1,343.1 5Atlanta, GA 3,499,840 HR 22,060.9 6 829.3 7Philadelphia, PA-NJ-DE-MD 5,149,079 HR 21,230.3 7 1,005.4 6Miami, FL 4,919,036 HR 6,709.5 8 295.3 8Los Angeles-Long Beach-Santa Ana, CA 11,789,487 HR 5,885.4 9 256.6 9Baltimore, MD 2,076,354 HR 4,480.7 10 183.6 10San Juan, PR 2,216,616 HR 2,614.4 11 142.3 11Cleveland, OH 1,786,647 HR 1,518.1 12 65.5 12
Inclined Plane Pittsburgh, PA 1,753,136 IP 37.3 1 12.8 1Chattanooga, TN-GA 343,509 IP 19.1 2 6.2 2Johnstown, PA 76,113 IP 3.7 3 1.5 3
Light Rail Los Angeles-Long Beach-Santa Ana, CA 11,789,487 LR 9,645.7 1 429.0 5San Diego, CA 2,674,436 LR 8,242.1 2 465.1 4Portland, OR-WA 1,583,138 LR 8,145.6 3 566.3 3Denver-Aurora, CO 1,984,889 LR 7,969.7 4 419.7 6Boston, MA-NH-RI 4,032,484 LR 6,107.5 5 650.3 1St. Louis, MO-IL 2,077,662 LR 5,818.8 6 233.6 10San Francisco-Oakland, CA 3,228,605 LR 5,766.6 7 627.6 2Dallas-Fort Worth-Arlington, TX 4,145,659 LR 4,941.2 8 248.1 9Sacramento, CA 1,393,498 LR 4,073.7 9 206.2 12New York-Newark, NY-NJ-CT 17,799,861 LR 3,881.4 10 262.1 8Philadelphia, PA-NJ-DE-MD 5,149,079 LR 3,527.3 11 377.8 7Salt Lake City, UT 887,650 LR 3,248.7 12 225.8 11Baltimore, MD 2,076,354 LR 3,179.3 13 159.7 15San Jose, CA 1,538,312 LR 3,019.9 14 183.5 13Seattle, WA 2,712,205 LR 2,736.3 15 158.4 16Phoenix-Mesa, AZ 2,907,049 LR 2,652.8 16 182.8 14Minneapolis-St. Paul, MN 2,388,593 LR 2,014.0 17 140.0 17Pittsburgh, PA 1,753,136 LR 1,865.7 18 139.9 18New Orleans, LA 1,009,283 LR 947.8 19 122.6 19Buffalo, NY 976,703 LR 947.0 20 83.9 20Houston, TX 3,822,509 LR 900.5 21 74.3 21Charlotte, NC-SC 758,927 LR 810.9 22 44.3 23Cleveland, OH 1,786,647 LR 675.4 23 43.3 24Memphis, TN-MS-AR 972,091 LR 345.4 24 54.6 22Tampa-St. Petersburg, FL 2,062,339 LR 71.4 25 13.8 25
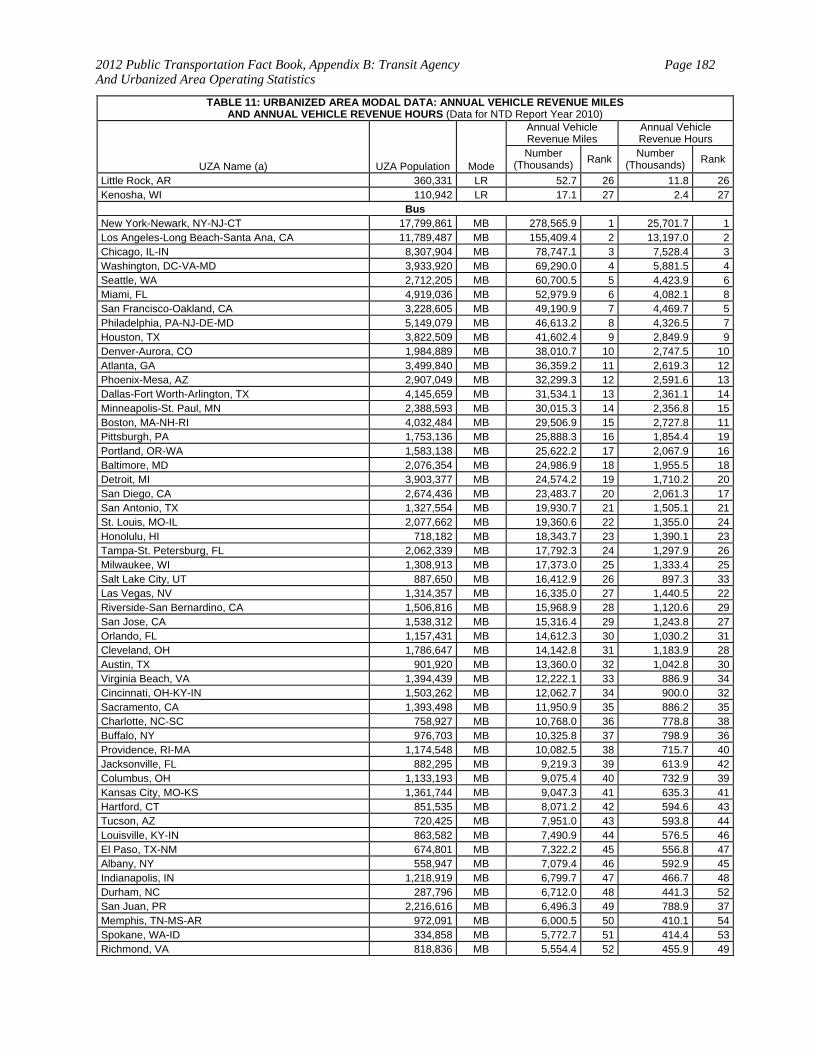
2012 Public Transportation Fact Book, Appendix B: Transit Agency And Urbanized Area Operating Statistics
Page 182
TABLE 11: URBANIZED AREA MODAL DATA: ANNUAL VEHICLE REVENUE MILES AND ANNUAL VEHICLE REVENUE HOURS (Data for NTD Report Year 2010)
UZA Name (a) UZA Population Mode
Annual Vehicle Revenue Miles
Annual Vehicle Revenue Hours
Number (Thousands) Rank
Number (Thousands) Rank
Little Rock, AR 360,331 LR 52.7 26 11.8 26Kenosha, WI 110,942 LR 17.1 27 2.4 27
Bus New York-Newark, NY-NJ-CT 17,799,861 MB 278,565.9 1 25,701.7 1Los Angeles-Long Beach-Santa Ana, CA 11,789,487 MB 155,409.4 2 13,197.0 2Chicago, IL-IN 8,307,904 MB 78,747.1 3 7,528.4 3Washington, DC-VA-MD 3,933,920 MB 69,290.0 4 5,881.5 4Seattle, WA 2,712,205 MB 60,700.5 5 4,423.9 6Miami, FL 4,919,036 MB 52,979.9 6 4,082.1 8San Francisco-Oakland, CA 3,228,605 MB 49,190.9 7 4,469.7 5Philadelphia, PA-NJ-DE-MD 5,149,079 MB 46,613.2 8 4,326.5 7Houston, TX 3,822,509 MB 41,602.4 9 2,849.9 9Denver-Aurora, CO 1,984,889 MB 38,010.7 10 2,747.5 10Atlanta, GA 3,499,840 MB 36,359.2 11 2,619.3 12Phoenix-Mesa, AZ 2,907,049 MB 32,299.3 12 2,591.6 13Dallas-Fort Worth-Arlington, TX 4,145,659 MB 31,534.1 13 2,361.1 14Minneapolis-St. Paul, MN 2,388,593 MB 30,015.3 14 2,356.8 15Boston, MA-NH-RI 4,032,484 MB 29,506.9 15 2,727.8 11Pittsburgh, PA 1,753,136 MB 25,888.3 16 1,854.4 19Portland, OR-WA 1,583,138 MB 25,622.2 17 2,067.9 16Baltimore, MD 2,076,354 MB 24,986.9 18 1,955.5 18Detroit, MI 3,903,377 MB 24,574.2 19 1,710.2 20San Diego, CA 2,674,436 MB 23,483.7 20 2,061.3 17San Antonio, TX 1,327,554 MB 19,930.7 21 1,505.1 21St. Louis, MO-IL 2,077,662 MB 19,360.6 22 1,355.0 24Honolulu, HI 718,182 MB 18,343.7 23 1,390.1 23Tampa-St. Petersburg, FL 2,062,339 MB 17,792.3 24 1,297.9 26Milwaukee, WI 1,308,913 MB 17,373.0 25 1,333.4 25Salt Lake City, UT 887,650 MB 16,412.9 26 897.3 33Las Vegas, NV 1,314,357 MB 16,335.0 27 1,440.5 22Riverside-San Bernardino, CA 1,506,816 MB 15,968.9 28 1,120.6 29San Jose, CA 1,538,312 MB 15,316.4 29 1,243.8 27Orlando, FL 1,157,431 MB 14,612.3 30 1,030.2 31Cleveland, OH 1,786,647 MB 14,142.8 31 1,183.9 28Austin, TX 901,920 MB 13,360.0 32 1,042.8 30Virginia Beach, VA 1,394,439 MB 12,222.1 33 886.9 34Cincinnati, OH-KY-IN 1,503,262 MB 12,062.7 34 900.0 32Sacramento, CA 1,393,498 MB 11,950.9 35 886.2 35Charlotte, NC-SC 758,927 MB 10,768.0 36 778.8 38Buffalo, NY 976,703 MB 10,325.8 37 798.9 36Providence, RI-MA 1,174,548 MB 10,082.5 38 715.7 40Jacksonville, FL 882,295 MB 9,219.3 39 613.9 42Columbus, OH 1,133,193 MB 9,075.4 40 732.9 39Kansas City, MO-KS 1,361,744 MB 9,047.3 41 635.3 41Hartford, CT 851,535 MB 8,071.2 42 594.6 43Tucson, AZ 720,425 MB 7,951.0 43 593.8 44Louisville, KY-IN 863,582 MB 7,490.9 44 576.5 46El Paso, TX-NM 674,801 MB 7,322.2 45 556.8 47Albany, NY 558,947 MB 7,079.4 46 592.9 45Indianapolis, IN 1,218,919 MB 6,799.7 47 466.7 48Durham, NC 287,796 MB 6,712.0 48 441.3 52San Juan, PR 2,216,616 MB 6,496.3 49 788.9 37Memphis, TN-MS-AR 972,091 MB 6,000.5 50 410.1 54Spokane, WA-ID 334,858 MB 5,772.7 51 414.4 53Richmond, VA 818,836 MB 5,554.4 52 455.9 49
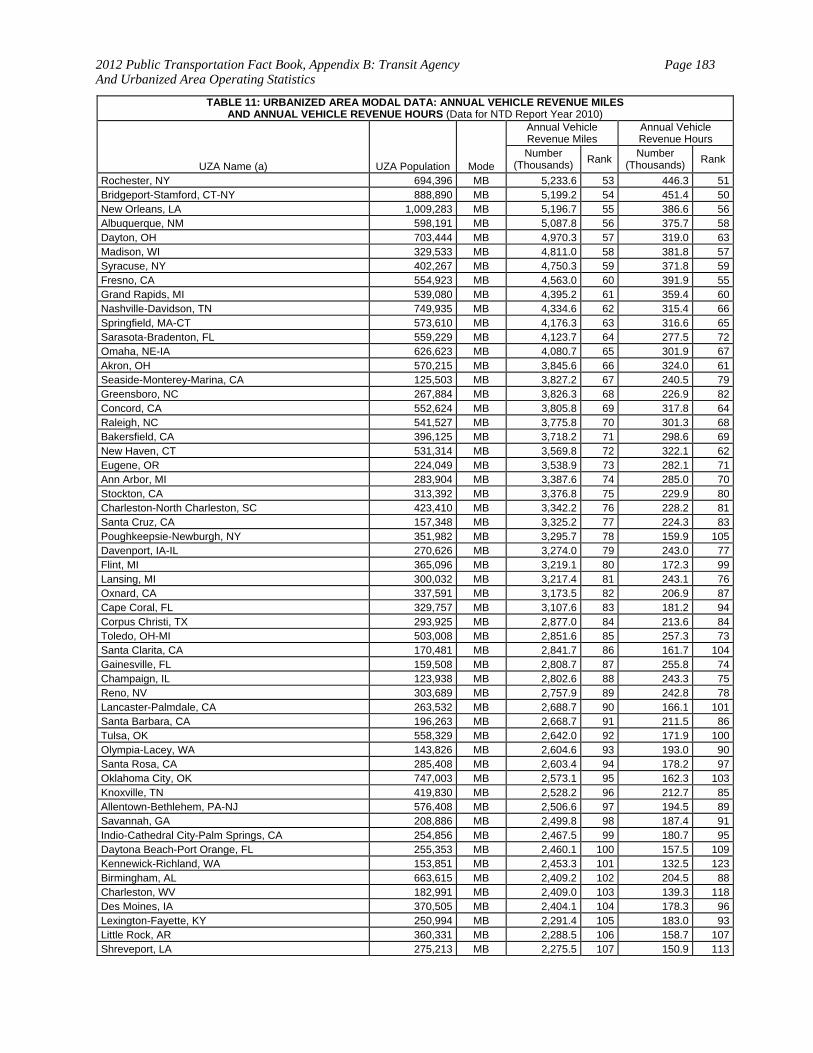
2012 Public Transportation Fact Book, Appendix B: Transit Agency And Urbanized Area Operating Statistics
Page 183
TABLE 11: URBANIZED AREA MODAL DATA: ANNUAL VEHICLE REVENUE MILES AND ANNUAL VEHICLE REVENUE HOURS (Data for NTD Report Year 2010)
UZA Name (a) UZA Population Mode
Annual Vehicle Revenue Miles
Annual Vehicle Revenue Hours
Number (Thousands) Rank
Number (Thousands) Rank
Rochester, NY 694,396 MB 5,233.6 53 446.3 51Bridgeport-Stamford, CT-NY 888,890 MB 5,199.2 54 451.4 50New Orleans, LA 1,009,283 MB 5,196.7 55 386.6 56Albuquerque, NM 598,191 MB 5,087.8 56 375.7 58Dayton, OH 703,444 MB 4,970.3 57 319.0 63Madison, WI 329,533 MB 4,811.0 58 381.8 57Syracuse, NY 402,267 MB 4,750.3 59 371.8 59Fresno, CA 554,923 MB 4,563.0 60 391.9 55Grand Rapids, MI 539,080 MB 4,395.2 61 359.4 60Nashville-Davidson, TN 749,935 MB 4,334.6 62 315.4 66Springfield, MA-CT 573,610 MB 4,176.3 63 316.6 65Sarasota-Bradenton, FL 559,229 MB 4,123.7 64 277.5 72Omaha, NE-IA 626,623 MB 4,080.7 65 301.9 67Akron, OH 570,215 MB 3,845.6 66 324.0 61Seaside-Monterey-Marina, CA 125,503 MB 3,827.2 67 240.5 79Greensboro, NC 267,884 MB 3,826.3 68 226.9 82Concord, CA 552,624 MB 3,805.8 69 317.8 64Raleigh, NC 541,527 MB 3,775.8 70 301.3 68Bakersfield, CA 396,125 MB 3,718.2 71 298.6 69New Haven, CT 531,314 MB 3,569.8 72 322.1 62Eugene, OR 224,049 MB 3,538.9 73 282.1 71Ann Arbor, MI 283,904 MB 3,387.6 74 285.0 70Stockton, CA 313,392 MB 3,376.8 75 229.9 80Charleston-North Charleston, SC 423,410 MB 3,342.2 76 228.2 81Santa Cruz, CA 157,348 MB 3,325.2 77 224.3 83Poughkeepsie-Newburgh, NY 351,982 MB 3,295.7 78 159.9 105Davenport, IA-IL 270,626 MB 3,274.0 79 243.0 77Flint, MI 365,096 MB 3,219.1 80 172.3 99Lansing, MI 300,032 MB 3,217.4 81 243.1 76Oxnard, CA 337,591 MB 3,173.5 82 206.9 87Cape Coral, FL 329,757 MB 3,107.6 83 181.2 94Corpus Christi, TX 293,925 MB 2,877.0 84 213.6 84Toledo, OH-MI 503,008 MB 2,851.6 85 257.3 73Santa Clarita, CA 170,481 MB 2,841.7 86 161.7 104Gainesville, FL 159,508 MB 2,808.7 87 255.8 74Champaign, IL 123,938 MB 2,802.6 88 243.3 75Reno, NV 303,689 MB 2,757.9 89 242.8 78Lancaster-Palmdale, CA 263,532 MB 2,688.7 90 166.1 101Santa Barbara, CA 196,263 MB 2,668.7 91 211.5 86Tulsa, OK 558,329 MB 2,642.0 92 171.9 100Olympia-Lacey, WA 143,826 MB 2,604.6 93 193.0 90Santa Rosa, CA 285,408 MB 2,603.4 94 178.2 97Oklahoma City, OK 747,003 MB 2,573.1 95 162.3 103Knoxville, TN 419,830 MB 2,528.2 96 212.7 85Allentown-Bethlehem, PA-NJ 576,408 MB 2,506.6 97 194.5 89Savannah, GA 208,886 MB 2,499.8 98 187.4 91Indio-Cathedral City-Palm Springs, CA 254,856 MB 2,467.5 99 180.7 95Daytona Beach-Port Orange, FL 255,353 MB 2,460.1 100 157.5 109Kennewick-Richland, WA 153,851 MB 2,453.3 101 132.5 123Birmingham, AL 663,615 MB 2,409.2 102 204.5 88Charleston, WV 182,991 MB 2,409.0 103 139.3 118Des Moines, IA 370,505 MB 2,404.1 104 178.3 96Lexington-Fayette, KY 250,994 MB 2,291.4 105 183.0 93Little Rock, AR 360,331 MB 2,288.5 106 158.7 107Shreveport, LA 275,213 MB 2,275.5 107 150.9 113
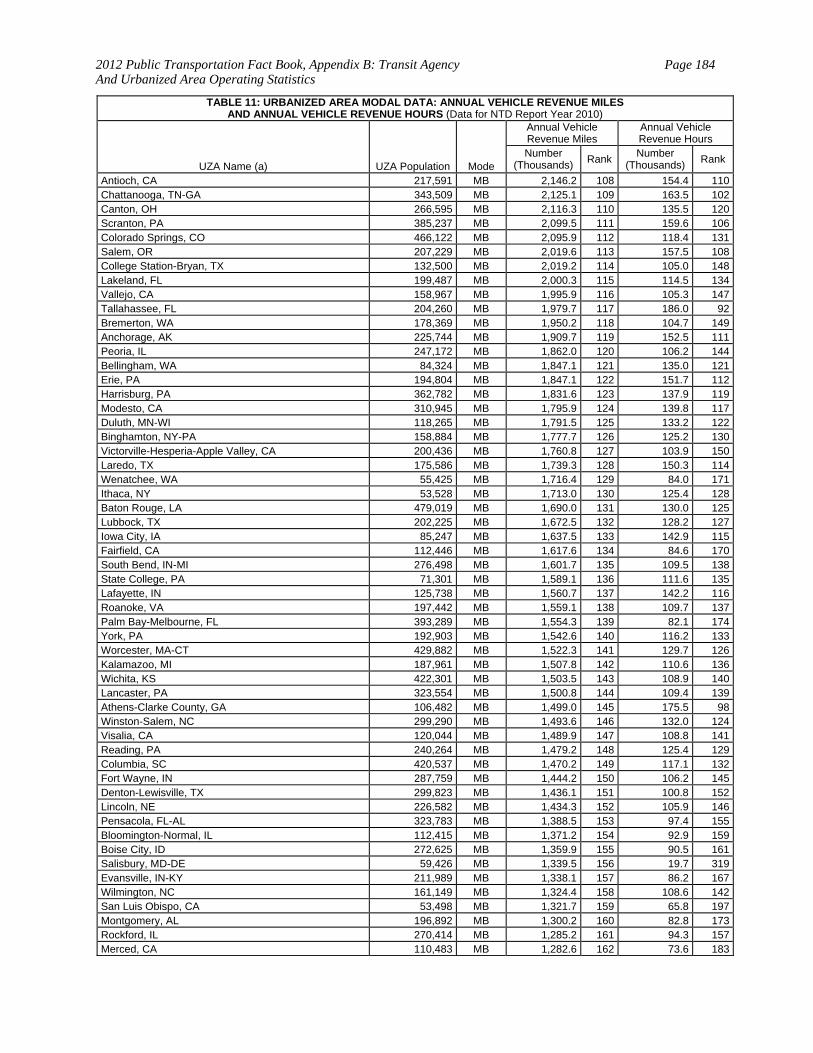
2012 Public Transportation Fact Book, Appendix B: Transit Agency And Urbanized Area Operating Statistics
Page 184
TABLE 11: URBANIZED AREA MODAL DATA: ANNUAL VEHICLE REVENUE MILES AND ANNUAL VEHICLE REVENUE HOURS (Data for NTD Report Year 2010)
UZA Name (a) UZA Population Mode
Annual Vehicle Revenue Miles
Annual Vehicle Revenue Hours
Number (Thousands) Rank
Number (Thousands) Rank
Antioch, CA 217,591 MB 2,146.2 108 154.4 110Chattanooga, TN-GA 343,509 MB 2,125.1 109 163.5 102Canton, OH 266,595 MB 2,116.3 110 135.5 120Scranton, PA 385,237 MB 2,099.5 111 159.6 106Colorado Springs, CO 466,122 MB 2,095.9 112 118.4 131Salem, OR 207,229 MB 2,019.6 113 157.5 108College Station-Bryan, TX 132,500 MB 2,019.2 114 105.0 148Lakeland, FL 199,487 MB 2,000.3 115 114.5 134Vallejo, CA 158,967 MB 1,995.9 116 105.3 147Tallahassee, FL 204,260 MB 1,979.7 117 186.0 92Bremerton, WA 178,369 MB 1,950.2 118 104.7 149Anchorage, AK 225,744 MB 1,909.7 119 152.5 111Peoria, IL 247,172 MB 1,862.0 120 106.2 144Bellingham, WA 84,324 MB 1,847.1 121 135.0 121Erie, PA 194,804 MB 1,847.1 122 151.7 112Harrisburg, PA 362,782 MB 1,831.6 123 137.9 119Modesto, CA 310,945 MB 1,795.9 124 139.8 117Duluth, MN-WI 118,265 MB 1,791.5 125 133.2 122Binghamton, NY-PA 158,884 MB 1,777.7 126 125.2 130Victorville-Hesperia-Apple Valley, CA 200,436 MB 1,760.8 127 103.9 150Laredo, TX 175,586 MB 1,739.3 128 150.3 114Wenatchee, WA 55,425 MB 1,716.4 129 84.0 171Ithaca, NY 53,528 MB 1,713.0 130 125.4 128Baton Rouge, LA 479,019 MB 1,690.0 131 130.0 125Lubbock, TX 202,225 MB 1,672.5 132 128.2 127Iowa City, IA 85,247 MB 1,637.5 133 142.9 115Fairfield, CA 112,446 MB 1,617.6 134 84.6 170South Bend, IN-MI 276,498 MB 1,601.7 135 109.5 138State College, PA 71,301 MB 1,589.1 136 111.6 135Lafayette, IN 125,738 MB 1,560.7 137 142.2 116Roanoke, VA 197,442 MB 1,559.1 138 109.7 137Palm Bay-Melbourne, FL 393,289 MB 1,554.3 139 82.1 174York, PA 192,903 MB 1,542.6 140 116.2 133Worcester, MA-CT 429,882 MB 1,522.3 141 129.7 126Kalamazoo, MI 187,961 MB 1,507.8 142 110.6 136Wichita, KS 422,301 MB 1,503.5 143 108.9 140Lancaster, PA 323,554 MB 1,500.8 144 109.4 139Athens-Clarke County, GA 106,482 MB 1,499.0 145 175.5 98Winston-Salem, NC 299,290 MB 1,493.6 146 132.0 124Visalia, CA 120,044 MB 1,489.9 147 108.8 141Reading, PA 240,264 MB 1,479.2 148 125.4 129Columbia, SC 420,537 MB 1,470.2 149 117.1 132Fort Wayne, IN 287,759 MB 1,444.2 150 106.2 145Denton-Lewisville, TX 299,823 MB 1,436.1 151 100.8 152Lincoln, NE 226,582 MB 1,434.3 152 105.9 146Pensacola, FL-AL 323,783 MB 1,388.5 153 97.4 155Bloomington-Normal, IL 112,415 MB 1,371.2 154 92.9 159Boise City, ID 272,625 MB 1,359.9 155 90.5 161Salisbury, MD-DE 59,426 MB 1,339.5 156 19.7 319Evansville, IN-KY 211,989 MB 1,338.1 157 86.2 167Wilmington, NC 161,149 MB 1,324.4 158 108.6 142San Luis Obispo, CA 53,498 MB 1,321.7 159 65.8 197Montgomery, AL 196,892 MB 1,300.2 160 82.8 173Rockford, IL 270,414 MB 1,285.2 161 94.3 157Merced, CA 110,483 MB 1,282.6 162 73.6 183
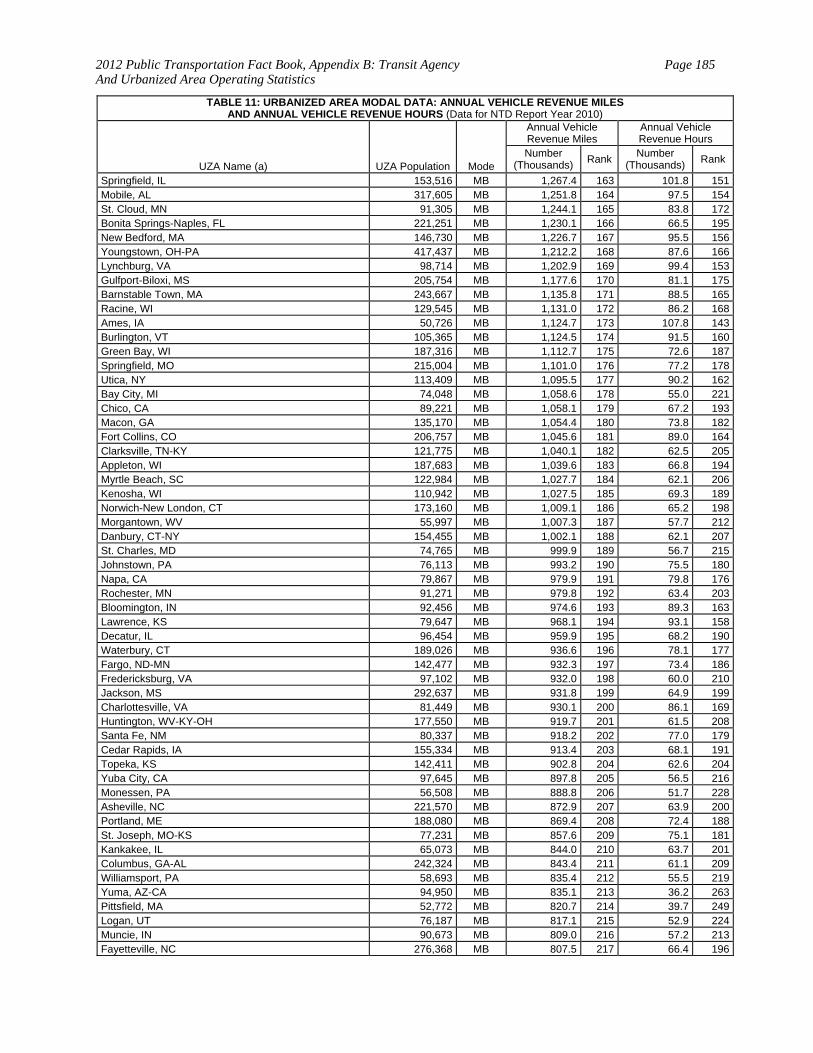
2012 Public Transportation Fact Book, Appendix B: Transit Agency And Urbanized Area Operating Statistics
Page 185
TABLE 11: URBANIZED AREA MODAL DATA: ANNUAL VEHICLE REVENUE MILES AND ANNUAL VEHICLE REVENUE HOURS (Data for NTD Report Year 2010)
UZA Name (a) UZA Population Mode
Annual Vehicle Revenue Miles
Annual Vehicle Revenue Hours
Number (Thousands) Rank
Number (Thousands) Rank
Springfield, IL 153,516 MB 1,267.4 163 101.8 151Mobile, AL 317,605 MB 1,251.8 164 97.5 154St. Cloud, MN 91,305 MB 1,244.1 165 83.8 172Bonita Springs-Naples, FL 221,251 MB 1,230.1 166 66.5 195New Bedford, MA 146,730 MB 1,226.7 167 95.5 156Youngstown, OH-PA 417,437 MB 1,212.2 168 87.6 166Lynchburg, VA 98,714 MB 1,202.9 169 99.4 153Gulfport-Biloxi, MS 205,754 MB 1,177.6 170 81.1 175Barnstable Town, MA 243,667 MB 1,135.8 171 88.5 165Racine, WI 129,545 MB 1,131.0 172 86.2 168Ames, IA 50,726 MB 1,124.7 173 107.8 143Burlington, VT 105,365 MB 1,124.5 174 91.5 160Green Bay, WI 187,316 MB 1,112.7 175 72.6 187Springfield, MO 215,004 MB 1,101.0 176 77.2 178Utica, NY 113,409 MB 1,095.5 177 90.2 162Bay City, MI 74,048 MB 1,058.6 178 55.0 221Chico, CA 89,221 MB 1,058.1 179 67.2 193Macon, GA 135,170 MB 1,054.4 180 73.8 182Fort Collins, CO 206,757 MB 1,045.6 181 89.0 164Clarksville, TN-KY 121,775 MB 1,040.1 182 62.5 205Appleton, WI 187,683 MB 1,039.6 183 66.8 194Myrtle Beach, SC 122,984 MB 1,027.7 184 62.1 206Kenosha, WI 110,942 MB 1,027.5 185 69.3 189Norwich-New London, CT 173,160 MB 1,009.1 186 65.2 198Morgantown, WV 55,997 MB 1,007.3 187 57.7 212Danbury, CT-NY 154,455 MB 1,002.1 188 62.1 207St. Charles, MD 74,765 MB 999.9 189 56.7 215Johnstown, PA 76,113 MB 993.2 190 75.5 180Napa, CA 79,867 MB 979.9 191 79.8 176Rochester, MN 91,271 MB 979.8 192 63.4 203Bloomington, IN 92,456 MB 974.6 193 89.3 163Lawrence, KS 79,647 MB 968.1 194 93.1 158Decatur, IL 96,454 MB 959.9 195 68.2 190Waterbury, CT 189,026 MB 936.6 196 78.1 177Fargo, ND-MN 142,477 MB 932.3 197 73.4 186Fredericksburg, VA 97,102 MB 932.0 198 60.0 210Jackson, MS 292,637 MB 931.8 199 64.9 199Charlottesville, VA 81,449 MB 930.1 200 86.1 169Huntington, WV-KY-OH 177,550 MB 919.7 201 61.5 208Santa Fe, NM 80,337 MB 918.2 202 77.0 179Cedar Rapids, IA 155,334 MB 913.4 203 68.1 191Topeka, KS 142,411 MB 902.8 204 62.6 204Yuba City, CA 97,645 MB 897.8 205 56.5 216Monessen, PA 56,508 MB 888.8 206 51.7 228Asheville, NC 221,570 MB 872.9 207 63.9 200Portland, ME 188,080 MB 869.4 208 72.4 188St. Joseph, MO-KS 77,231 MB 857.6 209 75.1 181Kankakee, IL 65,073 MB 844.0 210 63.7 201Columbus, GA-AL 242,324 MB 843.4 211 61.1 209Williamsport, PA 58,693 MB 835.4 212 55.5 219Yuma, AZ-CA 94,950 MB 835.1 213 36.2 263Pittsfield, MA 52,772 MB 820.7 214 39.7 249Logan, UT 76,187 MB 817.1 215 52.9 224Muncie, IN 90,673 MB 809.0 216 57.2 213Fayetteville, NC 276,368 MB 807.5 217 66.4 196
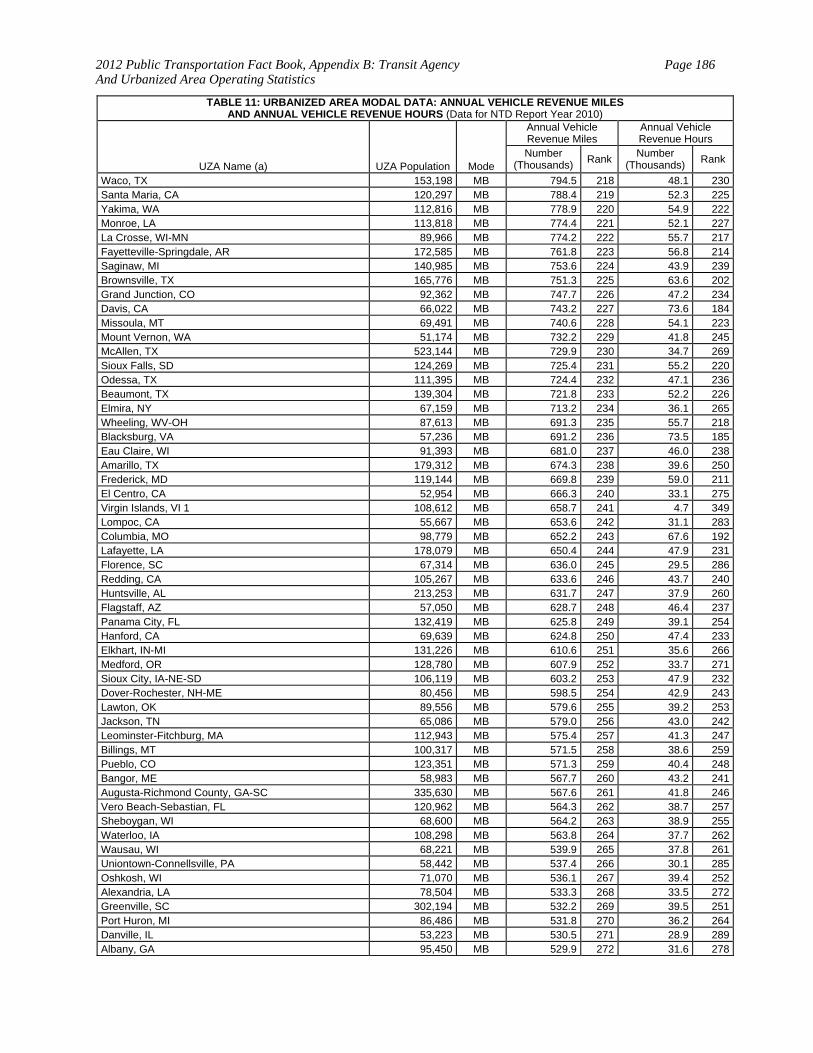
2012 Public Transportation Fact Book, Appendix B: Transit Agency And Urbanized Area Operating Statistics
Page 186
TABLE 11: URBANIZED AREA MODAL DATA: ANNUAL VEHICLE REVENUE MILES AND ANNUAL VEHICLE REVENUE HOURS (Data for NTD Report Year 2010)
UZA Name (a) UZA Population Mode
Annual Vehicle Revenue Miles
Annual Vehicle Revenue Hours
Number (Thousands) Rank
Number (Thousands) Rank
Waco, TX 153,198 MB 794.5 218 48.1 230Santa Maria, CA 120,297 MB 788.4 219 52.3 225Yakima, WA 112,816 MB 778.9 220 54.9 222Monroe, LA 113,818 MB 774.4 221 52.1 227La Crosse, WI-MN 89,966 MB 774.2 222 55.7 217Fayetteville-Springdale, AR 172,585 MB 761.8 223 56.8 214Saginaw, MI 140,985 MB 753.6 224 43.9 239Brownsville, TX 165,776 MB 751.3 225 63.6 202Grand Junction, CO 92,362 MB 747.7 226 47.2 234Davis, CA 66,022 MB 743.2 227 73.6 184Missoula, MT 69,491 MB 740.6 228 54.1 223Mount Vernon, WA 51,174 MB 732.2 229 41.8 245McAllen, TX 523,144 MB 729.9 230 34.7 269Sioux Falls, SD 124,269 MB 725.4 231 55.2 220Odessa, TX 111,395 MB 724.4 232 47.1 236Beaumont, TX 139,304 MB 721.8 233 52.2 226Elmira, NY 67,159 MB 713.2 234 36.1 265Wheeling, WV-OH 87,613 MB 691.3 235 55.7 218Blacksburg, VA 57,236 MB 691.2 236 73.5 185Eau Claire, WI 91,393 MB 681.0 237 46.0 238Amarillo, TX 179,312 MB 674.3 238 39.6 250Frederick, MD 119,144 MB 669.8 239 59.0 211El Centro, CA 52,954 MB 666.3 240 33.1 275Virgin Islands, VI 1 108,612 MB 658.7 241 4.7 349Lompoc, CA 55,667 MB 653.6 242 31.1 283Columbia, MO 98,779 MB 652.2 243 67.6 192Lafayette, LA 178,079 MB 650.4 244 47.9 231Florence, SC 67,314 MB 636.0 245 29.5 286Redding, CA 105,267 MB 633.6 246 43.7 240Huntsville, AL 213,253 MB 631.7 247 37.9 260Flagstaff, AZ 57,050 MB 628.7 248 46.4 237Panama City, FL 132,419 MB 625.8 249 39.1 254Hanford, CA 69,639 MB 624.8 250 47.4 233Elkhart, IN-MI 131,226 MB 610.6 251 35.6 266Medford, OR 128,780 MB 607.9 252 33.7 271Sioux City, IA-NE-SD 106,119 MB 603.2 253 47.9 232Dover-Rochester, NH-ME 80,456 MB 598.5 254 42.9 243Lawton, OK 89,556 MB 579.6 255 39.2 253Jackson, TN 65,086 MB 579.0 256 43.0 242Leominster-Fitchburg, MA 112,943 MB 575.4 257 41.3 247Billings, MT 100,317 MB 571.5 258 38.6 259Pueblo, CO 123,351 MB 571.3 259 40.4 248Bangor, ME 58,983 MB 567.7 260 43.2 241Augusta-Richmond County, GA-SC 335,630 MB 567.6 261 41.8 246Vero Beach-Sebastian, FL 120,962 MB 564.3 262 38.7 257Sheboygan, WI 68,600 MB 564.2 263 38.9 255Waterloo, IA 108,298 MB 563.8 264 37.7 262Wausau, WI 68,221 MB 539.9 265 37.8 261Uniontown-Connellsville, PA 58,442 MB 537.4 266 30.1 285Oshkosh, WI 71,070 MB 536.1 267 39.4 252Alexandria, LA 78,504 MB 533.3 268 33.5 272Greenville, SC 302,194 MB 532.2 269 39.5 251Port Huron, MI 86,486 MB 531.8 270 36.2 264Danville, IL 53,223 MB 530.5 271 28.9 289Albany, GA 95,450 MB 529.9 272 31.6 278
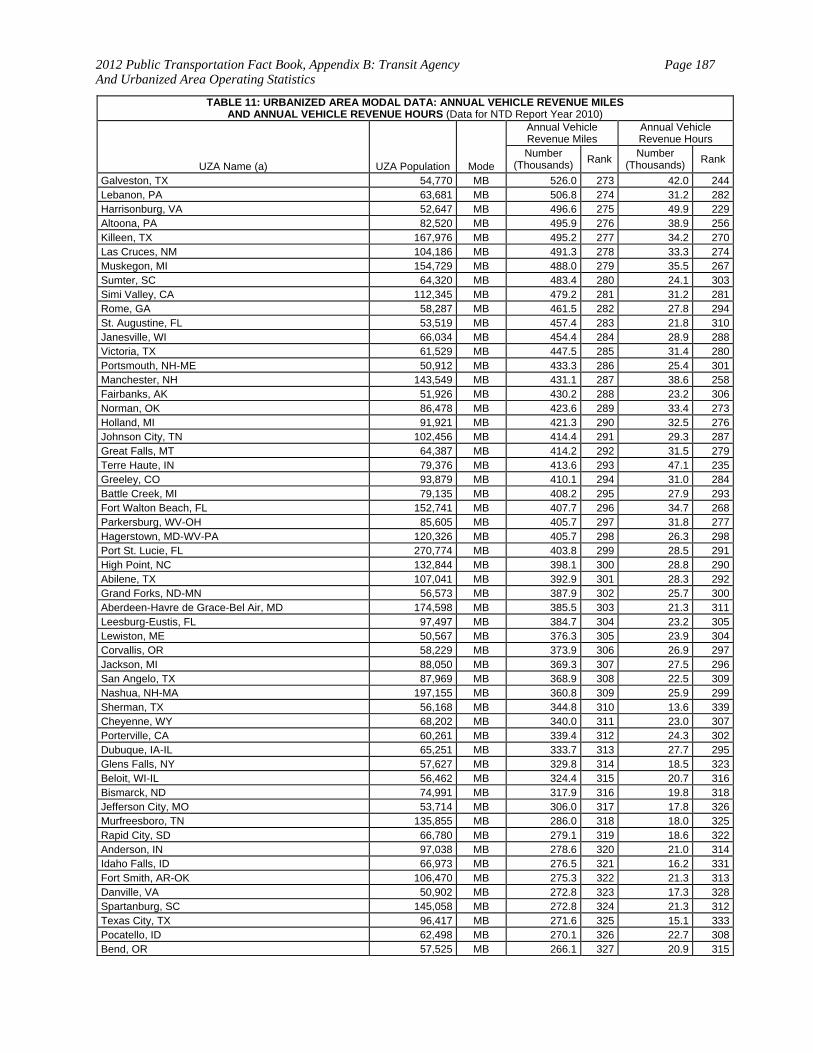
2012 Public Transportation Fact Book, Appendix B: Transit Agency And Urbanized Area Operating Statistics
Page 187
TABLE 11: URBANIZED AREA MODAL DATA: ANNUAL VEHICLE REVENUE MILES AND ANNUAL VEHICLE REVENUE HOURS (Data for NTD Report Year 2010)
UZA Name (a) UZA Population Mode
Annual Vehicle Revenue Miles
Annual Vehicle Revenue Hours
Number (Thousands) Rank
Number (Thousands) Rank
Galveston, TX 54,770 MB 526.0 273 42.0 244Lebanon, PA 63,681 MB 506.8 274 31.2 282Harrisonburg, VA 52,647 MB 496.6 275 49.9 229Altoona, PA 82,520 MB 495.9 276 38.9 256Killeen, TX 167,976 MB 495.2 277 34.2 270Las Cruces, NM 104,186 MB 491.3 278 33.3 274Muskegon, MI 154,729 MB 488.0 279 35.5 267Sumter, SC 64,320 MB 483.4 280 24.1 303Simi Valley, CA 112,345 MB 479.2 281 31.2 281Rome, GA 58,287 MB 461.5 282 27.8 294St. Augustine, FL 53,519 MB 457.4 283 21.8 310Janesville, WI 66,034 MB 454.4 284 28.9 288Victoria, TX 61,529 MB 447.5 285 31.4 280Portsmouth, NH-ME 50,912 MB 433.3 286 25.4 301Manchester, NH 143,549 MB 431.1 287 38.6 258Fairbanks, AK 51,926 MB 430.2 288 23.2 306Norman, OK 86,478 MB 423.6 289 33.4 273Holland, MI 91,921 MB 421.3 290 32.5 276Johnson City, TN 102,456 MB 414.4 291 29.3 287Great Falls, MT 64,387 MB 414.2 292 31.5 279Terre Haute, IN 79,376 MB 413.6 293 47.1 235Greeley, CO 93,879 MB 410.1 294 31.0 284Battle Creek, MI 79,135 MB 408.2 295 27.9 293Fort Walton Beach, FL 152,741 MB 407.7 296 34.7 268Parkersburg, WV-OH 85,605 MB 405.7 297 31.8 277Hagerstown, MD-WV-PA 120,326 MB 405.7 298 26.3 298Port St. Lucie, FL 270,774 MB 403.8 299 28.5 291High Point, NC 132,844 MB 398.1 300 28.8 290Abilene, TX 107,041 MB 392.9 301 28.3 292Grand Forks, ND-MN 56,573 MB 387.9 302 25.7 300Aberdeen-Havre de Grace-Bel Air, MD 174,598 MB 385.5 303 21.3 311Leesburg-Eustis, FL 97,497 MB 384.7 304 23.2 305Lewiston, ME 50,567 MB 376.3 305 23.9 304Corvallis, OR 58,229 MB 373.9 306 26.9 297Jackson, MI 88,050 MB 369.3 307 27.5 296San Angelo, TX 87,969 MB 368.9 308 22.5 309Nashua, NH-MA 197,155 MB 360.8 309 25.9 299Sherman, TX 56,168 MB 344.8 310 13.6 339Cheyenne, WY 68,202 MB 340.0 311 23.0 307Porterville, CA 60,261 MB 339.4 312 24.3 302Dubuque, IA-IL 65,251 MB 333.7 313 27.7 295Glens Falls, NY 57,627 MB 329.8 314 18.5 323Beloit, WI-IL 56,462 MB 324.4 315 20.7 316Bismarck, ND 74,991 MB 317.9 316 19.8 318Jefferson City, MO 53,714 MB 306.0 317 17.8 326Murfreesboro, TN 135,855 MB 286.0 318 18.0 325Rapid City, SD 66,780 MB 279.1 319 18.6 322Anderson, IN 97,038 MB 278.6 320 21.0 314Idaho Falls, ID 66,973 MB 276.5 321 16.2 331Fort Smith, AR-OK 106,470 MB 275.3 322 21.3 313Danville, VA 50,902 MB 272.8 323 17.3 328Spartanburg, SC 145,058 MB 272.8 324 21.3 312Texas City, TX 96,417 MB 271.6 325 15.1 333Pocatello, ID 62,498 MB 270.1 326 22.7 308Bend, OR 57,525 MB 266.1 327 20.9 315
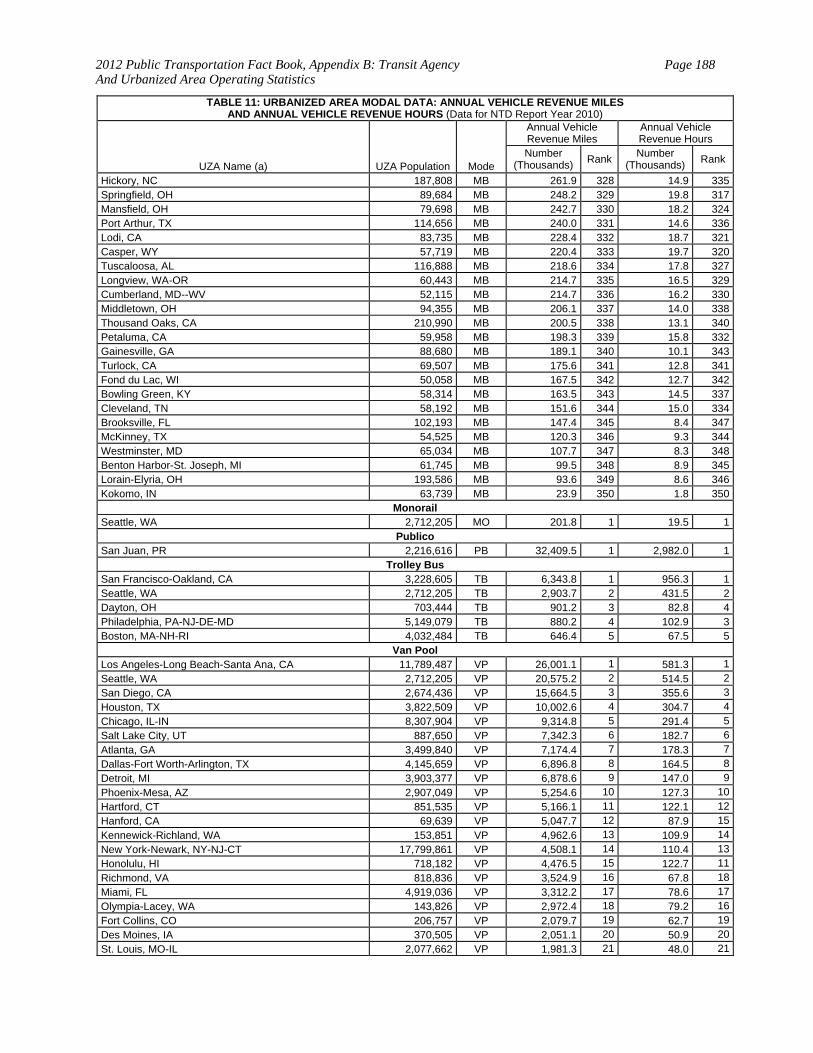
2012 Public Transportation Fact Book, Appendix B: Transit Agency And Urbanized Area Operating Statistics
Page 188
TABLE 11: URBANIZED AREA MODAL DATA: ANNUAL VEHICLE REVENUE MILES AND ANNUAL VEHICLE REVENUE HOURS (Data for NTD Report Year 2010)
UZA Name (a) UZA Population Mode
Annual Vehicle Revenue Miles
Annual Vehicle Revenue Hours
Number (Thousands) Rank
Number (Thousands) Rank
Hickory, NC 187,808 MB 261.9 328 14.9 335Springfield, OH 89,684 MB 248.2 329 19.8 317Mansfield, OH 79,698 MB 242.7 330 18.2 324Port Arthur, TX 114,656 MB 240.0 331 14.6 336Lodi, CA 83,735 MB 228.4 332 18.7 321Casper, WY 57,719 MB 220.4 333 19.7 320Tuscaloosa, AL 116,888 MB 218.6 334 17.8 327Longview, WA-OR 60,443 MB 214.7 335 16.5 329Cumberland, MD--WV 52,115 MB 214.7 336 16.2 330Middletown, OH 94,355 MB 206.1 337 14.0 338Thousand Oaks, CA 210,990 MB 200.5 338 13.1 340Petaluma, CA 59,958 MB 198.3 339 15.8 332Gainesville, GA 88,680 MB 189.1 340 10.1 343Turlock, CA 69,507 MB 175.6 341 12.8 341Fond du Lac, WI 50,058 MB 167.5 342 12.7 342Bowling Green, KY 58,314 MB 163.5 343 14.5 337Cleveland, TN 58,192 MB 151.6 344 15.0 334Brooksville, FL 102,193 MB 147.4 345 8.4 347McKinney, TX 54,525 MB 120.3 346 9.3 344Westminster, MD 65,034 MB 107.7 347 8.3 348Benton Harbor-St. Joseph, MI 61,745 MB 99.5 348 8.9 345Lorain-Elyria, OH 193,586 MB 93.6 349 8.6 346Kokomo, IN 63,739 MB 23.9 350 1.8 350
Monorail Seattle, WA 2,712,205 MO 201.8 1 19.5 1
Publico San Juan, PR 2,216,616 PB 32,409.5 1 2,982.0 1
Trolley Bus San Francisco-Oakland, CA 3,228,605 TB 6,343.8 1 956.3 1Seattle, WA 2,712,205 TB 2,903.7 2 431.5 2Dayton, OH 703,444 TB 901.2 3 82.8 4Philadelphia, PA-NJ-DE-MD 5,149,079 TB 880.2 4 102.9 3Boston, MA-NH-RI 4,032,484 TB 646.4 5 67.5 5
Van Pool Los Angeles-Long Beach-Santa Ana, CA 11,789,487 VP 26,001.1 1 581.3 1
Seattle, WA 2,712,205 VP 20,575.2 2 514.5 2
San Diego, CA 2,674,436 VP 15,664.5 3 355.6 3
Houston, TX 3,822,509 VP 10,002.6 4 304.7 4
Chicago, IL-IN 8,307,904 VP 9,314.8 5 291.4 5
Salt Lake City, UT 887,650 VP 7,342.3 6 182.7 6
Atlanta, GA 3,499,840 VP 7,174.4 7 178.3 7
Dallas-Fort Worth-Arlington, TX 4,145,659 VP 6,896.8 8 164.5 8
Detroit, MI 3,903,377 VP 6,878.6 9 147.0 9
Phoenix-Mesa, AZ 2,907,049 VP 5,254.6 10 127.3 10
Hartford, CT 851,535 VP 5,166.1 11 122.1 12
Hanford, CA 69,639 VP 5,047.7 12 87.9 15
Kennewick-Richland, WA 153,851 VP 4,962.6 13 109.9 14
New York-Newark, NY-NJ-CT 17,799,861 VP 4,508.1 14 110.4 13
Honolulu, HI 718,182 VP 4,476.5 15 122.7 11
Richmond, VA 818,836 VP 3,524.9 16 67.8 18
Miami, FL 4,919,036 VP 3,312.2 17 78.6 17
Olympia-Lacey, WA 143,826 VP 2,972.4 18 79.2 16
Fort Collins, CO 206,757 VP 2,079.7 19 62.7 19
Des Moines, IA 370,505 VP 2,051.1 20 50.9 20
St. Louis, MO-IL 2,077,662 VP 1,981.3 21 48.0 21
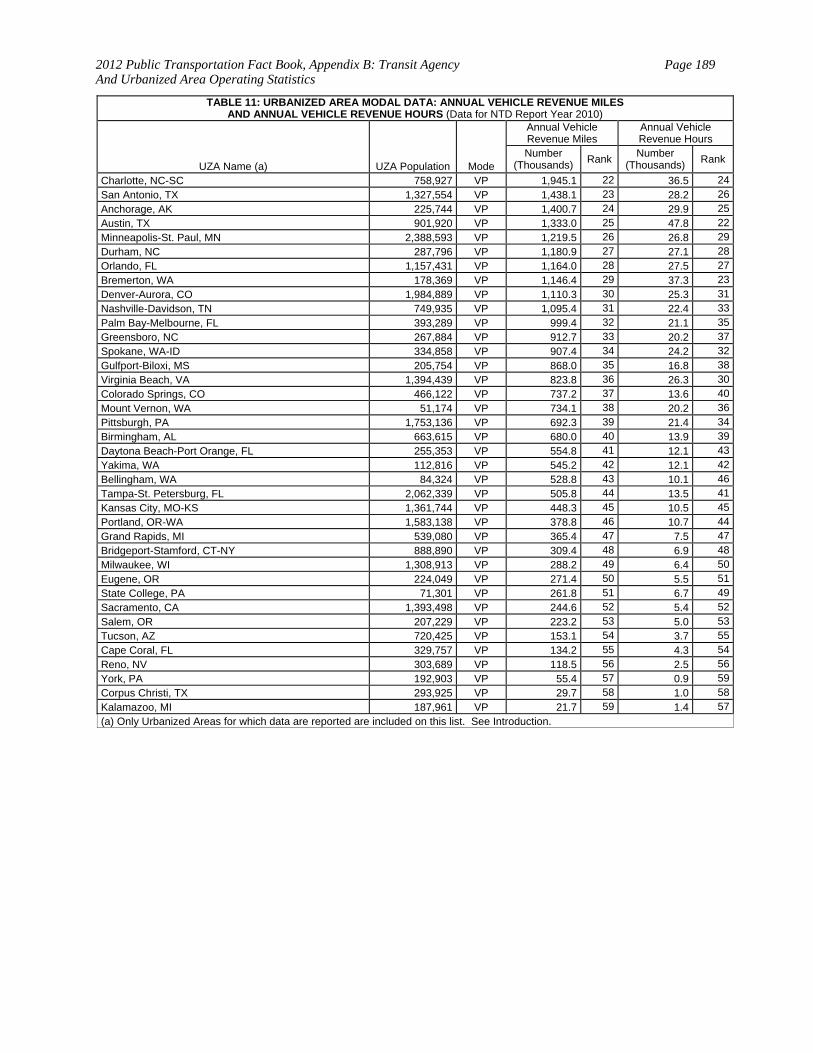
2012 Public Transportation Fact Book, Appendix B: Transit Agency And Urbanized Area Operating Statistics
Page 189
TABLE 11: URBANIZED AREA MODAL DATA: ANNUAL VEHICLE REVENUE MILES AND ANNUAL VEHICLE REVENUE HOURS (Data for NTD Report Year 2010)
UZA Name (a) UZA Population Mode
Annual Vehicle Revenue Miles
Annual Vehicle Revenue Hours
Number (Thousands) Rank
Number (Thousands) Rank
Charlotte, NC-SC 758,927 VP 1,945.1 22 36.5 24
San Antonio, TX 1,327,554 VP 1,438.1 23 28.2 26
Anchorage, AK 225,744 VP 1,400.7 24 29.9 25
Austin, TX 901,920 VP 1,333.0 25 47.8 22
Minneapolis-St. Paul, MN 2,388,593 VP 1,219.5 26 26.8 29
Durham, NC 287,796 VP 1,180.9 27 27.1 28
Orlando, FL 1,157,431 VP 1,164.0 28 27.5 27
Bremerton, WA 178,369 VP 1,146.4 29 37.3 23
Denver-Aurora, CO 1,984,889 VP 1,110.3 30 25.3 31
Nashville-Davidson, TN 749,935 VP 1,095.4 31 22.4 33
Palm Bay-Melbourne, FL 393,289 VP 999.4 32 21.1 35
Greensboro, NC 267,884 VP 912.7 33 20.2 37
Spokane, WA-ID 334,858 VP 907.4 34 24.2 32
Gulfport-Biloxi, MS 205,754 VP 868.0 35 16.8 38
Virginia Beach, VA 1,394,439 VP 823.8 36 26.3 30
Colorado Springs, CO 466,122 VP 737.2 37 13.6 40
Mount Vernon, WA 51,174 VP 734.1 38 20.2 36
Pittsburgh, PA 1,753,136 VP 692.3 39 21.4 34
Birmingham, AL 663,615 VP 680.0 40 13.9 39
Daytona Beach-Port Orange, FL 255,353 VP 554.8 41 12.1 43
Yakima, WA 112,816 VP 545.2 42 12.1 42
Bellingham, WA 84,324 VP 528.8 43 10.1 46
Tampa-St. Petersburg, FL 2,062,339 VP 505.8 44 13.5 41
Kansas City, MO-KS 1,361,744 VP 448.3 45 10.5 45
Portland, OR-WA 1,583,138 VP 378.8 46 10.7 44
Grand Rapids, MI 539,080 VP 365.4 47 7.5 47
Bridgeport-Stamford, CT-NY 888,890 VP 309.4 48 6.9 48
Milwaukee, WI 1,308,913 VP 288.2 49 6.4 50
Eugene, OR 224,049 VP 271.4 50 5.5 51
State College, PA 71,301 VP 261.8 51 6.7 49
Sacramento, CA 1,393,498 VP 244.6 52 5.4 52
Salem, OR 207,229 VP 223.2 53 5.0 53
Tucson, AZ 720,425 VP 153.1 54 3.7 55
Cape Coral, FL 329,757 VP 134.2 55 4.3 54
Reno, NV 303,689 VP 118.5 56 2.5 56
York, PA 192,903 VP 55.4 57 0.9 59
Corpus Christi, TX 293,925 VP 29.7 58 1.0 58
Kalamazoo, MI 187,961 VP 21.7 59 1.4 57
(a) Only Urbanized Areas for which data are reported are included on this list. See Introduction.
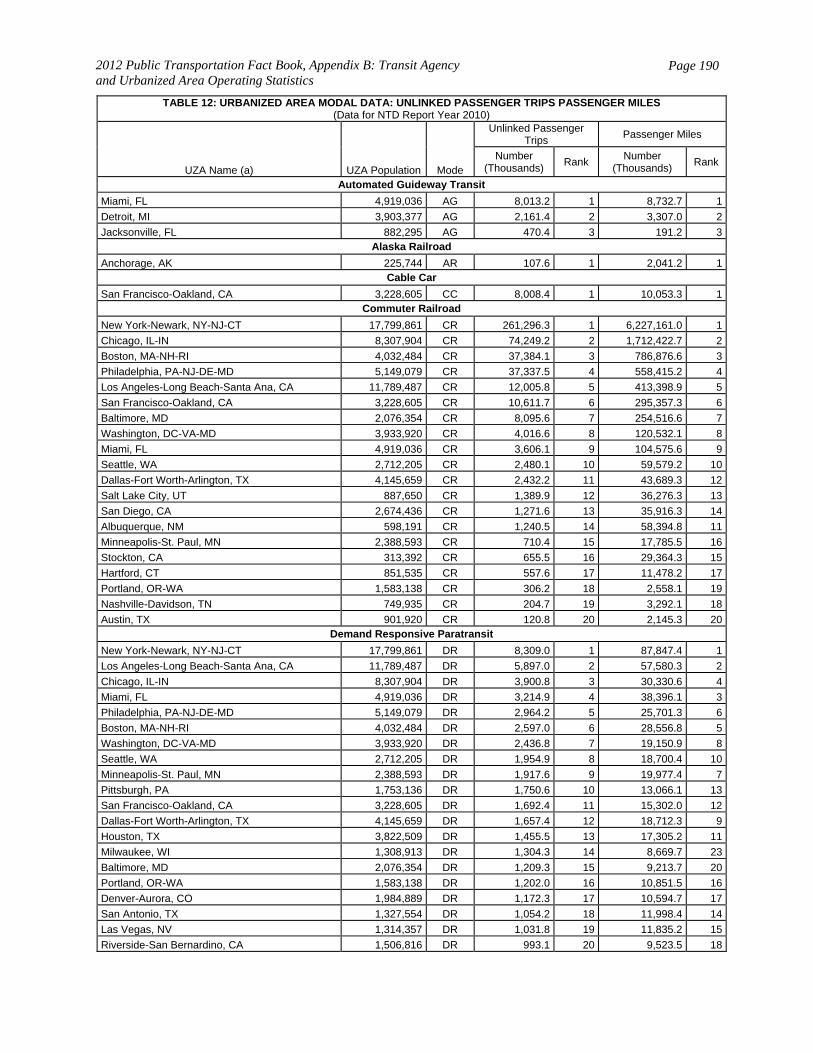
2012 Public Transportation Fact Book, Appendix B: Transit Agency and Urbanized Area Operating Statistics
Page 190
TABLE 12: URBANIZED AREA MODAL DATA: UNLINKED PASSENGER TRIPS PASSENGER MILES (Data for NTD Report Year 2010)
UZA Name (a) UZA Population Mode
Unlinked Passenger Trips
Passenger Miles
Number (Thousands)
Rank Number
(Thousands) Rank
Automated Guideway Transit
Miami, FL 4,919,036 AG 8,013.2 1 8,732.7 1
Detroit, MI 3,903,377 AG 2,161.4 2 3,307.0 2
Jacksonville, FL 882,295 AG 470.4 3 191.2 3Alaska Railroad
Anchorage, AK 225,744 AR 107.6 1 2,041.2 1Cable Car
San Francisco-Oakland, CA 3,228,605 CC 8,008.4 1 10,053.3 1Commuter Railroad
New York-Newark, NY-NJ-CT 17,799,861 CR 261,296.3 1 6,227,161.0 1
Chicago, IL-IN 8,307,904 CR 74,249.2 2 1,712,422.7 2
Boston, MA-NH-RI 4,032,484 CR 37,384.1 3 786,876.6 3
Philadelphia, PA-NJ-DE-MD 5,149,079 CR 37,337.5 4 558,415.2 4
Los Angeles-Long Beach-Santa Ana, CA 11,789,487 CR 12,005.8 5 413,398.9 5
San Francisco-Oakland, CA 3,228,605 CR 10,611.7 6 295,357.3 6
Baltimore, MD 2,076,354 CR 8,095.6 7 254,516.6 7
Washington, DC-VA-MD 3,933,920 CR 4,016.6 8 120,532.1 8
Miami, FL 4,919,036 CR 3,606.1 9 104,575.6 9
Seattle, WA 2,712,205 CR 2,480.1 10 59,579.2 10
Dallas-Fort Worth-Arlington, TX 4,145,659 CR 2,432.2 11 43,689.3 12
Salt Lake City, UT 887,650 CR 1,389.9 12 36,276.3 13
San Diego, CA 2,674,436 CR 1,271.6 13 35,916.3 14
Albuquerque, NM 598,191 CR 1,240.5 14 58,394.8 11
Minneapolis-St. Paul, MN 2,388,593 CR 710.4 15 17,785.5 16
Stockton, CA 313,392 CR 655.5 16 29,364.3 15
Hartford, CT 851,535 CR 557.6 17 11,478.2 17
Portland, OR-WA 1,583,138 CR 306.2 18 2,558.1 19
Nashville-Davidson, TN 749,935 CR 204.7 19 3,292.1 18
Austin, TX 901,920 CR 120.8 20 2,145.3 20Demand Responsive Paratransit
New York-Newark, NY-NJ-CT 17,799,861 DR 8,309.0 1 87,847.4 1
Los Angeles-Long Beach-Santa Ana, CA 11,789,487 DR 5,897.0 2 57,580.3 2
Chicago, IL-IN 8,307,904 DR 3,900.8 3 30,330.6 4
Miami, FL 4,919,036 DR 3,214.9 4 38,396.1 3
Philadelphia, PA-NJ-DE-MD 5,149,079 DR 2,964.2 5 25,701.3 6
Boston, MA-NH-RI 4,032,484 DR 2,597.0 6 28,556.8 5
Washington, DC-VA-MD 3,933,920 DR 2,436.8 7 19,150.9 8
Seattle, WA 2,712,205 DR 1,954.9 8 18,700.4 10
Minneapolis-St. Paul, MN 2,388,593 DR 1,917.6 9 19,977.4 7
Pittsburgh, PA 1,753,136 DR 1,750.6 10 13,066.1 13
San Francisco-Oakland, CA 3,228,605 DR 1,692.4 11 15,302.0 12
Dallas-Fort Worth-Arlington, TX 4,145,659 DR 1,657.4 12 18,712.3 9
Houston, TX 3,822,509 DR 1,455.5 13 17,305.2 11
Milwaukee, WI 1,308,913 DR 1,304.3 14 8,669.7 23
Baltimore, MD 2,076,354 DR 1,209.3 15 9,213.7 20
Portland, OR-WA 1,583,138 DR 1,202.0 16 10,851.5 16
Denver-Aurora, CO 1,984,889 DR 1,172.3 17 10,594.7 17
San Antonio, TX 1,327,554 DR 1,054.2 18 11,998.4 14
Las Vegas, NV 1,314,357 DR 1,031.8 19 11,835.2 15
Riverside-San Bernardino, CA 1,506,816 DR 993.1 20 9,523.5 18
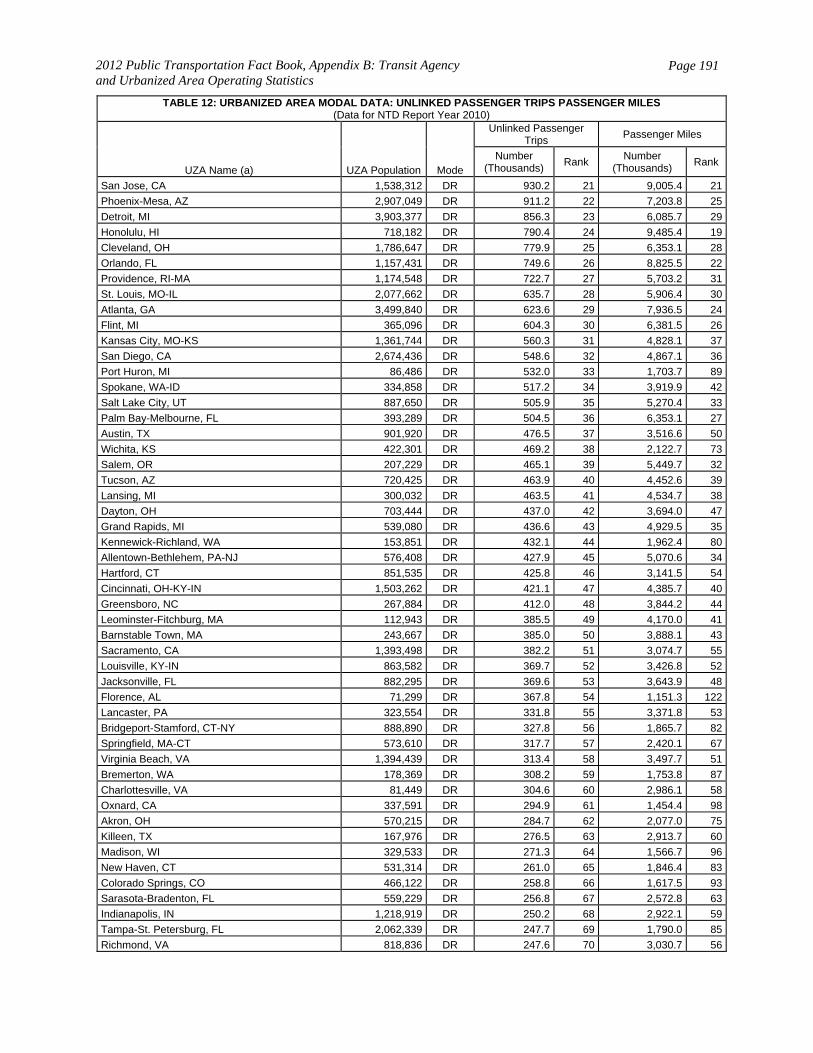
2012 Public Transportation Fact Book, Appendix B: Transit Agency and Urbanized Area Operating Statistics
Page 191
TABLE 12: URBANIZED AREA MODAL DATA: UNLINKED PASSENGER TRIPS PASSENGER MILES (Data for NTD Report Year 2010)
UZA Name (a) UZA Population Mode
Unlinked Passenger Trips
Passenger Miles
Number (Thousands)
Rank Number
(Thousands) Rank
San Jose, CA 1,538,312 DR 930.2 21 9,005.4 21
Phoenix-Mesa, AZ 2,907,049 DR 911.2 22 7,203.8 25
Detroit, MI 3,903,377 DR 856.3 23 6,085.7 29
Honolulu, HI 718,182 DR 790.4 24 9,485.4 19
Cleveland, OH 1,786,647 DR 779.9 25 6,353.1 28
Orlando, FL 1,157,431 DR 749.6 26 8,825.5 22
Providence, RI-MA 1,174,548 DR 722.7 27 5,703.2 31
St. Louis, MO-IL 2,077,662 DR 635.7 28 5,906.4 30
Atlanta, GA 3,499,840 DR 623.6 29 7,936.5 24
Flint, MI 365,096 DR 604.3 30 6,381.5 26
Kansas City, MO-KS 1,361,744 DR 560.3 31 4,828.1 37
San Diego, CA 2,674,436 DR 548.6 32 4,867.1 36
Port Huron, MI 86,486 DR 532.0 33 1,703.7 89
Spokane, WA-ID 334,858 DR 517.2 34 3,919.9 42
Salt Lake City, UT 887,650 DR 505.9 35 5,270.4 33
Palm Bay-Melbourne, FL 393,289 DR 504.5 36 6,353.1 27
Austin, TX 901,920 DR 476.5 37 3,516.6 50
Wichita, KS 422,301 DR 469.2 38 2,122.7 73
Salem, OR 207,229 DR 465.1 39 5,449.7 32
Tucson, AZ 720,425 DR 463.9 40 4,452.6 39
Lansing, MI 300,032 DR 463.5 41 4,534.7 38
Dayton, OH 703,444 DR 437.0 42 3,694.0 47
Grand Rapids, MI 539,080 DR 436.6 43 4,929.5 35
Kennewick-Richland, WA 153,851 DR 432.1 44 1,962.4 80
Allentown-Bethlehem, PA-NJ 576,408 DR 427.9 45 5,070.6 34
Hartford, CT 851,535 DR 425.8 46 3,141.5 54
Cincinnati, OH-KY-IN 1,503,262 DR 421.1 47 4,385.7 40
Greensboro, NC 267,884 DR 412.0 48 3,844.2 44
Leominster-Fitchburg, MA 112,943 DR 385.5 49 4,170.0 41
Barnstable Town, MA 243,667 DR 385.0 50 3,888.1 43
Sacramento, CA 1,393,498 DR 382.2 51 3,074.7 55
Louisville, KY-IN 863,582 DR 369.7 52 3,426.8 52
Jacksonville, FL 882,295 DR 369.6 53 3,643.9 48
Florence, AL 71,299 DR 367.8 54 1,151.3 122
Lancaster, PA 323,554 DR 331.8 55 3,371.8 53
Bridgeport-Stamford, CT-NY 888,890 DR 327.8 56 1,865.7 82
Springfield, MA-CT 573,610 DR 317.7 57 2,420.1 67
Virginia Beach, VA 1,394,439 DR 313.4 58 3,497.7 51
Bremerton, WA 178,369 DR 308.2 59 1,753.8 87
Charlottesville, VA 81,449 DR 304.6 60 2,986.1 58
Oxnard, CA 337,591 DR 294.9 61 1,454.4 98
Akron, OH 570,215 DR 284.7 62 2,077.0 75
Killeen, TX 167,976 DR 276.5 63 2,913.7 60
Madison, WI 329,533 DR 271.3 64 1,566.7 96
New Haven, CT 531,314 DR 261.0 65 1,846.4 83
Colorado Springs, CO 466,122 DR 258.8 66 1,617.5 93
Sarasota-Bradenton, FL 559,229 DR 256.8 67 2,572.8 63
Indianapolis, IN 1,218,919 DR 250.2 68 2,922.1 59
Tampa-St. Petersburg, FL 2,062,339 DR 247.7 69 1,790.0 85
Richmond, VA 818,836 DR 247.6 70 3,030.7 56

2012 Public Transportation Fact Book, Appendix B: Transit Agency and Urbanized Area Operating Statistics
Page 192
TABLE 12: URBANIZED AREA MODAL DATA: UNLINKED PASSENGER TRIPS PASSENGER MILES (Data for NTD Report Year 2010)
UZA Name (a) UZA Population Mode
Unlinked Passenger Trips
Passenger Miles
Number (Thousands)
Rank Number
(Thousands) Rank
Nashville-Davidson, TN 749,935 DR 247.2 71 2,999.2 57
Spartanburg, SC 145,058 DR 246.1 72 3,616.0 49
Reading, PA 240,264 DR 242.8 73 1,772.5 86
Daytona Beach-Port Orange, FL 255,353 DR 241.0 74 2,304.0 70
Erie, PA 194,804 DR 238.7 75 1,444.2 99
Fresno, CA 554,923 DR 238.7 76 1,260.6 113
Durham, NC 287,796 DR 238.3 77 2,052.0 76
Columbus, OH 1,133,193 DR 238.3 78 2,387.9 69
Memphis, TN-MS-AR 972,091 DR 236.0 79 2,645.3 62
Charlotte, NC-SC 758,927 DR 234.0 80 2,293.7 71
Concord, CA 552,624 DR 233.9 81 2,120.5 74
New Orleans, LA 1,009,283 DR 230.5 82 1,811.4 84
El Paso, TX-NM 674,801 DR 224.2 83 2,040.2 77
Lewiston, ME 50,567 DR 220.5 84 540.3 170
Toledo, OH-MI 503,008 DR 219.7 85 1,736.9 88
Lakeland, FL 199,487 DR 217.8 86 2,501.6 66
Leesburg-Eustis, FL 97,497 DR 217.6 87 3,828.2 45
Knoxville, TN 419,830 DR 215.2 88 2,394.4 68
Wildwood-North Wildwood-Cape May, NJ 52,550 DR 209.2 89 1,022.3 126
Reno, NV 303,689 DR 205.8 90 1,429.5 101
Decatur, AL 52,315 DR 205.4 91 487.1 177
Des Moines, IA 370,505 DR 204.7 92 1,959.9 81
Albuquerque, NM 598,191 DR 203.7 93 2,018.1 79
Florence, SC 67,314 DR 199.3 94 2,511.3 64
Anchorage, AK 225,744 DR 197.8 95 1,287.4 110
Merced, CA 110,483 DR 196.4 96 1,624.3 91
Tulsa, OK 558,329 DR 194.1 97 1,331.2 107
Youngstown, OH-PA 417,437 DR 191.5 98 1,634.1 90
Corpus Christi, TX 293,925 DR 190.7 99 1,426.6 102
Harrisburg, PA 362,782 DR 188.9 100 2,030.4 78
Sherman, TX 56,168 DR 188.7 101 3,728.1 46
York, PA 192,903 DR 186.7 102 2,510.9 65
Panama City, FL 132,419 DR 186.5 103 682.6 154
Rochester, NY 694,396 DR 179.7 104 1,431.9 100
Eugene, OR 224,049 DR 179.3 105 1,581.3 94
Victoria, TX 61,529 DR 175.4 106 1,408.8 103
Bellingham, WA 84,324 DR 173.9 107 973.3 129
Bismarck, ND 74,991 DR 171.7 108 667.7 156
Sumter, SC 64,320 DR 168.2 109 2,896.9 61
Dothan, AL 60,792 DR 163.9 110 957.8 130
Champaign, IL 123,938 DR 157.5 111 284.4 233
Appleton, WI 187,683 DR 156.9 112 939.8 133
Lexington-Fayette, KY 250,994 DR 155.1 113 895.0 134
Olympia-Lacey, WA 143,826 DR 153.0 114 977.0 128
Portland, ME 188,080 DR 148.9 115 1,223.4 115
Port St. Lucie, FL 270,774 DR 148.7 116 810.3 139
Benton Harbor-St. Joseph, MI 61,745 DR 148.3 117 713.3 151
Worcester, MA-CT 429,882 DR 142.9 118 797.7 143
Atlantic City, NJ 227,180 DR 141.7 119 1,287.3 111
Muskegon, MI 154,729 DR 140.0 120 342.8 216
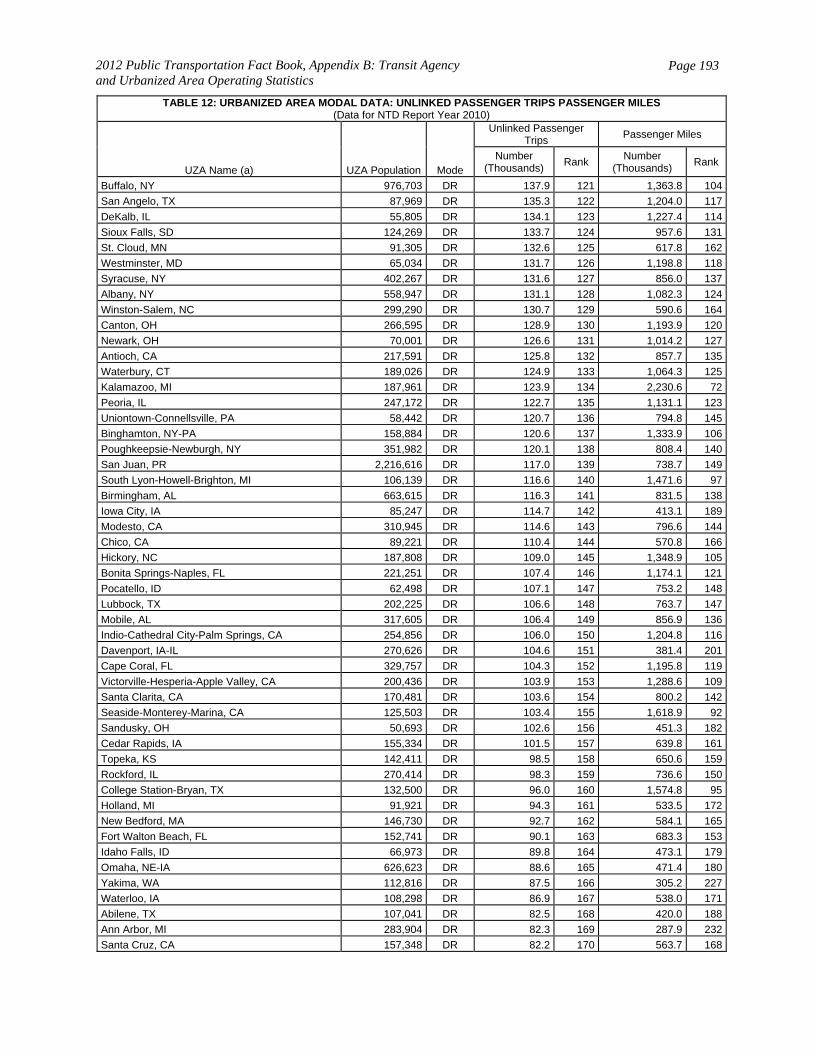
2012 Public Transportation Fact Book, Appendix B: Transit Agency and Urbanized Area Operating Statistics
Page 193
TABLE 12: URBANIZED AREA MODAL DATA: UNLINKED PASSENGER TRIPS PASSENGER MILES (Data for NTD Report Year 2010)
UZA Name (a) UZA Population Mode
Unlinked Passenger Trips
Passenger Miles
Number (Thousands)
Rank Number
(Thousands) Rank
Buffalo, NY 976,703 DR 137.9 121 1,363.8 104
San Angelo, TX 87,969 DR 135.3 122 1,204.0 117
DeKalb, IL 55,805 DR 134.1 123 1,227.4 114
Sioux Falls, SD 124,269 DR 133.7 124 957.6 131
St. Cloud, MN 91,305 DR 132.6 125 617.8 162
Westminster, MD 65,034 DR 131.7 126 1,198.8 118
Syracuse, NY 402,267 DR 131.6 127 856.0 137
Albany, NY 558,947 DR 131.1 128 1,082.3 124
Winston-Salem, NC 299,290 DR 130.7 129 590.6 164
Canton, OH 266,595 DR 128.9 130 1,193.9 120
Newark, OH 70,001 DR 126.6 131 1,014.2 127
Antioch, CA 217,591 DR 125.8 132 857.7 135
Waterbury, CT 189,026 DR 124.9 133 1,064.3 125
Kalamazoo, MI 187,961 DR 123.9 134 2,230.6 72
Peoria, IL 247,172 DR 122.7 135 1,131.1 123
Uniontown-Connellsville, PA 58,442 DR 120.7 136 794.8 145
Binghamton, NY-PA 158,884 DR 120.6 137 1,333.9 106
Poughkeepsie-Newburgh, NY 351,982 DR 120.1 138 808.4 140
San Juan, PR 2,216,616 DR 117.0 139 738.7 149
South Lyon-Howell-Brighton, MI 106,139 DR 116.6 140 1,471.6 97
Birmingham, AL 663,615 DR 116.3 141 831.5 138
Iowa City, IA 85,247 DR 114.7 142 413.1 189
Modesto, CA 310,945 DR 114.6 143 796.6 144
Chico, CA 89,221 DR 110.4 144 570.8 166
Hickory, NC 187,808 DR 109.0 145 1,348.9 105
Bonita Springs-Naples, FL 221,251 DR 107.4 146 1,174.1 121
Pocatello, ID 62,498 DR 107.1 147 753.2 148
Lubbock, TX 202,225 DR 106.6 148 763.7 147
Mobile, AL 317,605 DR 106.4 149 856.9 136
Indio-Cathedral City-Palm Springs, CA 254,856 DR 106.0 150 1,204.8 116
Davenport, IA-IL 270,626 DR 104.6 151 381.4 201
Cape Coral, FL 329,757 DR 104.3 152 1,195.8 119
Victorville-Hesperia-Apple Valley, CA 200,436 DR 103.9 153 1,288.6 109
Santa Clarita, CA 170,481 DR 103.6 154 800.2 142
Seaside-Monterey-Marina, CA 125,503 DR 103.4 155 1,618.9 92
Sandusky, OH 50,693 DR 102.6 156 451.3 182
Cedar Rapids, IA 155,334 DR 101.5 157 639.8 161
Topeka, KS 142,411 DR 98.5 158 650.6 159
Rockford, IL 270,414 DR 98.3 159 736.6 150
College Station-Bryan, TX 132,500 DR 96.0 160 1,574.8 95
Holland, MI 91,921 DR 94.3 161 533.5 172
New Bedford, MA 146,730 DR 92.7 162 584.1 165
Fort Walton Beach, FL 152,741 DR 90.1 163 683.3 153
Idaho Falls, ID 66,973 DR 89.8 164 473.1 179
Omaha, NE-IA 626,623 DR 88.6 165 471.4 180
Yakima, WA 112,816 DR 87.5 166 305.2 227
Waterloo, IA 108,298 DR 86.9 167 538.0 171
Abilene, TX 107,041 DR 82.5 168 420.0 188
Ann Arbor, MI 283,904 DR 82.3 169 287.9 232
Santa Cruz, CA 157,348 DR 82.2 170 563.7 168
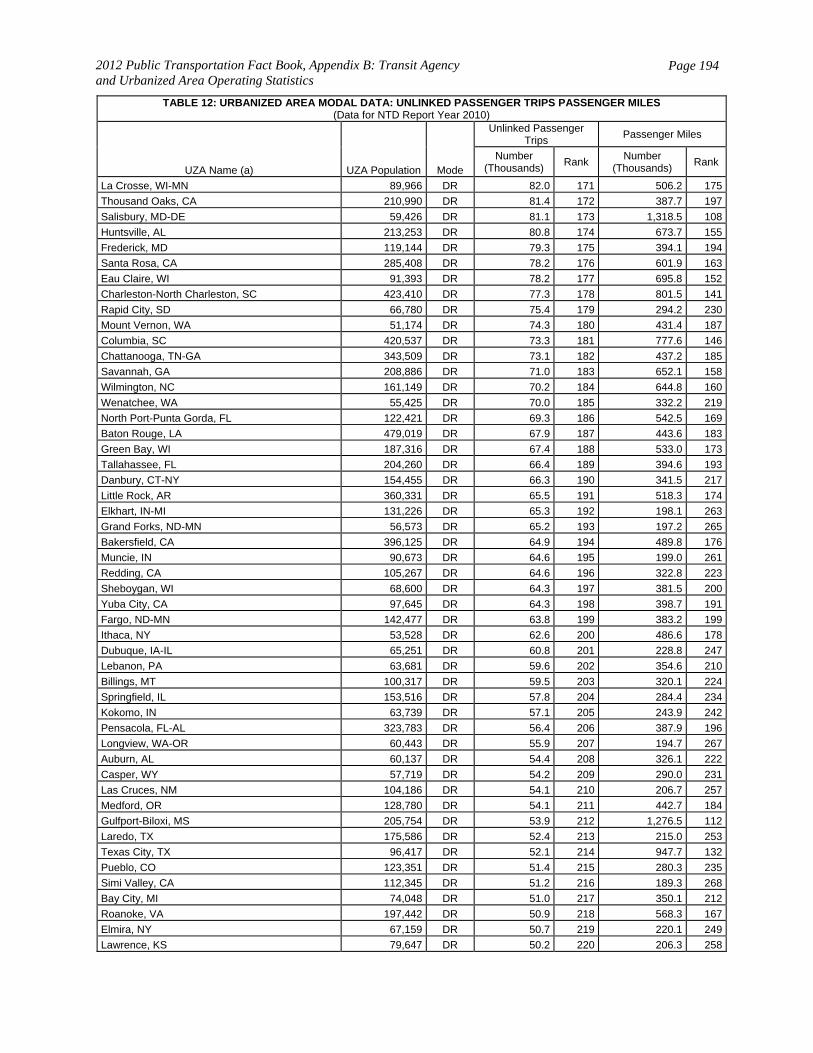
2012 Public Transportation Fact Book, Appendix B: Transit Agency and Urbanized Area Operating Statistics
Page 194
TABLE 12: URBANIZED AREA MODAL DATA: UNLINKED PASSENGER TRIPS PASSENGER MILES (Data for NTD Report Year 2010)
UZA Name (a) UZA Population Mode
Unlinked Passenger Trips
Passenger Miles
Number (Thousands)
Rank Number
(Thousands) Rank
La Crosse, WI-MN 89,966 DR 82.0 171 506.2 175
Thousand Oaks, CA 210,990 DR 81.4 172 387.7 197
Salisbury, MD-DE 59,426 DR 81.1 173 1,318.5 108
Huntsville, AL 213,253 DR 80.8 174 673.7 155
Frederick, MD 119,144 DR 79.3 175 394.1 194
Santa Rosa, CA 285,408 DR 78.2 176 601.9 163
Eau Claire, WI 91,393 DR 78.2 177 695.8 152
Charleston-North Charleston, SC 423,410 DR 77.3 178 801.5 141
Rapid City, SD 66,780 DR 75.4 179 294.2 230
Mount Vernon, WA 51,174 DR 74.3 180 431.4 187
Columbia, SC 420,537 DR 73.3 181 777.6 146
Chattanooga, TN-GA 343,509 DR 73.1 182 437.2 185
Savannah, GA 208,886 DR 71.0 183 652.1 158
Wilmington, NC 161,149 DR 70.2 184 644.8 160
Wenatchee, WA 55,425 DR 70.0 185 332.2 219
North Port-Punta Gorda, FL 122,421 DR 69.3 186 542.5 169
Baton Rouge, LA 479,019 DR 67.9 187 443.6 183
Green Bay, WI 187,316 DR 67.4 188 533.0 173
Tallahassee, FL 204,260 DR 66.4 189 394.6 193
Danbury, CT-NY 154,455 DR 66.3 190 341.5 217
Little Rock, AR 360,331 DR 65.5 191 518.3 174
Elkhart, IN-MI 131,226 DR 65.3 192 198.1 263
Grand Forks, ND-MN 56,573 DR 65.2 193 197.2 265
Bakersfield, CA 396,125 DR 64.9 194 489.8 176
Muncie, IN 90,673 DR 64.6 195 199.0 261
Redding, CA 105,267 DR 64.6 196 322.8 223
Sheboygan, WI 68,600 DR 64.3 197 381.5 200
Yuba City, CA 97,645 DR 64.3 198 398.7 191
Fargo, ND-MN 142,477 DR 63.8 199 383.2 199
Ithaca, NY 53,528 DR 62.6 200 486.6 178
Dubuque, IA-IL 65,251 DR 60.8 201 228.8 247
Lebanon, PA 63,681 DR 59.6 202 354.6 210
Billings, MT 100,317 DR 59.5 203 320.1 224
Springfield, IL 153,516 DR 57.8 204 284.4 234
Kokomo, IN 63,739 DR 57.1 205 243.9 242
Pensacola, FL-AL 323,783 DR 56.4 206 387.9 196
Longview, WA-OR 60,443 DR 55.9 207 194.7 267
Auburn, AL 60,137 DR 54.4 208 326.1 222
Casper, WY 57,719 DR 54.2 209 290.0 231
Las Cruces, NM 104,186 DR 54.1 210 206.7 257
Medford, OR 128,780 DR 54.1 211 442.7 184
Gulfport-Biloxi, MS 205,754 DR 53.9 212 1,276.5 112
Laredo, TX 175,586 DR 52.4 213 215.0 253
Texas City, TX 96,417 DR 52.1 214 947.7 132
Pueblo, CO 123,351 DR 51.4 215 280.3 235
Simi Valley, CA 112,345 DR 51.2 216 189.3 268
Bay City, MI 74,048 DR 51.0 217 350.1 212
Roanoke, VA 197,442 DR 50.9 218 568.3 167
Elmira, NY 67,159 DR 50.7 219 220.1 249
Lawrence, KS 79,647 DR 50.2 220 206.3 258

2012 Public Transportation Fact Book, Appendix B: Transit Agency and Urbanized Area Operating Statistics
Page 195
TABLE 12: URBANIZED AREA MODAL DATA: UNLINKED PASSENGER TRIPS PASSENGER MILES (Data for NTD Report Year 2010)
UZA Name (a) UZA Population Mode
Unlinked Passenger Trips
Passenger Miles
Number (Thousands)
Rank Number
(Thousands) Rank
Jefferson City, MO 53,714 DR 50.1 221 307.7 226
Myrtle Beach, SC 122,984 DR 50.0 222 660.5 157
Bend, OR 57,525 DR 49.5 223 175.5 272
Vero Beach-Sebastian, FL 120,962 DR 49.5 224 405.7 190
Fort Collins, CO 206,757 DR 48.6 225 276.6 236
South Bend, IN-MI 276,498 DR 48.5 226 363.3 206
Evansville, IN-KY 211,989 DR 47.9 227 295.5 229
Santa Barbara, CA 196,263 DR 45.4 228 271.5 238
Denton-Lewisville, TX 299,823 DR 44.7 229 344.9 214
Jackson, MI 88,050 DR 44.7 230 240.0 244
Gainesville, FL 159,508 DR 44.0 231 361.0 208
Fort Wayne, IN 287,759 DR 43.9 232 384.1 198
Burlington, VT 105,365 DR 43.2 233 210.9 255
Raleigh, NC 541,527 DR 42.8 234 389.9 195
Boise City, ID 272,625 DR 42.7 235 270.2 239
Fayetteville, NC 276,368 DR 42.4 236 319.8 225
Santa Fe, NM 80,337 DR 41.5 237 146.1 287
Montgomery, AL 196,892 DR 41.3 238 371.3 205
Oklahoma City, OK 747,003 DR 41.0 239 353.1 211
Rochester, MN 91,271 DR 40.7 240 303.9 228
Johnson City, TN 102,456 DR 40.6 241 163.6 275
Johnstown, PA 76,113 DR 40.5 242 157.1 280
Jackson, TN 65,086 DR 40.1 243 268.8 240
Napa, CA 79,867 DR 39.4 244 373.4 203
Racine, WI 129,545 DR 39.3 245 154.4 281
McKinney, TX 54,525 DR 39.0 246 339.9 218
Lodi, CA 83,735 DR 38.8 247 94.2 314
Utica, NY 113,409 DR 37.7 248 135.9 293
Sioux City, IA-NE-SD 106,119 DR 37.4 249 343.1 215
Fond du Lac, WI 50,058 DR 37.0 250 165.3 274
Aberdeen-Havre de Grace-Bel Air, MD 174,598 DR 37.0 251 397.3 192
El Centro, CA 52,954 DR 36.8 252 456.8 181
Huntington, WV-KY-OH 177,550 DR 36.7 253 271.8 237
Brownsville, TX 165,776 DR 36.6 254 207.2 256
Shreveport, LA 275,213 DR 36.5 255 362.5 207
Pittsfield, MA 52,772 DR 35.7 256 219.1 250
Stockton, CA 313,392 DR 35.0 257 186.8 269
Lincoln, NE 226,582 DR 34.7 258 204.8 259
State College, PA 71,301 DR 34.6 259 197.5 264
Bloomington-Normal, IL 112,415 DR 34.2 260 198.4 262
Hanford, CA 69,639 DR 33.8 261 120.8 302
Norman, OK 86,478 DR 33.2 262 122.2 299
Visalia, CA 120,044 DR 33.2 263 246.0 241
Charleston, WV 182,991 DR 32.4 264 372.1 204
Fayetteville-Springdale, AR 172,585 DR 32.0 265 136.5 292
Columbia, MO 98,779 DR 31.7 266 103.1 309
Brooksville, FL 102,193 DR 31.6 267 381.1 202
Lancaster-Palmdale, CA 263,532 DR 31.1 268 355.7 209
Yuma, AZ-CA 94,950 DR 30.4 269 433.5 186
High Point, NC 132,844 DR 30.3 270 163.0 277

2012 Public Transportation Fact Book, Appendix B: Transit Agency and Urbanized Area Operating Statistics
Page 196
TABLE 12: URBANIZED AREA MODAL DATA: UNLINKED PASSENGER TRIPS PASSENGER MILES (Data for NTD Report Year 2010)
UZA Name (a) UZA Population Mode
Unlinked Passenger Trips
Passenger Miles
Number (Thousands)
Rank Number
(Thousands) Rank
Clarksville, TN-KY 121,775 DR 30.3 271 200.3 260
St. Charles, MD 74,765 DR 30.2 272 330.6 221
San Luis Obispo, CA 53,498 DR 30.0 273 345.7 213
Amarillo, TX 179,312 DR 29.7 274 243.1 243
Scranton, PA 385,237 DR 29.6 275 154.3 282
Oshkosh, WI 71,070 DR 29.5 276 120.3 303
Wausau, WI 68,221 DR 28.7 277t 331.9 220
Fort Smith, AR-OK 106,470 DR 28.7 277t 217.2 251
Waco, TX 153,198 DR 27.3 279 157.3 279
Flagstaff, AZ 57,050 DR 27.3 280 146.4 286
Gainesville, GA 88,680 DR 27.2 281 212.8 254
Battle Creek, MI 79,135 DR 27.2 282 124.0 298
Rome, GA 58,287 DR 26.9 283 128.1 296
Bloomington, IN 92,456 DR 26.9 284 101.7 312
Kenosha, WI 110,942 DR 26.8 285 133.6 294
Logan, UT 76,187 DR 26.5 286 102.3 311
Lafayette, LA 178,079 DR 26.3 287 163.2 276
Anderson, IN 97,038 DR 26.2 288 104.7 308
Nashua, NH-MA 197,155 DR 26.1 289 169.9 273
Vallejo, CA 158,967 DR 25.9 290 114.2 307
Lynchburg, VA 98,714 DR 25.8 291 159.1 278
Lawton, OK 89,556 DR 25.7 292 181.0 271
Duluth, MN-WI 118,265 DR 25.6 293 145.3 288
Odessa, TX 111,395 DR 25.5 294 150.3 284
Great Falls, MT 64,387 DR 25.1 295 63.8 330
Mansfield, OH 79,698 DR 25.0 296 121.1 301
Asheville, NC 221,570 DR 25.0 297 234.6 246
Greeley, CO 93,879 DR 24.9 298 94.4 313
Jackson, MS 292,637 DR 24.8 299 222.4 248
Cheyenne, WY 68,202 DR 24.2 300 238.6 245
Santa Maria, CA 120,297 DR 24.2 301 119.0 305
Lafayette, IN 125,738 DR 23.1 302 119.9 304
Cleveland, TN 58,192 DR 22.8 303 75.5 323
Fairfield, CA 112,446 DR 22.4 304 182.9 270
Decatur, IL 96,454 DR 21.8 305 89.2 316
Missoula, MT 69,491 DR 21.3 306 71.0 326
Beaumont, TX 139,304 DR 21.3 307 152.7 283
Danville, VA 50,902 DR 21.3 308 132.5 295
Cumberland, MD--WV 52,115 DR 21.1 309 195.7 266
Fairbanks, AK 51,926 DR 21.1 310 148.2 285
Port Arthur, TX 114,656 DR 21.1 311 126.0 297
Saginaw, MI 140,985 DR 21.0 312 102.9 310
Petaluma, CA 59,958 DR 20.5 313 77.1 320
Lompoc, CA 55,667 DR 19.5 314 79.9 319
Athens-Clarke County, GA 106,482 DR 19.4 315 61.6 333
Blacksburg, VA 57,236 DR 19.3 316 52.3 338
Columbus, GA-AL 242,324 DR 19.2 317 143.8 290
Galveston, TX 54,770 DR 19.0 318 82.1 318
McAllen, TX 523,144 DR 18.6 319 145.3 289
Harrisonburg, VA 52,647 DR 18.6 320 73.6 324
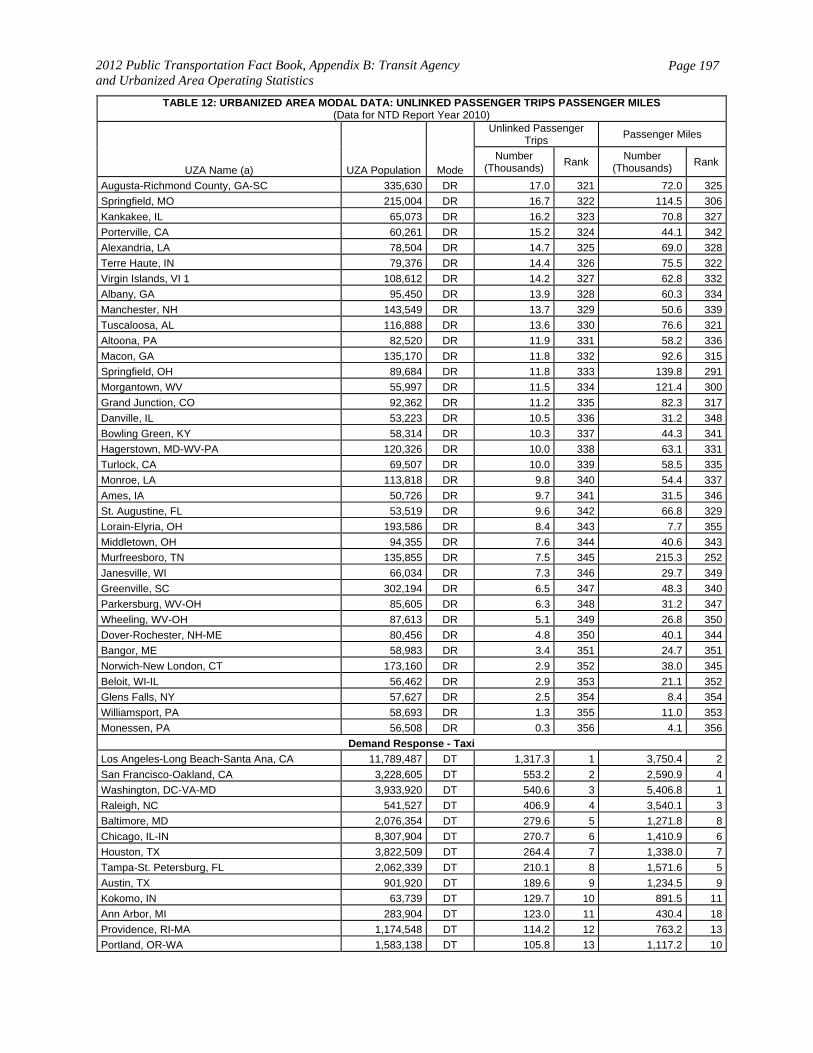
2012 Public Transportation Fact Book, Appendix B: Transit Agency and Urbanized Area Operating Statistics
Page 197
TABLE 12: URBANIZED AREA MODAL DATA: UNLINKED PASSENGER TRIPS PASSENGER MILES (Data for NTD Report Year 2010)
UZA Name (a) UZA Population Mode
Unlinked Passenger Trips
Passenger Miles
Number (Thousands)
Rank Number
(Thousands) Rank
Augusta-Richmond County, GA-SC 335,630 DR 17.0 321 72.0 325
Springfield, MO 215,004 DR 16.7 322 114.5 306
Kankakee, IL 65,073 DR 16.2 323 70.8 327
Porterville, CA 60,261 DR 15.2 324 44.1 342
Alexandria, LA 78,504 DR 14.7 325 69.0 328
Terre Haute, IN 79,376 DR 14.4 326 75.5 322
Virgin Islands, VI 1 108,612 DR 14.2 327 62.8 332
Albany, GA 95,450 DR 13.9 328 60.3 334
Manchester, NH 143,549 DR 13.7 329 50.6 339
Tuscaloosa, AL 116,888 DR 13.6 330 76.6 321
Altoona, PA 82,520 DR 11.9 331 58.2 336
Macon, GA 135,170 DR 11.8 332 92.6 315
Springfield, OH 89,684 DR 11.8 333 139.8 291
Morgantown, WV 55,997 DR 11.5 334 121.4 300
Grand Junction, CO 92,362 DR 11.2 335 82.3 317
Danville, IL 53,223 DR 10.5 336 31.2 348
Bowling Green, KY 58,314 DR 10.3 337 44.3 341
Hagerstown, MD-WV-PA 120,326 DR 10.0 338 63.1 331
Turlock, CA 69,507 DR 10.0 339 58.5 335
Monroe, LA 113,818 DR 9.8 340 54.4 337
Ames, IA 50,726 DR 9.7 341 31.5 346
St. Augustine, FL 53,519 DR 9.6 342 66.8 329
Lorain-Elyria, OH 193,586 DR 8.4 343 7.7 355
Middletown, OH 94,355 DR 7.6 344 40.6 343
Murfreesboro, TN 135,855 DR 7.5 345 215.3 252
Janesville, WI 66,034 DR 7.3 346 29.7 349
Greenville, SC 302,194 DR 6.5 347 48.3 340
Parkersburg, WV-OH 85,605 DR 6.3 348 31.2 347
Wheeling, WV-OH 87,613 DR 5.1 349 26.8 350
Dover-Rochester, NH-ME 80,456 DR 4.8 350 40.1 344
Bangor, ME 58,983 DR 3.4 351 24.7 351
Norwich-New London, CT 173,160 DR 2.9 352 38.0 345
Beloit, WI-IL 56,462 DR 2.9 353 21.1 352
Glens Falls, NY 57,627 DR 2.5 354 8.4 354
Williamsport, PA 58,693 DR 1.3 355 11.0 353
Monessen, PA 56,508 DR 0.3 356 4.1 356
Demand Response - Taxi
Los Angeles-Long Beach-Santa Ana, CA 11,789,487 DT 1,317.3 1 3,750.4 2
San Francisco-Oakland, CA 3,228,605 DT 553.2 2 2,590.9 4
Washington, DC-VA-MD 3,933,920 DT 540.6 3 5,406.8 1
Raleigh, NC 541,527 DT 406.9 4 3,540.1 3
Baltimore, MD 2,076,354 DT 279.6 5 1,271.8 8
Chicago, IL-IN 8,307,904 DT 270.7 6 1,410.9 6
Houston, TX 3,822,509 DT 264.4 7 1,338.0 7
Tampa-St. Petersburg, FL 2,062,339 DT 210.1 8 1,571.6 5
Austin, TX 901,920 DT 189.6 9 1,234.5 9
Kokomo, IN 63,739 DT 129.7 10 891.5 11
Ann Arbor, MI 283,904 DT 123.0 11 430.4 18
Providence, RI-MA 1,174,548 DT 114.2 12 763.2 13
Portland, OR-WA 1,583,138 DT 105.8 13 1,117.2 10
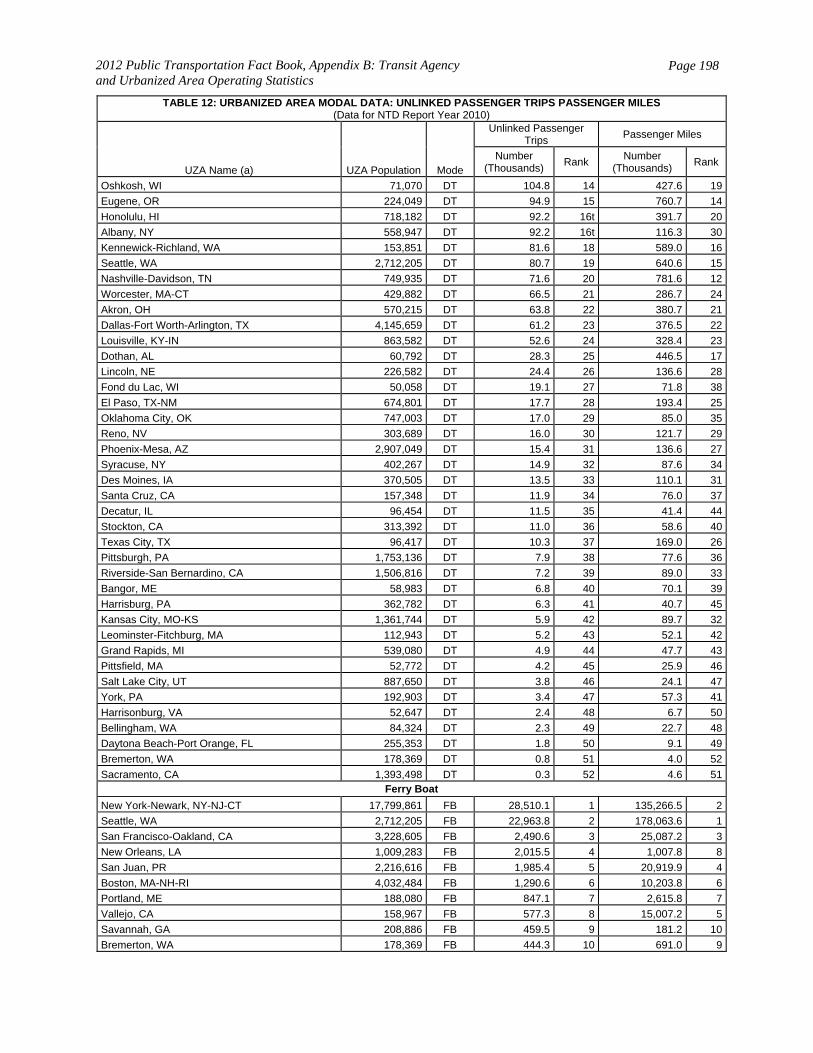
2012 Public Transportation Fact Book, Appendix B: Transit Agency and Urbanized Area Operating Statistics
Page 198
TABLE 12: URBANIZED AREA MODAL DATA: UNLINKED PASSENGER TRIPS PASSENGER MILES (Data for NTD Report Year 2010)
UZA Name (a) UZA Population Mode
Unlinked Passenger Trips
Passenger Miles
Number (Thousands)
Rank Number
(Thousands) Rank
Oshkosh, WI 71,070 DT 104.8 14 427.6 19
Eugene, OR 224,049 DT 94.9 15 760.7 14
Honolulu, HI 718,182 DT 92.2 16t 391.7 20
Albany, NY 558,947 DT 92.2 16t 116.3 30
Kennewick-Richland, WA 153,851 DT 81.6 18 589.0 16
Seattle, WA 2,712,205 DT 80.7 19 640.6 15
Nashville-Davidson, TN 749,935 DT 71.6 20 781.6 12
Worcester, MA-CT 429,882 DT 66.5 21 286.7 24
Akron, OH 570,215 DT 63.8 22 380.7 21
Dallas-Fort Worth-Arlington, TX 4,145,659 DT 61.2 23 376.5 22
Louisville, KY-IN 863,582 DT 52.6 24 328.4 23
Dothan, AL 60,792 DT 28.3 25 446.5 17
Lincoln, NE 226,582 DT 24.4 26 136.6 28
Fond du Lac, WI 50,058 DT 19.1 27 71.8 38
El Paso, TX-NM 674,801 DT 17.7 28 193.4 25
Oklahoma City, OK 747,003 DT 17.0 29 85.0 35
Reno, NV 303,689 DT 16.0 30 121.7 29
Phoenix-Mesa, AZ 2,907,049 DT 15.4 31 136.6 27
Syracuse, NY 402,267 DT 14.9 32 87.6 34
Des Moines, IA 370,505 DT 13.5 33 110.1 31
Santa Cruz, CA 157,348 DT 11.9 34 76.0 37
Decatur, IL 96,454 DT 11.5 35 41.4 44
Stockton, CA 313,392 DT 11.0 36 58.6 40
Texas City, TX 96,417 DT 10.3 37 169.0 26
Pittsburgh, PA 1,753,136 DT 7.9 38 77.6 36
Riverside-San Bernardino, CA 1,506,816 DT 7.2 39 89.0 33
Bangor, ME 58,983 DT 6.8 40 70.1 39
Harrisburg, PA 362,782 DT 6.3 41 40.7 45
Kansas City, MO-KS 1,361,744 DT 5.9 42 89.7 32
Leominster-Fitchburg, MA 112,943 DT 5.2 43 52.1 42
Grand Rapids, MI 539,080 DT 4.9 44 47.7 43
Pittsfield, MA 52,772 DT 4.2 45 25.9 46
Salt Lake City, UT 887,650 DT 3.8 46 24.1 47
York, PA 192,903 DT 3.4 47 57.3 41
Harrisonburg, VA 52,647 DT 2.4 48 6.7 50
Bellingham, WA 84,324 DT 2.3 49 22.7 48
Daytona Beach-Port Orange, FL 255,353 DT 1.8 50 9.1 49
Bremerton, WA 178,369 DT 0.8 51 4.0 52
Sacramento, CA 1,393,498 DT 0.3 52 4.6 51Ferry Boat
New York-Newark, NY-NJ-CT 17,799,861 FB 28,510.1 1 135,266.5 2
Seattle, WA 2,712,205 FB 22,963.8 2 178,063.6 1
San Francisco-Oakland, CA 3,228,605 FB 2,490.6 3 25,087.2 3
New Orleans, LA 1,009,283 FB 2,015.5 4 1,007.8 8
San Juan, PR 2,216,616 FB 1,985.4 5 20,919.9 4
Boston, MA-NH-RI 4,032,484 FB 1,290.6 6 10,203.8 6
Portland, ME 188,080 FB 847.1 7 2,615.8 7
Vallejo, CA 158,967 FB 577.3 8 15,007.2 5
Savannah, GA 208,886 FB 459.5 9 181.2 10
Bremerton, WA 178,369 FB 444.3 10 691.0 9
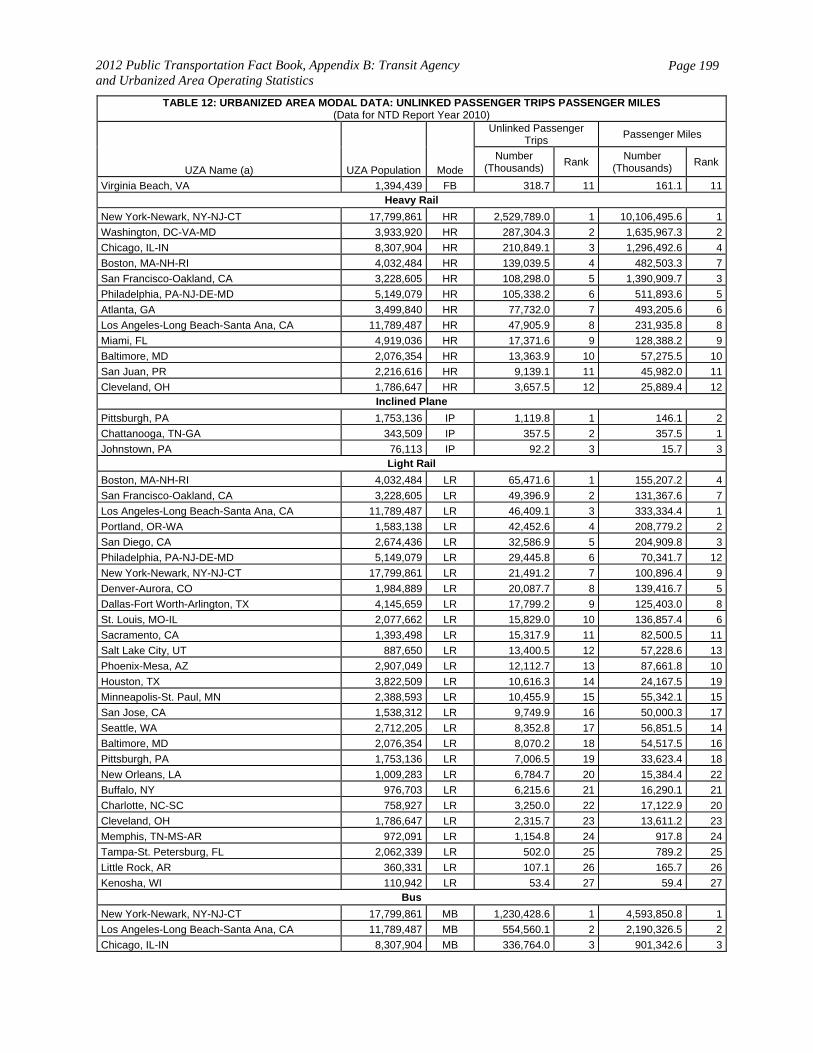
2012 Public Transportation Fact Book, Appendix B: Transit Agency and Urbanized Area Operating Statistics
Page 199
TABLE 12: URBANIZED AREA MODAL DATA: UNLINKED PASSENGER TRIPS PASSENGER MILES (Data for NTD Report Year 2010)
UZA Name (a) UZA Population Mode
Unlinked Passenger Trips
Passenger Miles
Number (Thousands)
Rank Number
(Thousands) Rank
Virginia Beach, VA 1,394,439 FB 318.7 11 161.1 11Heavy Rail
New York-Newark, NY-NJ-CT 17,799,861 HR 2,529,789.0 1 10,106,495.6 1
Washington, DC-VA-MD 3,933,920 HR 287,304.3 2 1,635,967.3 2
Chicago, IL-IN 8,307,904 HR 210,849.1 3 1,296,492.6 4
Boston, MA-NH-RI 4,032,484 HR 139,039.5 4 482,503.3 7
San Francisco-Oakland, CA 3,228,605 HR 108,298.0 5 1,390,909.7 3
Philadelphia, PA-NJ-DE-MD 5,149,079 HR 105,338.2 6 511,893.6 5
Atlanta, GA 3,499,840 HR 77,732.0 7 493,205.6 6
Los Angeles-Long Beach-Santa Ana, CA 11,789,487 HR 47,905.9 8 231,935.8 8
Miami, FL 4,919,036 HR 17,371.6 9 128,388.2 9
Baltimore, MD 2,076,354 HR 13,363.9 10 57,275.5 10
San Juan, PR 2,216,616 HR 9,139.1 11 45,982.0 11
Cleveland, OH 1,786,647 HR 3,657.5 12 25,889.4 12Inclined Plane
Pittsburgh, PA 1,753,136 IP 1,119.8 1 146.1 2
Chattanooga, TN-GA 343,509 IP 357.5 2 357.5 1
Johnstown, PA 76,113 IP 92.2 3 15.7 3Light Rail
Boston, MA-NH-RI 4,032,484 LR 65,471.6 1 155,207.2 4
San Francisco-Oakland, CA 3,228,605 LR 49,396.9 2 131,367.6 7
Los Angeles-Long Beach-Santa Ana, CA 11,789,487 LR 46,409.1 3 333,334.4 1
Portland, OR-WA 1,583,138 LR 42,452.6 4 208,779.2 2
San Diego, CA 2,674,436 LR 32,586.9 5 204,909.8 3
Philadelphia, PA-NJ-DE-MD 5,149,079 LR 29,445.8 6 70,341.7 12
New York-Newark, NY-NJ-CT 17,799,861 LR 21,491.2 7 100,896.4 9
Denver-Aurora, CO 1,984,889 LR 20,087.7 8 139,416.7 5
Dallas-Fort Worth-Arlington, TX 4,145,659 LR 17,799.2 9 125,403.0 8
St. Louis, MO-IL 2,077,662 LR 15,829.0 10 136,857.4 6
Sacramento, CA 1,393,498 LR 15,317.9 11 82,500.5 11
Salt Lake City, UT 887,650 LR 13,400.5 12 57,228.6 13
Phoenix-Mesa, AZ 2,907,049 LR 12,112.7 13 87,661.8 10
Houston, TX 3,822,509 LR 10,616.3 14 24,167.5 19
Minneapolis-St. Paul, MN 2,388,593 LR 10,455.9 15 55,342.1 15
San Jose, CA 1,538,312 LR 9,749.9 16 50,000.3 17
Seattle, WA 2,712,205 LR 8,352.8 17 56,851.5 14
Baltimore, MD 2,076,354 LR 8,070.2 18 54,517.5 16
Pittsburgh, PA 1,753,136 LR 7,006.5 19 33,623.4 18
New Orleans, LA 1,009,283 LR 6,784.7 20 15,384.4 22
Buffalo, NY 976,703 LR 6,215.6 21 16,290.1 21
Charlotte, NC-SC 758,927 LR 3,250.0 22 17,122.9 20
Cleveland, OH 1,786,647 LR 2,315.7 23 13,611.2 23
Memphis, TN-MS-AR 972,091 LR 1,154.8 24 917.8 24
Tampa-St. Petersburg, FL 2,062,339 LR 502.0 25 789.2 25
Little Rock, AR 360,331 LR 107.1 26 165.7 26
Kenosha, WI 110,942 LR 53.4 27 59.4 27Bus
New York-Newark, NY-NJ-CT 17,799,861 MB 1,230,428.6 1 4,593,850.8 1
Los Angeles-Long Beach-Santa Ana, CA 11,789,487 MB 554,560.1 2 2,190,326.5 2
Chicago, IL-IN 8,307,904 MB 336,764.0 3 901,342.6 3
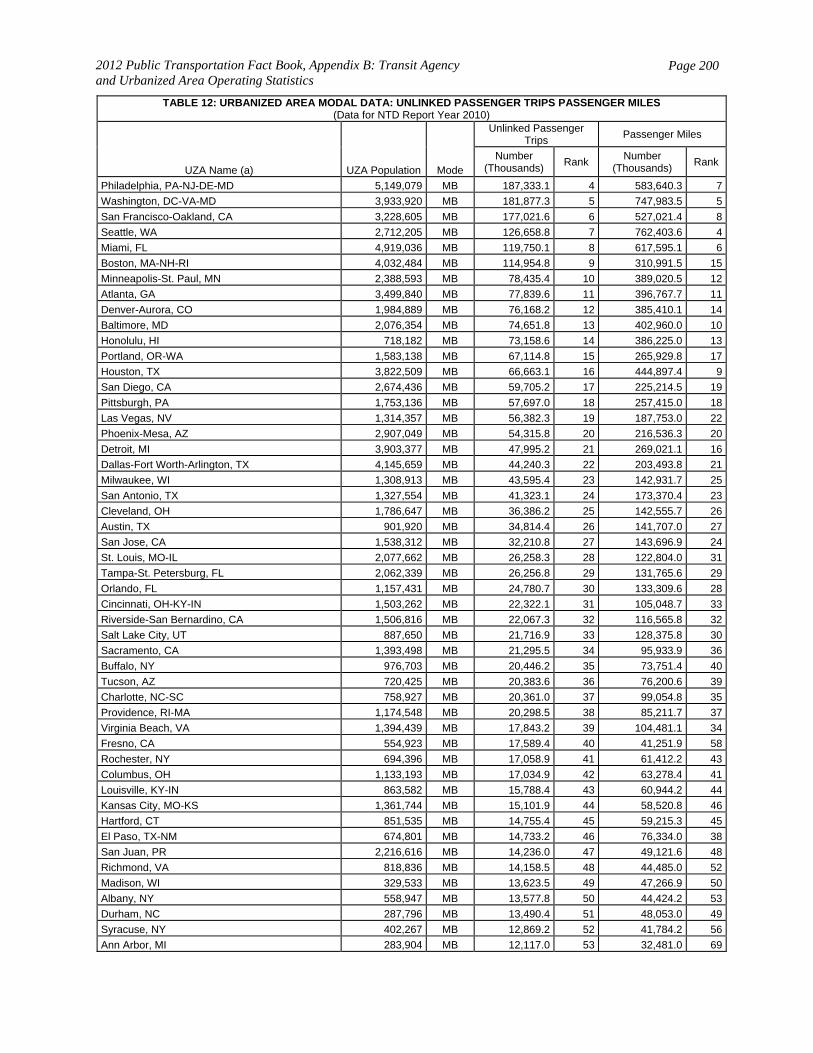
2012 Public Transportation Fact Book, Appendix B: Transit Agency and Urbanized Area Operating Statistics
Page 200
TABLE 12: URBANIZED AREA MODAL DATA: UNLINKED PASSENGER TRIPS PASSENGER MILES (Data for NTD Report Year 2010)
UZA Name (a) UZA Population Mode
Unlinked Passenger Trips
Passenger Miles
Number (Thousands)
Rank Number
(Thousands) Rank
Philadelphia, PA-NJ-DE-MD 5,149,079 MB 187,333.1 4 583,640.3 7
Washington, DC-VA-MD 3,933,920 MB 181,877.3 5 747,983.5 5
San Francisco-Oakland, CA 3,228,605 MB 177,021.6 6 527,021.4 8
Seattle, WA 2,712,205 MB 126,658.8 7 762,403.6 4
Miami, FL 4,919,036 MB 119,750.1 8 617,595.1 6
Boston, MA-NH-RI 4,032,484 MB 114,954.8 9 310,991.5 15
Minneapolis-St. Paul, MN 2,388,593 MB 78,435.4 10 389,020.5 12
Atlanta, GA 3,499,840 MB 77,839.6 11 396,767.7 11
Denver-Aurora, CO 1,984,889 MB 76,168.2 12 385,410.1 14
Baltimore, MD 2,076,354 MB 74,651.8 13 402,960.0 10
Honolulu, HI 718,182 MB 73,158.6 14 386,225.0 13
Portland, OR-WA 1,583,138 MB 67,114.8 15 265,929.8 17
Houston, TX 3,822,509 MB 66,663.1 16 444,897.4 9
San Diego, CA 2,674,436 MB 59,705.2 17 225,214.5 19
Pittsburgh, PA 1,753,136 MB 57,697.0 18 257,415.0 18
Las Vegas, NV 1,314,357 MB 56,382.3 19 187,753.0 22
Phoenix-Mesa, AZ 2,907,049 MB 54,315.8 20 216,536.3 20
Detroit, MI 3,903,377 MB 47,995.2 21 269,021.1 16
Dallas-Fort Worth-Arlington, TX 4,145,659 MB 44,240.3 22 203,493.8 21
Milwaukee, WI 1,308,913 MB 43,595.4 23 142,931.7 25
San Antonio, TX 1,327,554 MB 41,323.1 24 173,370.4 23
Cleveland, OH 1,786,647 MB 36,386.2 25 142,555.7 26
Austin, TX 901,920 MB 34,814.4 26 141,707.0 27
San Jose, CA 1,538,312 MB 32,210.8 27 143,696.9 24
St. Louis, MO-IL 2,077,662 MB 26,258.3 28 122,804.0 31
Tampa-St. Petersburg, FL 2,062,339 MB 26,256.8 29 131,765.6 29
Orlando, FL 1,157,431 MB 24,780.7 30 133,309.6 28
Cincinnati, OH-KY-IN 1,503,262 MB 22,322.1 31 105,048.7 33
Riverside-San Bernardino, CA 1,506,816 MB 22,067.3 32 116,565.8 32
Salt Lake City, UT 887,650 MB 21,716.9 33 128,375.8 30
Sacramento, CA 1,393,498 MB 21,295.5 34 95,933.9 36
Buffalo, NY 976,703 MB 20,446.2 35 73,751.4 40
Tucson, AZ 720,425 MB 20,383.6 36 76,200.6 39
Charlotte, NC-SC 758,927 MB 20,361.0 37 99,054.8 35
Providence, RI-MA 1,174,548 MB 20,298.5 38 85,211.7 37
Virginia Beach, VA 1,394,439 MB 17,843.2 39 104,481.1 34
Fresno, CA 554,923 MB 17,589.4 40 41,251.9 58
Rochester, NY 694,396 MB 17,058.9 41 61,412.2 43
Columbus, OH 1,133,193 MB 17,034.9 42 63,278.4 41
Louisville, KY-IN 863,582 MB 15,788.4 43 60,944.2 44
Kansas City, MO-KS 1,361,744 MB 15,101.9 44 58,520.8 46
Hartford, CT 851,535 MB 14,755.4 45 59,215.3 45
El Paso, TX-NM 674,801 MB 14,733.2 46 76,334.0 38
San Juan, PR 2,216,616 MB 14,236.0 47 49,121.6 48
Richmond, VA 818,836 MB 14,158.5 48 44,485.0 52
Madison, WI 329,533 MB 13,623.5 49 47,266.9 50
Albany, NY 558,947 MB 13,577.8 50 44,424.2 53
Durham, NC 287,796 MB 13,490.4 51 48,053.0 49
Syracuse, NY 402,267 MB 12,869.2 52 41,784.2 56
Ann Arbor, MI 283,904 MB 12,117.0 53 32,481.0 69

2012 Public Transportation Fact Book, Appendix B: Transit Agency and Urbanized Area Operating Statistics
Page 201
TABLE 12: URBANIZED AREA MODAL DATA: UNLINKED PASSENGER TRIPS PASSENGER MILES (Data for NTD Report Year 2010)
UZA Name (a) UZA Population Mode
Unlinked Passenger Trips
Passenger Miles
Number (Thousands)
Rank Number
(Thousands) Rank
Eugene, OR 224,049 MB 11,362.5 54 41,547.4 57
Albuquerque, NM 598,191 MB 11,177.1 55 37,443.3 60
Athens-Clarke County, GA 106,482 MB 11,025.5 56 10,007.8 134
New Orleans, LA 1,009,283 MB 11,008.5 57 42,188.2 55
Lansing, MI 300,032 MB 10,883.4 58 34,823.7 63
Bridgeport-Stamford, CT-NY 888,890 MB 10,786.4 59 33,873.1 64
Jacksonville, FL 882,295 MB 10,757.5 60 62,201.9 42
Spokane, WA-ID 334,858 MB 10,710.5 61 43,652.2 54
Springfield, MA-CT 573,610 MB 10,484.9 62 29,490.5 71
Memphis, TN-MS-AR 972,091 MB 10,114.0 63 54,460.6 47
Champaign, IL 123,938 MB 10,011.0 64 31,190.9 70
Gainesville, FL 159,508 MB 9,373.1 65 26,244.6 77
Grand Rapids, MI 539,080 MB 9,307.1 66 32,481.8 68
New Haven, CT 531,314 MB 8,730.4 67 29,205.6 72
Nashville-Davidson, TN 749,935 MB 8,667.2 68 45,063.1 51
Indianapolis, IN 1,218,919 MB 8,527.9 69 33,792.4 65
Santa Barbara, CA 196,263 MB 7,963.1 70 33,336.6 66
Raleigh, NC 541,527 MB 7,639.3 71 25,668.5 79
Reno, NV 303,689 MB 7,474.9 72 23,753.7 83
Bakersfield, CA 396,125 MB 7,294.5 73 25,971.6 78
State College, PA 71,301 MB 7,195.0 74 17,052.2 97
Iowa City, IA 85,247 MB 6,370.7 75 10,619.7 133
Dayton, OH 703,444 MB 6,355.7 76 33,104.5 67
Akron, OH 570,215 MB 6,207.5 77 23,147.5 84
Lexington-Fayette, KY 250,994 MB 6,104.7 78 19,308.7 92
Santa Cruz, CA 157,348 MB 5,745.9 79 36,321.2 62
Allentown-Bethlehem, PA-NJ 576,408 MB 5,475.0 80 20,012.2 90
Ames, IA 50,726 MB 5,367.4 81 8,348.7 146
Corpus Christi, TX 293,925 MB 5,238.1 82 22,619.7 85
Flint, MI 365,096 MB 5,189.7 83 21,091.7 87
Concord, CA 552,624 MB 4,976.0 84 24,320.6 81
Lafayette, IN 125,738 MB 4,923.1 85 9,900.3 136
Bellingham, WA 84,324 MB 4,886.7 86 14,876.1 108
Tallahassee, FL 204,260 MB 4,762.2 87 13,568.3 117
Davenport, IA-IL 270,626 MB 4,537.4 88 15,056.4 107
Greensboro, NC 267,884 MB 4,486.1 89 28,038.1 73
Olympia-Lacey, WA 143,826 MB 4,313.0 90 18,169.9 94
Stockton, CA 313,392 MB 4,303.2 91 27,343.2 75
Salem, OR 207,229 MB 4,272.5 92 11,974.1 125
Seaside-Monterey-Marina, CA 125,503 MB 4,249.6 93 27,998.0 74
Oxnard, CA 337,591 MB 4,221.2 94 19,613.5 91
Charleston-North Charleston, SC 423,410 MB 4,203.7 95 15,478.4 101
Omaha, NE-IA 626,623 MB 4,193.4 96 17,648.4 95
Sarasota-Bradenton, FL 559,229 MB 4,174.6 97 21,900.8 86
Des Moines, IA 370,505 MB 4,171.2 98 16,894.3 98
Santa Rosa, CA 285,408 MB 4,157.2 99 20,356.7 88
Anchorage, AK 225,744 MB 4,145.6 100 18,509.8 93
Santa Clarita, CA 170,481 MB 3,818.4 101 39,864.5 59
Indio-Cathedral City-Palm Springs, CA 254,856 MB 3,607.7 102 20,292.9 89
Ithaca, NY 53,528 MB 3,577.6 103 9,126.8 142
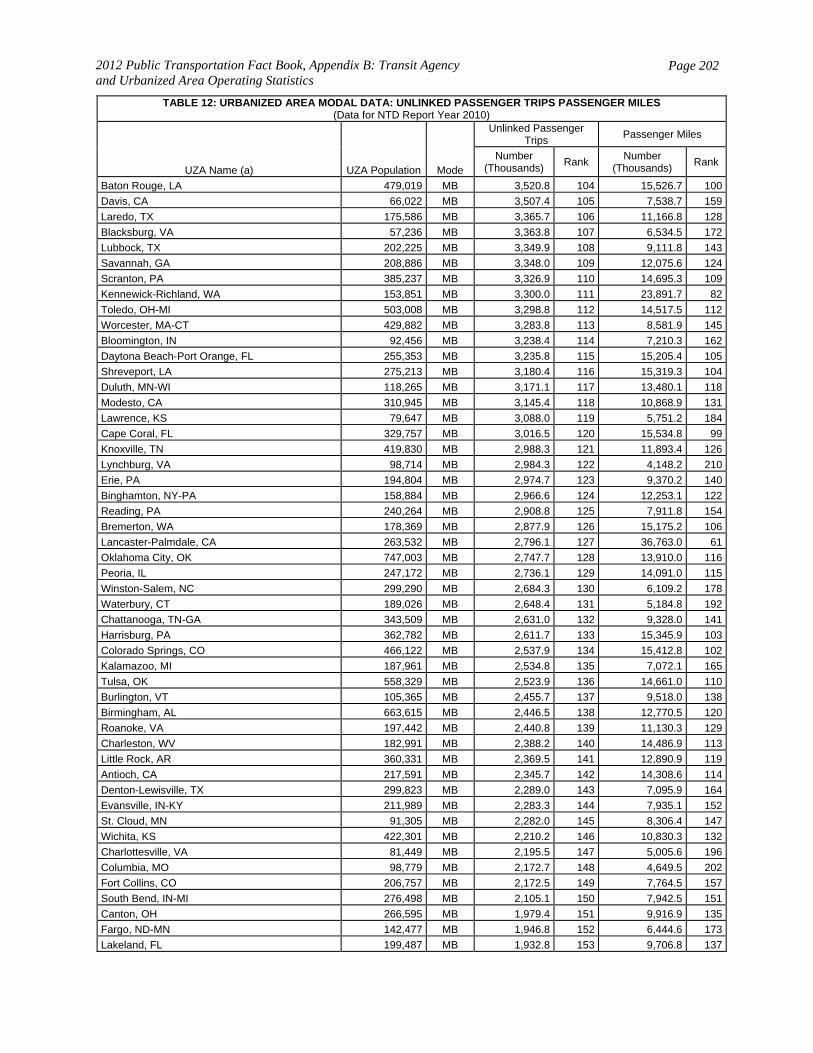
2012 Public Transportation Fact Book, Appendix B: Transit Agency and Urbanized Area Operating Statistics
Page 202
TABLE 12: URBANIZED AREA MODAL DATA: UNLINKED PASSENGER TRIPS PASSENGER MILES (Data for NTD Report Year 2010)
UZA Name (a) UZA Population Mode
Unlinked Passenger Trips
Passenger Miles
Number (Thousands)
Rank Number
(Thousands) Rank
Baton Rouge, LA 479,019 MB 3,520.8 104 15,526.7 100
Davis, CA 66,022 MB 3,507.4 105 7,538.7 159
Laredo, TX 175,586 MB 3,365.7 106 11,166.8 128
Blacksburg, VA 57,236 MB 3,363.8 107 6,534.5 172
Lubbock, TX 202,225 MB 3,349.9 108 9,111.8 143
Savannah, GA 208,886 MB 3,348.0 109 12,075.6 124
Scranton, PA 385,237 MB 3,326.9 110 14,695.3 109
Kennewick-Richland, WA 153,851 MB 3,300.0 111 23,891.7 82
Toledo, OH-MI 503,008 MB 3,298.8 112 14,517.5 112
Worcester, MA-CT 429,882 MB 3,283.8 113 8,581.9 145
Bloomington, IN 92,456 MB 3,238.4 114 7,210.3 162
Daytona Beach-Port Orange, FL 255,353 MB 3,235.8 115 15,205.4 105
Shreveport, LA 275,213 MB 3,180.4 116 15,319.3 104
Duluth, MN-WI 118,265 MB 3,171.1 117 13,480.1 118
Modesto, CA 310,945 MB 3,145.4 118 10,868.9 131
Lawrence, KS 79,647 MB 3,088.0 119 5,751.2 184
Cape Coral, FL 329,757 MB 3,016.5 120 15,534.8 99
Knoxville, TN 419,830 MB 2,988.3 121 11,893.4 126
Lynchburg, VA 98,714 MB 2,984.3 122 4,148.2 210
Erie, PA 194,804 MB 2,974.7 123 9,370.2 140
Binghamton, NY-PA 158,884 MB 2,966.6 124 12,253.1 122
Reading, PA 240,264 MB 2,908.8 125 7,911.8 154
Bremerton, WA 178,369 MB 2,877.9 126 15,175.2 106
Lancaster-Palmdale, CA 263,532 MB 2,796.1 127 36,763.0 61
Oklahoma City, OK 747,003 MB 2,747.7 128 13,910.0 116
Peoria, IL 247,172 MB 2,736.1 129 14,091.0 115
Winston-Salem, NC 299,290 MB 2,684.3 130 6,109.2 178
Waterbury, CT 189,026 MB 2,648.4 131 5,184.8 192
Chattanooga, TN-GA 343,509 MB 2,631.0 132 9,328.0 141
Harrisburg, PA 362,782 MB 2,611.7 133 15,345.9 103
Colorado Springs, CO 466,122 MB 2,537.9 134 15,412.8 102
Kalamazoo, MI 187,961 MB 2,534.8 135 7,072.1 165
Tulsa, OK 558,329 MB 2,523.9 136 14,661.0 110
Burlington, VT 105,365 MB 2,455.7 137 9,518.0 138
Birmingham, AL 663,615 MB 2,446.5 138 12,770.5 120
Roanoke, VA 197,442 MB 2,440.8 139 11,130.3 129
Charleston, WV 182,991 MB 2,388.2 140 14,486.9 113
Little Rock, AR 360,331 MB 2,369.5 141 12,890.9 119
Antioch, CA 217,591 MB 2,345.7 142 14,308.6 114
Denton-Lewisville, TX 299,823 MB 2,289.0 143 7,095.9 164
Evansville, IN-KY 211,989 MB 2,283.3 144 7,935.1 152
St. Cloud, MN 91,305 MB 2,282.0 145 8,306.4 147
Wichita, KS 422,301 MB 2,210.2 146 10,830.3 132
Charlottesville, VA 81,449 MB 2,195.5 147 5,005.6 196
Columbia, MO 98,779 MB 2,172.7 148 4,649.5 202
Fort Collins, CO 206,757 MB 2,172.5 149 7,764.5 157
South Bend, IN-MI 276,498 MB 2,105.1 150 7,942.5 151
Canton, OH 266,595 MB 1,979.4 151 9,916.9 135
Fargo, ND-MN 142,477 MB 1,946.8 152 6,444.6 173
Lakeland, FL 199,487 MB 1,932.8 153 9,706.8 137
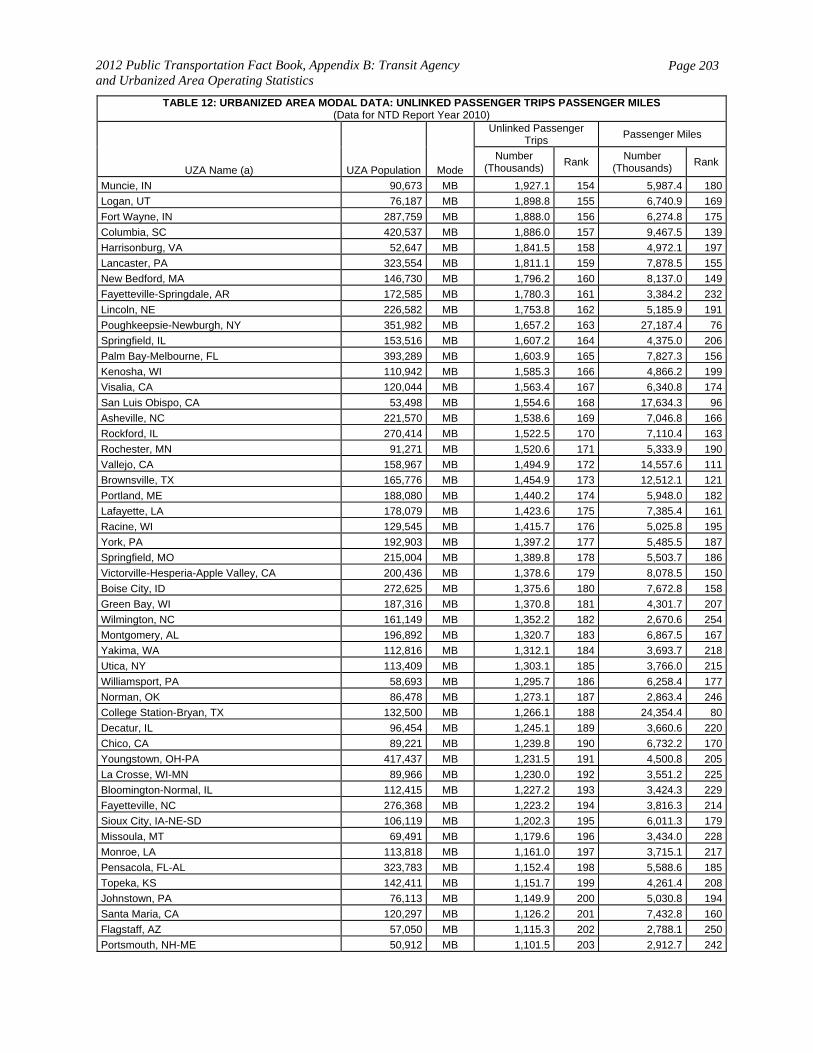
2012 Public Transportation Fact Book, Appendix B: Transit Agency and Urbanized Area Operating Statistics
Page 203
TABLE 12: URBANIZED AREA MODAL DATA: UNLINKED PASSENGER TRIPS PASSENGER MILES (Data for NTD Report Year 2010)
UZA Name (a) UZA Population Mode
Unlinked Passenger Trips
Passenger Miles
Number (Thousands)
Rank Number
(Thousands) Rank
Muncie, IN 90,673 MB 1,927.1 154 5,987.4 180
Logan, UT 76,187 MB 1,898.8 155 6,740.9 169
Fort Wayne, IN 287,759 MB 1,888.0 156 6,274.8 175
Columbia, SC 420,537 MB 1,886.0 157 9,467.5 139
Harrisonburg, VA 52,647 MB 1,841.5 158 4,972.1 197
Lancaster, PA 323,554 MB 1,811.1 159 7,878.5 155
New Bedford, MA 146,730 MB 1,796.2 160 8,137.0 149
Fayetteville-Springdale, AR 172,585 MB 1,780.3 161 3,384.2 232
Lincoln, NE 226,582 MB 1,753.8 162 5,185.9 191
Poughkeepsie-Newburgh, NY 351,982 MB 1,657.2 163 27,187.4 76
Springfield, IL 153,516 MB 1,607.2 164 4,375.0 206
Palm Bay-Melbourne, FL 393,289 MB 1,603.9 165 7,827.3 156
Kenosha, WI 110,942 MB 1,585.3 166 4,866.2 199
Visalia, CA 120,044 MB 1,563.4 167 6,340.8 174
San Luis Obispo, CA 53,498 MB 1,554.6 168 17,634.3 96
Asheville, NC 221,570 MB 1,538.6 169 7,046.8 166
Rockford, IL 270,414 MB 1,522.5 170 7,110.4 163
Rochester, MN 91,271 MB 1,520.6 171 5,333.9 190
Vallejo, CA 158,967 MB 1,494.9 172 14,557.6 111
Brownsville, TX 165,776 MB 1,454.9 173 12,512.1 121
Portland, ME 188,080 MB 1,440.2 174 5,948.0 182
Lafayette, LA 178,079 MB 1,423.6 175 7,385.4 161
Racine, WI 129,545 MB 1,415.7 176 5,025.8 195
York, PA 192,903 MB 1,397.2 177 5,485.5 187
Springfield, MO 215,004 MB 1,389.8 178 5,503.7 186
Victorville-Hesperia-Apple Valley, CA 200,436 MB 1,378.6 179 8,078.5 150
Boise City, ID 272,625 MB 1,375.6 180 7,672.8 158
Green Bay, WI 187,316 MB 1,370.8 181 4,301.7 207
Wilmington, NC 161,149 MB 1,352.2 182 2,670.6 254
Montgomery, AL 196,892 MB 1,320.7 183 6,867.5 167
Yakima, WA 112,816 MB 1,312.1 184 3,693.7 218
Utica, NY 113,409 MB 1,303.1 185 3,766.0 215
Williamsport, PA 58,693 MB 1,295.7 186 6,258.4 177
Norman, OK 86,478 MB 1,273.1 187 2,863.4 246
College Station-Bryan, TX 132,500 MB 1,266.1 188 24,354.4 80
Decatur, IL 96,454 MB 1,245.1 189 3,660.6 220
Chico, CA 89,221 MB 1,239.8 190 6,732.2 170
Youngstown, OH-PA 417,437 MB 1,231.5 191 4,500.8 205
La Crosse, WI-MN 89,966 MB 1,230.0 192 3,551.2 225
Bloomington-Normal, IL 112,415 MB 1,227.2 193 3,424.3 229
Fayetteville, NC 276,368 MB 1,223.2 194 3,816.3 214
Sioux City, IA-NE-SD 106,119 MB 1,202.3 195 6,011.3 179
Missoula, MT 69,491 MB 1,179.6 196 3,434.0 228
Monroe, LA 113,818 MB 1,161.0 197 3,715.1 217
Pensacola, FL-AL 323,783 MB 1,152.4 198 5,588.6 185
Topeka, KS 142,411 MB 1,151.7 199 4,261.4 208
Johnstown, PA 76,113 MB 1,149.9 200 5,030.8 194
Santa Maria, CA 120,297 MB 1,126.2 201 7,432.8 160
Flagstaff, AZ 57,050 MB 1,115.3 202 2,788.1 250
Portsmouth, NH-ME 50,912 MB 1,101.5 203 2,912.7 242
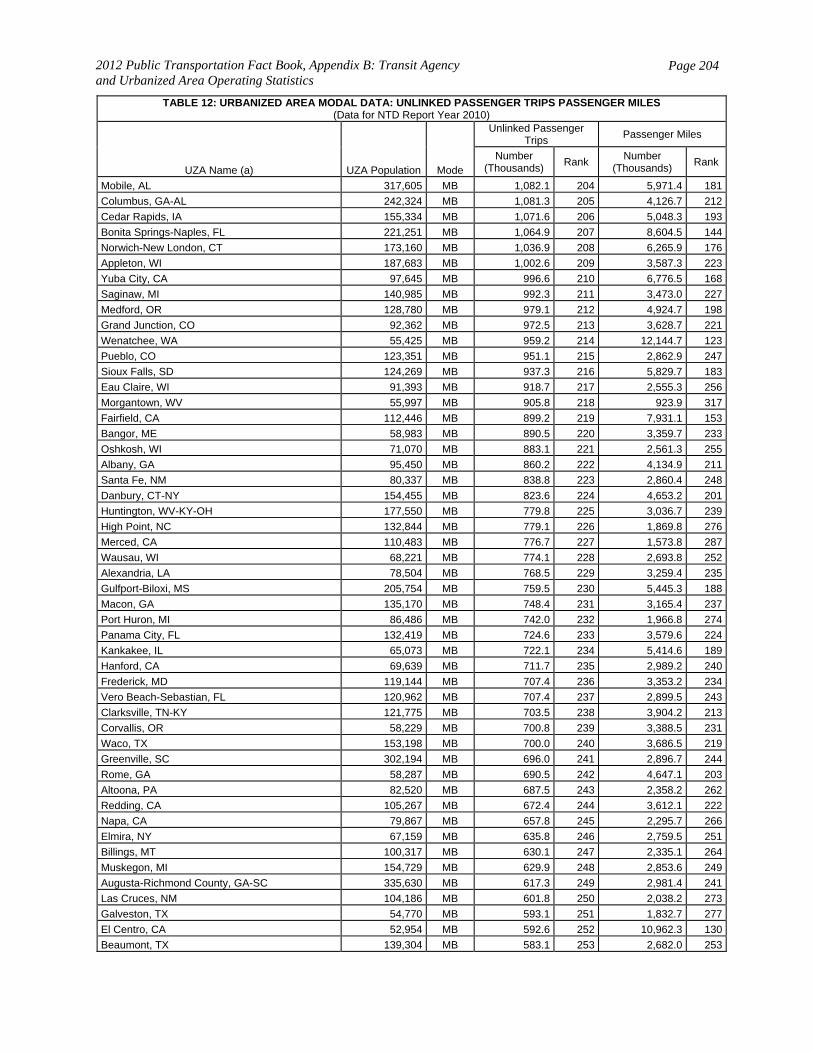
2012 Public Transportation Fact Book, Appendix B: Transit Agency and Urbanized Area Operating Statistics
Page 204
TABLE 12: URBANIZED AREA MODAL DATA: UNLINKED PASSENGER TRIPS PASSENGER MILES (Data for NTD Report Year 2010)
UZA Name (a) UZA Population Mode
Unlinked Passenger Trips
Passenger Miles
Number (Thousands)
Rank Number
(Thousands) Rank
Mobile, AL 317,605 MB 1,082.1 204 5,971.4 181
Columbus, GA-AL 242,324 MB 1,081.3 205 4,126.7 212
Cedar Rapids, IA 155,334 MB 1,071.6 206 5,048.3 193
Bonita Springs-Naples, FL 221,251 MB 1,064.9 207 8,604.5 144
Norwich-New London, CT 173,160 MB 1,036.9 208 6,265.9 176
Appleton, WI 187,683 MB 1,002.6 209 3,587.3 223
Yuba City, CA 97,645 MB 996.6 210 6,776.5 168
Saginaw, MI 140,985 MB 992.3 211 3,473.0 227
Medford, OR 128,780 MB 979.1 212 4,924.7 198
Grand Junction, CO 92,362 MB 972.5 213 3,628.7 221
Wenatchee, WA 55,425 MB 959.2 214 12,144.7 123
Pueblo, CO 123,351 MB 951.1 215 2,862.9 247
Sioux Falls, SD 124,269 MB 937.3 216 5,829.7 183
Eau Claire, WI 91,393 MB 918.7 217 2,555.3 256
Morgantown, WV 55,997 MB 905.8 218 923.9 317
Fairfield, CA 112,446 MB 899.2 219 7,931.1 153
Bangor, ME 58,983 MB 890.5 220 3,359.7 233
Oshkosh, WI 71,070 MB 883.1 221 2,561.3 255
Albany, GA 95,450 MB 860.2 222 4,134.9 211
Santa Fe, NM 80,337 MB 838.8 223 2,860.4 248
Danbury, CT-NY 154,455 MB 823.6 224 4,653.2 201
Huntington, WV-KY-OH 177,550 MB 779.8 225 3,036.7 239
High Point, NC 132,844 MB 779.1 226 1,869.8 276
Merced, CA 110,483 MB 776.7 227 1,573.8 287
Wausau, WI 68,221 MB 774.1 228 2,693.8 252
Alexandria, LA 78,504 MB 768.5 229 3,259.4 235
Gulfport-Biloxi, MS 205,754 MB 759.5 230 5,445.3 188
Macon, GA 135,170 MB 748.4 231 3,165.4 237
Port Huron, MI 86,486 MB 742.0 232 1,966.8 274
Panama City, FL 132,419 MB 724.6 233 3,579.6 224
Kankakee, IL 65,073 MB 722.1 234 5,414.6 189
Hanford, CA 69,639 MB 711.7 235 2,989.2 240
Frederick, MD 119,144 MB 707.4 236 3,353.2 234
Vero Beach-Sebastian, FL 120,962 MB 707.4 237 2,899.5 243
Clarksville, TN-KY 121,775 MB 703.5 238 3,904.2 213
Corvallis, OR 58,229 MB 700.8 239 3,388.5 231
Waco, TX 153,198 MB 700.0 240 3,686.5 219
Greenville, SC 302,194 MB 696.0 241 2,896.7 244
Rome, GA 58,287 MB 690.5 242 4,647.1 203
Altoona, PA 82,520 MB 687.5 243 2,358.2 262
Redding, CA 105,267 MB 672.4 244 3,612.1 222
Napa, CA 79,867 MB 657.8 245 2,295.7 266
Elmira, NY 67,159 MB 635.8 246 2,759.5 251
Billings, MT 100,317 MB 630.1 247 2,335.1 264
Muskegon, MI 154,729 MB 629.9 248 2,853.6 249
Augusta-Richmond County, GA-SC 335,630 MB 617.3 249 2,981.4 241
Las Cruces, NM 104,186 MB 601.8 250 2,038.2 273
Galveston, TX 54,770 MB 593.1 251 1,832.7 277
El Centro, CA 52,954 MB 592.6 252 10,962.3 130
Beaumont, TX 139,304 MB 583.1 253 2,682.0 253
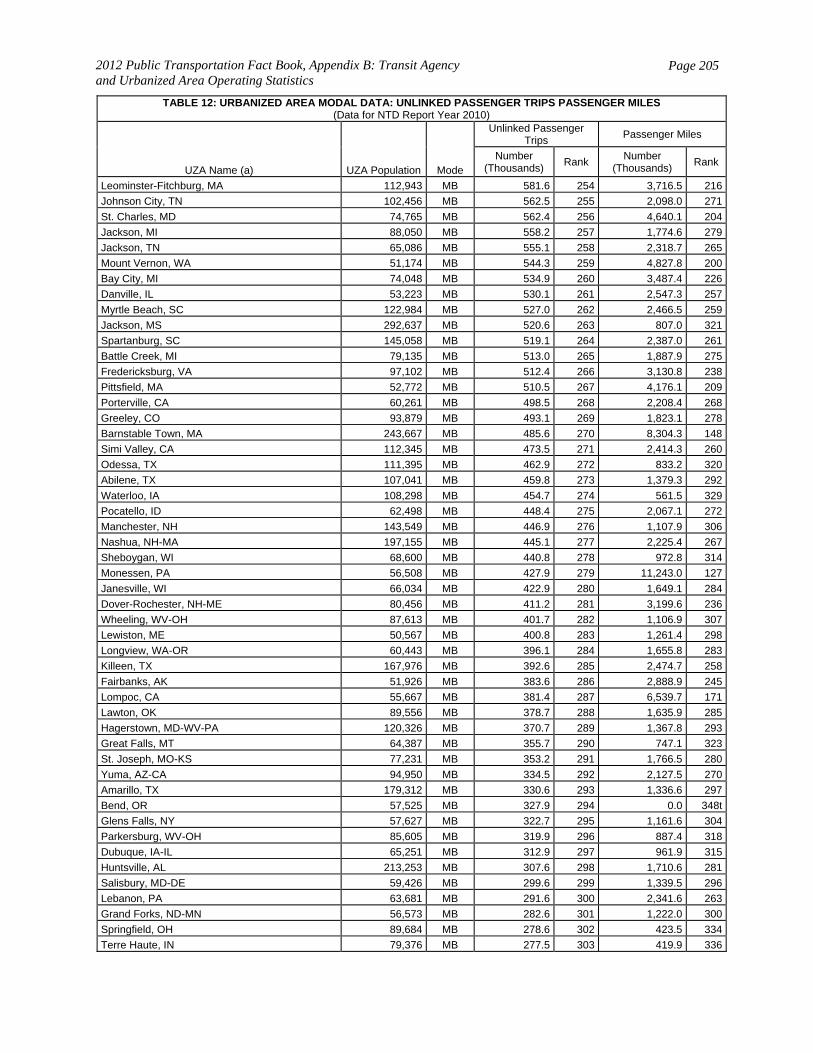
2012 Public Transportation Fact Book, Appendix B: Transit Agency and Urbanized Area Operating Statistics
Page 205
TABLE 12: URBANIZED AREA MODAL DATA: UNLINKED PASSENGER TRIPS PASSENGER MILES (Data for NTD Report Year 2010)
UZA Name (a) UZA Population Mode
Unlinked Passenger Trips
Passenger Miles
Number (Thousands)
Rank Number
(Thousands) Rank
Leominster-Fitchburg, MA 112,943 MB 581.6 254 3,716.5 216
Johnson City, TN 102,456 MB 562.5 255 2,098.0 271
St. Charles, MD 74,765 MB 562.4 256 4,640.1 204
Jackson, MI 88,050 MB 558.2 257 1,774.6 279
Jackson, TN 65,086 MB 555.1 258 2,318.7 265
Mount Vernon, WA 51,174 MB 544.3 259 4,827.8 200
Bay City, MI 74,048 MB 534.9 260 3,487.4 226
Danville, IL 53,223 MB 530.1 261 2,547.3 257
Myrtle Beach, SC 122,984 MB 527.0 262 2,466.5 259
Jackson, MS 292,637 MB 520.6 263 807.0 321
Spartanburg, SC 145,058 MB 519.1 264 2,387.0 261
Battle Creek, MI 79,135 MB 513.0 265 1,887.9 275
Fredericksburg, VA 97,102 MB 512.4 266 3,130.8 238
Pittsfield, MA 52,772 MB 510.5 267 4,176.1 209
Porterville, CA 60,261 MB 498.5 268 2,208.4 268
Greeley, CO 93,879 MB 493.1 269 1,823.1 278
Barnstable Town, MA 243,667 MB 485.6 270 8,304.3 148
Simi Valley, CA 112,345 MB 473.5 271 2,414.3 260
Odessa, TX 111,395 MB 462.9 272 833.2 320
Abilene, TX 107,041 MB 459.8 273 1,379.3 292
Waterloo, IA 108,298 MB 454.7 274 561.5 329
Pocatello, ID 62,498 MB 448.4 275 2,067.1 272
Manchester, NH 143,549 MB 446.9 276 1,107.9 306
Nashua, NH-MA 197,155 MB 445.1 277 2,225.4 267
Sheboygan, WI 68,600 MB 440.8 278 972.8 314
Monessen, PA 56,508 MB 427.9 279 11,243.0 127
Janesville, WI 66,034 MB 422.9 280 1,649.1 284
Dover-Rochester, NH-ME 80,456 MB 411.2 281 3,199.6 236
Wheeling, WV-OH 87,613 MB 401.7 282 1,106.9 307
Lewiston, ME 50,567 MB 400.8 283 1,261.4 298
Longview, WA-OR 60,443 MB 396.1 284 1,655.8 283
Killeen, TX 167,976 MB 392.6 285 2,474.7 258
Fairbanks, AK 51,926 MB 383.6 286 2,888.9 245
Lompoc, CA 55,667 MB 381.4 287 6,539.7 171
Lawton, OK 89,556 MB 378.7 288 1,635.9 285
Hagerstown, MD-WV-PA 120,326 MB 370.7 289 1,367.8 293
Great Falls, MT 64,387 MB 355.7 290 747.1 323
St. Joseph, MO-KS 77,231 MB 353.2 291 1,766.5 280
Yuma, AZ-CA 94,950 MB 334.5 292 2,127.5 270
Amarillo, TX 179,312 MB 330.6 293 1,336.6 297
Bend, OR 57,525 MB 327.9 294 0.0 348t
Glens Falls, NY 57,627 MB 322.7 295 1,161.6 304
Parkersburg, WV-OH 85,605 MB 319.9 296 887.4 318
Dubuque, IA-IL 65,251 MB 312.9 297 961.9 315
Huntsville, AL 213,253 MB 307.6 298 1,710.6 281
Salisbury, MD-DE 59,426 MB 299.6 299 1,339.5 296
Lebanon, PA 63,681 MB 291.6 300 2,341.6 263
Grand Forks, ND-MN 56,573 MB 282.6 301 1,222.0 300
Springfield, OH 89,684 MB 278.6 302 423.5 334
Terre Haute, IN 79,376 MB 277.5 303 419.9 336

2012 Public Transportation Fact Book, Appendix B: Transit Agency and Urbanized Area Operating Statistics
Page 206
TABLE 12: URBANIZED AREA MODAL DATA: UNLINKED PASSENGER TRIPS PASSENGER MILES (Data for NTD Report Year 2010)
UZA Name (a) UZA Population Mode
Unlinked Passenger Trips
Passenger Miles
Number (Thousands)
Rank Number
(Thousands) Rank
Jefferson City, MO 53,714 MB 274.4 304 634.5 326
Beloit, WI-IL 56,462 MB 269.1 305 1,064.9 309
Rapid City, SD 66,780 MB 264.4 306 993.3 312
Aberdeen-Havre de Grace-Bel Air, MD 174,598 MB 261.0 307 2,165.0 269
Cheyenne, WY 68,202 MB 253.7 308 1,082.7 308
Holland, MI 91,921 MB 242.2 309 1,011.2 311
Mansfield, OH 79,698 MB 240.8 310 708.4 324
Victoria, TX 61,529 MB 234.0 311 447.0 331
Leesburg-Eustis, FL 97,497 MB 232.8 312 1,198.9 302
Danville, VA 50,902 MB 225.4 313 1,143.4 305
Tuscaloosa, AL 116,888 MB 224.1 314 1,226.8 299
Elkhart, IN-MI 131,226 MB 223.4 315 1,676.2 282
Fort Smith, AR-OK 106,470 MB 214.0 316 941.7 316
San Angelo, TX 87,969 MB 212.1 317 402.8 337
Middletown, OH 94,355 MB 202.8 318 1,013.9 310
Lodi, CA 83,735 MB 189.1 319 563.4 328
St. Augustine, FL 53,519 MB 185.9 320 1,362.4 294
Thousand Oaks, CA 210,990 MB 184.9 321 1,179.3 303
Murfreesboro, TN 135,855 MB 180.0 322 286.0 339
Port St. Lucie, FL 270,774 MB 177.9 323 1,415.8 289
Fort Walton Beach, FL 152,741 MB 162.8 324 796.2 322
Petaluma, CA 59,958 MB 161.3 325 570.1 327
Sumter, SC 64,320 MB 152.5 326 1,631.9 286
Cumberland, MD--WV 52,115 MB 151.7 327 1,380.3 291
Anderson, IN 97,038 MB 149.6 328 658.1 325
Hickory, NC 187,808 MB 147.1 329 1,360.2 295
Fond du Lac, WI 50,058 MB 138.7 330 171.3 341
Bismarck, ND 74,991 MB 127.8 331 523.9 330
Casper, WY 57,719 MB 125.5 332 430.4 333
Gainesville, GA 88,680 MB 119.7 333 0.0 348t
Uniontown-Connellsville, PA 58,442 MB 117.0 334 1,385.2 290
Port Arthur, TX 114,656 MB 115.0 335 977.7 313
Florence, SC 67,314 MB 107.7 336 3,402.4 230
Turlock, CA 69,507 MB 99.9 337 368.0 338
Lorain-Elyria, OH 193,586 MB 98.9 338 69.4 345
McAllen, TX 523,144 MB 88.5 339 1,201.3 301
Bowling Green, KY 58,314 MB 80.1 340 138.2 343
Idaho Falls, ID 66,973 MB 78.4 341 873.6 319
Brooksville, FL 102,193 MB 69.9 342 440.1 332
Sherman, TX 56,168 MB 65.8 343 1,517.6 288
Texas City, TX 96,417 MB 61.5 344 421.0 335
Cleveland, TN 58,192 MB 60.0 345 152.8 342
Kokomo, IN 63,739 MB 37.4 346 23.9 347
McKinney, TX 54,525 MB 28.8 347 204.8 340
Benton Harbor-St. Joseph, MI 61,745 MB 23.2 348 118.7 344
Westminster, MD 65,034 MB 11.6 349 65.1 346
Virgin Islands, VI 1 108,612 MB 0.0 350 0.0 348tMonorail
Seattle, WA 2,712,205 MO 1,789.1 1 1,610.2 1
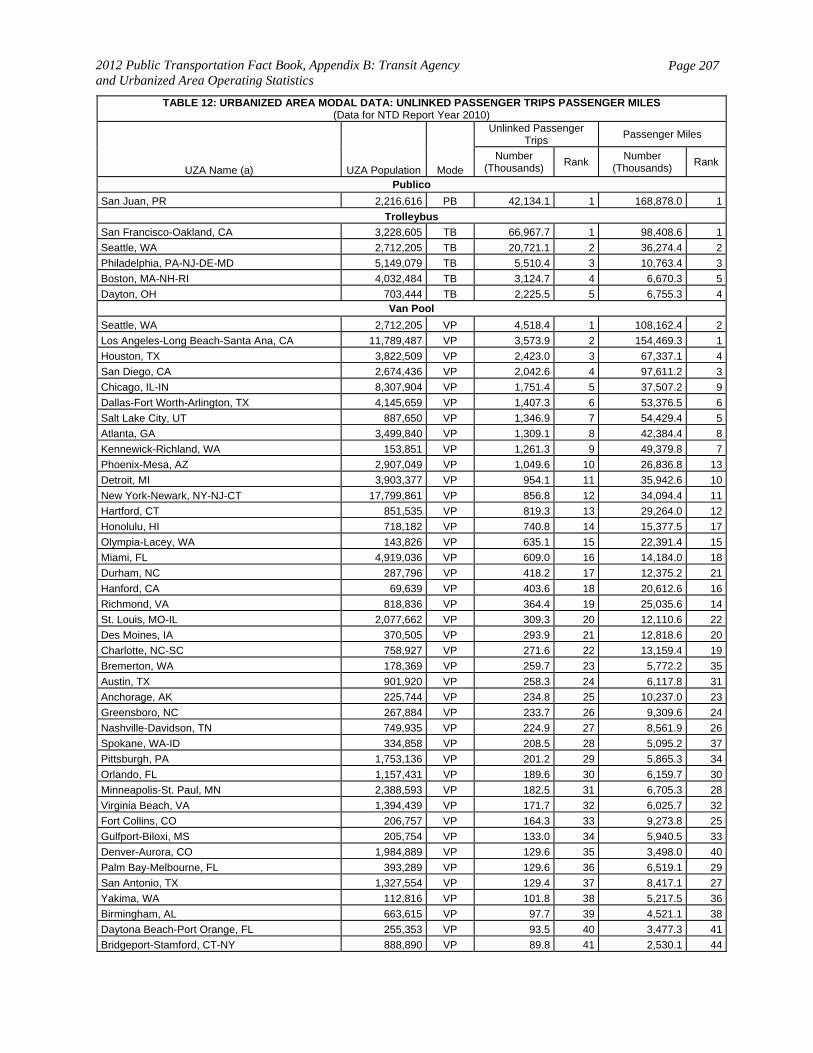
2012 Public Transportation Fact Book, Appendix B: Transit Agency and Urbanized Area Operating Statistics
Page 207
TABLE 12: URBANIZED AREA MODAL DATA: UNLINKED PASSENGER TRIPS PASSENGER MILES (Data for NTD Report Year 2010)
UZA Name (a) UZA Population Mode
Unlinked Passenger Trips
Passenger Miles
Number (Thousands)
Rank Number
(Thousands) Rank
Publico
San Juan, PR 2,216,616 PB 42,134.1 1 168,878.0 1
Trolleybus
San Francisco-Oakland, CA 3,228,605 TB 66,967.7 1 98,408.6 1
Seattle, WA 2,712,205 TB 20,721.1 2 36,274.4 2
Philadelphia, PA-NJ-DE-MD 5,149,079 TB 5,510.4 3 10,763.4 3
Boston, MA-NH-RI 4,032,484 TB 3,124.7 4 6,670.3 5
Dayton, OH 703,444 TB 2,225.5 5 6,755.3 4Van Pool
Seattle, WA 2,712,205 VP 4,518.4 1 108,162.4 2
Los Angeles-Long Beach-Santa Ana, CA 11,789,487 VP 3,573.9 2 154,469.3 1
Houston, TX 3,822,509 VP 2,423.0 3 67,337.1 4
San Diego, CA 2,674,436 VP 2,042.6 4 97,611.2 3
Chicago, IL-IN 8,307,904 VP 1,751.4 5 37,507.2 9
Dallas-Fort Worth-Arlington, TX 4,145,659 VP 1,407.3 6 53,376.5 6
Salt Lake City, UT 887,650 VP 1,346.9 7 54,429.4 5
Atlanta, GA 3,499,840 VP 1,309.1 8 42,384.4 8
Kennewick-Richland, WA 153,851 VP 1,261.3 9 49,379.8 7
Phoenix-Mesa, AZ 2,907,049 VP 1,049.6 10 26,836.8 13
Detroit, MI 3,903,377 VP 954.1 11 35,942.6 10
New York-Newark, NY-NJ-CT 17,799,861 VP 856.8 12 34,094.4 11
Hartford, CT 851,535 VP 819.3 13 29,264.0 12
Honolulu, HI 718,182 VP 740.8 14 15,377.5 17
Olympia-Lacey, WA 143,826 VP 635.1 15 22,391.4 15
Miami, FL 4,919,036 VP 609.0 16 14,184.0 18
Durham, NC 287,796 VP 418.2 17 12,375.2 21
Hanford, CA 69,639 VP 403.6 18 20,612.6 16
Richmond, VA 818,836 VP 364.4 19 25,035.6 14
St. Louis, MO-IL 2,077,662 VP 309.3 20 12,110.6 22
Des Moines, IA 370,505 VP 293.9 21 12,818.6 20
Charlotte, NC-SC 758,927 VP 271.6 22 13,159.4 19
Bremerton, WA 178,369 VP 259.7 23 5,772.2 35
Austin, TX 901,920 VP 258.3 24 6,117.8 31
Anchorage, AK 225,744 VP 234.8 25 10,237.0 23
Greensboro, NC 267,884 VP 233.7 26 9,309.6 24
Nashville-Davidson, TN 749,935 VP 224.9 27 8,561.9 26
Spokane, WA-ID 334,858 VP 208.5 28 5,095.2 37
Pittsburgh, PA 1,753,136 VP 201.2 29 5,865.3 34
Orlando, FL 1,157,431 VP 189.6 30 6,159.7 30
Minneapolis-St. Paul, MN 2,388,593 VP 182.5 31 6,705.3 28
Virginia Beach, VA 1,394,439 VP 171.7 32 6,025.7 32
Fort Collins, CO 206,757 VP 164.3 33 9,273.8 25
Gulfport-Biloxi, MS 205,754 VP 133.0 34 5,940.5 33
Denver-Aurora, CO 1,984,889 VP 129.6 35 3,498.0 40
Palm Bay-Melbourne, FL 393,289 VP 129.6 36 6,519.1 29
San Antonio, TX 1,327,554 VP 129.4 37 8,417.1 27
Yakima, WA 112,816 VP 101.8 38 5,217.5 36
Birmingham, AL 663,615 VP 97.7 39 4,521.1 38
Daytona Beach-Port Orange, FL 255,353 VP 93.5 40 3,477.3 41
Bridgeport-Stamford, CT-NY 888,890 VP 89.8 41 2,530.1 44
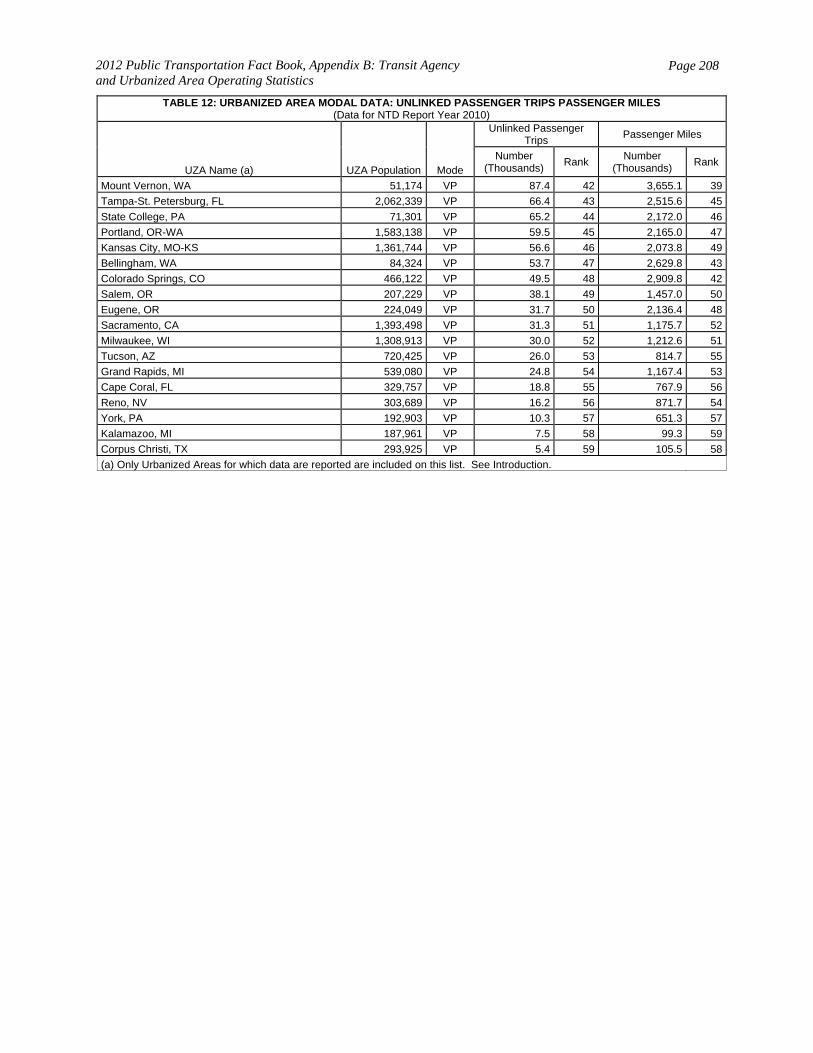
2012 Public Transportation Fact Book, Appendix B: Transit Agency and Urbanized Area Operating Statistics
Page 208
TABLE 12: URBANIZED AREA MODAL DATA: UNLINKED PASSENGER TRIPS PASSENGER MILES (Data for NTD Report Year 2010)
UZA Name (a) UZA Population Mode
Unlinked Passenger Trips
Passenger Miles
Number (Thousands)
Rank Number
(Thousands) Rank
Mount Vernon, WA 51,174 VP 87.4 42 3,655.1 39
Tampa-St. Petersburg, FL 2,062,339 VP 66.4 43 2,515.6 45
State College, PA 71,301 VP 65.2 44 2,172.0 46
Portland, OR-WA 1,583,138 VP 59.5 45 2,165.0 47
Kansas City, MO-KS 1,361,744 VP 56.6 46 2,073.8 49
Bellingham, WA 84,324 VP 53.7 47 2,629.8 43
Colorado Springs, CO 466,122 VP 49.5 48 2,909.8 42
Salem, OR 207,229 VP 38.1 49 1,457.0 50
Eugene, OR 224,049 VP 31.7 50 2,136.4 48
Sacramento, CA 1,393,498 VP 31.3 51 1,175.7 52
Milwaukee, WI 1,308,913 VP 30.0 52 1,212.6 51
Tucson, AZ 720,425 VP 26.0 53 814.7 55
Grand Rapids, MI 539,080 VP 24.8 54 1,167.4 53
Cape Coral, FL 329,757 VP 18.8 55 767.9 56
Reno, NV 303,689 VP 16.2 56 871.7 54
York, PA 192,903 VP 10.3 57 651.3 57
Kalamazoo, MI 187,961 VP 7.5 58 99.3 59
Corpus Christi, TX 293,925 VP 5.4 59 105.5 58
(a) Only Urbanized Areas for which data are reported are included on this list. See Introduction.

2012 Public Transportation Fact Book, Appendix B: Transit Agency and Urbanized Area Operating Statistics
Page 209
TABLE 13: AGENCY TOTAL ALL MODES COMBINED: INDEX [In Alphabetical Order of State Mail Code followed by Agency Name]
(Data for NTD Report Year 2010)
Name City State Mode
Rank
Vehicles Operated Maximum Service
Vehicles Available
for Maximum Service
Annual Vehicle Reve-nue
Miles
Annual Vehicle Reve-nue
Hours
Un-linked Pas-
senger Trips
Pas-senger Miles
Alaska Railroad Corporation(ARRC) Anchorage AK Total 341t 198t 599 606 568 457 Fairbanks North Star Borough Transit(MACS) Fairbanks AK Total 520t 543t 481 502 451 412 Municipality of Anchorage - Public Transportation Department(People Mover) Anchorage AK Total 181t 192t 175 154 147 178 VPSI, Anchorage Anchorage AK Total 249t 228t 301 521 509 248 Lee-Russell Council of Governments(LRCOG) Opelika AL Total 508t 484t 555 561 591 588 Birmingham-Jefferson County Transit Authority(MAX) Birmingham AL Total 167t 174t 159 132 213 217 City of Huntsville, Alabama - Public Transportation Division Huntsville AL Total 393t 383t 365 362 456 448 City of Montgomery-Montgomery Area Transit System(MATS) Montgomery AL Total 363t 358t 276 288 290 297 Morgan County Area Transportation System(MCATS) Decatur AL Total 383t 435t 494 483 521 577 Northwest Alabama Council of Local Governments(NACOLG)
Muscle Shoals AL Total 287t 326t 503 460 465 523
Regional Planning Commission of Greater Birmingham(RPCGB) Birmingham AL Total 356t 393t 450 583 575 358 The Wave Transit System(WTS) Mobile AL Total 287t 283t 242 201 309 300 Tuscaloosa County Parking and Transit Authority(TMT) Tuscaloosa AL Total 540t 551t 554 531 506 501 Wiregrass Transit Authority Dothan AL Total 265t 303t 300 308 528 496
Central Arkansas Transit Authority(CATA) North Little Rock AR Total 204t 220 183 167 214 218
Fort Smith Transit(FST) Fort Smith AR Total 559t 511t 518 499 504 521 Ozark Regional Transit(ORT) Springdale AR Total 447t 350t 464 474 508 539 University of Arkansas, Fayetteville(Razorback Transit) Fayetteville AR Total 481t 464t 552 497 268 438 City of Glendale Transit Glendale AZ Total 470t 426t 501 466 516 553 City of Phoenix Public Transit Department dba Valley Metro(Valley Metro) Phoenix AZ Total 36 34 38 28 37 50 City of Scottsdale - Scottsdale Trolley(COS) Scottsdale AZ Total 548t 558t 527 329 387 514 City of Tempe Transit Division - dba Valley Metro(TIM - Tempe in Motion) Tempe AZ Total 133t 129t 102 85 104 138 City of Tucson(COT) Tucson AZ Total 70 77 69 59 55 73 Northern Arizona Intergovernmental Public Transportation Authority(NAIPTA) Flagstaff AZ Total 470t 478t 433 414 317 420 Peoria Transit Peoria AZ Total 581t 589t 592 586 602 598 Phoenix - VPSI, Inc. Glendale AZ Total 62t 65t 118 235 324 152 Pima Association of Governments(PAG) Tuscon AZ Total 540t 562t 593 609 605 547 Regional Public Transportation Authority, dba: Valley Metro(RPTA) Phoenix AZ Total 102 93t 84 83 112 105 Surprise Dial-A-Ride Transit System Surprise AZ Total 581t 595t 601 597 606 605 Valley Metro Rail, Inc.(VMR) Phoenix AZ Total 368t 341t 196 182 80 69 Yuma Metropolitan Planning Organization(YMPO) Yuma AZ Total 470t 435t 331 389 466 440 City of Los Angeles Department of Transportation(LADOT) Los Angeles CA Total 51 51 70 49 44 80 Alameda-Contra Costa Transit District(AC Transit) Oakland CA Total 29 29 27 21 26 40 Access Services (AS) El Monte CA Total 37 41 29 38 206 129 Altamont Commuter Express(ACE) Stockton CA Total 447t 484t 443 566 386 145 Anaheim Transportation Network(ATN) Anaheim CA Total 277t 263t 408 262 151 274 Antelope Valley Transit Authority(AVTA) Lancaster CA Total 217t 215t 178 185 201 125 Butte County Association of Governments(BCAG) Chico CA Total 304t 312t 293 277 291 295 Central Contra Costa Transit Authority(County Connection) Concord CA Total 128 116 149 123 177 187 Chula Vista Transit(CVT) Chula Vista CA Total 368t 393t 345 270 178 228 City of Alameda Ferry Services Alameda CA Total 606t 595t 603 603 408 375 City of Arcadia Transit(Arcadia Transit) Arcadia CA Total 498t 537t 576 540 563 580 City of Commerce Municipal Buslines(CBL) Commerce CA Total 568t 569t 557 541 384 450 City of Corona(CCTS) Corona CA Total 520t 558t 522 505 510 533 City of Elk Grove(etran) Elk Grove CA Total 265t 312t 357 374 339 316
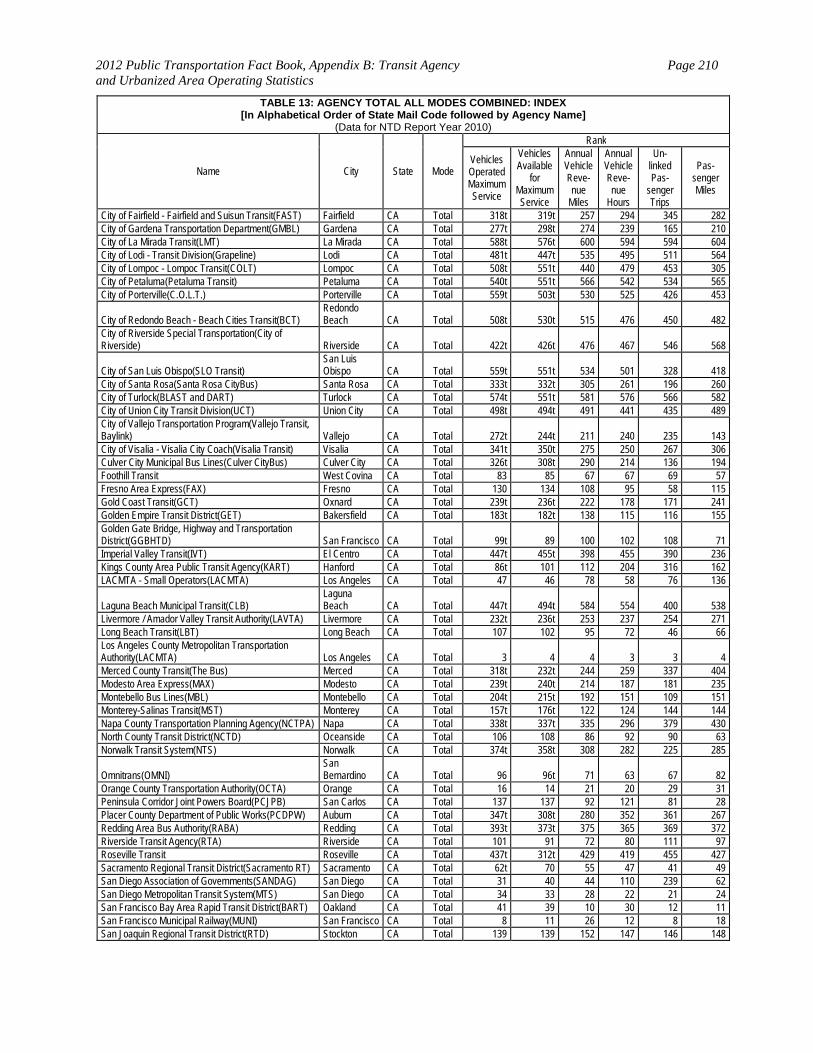
2012 Public Transportation Fact Book, Appendix B: Transit Agency and Urbanized Area Operating Statistics
Page 210
TABLE 13: AGENCY TOTAL ALL MODES COMBINED: INDEX [In Alphabetical Order of State Mail Code followed by Agency Name]
(Data for NTD Report Year 2010)
Name City State Mode
Rank
Vehicles Operated Maximum Service
Vehicles Available
for Maximum Service
Annual Vehicle Reve-nue
Miles
Annual Vehicle Reve-nue
Hours
Un-linked Pas-
senger Trips
Pas-senger Miles
City of Fairfield - Fairfield and Suisun Transit(FAST) Fairfield CA Total 318t 319t 257 294 345 282 City of Gardena Transportation Department(GMBL) Gardena CA Total 277t 298t 274 239 165 210 City of La Mirada Transit(LMT) La Mirada CA Total 588t 576t 600 594 594 604 City of Lodi - Transit Division(Grapeline) Lodi CA Total 481t 447t 535 495 511 564 City of Lompoc - Lompoc Transit(COLT) Lompoc CA Total 508t 551t 440 479 453 305 City of Petaluma(Petaluma Transit) Petaluma CA Total 540t 551t 566 542 534 565 City of Porterville(C.O.L.T.) Porterville CA Total 559t 503t 530 525 426 453
City of Redondo Beach - Beach Cities Transit(BCT) Redondo Beach CA Total 508t 530t 515 476 450 482
City of Riverside Special Transportation(City of Riverside) Riverside CA Total 422t 426t 476 467 546 568
City of San Luis Obispo(SLO Transit) San Luis Obispo CA Total 559t 551t 534 501 328 418
City of Santa Rosa(Santa Rosa CityBus) Santa Rosa CA Total 333t 332t 305 261 196 260 City of Turlock(BLAST and DART) Turlock CA Total 574t 551t 581 576 566 582 City of Union City Transit Division(UCT) Union City CA Total 498t 494t 491 441 435 489 City of Vallejo Transportation Program(Vallejo Transit, Baylink) Vallejo CA Total 272t 244t 211 240 235 143 City of Visalia - Visalia City Coach(Visalia Transit) Visalia CA Total 341t 350t 275 250 267 306 Culver City Municipal Bus Lines(Culver CityBus) Culver City CA Total 326t 308t 290 214 136 194 Foothill Transit West Covina CA Total 83 85 67 67 69 57 Fresno Area Express(FAX) Fresno CA Total 130 134 108 95 58 115 Gold Coast Transit(GCT) Oxnard CA Total 239t 236t 222 178 171 241 Golden Empire Transit District(GET) Bakersfield CA Total 183t 182t 138 115 116 155 Golden Gate Bridge, Highway and Transportation District(GGBHTD) San Francisco CA Total 99t 89 100 102 108 71 Imperial Valley Transit(IVT) El Centro CA Total 447t 455t 398 455 390 236 Kings County Area Public Transit Agency(KART) Hanford CA Total 86t 101 112 204 316 162 LACMTA - Small Operators(LACMTA) Los Angeles CA Total 47 46 78 58 76 136
Laguna Beach Municipal Transit(CLB) Laguna Beach CA Total 447t 494t 584 554 400 538
Livermore / Amador Valley Transit Authority(LAVTA) Livermore CA Total 232t 236t 253 237 254 271 Long Beach Transit(LBT) Long Beach CA Total 107 102 95 72 46 66 Los Angeles County Metropolitan Transportation Authority(LACMTA) Los Angeles CA Total 3 4 4 3 3 4 Merced County Transit(The Bus) Merced CA Total 318t 232t 244 259 337 404 Modesto Area Express(MAX) Modesto CA Total 239t 240t 214 187 181 235 Montebello Bus Lines(MBL) Montebello CA Total 204t 215t 192 151 109 151 Monterey-Salinas Transit(MST) Monterey CA Total 157t 176t 122 124 144 144 Napa County Transportation Planning Agency(NCTPA) Napa CA Total 338t 337t 335 296 379 430 North County Transit District(NCTD) Oceanside CA Total 106 108 86 92 90 63 Norwalk Transit System(NTS) Norwalk CA Total 374t 358t 308 282 225 285
Omnitrans(OMNI) San Bernardino CA Total 96 96t 71 63 67 82
Orange County Transportation Authority(OCTA) Orange CA Total 16 14 21 20 29 31 Peninsula Corridor Joint Powers Board(PCJPB) San Carlos CA Total 137 137 92 121 81 28 Placer County Department of Public Works(PCDPW) Auburn CA Total 347t 308t 280 352 361 267 Redding Area Bus Authority(RABA) Redding CA Total 393t 373t 375 365 369 372 Riverside Transit Agency(RTA) Riverside CA Total 101 91 72 80 111 97 Roseville Transit Roseville CA Total 437t 312t 429 419 455 427 Sacramento Regional Transit District(Sacramento RT) Sacramento CA Total 62t 70 55 47 41 49 San Diego Association of Governments(SANDAG) San Diego CA Total 31 40 44 110 239 62 San Diego Metropolitan Transit System(MTS) San Diego CA Total 34 33 28 22 21 24 San Francisco Bay Area Rapid Transit District(BART) Oakland CA Total 41 39 10 30 12 11 San Francisco Municipal Railway(MUNI) San Francisco CA Total 8 11 26 12 8 18 San Joaquin Regional Transit District(RTD) Stockton CA Total 139 139 152 147 146 148
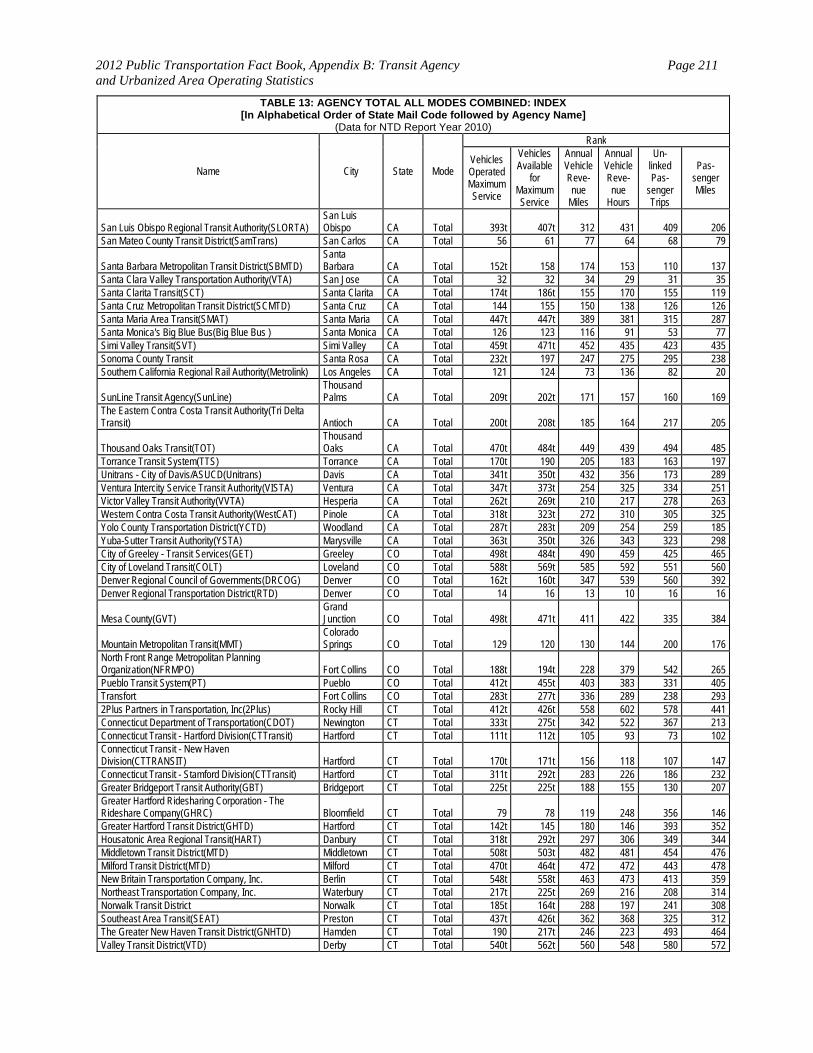
2012 Public Transportation Fact Book, Appendix B: Transit Agency and Urbanized Area Operating Statistics
Page 211
TABLE 13: AGENCY TOTAL ALL MODES COMBINED: INDEX [In Alphabetical Order of State Mail Code followed by Agency Name]
(Data for NTD Report Year 2010)
Name City State Mode
Rank
Vehicles Operated Maximum Service
Vehicles Available
for Maximum Service
Annual Vehicle Reve-nue
Miles
Annual Vehicle Reve-nue
Hours
Un-linked Pas-
senger Trips
Pas-senger Miles
San Luis Obispo Regional Transit Authority(SLORTA) San Luis Obispo CA Total 393t 407t 312 431 409 206
San Mateo County Transit District(SamTrans) San Carlos CA Total 56 61 77 64 68 79
Santa Barbara Metropolitan Transit District(SBMTD) Santa Barbara CA Total 152t 158 174 153 110 137
Santa Clara Valley Transportation Authority(VTA) San Jose CA Total 32 32 34 29 31 35 Santa Clarita Transit(SCT) Santa Clarita CA Total 174t 186t 155 170 155 119 Santa Cruz Metropolitan Transit District(SCMTD) Santa Cruz CA Total 144 155 150 138 126 126 Santa Maria Area Transit(SMAT) Santa Maria CA Total 447t 447t 389 381 315 287 Santa Monica's Big Blue Bus(Big Blue Bus ) Santa Monica CA Total 126 123 116 91 53 77 Simi Valley Transit(SVT) Simi Valley CA Total 459t 471t 452 435 423 435 Sonoma County Transit Santa Rosa CA Total 232t 197 247 275 295 238 Southern California Regional Rail Authority(Metrolink) Los Angeles CA Total 121 124 73 136 82 20
SunLine Transit Agency(SunLine) Thousand Palms CA Total 209t 202t 171 157 160 169
The Eastern Contra Costa Transit Authority(Tri Delta Transit) Antioch CA Total 200t 208t 185 164 217 205
Thousand Oaks Transit(TOT) Thousand Oaks CA Total 470t 484t 449 439 494 485
Torrance Transit System(TTS) Torrance CA Total 170t 190 205 183 163 197 Unitrans - City of Davis/ASUCD(Unitrans) Davis CA Total 341t 350t 432 356 173 289 Ventura Intercity Service Transit Authority(VISTA) Ventura CA Total 347t 373t 254 325 334 251 Victor Valley Transit Authority(VVTA) Hesperia CA Total 262t 269t 210 217 278 263 Western Contra Costa Transit Authority(WestCAT) Pinole CA Total 318t 323t 272 310 305 325 Yolo County Transportation District(YCTD) Woodland CA Total 287t 283t 209 254 259 185 Yuba-Sutter Transit Authority(YSTA) Marysville CA Total 363t 350t 326 343 323 298 City of Greeley - Transit Services(GET) Greeley CO Total 498t 484t 490 459 425 465 City of Loveland Transit(COLT) Loveland CO Total 588t 569t 585 592 551 560 Denver Regional Council of Governments(DRCOG) Denver CO Total 162t 160t 347 539 560 392 Denver Regional Transportation District(RTD) Denver CO Total 14 16 13 10 16 16
Mesa County(GVT) Grand Junction CO Total 498t 471t 411 422 335 384
Mountain Metropolitan Transit(MMT) Colorado Springs CO Total 129 120 130 144 200 176
North Front Range Metropolitan Planning Organization(NFRMPO) Fort Collins CO Total 188t 194t 228 379 542 265 Pueblo Transit System(PT) Pueblo CO Total 412t 455t 403 383 331 405 Transfort Fort Collins CO Total 283t 277t 336 289 238 293 2Plus Partners in Transportation, Inc(2Plus) Rocky Hill CT Total 412t 426t 558 602 578 441 Connecticut Department of Transportation(CDOT) Newington CT Total 333t 275t 342 522 367 213 Connecticut Transit - Hartford Division(CTTransit) Hartford CT Total 111t 112t 105 93 73 102 Connecticut Transit - New Haven Division(CTTRANSIT) Hartford CT Total 170t 171t 156 118 107 147 Connecticut Transit - Stamford Division(CTTransit) Hartford CT Total 311t 292t 283 226 186 232 Greater Bridgeport Transit Authority(GBT) Bridgeport CT Total 225t 225t 188 155 130 207 Greater Hartford Ridesharing Corporation - The Rideshare Company(GHRC) Bloomfield CT Total 79 78 119 248 356 146 Greater Hartford Transit District(GHTD) Hartford CT Total 142t 145 180 146 393 352 Housatonic Area Regional Transit(HART) Danbury CT Total 318t 292t 297 306 349 344 Middletown Transit District(MTD) Middletown CT Total 508t 503t 482 481 454 476 Milford Transit District(MTD) Milford CT Total 470t 464t 472 472 443 478 New Britain Transportation Company, Inc. Berlin CT Total 548t 558t 463 473 413 359 Northeast Transportation Company, Inc. Waterbury CT Total 217t 225t 269 216 208 314 Norwalk Transit District Norwalk CT Total 185t 164t 288 197 241 308 Southeast Area Transit(SEAT) Preston CT Total 437t 426t 362 368 325 312 The Greater New Haven Transit District(GNHTD) Hamden CT Total 190 217t 246 223 493 464 Valley Transit District(VTD) Derby CT Total 540t 562t 560 548 580 572
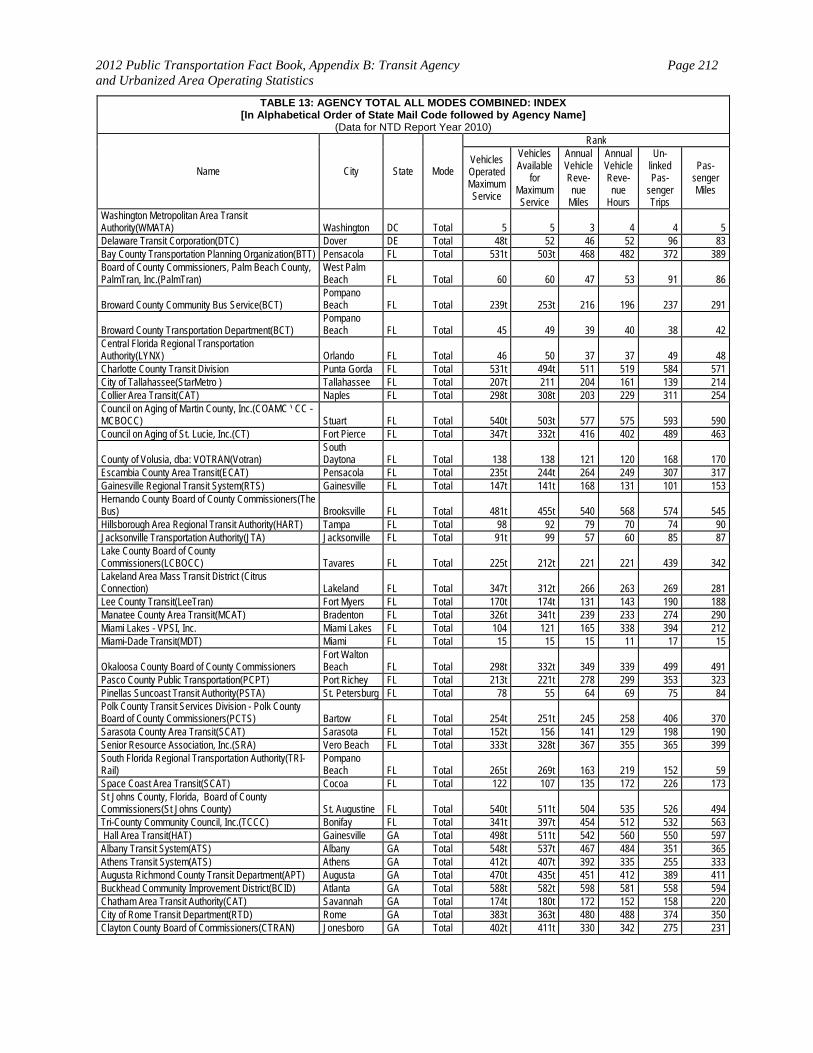
2012 Public Transportation Fact Book, Appendix B: Transit Agency and Urbanized Area Operating Statistics
Page 212
TABLE 13: AGENCY TOTAL ALL MODES COMBINED: INDEX [In Alphabetical Order of State Mail Code followed by Agency Name]
(Data for NTD Report Year 2010)
Name City State Mode
Rank
Vehicles Operated Maximum Service
Vehicles Available
for Maximum Service
Annual Vehicle Reve-nue
Miles
Annual Vehicle Reve-nue
Hours
Un-linked Pas-
senger Trips
Pas-senger Miles
Washington Metropolitan Area Transit Authority(WMATA) Washington DC Total 5 5 3 4 4 5 Delaware Transit Corporation(DTC) Dover DE Total 48t 52 46 52 96 83 Bay County Transportation Planning Organization(BTT) Pensacola FL Total 531t 503t 468 482 372 389 Board of County Commissioners, Palm Beach County, PalmTran, Inc.(PalmTran)
West Palm Beach FL Total 60 60 47 53 91 86
Broward County Community Bus Service(BCT) Pompano Beach FL Total 239t 253t 216 196 237 291
Broward County Transportation Department(BCT) Pompano Beach FL Total 45 49 39 40 38 42
Central Florida Regional Transportation Authority(LYNX) Orlando FL Total 46 50 37 37 49 48 Charlotte County Transit Division Punta Gorda FL Total 531t 494t 511 519 584 571 City of Tallahassee(StarMetro ) Tallahassee FL Total 207t 211 204 161 139 214 Collier Area Transit(CAT) Naples FL Total 298t 308t 203 229 311 254 Council on Aging of Martin County, Inc.(COAMC \ CC - MCBOCC) Stuart FL Total 540t 503t 577 575 593 590 Council on Aging of St. Lucie, Inc.(CT) Fort Pierce FL Total 347t 332t 416 402 489 463
County of Volusia, dba: VOTRAN(Votran) South Daytona FL Total 138 138 121 120 168 170
Escambia County Area Transit(ECAT) Pensacola FL Total 235t 244t 264 249 307 317 Gainesville Regional Transit System(RTS) Gainesville FL Total 147t 141t 168 131 101 153 Hernando County Board of County Commissioners(The Bus) Brooksville FL Total 481t 455t 540 568 574 545 Hillsborough Area Regional Transit Authority(HART) Tampa FL Total 98 92 79 70 74 90 Jacksonville Transportation Authority(JTA) Jacksonville FL Total 91t 99 57 60 85 87 Lake County Board of County Commissioners(LCBOCC) Tavares FL Total 225t 212t 221 221 439 342 Lakeland Area Mass Transit District (Citrus Connection) Lakeland FL Total 347t 312t 266 263 269 281 Lee County Transit(LeeTran) Fort Myers FL Total 170t 174t 131 143 190 188 Manatee County Area Transit(MCAT) Bradenton FL Total 326t 341t 239 233 274 290 Miami Lakes - VPSI, Inc. Miami Lakes FL Total 104 121 165 338 394 212 Miami-Dade Transit(MDT) Miami FL Total 15 15 15 11 17 15
Okaloosa County Board of County Commissioners Fort Walton Beach FL Total 298t 332t 349 339 499 491
Pasco County Public Transportation(PCPT) Port Richey FL Total 213t 221t 278 299 353 323 Pinellas Suncoast Transit Authority(PSTA) St. Petersburg FL Total 78 55 64 69 75 84 Polk County Transit Services Division - Polk County Board of County Commissioners(PCTS) Bartow FL Total 254t 251t 245 258 406 370 Sarasota County Area Transit(SCAT) Sarasota FL Total 152t 156 141 129 198 190 Senior Resource Association, Inc.(SRA) Vero Beach FL Total 333t 328t 367 355 365 399 South Florida Regional Transportation Authority(TRI-Rail)
Pompano Beach FL Total 265t 269t 163 219 152 59
Space Coast Area Transit(SCAT) Cocoa FL Total 122 107 135 172 226 173 St Johns County, Florida, Board of County Commissioners(St Johns County) St. Augustine FL Total 540t 511t 504 535 526 494 Tri-County Community Council, Inc.(TCCC) Bonifay FL Total 341t 397t 454 512 532 563 Hall Area Transit(HAT) Gainesville GA Total 498t 511t 542 560 550 597 Albany Transit System(ATS) Albany GA Total 548t 537t 467 484 351 365 Athens Transit System(ATS) Athens GA Total 412t 407t 392 335 255 333 Augusta Richmond County Transit Department(APT) Augusta GA Total 470t 435t 451 412 389 411 Buckhead Community Improvement District(BCID) Atlanta GA Total 588t 582t 598 581 558 594 Chatham Area Transit Authority(CAT) Savannah GA Total 174t 180t 172 152 158 220 City of Rome Transit Department(RTD) Rome GA Total 383t 363t 480 488 374 350 Clayton County Board of Commissioners(CTRAN) Jonesboro GA Total 402t 411t 330 342 275 231

2012 Public Transportation Fact Book, Appendix B: Transit Agency and Urbanized Area Operating Statistics
Page 213
TABLE 13: AGENCY TOTAL ALL MODES COMBINED: INDEX [In Alphabetical Order of State Mail Code followed by Agency Name]
(Data for NTD Report Year 2010)
Name City State Mode
Rank
Vehicles Operated Maximum Service
Vehicles Available
for Maximum Service
Annual Vehicle Reve-nue
Miles
Annual Vehicle Reve-nue
Hours
Un-linked Pas-
senger Trips
Pas-senger Miles
Cobb County Department of Transportation Authority(CCT) Marietta GA Total 147t 152t 128 150 142 117 Douglas County Rideshare(Rideshare) Douglasville GA Total 227t 232t 355 532 544 321 Georgia Regional Transportation Authority(GRTA) Atlanta GA Total 91t 103 137 220 252 100 Gwinnett County Board of Commissioners(GCT) Lawrenceville GA Total 217t 194t 199 222 233 131 Macon-Bibb County Transit Authority(MTA ) Macon GA Total 437t 464t 327 327 364 400 Marietta - VPSI, Inc. Marietta GA Total 82 86t 136 285 355 164 Metra Transit System(Metra) Columbus GA Total 437t 397t 360 357 320 363 Metropolitan Atlanta Rapid Transit Authority(MARTA) Atlanta GA Total 27 23 14 14 9 13 University of Georgia Transit System(UGA) Athens GA Total 311t 298t 448 265 102 355 City and County of Honolulu Department of Transportation Services(DTS) Honolulu HI Total 30 31 36 32 23 21 Honolulu - VPSI, Inc. Honolulu HI Total 67 80t 127 246 366 203 Ames Transit Agency(CyRide) Ames IA Total 211t 186t 341 266 131 277 Bettendorf Transit System(BT) Bettendorf IA Total 548t 562t 533 546 522 549 Cedar Rapids Transit(CRT) Cedar Rapids IA Total 259t 250 310 287 310 326 City of Dubuque(KeyLine) Dubuque IA Total 459t 478t 492 448 463 517 Coralville Transit System(CTS) Coralville IA Total 581t 585t 590 574 422 462 Davenport Public Transit(CITIBUS) Davenport IA Total 447t 471t 399 367 306 347 Des Moines Area Regional Transit Authority(DART) Des Moines IA Total 99t 104 115 122 141 140 Iowa City Transit(ICT) Iowa City IA Total 447t 455t 444 406 249 374 Johnson County SEATS(SEATS) Iowa City IA Total 437t 471t 537 508 571 586 Metropolitan Transit Authority of Black Hawk County(MET Transit) Waterloo IA Total 383t 389t 364 364 417 528 Sioux City Transit System(SCTS) Sioux City IA Total 374t 407t 435 386 304 311 University of Iowa(Cambus) Iowa City IA Total 393t 407t 419 333 154 349 City of Pocatello - Pocatello Regional Transit(PRT) Pocatello ID Total 391t 411t 423 420 411 425 Targhee Regional Public Transit Authority(TRPTA) Idaho Falls ID Total 393t 420t 428 424 540 498 Valley Regional Transit(VRT) Meridian ID Total 277t 283t 271 251 286 283 Bloomington-Normal Public Transit System(B-NPTS) Normal IL Total 383t 383t 287 269 301 387 Champaign-Urbana Mass Transit District(C-U MTD) Urbana IL Total 152t 164t 164 128 95 141 Chicago Transit Authority(CTA) Chicago IL Total 6 7 5 2 2 6 City of Danville/Danville Mass Transit(DMT) Danville IL Total 531t 511t 489 518 418 437 City of DeKalb(DSATS) DeKalb IL Total 437t 478t 460 465 556 510 Decatur Public Transit System(DPTS) Decatur IL Total 383t 397t 346 332 298 381 Greater Peoria Mass Transit District(CityLink) Peoria IL Total 203 178t 200 198 199 204 Madison County Transit District(MCT) Granite City IL Total 110 119 109 127 218 150 Northeast Illinois Regional Commuter Railroad Corporation(Metra) Chicago IL Total 20 24 18 41 24 9
Pace - Suburban Bus Division(PACE) Arlington Heights IL Total 12 13 22 24 43 33
Pace-Suburban Bus Division, ADA Paratransit Services(PACE)
Arlington Heights IL Total 28 30 33 31 209 165
River Valley Metro Mass Transit District(RVMMTD) Bourbonnais IL Total 520t 543t 393 361 368 332 Rock Island County Metropolitan Mass Transit District(MetroLink) Moline IL Total 249t 244t 208 180 183 253 Rockford Mass Transit District(RMTD) Rockford IL Total 296t 230t 252 225 264 286 Springfield Mass Transit District(SMTD) Springfield IL Total 239t 253t 279 228 262 354 Bloomington Public Transportation Corporation(BT) Bloomington IN Total 341t 355t 348 284 180 294 City of Anderson Transportation System(CATS) Anderson IN Total 548t 551t 528 516 537 552 City of Kokomo(COK) Kokomo IN Total 298t 345 381 291 513 520 City of Valparaiso Valparaiso IN Total 581t 589t 556 578 572 474 East Chicago Transit(ECT) East Chicago IN Total 598t 595t 589 596 503 587 Fort Wayne Public Transportation Corporation(Citilink) Fort Wayne IN Total 333t 346t 268 243 247 304 Gary Public Transportation Corporation(GPTC) Gary IN Total 459t 464t 379 360 347 525 Greater Lafayette Public Transportation Corporation(CityBus) Lafayette IN Total 232t 258t 273 203 138 250
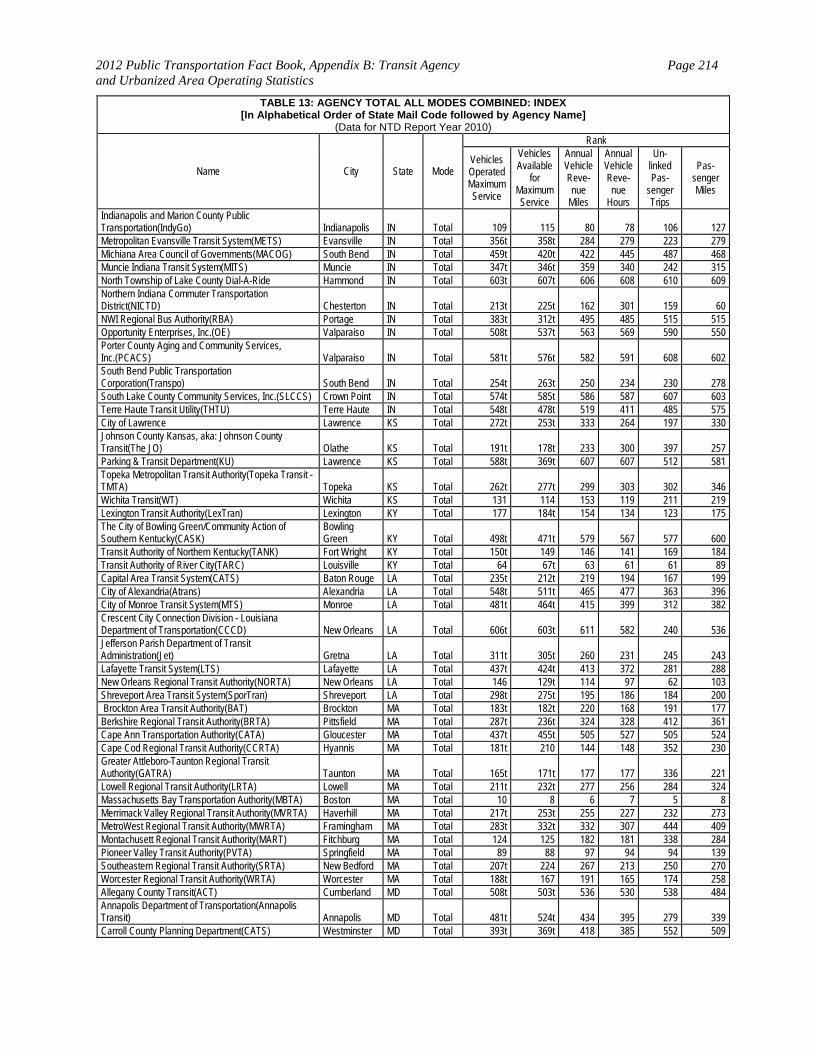
2012 Public Transportation Fact Book, Appendix B: Transit Agency and Urbanized Area Operating Statistics
Page 214
TABLE 13: AGENCY TOTAL ALL MODES COMBINED: INDEX [In Alphabetical Order of State Mail Code followed by Agency Name]
(Data for NTD Report Year 2010)
Name City State Mode
Rank
Vehicles Operated Maximum Service
Vehicles Available
for Maximum Service
Annual Vehicle Reve-nue
Miles
Annual Vehicle Reve-nue
Hours
Un-linked Pas-
senger Trips
Pas-senger Miles
Indianapolis and Marion County Public Transportation(IndyGo) Indianapolis IN Total 109 115 80 78 106 127 Metropolitan Evansville Transit System(METS) Evansville IN Total 356t 358t 284 279 223 279 Michiana Area Council of Governments(MACOG) South Bend IN Total 459t 420t 422 445 487 468 Muncie Indiana Transit System(MITS) Muncie IN Total 347t 346t 359 340 242 315 North Township of Lake County Dial-A-Ride Hammond IN Total 603t 607t 606 608 610 609 Northern Indiana Commuter Transportation District(NICTD) Chesterton IN Total 213t 225t 162 301 159 60 NWI Regional Bus Authority(RBA) Portage IN Total 383t 312t 495 485 515 515 Opportunity Enterprises, Inc.(OE) Valparaiso IN Total 508t 537t 563 569 590 550 Porter County Aging and Community Services, Inc.(PCACS) Valparaiso IN Total 581t 576t 582 591 608 602 South Bend Public Transportation Corporation(Transpo) South Bend IN Total 254t 263t 250 234 230 278 South Lake County Community Services, Inc.(SLCCS) Crown Point IN Total 574t 585t 586 587 607 603 Terre Haute Transit Utility(THTU) Terre Haute IN Total 548t 478t 519 411 485 575 City of Lawrence Lawrence KS Total 272t 253t 333 264 197 330 Johnson County Kansas, aka: Johnson County Transit(The JO) Olathe KS Total 191t 178t 233 300 397 257 Parking & Transit Department(KU) Lawrence KS Total 588t 369t 607 607 512 581 Topeka Metropolitan Transit Authority(Topeka Transit - TMTA) Topeka KS Total 262t 277t 299 303 302 346 Wichita Transit(WT) Wichita KS Total 131 114 153 119 211 219 Lexington Transit Authority(LexTran) Lexington KY Total 177 184t 154 134 123 175 The City of Bowling Green/Community Action of Southern Kentucky(CASK)
Bowling Green KY Total 498t 471t 579 567 577 600
Transit Authority of Northern Kentucky(TANK) Fort Wright KY Total 150t 149 146 141 169 184 Transit Authority of River City(TARC) Louisville KY Total 64 67t 63 61 61 89 Capital Area Transit System(CATS) Baton Rouge LA Total 235t 212t 219 194 167 199 City of Alexandria(Atrans) Alexandria LA Total 548t 511t 465 477 363 396 City of Monroe Transit System(MTS) Monroe LA Total 481t 464t 415 399 312 382 Crescent City Connection Division - Louisiana Department of Transportation(CCCD) New Orleans LA Total 606t 603t 611 582 240 536 Jefferson Parish Department of Transit Administration(Jet) Gretna LA Total 311t 305t 260 231 245 243 Lafayette Transit System(LTS) Lafayette LA Total 437t 424t 413 372 281 288 New Orleans Regional Transit Authority(NORTA) New Orleans LA Total 146 129t 114 97 62 103 Shreveport Area Transit System(SporTran) Shreveport LA Total 298t 275t 195 186 184 200 Brockton Area Transit Authority(BAT) Brockton MA Total 183t 182t 220 168 191 177 Berkshire Regional Transit Authority(BRTA) Pittsfield MA Total 287t 236t 324 328 412 361 Cape Ann Transportation Authority(CATA) Gloucester MA Total 437t 455t 505 527 505 524 Cape Cod Regional Transit Authority(CCRTA) Hyannis MA Total 181t 210 144 148 352 230 Greater Attleboro-Taunton Regional Transit Authority(GATRA) Taunton MA Total 165t 171t 177 177 336 221 Lowell Regional Transit Authority(LRTA) Lowell MA Total 211t 232t 277 256 284 324 Massachusetts Bay Transportation Authority(MBTA) Boston MA Total 10 8 6 7 5 8 Merrimack Valley Regional Transit Authority(MVRTA) Haverhill MA Total 217t 253t 255 227 232 273 MetroWest Regional Transit Authority(MWRTA) Framingham MA Total 283t 332t 332 307 444 409 Montachusett Regional Transit Authority(MART) Fitchburg MA Total 124 125 182 181 338 284 Pioneer Valley Transit Authority(PVTA) Springfield MA Total 89 88 97 94 94 139 Southeastern Regional Transit Authority(SRTA) New Bedford MA Total 207t 224 267 213 250 270 Worcester Regional Transit Authority(WRTA) Worcester MA Total 188t 167 191 165 174 258 Allegany County Transit(ACT) Cumberland MD Total 508t 503t 536 530 538 484 Annapolis Department of Transportation(Annapolis Transit) Annapolis MD Total 481t 524t 434 395 279 339 Carroll County Planning Department(CATS) Westminster MD Total 393t 369t 418 385 552 509
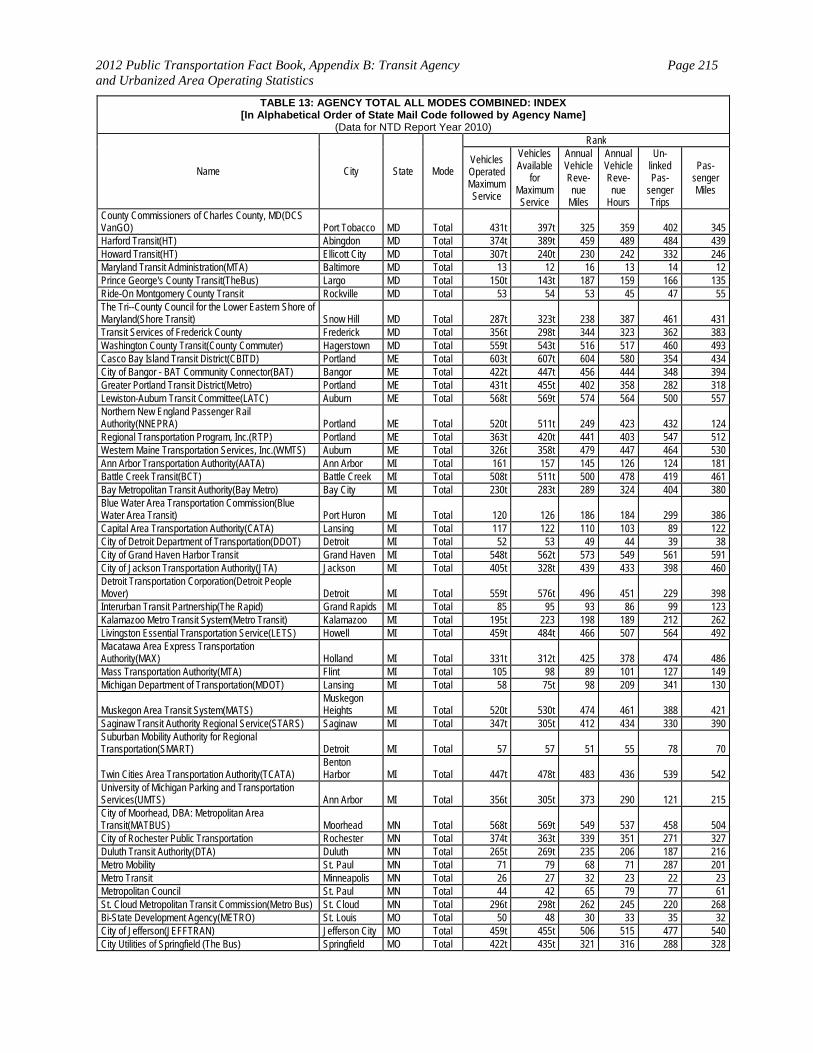
2012 Public Transportation Fact Book, Appendix B: Transit Agency and Urbanized Area Operating Statistics
Page 215
TABLE 13: AGENCY TOTAL ALL MODES COMBINED: INDEX [In Alphabetical Order of State Mail Code followed by Agency Name]
(Data for NTD Report Year 2010)
Name City State Mode
Rank
Vehicles Operated Maximum Service
Vehicles Available
for Maximum Service
Annual Vehicle Reve-nue
Miles
Annual Vehicle Reve-nue
Hours
Un-linked Pas-
senger Trips
Pas-senger Miles
County Commissioners of Charles County, MD(DCS VanGO) Port Tobacco MD Total 431t 397t 325 359 402 345 Harford Transit(HT) Abingdon MD Total 374t 389t 459 489 484 439 Howard Transit(HT) Ellicott City MD Total 307t 240t 230 242 332 246 Maryland Transit Administration(MTA) Baltimore MD Total 13 12 16 13 14 12 Prince George's County Transit(TheBus) Largo MD Total 150t 143t 187 159 166 135 Ride-On Montgomery County Transit Rockville MD Total 53 54 53 45 47 55 The Tri--County Council for the Lower Eastern Shore of Maryland(Shore Transit) Snow Hill MD Total 287t 323t 238 387 461 431 Transit Services of Frederick County Frederick MD Total 356t 298t 344 323 362 383 Washington County Transit(County Commuter) Hagerstown MD Total 559t 543t 516 517 460 493 Casco Bay Island Transit District(CBITD) Portland ME Total 603t 607t 604 580 354 434 City of Bangor - BAT Community Connector(BAT) Bangor ME Total 422t 447t 456 444 348 394 Greater Portland Transit District(Metro) Portland ME Total 431t 455t 402 358 282 318 Lewiston-Auburn Transit Committee(LATC) Auburn ME Total 568t 569t 574 564 500 557 Northern New England Passenger Rail Authority(NNEPRA) Portland ME Total 520t 511t 249 423 432 124 Regional Transportation Program, Inc.(RTP) Portland ME Total 363t 420t 441 403 547 512 Western Maine Transportation Services, Inc.(WMTS) Auburn ME Total 326t 358t 479 447 464 530 Ann Arbor Transportation Authority(AATA) Ann Arbor MI Total 161 157 145 126 124 181 Battle Creek Transit(BCT) Battle Creek MI Total 508t 511t 500 478 419 461 Bay Metropolitan Transit Authority(Bay Metro) Bay City MI Total 230t 283t 289 324 404 380 Blue Water Area Transportation Commission(Blue Water Area Transit) Port Huron MI Total 120 126 186 184 299 386 Capital Area Transportation Authority(CATA) Lansing MI Total 117 122 110 103 89 122 City of Detroit Department of Transportation(DDOT) Detroit MI Total 52 53 49 44 39 38 City of Grand Haven Harbor Transit Grand Haven MI Total 548t 562t 573 549 561 591 City of Jackson Transportation Authority(JTA) Jackson MI Total 405t 328t 439 433 398 460 Detroit Transportation Corporation(Detroit People Mover) Detroit MI Total 559t 576t 496 451 229 398 Interurban Transit Partnership(The Rapid) Grand Rapids MI Total 85 95 93 86 99 123 Kalamazoo Metro Transit System(Metro Transit) Kalamazoo MI Total 195t 223 198 189 212 262 Livingston Essential Transportation Service(LETS) Howell MI Total 459t 484t 466 507 564 492 Macatawa Area Express Transportation Authority(MAX) Holland MI Total 331t 312t 425 378 474 486 Mass Transportation Authority(MTA) Flint MI Total 105 98 89 101 127 149 Michigan Department of Transportation(MDOT) Lansing MI Total 58 75t 98 209 341 130
Muskegon Area Transit System(MATS) Muskegon Heights MI Total 520t 530t 474 461 388 421
Saginaw Transit Authority Regional Service(STARS) Saginaw MI Total 347t 305t 412 434 330 390 Suburban Mobility Authority for Regional Transportation(SMART) Detroit MI Total 57 57 51 55 78 70
Twin Cities Area Transportation Authority(TCATA) Benton Harbor MI Total 447t 478t 483 436 539 542
University of Michigan Parking and Transportation Services(UMTS) Ann Arbor MI Total 356t 305t 373 290 121 215 City of Moorhead, DBA: Metropolitan Area Transit(MATBUS) Moorhead MN Total 568t 569t 549 537 458 504 City of Rochester Public Transportation Rochester MN Total 374t 363t 339 351 271 327 Duluth Transit Authority(DTA) Duluth MN Total 265t 269t 235 206 187 216 Metro Mobility St. Paul MN Total 71 79 68 71 287 201 Metro Transit Minneapolis MN Total 26 27 32 23 22 23 Metropolitan Council St. Paul MN Total 44 42 65 79 77 61 St. Cloud Metropolitan Transit Commission(Metro Bus) St. Cloud MN Total 296t 298t 262 245 220 268 Bi-State Development Agency(METRO) St. Louis MO Total 50 48 30 33 35 32 City of Jefferson(JEFFTRAN) Jefferson City MO Total 459t 455t 506 515 477 540 City Utilities of Springfield (The Bus) Springfield MO Total 422t 435t 321 316 288 328
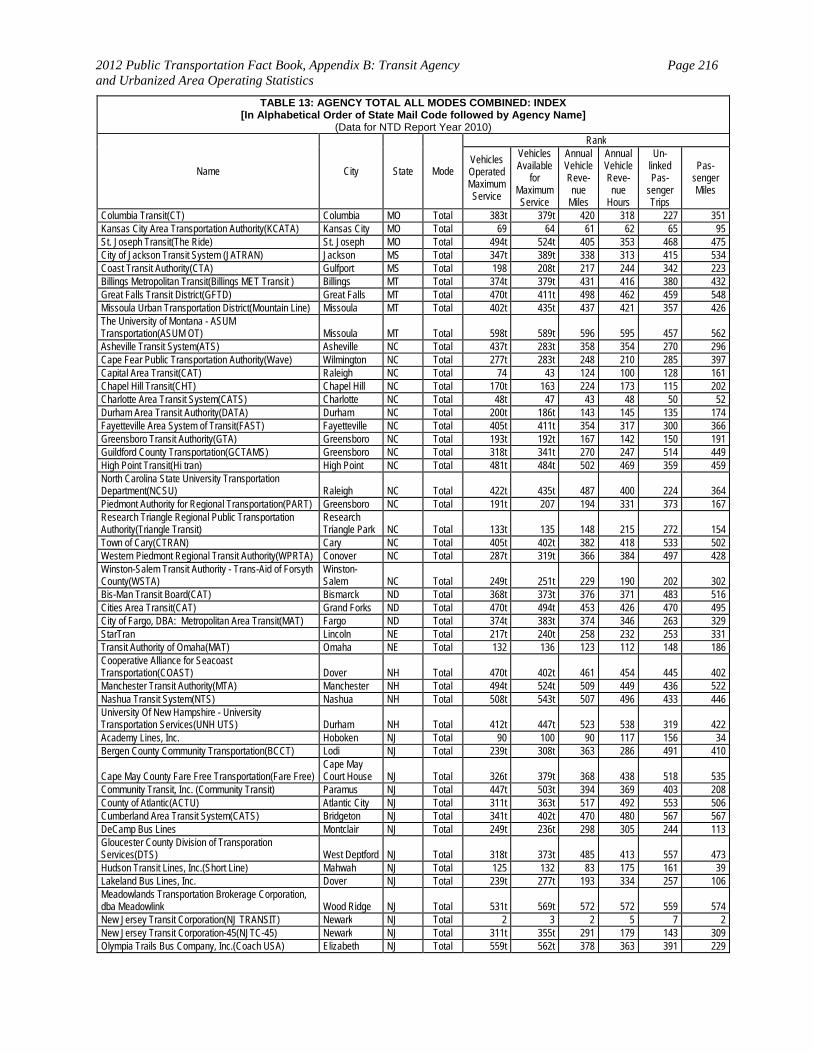
2012 Public Transportation Fact Book, Appendix B: Transit Agency and Urbanized Area Operating Statistics
Page 216
TABLE 13: AGENCY TOTAL ALL MODES COMBINED: INDEX [In Alphabetical Order of State Mail Code followed by Agency Name]
(Data for NTD Report Year 2010)
Name City State Mode
Rank
Vehicles Operated Maximum Service
Vehicles Available
for Maximum Service
Annual Vehicle Reve-nue
Miles
Annual Vehicle Reve-nue
Hours
Un-linked Pas-
senger Trips
Pas-senger Miles
Columbia Transit(CT) Columbia MO Total 383t 379t 420 318 227 351 Kansas City Area Transportation Authority(KCATA) Kansas City MO Total 69 64 61 62 65 95 St. Joseph Transit(The Ride) St. Joseph MO Total 494t 524t 405 353 468 475 City of Jackson Transit System (JATRAN) Jackson MS Total 347t 389t 338 313 415 534 Coast Transit Authority(CTA) Gulfport MS Total 198 208t 217 244 342 223 Billings Metropolitan Transit(Billings MET Transit ) Billings MT Total 374t 379t 431 416 380 432 Great Falls Transit District(GFTD) Great Falls MT Total 470t 411t 498 462 459 548 Missoula Urban Transportation District(Mountain Line) Missoula MT Total 402t 435t 437 421 357 426 The University of Montana - ASUM Transportation(ASUM OT) Missoula MT Total 598t 589t 596 595 457 562 Asheville Transit System(ATS) Asheville NC Total 437t 283t 358 354 270 296 Cape Fear Public Transportation Authority(Wave) Wilmington NC Total 277t 283t 248 210 285 397 Capital Area Transit(CAT) Raleigh NC Total 74 43 124 100 128 161 Chapel Hill Transit(CHT) Chapel Hill NC Total 170t 163 224 173 115 202 Charlotte Area Transit System(CATS) Charlotte NC Total 48t 47 43 48 50 52 Durham Area Transit Authority(DATA) Durham NC Total 200t 186t 143 145 135 174 Fayetteville Area System of Transit(FAST) Fayetteville NC Total 405t 411t 354 317 300 366 Greensboro Transit Authority(GTA) Greensboro NC Total 193t 192t 167 142 150 191 Guildford County Transportation(GCTAMS) Greensboro NC Total 318t 341t 270 247 514 449 High Point Transit(Hi tran) High Point NC Total 481t 484t 502 469 359 459 North Carolina State University Transportation Department(NCSU) Raleigh NC Total 422t 435t 487 400 224 364 Piedmont Authority for Regional Transportation(PART) Greensboro NC Total 191t 207 194 331 373 167 Research Triangle Regional Public Transportation Authority(Triangle Transit)
Research Triangle Park NC Total 133t 135 148 215 272 154
Town of Cary(CTRAN) Cary NC Total 405t 402t 382 418 533 502 Western Piedmont Regional Transit Authority(WPRTA) Conover NC Total 287t 319t 366 384 497 428 Winston-Salem Transit Authority - Trans-Aid of Forsyth County(WSTA)
Winston-Salem NC Total 249t 251t 229 190 202 302
Bis-Man Transit Board(CAT) Bismarck ND Total 368t 373t 376 371 483 516 Cities Area Transit(CAT) Grand Forks ND Total 470t 494t 453 426 470 495 City of Fargo, DBA: Metropolitan Area Transit(MAT) Fargo ND Total 374t 383t 374 346 263 329 StarTran Lincoln NE Total 217t 240t 258 232 253 331 Transit Authority of Omaha(MAT) Omaha NE Total 132 136 123 112 148 186 Cooperative Alliance for Seacoast Transportation(COAST) Dover NH Total 470t 402t 461 454 445 402 Manchester Transit Authority(MTA) Manchester NH Total 494t 524t 509 449 436 522 Nashua Transit System(NTS) Nashua NH Total 508t 543t 507 496 433 446 University Of New Hampshire - University Transportation Services(UNH UTS) Durham NH Total 412t 447t 523 538 319 422 Academy Lines, Inc. Hoboken NJ Total 90 100 90 117 156 34 Bergen County Community Transportation(BCCT) Lodi NJ Total 239t 308t 363 286 491 410
Cape May County Fare Free Transportation(Fare Free) Cape May Court House NJ Total 326t 379t 368 438 518 535
Community Transit, Inc. (Community Transit) Paramus NJ Total 447t 503t 394 369 403 208 County of Atlantic(ACTU) Atlantic City NJ Total 311t 363t 517 492 553 506 Cumberland Area Transit System(CATS) Bridgeton NJ Total 341t 402t 470 480 567 567 DeCamp Bus Lines Montclair NJ Total 249t 236t 298 305 244 113 Gloucester County Division of Transporation Services(DTS) West Deptford NJ Total 318t 373t 485 413 557 473 Hudson Transit Lines, Inc.(Short Line) Mahwah NJ Total 125 132 83 175 161 39 Lakeland Bus Lines, Inc. Dover NJ Total 239t 277t 193 334 257 106 Meadowlands Transportation Brokerage Corporation, dba Meadowlink Wood Ridge NJ Total 531t 569t 572 572 559 574 New Jersey Transit Corporation(NJ TRANSIT) Newark NJ Total 2 3 2 5 7 2 New Jersey Transit Corporation-45(NJTC-45) Newark NJ Total 311t 355t 291 179 143 309 Olympia Trails Bus Company, Inc.(Coach USA) Elizabeth NJ Total 559t 562t 378 363 391 229

2012 Public Transportation Fact Book, Appendix B: Transit Agency and Urbanized Area Operating Statistics
Page 217
TABLE 13: AGENCY TOTAL ALL MODES COMBINED: INDEX [In Alphabetical Order of State Mail Code followed by Agency Name]
(Data for NTD Report Year 2010)
Name City State Mode
Rank
Vehicles Operated Maximum Service
Vehicles Available
for Maximum Service
Annual Vehicle Reve-nue
Miles
Annual Vehicle Reve-nue
Hours
Un-linked Pas-
senger Trips
Pas-senger Miles
Orange-Newark-Elizabeth, Inc.(Coach USA) Elizabeth NJ Total 239t 269t 212 156 93 132 Port Authority Trans-Hudson Corporation(PATH) Jersey City NJ Total 80 72 60 73 18 26 Port Authority Transit Corporation(PATCO) Lindenwold NJ Total 185t 198t 129 218 97 67 Port Imperial Ferry Corporation dba NY Waterway Weehawken NJ Total 265t 277t 386 208 122 159 Rockland Coaches, Inc. Westwood NJ Total 185t 186t 158 211 182 92
Suburban Transit Corporation(Coach USA) New Brunswick NJ Total 135 143t 120 137 207 85
Trans-Hudson Express Elizabeth NJ Total 338t 383t 384 345 162 133 City of Albuquerque Transit Department(ABQ Ride) Albuquerque NM Total 119 105t 96 98 88 121 Las Cruces Area Transit(RoadRUNNER Transit) Las Cruces NM Total 422t 402t 446 407 385 454 Rio Metro Regional Transit District(RMRTD) Albuquerque NM Total 412t 426t 282 475 303 93 Santa Fe Trails - City of Santa Fe(SFT) Santa Fe NM Total 331t 350t 337 295 350 414 Regional Transportation Commission of Southern Nevada(RTC) Las Vegas NV Total 43 37 35 27 28 36 Regional Transportation Commission of Washoe County(RTC) Reno NV Total 141 146 139 116 113 156 Adirondack Transit Lines, Inc,(Adirondack Trailways) Hurley NY Total 405t 383t 218 394 420 112 BillyBey Ferry Company, LLC New York NY Total 588t 589t 569 559 260 385 Broome County Department of Public Transportation(Broome County) Vestal NY Total 259t 263t 240 202 194 225 Capital District Transportation Authority(CDTA) Albany NY Total 84 86t 85 76 72 110 Centro of Cayuga, Inc.(Centro of Cayuga) Syracuse NY Total 531t 562t 484 513 431 378 Centro of Oneida, Inc.(Centro of Oneida) Syracruse NY Total 363t 363t 318 278 292 373 Centro of Oswego, Inc.(Centro of Oswego) Syracuse NY Total 520t 543t 493 498 446 444 Chemung County Transit System(CCTS) Elmira NY Total 402t 411t 380 432 382 417 City of Long Beach(Long Beach Bus) Long Beach NY Total 574t 562t 565 491 472 546 City of Poughkeepsie Poughkeepsie NY Total 588t 602 588 579 442 511 Clarkstown Mini-Trans Nanuet NY Total 598t 585t 550 565 549 555 CNY Centro, Inc. (CNY Centro ) Syracuse NY Total 115 118 125 107 79 128 Dutchess County Division of Mass Transportation(Loop Bus) Poughkeepsie NY Total 307t 346t 369 410 434 391 Greater Glens Falls Transit System(GGFT) Queensbury NY Total 588t 576t 545 558 476 519 Hendrick Hudson Bus Lines, Inc.(HHBL) Newburgh NY Total 588t 595t 541 585 595 456
Huntington Area Rapid Transit(HART) Huntington Station NY Total 459t 511t 512 494 496 507
Metro-North Commuter Railroad Company, dba: MTA Metro-North Railroad(MTA-MNCR) New York NY Total 19 25 11 35 19 7 Metropolitan Suburban Bus Authority, dba: MTA Long Island Bus(MTA Long Island Bus) Garden City NY Total 59 67t 54 43 45 45 Monroe Bus Corporation Brooklyn NY Total 540t 524t 458 571 488 193 Monsey New Square Trails Corporation Spring Valley NY Total 368t 411t 361 456 414 168 MTA Bus Company(MTABUS) New York NY Total 18 18 31 15 10 25 MTA Long Island Rail Road(MTA LIRR) Jamaica NY Total 24 21 9 25 15 3 MTA New York City Transit(NYCT) New York NY Total 1 1 1 1 1 1 New York City Department of Transportation(NYCDOT) New York NY Total 391t 411t 410 443 54 54 Newburgh Beacon Bus Corporation(NBBC) New Windsor NY Total 568t 582t 553 543 548 559 Niagara Frontier Transportation Authority(NFT Metro) Buffalo NY Total 54 58 59 50 48 65 Private One of New York, LLC, dba: New York Airport Service Brooklyn NY Total 412t 455t 320 297 318 179 Private Transportation Corporation Brooklyn NY Total 588t 595t 578 577 410 368 Putnam County Transit(PART) Carmel NY Total 531t 494t 486 528 531 467 Regional Transit Service, Inc. and Lift Line, Inc.(R-GRTA) Rochester NY Total 88 82 99 88 60 91 Staten Island Rapid Transit Operating Authority, dba: MTA Staten Island Railway(SIRTOA) Staten Island NY Total 298t 283t 215 272 114 111 Suffolk County Department of Public Works - Transportation Division(ST) Yaphank NY Total 95 93t 56 77 120 107
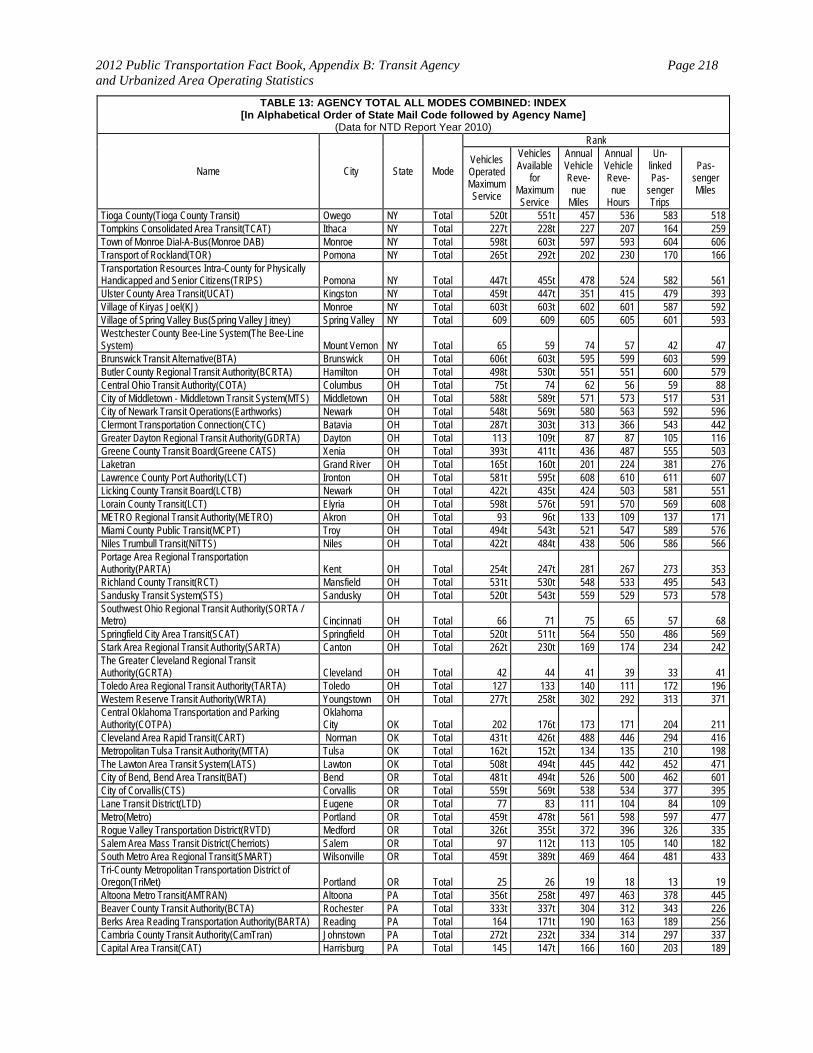
2012 Public Transportation Fact Book, Appendix B: Transit Agency and Urbanized Area Operating Statistics
Page 218
TABLE 13: AGENCY TOTAL ALL MODES COMBINED: INDEX [In Alphabetical Order of State Mail Code followed by Agency Name]
(Data for NTD Report Year 2010)
Name City State Mode
Rank
Vehicles Operated Maximum Service
Vehicles Available
for Maximum Service
Annual Vehicle Reve-nue
Miles
Annual Vehicle Reve-nue
Hours
Un-linked Pas-
senger Trips
Pas-senger Miles
Tioga County(Tioga County Transit) Owego NY Total 520t 551t 457 536 583 518 Tompkins Consolidated Area Transit(TCAT) Ithaca NY Total 227t 228t 227 207 164 259 Town of Monroe Dial-A-Bus(Monroe DAB) Monroe NY Total 598t 603t 597 593 604 606 Transport of Rockland(TOR) Pomona NY Total 265t 292t 202 230 170 166 Transportation Resources Intra-County for Physically Handicapped and Senior Citizens(TRIPS) Pomona NY Total 447t 455t 478 524 582 561 Ulster County Area Transit(UCAT) Kingston NY Total 459t 447t 351 415 479 393 Village of Kiryas Joel(KJ) Monroe NY Total 603t 603t 602 601 587 592 Village of Spring Valley Bus(Spring Valley Jitney) Spring Valley NY Total 609 609 605 605 601 593 Westchester County Bee-Line System(The Bee-Line System) Mount Vernon NY Total 65 59 74 57 42 47 Brunswick Transit Alternative(BTA) Brunswick OH Total 606t 603t 595 599 603 599 Butler County Regional Transit Authority(BCRTA) Hamilton OH Total 498t 530t 551 551 600 579 Central Ohio Transit Authority(COTA) Columbus OH Total 75t 74 62 56 59 88 City of Middletown - Middletown Transit System(MTS) Middletown OH Total 588t 589t 571 573 517 531 City of Newark Transit Operations(Earthworks) Newark OH Total 548t 569t 580 563 592 596 Clermont Transportation Connection(CTC) Batavia OH Total 287t 303t 313 366 543 442 Greater Dayton Regional Transit Authority(GDRTA) Dayton OH Total 113 109t 87 87 105 116 Greene County Transit Board(Greene CATS) Xenia OH Total 393t 411t 436 487 555 503 Laketran Grand River OH Total 165t 160t 201 224 381 276 Lawrence County Port Authority(LCT) Ironton OH Total 581t 595t 608 610 611 607 Licking County Transit Board(LCTB) Newark OH Total 422t 435t 424 503 581 551 Lorain County Transit(LCT) Elyria OH Total 598t 576t 591 570 569 608 METRO Regional Transit Authority(METRO) Akron OH Total 93 96t 133 109 137 171 Miami County Public Transit(MCPT) Troy OH Total 494t 543t 521 547 589 576 Niles Trumbull Transit(NiTTS) Niles OH Total 422t 484t 438 506 586 566 Portage Area Regional Transportation Authority(PARTA) Kent OH Total 254t 247t 281 267 273 353 Richland County Transit(RCT) Mansfield OH Total 531t 530t 548 533 495 543 Sandusky Transit System(STS) Sandusky OH Total 520t 543t 559 529 573 578 Southwest Ohio Regional Transit Authority(SORTA / Metro) Cincinnati OH Total 66 71 75 65 57 68 Springfield City Area Transit(SCAT) Springfield OH Total 520t 511t 564 550 486 569 Stark Area Regional Transit Authority(SARTA) Canton OH Total 262t 230t 169 174 234 242 The Greater Cleveland Regional Transit Authority(GCRTA) Cleveland OH Total 42 44 41 39 33 41 Toledo Area Regional Transit Authority(TARTA) Toledo OH Total 127 133 140 111 172 196 Western Reserve Transit Authority(WRTA) Youngstown OH Total 277t 258t 302 292 313 371 Central Oklahoma Transportation and Parking Authority(COTPA)
Oklahoma City OK Total 202 176t 173 171 204 211
Cleveland Area Rapid Transit(CART) Norman OK Total 431t 426t 488 446 294 416 Metropolitan Tulsa Transit Authority(MTTA) Tulsa OK Total 162t 152t 134 135 210 198 The Lawton Area Transit System(LATS) Lawton OK Total 508t 494t 445 442 452 471 City of Bend, Bend Area Transit(BAT) Bend OR Total 481t 494t 526 500 462 601 City of Corvallis(CTS) Corvallis OR Total 559t 569t 538 534 377 395 Lane Transit District(LTD) Eugene OR Total 77 83 111 104 84 109 Metro(Metro) Portland OR Total 459t 478t 561 598 597 477 Rogue Valley Transportation District(RVTD) Medford OR Total 326t 355t 372 396 326 335 Salem Area Mass Transit District(Cherriots) Salem OR Total 97 112t 113 105 140 182 South Metro Area Regional Transit(SMART) Wilsonville OR Total 459t 389t 469 464 481 433 Tri-County Metropolitan Transportation District of Oregon(TriMet) Portland OR Total 25 26 19 18 13 19 Altoona Metro Transit(AMTRAN) Altoona PA Total 356t 258t 497 463 378 445 Beaver County Transit Authority(BCTA) Rochester PA Total 333t 337t 304 312 343 226 Berks Area Reading Transportation Authority(BARTA) Reading PA Total 164 171t 190 163 189 256 Cambria County Transit Authority(CamTran) Johnstown PA Total 272t 232t 334 314 297 337 Capital Area Transit(CAT) Harrisburg PA Total 145 147t 166 160 203 189
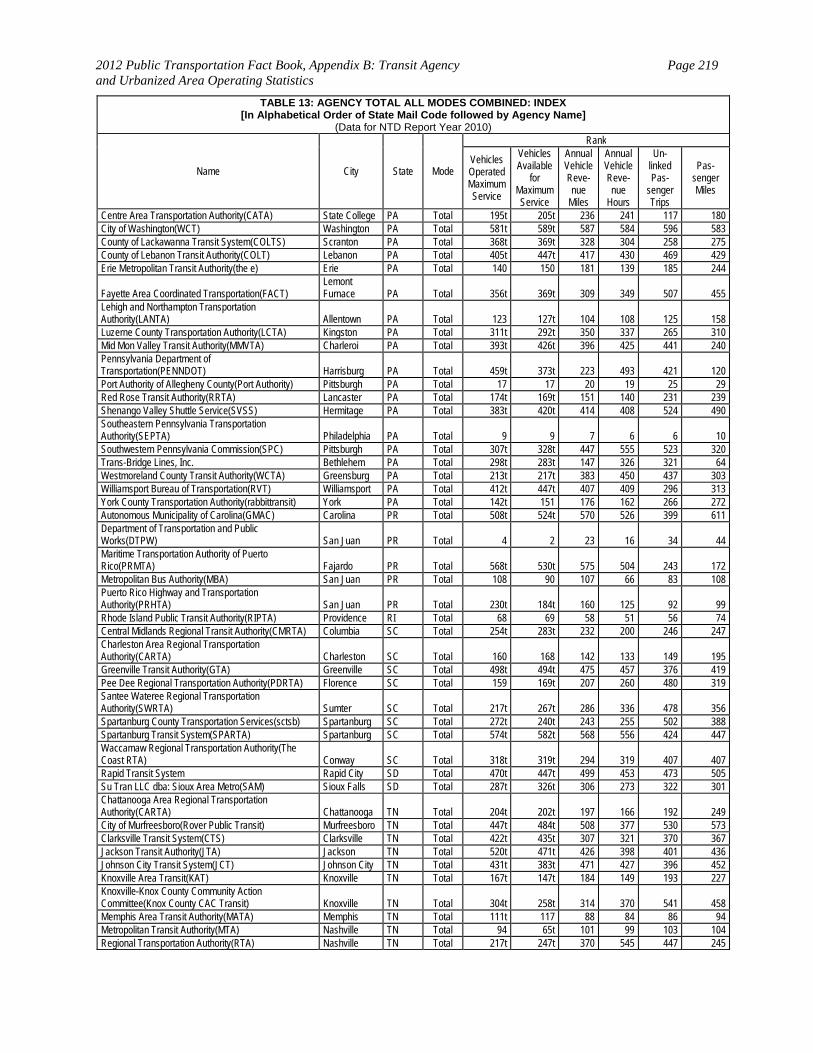
2012 Public Transportation Fact Book, Appendix B: Transit Agency and Urbanized Area Operating Statistics
Page 219
TABLE 13: AGENCY TOTAL ALL MODES COMBINED: INDEX [In Alphabetical Order of State Mail Code followed by Agency Name]
(Data for NTD Report Year 2010)
Name City State Mode
Rank
Vehicles Operated Maximum Service
Vehicles Available
for Maximum Service
Annual Vehicle Reve-nue
Miles
Annual Vehicle Reve-nue
Hours
Un-linked Pas-
senger Trips
Pas-senger Miles
Centre Area Transportation Authority(CATA) State College PA Total 195t 205t 236 241 117 180 City of Washington(WCT) Washington PA Total 581t 589t 587 584 596 583 County of Lackawanna Transit System(COLTS) Scranton PA Total 368t 369t 328 304 258 275 County of Lebanon Transit Authority(COLT) Lebanon PA Total 405t 447t 417 430 469 429 Erie Metropolitan Transit Authority(the e) Erie PA Total 140 150 181 139 185 244
Fayette Area Coordinated Transportation(FACT) Lemont Furnace PA Total 356t 369t 309 349 507 455
Lehigh and Northampton Transportation Authority(LANTA) Allentown PA Total 123 127t 104 108 125 158 Luzerne County Transportation Authority(LCTA) Kingston PA Total 311t 292t 350 337 265 310 Mid Mon Valley Transit Authority(MMVTA) Charleroi PA Total 393t 426t 396 425 441 240 Pennsylvania Department of Transportation(PENNDOT) Harrisburg PA Total 459t 373t 223 493 421 120 Port Authority of Allegheny County(Port Authority) Pittsburgh PA Total 17 17 20 19 25 29 Red Rose Transit Authority(RRTA) Lancaster PA Total 174t 169t 151 140 231 239 Shenango Valley Shuttle Service(SVSS) Hermitage PA Total 383t 420t 414 408 524 490 Southeastern Pennsylvania Transportation Authority(SEPTA) Philadelphia PA Total 9 9 7 6 6 10 Southwestern Pennsylvania Commission(SPC) Pittsburgh PA Total 307t 328t 447 555 523 320 Trans-Bridge Lines, Inc. Bethlehem PA Total 298t 283t 147 326 321 64 Westmoreland County Transit Authority(WCTA) Greensburg PA Total 213t 217t 383 450 437 303 Williamsport Bureau of Transportation(RVT) Williamsport PA Total 412t 447t 407 409 296 313 York County Transportation Authority(rabbittransit) York PA Total 142t 151 176 162 266 272 Autonomous Municipality of Carolina(GMAC) Carolina PR Total 508t 524t 570 526 399 611 Department of Transportation and Public Works(DTPW) San Juan PR Total 4 2 23 16 34 44 Maritime Transportation Authority of Puerto Rico(PRMTA) Fajardo PR Total 568t 530t 575 504 243 172 Metropolitan Bus Authority(MBA) San Juan PR Total 108 90 107 66 83 108 Puerto Rico Highway and Transportation Authority(PRHTA) San Juan PR Total 230t 184t 160 125 92 99 Rhode Island Public Transit Authority(RIPTA) Providence RI Total 68 69 58 51 56 74 Central Midlands Regional Transit Authority(CMRTA) Columbia SC Total 254t 283t 232 200 246 247 Charleston Area Regional Transportation Authority(CARTA) Charleston SC Total 160 168 142 133 149 195 Greenville Transit Authority(GTA) Greenville SC Total 498t 494t 475 457 376 419 Pee Dee Regional Transportation Authority(PDRTA) Florence SC Total 159 169t 207 260 480 319 Santee Wateree Regional Transportation Authority(SWRTA) Sumter SC Total 217t 267t 286 336 478 356 Spartanburg County Transportation Services(sctsb) Spartanburg SC Total 272t 240t 243 255 502 388 Spartanburg Transit System(SPARTA) Spartanburg SC Total 574t 582t 568 556 424 447 Waccamaw Regional Transportation Authority(The Coast RTA) Conway SC Total 318t 319t 294 319 407 407 Rapid Transit System Rapid City SD Total 470t 447t 499 453 473 505 Su Tran LLC dba: Sioux Area Metro(SAM) Sioux Falls SD Total 287t 326t 306 273 322 301 Chattanooga Area Regional Transportation Authority(CARTA) Chattanooga TN Total 204t 202t 197 166 192 249 City of Murfreesboro(Rover Public Transit) Murfreesboro TN Total 447t 484t 508 377 530 573 Clarksville Transit System(CTS) Clarksville TN Total 422t 435t 307 321 370 367 Jackson Transit Authority(JTA) Jackson TN Total 520t 471t 426 398 401 436 Johnson City Transit System(JCT) Johnson City TN Total 431t 383t 471 427 396 452 Knoxville Area Transit(KAT) Knoxville TN Total 167t 147t 184 149 193 227 Knoxville-Knox County Community Action Committee(Knox County CAC Transit) Knoxville TN Total 304t 258t 314 370 541 458 Memphis Area Transit Authority(MATA) Memphis TN Total 111t 117 88 84 86 94 Metropolitan Transit Authority(MTA) Nashville TN Total 94 65t 101 99 103 104 Regional Transportation Authority(RTA) Nashville TN Total 217t 247t 370 545 447 245
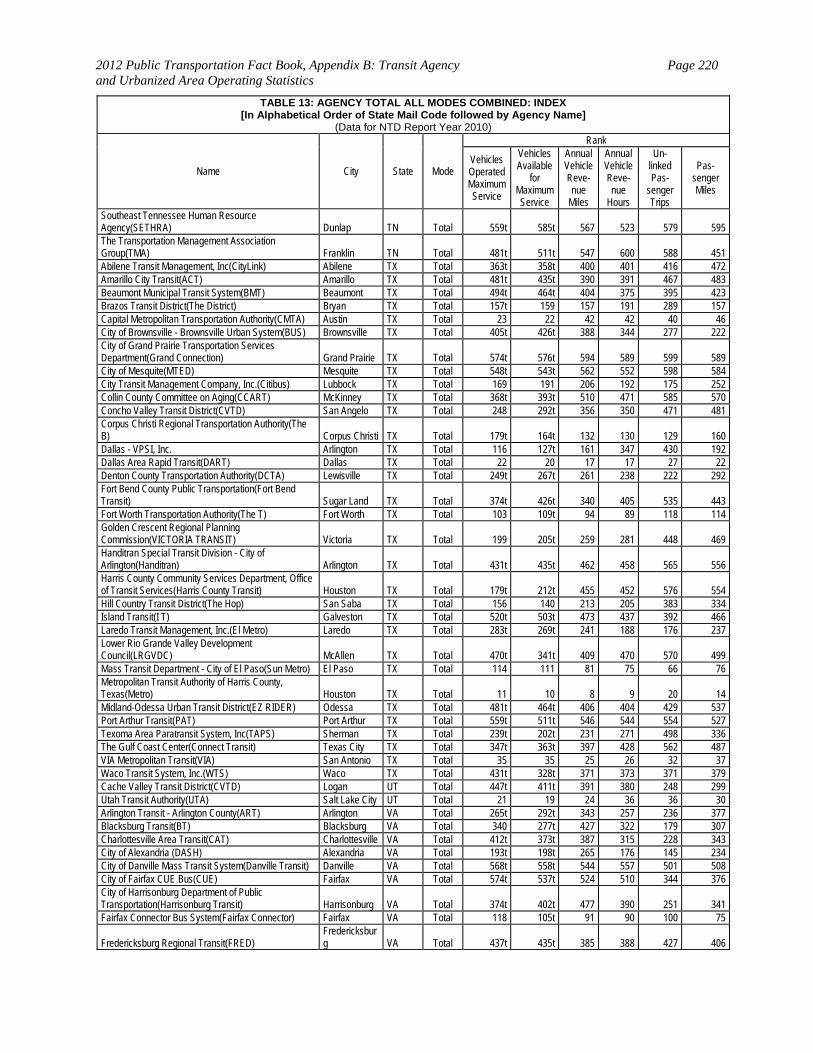
2012 Public Transportation Fact Book, Appendix B: Transit Agency and Urbanized Area Operating Statistics
Page 220
TABLE 13: AGENCY TOTAL ALL MODES COMBINED: INDEX [In Alphabetical Order of State Mail Code followed by Agency Name]
(Data for NTD Report Year 2010)
Name City State Mode
Rank
Vehicles Operated Maximum Service
Vehicles Available
for Maximum Service
Annual Vehicle Reve-nue
Miles
Annual Vehicle Reve-nue
Hours
Un-linked Pas-
senger Trips
Pas-senger Miles
Southeast Tennessee Human Resource Agency(SETHRA) Dunlap TN Total 559t 585t 567 523 579 595 The Transportation Management Association Group(TMA) Franklin TN Total 481t 511t 547 600 588 451 Abilene Transit Management, Inc(CityLink) Abilene TX Total 363t 358t 400 401 416 472 Amarillo City Transit(ACT) Amarillo TX Total 481t 435t 390 391 467 483 Beaumont Municipal Transit System(BMT) Beaumont TX Total 494t 464t 404 375 395 423 Brazos Transit District(The District) Bryan TX Total 157t 159 157 191 289 157 Capital Metropolitan Transportation Authority(CMTA) Austin TX Total 23 22 42 42 40 46 City of Brownsville - Brownsville Urban System(BUS) Brownsville TX Total 405t 426t 388 344 277 222 City of Grand Prairie Transportation Services Department(Grand Connection) Grand Prairie TX Total 574t 576t 594 589 599 589 City of Mesquite(MTED) Mesquite TX Total 548t 543t 562 552 598 584 City Transit Management Company, Inc.(Citibus) Lubbock TX Total 169 191 206 192 175 252 Collin County Committee on Aging(CCART) McKinney TX Total 368t 393t 510 471 585 570 Concho Valley Transit District(CVTD) San Angelo TX Total 248 292t 356 350 471 481 Corpus Christi Regional Transportation Authority(The B) Corpus Christi TX Total 179t 164t 132 130 129 160 Dallas - VPSI, Inc. Arlington TX Total 116 127t 161 347 430 192 Dallas Area Rapid Transit(DART) Dallas TX Total 22 20 17 17 27 22 Denton County Transportation Authority(DCTA) Lewisville TX Total 249t 267t 261 238 222 292 Fort Bend County Public Transportation(Fort Bend Transit) Sugar Land TX Total 374t 426t 340 405 535 443 Fort Worth Transportation Authority(The T) Fort Worth TX Total 103 109t 94 89 118 114 Golden Crescent Regional Planning Commission(VICTORIA TRANSIT) Victoria TX Total 199 205t 259 281 448 469 Handitran Special Transit Division - City of Arlington(Handitran) Arlington TX Total 431t 435t 462 458 565 556 Harris County Community Services Department, Office of Transit Services(Harris County Transit) Houston TX Total 179t 212t 455 452 576 554 Hill Country Transit District(The Hop) San Saba TX Total 156 140 213 205 383 334 Island Transit(I T) Galveston TX Total 520t 503t 473 437 392 466 Laredo Transit Management, Inc.(El Metro) Laredo TX Total 283t 269t 241 188 176 237 Lower Rio Grande Valley Development Council(LRGVDC) McAllen TX Total 470t 341t 409 470 570 499 Mass Transit Department - City of El Paso(Sun Metro) El Paso TX Total 114 111 81 75 66 76 Metropolitan Transit Authority of Harris County, Texas(Metro) Houston TX Total 11 10 8 9 20 14 Midland-Odessa Urban Transit District(EZ RIDER) Odessa TX Total 481t 464t 406 404 429 537 Port Arthur Transit(PAT) Port Arthur TX Total 559t 511t 546 544 554 527 Texoma Area Paratransit System, Inc(TAPS) Sherman TX Total 239t 202t 231 271 498 336 The Gulf Coast Center(Connect Transit) Texas City TX Total 347t 363t 397 428 562 487 VIA Metropolitan Transit(VIA) San Antonio TX Total 35 35 25 26 32 37 Waco Transit System, Inc.(WTS) Waco TX Total 431t 328t 371 373 371 379 Cache Valley Transit District(CVTD) Logan UT Total 447t 411t 391 380 248 299 Utah Transit Authority(UTA) Salt Lake City UT Total 21 19 24 36 36 30 Arlington Transit - Arlington County(ART) Arlington VA Total 265t 292t 343 257 236 377 Blacksburg Transit(BT) Blacksburg VA Total 340 277t 427 322 179 307 Charlottesville Area Transit(CAT) Charlottesville VA Total 412t 373t 387 315 228 343 City of Alexandria (DASH) Alexandria VA Total 193t 198t 265 176 145 234 City of Danville Mass Transit System(Danville Transit) Danville VA Total 568t 558t 544 557 501 508 City of Fairfax CUE Bus(CUE) Fairfax VA Total 574t 537t 524 510 344 376 City of Harrisonburg Department of Public Transportation(Harrisonburg Transit) Harrisonburg VA Total 374t 402t 477 390 251 341 Fairfax Connector Bus System(Fairfax Connector) Fairfax VA Total 118 105t 91 90 100 75
Fredericksburg Regional Transit(FRED) Fredericksburg VA Total 437t 435t 385 388 427 406
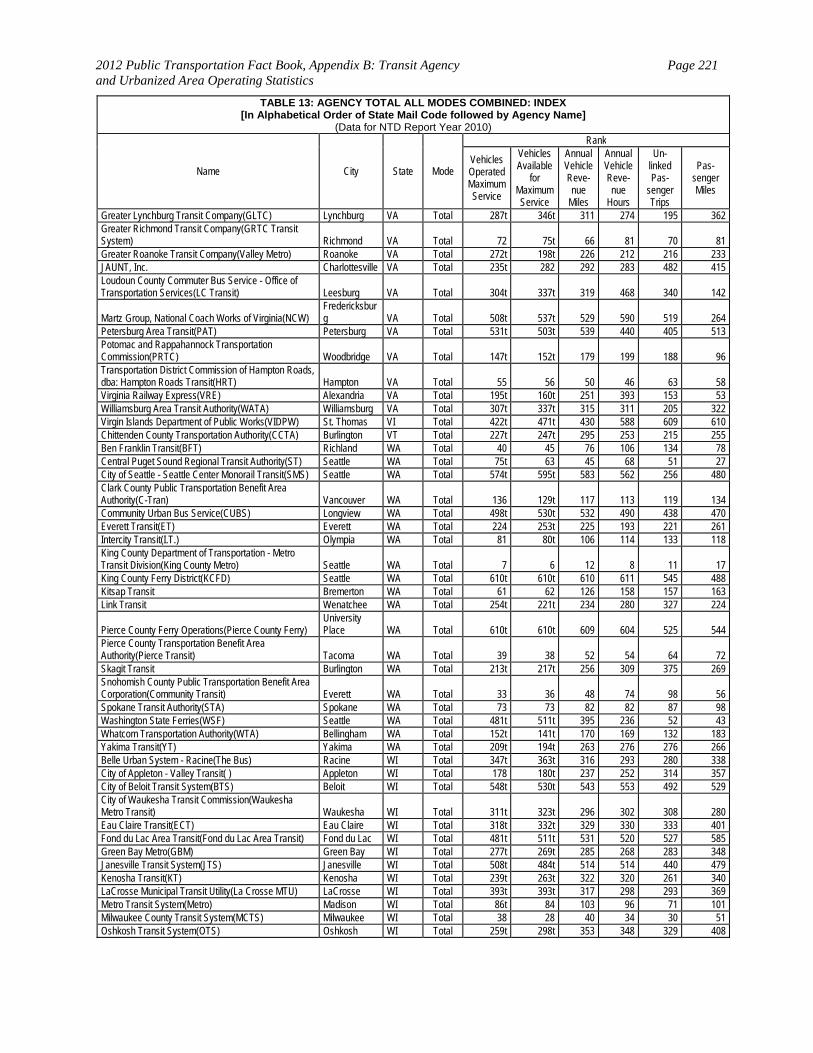
2012 Public Transportation Fact Book, Appendix B: Transit Agency and Urbanized Area Operating Statistics
Page 221
TABLE 13: AGENCY TOTAL ALL MODES COMBINED: INDEX [In Alphabetical Order of State Mail Code followed by Agency Name]
(Data for NTD Report Year 2010)
Name City State Mode
Rank
Vehicles Operated Maximum Service
Vehicles Available
for Maximum Service
Annual Vehicle Reve-nue
Miles
Annual Vehicle Reve-nue
Hours
Un-linked Pas-
senger Trips
Pas-senger Miles
Greater Lynchburg Transit Company(GLTC) Lynchburg VA Total 287t 346t 311 274 195 362 Greater Richmond Transit Company(GRTC Transit System) Richmond VA Total 72 75t 66 81 70 81 Greater Roanoke Transit Company(Valley Metro) Roanoke VA Total 272t 198t 226 212 216 233 JAUNT, Inc. Charlottesville VA Total 235t 282 292 283 482 415 Loudoun County Commuter Bus Service - Office of Transportation Services(LC Transit) Leesburg VA Total 304t 337t 319 468 340 142
Martz Group, National Coach Works of Virginia(NCW) Fredericksburg VA Total 508t 537t 529 590 519 264
Petersburg Area Transit(PAT) Petersburg VA Total 531t 503t 539 440 405 513 Potomac and Rappahannock Transportation Commission(PRTC) Woodbridge VA Total 147t 152t 179 199 188 96 Transportation District Commission of Hampton Roads, dba: Hampton Roads Transit(HRT) Hampton VA Total 55 56 50 46 63 58 Virginia Railway Express(VRE) Alexandria VA Total 195t 160t 251 393 153 53 Williamsburg Area Transit Authority(WATA) Williamsburg VA Total 307t 337t 315 311 205 322 Virgin Islands Department of Public Works(VIDPW) St. Thomas VI Total 422t 471t 430 588 609 610 Chittenden County Transportation Authority(CCTA) Burlington VT Total 227t 247t 295 253 215 255 Ben Franklin Transit(BFT) Richland WA Total 40 45 76 106 134 78 Central Puget Sound Regional Transit Authority(ST) Seattle WA Total 75t 63 45 68 51 27 City of Seattle - Seattle Center Monorail Transit(SMS) Seattle WA Total 574t 595t 583 562 256 480 Clark County Public Transportation Benefit Area Authority(C-Tran) Vancouver WA Total 136 129t 117 113 119 134 Community Urban Bus Service(CUBS) Longview WA Total 498t 530t 532 490 438 470 Everett Transit(ET) Everett WA Total 224 253t 225 193 221 261 Intercity Transit(I.T.) Olympia WA Total 81 80t 106 114 133 118 King County Department of Transportation - Metro Transit Division(King County Metro) Seattle WA Total 7 6 12 8 11 17 King County Ferry District(KCFD) Seattle WA Total 610t 610t 610 611 545 488 Kitsap Transit Bremerton WA Total 61 62 126 158 157 163 Link Transit Wenatchee WA Total 254t 221t 234 280 327 224
Pierce County Ferry Operations(Pierce County Ferry) University Place WA Total 610t 610t 609 604 525 544
Pierce County Transportation Benefit Area Authority(Pierce Transit) Tacoma WA Total 39 38 52 54 64 72 Skagit Transit Burlington WA Total 213t 217t 256 309 375 269 Snohomish County Public Transportation Benefit Area Corporation(Community Transit) Everett WA Total 33 36 48 74 98 56 Spokane Transit Authority(STA) Spokane WA Total 73 73 82 82 87 98 Washington State Ferries(WSF) Seattle WA Total 481t 511t 395 236 52 43 Whatcom Transportation Authority(WTA) Bellingham WA Total 152t 141t 170 169 132 183 Yakima Transit(YT) Yakima WA Total 209t 194t 263 276 276 266 Belle Urban System - Racine(The Bus) Racine WI Total 347t 363t 316 293 280 338 City of Appleton - Valley Transit( ) Appleton WI Total 178 180t 237 252 314 357 City of Beloit Transit System(BTS) Beloit WI Total 548t 530t 543 553 492 529 City of Waukesha Transit Commission(Waukesha Metro Transit) Waukesha WI Total 311t 323t 296 302 308 280 Eau Claire Transit(ECT) Eau Claire WI Total 318t 332t 329 330 333 401 Fond du Lac Area Transit(Fond du Lac Area Transit) Fond du Lac WI Total 481t 511t 531 520 527 585 Green Bay Metro(GBM) Green Bay WI Total 277t 269t 285 268 283 348 Janesville Transit System(JTS) Janesville WI Total 508t 484t 514 514 440 479 Kenosha Transit(KT) Kenosha WI Total 239t 263t 322 320 261 340 LaCrosse Municipal Transit Utility(La Crosse MTU) LaCrosse WI Total 393t 393t 317 298 293 369 Metro Transit System(Metro) Madison WI Total 86t 84 103 96 71 101 Milwaukee County Transit System(MCTS) Milwaukee WI Total 38 28 40 34 30 51 Oshkosh Transit System(OTS) Oshkosh WI Total 259t 298t 353 348 329 408
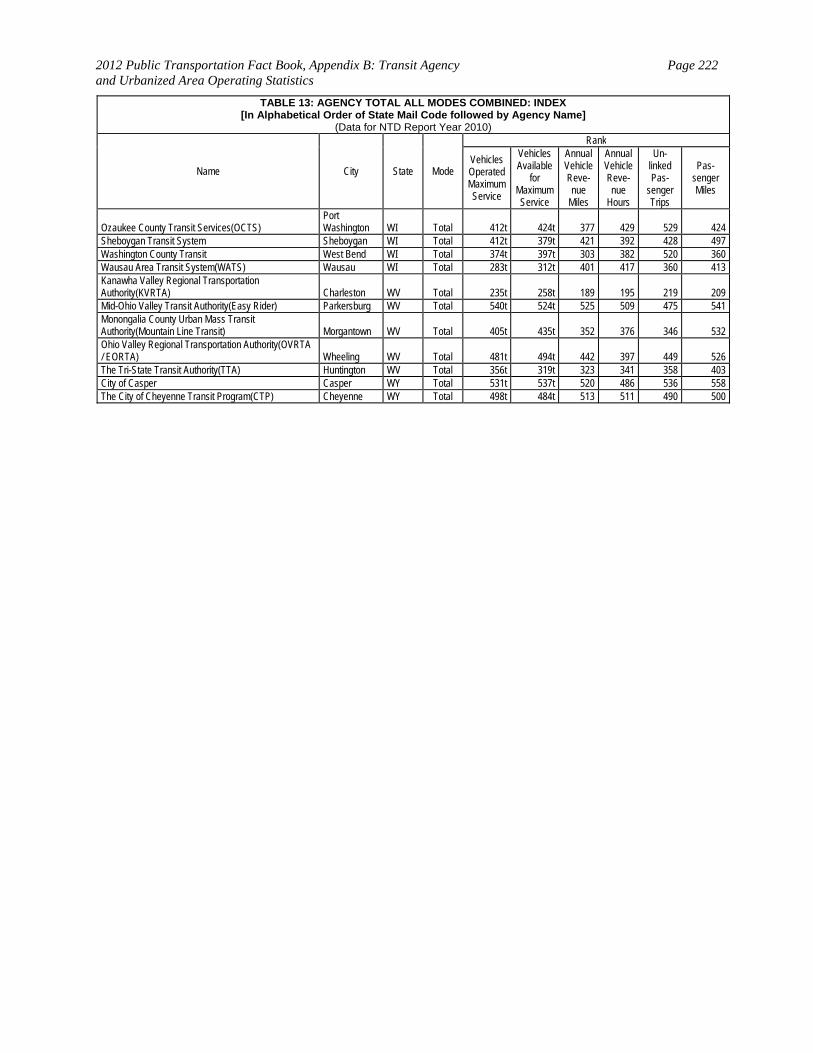
2012 Public Transportation Fact Book, Appendix B: Transit Agency and Urbanized Area Operating Statistics
Page 222
TABLE 13: AGENCY TOTAL ALL MODES COMBINED: INDEX [In Alphabetical Order of State Mail Code followed by Agency Name]
(Data for NTD Report Year 2010)
Name City State Mode
Rank
Vehicles Operated Maximum Service
Vehicles Available
for Maximum Service
Annual Vehicle Reve-nue
Miles
Annual Vehicle Reve-nue
Hours
Un-linked Pas-
senger Trips
Pas-senger Miles
Ozaukee County Transit Services(OCTS) Port Washington WI Total 412t 424t 377 429 529 424
Sheboygan Transit System Sheboygan WI Total 412t 379t 421 392 428 497 Washington County Transit West Bend WI Total 374t 397t 303 382 520 360 Wausau Area Transit System(WATS) Wausau WI Total 283t 312t 401 417 360 413 Kanawha Valley Regional Transportation Authority(KVRTA) Charleston WV Total 235t 258t 189 195 219 209 Mid-Ohio Valley Transit Authority(Easy Rider) Parkersburg WV Total 540t 524t 525 509 475 541 Monongalia County Urban Mass Transit Authority(Mountain Line Transit) Morgantown WV Total 405t 435t 352 376 346 532 Ohio Valley Regional Transportation Authority(OVRTA / EORTA) Wheeling WV Total 481t 494t 442 397 449 526 The Tri-State Transit Authority(TTA) Huntington WV Total 356t 319t 323 341 358 403 City of Casper Casper WY Total 531t 537t 520 486 536 558 The City of Cheyenne Transit Program(CTP) Cheyenne WY Total 498t 484t 513 511 490 500

2012 Public Transportation Fact Book, Appendix B: Transit Agency and Urbanized Area Operating Statistics
Page 223
TABLE 14: AGENCY MODAL DATA: INDEX[In Alphabetical Order by Mode followed by State Mail Code and Agency Name]
(Data for NTD Report Year 2010)
Name City State Mode
Rank
Vehicles Operated Maximum Service
Vehicles Available
for Maximum Service
Annual Vehicle Reve-nue
Miles
Annual Vehicle Reve-nue
Hours
Un-linked Pas-
senger Trips
Pas-senger Miles
Automated Guideway Transit Jacksonville Transportation Authority(JTA) Jacksonville FL AG 3 3 3 3 3 3 Miami-Dade Transit(MDT) Miami FL AG 1 1 1 1 1 1 Detroit Transportation Corporation(Detroit People Mover) Detroit MI AG 2 2 2 2 2 2
Alaska Railroad Alaska Railroad Corporation (ARRC) Anchorage AK AR 1 1 1 1 1 1
Cable Car San Francisco Municipal Railway (MUNI) San Francisco CA CC 1 1 1 1 1 1
Commuter Railroad Altamont Commuter Express(ACE) Stockton CA CR 20 20t 21 21 19 20 North County Transit District(NCTD) Oceanside CA CR 17 17t 19 19 16 19 Peninsula Corridor Joint Powers Board(PCJPB) San Carlos CA CR 9 10 8 8 8 8 Southern California Regional Rail Authority(Metrolink) Los Angeles CA CR 7 7 7 7 7 7 Connecticut Department of Transportation(CDOT) Newington CT CR 16 13 20 20 20 22 South Florida Regional Transportation Authority(TRI-Rail) Pompano Beach FL CR 14t 14 11 10 12 11 Northeast Illinois Regional Commuter Railroad Corporation(Metra) Chicago IL CR 3 3 4 4 4 4 Northern Indiana Commuter Transportation District(NICTD) Chesterton IN CR 11 11 10 11 11 12 Massachusetts Bay Transportation Authority(MBTA) Boston MA CR 5 5 5 5 5 5 Maryland Transit Administration(MTA) Baltimore MD CR 8 8 9 9 9 9 Northern New England Passenger Rail Authority(NNEPRA) Portland ME CR 22 22 14 14 22 17 Metro Transit Minneapolis MN CR 19 20t 22 22 18 21 New Jersey Transit Corporation(NJ TRANSIT) Newark NJ CR 1 1 1 2 2 2 Rio Metro Regional Transit District(RMRTD) Albuquerque NM CR 18 19 16 16 17 14 Metro-North Commuter Railroad Company, dba: MTA Metro-North Railroad(MTA-MNCR) New York NY CR 2 4 3 3 3 3 MTA Long Island Rail Road(MTA LIRR) Jamaica NY CR 4 2 2 1 1 1 Tri-County Metropolitan Transportation District of Oregon(TriMet) Portland OR CR 24t 25 24 23 23 24 Pennsylvania Department of Transportation(PENNDOT) Harrisburg PA CR 21 16 12 18 21 16 Southeastern Pennsylvania Transportation Authority(SEPTA) Philadelphia PA CR 6 6 6 6 6 6 Regional Transportation Authority(RTA) Nashville TN CR 23 23 23 24 24 23 Capital Metropolitan Transportation Authority(CMTA) Austin TX CR 24t 24 25 25 25 25 Dallas Area Rapid Transit(DART) Dallas TX CR 13 15 18 15 14 15 Utah Transit Authority(UTA) Salt Lake City UT CR 14t 17t 13 12 15 18 Virginia Railway Express(VRE) Alexandria VA CR 10 9 15 13 10 10 Central Puget Sound Regional Transit Authority(ST) Seattle WA CR 12 12 17 17 13 13
Demand Responsive Paratransit Fairbanks North Star Borough Transit(MACS) Fairbanks AK DR 381t 415t 371 376 403 374 Municipality of Anchorage - Public Transportation Department(People Mover) Anchorage AK DR 123t 134t 121 107 109 131 Lee-Russell Council of Governments(LRCOG) Opelika AL DR 262t 225t 274 306 272 289 Birmingham-Jefferson County Transit Authority(MAX) Birmingham AL DR 169t 182t 134 126 166 176 City of Huntsville, Alabama - Public Transportation Division Huntsville AL DR 262t 225t 245 234 224 198 City of Montgomery-Montgomery Area Transit System(MATS) Montgomery AL DR 342t 351t 268 309 308 269 Morgan County Area Transportation System(MCATS) Decatur AL DR 152t 195t 198 203 104 232 Northwest Alabama Council of Local Governments(NACOLG) Muscle Shoals AL DR 107t 116t 202 177 62 148 The Wave Transit System(WTS) Mobile AL DR 176t 204t 170 152 178 170 Tuscaloosa County Parking and Transit Authority(TMT) Tuscaloosa AL DR 401t 415t 409 405 437 424 Wiregrass Transit Authority Dothan AL DR 152t 155t 137 124 130 160 Central Arkansas Transit Authority(CATA) North Little Rock AR DR 213t 248t 187 224 247 225 Fort Smith Transit(FST) Fort Smith AR DR 427t 351t 346 347 358t 329
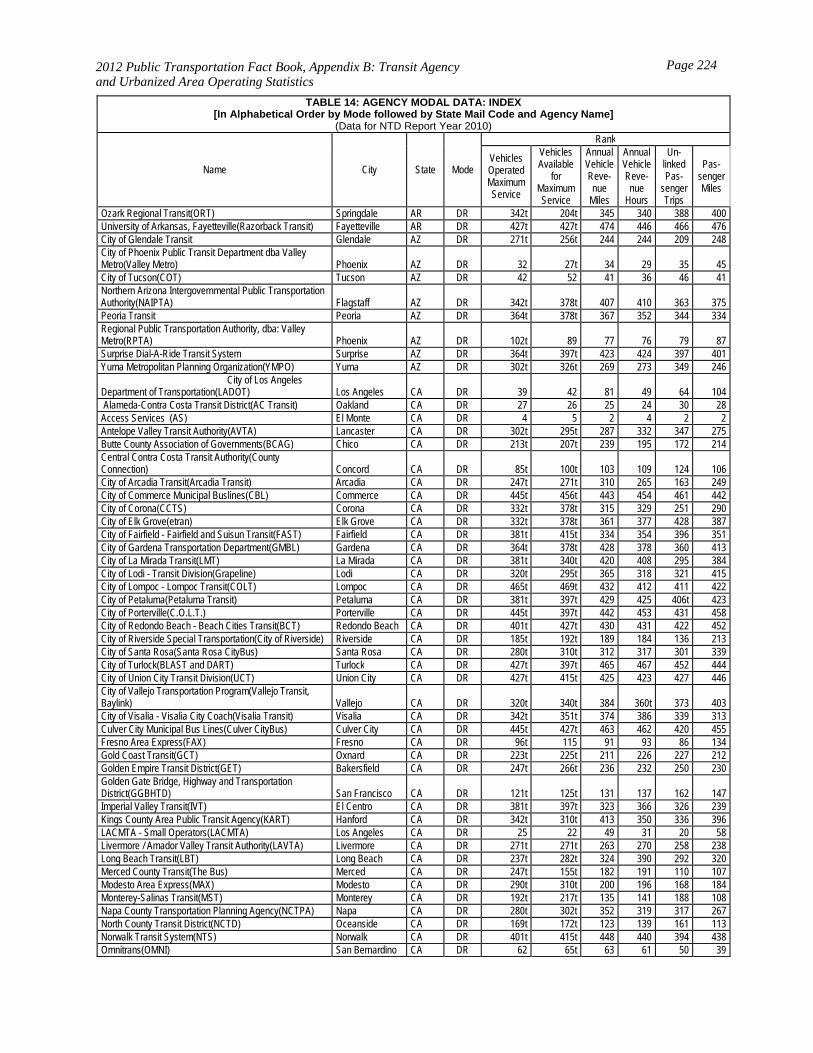
2012 Public Transportation Fact Book, Appendix B: Transit Agency and Urbanized Area Operating Statistics
Page 224
TABLE 14: AGENCY MODAL DATA: INDEX[In Alphabetical Order by Mode followed by State Mail Code and Agency Name]
(Data for NTD Report Year 2010)
Name City State Mode
Rank
Vehicles Operated Maximum Service
Vehicles Available
for Maximum Service
Annual Vehicle Reve-nue
Miles
Annual Vehicle Reve-nue
Hours
Un-linked Pas-
senger Trips
Pas-senger Miles
Ozark Regional Transit(ORT) Springdale AR DR 342t 204t 345 340 388 400 University of Arkansas, Fayetteville(Razorback Transit) Fayetteville AR DR 427t 427t 474 446 466 476 City of Glendale Transit Glendale AZ DR 271t 256t 244 244 209 248 City of Phoenix Public Transit Department dba Valley Metro(Valley Metro) Phoenix AZ DR 32 27t 34 29 35 45 City of Tucson(COT) Tucson AZ DR 42 52 41 36 46 41 Northern Arizona Intergovernmental Public Transportation Authority(NAIPTA) Flagstaff AZ DR 342t 378t 407 410 363 375 Peoria Transit Peoria AZ DR 364t 378t 367 352 344 334 Regional Public Transportation Authority, dba: Valley Metro(RPTA) Phoenix AZ DR 102t 89 77 76 79 87 Surprise Dial-A-Ride Transit System Surprise AZ DR 364t 397t 423 424 397 401 Yuma Metropolitan Planning Organization(YMPO) Yuma AZ DR 302t 326t 269 273 349 246 City of Los Angeles Department of Transportation(LADOT) Los Angeles CA DR 39 42 81 49 64 104 Alameda-Contra Costa Transit District(AC Transit) Oakland CA DR 27 26 25 24 30 28 Access Services (AS) El Monte CA DR 4 5 2 4 2 2 Antelope Valley Transit Authority(AVTA) Lancaster CA DR 302t 295t 287 332 347 275 Butte County Association of Governments(BCAG) Chico CA DR 213t 207t 239 195 172 214 Central Contra Costa Transit Authority(County Connection) Concord CA DR 85t 100t 103 109 124 106 City of Arcadia Transit(Arcadia Transit) Arcadia CA DR 247t 271t 310 265 163 249 City of Commerce Municipal Buslines(CBL) Commerce CA DR 445t 456t 443 454 461 442 City of Corona(CCTS) Corona CA DR 332t 378t 315 329 251 290 City of Elk Grove(etran) Elk Grove CA DR 332t 378t 361 377 428 387 City of Fairfield - Fairfield and Suisun Transit(FAST) Fairfield CA DR 381t 415t 334 354 396 351 City of Gardena Transportation Department(GMBL) Gardena CA DR 364t 378t 428 378 360 413 City of La Mirada Transit(LMT) La Mirada CA DR 381t 340t 420 408 295 384 City of Lodi - Transit Division(Grapeline) Lodi CA DR 320t 295t 365 318 321 415 City of Lompoc - Lompoc Transit(COLT) Lompoc CA DR 465t 469t 432 412 411 422 City of Petaluma(Petaluma Transit) Petaluma CA DR 381t 397t 429 425 406t 423 City of Porterville(C.O.L.T.) Porterville CA DR 445t 397t 442 453 431 458 City of Redondo Beach - Beach Cities Transit(BCT) Redondo Beach CA DR 401t 427t 430 431 422 452 City of Riverside Special Transportation(City of Riverside) Riverside CA DR 185t 192t 189 184 136 213 City of Santa Rosa(Santa Rosa CityBus) Santa Rosa CA DR 280t 310t 312 317 301 339 City of Turlock(BLAST and DART) Turlock CA DR 427t 397t 465 467 452 444 City of Union City Transit Division(UCT) Union City CA DR 427t 415t 425 423 427 446 City of Vallejo Transportation Program(Vallejo Transit, Baylink) Vallejo CA DR 320t 340t 384 360t 373 403 City of Visalia - Visalia City Coach(Visalia Transit) Visalia CA DR 342t 351t 374 386 339 313 Culver City Municipal Bus Lines(Culver CityBus) Culver City CA DR 445t 427t 463 462 420 455 Fresno Area Express(FAX) Fresno CA DR 96t 115 91 93 86 134 Gold Coast Transit(GCT) Oxnard CA DR 223t 225t 211 226 227 212 Golden Empire Transit District(GET) Bakersfield CA DR 247t 266t 236 232 250 230 Golden Gate Bridge, Highway and Transportation District(GGBHTD) San Francisco CA DR 121t 125t 131 137 162 147 Imperial Valley Transit(IVT) El Centro CA DR 381t 397t 323 366 326 239 Kings County Area Public Transit Agency(KART) Hanford CA DR 342t 310t 413 350 336 396 LACMTA - Small Operators(LACMTA) Los Angeles CA DR 25 22 49 31 20 58 Livermore / Amador Valley Transit Authority(LAVTA) Livermore CA DR 271t 271t 263 270 258 238 Long Beach Transit(LBT) Long Beach CA DR 237t 282t 324 390 292 320 Merced County Transit(The Bus) Merced CA DR 247t 155t 182 191 110 107 Modesto Area Express(MAX) Modesto CA DR 290t 310t 200 196 168 184 Monterey-Salinas Transit(MST) Monterey CA DR 192t 217t 135 141 188 108 Napa County Transportation Planning Agency(NCTPA) Napa CA DR 280t 302t 352 319 317 267 North County Transit District(NCTD) Oceanside CA DR 169t 172t 123 139 161 113 Norwalk Transit System(NTS) Norwalk CA DR 401t 415t 448 440 394 438 Omnitrans(OMNI) San Bernardino CA DR 62 65t 63 61 50 39
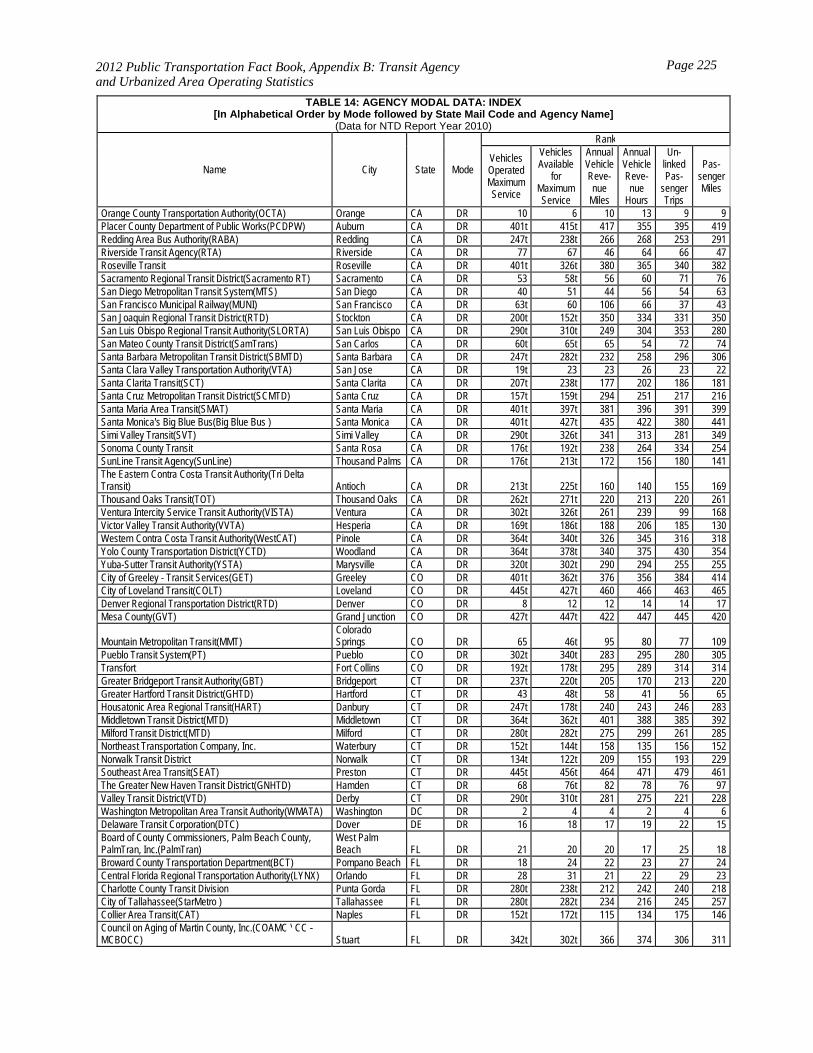
2012 Public Transportation Fact Book, Appendix B: Transit Agency and Urbanized Area Operating Statistics
Page 225
TABLE 14: AGENCY MODAL DATA: INDEX[In Alphabetical Order by Mode followed by State Mail Code and Agency Name]
(Data for NTD Report Year 2010)
Name City State Mode
Rank
Vehicles Operated Maximum Service
Vehicles Available
for Maximum Service
Annual Vehicle Reve-nue
Miles
Annual Vehicle Reve-nue
Hours
Un-linked Pas-
senger Trips
Pas-senger Miles
Orange County Transportation Authority(OCTA) Orange CA DR 10 6 10 13 9 9 Placer County Department of Public Works(PCDPW) Auburn CA DR 401t 415t 417 355 395 419 Redding Area Bus Authority(RABA) Redding CA DR 247t 238t 266 268 253 291 Riverside Transit Agency(RTA) Riverside CA DR 77 67 46 64 66 47 Roseville Transit Roseville CA DR 401t 326t 380 365 340 382 Sacramento Regional Transit District(Sacramento RT) Sacramento CA DR 53 58t 56 60 71 76 San Diego Metropolitan Transit System(MTS) San Diego CA DR 40 51 44 56 54 63 San Francisco Municipal Railway(MUNI) San Francisco CA DR 63t 60 106 66 37 43 San Joaquin Regional Transit District(RTD) Stockton CA DR 200t 152t 350 334 331 350 San Luis Obispo Regional Transit Authority(SLORTA) San Luis Obispo CA DR 290t 310t 249 304 353 280 San Mateo County Transit District(SamTrans) San Carlos CA DR 60t 65t 65 54 72 74 Santa Barbara Metropolitan Transit District(SBMTD) Santa Barbara CA DR 247t 282t 232 258 296 306 Santa Clara Valley Transportation Authority(VTA) San Jose CA DR 19t 23 23 26 23 22 Santa Clarita Transit(SCT) Santa Clarita CA DR 207t 238t 177 202 186 181 Santa Cruz Metropolitan Transit District(SCMTD) Santa Cruz CA DR 157t 159t 294 251 217 216 Santa Maria Area Transit(SMAT) Santa Maria CA DR 401t 397t 381 396 391 399 Santa Monica's Big Blue Bus(Big Blue Bus ) Santa Monica CA DR 401t 427t 435 422 380 441 Simi Valley Transit(SVT) Simi Valley CA DR 290t 326t 341 313 281 349 Sonoma County Transit Santa Rosa CA DR 176t 192t 238 264 334 254 SunLine Transit Agency(SunLine) Thousand Palms CA DR 176t 213t 172 156 180 141 The Eastern Contra Costa Transit Authority(Tri Delta Transit) Antioch CA DR 213t 225t 160 140 155 169 Thousand Oaks Transit(TOT) Thousand Oaks CA DR 262t 271t 220 213 220 261 Ventura Intercity Service Transit Authority(VISTA) Ventura CA DR 302t 326t 261 239 99 168 Victor Valley Transit Authority(VVTA) Hesperia CA DR 169t 186t 188 206 185 130 Western Contra Costa Transit Authority(WestCAT) Pinole CA DR 364t 340t 326 345 316 318 Yolo County Transportation District(YCTD) Woodland CA DR 364t 378t 340 375 430 354 Yuba-Sutter Transit Authority(YSTA) Marysville CA DR 320t 302t 290 294 255 255 City of Greeley - Transit Services(GET) Greeley CO DR 401t 362t 376 356 384 414 City of Loveland Transit(COLT) Loveland CO DR 445t 427t 460 466 463 465 Denver Regional Transportation District(RTD) Denver CO DR 8 12 12 14 14 17 Mesa County(GVT) Grand Junction CO DR 427t 447t 422 447 445 420
Mountain Metropolitan Transit(MMT) Colorado Springs CO DR 65 46t 95 80 77 109
Pueblo Transit System(PT) Pueblo CO DR 302t 340t 283 295 280 305 Transfort Fort Collins CO DR 192t 178t 295 289 314 314 Greater Bridgeport Transit Authority(GBT) Bridgeport CT DR 237t 220t 205 170 213 220 Greater Hartford Transit District(GHTD) Hartford CT DR 43 48t 58 41 56 65 Housatonic Area Regional Transit(HART) Danbury CT DR 247t 178t 240 243 246 283 Middletown Transit District(MTD) Middletown CT DR 364t 362t 401 388 385 392 Milford Transit District(MTD) Milford CT DR 280t 282t 275 299 261 285 Northeast Transportation Company, Inc. Waterbury CT DR 152t 144t 158 135 156 152 Norwalk Transit District Norwalk CT DR 134t 122t 209 155 193 229 Southeast Area Transit(SEAT) Preston CT DR 445t 456t 464 471 479 461 The Greater New Haven Transit District(GNHTD) Hamden CT DR 68 76t 82 78 76 97 Valley Transit District(VTD) Derby CT DR 290t 310t 281 275 221 228 Washington Metropolitan Area Transit Authority(WMATA) Washington DC DR 2 4 4 2 4 6 Delaware Transit Corporation(DTC) Dover DE DR 16 18 17 19 22 15 Board of County Commissioners, Palm Beach County, PalmTran, Inc.(PalmTran)
West Palm Beach FL DR 21 20 20 17 25 18
Broward County Transportation Department(BCT) Pompano Beach FL DR 18 24 22 23 27 24 Central Florida Regional Transportation Authority(LYNX) Orlando FL DR 28 31 21 22 29 23 Charlotte County Transit Division Punta Gorda FL DR 280t 238t 212 242 240 218 City of Tallahassee(StarMetro ) Tallahassee FL DR 280t 282t 234 216 245 257 Collier Area Transit(CAT) Naples FL DR 152t 172t 115 134 175 146 Council on Aging of Martin County, Inc.(COAMC \ CC - MCBOCC) Stuart FL DR 342t 302t 366 374 306 311
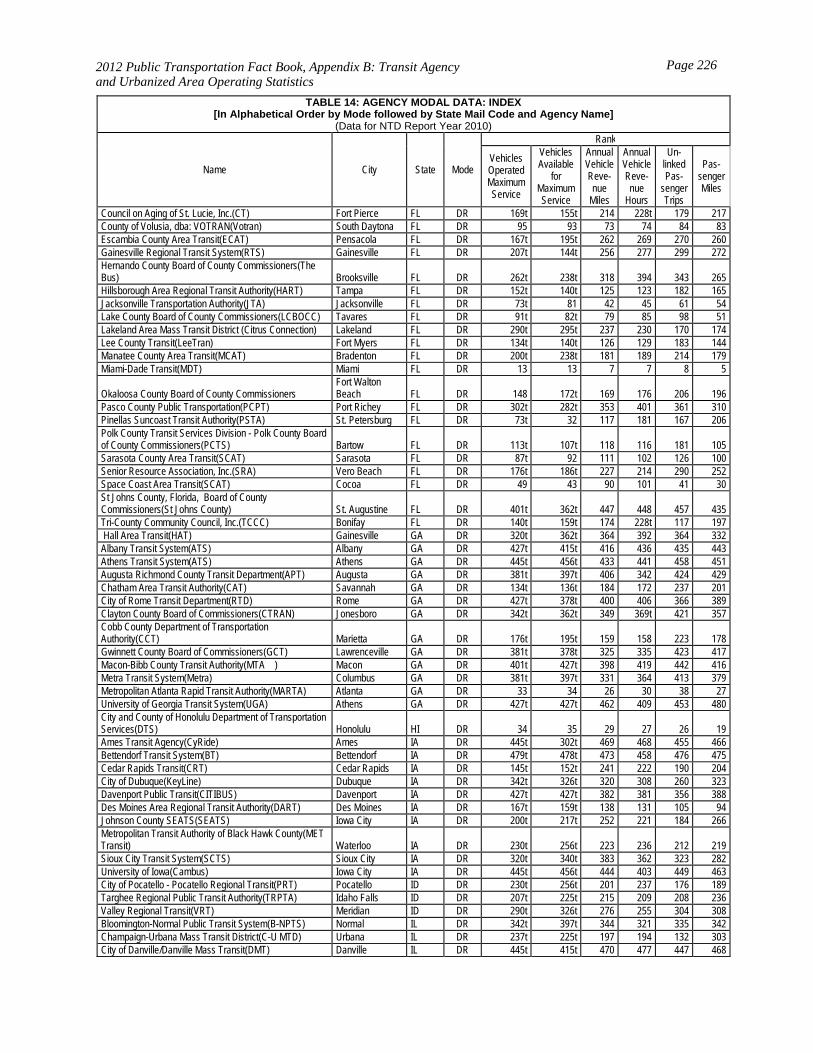
2012 Public Transportation Fact Book, Appendix B: Transit Agency and Urbanized Area Operating Statistics
Page 226
TABLE 14: AGENCY MODAL DATA: INDEX[In Alphabetical Order by Mode followed by State Mail Code and Agency Name]
(Data for NTD Report Year 2010)
Name City State Mode
Rank
Vehicles Operated Maximum Service
Vehicles Available
for Maximum Service
Annual Vehicle Reve-nue
Miles
Annual Vehicle Reve-nue
Hours
Un-linked Pas-
senger Trips
Pas-senger Miles
Council on Aging of St. Lucie, Inc.(CT) Fort Pierce FL DR 169t 155t 214 228t 179 217 County of Volusia, dba: VOTRAN(Votran) South Daytona FL DR 95 93 73 74 84 83 Escambia County Area Transit(ECAT) Pensacola FL DR 167t 195t 262 269 270 260 Gainesville Regional Transit System(RTS) Gainesville FL DR 207t 144t 256 277 299 272 Hernando County Board of County Commissioners(The Bus) Brooksville FL DR 262t 238t 318 394 343 265 Hillsborough Area Regional Transit Authority(HART) Tampa FL DR 152t 140t 125 123 182 165 Jacksonville Transportation Authority(JTA) Jacksonville FL DR 73t 81 42 45 61 54 Lake County Board of County Commissioners(LCBOCC) Tavares FL DR 91t 82t 79 85 98 51 Lakeland Area Mass Transit District (Citrus Connection) Lakeland FL DR 290t 295t 237 230 170 174 Lee County Transit(LeeTran) Fort Myers FL DR 134t 140t 126 129 183 144 Manatee County Area Transit(MCAT) Bradenton FL DR 200t 238t 181 189 214 179 Miami-Dade Transit(MDT) Miami FL DR 13 13 7 7 8 5
Okaloosa County Board of County Commissioners Fort Walton Beach FL DR 148 172t 169 176 206 196
Pasco County Public Transportation(PCPT) Port Richey FL DR 302t 282t 353 401 361 310 Pinellas Suncoast Transit Authority(PSTA) St. Petersburg FL DR 73t 32 117 181 167 206 Polk County Transit Services Division - Polk County Board of County Commissioners(PCTS) Bartow FL DR 113t 107t 118 116 181 105 Sarasota County Area Transit(SCAT) Sarasota FL DR 87t 92 111 102 126 100 Senior Resource Association, Inc.(SRA) Vero Beach FL DR 176t 186t 227 214 290 252 Space Coast Area Transit(SCAT) Cocoa FL DR 49 43 90 101 41 30 St Johns County, Florida, Board of County Commissioners(St Johns County) St. Augustine FL DR 401t 362t 447 448 457 435 Tri-County Community Council, Inc.(TCCC) Bonifay FL DR 140t 159t 174 228t 117 197 Hall Area Transit(HAT) Gainesville GA DR 320t 362t 364 392 364 332 Albany Transit System(ATS) Albany GA DR 427t 415t 416 436 435 443 Athens Transit System(ATS) Athens GA DR 445t 456t 433 441 458 451 Augusta Richmond County Transit Department(APT) Augusta GA DR 381t 397t 406 342 424 429 Chatham Area Transit Authority(CAT) Savannah GA DR 134t 136t 184 172 237 201 City of Rome Transit Department(RTD) Rome GA DR 427t 378t 400 406 366 389 Clayton County Board of Commissioners(CTRAN) Jonesboro GA DR 342t 362t 349 369t 421 357 Cobb County Department of Transportation Authority(CCT) Marietta GA DR 176t 195t 159 158 223 178 Gwinnett County Board of Commissioners(GCT) Lawrenceville GA DR 381t 378t 325 335 423 417 Macon-Bibb County Transit Authority(MTA ) Macon GA DR 401t 427t 398 419 442 416 Metra Transit System(Metra) Columbus GA DR 381t 397t 331 364 413 379 Metropolitan Atlanta Rapid Transit Authority(MARTA) Atlanta GA DR 33 34 26 30 38 27 University of Georgia Transit System(UGA) Athens GA DR 427t 427t 462 409 453 480 City and County of Honolulu Department of Transportation Services(DTS) Honolulu HI DR 34 35 29 27 26 19 Ames Transit Agency(CyRide) Ames IA DR 445t 302t 469 468 455 466 Bettendorf Transit System(BT) Bettendorf IA DR 479t 478t 473 458 476 475 Cedar Rapids Transit(CRT) Cedar Rapids IA DR 145t 152t 241 222 190 204 City of Dubuque(KeyLine) Dubuque IA DR 342t 326t 320 308 260 323 Davenport Public Transit(CITIBUS) Davenport IA DR 427t 427t 382 381 356 388 Des Moines Area Regional Transit Authority(DART) Des Moines IA DR 167t 159t 138 131 105 94 Johnson County SEATS(SEATS) Iowa City IA DR 200t 217t 252 221 184 266 Metropolitan Transit Authority of Black Hawk County(MET Transit) Waterloo IA DR 230t 256t 223 236 212 219 Sioux City Transit System(SCTS) Sioux City IA DR 320t 340t 383 362 323 282 University of Iowa(Cambus) Iowa City IA DR 445t 456t 444 403 449 463 City of Pocatello - Pocatello Regional Transit(PRT) Pocatello ID DR 230t 256t 201 237 176 189 Targhee Regional Public Transit Authority(TRPTA) Idaho Falls ID DR 207t 225t 215 209 208 236 Valley Regional Transit(VRT) Meridian ID DR 290t 326t 276 255 304 308 Bloomington-Normal Public Transit System(B-NPTS) Normal IL DR 342t 397t 344 321 335 342 Champaign-Urbana Mass Transit District(C-U MTD) Urbana IL DR 237t 225t 197 194 132 303 City of Danville/Danville Mass Transit(DMT) Danville IL DR 445t 415t 470 477 447 468
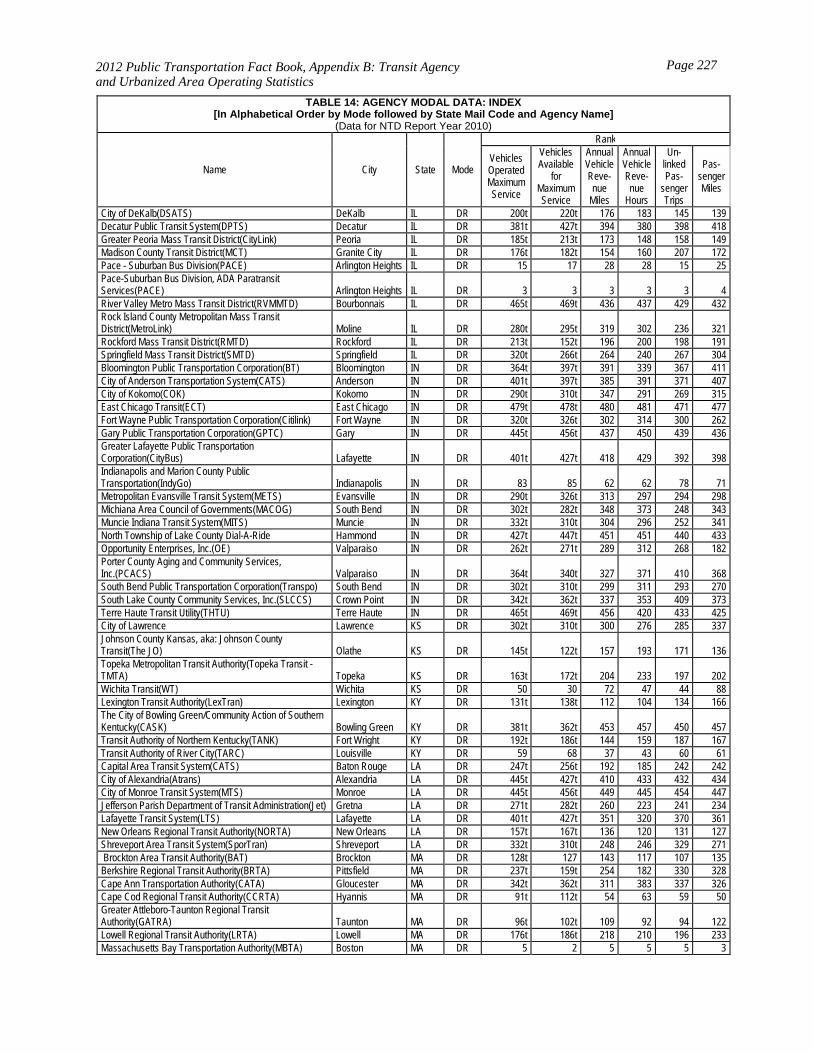
2012 Public Transportation Fact Book, Appendix B: Transit Agency and Urbanized Area Operating Statistics
Page 227
TABLE 14: AGENCY MODAL DATA: INDEX[In Alphabetical Order by Mode followed by State Mail Code and Agency Name]
(Data for NTD Report Year 2010)
Name City State Mode
Rank
Vehicles Operated Maximum Service
Vehicles Available
for Maximum Service
Annual Vehicle Reve-nue
Miles
Annual Vehicle Reve-nue
Hours
Un-linked Pas-
senger Trips
Pas-senger Miles
City of DeKalb(DSATS) DeKalb IL DR 200t 220t 176 183 145 139 Decatur Public Transit System(DPTS) Decatur IL DR 381t 427t 394 380 398 418 Greater Peoria Mass Transit District(CityLink) Peoria IL DR 185t 213t 173 148 158 149 Madison County Transit District(MCT) Granite City IL DR 176t 182t 154 160 207 172 Pace - Suburban Bus Division(PACE) Arlington Heights IL DR 15 17 28 28 15 25 Pace-Suburban Bus Division, ADA Paratransit Services(PACE) Arlington Heights IL DR 3 3 3 3 3 4 River Valley Metro Mass Transit District(RVMMTD) Bourbonnais IL DR 465t 469t 436 437 429 432 Rock Island County Metropolitan Mass Transit District(MetroLink) Moline IL DR 280t 295t 319 302 236 321 Rockford Mass Transit District(RMTD) Rockford IL DR 213t 152t 196 200 198 191 Springfield Mass Transit District(SMTD) Springfield IL DR 320t 266t 264 240 267 304 Bloomington Public Transportation Corporation(BT) Bloomington IN DR 364t 397t 391 339 367 411 City of Anderson Transportation System(CATS) Anderson IN DR 401t 397t 385 391 371 407 City of Kokomo(COK) Kokomo IN DR 290t 310t 347 291 269 315 East Chicago Transit(ECT) East Chicago IN DR 479t 478t 480 481 471 477 Fort Wayne Public Transportation Corporation(Citilink) Fort Wayne IN DR 320t 326t 302 314 300 262 Gary Public Transportation Corporation(GPTC) Gary IN DR 445t 456t 437 450 439 436 Greater Lafayette Public Transportation Corporation(CityBus) Lafayette IN DR 401t 427t 418 429 392 398 Indianapolis and Marion County Public Transportation(IndyGo) Indianapolis IN DR 83 85 62 62 78 71 Metropolitan Evansville Transit System(METS) Evansville IN DR 290t 326t 313 297 294 298 Michiana Area Council of Governments(MACOG) South Bend IN DR 302t 282t 348 373 248 343 Muncie Indiana Transit System(MITS) Muncie IN DR 332t 310t 304 296 252 341 North Township of Lake County Dial-A-Ride Hammond IN DR 427t 447t 451 451 440 433 Opportunity Enterprises, Inc.(OE) Valparaiso IN DR 262t 271t 289 312 268 182 Porter County Aging and Community Services, Inc.(PCACS) Valparaiso IN DR 364t 340t 327 371 410 368 South Bend Public Transportation Corporation(Transpo) South Bend IN DR 302t 310t 299 311 293 270 South Lake County Community Services, Inc.(SLCCS) Crown Point IN DR 342t 362t 337 353 409 373 Terre Haute Transit Utility(THTU) Terre Haute IN DR 465t 469t 456 420 433 425 City of Lawrence Lawrence KS DR 302t 310t 300 276 285 337 Johnson County Kansas, aka: Johnson County Transit(The JO) Olathe KS DR 145t 122t 157 193 171 136 Topeka Metropolitan Transit Authority(Topeka Transit - TMTA) Topeka KS DR 163t 172t 204 233 197 202 Wichita Transit(WT) Wichita KS DR 50 30 72 47 44 88 Lexington Transit Authority(LexTran) Lexington KY DR 131t 138t 112 104 134 166 The City of Bowling Green/Community Action of Southern Kentucky(CASK) Bowling Green KY DR 381t 362t 453 457 450 457 Transit Authority of Northern Kentucky(TANK) Fort Wright KY DR 192t 186t 144 159 187 167 Transit Authority of River City(TARC) Louisville KY DR 59 68 37 43 60 61 Capital Area Transit System(CATS) Baton Rouge LA DR 247t 256t 192 185 242 242 City of Alexandria(Atrans) Alexandria LA DR 445t 427t 410 433 432 434 City of Monroe Transit System(MTS) Monroe LA DR 445t 456t 449 445 454 447 Jefferson Parish Department of Transit Administration(Jet) Gretna LA DR 271t 282t 260 223 241 234 Lafayette Transit System(LTS) Lafayette LA DR 401t 427t 351 320 370 361 New Orleans Regional Transit Authority(NORTA) New Orleans LA DR 157t 167t 136 120 131 127 Shreveport Area Transit System(SporTran) Shreveport LA DR 332t 310t 248 246 329 271 Brockton Area Transit Authority(BAT) Brockton MA DR 128t 127 143 117 107 135 Berkshire Regional Transit Authority(BRTA) Pittsfield MA DR 237t 159t 254 182 330 328 Cape Ann Transportation Authority(CATA) Gloucester MA DR 342t 362t 311 383 337 326 Cape Cod Regional Transit Authority(CCRTA) Hyannis MA DR 91t 112t 54 63 59 50 Greater Attleboro-Taunton Regional Transit Authority(GATRA) Taunton MA DR 96t 102t 109 92 94 122 Lowell Regional Transit Authority(LRTA) Lowell MA DR 176t 186t 218 210 196 233 Massachusetts Bay Transportation Authority(MBTA) Boston MA DR 5 2 5 5 5 3
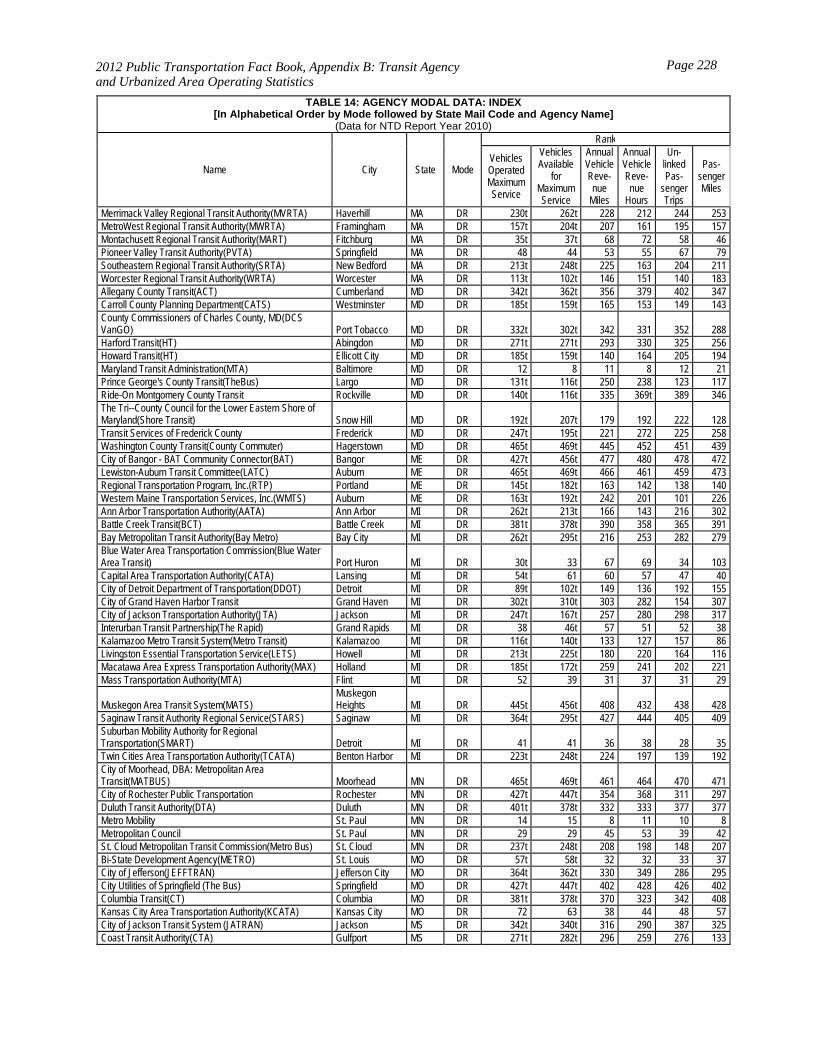
2012 Public Transportation Fact Book, Appendix B: Transit Agency and Urbanized Area Operating Statistics
Page 228
TABLE 14: AGENCY MODAL DATA: INDEX[In Alphabetical Order by Mode followed by State Mail Code and Agency Name]
(Data for NTD Report Year 2010)
Name City State Mode
Rank
Vehicles Operated Maximum Service
Vehicles Available
for Maximum Service
Annual Vehicle Reve-nue
Miles
Annual Vehicle Reve-nue
Hours
Un-linked Pas-
senger Trips
Pas-senger Miles
Merrimack Valley Regional Transit Authority(MVRTA) Haverhill MA DR 230t 262t 228 212 244 253 MetroWest Regional Transit Authority(MWRTA) Framingham MA DR 157t 204t 207 161 195 157 Montachusett Regional Transit Authority(MART) Fitchburg MA DR 35t 37t 68 72 58 46 Pioneer Valley Transit Authority(PVTA) Springfield MA DR 48 44 53 55 67 79 Southeastern Regional Transit Authority(SRTA) New Bedford MA DR 213t 248t 225 163 204 211 Worcester Regional Transit Authority(WRTA) Worcester MA DR 113t 102t 146 151 140 183 Allegany County Transit(ACT) Cumberland MD DR 342t 362t 356 379 402 347 Carroll County Planning Department(CATS) Westminster MD DR 185t 159t 165 153 149 143 County Commissioners of Charles County, MD(DCS VanGO) Port Tobacco MD DR 332t 302t 342 331 352 288 Harford Transit(HT) Abingdon MD DR 271t 271t 293 330 325 256 Howard Transit(HT) Ellicott City MD DR 185t 159t 140 164 205 194 Maryland Transit Administration(MTA) Baltimore MD DR 12 8 11 8 12 21 Prince George's County Transit(TheBus) Largo MD DR 131t 116t 250 238 123 117 Ride-On Montgomery County Transit Rockville MD DR 140t 116t 335 369t 389 346 The Tri--County Council for the Lower Eastern Shore of Maryland(Shore Transit) Snow Hill MD DR 192t 207t 179 192 222 128 Transit Services of Frederick County Frederick MD DR 247t 195t 221 272 225 258 Washington County Transit(County Commuter) Hagerstown MD DR 465t 469t 445 452 451 439 City of Bangor - BAT Community Connector(BAT) Bangor ME DR 427t 456t 477 480 478 472 Lewiston-Auburn Transit Committee(LATC) Auburn ME DR 465t 469t 466 461 459 473 Regional Transportation Program, Inc.(RTP) Portland ME DR 145t 182t 163 142 138 140 Western Maine Transportation Services, Inc.(WMTS) Auburn ME DR 163t 192t 242 201 101 226 Ann Arbor Transportation Authority(AATA) Ann Arbor MI DR 262t 213t 166 143 216 302 Battle Creek Transit(BCT) Battle Creek MI DR 381t 378t 390 358 365 391 Bay Metropolitan Transit Authority(Bay Metro) Bay City MI DR 262t 295t 216 253 282 279 Blue Water Area Transportation Commission(Blue Water Area Transit) Port Huron MI DR 30t 33 67 69 34 103 Capital Area Transportation Authority(CATA) Lansing MI DR 54t 61 60 57 47 40 City of Detroit Department of Transportation(DDOT) Detroit MI DR 89t 102t 149 136 192 155 City of Grand Haven Harbor Transit Grand Haven MI DR 302t 310t 303 282 154 307 City of Jackson Transportation Authority(JTA) Jackson MI DR 247t 167t 257 280 298 317 Interurban Transit Partnership(The Rapid) Grand Rapids MI DR 38 46t 57 51 52 38 Kalamazoo Metro Transit System(Metro Transit) Kalamazoo MI DR 116t 140t 133 127 157 86 Livingston Essential Transportation Service(LETS) Howell MI DR 213t 225t 180 220 164 116 Macatawa Area Express Transportation Authority(MAX) Holland MI DR 185t 172t 259 241 202 221 Mass Transportation Authority(MTA) Flint MI DR 52 39 31 37 31 29
Muskegon Area Transit System(MATS) Muskegon Heights MI DR 445t 456t 408 432 438 428
Saginaw Transit Authority Regional Service(STARS) Saginaw MI DR 364t 295t 427 444 405 409 Suburban Mobility Authority for Regional Transportation(SMART) Detroit MI DR 41 41 36 38 28 35 Twin Cities Area Transportation Authority(TCATA) Benton Harbor MI DR 223t 248t 224 197 139 192 City of Moorhead, DBA: Metropolitan Area Transit(MATBUS) Moorhead MN DR 465t 469t 461 464 470 471 City of Rochester Public Transportation Rochester MN DR 427t 447t 354 368 311 297 Duluth Transit Authority(DTA) Duluth MN DR 401t 378t 332 333 377 377 Metro Mobility St. Paul MN DR 14 15 8 11 10 8 Metropolitan Council St. Paul MN DR 29 29 45 53 39 42 St. Cloud Metropolitan Transit Commission(Metro Bus) St. Cloud MN DR 237t 248t 208 198 148 207 Bi-State Development Agency(METRO) St. Louis MO DR 57t 58t 32 32 33 37 City of Jefferson(JEFFTRAN) Jefferson City MO DR 364t 362t 330 349 286 295 City Utilities of Springfield (The Bus) Springfield MO DR 427t 447t 402 428 426 402 Columbia Transit(CT) Columbia MO DR 381t 378t 370 323 342 408 Kansas City Area Transportation Authority(KCATA) Kansas City MO DR 72 63 38 44 48 57 City of Jackson Transit System (JATRAN) Jackson MS DR 342t 340t 316 290 387 325 Coast Transit Authority(CTA) Gulfport MS DR 271t 282t 296 259 276 133
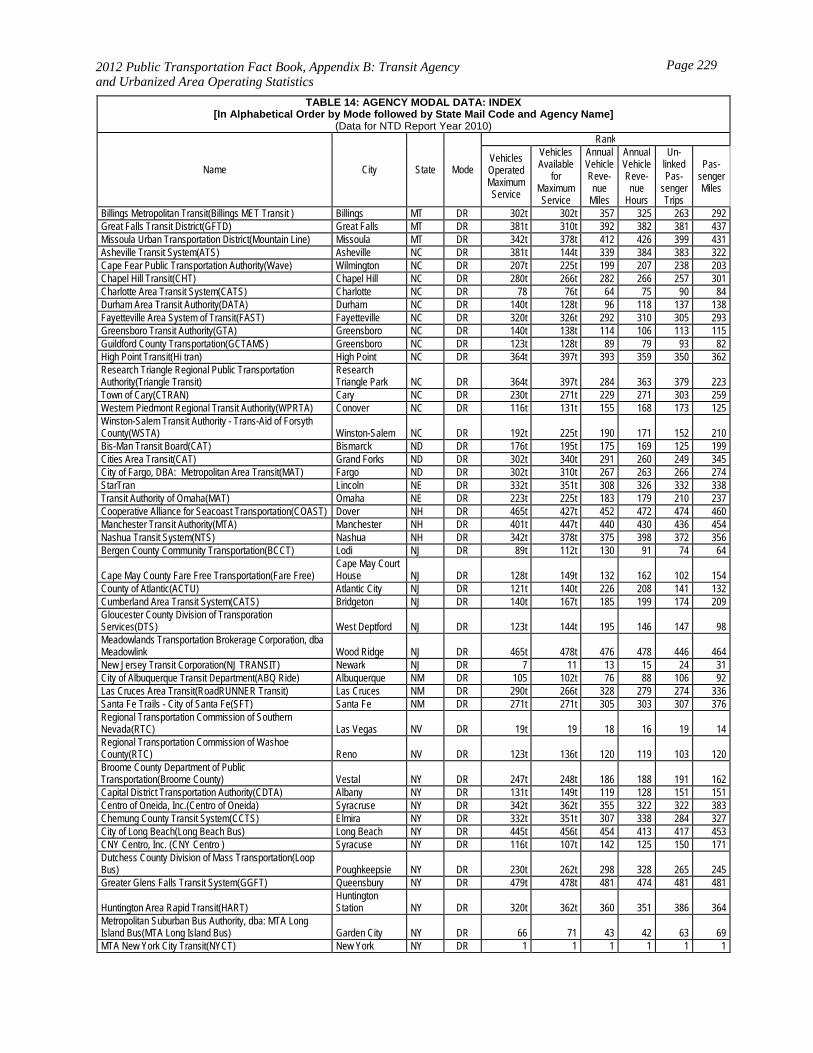
2012 Public Transportation Fact Book, Appendix B: Transit Agency and Urbanized Area Operating Statistics
Page 229
TABLE 14: AGENCY MODAL DATA: INDEX[In Alphabetical Order by Mode followed by State Mail Code and Agency Name]
(Data for NTD Report Year 2010)
Name City State Mode
Rank
Vehicles Operated Maximum Service
Vehicles Available
for Maximum Service
Annual Vehicle Reve-nue
Miles
Annual Vehicle Reve-nue
Hours
Un-linked Pas-
senger Trips
Pas-senger Miles
Billings Metropolitan Transit(Billings MET Transit ) Billings MT DR 302t 302t 357 325 263 292 Great Falls Transit District(GFTD) Great Falls MT DR 381t 310t 392 382 381 437 Missoula Urban Transportation District(Mountain Line) Missoula MT DR 342t 378t 412 426 399 431 Asheville Transit System(ATS) Asheville NC DR 381t 144t 339 384 383 322 Cape Fear Public Transportation Authority(Wave) Wilmington NC DR 207t 225t 199 207 238 203 Chapel Hill Transit(CHT) Chapel Hill NC DR 280t 266t 282 266 257 301 Charlotte Area Transit System(CATS) Charlotte NC DR 78 76t 64 75 90 84 Durham Area Transit Authority(DATA) Durham NC DR 140t 128t 96 118 137 138 Fayetteville Area System of Transit(FAST) Fayetteville NC DR 320t 326t 292 310 305 293 Greensboro Transit Authority(GTA) Greensboro NC DR 140t 138t 114 106 113 115 Guildford County Transportation(GCTAMS) Greensboro NC DR 123t 128t 89 79 93 82 High Point Transit(Hi tran) High Point NC DR 364t 397t 393 359 350 362 Research Triangle Regional Public Transportation Authority(Triangle Transit)
Research Triangle Park NC DR 364t 397t 284 363 379 223
Town of Cary(CTRAN) Cary NC DR 230t 271t 229 271 303 259 Western Piedmont Regional Transit Authority(WPRTA) Conover NC DR 116t 131t 155 168 173 125 Winston-Salem Transit Authority - Trans-Aid of Forsyth County(WSTA) Winston-Salem NC DR 192t 225t 190 171 152 210 Bis-Man Transit Board(CAT) Bismarck ND DR 176t 195t 175 169 125 199 Cities Area Transit(CAT) Grand Forks ND DR 302t 340t 291 260 249 345 City of Fargo, DBA: Metropolitan Area Transit(MAT) Fargo ND DR 302t 310t 267 263 266 274 StarTran Lincoln NE DR 332t 351t 308 326 332 338 Transit Authority of Omaha(MAT) Omaha NE DR 223t 225t 183 179 210 237 Cooperative Alliance for Seacoast Transportation(COAST) Dover NH DR 465t 427t 452 472 474 460 Manchester Transit Authority(MTA) Manchester NH DR 401t 447t 440 430 436 454 Nashua Transit System(NTS) Nashua NH DR 342t 378t 375 398 372 356 Bergen County Community Transportation(BCCT) Lodi NJ DR 89t 112t 130 91 74 64
Cape May County Fare Free Transportation(Fare Free) Cape May Court House NJ DR 128t 149t 132 162 102 154
County of Atlantic(ACTU) Atlantic City NJ DR 121t 140t 226 208 141 132 Cumberland Area Transit System(CATS) Bridgeton NJ DR 140t 167t 185 199 174 209 Gloucester County Division of Transporation Services(DTS) West Deptford NJ DR 123t 144t 195 146 147 98 Meadowlands Transportation Brokerage Corporation, dba Meadowlink Wood Ridge NJ DR 465t 478t 476 478 446 464 New Jersey Transit Corporation(NJ TRANSIT) Newark NJ DR 7 11 13 15 24 31 City of Albuquerque Transit Department(ABQ Ride) Albuquerque NM DR 105 102t 76 88 106 92 Las Cruces Area Transit(RoadRUNNER Transit) Las Cruces NM DR 290t 266t 328 279 274 336 Santa Fe Trails - City of Santa Fe(SFT) Santa Fe NM DR 271t 271t 305 303 307 376 Regional Transportation Commission of Southern Nevada(RTC) Las Vegas NV DR 19t 19 18 16 19 14 Regional Transportation Commission of Washoe County(RTC) Reno NV DR 123t 136t 120 119 103 120 Broome County Department of Public Transportation(Broome County) Vestal NY DR 247t 248t 186 188 191 162 Capital District Transportation Authority(CDTA) Albany NY DR 131t 149t 119 128 151 151 Centro of Oneida, Inc.(Centro of Oneida) Syracruse NY DR 342t 362t 355 322 322 383 Chemung County Transit System(CCTS) Elmira NY DR 332t 351t 307 338 284 327 City of Long Beach(Long Beach Bus) Long Beach NY DR 445t 456t 454 413 417 453 CNY Centro, Inc. (CNY Centro ) Syracuse NY DR 116t 107t 142 125 150 171 Dutchess County Division of Mass Transportation(Loop Bus) Poughkeepsie NY DR 230t 262t 298 328 265 245 Greater Glens Falls Transit System(GGFT) Queensbury NY DR 479t 478t 481 474 481 481
Huntington Area Rapid Transit(HART) Huntington Station NY DR 320t 362t 360 351 386 364
Metropolitan Suburban Bus Authority, dba: MTA Long Island Bus(MTA Long Island Bus) Garden City NY DR 66 71 43 42 63 69 MTA New York City Transit(NYCT) New York NY DR 1 1 1 1 1 1
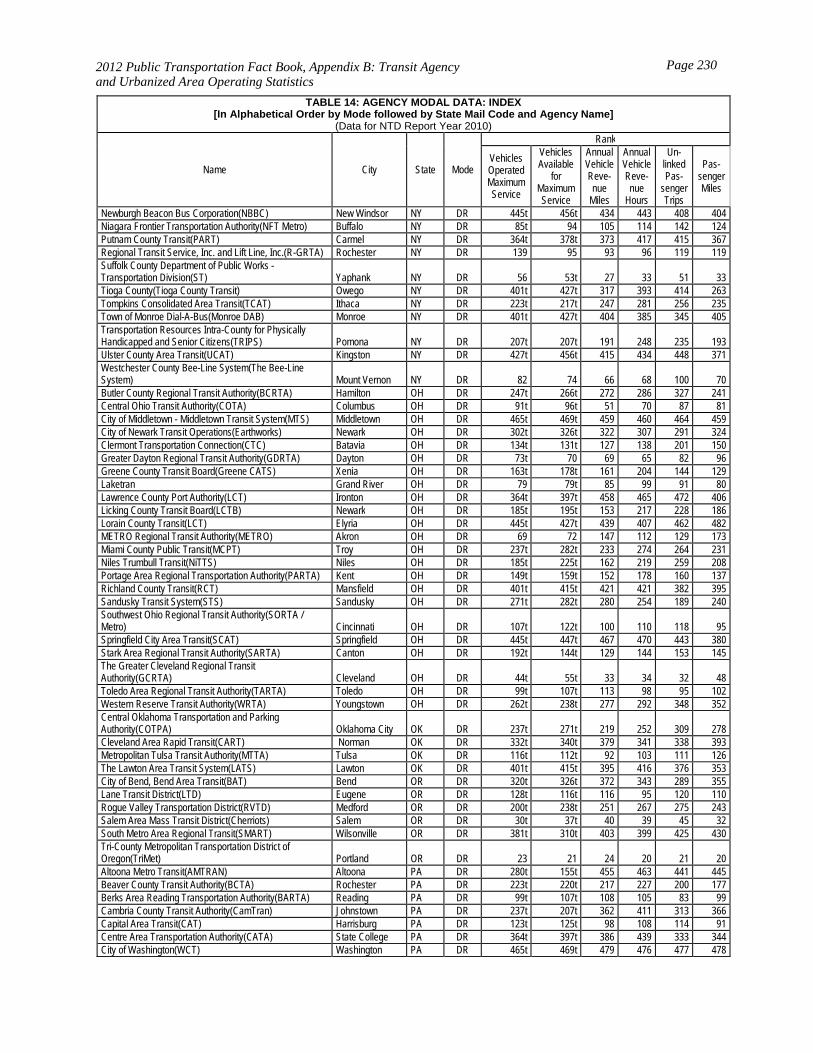
2012 Public Transportation Fact Book, Appendix B: Transit Agency and Urbanized Area Operating Statistics
Page 230
TABLE 14: AGENCY MODAL DATA: INDEX[In Alphabetical Order by Mode followed by State Mail Code and Agency Name]
(Data for NTD Report Year 2010)
Name City State Mode
Rank
Vehicles Operated Maximum Service
Vehicles Available
for Maximum Service
Annual Vehicle Reve-nue
Miles
Annual Vehicle Reve-nue
Hours
Un-linked Pas-
senger Trips
Pas-senger Miles
Newburgh Beacon Bus Corporation(NBBC) New Windsor NY DR 445t 456t 434 443 408 404 Niagara Frontier Transportation Authority(NFT Metro) Buffalo NY DR 85t 94 105 114 142 124 Putnam County Transit(PART) Carmel NY DR 364t 378t 373 417 415 367 Regional Transit Service, Inc. and Lift Line, Inc.(R-GRTA) Rochester NY DR 139 95 93 96 119 119 Suffolk County Department of Public Works - Transportation Division(ST) Yaphank NY DR 56 53t 27 33 51 33 Tioga County(Tioga County Transit) Owego NY DR 401t 427t 317 393 414 263 Tompkins Consolidated Area Transit(TCAT) Ithaca NY DR 223t 217t 247 281 256 235 Town of Monroe Dial-A-Bus(Monroe DAB) Monroe NY DR 401t 427t 404 385 345 405 Transportation Resources Intra-County for Physically Handicapped and Senior Citizens(TRIPS) Pomona NY DR 207t 207t 191 248 235 193 Ulster County Area Transit(UCAT) Kingston NY DR 427t 456t 415 434 448 371 Westchester County Bee-Line System(The Bee-Line System) Mount Vernon NY DR 82 74 66 68 100 70 Butler County Regional Transit Authority(BCRTA) Hamilton OH DR 247t 266t 272 286 327 241 Central Ohio Transit Authority(COTA) Columbus OH DR 91t 96t 51 70 87 81 City of Middletown - Middletown Transit System(MTS) Middletown OH DR 465t 469t 459 460 464 459 City of Newark Transit Operations(Earthworks) Newark OH DR 302t 326t 322 307 291 324 Clermont Transportation Connection(CTC) Batavia OH DR 134t 131t 127 138 201 150 Greater Dayton Regional Transit Authority(GDRTA) Dayton OH DR 73t 70 69 65 82 96 Greene County Transit Board(Greene CATS) Xenia OH DR 163t 178t 161 204 144 129 Laketran Grand River OH DR 79 79t 85 99 91 80 Lawrence County Port Authority(LCT) Ironton OH DR 364t 397t 458 465 472 406 Licking County Transit Board(LCTB) Newark OH DR 185t 195t 153 217 228 186 Lorain County Transit(LCT) Elyria OH DR 445t 427t 439 407 462 482 METRO Regional Transit Authority(METRO) Akron OH DR 69 72 147 112 129 173 Miami County Public Transit(MCPT) Troy OH DR 237t 282t 233 274 264 231 Niles Trumbull Transit(NiTTS) Niles OH DR 185t 225t 162 219 259 208 Portage Area Regional Transportation Authority(PARTA) Kent OH DR 149t 159t 152 178 160 137 Richland County Transit(RCT) Mansfield OH DR 401t 415t 421 421 382 395 Sandusky Transit System(STS) Sandusky OH DR 271t 282t 280 254 189 240 Southwest Ohio Regional Transit Authority(SORTA / Metro) Cincinnati OH DR 107t 122t 100 110 118 95 Springfield City Area Transit(SCAT) Springfield OH DR 445t 447t 467 470 443 380 Stark Area Regional Transit Authority(SARTA) Canton OH DR 192t 144t 129 144 153 145 The Greater Cleveland Regional Transit Authority(GCRTA) Cleveland OH DR 44t 55t 33 34 32 48 Toledo Area Regional Transit Authority(TARTA) Toledo OH DR 99t 107t 113 98 95 102 Western Reserve Transit Authority(WRTA) Youngstown OH DR 262t 238t 277 292 348 352 Central Oklahoma Transportation and Parking Authority(COTPA) Oklahoma City OK DR 237t 271t 219 252 309 278 Cleveland Area Rapid Transit(CART) Norman OK DR 332t 340t 379 341 338 393 Metropolitan Tulsa Transit Authority(MTTA) Tulsa OK DR 116t 112t 92 103 111 126 The Lawton Area Transit System(LATS) Lawton OK DR 401t 415t 395 416 376 353 City of Bend, Bend Area Transit(BAT) Bend OR DR 320t 326t 372 343 289 355 Lane Transit District(LTD) Eugene OR DR 128t 116t 116 95 120 110 Rogue Valley Transportation District(RVTD) Medford OR DR 200t 238t 251 267 275 243 Salem Area Mass Transit District(Cherriots) Salem OR DR 30t 37t 40 39 45 32 South Metro Area Regional Transit(SMART) Wilsonville OR DR 381t 310t 403 399 425 430 Tri-County Metropolitan Transportation District of Oregon(TriMet) Portland OR DR 23 21 24 20 21 20 Altoona Metro Transit(AMTRAN) Altoona PA DR 280t 155t 455 463 441 445 Beaver County Transit Authority(BCTA) Rochester PA DR 223t 220t 217 227 200 177 Berks Area Reading Transportation Authority(BARTA) Reading PA DR 99t 107t 108 105 83 99 Cambria County Transit Authority(CamTran) Johnstown PA DR 237t 207t 362 411 313 366 Capital Area Transit(CAT) Harrisburg PA DR 123t 125t 98 108 114 91 Centre Area Transportation Authority(CATA) State College PA DR 364t 397t 386 439 333 344 City of Washington(WCT) Washington PA DR 465t 469t 479 476 477 478
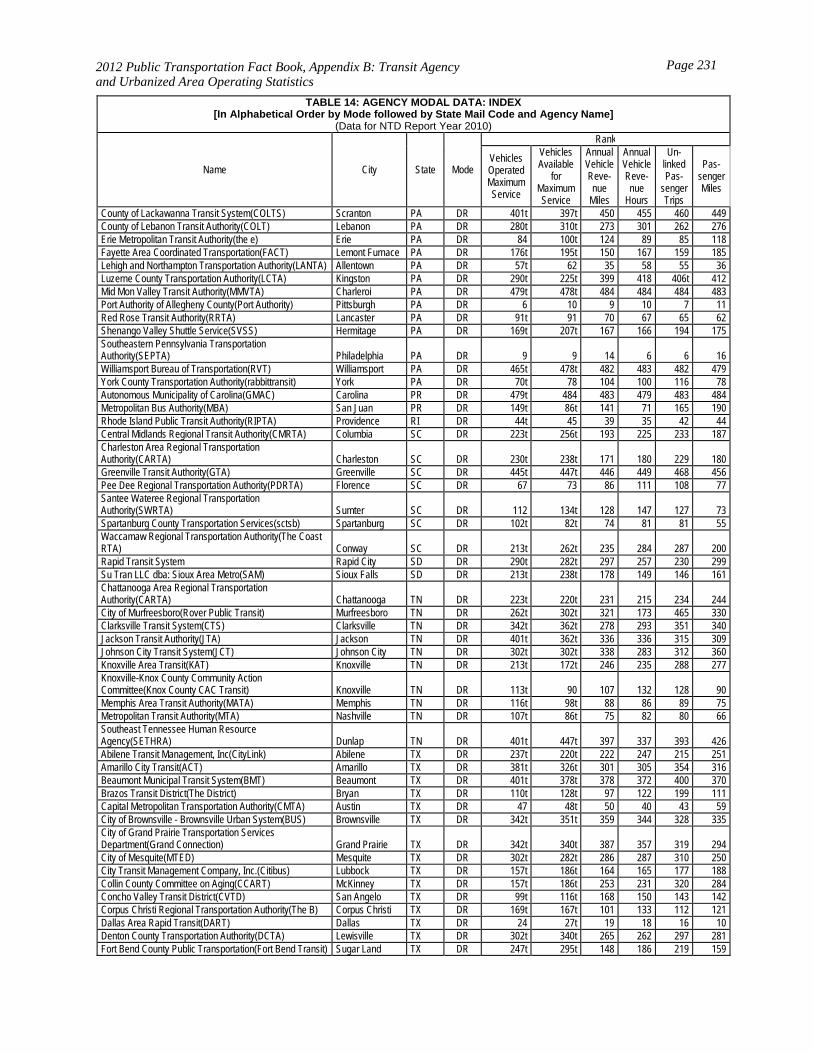
2012 Public Transportation Fact Book, Appendix B: Transit Agency and Urbanized Area Operating Statistics
Page 231
TABLE 14: AGENCY MODAL DATA: INDEX[In Alphabetical Order by Mode followed by State Mail Code and Agency Name]
(Data for NTD Report Year 2010)
Name City State Mode
Rank
Vehicles Operated Maximum Service
Vehicles Available
for Maximum Service
Annual Vehicle Reve-nue
Miles
Annual Vehicle Reve-nue
Hours
Un-linked Pas-
senger Trips
Pas-senger Miles
County of Lackawanna Transit System(COLTS) Scranton PA DR 401t 397t 450 455 460 449 County of Lebanon Transit Authority(COLT) Lebanon PA DR 280t 310t 273 301 262 276 Erie Metropolitan Transit Authority(the e) Erie PA DR 84 100t 124 89 85 118 Fayette Area Coordinated Transportation(FACT) Lemont Furnace PA DR 176t 195t 150 167 159 185 Lehigh and Northampton Transportation Authority(LANTA) Allentown PA DR 57t 62 35 58 55 36 Luzerne County Transportation Authority(LCTA) Kingston PA DR 290t 225t 399 418 406t 412 Mid Mon Valley Transit Authority(MMVTA) Charleroi PA DR 479t 478t 484 484 484 483 Port Authority of Allegheny County(Port Authority) Pittsburgh PA DR 6 10 9 10 7 11 Red Rose Transit Authority(RRTA) Lancaster PA DR 91t 91 70 67 65 62 Shenango Valley Shuttle Service(SVSS) Hermitage PA DR 169t 207t 167 166 194 175 Southeastern Pennsylvania Transportation Authority(SEPTA) Philadelphia PA DR 9 9 14 6 6 16 Williamsport Bureau of Transportation(RVT) Williamsport PA DR 465t 478t 482 483 482 479 York County Transportation Authority(rabbittransit) York PA DR 70t 78 104 100 116 78 Autonomous Municipality of Carolina(GMAC) Carolina PR DR 479t 484 483 479 483 484 Metropolitan Bus Authority(MBA) San Juan PR DR 149t 86t 141 71 165 190 Rhode Island Public Transit Authority(RIPTA) Providence RI DR 44t 45 39 35 42 44 Central Midlands Regional Transit Authority(CMRTA) Columbia SC DR 223t 256t 193 225 233 187 Charleston Area Regional Transportation Authority(CARTA) Charleston SC DR 230t 238t 171 180 229 180 Greenville Transit Authority(GTA) Greenville SC DR 445t 447t 446 449 468 456 Pee Dee Regional Transportation Authority(PDRTA) Florence SC DR 67 73 86 111 108 77 Santee Wateree Regional Transportation Authority(SWRTA) Sumter SC DR 112 134t 128 147 127 73 Spartanburg County Transportation Services(sctsb) Spartanburg SC DR 102t 82t 74 81 81 55 Waccamaw Regional Transportation Authority(The Coast RTA) Conway SC DR 213t 262t 235 284 287 200 Rapid Transit System Rapid City SD DR 290t 282t 297 257 230 299 Su Tran LLC dba: Sioux Area Metro(SAM) Sioux Falls SD DR 213t 238t 178 149 146 161 Chattanooga Area Regional Transportation Authority(CARTA) Chattanooga TN DR 223t 220t 231 215 234 244 City of Murfreesboro(Rover Public Transit) Murfreesboro TN DR 262t 302t 321 173 465 330 Clarksville Transit System(CTS) Clarksville TN DR 342t 362t 278 293 351 340 Jackson Transit Authority(JTA) Jackson TN DR 401t 362t 336 336 315 309 Johnson City Transit System(JCT) Johnson City TN DR 302t 302t 338 283 312 360 Knoxville Area Transit(KAT) Knoxville TN DR 213t 172t 246 235 288 277 Knoxville-Knox County Community Action Committee(Knox County CAC Transit) Knoxville TN DR 113t 90 107 132 128 90 Memphis Area Transit Authority(MATA) Memphis TN DR 116t 98t 88 86 89 75 Metropolitan Transit Authority(MTA) Nashville TN DR 107t 86t 75 82 80 66 Southeast Tennessee Human Resource Agency(SETHRA) Dunlap TN DR 401t 447t 397 337 393 426 Abilene Transit Management, Inc(CityLink) Abilene TX DR 237t 220t 222 247 215 251 Amarillo City Transit(ACT) Amarillo TX DR 381t 326t 301 305 354 316 Beaumont Municipal Transit System(BMT) Beaumont TX DR 401t 378t 378 372 400 370 Brazos Transit District(The District) Bryan TX DR 110t 128t 97 122 199 111 Capital Metropolitan Transportation Authority(CMTA) Austin TX DR 47 48t 50 40 43 59 City of Brownsville - Brownsville Urban System(BUS) Brownsville TX DR 342t 351t 359 344 328 335 City of Grand Prairie Transportation Services Department(Grand Connection) Grand Prairie TX DR 342t 340t 387 357 319 294 City of Mesquite(MTED) Mesquite TX DR 302t 282t 286 287 310 250 City Transit Management Company, Inc.(Citibus) Lubbock TX DR 157t 186t 164 165 177 188 Collin County Committee on Aging(CCART) McKinney TX DR 157t 186t 253 231 320 284 Concho Valley Transit District(CVTD) San Angelo TX DR 99t 116t 168 150 143 142 Corpus Christi Regional Transportation Authority(The B) Corpus Christi TX DR 169t 167t 101 133 112 121 Dallas Area Rapid Transit(DART) Dallas TX DR 24 27t 19 18 16 10 Denton County Transportation Authority(DCTA) Lewisville TX DR 302t 340t 265 262 297 281 Fort Bend County Public Transportation(Fort Bend Transit) Sugar Land TX DR 247t 295t 148 186 219 159
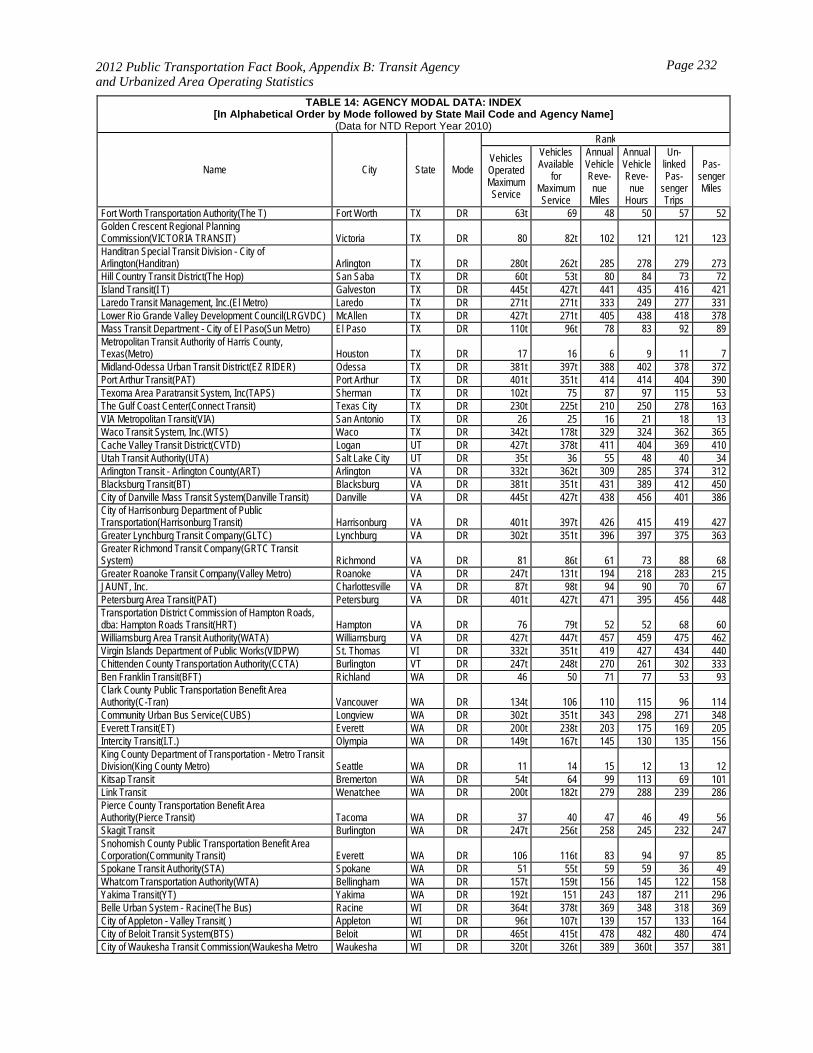
2012 Public Transportation Fact Book, Appendix B: Transit Agency and Urbanized Area Operating Statistics
Page 232
TABLE 14: AGENCY MODAL DATA: INDEX[In Alphabetical Order by Mode followed by State Mail Code and Agency Name]
(Data for NTD Report Year 2010)
Name City State Mode
Rank
Vehicles Operated Maximum Service
Vehicles Available
for Maximum Service
Annual Vehicle Reve-nue
Miles
Annual Vehicle Reve-nue
Hours
Un-linked Pas-
senger Trips
Pas-senger Miles
Fort Worth Transportation Authority(The T) Fort Worth TX DR 63t 69 48 50 57 52 Golden Crescent Regional Planning Commission(VICTORIA TRANSIT) Victoria TX DR 80 82t 102 121 121 123 Handitran Special Transit Division - City of Arlington(Handitran) Arlington TX DR 280t 262t 285 278 279 273 Hill Country Transit District(The Hop) San Saba TX DR 60t 53t 80 84 73 72 Island Transit(I T) Galveston TX DR 445t 427t 441 435 416 421 Laredo Transit Management, Inc.(El Metro) Laredo TX DR 271t 271t 333 249 277 331 Lower Rio Grande Valley Development Council(LRGVDC) McAllen TX DR 427t 271t 405 438 418 378 Mass Transit Department - City of El Paso(Sun Metro) El Paso TX DR 110t 96t 78 83 92 89 Metropolitan Transit Authority of Harris County, Texas(Metro) Houston TX DR 17 16 6 9 11 7 Midland-Odessa Urban Transit District(EZ RIDER) Odessa TX DR 381t 397t 388 402 378 372 Port Arthur Transit(PAT) Port Arthur TX DR 401t 351t 414 414 404 390 Texoma Area Paratransit System, Inc(TAPS) Sherman TX DR 102t 75 87 97 115 53 The Gulf Coast Center(Connect Transit) Texas City TX DR 230t 225t 210 250 278 163 VIA Metropolitan Transit(VIA) San Antonio TX DR 26 25 16 21 18 13 Waco Transit System, Inc.(WTS) Waco TX DR 342t 178t 329 324 362 365 Cache Valley Transit District(CVTD) Logan UT DR 427t 378t 411 404 369 410 Utah Transit Authority(UTA) Salt Lake City UT DR 35t 36 55 48 40 34 Arlington Transit - Arlington County(ART) Arlington VA DR 332t 362t 309 285 374 312 Blacksburg Transit(BT) Blacksburg VA DR 381t 351t 431 389 412 450 City of Danville Mass Transit System(Danville Transit) Danville VA DR 445t 427t 438 456 401 386 City of Harrisonburg Department of Public Transportation(Harrisonburg Transit) Harrisonburg VA DR 401t 397t 426 415 419 427 Greater Lynchburg Transit Company(GLTC) Lynchburg VA DR 302t 351t 396 397 375 363 Greater Richmond Transit Company(GRTC Transit System) Richmond VA DR 81 86t 61 73 88 68 Greater Roanoke Transit Company(Valley Metro) Roanoke VA DR 247t 131t 194 218 283 215 JAUNT, Inc. Charlottesville VA DR 87t 98t 94 90 70 67 Petersburg Area Transit(PAT) Petersburg VA DR 401t 427t 471 395 456 448 Transportation District Commission of Hampton Roads, dba: Hampton Roads Transit(HRT) Hampton VA DR 76 79t 52 52 68 60 Williamsburg Area Transit Authority(WATA) Williamsburg VA DR 427t 447t 457 459 475 462 Virgin Islands Department of Public Works(VIDPW) St. Thomas VI DR 332t 351t 419 427 434 440 Chittenden County Transportation Authority(CCTA) Burlington VT DR 247t 248t 270 261 302 333 Ben Franklin Transit(BFT) Richland WA DR 46 50 71 77 53 93 Clark County Public Transportation Benefit Area Authority(C-Tran) Vancouver WA DR 134t 106 110 115 96 114 Community Urban Bus Service(CUBS) Longview WA DR 302t 351t 343 298 271 348 Everett Transit(ET) Everett WA DR 200t 238t 203 175 169 205 Intercity Transit(I.T.) Olympia WA DR 149t 167t 145 130 135 156 King County Department of Transportation - Metro Transit Division(King County Metro) Seattle WA DR 11 14 15 12 13 12 Kitsap Transit Bremerton WA DR 54t 64 99 113 69 101 Link Transit Wenatchee WA DR 200t 182t 279 288 239 286 Pierce County Transportation Benefit Area Authority(Pierce Transit) Tacoma WA DR 37 40 47 46 49 56 Skagit Transit Burlington WA DR 247t 256t 258 245 232 247 Snohomish County Public Transportation Benefit Area Corporation(Community Transit) Everett WA DR 106 116t 83 94 97 85 Spokane Transit Authority(STA) Spokane WA DR 51 55t 59 59 36 49 Whatcom Transportation Authority(WTA) Bellingham WA DR 157t 159t 156 145 122 158 Yakima Transit(YT) Yakima WA DR 192t 151 243 187 211 296 Belle Urban System - Racine(The Bus) Racine WI DR 364t 378t 369 348 318 369 City of Appleton - Valley Transit( ) Appleton WI DR 96t 107t 139 157 133 164 City of Beloit Transit System(BTS) Beloit WI DR 465t 415t 478 482 480 474 City of Waukesha Transit Commission(Waukesha Metro Waukesha WI DR 320t 326t 389 360t 357 381
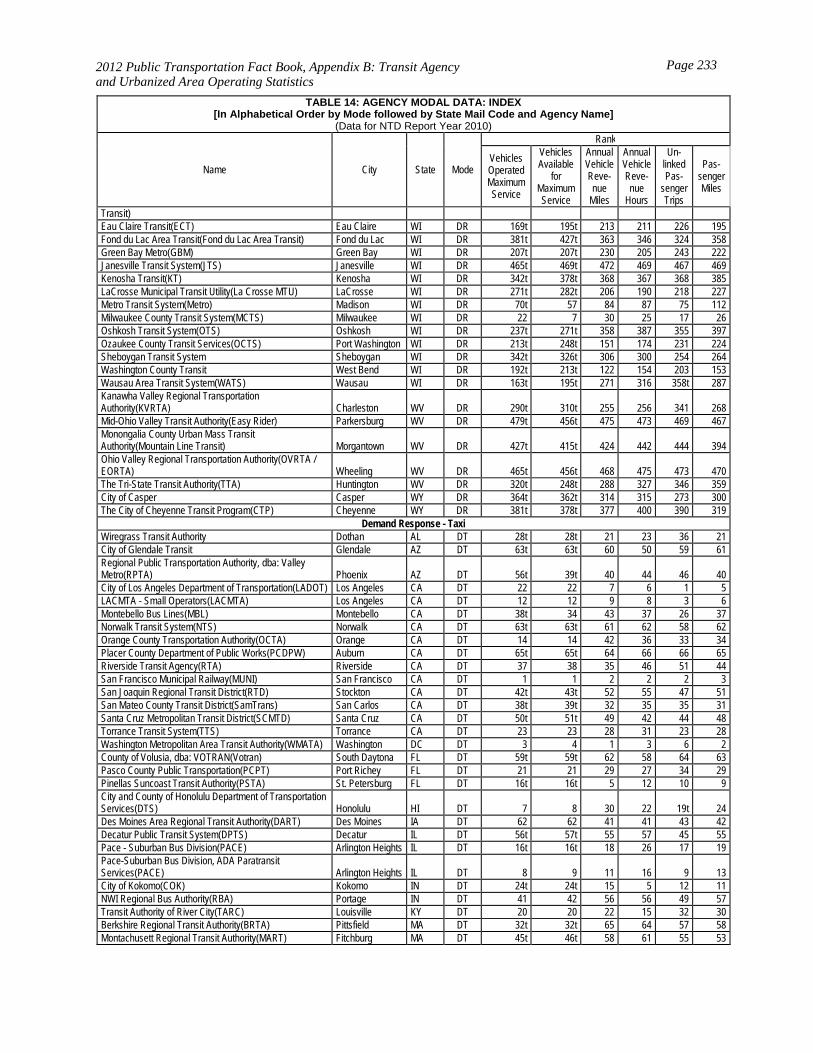
2012 Public Transportation Fact Book, Appendix B: Transit Agency and Urbanized Area Operating Statistics
Page 233
TABLE 14: AGENCY MODAL DATA: INDEX[In Alphabetical Order by Mode followed by State Mail Code and Agency Name]
(Data for NTD Report Year 2010)
Name City State Mode
Rank
Vehicles Operated Maximum Service
Vehicles Available
for Maximum Service
Annual Vehicle Reve-nue
Miles
Annual Vehicle Reve-nue
Hours
Un-linked Pas-
senger Trips
Pas-senger Miles
Transit) Eau Claire Transit(ECT) Eau Claire WI DR 169t 195t 213 211 226 195 Fond du Lac Area Transit(Fond du Lac Area Transit) Fond du Lac WI DR 381t 427t 363 346 324 358 Green Bay Metro(GBM) Green Bay WI DR 207t 207t 230 205 243 222 Janesville Transit System(JTS) Janesville WI DR 465t 469t 472 469 467 469 Kenosha Transit(KT) Kenosha WI DR 342t 378t 368 367 368 385 LaCrosse Municipal Transit Utility(La Crosse MTU) LaCrosse WI DR 271t 282t 206 190 218 227 Metro Transit System(Metro) Madison WI DR 70t 57 84 87 75 112 Milwaukee County Transit System(MCTS) Milwaukee WI DR 22 7 30 25 17 26 Oshkosh Transit System(OTS) Oshkosh WI DR 237t 271t 358 387 355 397 Ozaukee County Transit Services(OCTS) Port Washington WI DR 213t 248t 151 174 231 224 Sheboygan Transit System Sheboygan WI DR 342t 326t 306 300 254 264 Washington County Transit West Bend WI DR 192t 213t 122 154 203 153 Wausau Area Transit System(WATS) Wausau WI DR 163t 195t 271 316 358t 287 Kanawha Valley Regional Transportation Authority(KVRTA) Charleston WV DR 290t 310t 255 256 341 268 Mid-Ohio Valley Transit Authority(Easy Rider) Parkersburg WV DR 479t 456t 475 473 469 467 Monongalia County Urban Mass Transit Authority(Mountain Line Transit) Morgantown WV DR 427t 415t 424 442 444 394 Ohio Valley Regional Transportation Authority(OVRTA / EORTA) Wheeling WV DR 465t 456t 468 475 473 470 The Tri-State Transit Authority(TTA) Huntington WV DR 320t 248t 288 327 346 359 City of Casper Casper WY DR 364t 362t 314 315 273 300 The City of Cheyenne Transit Program(CTP) Cheyenne WY DR 381t 378t 377 400 390 319
Demand Response - Taxi Wiregrass Transit Authority Dothan AL DT 28t 28t 21 23 36 21 City of Glendale Transit Glendale AZ DT 63t 63t 60 50 59 61 Regional Public Transportation Authority, dba: Valley Metro(RPTA) Phoenix AZ DT 56t 39t 40 44 46 40 City of Los Angeles Department of Transportation(LADOT) Los Angeles CA DT 22 22 7 6 1 5 LACMTA - Small Operators(LACMTA) Los Angeles CA DT 12 12 9 8 3 6 Montebello Bus Lines(MBL) Montebello CA DT 38t 34 43 37 26 37 Norwalk Transit System(NTS) Norwalk CA DT 63t 63t 61 62 58 62 Orange County Transportation Authority(OCTA) Orange CA DT 14 14 42 36 33 34 Placer County Department of Public Works(PCDPW) Auburn CA DT 65t 65t 64 66 66 65 Riverside Transit Agency(RTA) Riverside CA DT 37 38 35 46 51 44 San Francisco Municipal Railway(MUNI) San Francisco CA DT 1 1 2 2 2 3 San Joaquin Regional Transit District(RTD) Stockton CA DT 42t 43t 52 55 47 51 San Mateo County Transit District(SamTrans) San Carlos CA DT 38t 39t 32 35 35 31 Santa Cruz Metropolitan Transit District(SCMTD) Santa Cruz CA DT 50t 51t 49 42 44 48 Torrance Transit System(TTS) Torrance CA DT 23 23 28 31 23 28 Washington Metropolitan Area Transit Authority(WMATA) Washington DC DT 3 4 1 3 6 2 County of Volusia, dba: VOTRAN(Votran) South Daytona FL DT 59t 59t 62 58 64 63 Pasco County Public Transportation(PCPT) Port Richey FL DT 21 21 29 27 34 29 Pinellas Suncoast Transit Authority(PSTA) St. Petersburg FL DT 16t 16t 5 12 10 9 City and County of Honolulu Department of Transportation Services(DTS) Honolulu HI DT 7 8 30 22 19t 24 Des Moines Area Regional Transit Authority(DART) Des Moines IA DT 62 62 41 41 43 42 Decatur Public Transit System(DPTS) Decatur IL DT 56t 57t 55 57 45 55 Pace - Suburban Bus Division(PACE) Arlington Heights IL DT 16t 16t 18 26 17 19 Pace-Suburban Bus Division, ADA Paratransit Services(PACE) Arlington Heights IL DT 8 9 11 16 9 13 City of Kokomo(COK) Kokomo IN DT 24t 24t 15 5 12 11 NWI Regional Bus Authority(RBA) Portage IN DT 41 42 56 56 49 57 Transit Authority of River City(TARC) Louisville KY DT 20 20 22 15 32 30 Berkshire Regional Transit Authority(BRTA) Pittsfield MA DT 32t 32t 65 64 57 58 Montachusett Regional Transit Authority(MART) Fitchburg MA DT 45t 46t 58 61 55 53
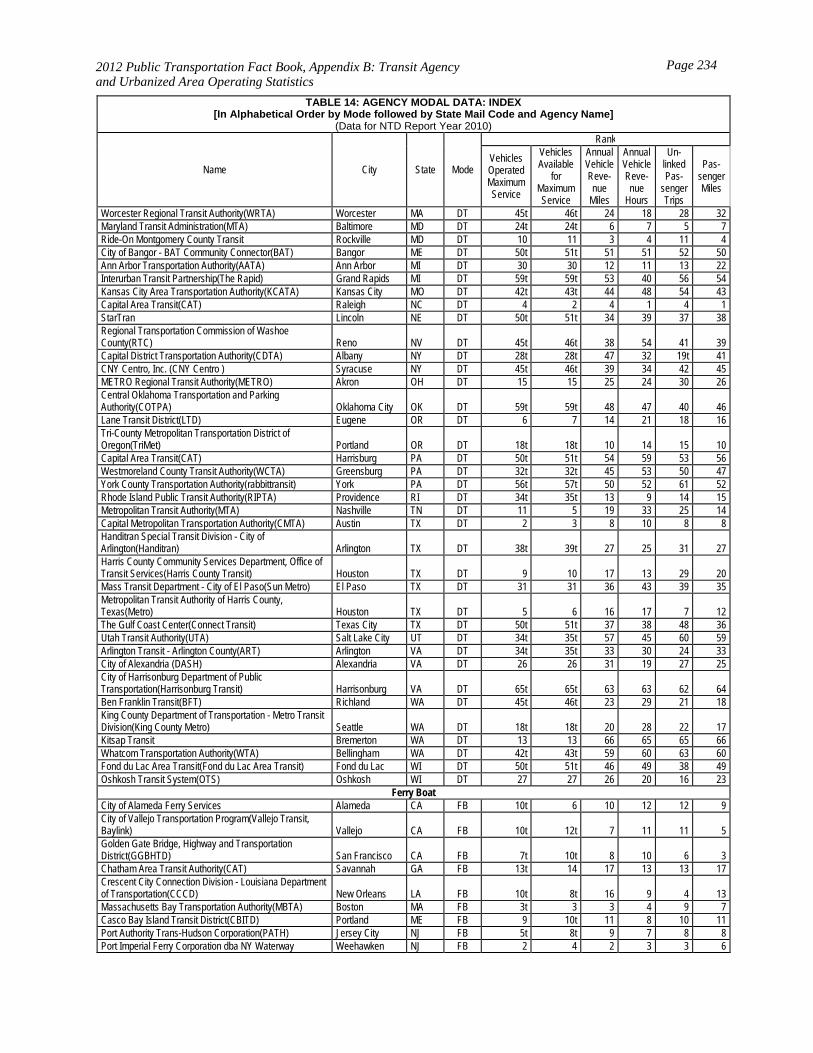
2012 Public Transportation Fact Book, Appendix B: Transit Agency and Urbanized Area Operating Statistics
Page 234
TABLE 14: AGENCY MODAL DATA: INDEX[In Alphabetical Order by Mode followed by State Mail Code and Agency Name]
(Data for NTD Report Year 2010)
Name City State Mode
Rank
Vehicles Operated Maximum Service
Vehicles Available
for Maximum Service
Annual Vehicle Reve-nue
Miles
Annual Vehicle Reve-nue
Hours
Un-linked Pas-
senger Trips
Pas-senger Miles
Worcester Regional Transit Authority(WRTA) Worcester MA DT 45t 46t 24 18 28 32 Maryland Transit Administration(MTA) Baltimore MD DT 24t 24t 6 7 5 7 Ride-On Montgomery County Transit Rockville MD DT 10 11 3 4 11 4 City of Bangor - BAT Community Connector(BAT) Bangor ME DT 50t 51t 51 51 52 50 Ann Arbor Transportation Authority(AATA) Ann Arbor MI DT 30 30 12 11 13 22 Interurban Transit Partnership(The Rapid) Grand Rapids MI DT 59t 59t 53 40 56 54 Kansas City Area Transportation Authority(KCATA) Kansas City MO DT 42t 43t 44 48 54 43 Capital Area Transit(CAT) Raleigh NC DT 4 2 4 1 4 1 StarTran Lincoln NE DT 50t 51t 34 39 37 38 Regional Transportation Commission of Washoe County(RTC) Reno NV DT 45t 46t 38 54 41 39 Capital District Transportation Authority(CDTA) Albany NY DT 28t 28t 47 32 19t 41 CNY Centro, Inc. (CNY Centro ) Syracuse NY DT 45t 46t 39 34 42 45 METRO Regional Transit Authority(METRO) Akron OH DT 15 15 25 24 30 26 Central Oklahoma Transportation and Parking Authority(COTPA) Oklahoma City OK DT 59t 59t 48 47 40 46 Lane Transit District(LTD) Eugene OR DT 6 7 14 21 18 16 Tri-County Metropolitan Transportation District of Oregon(TriMet) Portland OR DT 18t 18t 10 14 15 10 Capital Area Transit(CAT) Harrisburg PA DT 50t 51t 54 59 53 56 Westmoreland County Transit Authority(WCTA) Greensburg PA DT 32t 32t 45 53 50 47 York County Transportation Authority(rabbittransit) York PA DT 56t 57t 50 52 61 52 Rhode Island Public Transit Authority(RIPTA) Providence RI DT 34t 35t 13 9 14 15 Metropolitan Transit Authority(MTA) Nashville TN DT 11 5 19 33 25 14 Capital Metropolitan Transportation Authority(CMTA) Austin TX DT 2 3 8 10 8 8 Handitran Special Transit Division - City of Arlington(Handitran) Arlington TX DT 38t 39t 27 25 31 27 Harris County Community Services Department, Office of Transit Services(Harris County Transit) Houston TX DT 9 10 17 13 29 20 Mass Transit Department - City of El Paso(Sun Metro) El Paso TX DT 31 31 36 43 39 35 Metropolitan Transit Authority of Harris County, Texas(Metro) Houston TX DT 5 6 16 17 7 12 The Gulf Coast Center(Connect Transit) Texas City TX DT 50t 51t 37 38 48 36 Utah Transit Authority(UTA) Salt Lake City UT DT 34t 35t 57 45 60 59 Arlington Transit - Arlington County(ART) Arlington VA DT 34t 35t 33 30 24 33 City of Alexandria (DASH) Alexandria VA DT 26 26 31 19 27 25 City of Harrisonburg Department of Public Transportation(Harrisonburg Transit) Harrisonburg VA DT 65t 65t 63 63 62 64 Ben Franklin Transit(BFT) Richland WA DT 45t 46t 23 29 21 18 King County Department of Transportation - Metro Transit Division(King County Metro) Seattle WA DT 18t 18t 20 28 22 17 Kitsap Transit Bremerton WA DT 13 13 66 65 65 66 Whatcom Transportation Authority(WTA) Bellingham WA DT 42t 43t 59 60 63 60 Fond du Lac Area Transit(Fond du Lac Area Transit) Fond du Lac WI DT 50t 51t 46 49 38 49 Oshkosh Transit System(OTS) Oshkosh WI DT 27 27 26 20 16 23
Ferry Boat City of Alameda Ferry Services Alameda CA FB 10t 6 10 12 12 9 City of Vallejo Transportation Program(Vallejo Transit, Baylink) Vallejo CA FB 10t 12t 7 11 11 5 Golden Gate Bridge, Highway and Transportation District(GGBHTD) San Francisco CA FB 7t 10t 8 10 6 3 Chatham Area Transit Authority(CAT) Savannah GA FB 13t 14 17 13 13 17 Crescent City Connection Division - Louisiana Department of Transportation(CCCD) New Orleans LA FB 10t 8t 16 9 4 13 Massachusetts Bay Transportation Authority(MBTA) Boston MA FB 3t 3 3 4 9 7 Casco Bay Island Transit District(CBITD) Portland ME FB 9 10t 11 8 10 11 Port Authority Trans-Hudson Corporation(PATH) Jersey City NJ FB 5t 8t 9 7 8 8 Port Imperial Ferry Corporation dba NY Waterway Weehawken NJ FB 2 4 2 3 3 6
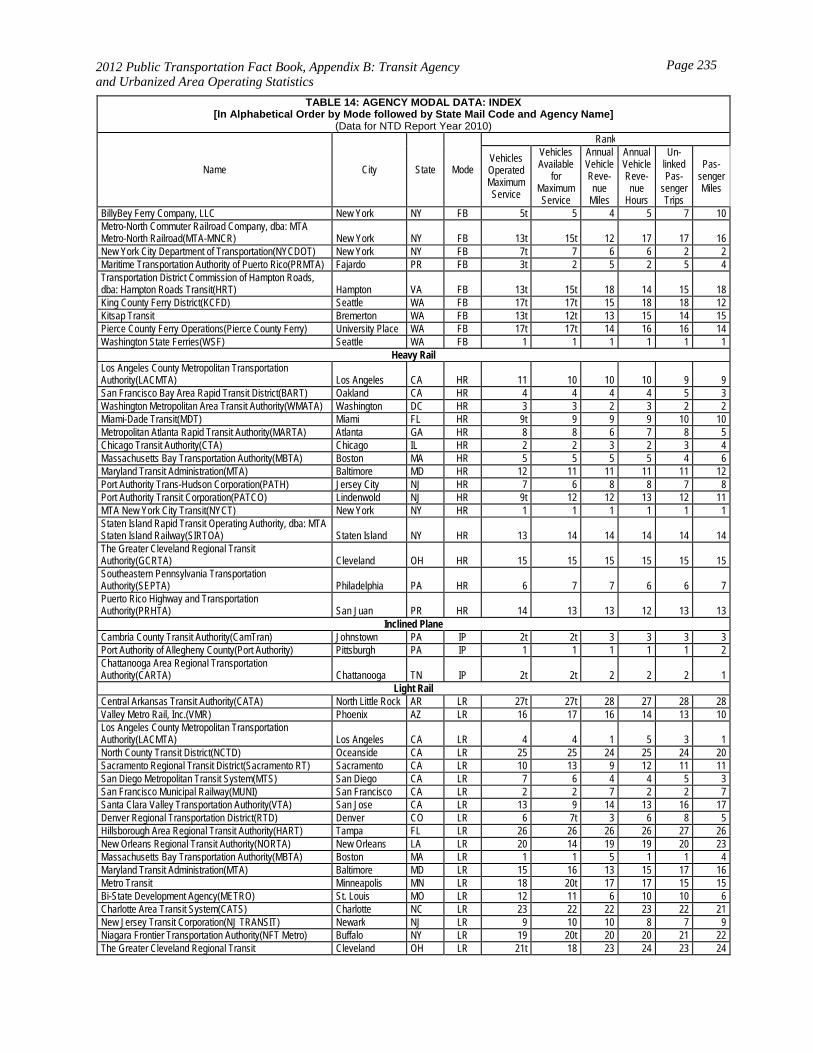
2012 Public Transportation Fact Book, Appendix B: Transit Agency and Urbanized Area Operating Statistics
Page 235
TABLE 14: AGENCY MODAL DATA: INDEX[In Alphabetical Order by Mode followed by State Mail Code and Agency Name]
(Data for NTD Report Year 2010)
Name City State Mode
Rank
Vehicles Operated Maximum Service
Vehicles Available
for Maximum Service
Annual Vehicle Reve-nue
Miles
Annual Vehicle Reve-nue
Hours
Un-linked Pas-
senger Trips
Pas-senger Miles
BillyBey Ferry Company, LLC New York NY FB 5t 5 4 5 7 10 Metro-North Commuter Railroad Company, dba: MTA Metro-North Railroad(MTA-MNCR) New York NY FB 13t 15t 12 17 17 16 New York City Department of Transportation(NYCDOT) New York NY FB 7t 7 6 6 2 2 Maritime Transportation Authority of Puerto Rico(PRMTA) Fajardo PR FB 3t 2 5 2 5 4 Transportation District Commission of Hampton Roads, dba: Hampton Roads Transit(HRT) Hampton VA FB 13t 15t 18 14 15 18 King County Ferry District(KCFD) Seattle WA FB 17t 17t 15 18 18 12 Kitsap Transit Bremerton WA FB 13t 12t 13 15 14 15 Pierce County Ferry Operations(Pierce County Ferry) University Place WA FB 17t 17t 14 16 16 14 Washington State Ferries(WSF) Seattle WA FB 1 1 1 1 1 1
Heavy Rail Los Angeles County Metropolitan Transportation Authority(LACMTA) Los Angeles CA HR 11 10 10 10 9 9 San Francisco Bay Area Rapid Transit District(BART) Oakland CA HR 4 4 4 4 5 3 Washington Metropolitan Area Transit Authority(WMATA) Washington DC HR 3 3 2 3 2 2 Miami-Dade Transit(MDT) Miami FL HR 9t 9 9 9 10 10 Metropolitan Atlanta Rapid Transit Authority(MARTA) Atlanta GA HR 8 8 6 7 8 5 Chicago Transit Authority(CTA) Chicago IL HR 2 2 3 2 3 4 Massachusetts Bay Transportation Authority(MBTA) Boston MA HR 5 5 5 5 4 6 Maryland Transit Administration(MTA) Baltimore MD HR 12 11 11 11 11 12 Port Authority Trans-Hudson Corporation(PATH) Jersey City NJ HR 7 6 8 8 7 8 Port Authority Transit Corporation(PATCO) Lindenwold NJ HR 9t 12 12 13 12 11 MTA New York City Transit(NYCT) New York NY HR 1 1 1 1 1 1 Staten Island Rapid Transit Operating Authority, dba: MTA Staten Island Railway(SIRTOA) Staten Island NY HR 13 14 14 14 14 14 The Greater Cleveland Regional Transit Authority(GCRTA) Cleveland OH HR 15 15 15 15 15 15 Southeastern Pennsylvania Transportation Authority(SEPTA) Philadelphia PA HR 6 7 7 6 6 7 Puerto Rico Highway and Transportation Authority(PRHTA) San Juan PR HR 14 13 13 12 13 13
Inclined Plane Cambria County Transit Authority(CamTran) Johnstown PA IP 2t 2t 3 3 3 3 Port Authority of Allegheny County(Port Authority) Pittsburgh PA IP 1 1 1 1 1 2 Chattanooga Area Regional Transportation Authority(CARTA) Chattanooga TN IP 2t 2t 2 2 2 1
Light Rail Central Arkansas Transit Authority(CATA) North Little Rock AR LR 27t 27t 28 27 28 28 Valley Metro Rail, Inc.(VMR) Phoenix AZ LR 16 17 16 14 13 10 Los Angeles County Metropolitan Transportation Authority(LACMTA) Los Angeles CA LR 4 4 1 5 3 1 North County Transit District(NCTD) Oceanside CA LR 25 25 24 25 24 20 Sacramento Regional Transit District(Sacramento RT) Sacramento CA LR 10 13 9 12 11 11 San Diego Metropolitan Transit System(MTS) San Diego CA LR 7 6 4 4 5 3 San Francisco Municipal Railway(MUNI) San Francisco CA LR 2 2 7 2 2 7 Santa Clara Valley Transportation Authority(VTA) San Jose CA LR 13 9 14 13 16 17 Denver Regional Transportation District(RTD) Denver CO LR 6 7t 3 6 8 5 Hillsborough Area Regional Transit Authority(HART) Tampa FL LR 26 26 26 26 27 26 New Orleans Regional Transit Authority(NORTA) New Orleans LA LR 20 14 19 19 20 23 Massachusetts Bay Transportation Authority(MBTA) Boston MA LR 1 1 5 1 1 4 Maryland Transit Administration(MTA) Baltimore MD LR 15 16 13 15 17 16 Metro Transit Minneapolis MN LR 18 20t 17 17 15 15 Bi-State Development Agency(METRO) St. Louis MO LR 12 11 6 10 10 6 Charlotte Area Transit System(CATS) Charlotte NC LR 23 22 22 23 22 21 New Jersey Transit Corporation(NJ TRANSIT) Newark NJ LR 9 10 10 8 7 9 Niagara Frontier Transportation Authority(NFT Metro) Buffalo NY LR 19 20t 20 20 21 22 The Greater Cleveland Regional Transit Cleveland OH LR 21t 18 23 24 23 24
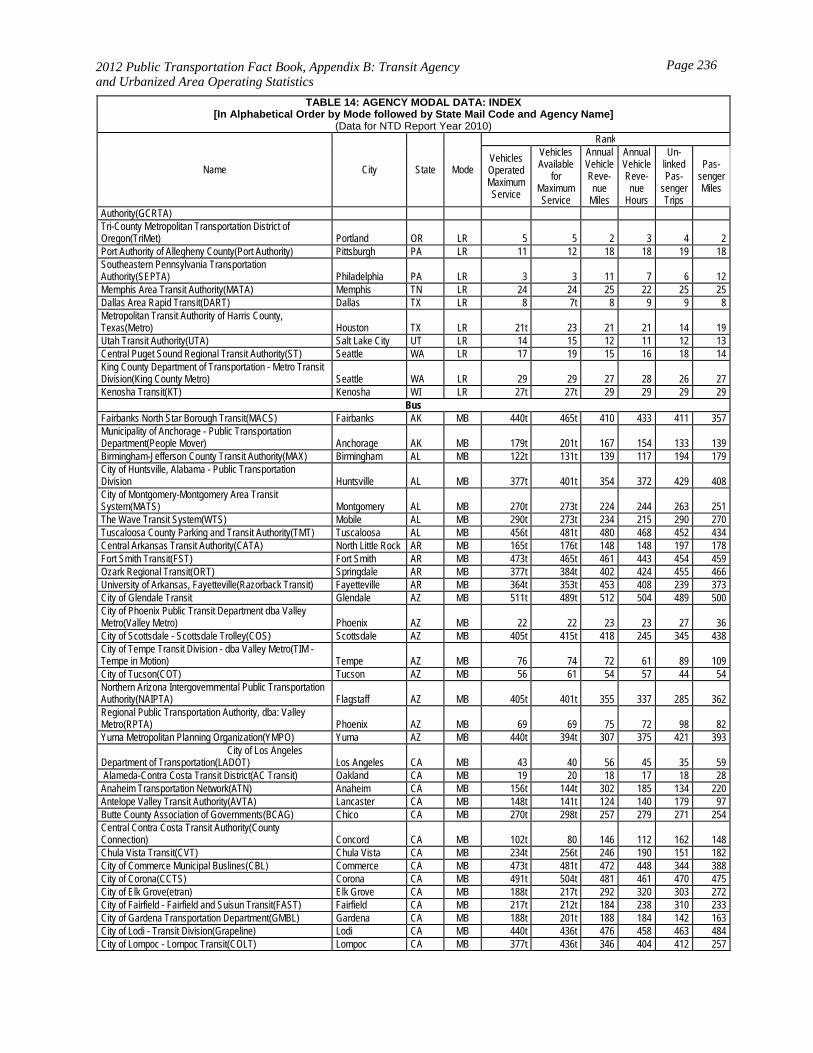
2012 Public Transportation Fact Book, Appendix B: Transit Agency and Urbanized Area Operating Statistics
Page 236
TABLE 14: AGENCY MODAL DATA: INDEX[In Alphabetical Order by Mode followed by State Mail Code and Agency Name]
(Data for NTD Report Year 2010)
Name City State Mode
Rank
Vehicles Operated Maximum Service
Vehicles Available
for Maximum Service
Annual Vehicle Reve-nue
Miles
Annual Vehicle Reve-nue
Hours
Un-linked Pas-
senger Trips
Pas-senger Miles
Authority(GCRTA) Tri-County Metropolitan Transportation District of Oregon(TriMet) Portland OR LR 5 5 2 3 4 2 Port Authority of Allegheny County(Port Authority) Pittsburgh PA LR 11 12 18 18 19 18 Southeastern Pennsylvania Transportation Authority(SEPTA) Philadelphia PA LR 3 3 11 7 6 12 Memphis Area Transit Authority(MATA) Memphis TN LR 24 24 25 22 25 25 Dallas Area Rapid Transit(DART) Dallas TX LR 8 7t 8 9 9 8 Metropolitan Transit Authority of Harris County, Texas(Metro) Houston TX LR 21t 23 21 21 14 19 Utah Transit Authority(UTA) Salt Lake City UT LR 14 15 12 11 12 13 Central Puget Sound Regional Transit Authority(ST) Seattle WA LR 17 19 15 16 18 14 King County Department of Transportation - Metro Transit Division(King County Metro) Seattle WA LR 29 29 27 28 26 27 Kenosha Transit(KT) Kenosha WI LR 27t 27t 29 29 29 29
Bus Fairbanks North Star Borough Transit(MACS) Fairbanks AK MB 440t 465t 410 433 411 357 Municipality of Anchorage - Public Transportation Department(People Mover) Anchorage AK MB 179t 201t 167 154 133 139 Birmingham-Jefferson County Transit Authority(MAX) Birmingham AL MB 122t 131t 139 117 194 179 City of Huntsville, Alabama - Public Transportation Division Huntsville AL MB 377t 401t 354 372 429 408 City of Montgomery-Montgomery Area Transit System(MATS) Montgomery AL MB 270t 273t 224 244 263 251 The Wave Transit System(WTS) Mobile AL MB 290t 273t 234 215 290 270 Tuscaloosa County Parking and Transit Authority(TMT) Tuscaloosa AL MB 456t 481t 480 468 452 434 Central Arkansas Transit Authority(CATA) North Little Rock AR MB 165t 176t 148 148 197 178 Fort Smith Transit(FST) Fort Smith AR MB 473t 465t 461 443 454 459 Ozark Regional Transit(ORT) Springdale AR MB 377t 384t 402 424 455 466 University of Arkansas, Fayetteville(Razorback Transit) Fayetteville AR MB 364t 353t 453 408 239 373 City of Glendale Transit Glendale AZ MB 511t 489t 512 504 489 500 City of Phoenix Public Transit Department dba Valley Metro(Valley Metro) Phoenix AZ MB 22 22 23 23 27 36 City of Scottsdale - Scottsdale Trolley(COS) Scottsdale AZ MB 405t 415t 418 245 345 438 City of Tempe Transit Division - dba Valley Metro(TIM - Tempe in Motion) Tempe AZ MB 76 74 72 61 89 109 City of Tucson(COT) Tucson AZ MB 56 61 54 57 44 54 Northern Arizona Intergovernmental Public Transportation Authority(NAIPTA) Flagstaff AZ MB 405t 401t 355 337 285 362 Regional Public Transportation Authority, dba: Valley Metro(RPTA) Phoenix AZ MB 69 69 75 72 98 82 Yuma Metropolitan Planning Organization(YMPO) Yuma AZ MB 440t 394t 307 375 421 393 City of Los Angeles Department of Transportation(LADOT) Los Angeles CA MB 43 40 56 45 35 59 Alameda-Contra Costa Transit District(AC Transit) Oakland CA MB 19 20 18 17 18 28 Anaheim Transportation Network(ATN) Anaheim CA MB 156t 144t 302 185 134 220 Antelope Valley Transit Authority(AVTA) Lancaster CA MB 148t 141t 124 140 179 97 Butte County Association of Governments(BCAG) Chico CA MB 270t 298t 257 279 271 254 Central Contra Costa Transit Authority(County Connection) Concord CA MB 102t 80 146 112 162 148 Chula Vista Transit(CVT) Chula Vista CA MB 234t 256t 246 190 151 182 City of Commerce Municipal Buslines(CBL) Commerce CA MB 473t 481t 472 448 344 388 City of Corona(CCTS) Corona CA MB 491t 504t 481 461 470 475 City of Elk Grove(etran) Elk Grove CA MB 188t 217t 292 320 303 272 City of Fairfield - Fairfield and Suisun Transit(FAST) Fairfield CA MB 217t 212t 184 238 310 233 City of Gardena Transportation Department(GMBL) Gardena CA MB 188t 201t 188 184 142 163 City of Lodi - Transit Division(Grapeline) Lodi CA MB 440t 436t 476 458 463 484 City of Lompoc - Lompoc Transit(COLT) Lompoc CA MB 377t 436t 346 404 412 257

2012 Public Transportation Fact Book, Appendix B: Transit Agency and Urbanized Area Operating Statistics
Page 237
TABLE 14: AGENCY MODAL DATA: INDEX[In Alphabetical Order by Mode followed by State Mail Code and Agency Name]
(Data for NTD Report Year 2010)
Name City State Mode
Rank
Vehicles Operated Maximum Service
Vehicles Available
for Maximum Service
Annual Vehicle Reve-nue
Miles
Annual Vehicle Reve-nue
Hours
Un-linked Pas-
senger Trips
Pas-senger Miles
City of Petaluma(Petaluma Transit) Petaluma CA MB 473t 489t 488 475 473 483 City of Porterville(C.O.L.T.) Porterville CA MB 456t 424t 441 430 380 390 City of Redondo Beach - Beach Cities Transit(BCT) Redondo Beach CA MB 419t 436t 427 392 410 417 City of San Luis Obispo(SLO Transit) San Luis Obispo CA MB 419t 401t 426 384 295 353 City of Santa Rosa(Santa Rosa CityBus) Santa Rosa CA MB 261t 256t 244 221 176 210 City of Turlock(BLAST and DART) Turlock CA MB 502t 489t 495 492 495 498 City of Union City Transit Division(UCT) Union City CA MB 392t 401t 400 361 393 421 City of Vallejo Transportation Program(Vallejo Transit, Baylink) Vallejo CA MB 208t 172t 164 203 245 166 City of Visalia - Visalia City Coach(Visalia Transit) Visalia CA MB 250t 263t 203 195 240 260 Culver City Municipal Bus Lines(Culver CityBus) Culver City CA MB 208t 201t 197 161 117 147 Foothill Transit West Covina CA MB 42 42 39 42 58 42 Fresno Area Express(FAX) Fresno CA MB 99 97t 89 81 48 90 Gold Coast Transit(GCT) Oxnard CA MB 206t 192t 182 152 149 201 Golden Empire Transit District(GET) Bakersfield CA MB 120t 123t 99 95 100 122 Golden Gate Bridge, Highway and Transportation District(GGBHTD) San Francisco CA MB 64 57 78 87 102 64 Imperial Valley Transit(IVT) El Centro CA MB 357t 366t 342 393 356 197 Kings County Area Public Transit Agency(KART) Hanford CA MB 343t 353t 358 333 333 351 LACMTA - Small Operators(LACMTA) Los Angeles CA MB 59t 53 79 67 72 117 Laguna Beach Municipal Transit(CLB) Laguna Beach CA MB 302t 334t 489 440 354 458 Livermore / Amador Valley Transit Authority(LAVTA) Livermore CA MB 172t 172t 200 208 231 227 Long Beach Transit(LBT) Long Beach CA MB 63 60 67 47 37 47 Los Angeles County Metropolitan Transportation Authority(LACMTA) Los Angeles CA MB 2 2 2 2 2 2 Merced County Transit(The Bus) Merced CA MB 261t 242t 228 266 323 416 Modesto Area Express(MAX) Modesto CA MB 172t 162t 173 162 168 199 Montebello Bus Lines(MBL) Montebello CA MB 134 137t 127 107 93 120 Monterey-Salinas Transit(MST) Monterey CA MB 118 126t 96 106 129 118 Napa County Transportation Planning Agency(NCTPA) Napa CA MB 270t 263t 275 251 343 387 North County Transit District(NCTD) Oceanside CA MB 75 82 82 80 95 95 Norwalk Transit System(NTS) Norwalk CA MB 281t 263t 232 217 204 237 Omnitrans(OMNI) San Bernardino CA MB 77 78 52 49 57 61 Orange County Transportation Authority(OCTA) Orange CA MB 20 19 20 20 22 18 Peninsula Corridor Joint Powers Board(PCJPB) San Carlos CA MB 221t 237t 271 186 255 368 Placer County Department of Public Works(PCDPW) Auburn CA MB 317t 249t 237 307 330 238 Redding Area Bus Authority(RABA) Redding CA MB 392t 376t 353 343 342 330 Riverside Transit Agency(RTA) Riverside CA MB 79t 77 61 71 96 77 Roseville Transit Roseville CA MB 333t 231 360 349 417 370 Sacramento Regional Transit District(Sacramento RT) Sacramento CA MB 62 71 66 52 49 66 San Diego Metropolitan Transit System(MTS) San Diego CA MB 25 24 25 21 23 27 San Francisco Municipal Railway(MUNI) San Francisco CA MB 26 33 36 26 9 21 San Joaquin Regional Transit District(RTD) Stockton CA MB 100 105 105 109 126 119 San Luis Obispo Regional Transit Authority(SLORTA) San Luis Obispo CA MB 343t 353t 285 403 371 164 San Mateo County Transit District(SamTrans) San Carlos CA MB 44 43 70 55 56 58 Santa Barbara Metropolitan Transit District(SBMTD) Santa Barbara CA MB 107t 107 125 116 94 106 Santa Clara Valley Transportation Authority(VTA) San Jose CA MB 28 28 30 28 33 34 Santa Clarita Transit(SCT) Santa Clarita CA MB 120t 129t 117 147 138 93 Santa Cruz Metropolitan Transit District(SCMTD) Santa Cruz CA MB 113 125 107 111 110 98 Santa Maria Area Transit(SMAT) Santa Maria CA MB 343t 353t 313 322 284 242 Santa Monica's Big Blue Bus(Big Blue Bus ) Santa Monica CA MB 74 70 81 66 41 55 Simi Valley Transit(SVT) Simi Valley CA MB 440t 436t 398 401 386 379 Sonoma County Transit Santa Rosa CA MB 221t 156 206 242 269 198 SunLine Transit Agency(SunLine) Thousand Palms CA MB 188t 147t 135 133 141 131 The Eastern Contra Costa Transit Authority(Tri Delta Transit) Antioch CA MB 151t 147t 156 153 198 171 Thousand Oaks Transit(TOT) Thousand Oaks CA MB 502t 504t 487 491 465 441
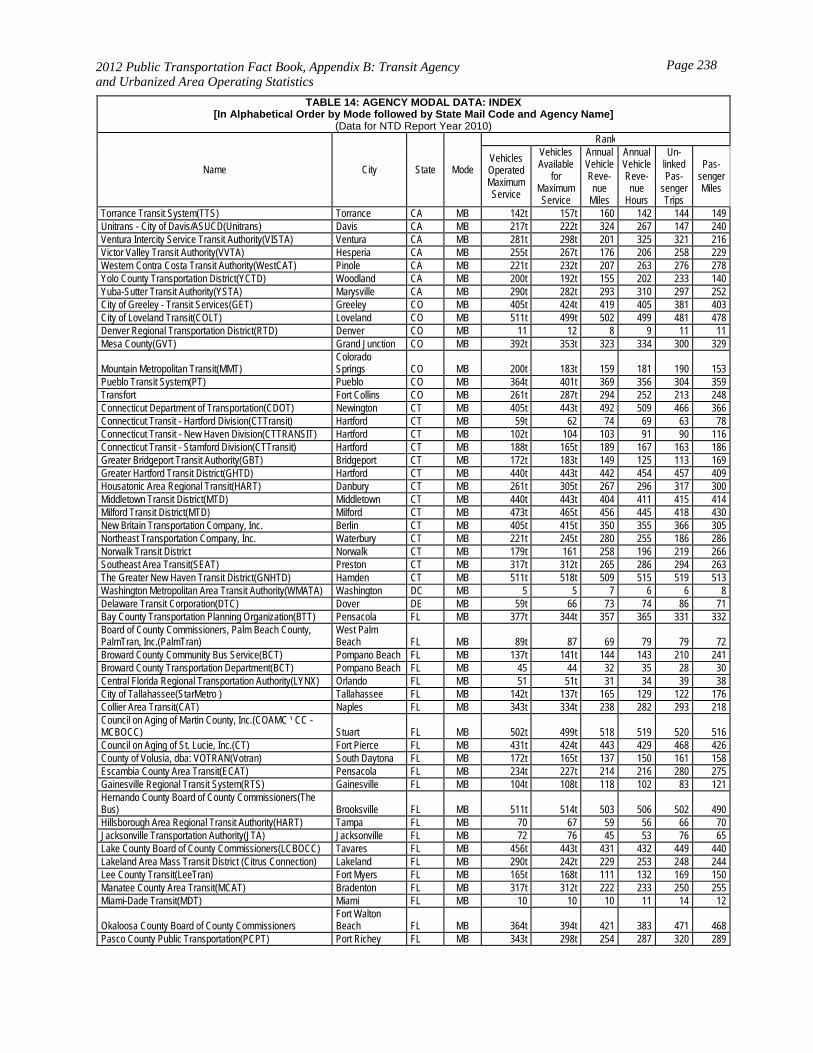
2012 Public Transportation Fact Book, Appendix B: Transit Agency and Urbanized Area Operating Statistics
Page 238
TABLE 14: AGENCY MODAL DATA: INDEX[In Alphabetical Order by Mode followed by State Mail Code and Agency Name]
(Data for NTD Report Year 2010)
Name City State Mode
Rank
Vehicles Operated Maximum Service
Vehicles Available
for Maximum Service
Annual Vehicle Reve-nue
Miles
Annual Vehicle Reve-nue
Hours
Un-linked Pas-
senger Trips
Pas-senger Miles
Torrance Transit System(TTS) Torrance CA MB 142t 157t 160 142 144 149 Unitrans - City of Davis/ASUCD(Unitrans) Davis CA MB 217t 222t 324 267 147 240 Ventura Intercity Service Transit Authority(VISTA) Ventura CA MB 281t 298t 201 325 321 216 Victor Valley Transit Authority(VVTA) Hesperia CA MB 255t 267t 176 206 258 229 Western Contra Costa Transit Authority(WestCAT) Pinole CA MB 221t 232t 207 263 276 278 Yolo County Transportation District(YCTD) Woodland CA MB 200t 192t 155 202 233 140 Yuba-Sutter Transit Authority(YSTA) Marysville CA MB 290t 282t 293 310 297 252 City of Greeley - Transit Services(GET) Greeley CO MB 405t 424t 419 405 381 403 City of Loveland Transit(COLT) Loveland CO MB 511t 499t 502 499 481 478 Denver Regional Transportation District(RTD) Denver CO MB 11 12 8 9 11 11 Mesa County(GVT) Grand Junction CO MB 392t 353t 323 334 300 329
Mountain Metropolitan Transit(MMT) Colorado Springs CO MB 200t 183t 159 181 190 153
Pueblo Transit System(PT) Pueblo CO MB 364t 401t 369 356 304 359 Transfort Fort Collins CO MB 261t 287t 294 252 213 248 Connecticut Department of Transportation(CDOT) Newington CT MB 405t 443t 492 509 466 366 Connecticut Transit - Hartford Division(CTTransit) Hartford CT MB 59t 62 74 69 63 78 Connecticut Transit - New Haven Division(CTTRANSIT) Hartford CT MB 102t 104 103 91 90 116 Connecticut Transit - Stamford Division(CTTransit) Hartford CT MB 188t 165t 189 167 163 186 Greater Bridgeport Transit Authority(GBT) Bridgeport CT MB 172t 183t 149 125 113 169 Greater Hartford Transit District(GHTD) Hartford CT MB 440t 443t 442 454 457 409 Housatonic Area Regional Transit(HART) Danbury CT MB 261t 305t 267 296 317 300 Middletown Transit District(MTD) Middletown CT MB 440t 443t 404 411 415 414 Milford Transit District(MTD) Milford CT MB 473t 465t 456 445 418 430 New Britain Transportation Company, Inc. Berlin CT MB 405t 415t 350 355 366 305 Northeast Transportation Company, Inc. Waterbury CT MB 221t 245t 280 255 186 286 Norwalk Transit District Norwalk CT MB 179t 161 258 196 219 266 Southeast Area Transit(SEAT) Preston CT MB 317t 312t 265 286 294 263 The Greater New Haven Transit District(GNHTD) Hamden CT MB 511t 518t 509 515 519 513 Washington Metropolitan Area Transit Authority(WMATA) Washington DC MB 5 5 7 6 6 8 Delaware Transit Corporation(DTC) Dover DE MB 59t 66 73 74 86 71 Bay County Transportation Planning Organization(BTT) Pensacola FL MB 377t 344t 357 365 331 332 Board of County Commissioners, Palm Beach County, PalmTran, Inc.(PalmTran)
West Palm Beach FL MB 89t 87 69 79 79 72
Broward County Community Bus Service(BCT) Pompano Beach FL MB 137t 141t 144 143 210 241 Broward County Transportation Department(BCT) Pompano Beach FL MB 45 44 32 35 28 30 Central Florida Regional Transportation Authority(LYNX) Orlando FL MB 51 51t 31 34 39 38 City of Tallahassee(StarMetro ) Tallahassee FL MB 142t 137t 165 129 122 176 Collier Area Transit(CAT) Naples FL MB 343t 334t 238 282 293 218 Council on Aging of Martin County, Inc.(COAMC \ CC - MCBOCC) Stuart FL MB 502t 499t 518 519 520 516 Council on Aging of St. Lucie, Inc.(CT) Fort Pierce FL MB 431t 424t 443 429 468 426 County of Volusia, dba: VOTRAN(Votran) South Daytona FL MB 172t 165t 137 150 161 158 Escambia County Area Transit(ECAT) Pensacola FL MB 234t 227t 214 216 280 275 Gainesville Regional Transit System(RTS) Gainesville FL MB 104t 108t 118 102 83 121 Hernando County Board of County Commissioners(The Bus) Brooksville FL MB 511t 514t 503 506 502 490 Hillsborough Area Regional Transit Authority(HART) Tampa FL MB 70 67 59 56 66 70 Jacksonville Transportation Authority(JTA) Jacksonville FL MB 72 76 45 53 76 65 Lake County Board of County Commissioners(LCBOCC) Tavares FL MB 456t 443t 431 432 449 440 Lakeland Area Mass Transit District (Citrus Connection) Lakeland FL MB 290t 242t 229 253 248 244 Lee County Transit(LeeTran) Fort Myers FL MB 165t 168t 111 132 169 150 Manatee County Area Transit(MCAT) Bradenton FL MB 317t 312t 222 233 250 255 Miami-Dade Transit(MDT) Miami FL MB 10 10 10 11 14 12
Okaloosa County Board of County Commissioners Fort Walton Beach FL MB 364t 394t 421 383 471 468
Pasco County Public Transportation(PCPT) Port Richey FL MB 343t 298t 254 287 320 289
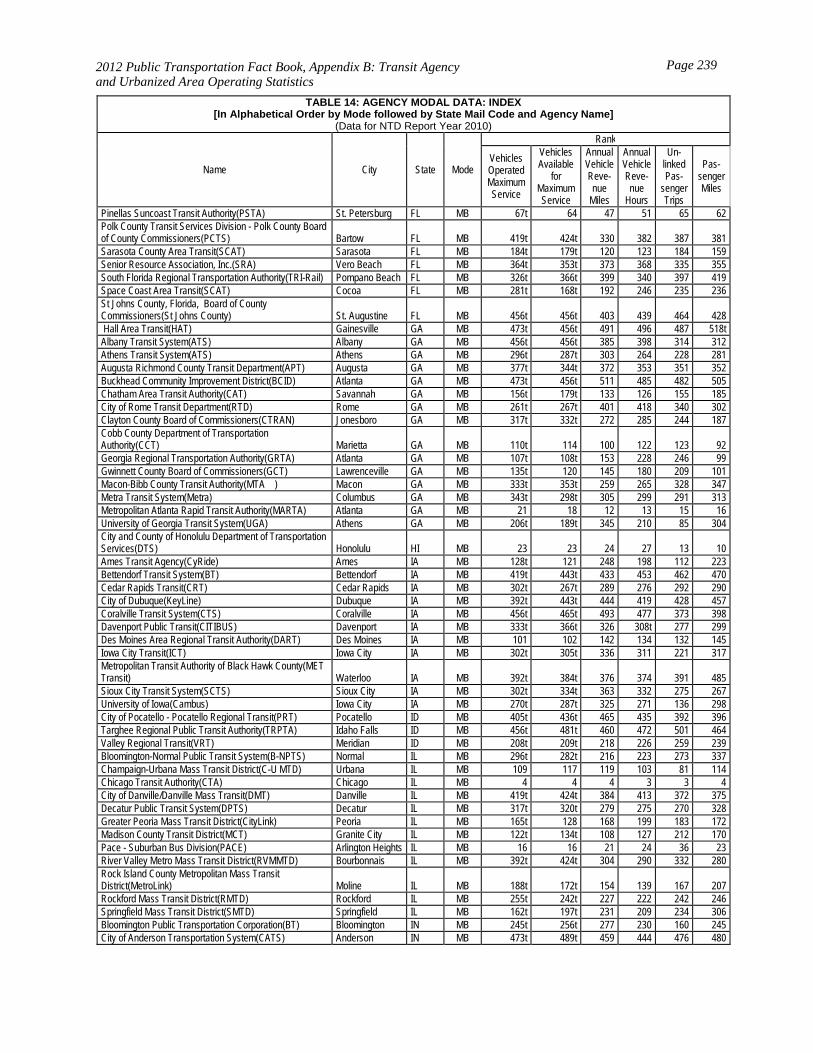
2012 Public Transportation Fact Book, Appendix B: Transit Agency and Urbanized Area Operating Statistics
Page 239
TABLE 14: AGENCY MODAL DATA: INDEX[In Alphabetical Order by Mode followed by State Mail Code and Agency Name]
(Data for NTD Report Year 2010)
Name City State Mode
Rank
Vehicles Operated Maximum Service
Vehicles Available
for Maximum Service
Annual Vehicle Reve-nue
Miles
Annual Vehicle Reve-nue
Hours
Un-linked Pas-
senger Trips
Pas-senger Miles
Pinellas Suncoast Transit Authority(PSTA) St. Petersburg FL MB 67t 64 47 51 65 62 Polk County Transit Services Division - Polk County Board of County Commissioners(PCTS) Bartow FL MB 419t 424t 330 382 387 381 Sarasota County Area Transit(SCAT) Sarasota FL MB 184t 179t 120 123 184 159 Senior Resource Association, Inc.(SRA) Vero Beach FL MB 364t 353t 373 368 335 355 South Florida Regional Transportation Authority(TRI-Rail) Pompano Beach FL MB 326t 366t 399 340 397 419 Space Coast Area Transit(SCAT) Cocoa FL MB 281t 168t 192 246 235 236 St Johns County, Florida, Board of County Commissioners(St Johns County) St. Augustine FL MB 456t 456t 403 439 464 428 Hall Area Transit(HAT) Gainesville GA MB 473t 456t 491 496 487 518t Albany Transit System(ATS) Albany GA MB 456t 456t 385 398 314 312 Athens Transit System(ATS) Athens GA MB 296t 287t 303 264 228 281 Augusta Richmond County Transit Department(APT) Augusta GA MB 377t 344t 372 353 351 352 Buckhead Community Improvement District(BCID) Atlanta GA MB 473t 456t 511 485 482 505 Chatham Area Transit Authority(CAT) Savannah GA MB 156t 179t 133 126 155 185 City of Rome Transit Department(RTD) Rome GA MB 261t 267t 401 418 340 302 Clayton County Board of Commissioners(CTRAN) Jonesboro GA MB 317t 332t 272 285 244 187 Cobb County Department of Transportation Authority(CCT) Marietta GA MB 110t 114 100 122 123 92 Georgia Regional Transportation Authority(GRTA) Atlanta GA MB 107t 108t 153 228 246 99 Gwinnett County Board of Commissioners(GCT) Lawrenceville GA MB 135t 120 145 180 209 101 Macon-Bibb County Transit Authority(MTA ) Macon GA MB 333t 353t 259 265 328 347 Metra Transit System(Metra) Columbus GA MB 343t 298t 305 299 291 313 Metropolitan Atlanta Rapid Transit Authority(MARTA) Atlanta GA MB 21 18 12 13 15 16 University of Georgia Transit System(UGA) Athens GA MB 206t 189t 345 210 85 304 City and County of Honolulu Department of Transportation Services(DTS) Honolulu HI MB 23 23 24 27 13 10 Ames Transit Agency(CyRide) Ames IA MB 128t 121 248 198 112 223 Bettendorf Transit System(BT) Bettendorf IA MB 419t 443t 433 453 462 470 Cedar Rapids Transit(CRT) Cedar Rapids IA MB 302t 267t 289 276 292 290 City of Dubuque(KeyLine) Dubuque IA MB 392t 443t 444 419 428 457 Coralville Transit System(CTS) Coralville IA MB 456t 465t 493 477 373 398 Davenport Public Transit(CITIBUS) Davenport IA MB 333t 366t 326 308t 277 299 Des Moines Area Regional Transit Authority(DART) Des Moines IA MB 101 102 142 134 132 145 Iowa City Transit(ICT) Iowa City IA MB 302t 305t 336 311 221 317 Metropolitan Transit Authority of Black Hawk County(MET Transit) Waterloo IA MB 392t 384t 376 374 391 485 Sioux City Transit System(SCTS) Sioux City IA MB 302t 334t 363 332 275 267 University of Iowa(Cambus) Iowa City IA MB 270t 287t 325 271 136 298 City of Pocatello - Pocatello Regional Transit(PRT) Pocatello ID MB 405t 436t 465 435 392 396 Targhee Regional Public Transit Authority(TRPTA) Idaho Falls ID MB 456t 481t 460 472 501 464 Valley Regional Transit(VRT) Meridian ID MB 208t 209t 218 226 259 239 Bloomington-Normal Public Transit System(B-NPTS) Normal IL MB 296t 282t 216 223 273 337 Champaign-Urbana Mass Transit District(C-U MTD) Urbana IL MB 109 117 119 103 81 114 Chicago Transit Authority(CTA) Chicago IL MB 4 4 4 3 3 4 City of Danville/Danville Mass Transit(DMT) Danville IL MB 419t 424t 384 413 372 375 Decatur Public Transit System(DPTS) Decatur IL MB 317t 320t 279 275 270 328 Greater Peoria Mass Transit District(CityLink) Peoria IL MB 165t 128 168 199 183 172 Madison County Transit District(MCT) Granite City IL MB 122t 134t 108 127 212 170 Pace - Suburban Bus Division(PACE) Arlington Heights IL MB 16 16 21 24 36 23 River Valley Metro Mass Transit District(RVMMTD) Bourbonnais IL MB 392t 424t 304 290 332 280 Rock Island County Metropolitan Mass Transit District(MetroLink) Moline IL MB 188t 172t 154 139 167 207 Rockford Mass Transit District(RMTD) Rockford IL MB 255t 242t 227 222 242 246 Springfield Mass Transit District(SMTD) Springfield IL MB 162t 197t 231 209 234 306 Bloomington Public Transportation Corporation(BT) Bloomington IN MB 245t 256t 277 230 160 245 City of Anderson Transportation System(CATS) Anderson IN MB 473t 489t 459 444 476 480
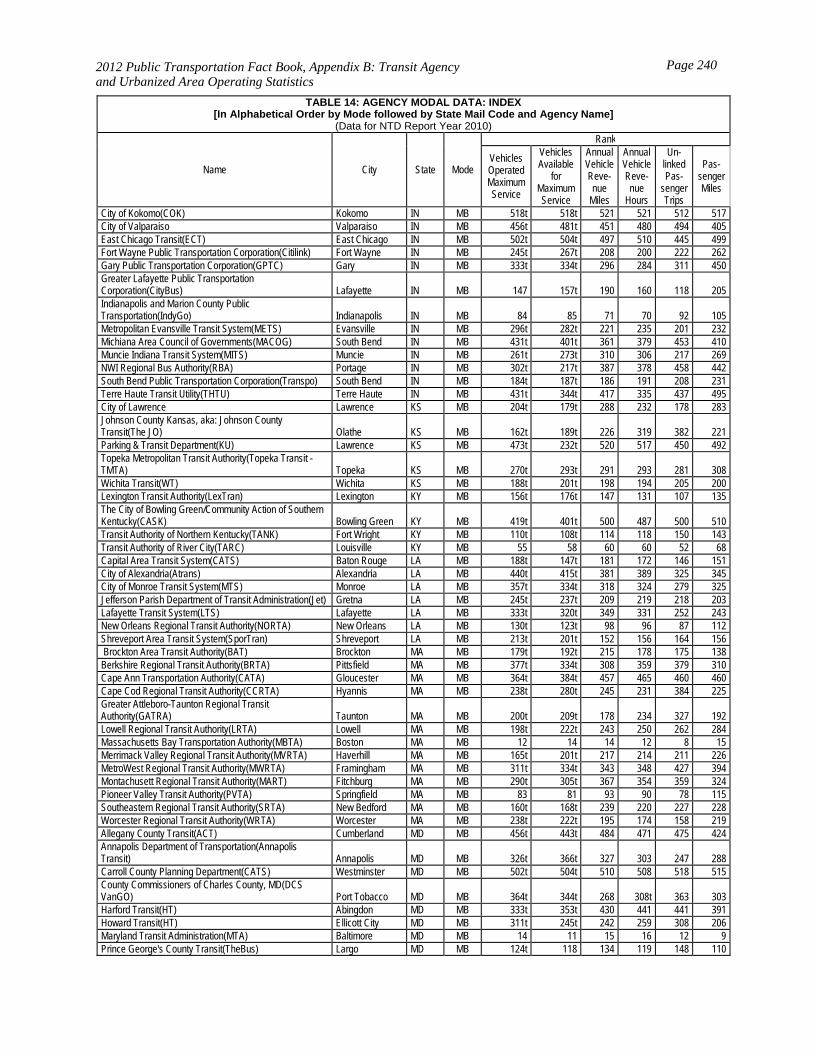
2012 Public Transportation Fact Book, Appendix B: Transit Agency and Urbanized Area Operating Statistics
Page 240
TABLE 14: AGENCY MODAL DATA: INDEX[In Alphabetical Order by Mode followed by State Mail Code and Agency Name]
(Data for NTD Report Year 2010)
Name City State Mode
Rank
Vehicles Operated Maximum Service
Vehicles Available
for Maximum Service
Annual Vehicle Reve-nue
Miles
Annual Vehicle Reve-nue
Hours
Un-linked Pas-
senger Trips
Pas-senger Miles
City of Kokomo(COK) Kokomo IN MB 518t 518t 521 521 512 517 City of Valparaiso Valparaiso IN MB 456t 481t 451 480 494 405 East Chicago Transit(ECT) East Chicago IN MB 502t 504t 497 510 445 499 Fort Wayne Public Transportation Corporation(Citilink) Fort Wayne IN MB 245t 267t 208 200 222 262 Gary Public Transportation Corporation(GPTC) Gary IN MB 333t 334t 296 284 311 450 Greater Lafayette Public Transportation Corporation(CityBus) Lafayette IN MB 147 157t 190 160 118 205 Indianapolis and Marion County Public Transportation(IndyGo) Indianapolis IN MB 84 85 71 70 92 105 Metropolitan Evansville Transit System(METS) Evansville IN MB 296t 282t 221 235 201 232 Michiana Area Council of Governments(MACOG) South Bend IN MB 431t 401t 361 379 453 410 Muncie Indiana Transit System(MITS) Muncie IN MB 261t 273t 310 306 217 269 NWI Regional Bus Authority(RBA) Portage IN MB 302t 217t 387 378 458 442 South Bend Public Transportation Corporation(Transpo) South Bend IN MB 184t 187t 186 191 208 231 Terre Haute Transit Utility(THTU) Terre Haute IN MB 431t 344t 417 335 437 495 City of Lawrence Lawrence KS MB 204t 179t 288 232 178 283 Johnson County Kansas, aka: Johnson County Transit(The JO) Olathe KS MB 162t 189t 226 319 382 221 Parking & Transit Department(KU) Lawrence KS MB 473t 232t 520 517 450 492 Topeka Metropolitan Transit Authority(Topeka Transit - TMTA) Topeka KS MB 270t 293t 291 293 281 308 Wichita Transit(WT) Wichita KS MB 188t 201t 198 194 205 200 Lexington Transit Authority(LexTran) Lexington KY MB 156t 176t 147 131 107 135 The City of Bowling Green/Community Action of Southern Kentucky(CASK) Bowling Green KY MB 419t 401t 500 487 500 510 Transit Authority of Northern Kentucky(TANK) Fort Wright KY MB 110t 108t 114 118 150 143 Transit Authority of River City(TARC) Louisville KY MB 55 58 60 60 52 68 Capital Area Transit System(CATS) Baton Rouge LA MB 188t 147t 181 172 146 151 City of Alexandria(Atrans) Alexandria LA MB 440t 415t 381 389 325 345 City of Monroe Transit System(MTS) Monroe LA MB 357t 334t 318 324 279 325 Jefferson Parish Department of Transit Administration(Jet) Gretna LA MB 245t 237t 209 219 218 203 Lafayette Transit System(LTS) Lafayette LA MB 333t 320t 349 331 252 243 New Orleans Regional Transit Authority(NORTA) New Orleans LA MB 130t 123t 98 96 87 112 Shreveport Area Transit System(SporTran) Shreveport LA MB 213t 201t 152 156 164 156 Brockton Area Transit Authority(BAT) Brockton MA MB 179t 192t 215 178 175 138 Berkshire Regional Transit Authority(BRTA) Pittsfield MA MB 377t 334t 308 359 379 310 Cape Ann Transportation Authority(CATA) Gloucester MA MB 364t 384t 457 465 460 460 Cape Cod Regional Transit Authority(CCRTA) Hyannis MA MB 238t 280t 245 231 384 225 Greater Attleboro-Taunton Regional Transit Authority(GATRA) Taunton MA MB 200t 209t 178 234 327 192 Lowell Regional Transit Authority(LRTA) Lowell MA MB 198t 222t 243 250 262 284 Massachusetts Bay Transportation Authority(MBTA) Boston MA MB 12 14 14 12 8 15 Merrimack Valley Regional Transit Authority(MVRTA) Haverhill MA MB 165t 201t 217 214 211 226 MetroWest Regional Transit Authority(MWRTA) Framingham MA MB 311t 334t 343 348 427 394 Montachusett Regional Transit Authority(MART) Fitchburg MA MB 290t 305t 367 354 359 324 Pioneer Valley Transit Authority(PVTA) Springfield MA MB 83 81 93 90 78 115 Southeastern Regional Transit Authority(SRTA) New Bedford MA MB 160t 168t 239 220 227 228 Worcester Regional Transit Authority(WRTA) Worcester MA MB 238t 222t 195 174 158 219 Allegany County Transit(ACT) Cumberland MD MB 456t 443t 484 471 475 424 Annapolis Department of Transportation(Annapolis Transit) Annapolis MD MB 326t 366t 327 303 247 288 Carroll County Planning Department(CATS) Westminster MD MB 502t 504t 510 508 518 515 County Commissioners of Charles County, MD(DCS VanGO) Port Tobacco MD MB 364t 344t 268 308t 363 303 Harford Transit(HT) Abingdon MD MB 333t 353t 430 441 441 391 Howard Transit(HT) Ellicott City MD MB 311t 245t 242 259 308 206 Maryland Transit Administration(MTA) Baltimore MD MB 14 11 15 16 12 9 Prince George's County Transit(TheBus) Largo MD MB 124t 118 134 119 148 110
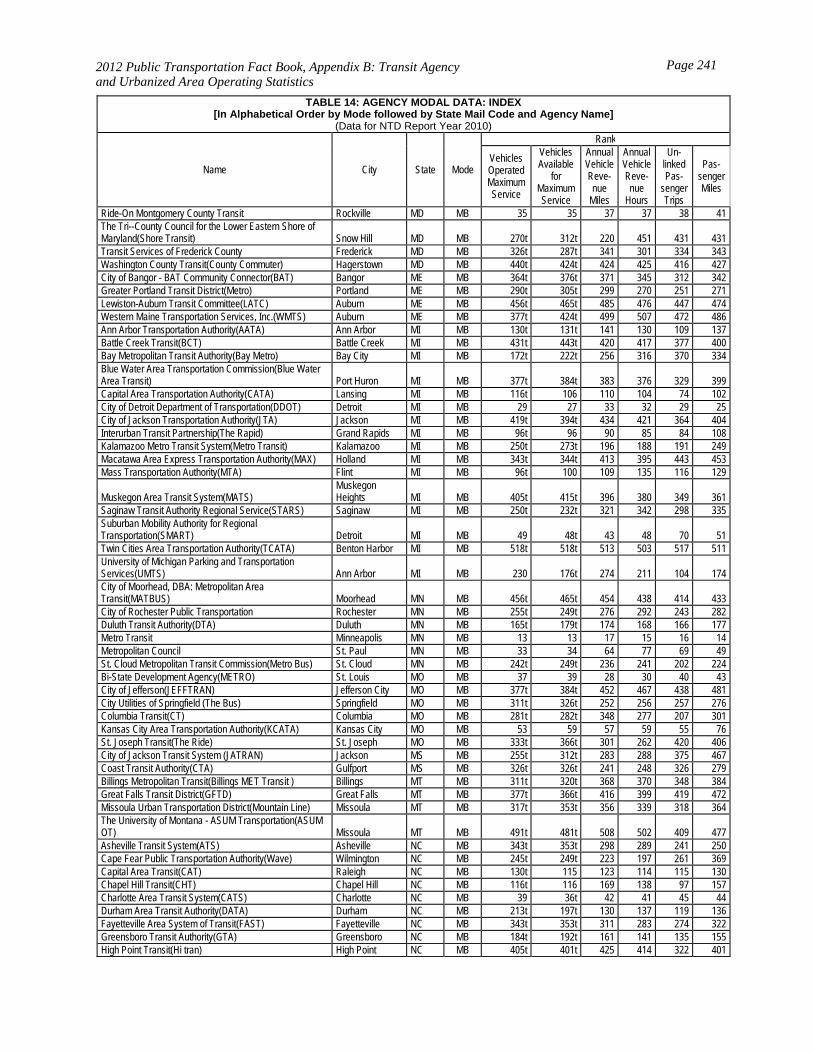
2012 Public Transportation Fact Book, Appendix B: Transit Agency and Urbanized Area Operating Statistics
Page 241
TABLE 14: AGENCY MODAL DATA: INDEX[In Alphabetical Order by Mode followed by State Mail Code and Agency Name]
(Data for NTD Report Year 2010)
Name City State Mode
Rank
Vehicles Operated Maximum Service
Vehicles Available
for Maximum Service
Annual Vehicle Reve-nue
Miles
Annual Vehicle Reve-nue
Hours
Un-linked Pas-
senger Trips
Pas-senger Miles
Ride-On Montgomery County Transit Rockville MD MB 35 35 37 37 38 41 The Tri--County Council for the Lower Eastern Shore of Maryland(Shore Transit) Snow Hill MD MB 270t 312t 220 451 431 431 Transit Services of Frederick County Frederick MD MB 326t 287t 341 301 334 343 Washington County Transit(County Commuter) Hagerstown MD MB 440t 424t 424 425 416 427 City of Bangor - BAT Community Connector(BAT) Bangor ME MB 364t 376t 371 345 312 342 Greater Portland Transit District(Metro) Portland ME MB 290t 305t 299 270 251 271 Lewiston-Auburn Transit Committee(LATC) Auburn ME MB 456t 465t 485 476 447 474 Western Maine Transportation Services, Inc.(WMTS) Auburn ME MB 377t 424t 499 507 472 486 Ann Arbor Transportation Authority(AATA) Ann Arbor MI MB 130t 131t 141 130 109 137 Battle Creek Transit(BCT) Battle Creek MI MB 431t 443t 420 417 377 400 Bay Metropolitan Transit Authority(Bay Metro) Bay City MI MB 172t 222t 256 316 370 334 Blue Water Area Transportation Commission(Blue Water Area Transit) Port Huron MI MB 377t 384t 383 376 329 399 Capital Area Transportation Authority(CATA) Lansing MI MB 116t 106 110 104 74 102 City of Detroit Department of Transportation(DDOT) Detroit MI MB 29 27 33 32 29 25 City of Jackson Transportation Authority(JTA) Jackson MI MB 419t 394t 434 421 364 404 Interurban Transit Partnership(The Rapid) Grand Rapids MI MB 96t 96 90 85 84 108 Kalamazoo Metro Transit System(Metro Transit) Kalamazoo MI MB 250t 273t 196 188 191 249 Macatawa Area Express Transportation Authority(MAX) Holland MI MB 343t 344t 413 395 443 453 Mass Transportation Authority(MTA) Flint MI MB 96t 100 109 135 116 129
Muskegon Area Transit System(MATS) Muskegon Heights MI MB 405t 415t 396 380 349 361
Saginaw Transit Authority Regional Service(STARS) Saginaw MI MB 250t 232t 321 342 298 335 Suburban Mobility Authority for Regional Transportation(SMART) Detroit MI MB 49 48t 43 48 70 51 Twin Cities Area Transportation Authority(TCATA) Benton Harbor MI MB 518t 518t 513 503 517 511 University of Michigan Parking and Transportation Services(UMTS) Ann Arbor MI MB 230 176t 274 211 104 174 City of Moorhead, DBA: Metropolitan Area Transit(MATBUS) Moorhead MN MB 456t 465t 454 438 414 433 City of Rochester Public Transportation Rochester MN MB 255t 249t 276 292 243 282 Duluth Transit Authority(DTA) Duluth MN MB 165t 179t 174 168 166 177 Metro Transit Minneapolis MN MB 13 13 17 15 16 14 Metropolitan Council St. Paul MN MB 33 34 64 77 69 49 St. Cloud Metropolitan Transit Commission(Metro Bus) St. Cloud MN MB 242t 249t 236 241 202 224 Bi-State Development Agency(METRO) St. Louis MO MB 37 39 28 30 40 43 City of Jefferson(JEFFTRAN) Jefferson City MO MB 377t 384t 452 467 438 481 City Utilities of Springfield (The Bus) Springfield MO MB 311t 326t 252 256 257 276 Columbia Transit(CT) Columbia MO MB 281t 282t 348 277 207 301 Kansas City Area Transportation Authority(KCATA) Kansas City MO MB 53 59 57 59 55 76 St. Joseph Transit(The Ride) St. Joseph MO MB 333t 366t 301 262 420 406 City of Jackson Transit System (JATRAN) Jackson MS MB 255t 312t 283 288 375 467 Coast Transit Authority(CTA) Gulfport MS MB 326t 326t 241 248 326 279 Billings Metropolitan Transit(Billings MET Transit ) Billings MT MB 311t 320t 368 370 348 384 Great Falls Transit District(GFTD) Great Falls MT MB 377t 366t 416 399 419 472 Missoula Urban Transportation District(Mountain Line) Missoula MT MB 317t 353t 356 339 318 364 The University of Montana - ASUM Transportation(ASUM OT) Missoula MT MB 491t 481t 508 502 409 477 Asheville Transit System(ATS) Asheville NC MB 343t 353t 298 289 241 250 Cape Fear Public Transportation Authority(Wave) Wilmington NC MB 245t 249t 223 197 261 369 Capital Area Transit(CAT) Raleigh NC MB 130t 115 123 114 115 130 Chapel Hill Transit(CHT) Chapel Hill NC MB 116t 116 169 138 97 157 Charlotte Area Transit System(CATS) Charlotte NC MB 39 36t 42 41 45 44 Durham Area Transit Authority(DATA) Durham NC MB 213t 197t 130 137 119 136 Fayetteville Area System of Transit(FAST) Fayetteville NC MB 343t 353t 311 283 274 322 Greensboro Transit Authority(GTA) Greensboro NC MB 184t 192t 161 141 135 155 High Point Transit(Hi tran) High Point NC MB 405t 401t 425 414 322 401
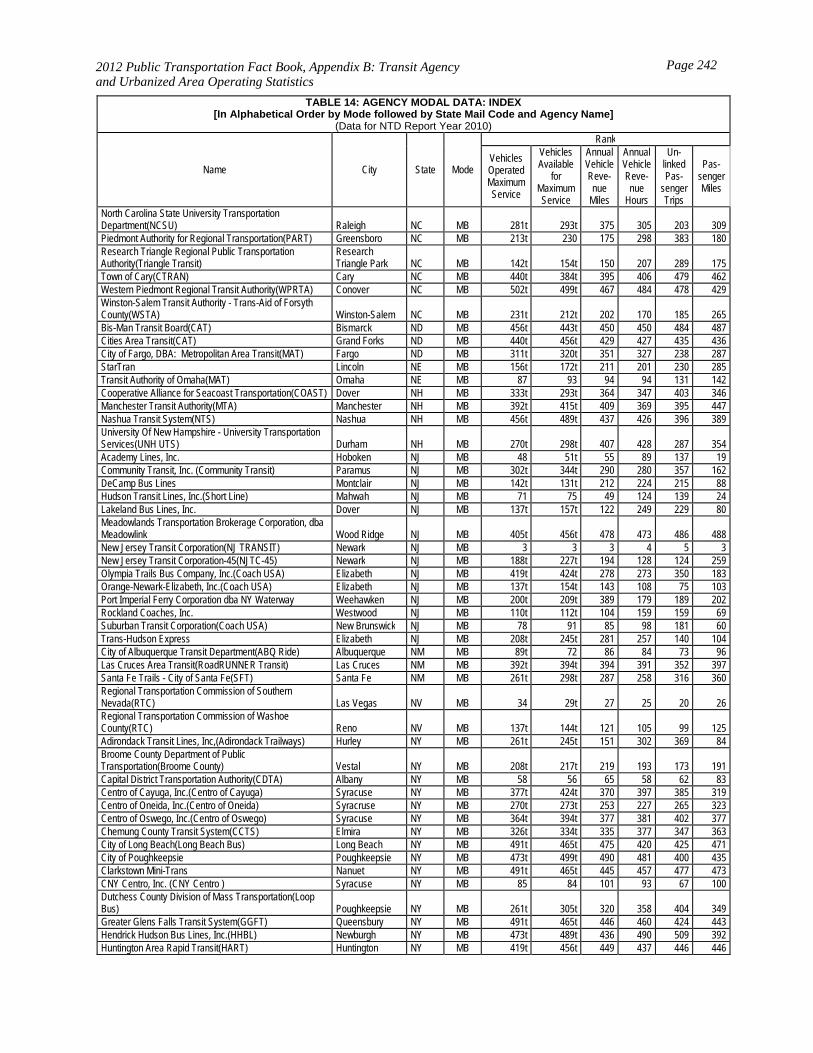
2012 Public Transportation Fact Book, Appendix B: Transit Agency and Urbanized Area Operating Statistics
Page 242
TABLE 14: AGENCY MODAL DATA: INDEX[In Alphabetical Order by Mode followed by State Mail Code and Agency Name]
(Data for NTD Report Year 2010)
Name City State Mode
Rank
Vehicles Operated Maximum Service
Vehicles Available
for Maximum Service
Annual Vehicle Reve-nue
Miles
Annual Vehicle Reve-nue
Hours
Un-linked Pas-
senger Trips
Pas-senger Miles
North Carolina State University Transportation Department(NCSU) Raleigh NC MB 281t 293t 375 305 203 309 Piedmont Authority for Regional Transportation(PART) Greensboro NC MB 213t 230 175 298 383 180 Research Triangle Regional Public Transportation Authority(Triangle Transit)
Research Triangle Park NC MB 142t 154t 150 207 289 175
Town of Cary(CTRAN) Cary NC MB 440t 384t 395 406 479 462 Western Piedmont Regional Transit Authority(WPRTA) Conover NC MB 502t 499t 467 484 478 429 Winston-Salem Transit Authority - Trans-Aid of Forsyth County(WSTA) Winston-Salem NC MB 231t 212t 202 170 185 265 Bis-Man Transit Board(CAT) Bismarck ND MB 456t 443t 450 450 484 487 Cities Area Transit(CAT) Grand Forks ND MB 440t 456t 429 427 435 436 City of Fargo, DBA: Metropolitan Area Transit(MAT) Fargo ND MB 311t 320t 351 327 238 287 StarTran Lincoln NE MB 156t 172t 211 201 230 285 Transit Authority of Omaha(MAT) Omaha NE MB 87 93 94 94 131 142 Cooperative Alliance for Seacoast Transportation(COAST) Dover NH MB 333t 293t 364 347 403 346 Manchester Transit Authority(MTA) Manchester NH MB 392t 415t 409 369 395 447 Nashua Transit System(NTS) Nashua NH MB 456t 489t 437 426 396 389 University Of New Hampshire - University Transportation Services(UNH UTS) Durham NH MB 270t 298t 407 428 287 354 Academy Lines, Inc. Hoboken NJ MB 48 51t 55 89 137 19 Community Transit, Inc. (Community Transit) Paramus NJ MB 302t 344t 290 280 357 162 DeCamp Bus Lines Montclair NJ MB 142t 131t 212 224 215 88 Hudson Transit Lines, Inc.(Short Line) Mahwah NJ MB 71 75 49 124 139 24 Lakeland Bus Lines, Inc. Dover NJ MB 137t 157t 122 249 229 80 Meadowlands Transportation Brokerage Corporation, dba Meadowlink Wood Ridge NJ MB 405t 456t 478 473 486 488 New Jersey Transit Corporation(NJ TRANSIT) Newark NJ MB 3 3 3 4 5 3 New Jersey Transit Corporation-45(NJTC-45) Newark NJ MB 188t 227t 194 128 124 259 Olympia Trails Bus Company, Inc.(Coach USA) Elizabeth NJ MB 419t 424t 278 273 350 183 Orange-Newark-Elizabeth, Inc.(Coach USA) Elizabeth NJ MB 137t 154t 143 108 75 103 Port Imperial Ferry Corporation dba NY Waterway Weehawken NJ MB 200t 209t 389 179 189 202 Rockland Coaches, Inc. Westwood NJ MB 110t 112t 104 159 159 69 Suburban Transit Corporation(Coach USA) New Brunswick NJ MB 78 91 85 98 181 60 Trans-Hudson Express Elizabeth NJ MB 208t 245t 281 257 140 104 City of Albuquerque Transit Department(ABQ Ride) Albuquerque NM MB 89t 72 86 84 73 96 Las Cruces Area Transit(RoadRUNNER Transit) Las Cruces NM MB 392t 394t 394 391 352 397 Santa Fe Trails - City of Santa Fe(SFT) Santa Fe NM MB 261t 298t 287 258 316 360 Regional Transportation Commission of Southern Nevada(RTC) Las Vegas NV MB 34 29t 27 25 20 26 Regional Transportation Commission of Washoe County(RTC) Reno NV MB 137t 144t 121 105 99 125 Adirondack Transit Lines, Inc,(Adirondack Trailways) Hurley NY MB 261t 245t 151 302 369 84 Broome County Department of Public Transportation(Broome County) Vestal NY MB 208t 217t 219 193 173 191 Capital District Transportation Authority(CDTA) Albany NY MB 58 56 65 58 62 83 Centro of Cayuga, Inc.(Centro of Cayuga) Syracuse NY MB 377t 424t 370 397 385 319 Centro of Oneida, Inc.(Centro of Oneida) Syracruse NY MB 270t 273t 253 227 265 323 Centro of Oswego, Inc.(Centro of Oswego) Syracuse NY MB 364t 394t 377 381 402 377 Chemung County Transit System(CCTS) Elmira NY MB 326t 334t 335 377 347 363 City of Long Beach(Long Beach Bus) Long Beach NY MB 491t 465t 475 420 425 471 City of Poughkeepsie Poughkeepsie NY MB 473t 499t 490 481 400 435 Clarkstown Mini-Trans Nanuet NY MB 491t 465t 445 457 477 473 CNY Centro, Inc. (CNY Centro ) Syracuse NY MB 85 84 101 93 67 100 Dutchess County Division of Mass Transportation(Loop Bus) Poughkeepsie NY MB 261t 305t 320 358 404 349 Greater Glens Falls Transit System(GGFT) Queensbury NY MB 491t 465t 446 460 424 443 Hendrick Hudson Bus Lines, Inc.(HHBL) Newburgh NY MB 473t 489t 436 490 509 392 Huntington Area Rapid Transit(HART) Huntington NY MB 419t 456t 449 437 446 446
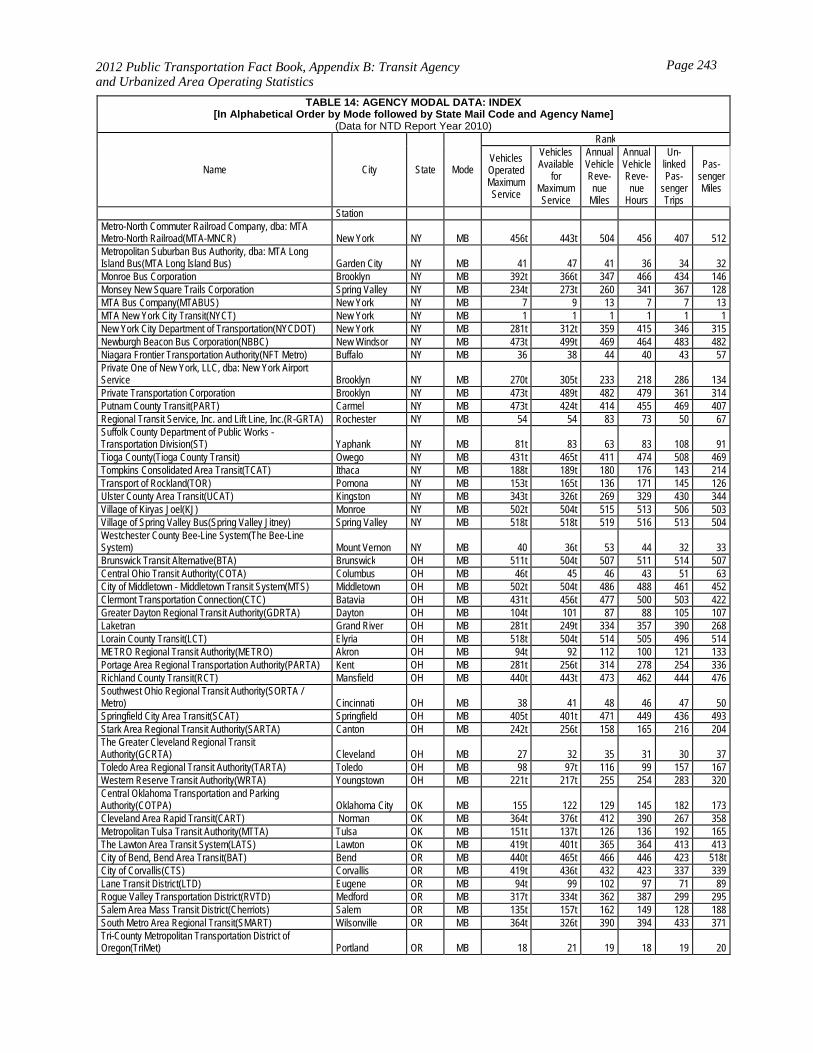
2012 Public Transportation Fact Book, Appendix B: Transit Agency and Urbanized Area Operating Statistics
Page 243
TABLE 14: AGENCY MODAL DATA: INDEX[In Alphabetical Order by Mode followed by State Mail Code and Agency Name]
(Data for NTD Report Year 2010)
Name City State Mode
Rank
Vehicles Operated Maximum Service
Vehicles Available
for Maximum Service
Annual Vehicle Reve-nue
Miles
Annual Vehicle Reve-nue
Hours
Un-linked Pas-
senger Trips
Pas-senger Miles
Station Metro-North Commuter Railroad Company, dba: MTA Metro-North Railroad(MTA-MNCR) New York NY MB 456t 443t 504 456 407 512 Metropolitan Suburban Bus Authority, dba: MTA Long Island Bus(MTA Long Island Bus) Garden City NY MB 41 47 41 36 34 32 Monroe Bus Corporation Brooklyn NY MB 392t 366t 347 466 434 146 Monsey New Square Trails Corporation Spring Valley NY MB 234t 273t 260 341 367 128 MTA Bus Company(MTABUS) New York NY MB 7 9 13 7 7 13 MTA New York City Transit(NYCT) New York NY MB 1 1 1 1 1 1 New York City Department of Transportation(NYCDOT) New York NY MB 281t 312t 359 415 346 315 Newburgh Beacon Bus Corporation(NBBC) New Windsor NY MB 473t 499t 469 464 483 482 Niagara Frontier Transportation Authority(NFT Metro) Buffalo NY MB 36 38 44 40 43 57 Private One of New York, LLC, dba: New York Airport Service Brooklyn NY MB 270t 305t 233 218 286 134 Private Transportation Corporation Brooklyn NY MB 473t 489t 482 479 361 314 Putnam County Transit(PART) Carmel NY MB 473t 424t 414 455 469 407 Regional Transit Service, Inc. and Lift Line, Inc.(R-GRTA) Rochester NY MB 54 54 83 73 50 67 Suffolk County Department of Public Works - Transportation Division(ST) Yaphank NY MB 81t 83 63 83 108 91 Tioga County(Tioga County Transit) Owego NY MB 431t 465t 411 474 508 469 Tompkins Consolidated Area Transit(TCAT) Ithaca NY MB 188t 189t 180 176 143 214 Transport of Rockland(TOR) Pomona NY MB 153t 165t 136 171 145 126 Ulster County Area Transit(UCAT) Kingston NY MB 343t 326t 269 329 430 344 Village of Kiryas Joel(KJ) Monroe NY MB 502t 504t 515 513 506 503 Village of Spring Valley Bus(Spring Valley Jitney) Spring Valley NY MB 518t 518t 519 516 513 504 Westchester County Bee-Line System(The Bee-Line System) Mount Vernon NY MB 40 36t 53 44 32 33 Brunswick Transit Alternative(BTA) Brunswick OH MB 511t 504t 507 511 514 507 Central Ohio Transit Authority(COTA) Columbus OH MB 46t 45 46 43 51 63 City of Middletown - Middletown Transit System(MTS) Middletown OH MB 502t 504t 486 488 461 452 Clermont Transportation Connection(CTC) Batavia OH MB 431t 456t 477 500 503 422 Greater Dayton Regional Transit Authority(GDRTA) Dayton OH MB 104t 101 87 88 105 107 Laketran Grand River OH MB 281t 249t 334 357 390 268 Lorain County Transit(LCT) Elyria OH MB 518t 504t 514 505 496 514 METRO Regional Transit Authority(METRO) Akron OH MB 94t 92 112 100 121 133 Portage Area Regional Transportation Authority(PARTA) Kent OH MB 281t 256t 314 278 254 336 Richland County Transit(RCT) Mansfield OH MB 440t 443t 473 462 444 476 Southwest Ohio Regional Transit Authority(SORTA / Metro) Cincinnati OH MB 38 41 48 46 47 50 Springfield City Area Transit(SCAT) Springfield OH MB 405t 401t 471 449 436 493 Stark Area Regional Transit Authority(SARTA) Canton OH MB 242t 256t 158 165 216 204 The Greater Cleveland Regional Transit Authority(GCRTA) Cleveland OH MB 27 32 35 31 30 37 Toledo Area Regional Transit Authority(TARTA) Toledo OH MB 98 97t 116 99 157 167 Western Reserve Transit Authority(WRTA) Youngstown OH MB 221t 217t 255 254 283 320 Central Oklahoma Transportation and Parking Authority(COTPA) Oklahoma City OK MB 155 122 129 145 182 173 Cleveland Area Rapid Transit(CART) Norman OK MB 364t 376t 412 390 267 358 Metropolitan Tulsa Transit Authority(MTTA) Tulsa OK MB 151t 137t 126 136 192 165 The Lawton Area Transit System(LATS) Lawton OK MB 419t 401t 365 364 413 413 City of Bend, Bend Area Transit(BAT) Bend OR MB 440t 465t 466 446 423 518t City of Corvallis(CTS) Corvallis OR MB 419t 436t 432 423 337 339 Lane Transit District(LTD) Eugene OR MB 94t 99 102 97 71 89 Rogue Valley Transportation District(RVTD) Medford OR MB 317t 334t 362 387 299 295 Salem Area Mass Transit District(Cherriots) Salem OR MB 135t 157t 162 149 128 188 South Metro Area Regional Transit(SMART) Wilsonville OR MB 364t 326t 390 394 433 371 Tri-County Metropolitan Transportation District of Oregon(TriMet) Portland OR MB 18 21 19 18 19 20
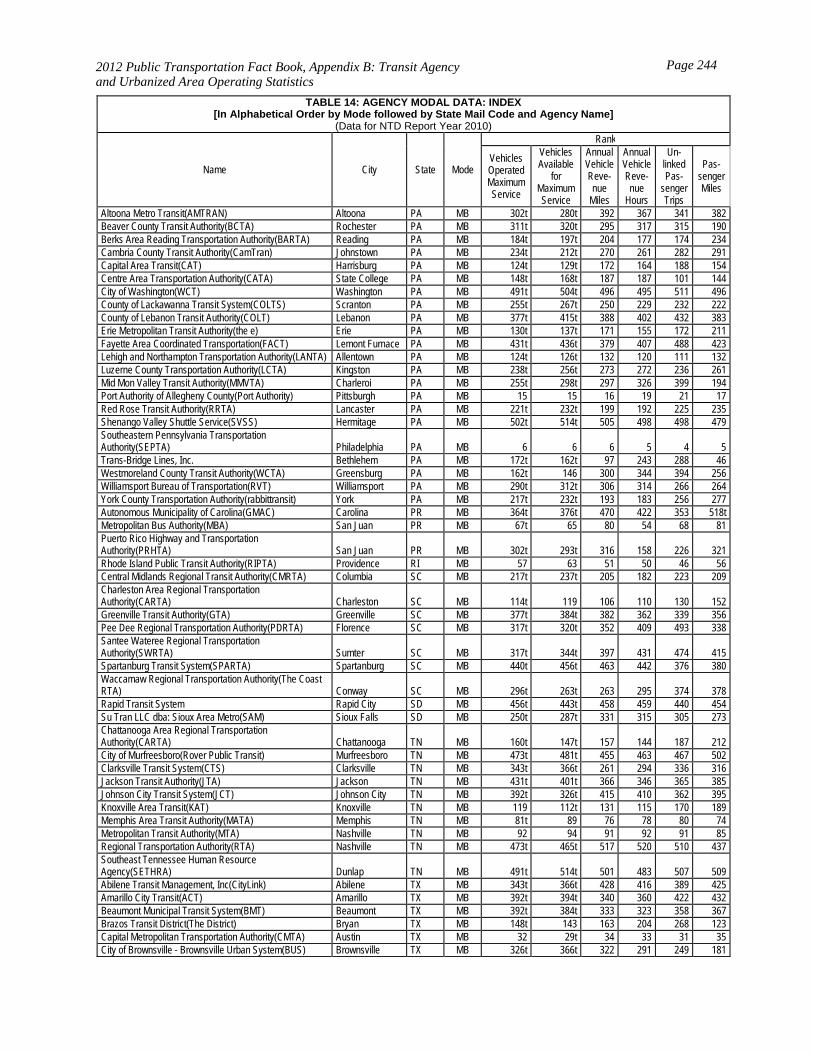
2012 Public Transportation Fact Book, Appendix B: Transit Agency and Urbanized Area Operating Statistics
Page 244
TABLE 14: AGENCY MODAL DATA: INDEX[In Alphabetical Order by Mode followed by State Mail Code and Agency Name]
(Data for NTD Report Year 2010)
Name City State Mode
Rank
Vehicles Operated Maximum Service
Vehicles Available
for Maximum Service
Annual Vehicle Reve-nue
Miles
Annual Vehicle Reve-nue
Hours
Un-linked Pas-
senger Trips
Pas-senger Miles
Altoona Metro Transit(AMTRAN) Altoona PA MB 302t 280t 392 367 341 382 Beaver County Transit Authority(BCTA) Rochester PA MB 311t 320t 295 317 315 190 Berks Area Reading Transportation Authority(BARTA) Reading PA MB 184t 197t 204 177 174 234 Cambria County Transit Authority(CamTran) Johnstown PA MB 234t 212t 270 261 282 291 Capital Area Transit(CAT) Harrisburg PA MB 124t 129t 172 164 188 154 Centre Area Transportation Authority(CATA) State College PA MB 148t 168t 187 187 101 144 City of Washington(WCT) Washington PA MB 491t 504t 496 495 511 496 County of Lackawanna Transit System(COLTS) Scranton PA MB 255t 267t 250 229 232 222 County of Lebanon Transit Authority(COLT) Lebanon PA MB 377t 415t 388 402 432 383 Erie Metropolitan Transit Authority(the e) Erie PA MB 130t 137t 171 155 172 211 Fayette Area Coordinated Transportation(FACT) Lemont Furnace PA MB 431t 436t 379 407 488 423 Lehigh and Northampton Transportation Authority(LANTA) Allentown PA MB 124t 126t 132 120 111 132 Luzerne County Transportation Authority(LCTA) Kingston PA MB 238t 256t 273 272 236 261 Mid Mon Valley Transit Authority(MMVTA) Charleroi PA MB 255t 298t 297 326 399 194 Port Authority of Allegheny County(Port Authority) Pittsburgh PA MB 15 15 16 19 21 17 Red Rose Transit Authority(RRTA) Lancaster PA MB 221t 232t 199 192 225 235 Shenango Valley Shuttle Service(SVSS) Hermitage PA MB 502t 514t 505 498 498 479 Southeastern Pennsylvania Transportation Authority(SEPTA) Philadelphia PA MB 6 6 6 5 4 5 Trans-Bridge Lines, Inc. Bethlehem PA MB 172t 162t 97 243 288 46 Westmoreland County Transit Authority(WCTA) Greensburg PA MB 162t 146 300 344 394 256 Williamsport Bureau of Transportation(RVT) Williamsport PA MB 290t 312t 306 314 266 264 York County Transportation Authority(rabbittransit) York PA MB 217t 232t 193 183 256 277 Autonomous Municipality of Carolina(GMAC) Carolina PR MB 364t 376t 470 422 353 518t Metropolitan Bus Authority(MBA) San Juan PR MB 67t 65 80 54 68 81 Puerto Rico Highway and Transportation Authority(PRHTA) San Juan PR MB 302t 293t 316 158 226 321 Rhode Island Public Transit Authority(RIPTA) Providence RI MB 57 63 51 50 46 56 Central Midlands Regional Transit Authority(CMRTA) Columbia SC MB 217t 237t 205 182 223 209 Charleston Area Regional Transportation Authority(CARTA) Charleston SC MB 114t 119 106 110 130 152 Greenville Transit Authority(GTA) Greenville SC MB 377t 384t 382 362 339 356 Pee Dee Regional Transportation Authority(PDRTA) Florence SC MB 317t 320t 352 409 493 338 Santee Wateree Regional Transportation Authority(SWRTA) Sumter SC MB 317t 344t 397 431 474 415 Spartanburg Transit System(SPARTA) Spartanburg SC MB 440t 456t 463 442 376 380 Waccamaw Regional Transportation Authority(The Coast RTA) Conway SC MB 296t 263t 263 295 374 378 Rapid Transit System Rapid City SD MB 456t 443t 458 459 440 454 Su Tran LLC dba: Sioux Area Metro(SAM) Sioux Falls SD MB 250t 287t 331 315 305 273 Chattanooga Area Regional Transportation Authority(CARTA) Chattanooga TN MB 160t 147t 157 144 187 212 City of Murfreesboro(Rover Public Transit) Murfreesboro TN MB 473t 481t 455 463 467 502 Clarksville Transit System(CTS) Clarksville TN MB 343t 366t 261 294 336 316 Jackson Transit Authority(JTA) Jackson TN MB 431t 401t 366 346 365 385 Johnson City Transit System(JCT) Johnson City TN MB 392t 326t 415 410 362 395 Knoxville Area Transit(KAT) Knoxville TN MB 119 112t 131 115 170 189 Memphis Area Transit Authority(MATA) Memphis TN MB 81t 89 76 78 80 74 Metropolitan Transit Authority(MTA) Nashville TN MB 92 94 91 92 91 85 Regional Transportation Authority(RTA) Nashville TN MB 473t 465t 517 520 510 437 Southeast Tennessee Human Resource Agency(SETHRA) Dunlap TN MB 491t 514t 501 483 507 509 Abilene Transit Management, Inc(CityLink) Abilene TX MB 343t 366t 428 416 389 425 Amarillo City Transit(ACT) Amarillo TX MB 392t 394t 340 360 422 432 Beaumont Municipal Transit System(BMT) Beaumont TX MB 392t 384t 333 323 358 367 Brazos Transit District(The District) Bryan TX MB 148t 143 163 204 268 123 Capital Metropolitan Transportation Authority(CMTA) Austin TX MB 32 29t 34 33 31 35 City of Brownsville - Brownsville Urban System(BUS) Brownsville TX MB 326t 366t 322 291 249 181

2012 Public Transportation Fact Book, Appendix B: Transit Agency and Urbanized Area Operating Statistics
Page 245
TABLE 14: AGENCY MODAL DATA: INDEX[In Alphabetical Order by Mode followed by State Mail Code and Agency Name]
(Data for NTD Report Year 2010)
Name City State Mode
Rank
Vehicles Operated Maximum Service
Vehicles Available
for Maximum Service
Annual Vehicle Reve-nue
Miles
Annual Vehicle Reve-nue
Hours
Un-linked Pas-
senger Trips
Pas-senger Miles
City Transit Management Company, Inc.(Citibus) Lubbock TX MB 128t 147t 183 175 154 215 Collin County Committee on Aging(CCART) McKinney TX MB 511t 504t 506 497 515 506 Concho Valley Transit District(CVTD) San Angelo TX MB 491t 489t 435 436 456 497 Corpus Christi Regional Transportation Authority(The B) Corpus Christi TX MB 137t 134t 115 113 114 127 Dallas Area Rapid Transit(DART) Dallas TX MB 17 17 11 14 26 31 Denton County Transportation Authority(DCTA) Lewisville TX MB 179t 183t 210 212 200 247 Fort Bend County Public Transportation(Fort Bend Transit) Sugar Land TX MB 357t 415t 447 478 497 418 Fort Worth Transportation Authority(The T) Fort Worth TX MB 86 90 92 86 103 94 Golden Crescent Regional Planning Commission(VICTORIA TRANSIT) Victoria TX MB 456t 394t 406 400 448 489 Harris County Community Services Department, Office of Transit Services(Harris County Transit) Houston TX MB 511t 517 516 514 516 501 Hill Country Transit District(The Hop) San Saba TX MB 405t 287t 393 386 408 376 Island Transit(I T) Galveston TX MB 405t 401t 386 350 355 402 Laredo Transit Management, Inc.(El Metro) Laredo TX MB 221t 212t 177 157 152 195 Lower Rio Grande Valley Development Council(LRGVDC) McAllen TX MB 357t 282t 329 385 499 439 Mass Transit Department - City of El Paso(Sun Metro) El Paso TX MB 91 86 62 63 54 53 Metropolitan Transit Authority of Harris County, Texas(Metro) Houston TX MB 8 7 5 8 17 6 Midland-Odessa Urban Transit District(EZ RIDER) Odessa TX MB 392t 376t 332 336 388 465 Port Arthur Transit(PAT) Port Arthur TX MB 491t 465t 474 486 490 455 Texoma Area Paratransit System, Inc(TAPS) Sherman TX MB 456t 465t 438 489 504 420 The Gulf Coast Center(Connect Transit) Texas City TX MB 405t 424t 464 482 505 494 VIA Metropolitan Transit(VIA) San Antonio TX MB 30 26 22 22 25 29 Waco Transit System, Inc.(WTS) Waco TX MB 357t 376t 312 330 338 327 Cache Valley Transit District(CVTD) Logan UT MB 333t 326t 309 321 220 253 Utah Transit Authority(UTA) Salt Lake City UT MB 24 25 26 38 42 40 Arlington Transit - Arlington County(ART) Arlington VA MB 242t 249t 317 260 214 340 Blacksburg Transit(BT) Blacksburg VA MB 238t 192t 338 268 153 258 Charlottesville Area Transit(CAT) Charlottesville VA MB 270t 237t 284 237 206 293 City of Alexandria (DASH) Alexandria VA MB 153t 147t 213 146 127 193 City of Danville Mass Transit System(Danville Transit) Danville VA MB 473t 481t 462 469 451 445 City of Fairfax CUE Bus(CUE) Fairfax VA MB 440t 384t 408 388 306 318 City of Harrisonburg Department of Public Transportation(Harrisonburg Transit) Harrisonburg VA MB 270t 312t 391 328 224 294 Fairfax Connector Bus System(Fairfax Connector) Fairfax VA MB 65 55 58 65 82 52 Fredericksburg Regional Transit(FRED) Fredericksburg VA MB 296t 293t 282 300 378 348 Greater Lynchburg Transit Company(GLTC) Lynchburg VA MB 213t 262 240 213 171 311 Greater Richmond Transit Company(GRTC Transit System) Richmond VA MB 79t 79 84 75 61 87 Greater Roanoke Transit Company(Valley Metro) Roanoke VA MB 221t 222t 191 189 195 196 Loudoun County Commuter Bus Service - Office of Transportation Services(LC Transit) Leesburg VA MB 179t 208 230 351 301 113 Martz Group, National Coach Works of Virginia(NCW) Fredericksburg VA MB 357t 384t 422 494 459 213 Petersburg Area Transit(PAT) Petersburg VA MB 440t 401t 439 371 360 444 Potomac and Rappahannock Transportation Commission(PRTC) Woodbridge VA MB 93 95 113 151 165 73 Transportation District Commission of Hampton Roads, dba: Hampton Roads Transit(HRT) Hampton VA MB 50 48t 40 39 53 45 Williamsburg Area Transit Authority(WATA) Williamsburg VA MB 204t 227t 235 239 180 274 Virgin Islands Department of Public Works(VIDPW) St. Thomas VI MB 357t 415t 344 518 521 518t Chittenden County Transportation Authority(CCTA) Burlington VT MB 172t 197t 249 225 193 208 Ben Franklin Transit(BFT) Richland WA MB 124t 136 138 169 156 124 Central Puget Sound Regional Transit Authority(ST) Seattle WA MB 52 46 38 64 64 22 Clark County Public Transportation Benefit Area Authority(C-Tran) Vancouver WA MB 104t 108t 95 101 106 111 Community Urban Bus Service(CUBS) Longview WA MB 491t 489t 483 470 406 411 Everett Transit(ET) Everett WA MB 198t 212t 185 173 199 217
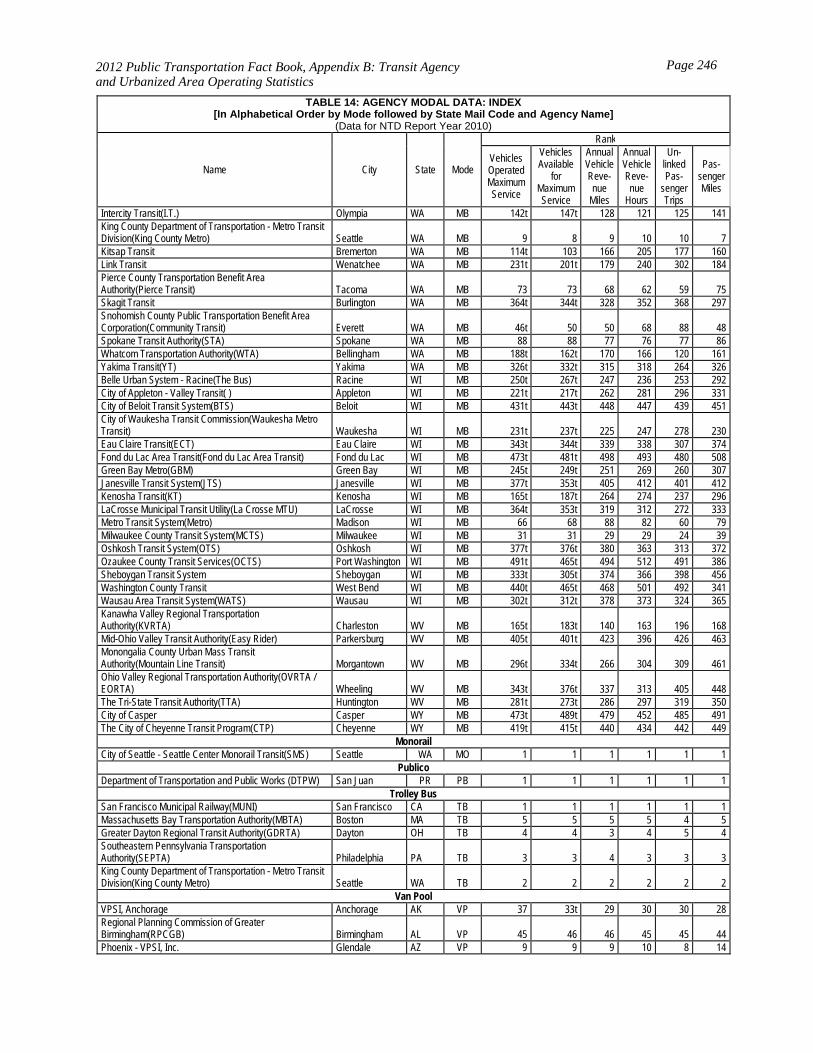
2012 Public Transportation Fact Book, Appendix B: Transit Agency and Urbanized Area Operating Statistics
Page 246
TABLE 14: AGENCY MODAL DATA: INDEX[In Alphabetical Order by Mode followed by State Mail Code and Agency Name]
(Data for NTD Report Year 2010)
Name City State Mode
Rank
Vehicles Operated Maximum Service
Vehicles Available
for Maximum Service
Annual Vehicle Reve-nue
Miles
Annual Vehicle Reve-nue
Hours
Un-linked Pas-
senger Trips
Pas-senger Miles
Intercity Transit(I.T.) Olympia WA MB 142t 147t 128 121 125 141 King County Department of Transportation - Metro Transit Division(King County Metro) Seattle WA MB 9 8 9 10 10 7 Kitsap Transit Bremerton WA MB 114t 103 166 205 177 160 Link Transit Wenatchee WA MB 231t 201t 179 240 302 184 Pierce County Transportation Benefit Area Authority(Pierce Transit) Tacoma WA MB 73 73 68 62 59 75 Skagit Transit Burlington WA MB 364t 344t 328 352 368 297 Snohomish County Public Transportation Benefit Area Corporation(Community Transit) Everett WA MB 46t 50 50 68 88 48 Spokane Transit Authority(STA) Spokane WA MB 88 88 77 76 77 86 Whatcom Transportation Authority(WTA) Bellingham WA MB 188t 162t 170 166 120 161 Yakima Transit(YT) Yakima WA MB 326t 332t 315 318 264 326 Belle Urban System - Racine(The Bus) Racine WI MB 250t 267t 247 236 253 292 City of Appleton - Valley Transit( ) Appleton WI MB 221t 217t 262 281 296 331 City of Beloit Transit System(BTS) Beloit WI MB 431t 443t 448 447 439 451 City of Waukesha Transit Commission(Waukesha Metro Transit) Waukesha WI MB 231t 237t 225 247 278 230 Eau Claire Transit(ECT) Eau Claire WI MB 343t 344t 339 338 307 374 Fond du Lac Area Transit(Fond du Lac Area Transit) Fond du Lac WI MB 473t 481t 498 493 480 508 Green Bay Metro(GBM) Green Bay WI MB 245t 249t 251 269 260 307 Janesville Transit System(JTS) Janesville WI MB 377t 353t 405 412 401 412 Kenosha Transit(KT) Kenosha WI MB 165t 187t 264 274 237 296 LaCrosse Municipal Transit Utility(La Crosse MTU) LaCrosse WI MB 364t 353t 319 312 272 333 Metro Transit System(Metro) Madison WI MB 66 68 88 82 60 79 Milwaukee County Transit System(MCTS) Milwaukee WI MB 31 31 29 29 24 39 Oshkosh Transit System(OTS) Oshkosh WI MB 377t 376t 380 363 313 372 Ozaukee County Transit Services(OCTS) Port Washington WI MB 491t 465t 494 512 491 386 Sheboygan Transit System Sheboygan WI MB 333t 305t 374 366 398 456 Washington County Transit West Bend WI MB 440t 465t 468 501 492 341 Wausau Area Transit System(WATS) Wausau WI MB 302t 312t 378 373 324 365 Kanawha Valley Regional Transportation Authority(KVRTA) Charleston WV MB 165t 183t 140 163 196 168 Mid-Ohio Valley Transit Authority(Easy Rider) Parkersburg WV MB 405t 401t 423 396 426 463 Monongalia County Urban Mass Transit Authority(Mountain Line Transit) Morgantown WV MB 296t 334t 266 304 309 461 Ohio Valley Regional Transportation Authority(OVRTA / EORTA) Wheeling WV MB 343t 376t 337 313 405 448 The Tri-State Transit Authority(TTA) Huntington WV MB 281t 273t 286 297 319 350 City of Casper Casper WY MB 473t 489t 479 452 485 491 The City of Cheyenne Transit Program(CTP) Cheyenne WY MB 419t 415t 440 434 442 449
Monorail City of Seattle - Seattle Center Monorail Transit(SMS) Seattle WA MO 1 1 1 1 1 1
Publico Department of Transportation and Public Works (DTPW) San Juan PR PB 1 1 1 1 1 1
Trolley Bus San Francisco Municipal Railway(MUNI) San Francisco CA TB 1 1 1 1 1 1 Massachusetts Bay Transportation Authority(MBTA) Boston MA TB 5 5 5 5 4 5 Greater Dayton Regional Transit Authority(GDRTA) Dayton OH TB 4 4 3 4 5 4 Southeastern Pennsylvania Transportation Authority(SEPTA) Philadelphia PA TB 3 3 4 3 3 3 King County Department of Transportation - Metro Transit Division(King County Metro) Seattle WA TB 2 2 2 2 2 2
Van Pool VPSI, Anchorage Anchorage AK VP 37 33t 29 30 30 28 Regional Planning Commission of Greater Birmingham(RPCGB) Birmingham AL VP 45 46 46 45 45 44 Phoenix - VPSI, Inc. Glendale AZ VP 9 9 9 10 8 14
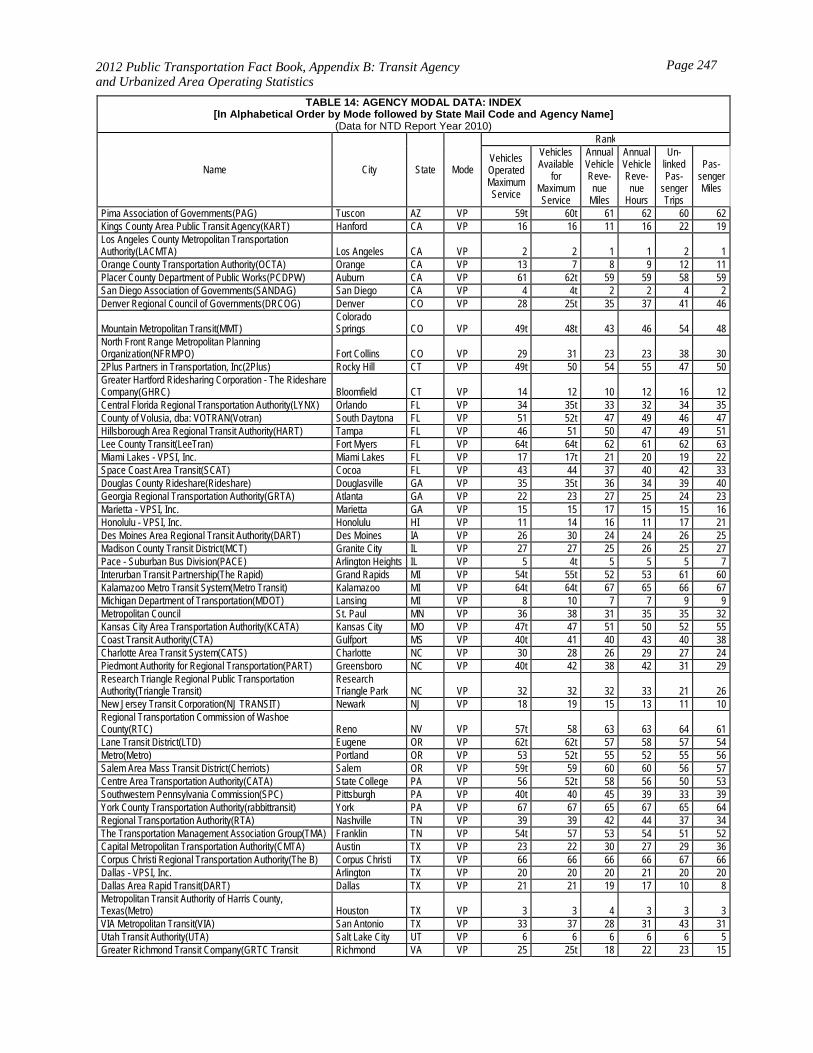
2012 Public Transportation Fact Book, Appendix B: Transit Agency and Urbanized Area Operating Statistics
Page 247
TABLE 14: AGENCY MODAL DATA: INDEX[In Alphabetical Order by Mode followed by State Mail Code and Agency Name]
(Data for NTD Report Year 2010)
Name City State Mode
Rank
Vehicles Operated Maximum Service
Vehicles Available
for Maximum Service
Annual Vehicle Reve-nue
Miles
Annual Vehicle Reve-nue
Hours
Un-linked Pas-
senger Trips
Pas-senger Miles
Pima Association of Governments(PAG) Tuscon AZ VP 59t 60t 61 62 60 62 Kings County Area Public Transit Agency(KART) Hanford CA VP 16 16 11 16 22 19 Los Angeles County Metropolitan Transportation Authority(LACMTA) Los Angeles CA VP 2 2 1 1 2 1 Orange County Transportation Authority(OCTA) Orange CA VP 13 7 8 9 12 11 Placer County Department of Public Works(PCDPW) Auburn CA VP 61 62t 59 59 58 59 San Diego Association of Governments(SANDAG) San Diego CA VP 4 4t 2 2 4 2 Denver Regional Council of Governments(DRCOG) Denver CO VP 28 25t 35 37 41 46
Mountain Metropolitan Transit(MMT) Colorado Springs CO VP 49t 48t 43 46 54 48
North Front Range Metropolitan Planning Organization(NFRMPO) Fort Collins CO VP 29 31 23 23 38 30 2Plus Partners in Transportation, Inc(2Plus) Rocky Hill CT VP 49t 50 54 55 47 50 Greater Hartford Ridesharing Corporation - The Rideshare Company(GHRC) Bloomfield CT VP 14 12 10 12 16 12 Central Florida Regional Transportation Authority(LYNX) Orlando FL VP 34 35t 33 32 34 35 County of Volusia, dba: VOTRAN(Votran) South Daytona FL VP 51 52t 47 49 46 47 Hillsborough Area Regional Transit Authority(HART) Tampa FL VP 46 51 50 47 49 51 Lee County Transit(LeeTran) Fort Myers FL VP 64t 64t 62 61 62 63 Miami Lakes - VPSI, Inc. Miami Lakes FL VP 17 17t 21 20 19 22 Space Coast Area Transit(SCAT) Cocoa FL VP 43 44 37 40 42 33 Douglas County Rideshare(Rideshare) Douglasville GA VP 35 35t 36 34 39 40 Georgia Regional Transportation Authority(GRTA) Atlanta GA VP 22 23 27 25 24 23 Marietta - VPSI, Inc. Marietta GA VP 15 15 17 15 15 16 Honolulu - VPSI, Inc. Honolulu HI VP 11 14 16 11 17 21 Des Moines Area Regional Transit Authority(DART) Des Moines IA VP 26 30 24 24 26 25 Madison County Transit District(MCT) Granite City IL VP 27 27 25 26 25 27 Pace - Suburban Bus Division(PACE) Arlington Heights IL VP 5 4t 5 5 5 7 Interurban Transit Partnership(The Rapid) Grand Rapids MI VP 54t 55t 52 53 61 60 Kalamazoo Metro Transit System(Metro Transit) Kalamazoo MI VP 64t 64t 67 65 66 67 Michigan Department of Transportation(MDOT) Lansing MI VP 8 10 7 7 9 9 Metropolitan Council St. Paul MN VP 36 38 31 35 35 32 Kansas City Area Transportation Authority(KCATA) Kansas City MO VP 47t 47 51 50 52 55 Coast Transit Authority(CTA) Gulfport MS VP 40t 41 40 43 40 38 Charlotte Area Transit System(CATS) Charlotte NC VP 30 28 26 29 27 24 Piedmont Authority for Regional Transportation(PART) Greensboro NC VP 40t 42 38 42 31 29 Research Triangle Regional Public Transportation Authority(Triangle Transit)
Research Triangle Park NC VP 32 32 32 33 21 26
New Jersey Transit Corporation(NJ TRANSIT) Newark NJ VP 18 19 15 13 11 10 Regional Transportation Commission of Washoe County(RTC) Reno NV VP 57t 58 63 63 64 61 Lane Transit District(LTD) Eugene OR VP 62t 62t 57 58 57 54 Metro(Metro) Portland OR VP 53 52t 55 52 55 56 Salem Area Mass Transit District(Cherriots) Salem OR VP 59t 59 60 60 56 57 Centre Area Transportation Authority(CATA) State College PA VP 56 52t 58 56 50 53 Southwestern Pennsylvania Commission(SPC) Pittsburgh PA VP 40t 40 45 39 33 39 York County Transportation Authority(rabbittransit) York PA VP 67 67 65 67 65 64 Regional Transportation Authority(RTA) Nashville TN VP 39 39 42 44 37 34 The Transportation Management Association Group(TMA) Franklin TN VP 54t 57 53 54 51 52 Capital Metropolitan Transportation Authority(CMTA) Austin TX VP 23 22 30 27 29 36 Corpus Christi Regional Transportation Authority(The B) Corpus Christi TX VP 66 66 66 66 67 66 Dallas - VPSI, Inc. Arlington TX VP 20 20 20 21 20 20 Dallas Area Rapid Transit(DART) Dallas TX VP 21 21 19 17 10 8 Metropolitan Transit Authority of Harris County, Texas(Metro) Houston TX VP 3 3 4 3 3 3 VIA Metropolitan Transit(VIA) San Antonio TX VP 33 37 28 31 43 31 Utah Transit Authority(UTA) Salt Lake City UT VP 6 6 6 6 6 5 Greater Richmond Transit Company(GRTC Transit Richmond VA VP 25 25t 18 22 23 15
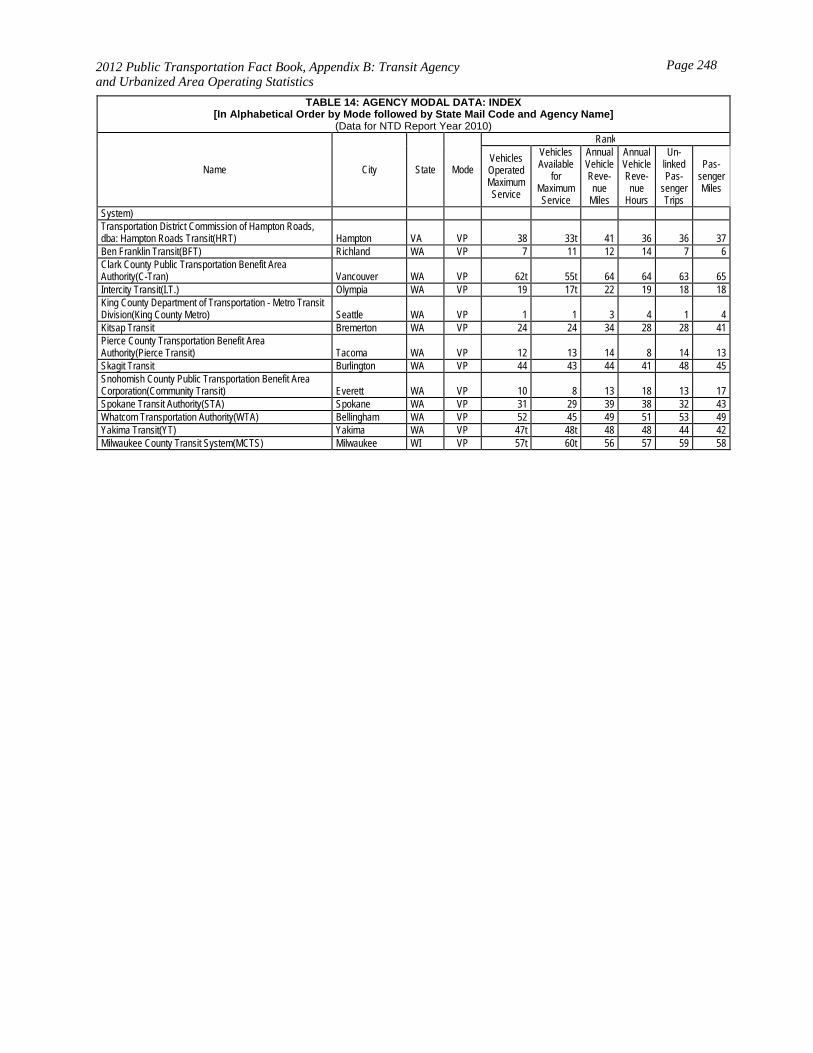
2012 Public Transportation Fact Book, Appendix B: Transit Agency and Urbanized Area Operating Statistics
Page 248
TABLE 14: AGENCY MODAL DATA: INDEX[In Alphabetical Order by Mode followed by State Mail Code and Agency Name]
(Data for NTD Report Year 2010)
Name City State Mode
Rank
Vehicles Operated Maximum Service
Vehicles Available
for Maximum Service
Annual Vehicle Reve-nue
Miles
Annual Vehicle Reve-nue
Hours
Un-linked Pas-
senger Trips
Pas-senger Miles
System) Transportation District Commission of Hampton Roads, dba: Hampton Roads Transit(HRT) Hampton VA VP 38 33t 41 36 36 37 Ben Franklin Transit(BFT) Richland WA VP 7 11 12 14 7 6 Clark County Public Transportation Benefit Area Authority(C-Tran) Vancouver WA VP 62t 55t 64 64 63 65 Intercity Transit(I.T.) Olympia WA VP 19 17t 22 19 18 18 King County Department of Transportation - Metro Transit Division(King County Metro) Seattle WA VP 1 1 3 4 1 4 Kitsap Transit Bremerton WA VP 24 24 34 28 28 41 Pierce County Transportation Benefit Area Authority(Pierce Transit) Tacoma WA VP 12 13 14 8 14 13 Skagit Transit Burlington WA VP 44 43 44 41 48 45 Snohomish County Public Transportation Benefit Area Corporation(Community Transit) Everett WA VP 10 8 13 18 13 17 Spokane Transit Authority(STA) Spokane WA VP 31 29 39 38 32 43 Whatcom Transportation Authority(WTA) Bellingham WA VP 52 45 49 51 53 49 Yakima Transit(YT) Yakima WA VP 47t 48t 48 48 44 42 Milwaukee County Transit System(MCTS) Milwaukee WI VP 57t 60t 56 57 59 58
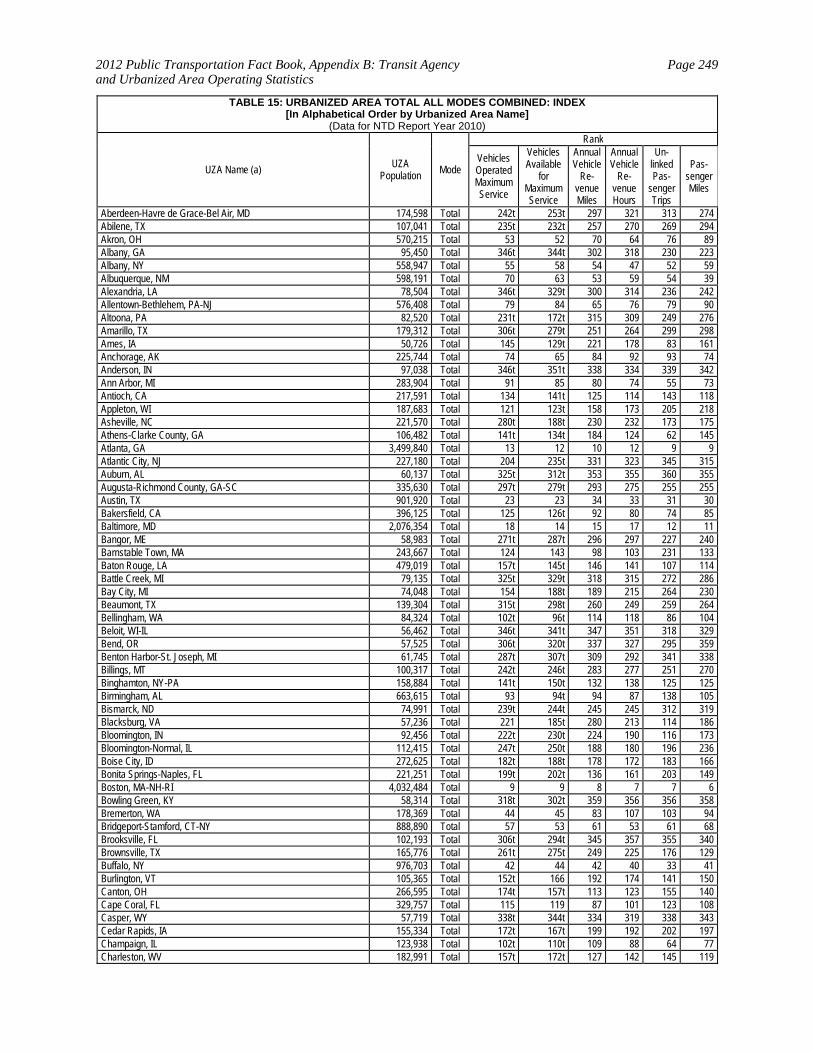
2012 Public Transportation Fact Book, Appendix B: Transit Agency and Urbanized Area Operating Statistics
Page 249
TABLE 15: URBANIZED AREA TOTAL ALL MODES COMBINED: INDEX [In Alphabetical Order by Urbanized Area Name]
(Data for NTD Report Year 2010)
UZA Name (a) UZA Population Mode
Rank
Vehicles Operated Maximum Service
Vehicles Available
for Maximum Service
Annual Vehicle
Re-venue Miles
Annual Vehicle
Re-venue Hours
Un-linked Pas-
senger Trips
Pas-senger Miles
Aberdeen-Havre de Grace-Bel Air, MD 174,598 Total 242t 253t 297 321 313 274 Abilene, TX 107,041 Total 235t 232t 257 270 269 294 Akron, OH 570,215 Total 53 52 70 64 76 89 Albany, GA 95,450 Total 346t 344t 302 318 230 223 Albany, NY 558,947 Total 55 58 54 47 52 59 Albuquerque, NM 598,191 Total 70 63 53 59 54 39 Alexandria, LA 78,504 Total 346t 329t 300 314 236 242 Allentown-Bethlehem, PA-NJ 576,408 Total 79 84 65 76 79 90 Altoona, PA 82,520 Total 231t 172t 315 309 249 276 Amarillo, TX 179,312 Total 306t 279t 251 264 299 298 Ames, IA 50,726 Total 145 129t 221 178 83 161 Anchorage, AK 225,744 Total 74 65 84 92 93 74 Anderson, IN 97,038 Total 346t 351t 338 334 339 342 Ann Arbor, MI 283,904 Total 91 85 80 74 55 73 Antioch, CA 217,591 Total 134 141t 125 114 143 118 Appleton, WI 187,683 Total 121 123t 158 173 205 218 Asheville, NC 221,570 Total 280t 188t 230 232 173 175 Athens-Clarke County, GA 106,482 Total 141t 134t 184 124 62 145 Atlanta, GA 3,499,840 Total 13 12 10 12 9 9 Atlantic City, NJ 227,180 Total 204 235t 331 323 345 315 Auburn, AL 60,137 Total 325t 312t 353 355 360 355 Augusta-Richmond County, GA-SC 335,630 Total 297t 279t 293 275 255 255 Austin, TX 901,920 Total 23 23 34 33 31 30 Bakersfield, CA 396,125 Total 125 126t 92 80 74 85 Baltimore, MD 2,076,354 Total 18 14 15 17 12 11 Bangor, ME 58,983 Total 271t 287t 296 297 227 240 Barnstable Town, MA 243,667 Total 124 143 98 103 231 133 Baton Rouge, LA 479,019 Total 157t 145t 146 141 107 114 Battle Creek, MI 79,135 Total 325t 329t 318 315 272 286 Bay City, MI 74,048 Total 154 188t 189 215 264 230 Beaumont, TX 139,304 Total 315t 298t 260 249 259 264 Bellingham, WA 84,324 Total 102t 96t 114 118 86 104 Beloit, WI-IL 56,462 Total 346t 341t 347 351 318 329 Bend, OR 57,525 Total 306t 320t 337 327 295 359 Benton Harbor-St. Joseph, MI 61,745 Total 287t 307t 309 292 341 338 Billings, MT 100,317 Total 242t 246t 283 277 251 270 Binghamton, NY-PA 158,884 Total 141t 150t 132 138 125 125 Birmingham, AL 663,615 Total 93 94t 94 87 138 105 Bismarck, ND 74,991 Total 239t 244t 245 245 312 319 Blacksburg, VA 57,236 Total 221 185t 280 213 114 186 Bloomington, IN 92,456 Total 222t 230t 224 190 116 173 Bloomington-Normal, IL 112,415 Total 247t 250t 188 180 196 236 Boise City, ID 272,625 Total 182t 188t 178 172 183 166 Bonita Springs-Naples, FL 221,251 Total 199t 202t 136 161 203 149 Boston, MA-NH-RI 4,032,484 Total 9 9 8 7 7 6 Bowling Green, KY 58,314 Total 318t 302t 359 356 356 358 Bremerton, WA 178,369 Total 44 45 83 107 103 94 Bridgeport-Stamford, CT-NY 888,890 Total 57 53 61 53 61 68 Brooksville, FL 102,193 Total 306t 294t 345 357 355 340 Brownsville, TX 165,776 Total 261t 275t 249 225 176 129 Buffalo, NY 976,703 Total 42 44 42 40 33 41 Burlington, VT 105,365 Total 152t 166 192 174 141 150 Canton, OH 266,595 Total 174t 157t 113 123 155 140 Cape Coral, FL 329,757 Total 115 119 87 101 123 108 Casper, WY 57,719 Total 338t 344t 334 319 338 343 Cedar Rapids, IA 155,334 Total 172t 167t 199 192 202 197 Champaign, IL 123,938 Total 102t 110t 109 88 64 77 Charleston, WV 182,991 Total 157t 172t 127 142 145 119

2012 Public Transportation Fact Book, Appendix B: Transit Agency and Urbanized Area Operating Statistics
Page 250
TABLE 15: URBANIZED AREA TOTAL ALL MODES COMBINED: INDEX [In Alphabetical Order by Urbanized Area Name]
(Data for NTD Report Year 2010)
UZA Name (a) UZA Population Mode
Rank
Vehicles Operated Maximum Service
Vehicles Available
for Maximum Service
Annual Vehicle
Re-venue Miles
Annual Vehicle
Re-venue Hours
Un-linked Pas-
senger Trips
Pas-senger Miles
Charleston-North Charleston, SC 423,410 Total 109t 115 97 94 100 111 Charlotte, NC-SC 758,927 Total 38 38 36 38 35 34 Charlottesville, VA 81,449 Total 126 125 135 126 140 165 Chattanooga, TN-GA 343,509 Total 137t 136t 131 116 126 144 Cheyenne, WY 68,202 Total 318t 312t 328 331 317 312 Chicago, IL-IN 8,307,904 Total 3 3 3 3 3 2 Chico, CA 89,221 Total 203 204t 190 185 187 174 Cincinnati, OH-KY-IN 1,503,262 Total 34t 36 38 36 37 37 Clarksville, TN-KY 121,775 Total 271t 279t 197 212 243 225 Cleveland, OH 1,786,647 Total 28 30 32 28 25 28 Cleveland, TN 58,192 Total 351t 360 357 339 357 356 College Station-Bryan, TX 132,500 Total 106t 108 107 137 185 88 Colorado Springs, CO 466,122 Total 83 78 85 102 129 101 Columbia, MO 98,779 Total 247t 246t 274 209 151 215 Columbia, SC 420,537 Total 169t 188t 154 144 159 143 Columbus, GA-AL 242,324 Total 280t 259t 233 235 210 221 Columbus, OH 1,133,193 Total 51 51 43 42 43 47 Concord, CA 552,624 Total 66 59t 77 68 84 86 Corpus Christi, TX 293,925 Total 122t 110t 88 89 82 92 Corvallis, OR 58,229 Total 351t 357 344 345 248 241 Cumberland, MD--WV 52,115 Total 325t 326t 343 342 340 299 Dallas-Fort Worth-Arlington, TX 4,145,659 Total 15 17 12 14 21 17 Danbury, CT-NY 154,455 Total 205t 194t 193 201 228 210 Danville, IL 53,223 Total 338t 329t 311 336 271 273 Danville, VA 50,902 Total 357 356 348 352 324 316 Davenport, IA-IL 270,626 Total 122t 112t 101 91 95 116 Davis, CA 66,022 Total 222t 226t 284 234 110 171 Dayton, OH 703,444 Total 63 61 51 51 68 60 Daytona Beach-Port Orange, FL 255,353 Total 92 92 79 84 108 97 Decatur, AL 52,315 Total 247t 279t 314 317 332 351 Decatur, IL 96,454 Total 247t 259t 223 219 193 231 DeKalb, IL 55,805 Total 280t 307t 298 310 347 318 Denton-Lewisville, TX 299,823 Total 167t 177t 170 164 148 172 Denver-Aurora, CO 1,984,889 Total 17 18 13 13 13 14 Des Moines, IA 370,505 Total 65 69 76 85 94 76 Detroit, MI 3,903,377 Total 20 20 21 21 23 20 Dothan, AL 60,792 Total 177t 199 195 202 335 308 Dover-Rochester, NH-ME 80,456 Total 297t 262t 299 303 285 248 Dubuque, IA-IL 65,251 Total 292t 307t 313 300 296 320 Duluth, MN-WI 118,265 Total 177t 179t 156 149 121 124 Durham, NC 287,796 Total 49 48 48 54 50 51 Eau Claire, WI 91,393 Total 205t 217t 214 218 219 247 El Centro, CA 52,954 Total 287t 294t 256 304 256 136 El Paso, TX-NM 674,801 Total 73 72 50 46 48 43 Elkhart, IN-MI 131,226 Total 292t 271t 276 298 316 289 Elmira, NY 67,159 Total 260 266t 246 288 252 260 Erie, PA 194,804 Total 94 100 122 99 119 142 Eugene, OR 224,049 Total 52 56 72 71 56 58 Evansville, IN-KY 211,989 Total 231t 232t 185 187 149 163 Fairbanks, AK 51,926 Total 332t 346t 308 328 288 256 Fairfield, CA 112,446 Total 205t 207t 167 196 224 164 Fargo, ND-MN 142,477 Total 213t 213t 201 191 157 180 Fayetteville, NC 276,368 Total 261t 266t 228 208 195 224 Fayetteville-Springdale, AR 172,585 Total 216t 167t 244 228 165 238 Flagstaff, AZ 57,050 Total 297t 307t 285 276 208 262 Flint, MI 365,096 Total 68 64 57 69 81 83 Florence, AL 71,299 Total 189t 211t 320 307 297 325 Florence, SC 67,314 Total 108 116t 139 177 311 196
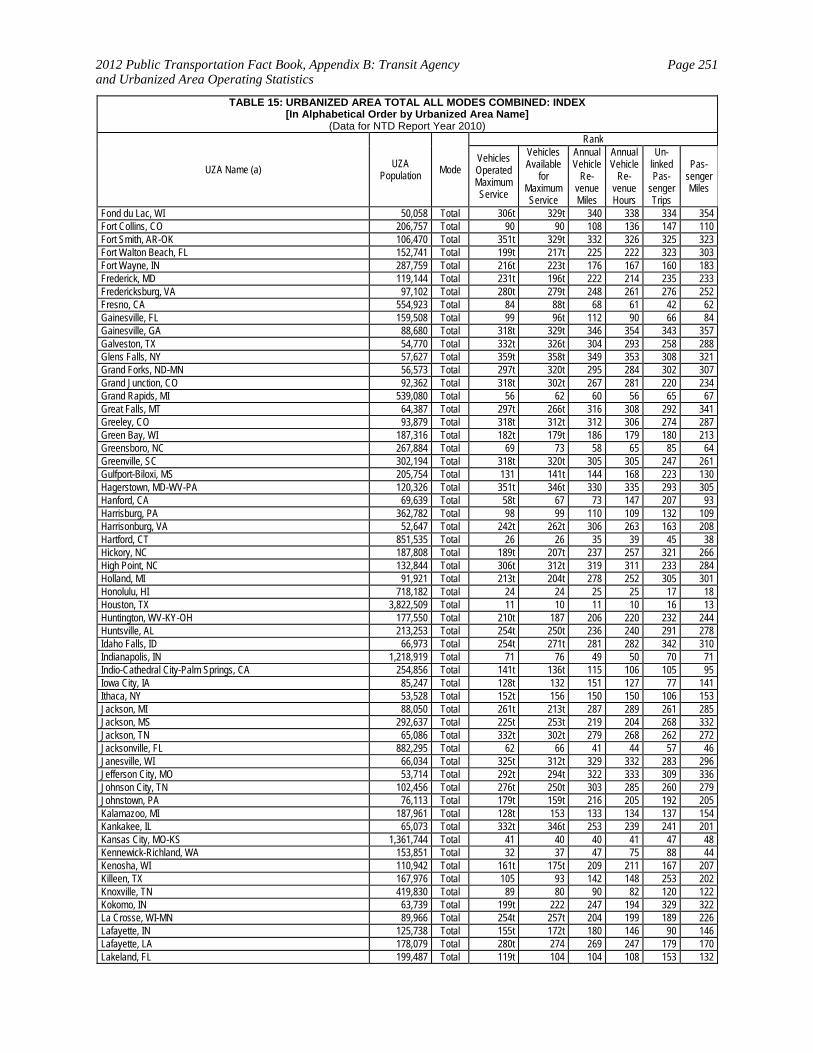
2012 Public Transportation Fact Book, Appendix B: Transit Agency and Urbanized Area Operating Statistics
Page 251
TABLE 15: URBANIZED AREA TOTAL ALL MODES COMBINED: INDEX [In Alphabetical Order by Urbanized Area Name]
(Data for NTD Report Year 2010)
UZA Name (a) UZA Population Mode
Rank
Vehicles Operated Maximum Service
Vehicles Available
for Maximum Service
Annual Vehicle
Re-venue Miles
Annual Vehicle
Re-venue Hours
Un-linked Pas-
senger Trips
Pas-senger Miles
Fond du Lac, WI 50,058 Total 306t 329t 340 338 334 354 Fort Collins, CO 206,757 Total 90 90 108 136 147 110 Fort Smith, AR-OK 106,470 Total 351t 329t 332 326 325 323 Fort Walton Beach, FL 152,741 Total 199t 217t 225 222 323 303 Fort Wayne, IN 287,759 Total 216t 223t 176 167 160 183 Frederick, MD 119,144 Total 231t 196t 222 214 235 233 Fredericksburg, VA 97,102 Total 280t 279t 248 261 276 252 Fresno, CA 554,923 Total 84 88t 68 61 42 62 Gainesville, FL 159,508 Total 99 96t 112 90 66 84 Gainesville, GA 88,680 Total 318t 329t 346 354 343 357 Galveston, TX 54,770 Total 332t 326t 304 293 258 288 Glens Falls, NY 57,627 Total 359t 358t 349 353 308 321 Grand Forks, ND-MN 56,573 Total 297t 320t 295 284 302 307 Grand Junction, CO 92,362 Total 318t 302t 267 281 220 234 Grand Rapids, MI 539,080 Total 56 62 60 56 65 67 Great Falls, MT 64,387 Total 297t 266t 316 308 292 341 Greeley, CO 93,879 Total 318t 312t 312 306 274 287 Green Bay, WI 187,316 Total 182t 179t 186 179 180 213 Greensboro, NC 267,884 Total 69 73 58 65 85 64 Greenville, SC 302,194 Total 318t 320t 305 305 247 261 Gulfport-Biloxi, MS 205,754 Total 131 141t 144 168 223 130 Hagerstown, MD-WV-PA 120,326 Total 351t 346t 330 335 293 305 Hanford, CA 69,639 Total 58t 67 73 147 207 93 Harrisburg, PA 362,782 Total 98 99 110 109 132 109 Harrisonburg, VA 52,647 Total 242t 262t 306 263 163 208 Hartford, CT 851,535 Total 26 26 35 39 45 38 Hickory, NC 187,808 Total 189t 207t 237 257 321 266 High Point, NC 132,844 Total 306t 312t 319 311 233 284 Holland, MI 91,921 Total 213t 204t 278 252 305 301 Honolulu, HI 718,182 Total 24 24 25 25 17 18 Houston, TX 3,822,509 Total 11 10 11 10 16 13 Huntington, WV-KY-OH 177,550 Total 210t 187 206 220 232 244 Huntsville, AL 213,253 Total 254t 250t 236 240 291 278 Idaho Falls, ID 66,973 Total 254t 271t 281 282 342 310 Indianapolis, IN 1,218,919 Total 71 76 49 50 70 71 Indio-Cathedral City-Palm Springs, CA 254,856 Total 141t 136t 115 106 105 95 Iowa City, IA 85,247 Total 128t 132 151 127 77 141 Ithaca, NY 53,528 Total 152t 156 150 150 106 153 Jackson, MI 88,050 Total 261t 213t 287 289 261 285 Jackson, MS 292,637 Total 225t 253t 219 204 268 332 Jackson, TN 65,086 Total 332t 302t 279 268 262 272 Jacksonville, FL 882,295 Total 62 66 41 44 57 46 Janesville, WI 66,034 Total 325t 312t 329 332 283 296 Jefferson City, MO 53,714 Total 292t 294t 322 333 309 336 Johnson City, TN 102,456 Total 276t 250t 303 285 260 279 Johnstown, PA 76,113 Total 179t 159t 216 205 192 205 Kalamazoo, MI 187,961 Total 128t 153 133 134 137 154 Kankakee, IL 65,073 Total 332t 346t 253 239 241 201 Kansas City, MO-KS 1,361,744 Total 41 40 40 41 47 48 Kennewick-Richland, WA 153,851 Total 32 37 47 75 88 44 Kenosha, WI 110,942 Total 161t 175t 209 211 167 207 Killeen, TX 167,976 Total 105 93 142 148 253 202 Knoxville, TN 419,830 Total 89 80 90 82 120 122 Kokomo, IN 63,739 Total 199t 222 247 194 329 322 La Crosse, WI-MN 89,966 Total 254t 257t 204 199 189 226 Lafayette, IN 125,738 Total 155t 172t 180 146 90 146 Lafayette, LA 178,079 Total 280t 274 269 247 179 170 Lakeland, FL 199,487 Total 119t 104 104 108 153 132
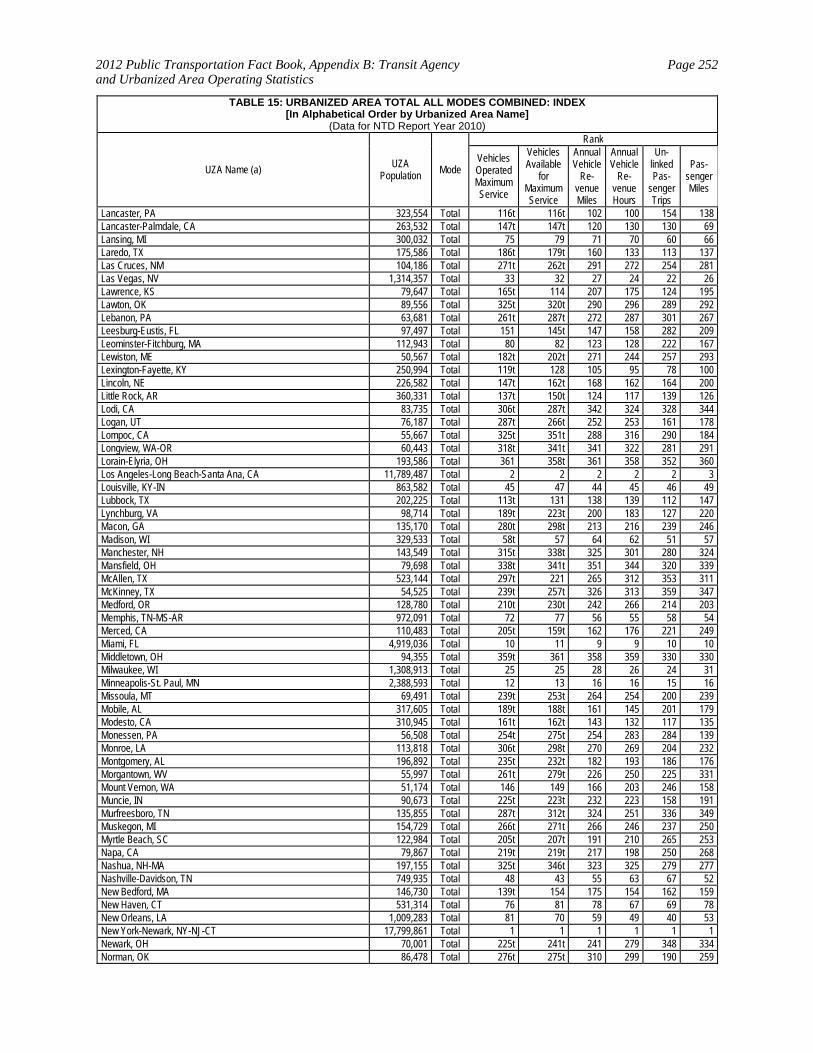
2012 Public Transportation Fact Book, Appendix B: Transit Agency and Urbanized Area Operating Statistics
Page 252
TABLE 15: URBANIZED AREA TOTAL ALL MODES COMBINED: INDEX [In Alphabetical Order by Urbanized Area Name]
(Data for NTD Report Year 2010)
UZA Name (a) UZA Population Mode
Rank
Vehicles Operated Maximum Service
Vehicles Available
for Maximum Service
Annual Vehicle
Re-venue Miles
Annual Vehicle
Re-venue Hours
Un-linked Pas-
senger Trips
Pas-senger Miles
Lancaster, PA 323,554 Total 116t 116t 102 100 154 138 Lancaster-Palmdale, CA 263,532 Total 147t 147t 120 130 130 69 Lansing, MI 300,032 Total 75 79 71 70 60 66 Laredo, TX 175,586 Total 186t 179t 160 133 113 137 Las Cruces, NM 104,186 Total 271t 262t 291 272 254 281 Las Vegas, NV 1,314,357 Total 33 32 27 24 22 26 Lawrence, KS 79,647 Total 165t 114 207 175 124 195 Lawton, OK 89,556 Total 325t 320t 290 296 289 292 Lebanon, PA 63,681 Total 261t 287t 272 287 301 267 Leesburg-Eustis, FL 97,497 Total 151 145t 147 158 282 209 Leominster-Fitchburg, MA 112,943 Total 80 82 123 128 222 167 Lewiston, ME 50,567 Total 182t 202t 271 244 257 293 Lexington-Fayette, KY 250,994 Total 119t 128 105 95 78 100 Lincoln, NE 226,582 Total 147t 162t 168 162 164 200 Little Rock, AR 360,331 Total 137t 150t 124 117 139 126 Lodi, CA 83,735 Total 306t 287t 342 324 328 344 Logan, UT 76,187 Total 287t 266t 252 253 161 178 Lompoc, CA 55,667 Total 325t 351t 288 316 290 184 Longview, WA-OR 60,443 Total 318t 341t 341 322 281 291 Lorain-Elyria, OH 193,586 Total 361 358t 361 358 352 360 Los Angeles-Long Beach-Santa Ana, CA 11,789,487 Total 2 2 2 2 2 3 Louisville, KY-IN 863,582 Total 45 47 44 45 46 49 Lubbock, TX 202,225 Total 113t 131 138 139 112 147 Lynchburg, VA 98,714 Total 189t 223t 200 183 127 220 Macon, GA 135,170 Total 280t 298t 213 216 239 246 Madison, WI 329,533 Total 58t 57 64 62 51 57 Manchester, NH 143,549 Total 315t 338t 325 301 280 324 Mansfield, OH 79,698 Total 338t 341t 351 344 320 339 McAllen, TX 523,144 Total 297t 221 265 312 353 311 McKinney, TX 54,525 Total 239t 257t 326 313 359 347 Medford, OR 128,780 Total 210t 230t 242 266 214 203 Memphis, TN-MS-AR 972,091 Total 72 77 56 55 58 54 Merced, CA 110,483 Total 205t 159t 162 176 221 249 Miami, FL 4,919,036 Total 10 11 9 9 10 10 Middletown, OH 94,355 Total 359t 361 358 359 330 330 Milwaukee, WI 1,308,913 Total 25 25 28 26 24 31 Minneapolis-St. Paul, MN 2,388,593 Total 12 13 16 16 15 16 Missoula, MT 69,491 Total 239t 253t 264 254 200 239 Mobile, AL 317,605 Total 189t 188t 161 145 201 179 Modesto, CA 310,945 Total 161t 162t 143 132 117 135 Monessen, PA 56,508 Total 254t 275t 254 283 284 139 Monroe, LA 113,818 Total 306t 298t 270 269 204 232 Montgomery, AL 196,892 Total 235t 232t 182 193 186 176 Morgantown, WV 55,997 Total 261t 279t 226 250 225 331 Mount Vernon, WA 51,174 Total 146 149 166 203 246 158 Muncie, IN 90,673 Total 225t 223t 232 223 158 191 Murfreesboro, TN 135,855 Total 287t 312t 324 251 336 349 Muskegon, MI 154,729 Total 266t 271t 266 246 237 250 Myrtle Beach, SC 122,984 Total 205t 207t 191 210 265 253 Napa, CA 79,867 Total 219t 219t 217 198 250 268 Nashua, NH-MA 197,155 Total 325t 346t 323 325 279 277 Nashville-Davidson, TN 749,935 Total 48 43 55 63 67 52 New Bedford, MA 146,730 Total 139t 154 175 154 162 159 New Haven, CT 531,314 Total 76 81 78 67 69 78 New Orleans, LA 1,009,283 Total 81 70 59 49 40 53 New York-Newark, NY-NJ-CT 17,799,861 Total 1 1 1 1 1 1 Newark, OH 70,001 Total 225t 241t 241 279 348 334 Norman, OK 86,478 Total 276t 275t 310 299 190 259
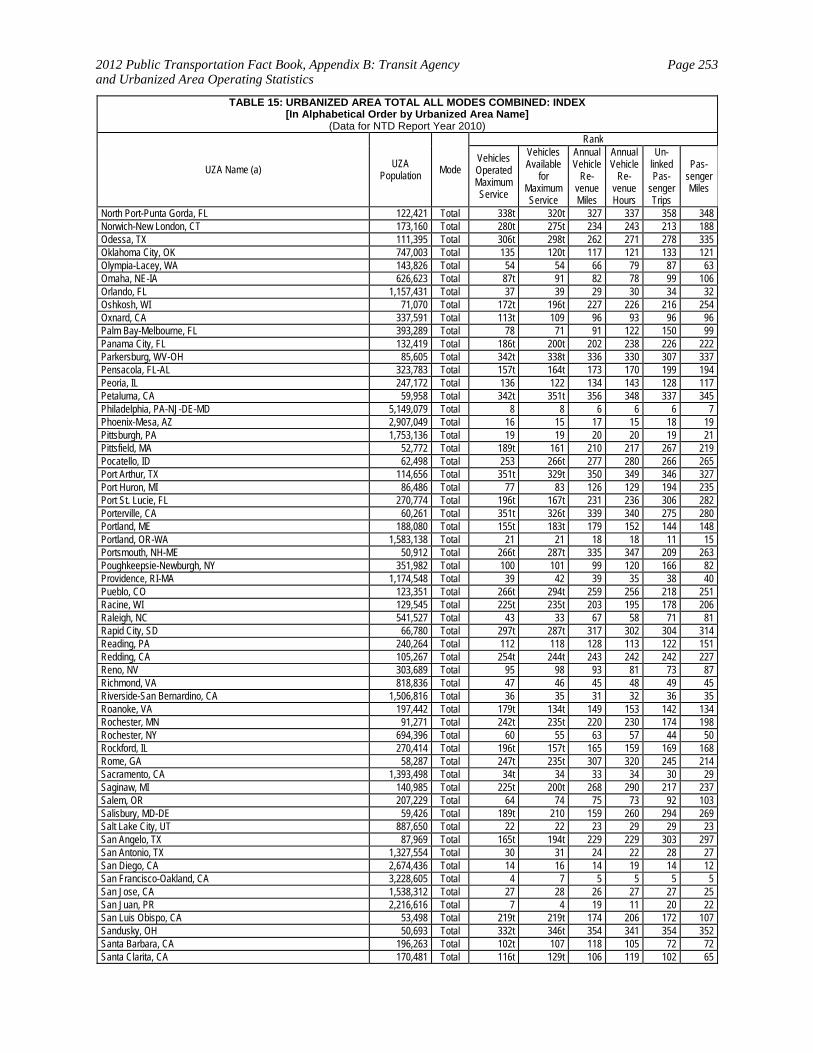
2012 Public Transportation Fact Book, Appendix B: Transit Agency and Urbanized Area Operating Statistics
Page 253
TABLE 15: URBANIZED AREA TOTAL ALL MODES COMBINED: INDEX [In Alphabetical Order by Urbanized Area Name]
(Data for NTD Report Year 2010)
UZA Name (a) UZA Population Mode
Rank
Vehicles Operated Maximum Service
Vehicles Available
for Maximum Service
Annual Vehicle
Re-venue Miles
Annual Vehicle
Re-venue Hours
Un-linked Pas-
senger Trips
Pas-senger Miles
North Port-Punta Gorda, FL 122,421 Total 338t 320t 327 337 358 348 Norwich-New London, CT 173,160 Total 280t 275t 234 243 213 188 Odessa, TX 111,395 Total 306t 298t 262 271 278 335 Oklahoma City, OK 747,003 Total 135 120t 117 121 133 121 Olympia-Lacey, WA 143,826 Total 54 54 66 79 87 63 Omaha, NE-IA 626,623 Total 87t 91 82 78 99 106 Orlando, FL 1,157,431 Total 37 39 29 30 34 32 Oshkosh, WI 71,070 Total 172t 196t 227 226 216 254 Oxnard, CA 337,591 Total 113t 109 96 93 96 96 Palm Bay-Melbourne, FL 393,289 Total 78 71 91 122 150 99 Panama City, FL 132,419 Total 186t 200t 202 238 226 222 Parkersburg, WV-OH 85,605 Total 342t 338t 336 330 307 337 Pensacola, FL-AL 323,783 Total 157t 164t 173 170 199 194 Peoria, IL 247,172 Total 136 122 134 143 128 117 Petaluma, CA 59,958 Total 342t 351t 356 348 337 345 Philadelphia, PA-NJ-DE-MD 5,149,079 Total 8 8 6 6 6 7 Phoenix-Mesa, AZ 2,907,049 Total 16 15 17 15 18 19 Pittsburgh, PA 1,753,136 Total 19 19 20 20 19 21 Pittsfield, MA 52,772 Total 189t 161 210 217 267 219 Pocatello, ID 62,498 Total 253 266t 277 280 266 265 Port Arthur, TX 114,656 Total 351t 329t 350 349 346 327 Port Huron, MI 86,486 Total 77 83 126 129 194 235 Port St. Lucie, FL 270,774 Total 196t 167t 231 236 306 282 Porterville, CA 60,261 Total 351t 326t 339 340 275 280 Portland, ME 188,080 Total 155t 183t 179 152 144 148 Portland, OR-WA 1,583,138 Total 21 21 18 18 11 15 Portsmouth, NH-ME 50,912 Total 266t 287t 335 347 209 263 Poughkeepsie-Newburgh, NY 351,982 Total 100 101 99 120 166 82 Providence, RI-MA 1,174,548 Total 39 42 39 35 38 40 Pueblo, CO 123,351 Total 266t 294t 259 256 218 251 Racine, WI 129,545 Total 225t 235t 203 195 178 206 Raleigh, NC 541,527 Total 43 33 67 58 71 81 Rapid City, SD 66,780 Total 297t 287t 317 302 304 314 Reading, PA 240,264 Total 112 118 128 113 122 151 Redding, CA 105,267 Total 254t 244t 243 242 242 227 Reno, NV 303,689 Total 95 98 93 81 73 87 Richmond, VA 818,836 Total 47 46 45 48 49 45 Riverside-San Bernardino, CA 1,506,816 Total 36 35 31 32 36 35 Roanoke, VA 197,442 Total 179t 134t 149 153 142 134 Rochester, MN 91,271 Total 242t 235t 220 230 174 198 Rochester, NY 694,396 Total 60 55 63 57 44 50 Rockford, IL 270,414 Total 196t 157t 165 159 169 168 Rome, GA 58,287 Total 247t 235t 307 320 245 214 Sacramento, CA 1,393,498 Total 34t 34 33 34 30 29 Saginaw, MI 140,985 Total 225t 200t 268 290 217 237 Salem, OR 207,229 Total 64 74 75 73 92 103 Salisbury, MD-DE 59,426 Total 189t 210 159 260 294 269 Salt Lake City, UT 887,650 Total 22 22 23 29 29 23 San Angelo, TX 87,969 Total 165t 194t 229 229 303 297 San Antonio, TX 1,327,554 Total 30 31 24 22 28 27 San Diego, CA 2,674,436 Total 14 16 14 19 14 12 San Francisco-Oakland, CA 3,228,605 Total 4 7 5 5 5 5 San Jose, CA 1,538,312 Total 27 28 26 27 27 25 San Juan, PR 2,216,616 Total 7 4 19 11 20 22 San Luis Obispo, CA 53,498 Total 219t 219t 174 206 172 107 Sandusky, OH 50,693 Total 332t 346t 354 341 354 352 Santa Barbara, CA 196,263 Total 102t 107 118 105 72 72 Santa Clarita, CA 170,481 Total 116t 129t 106 119 102 65
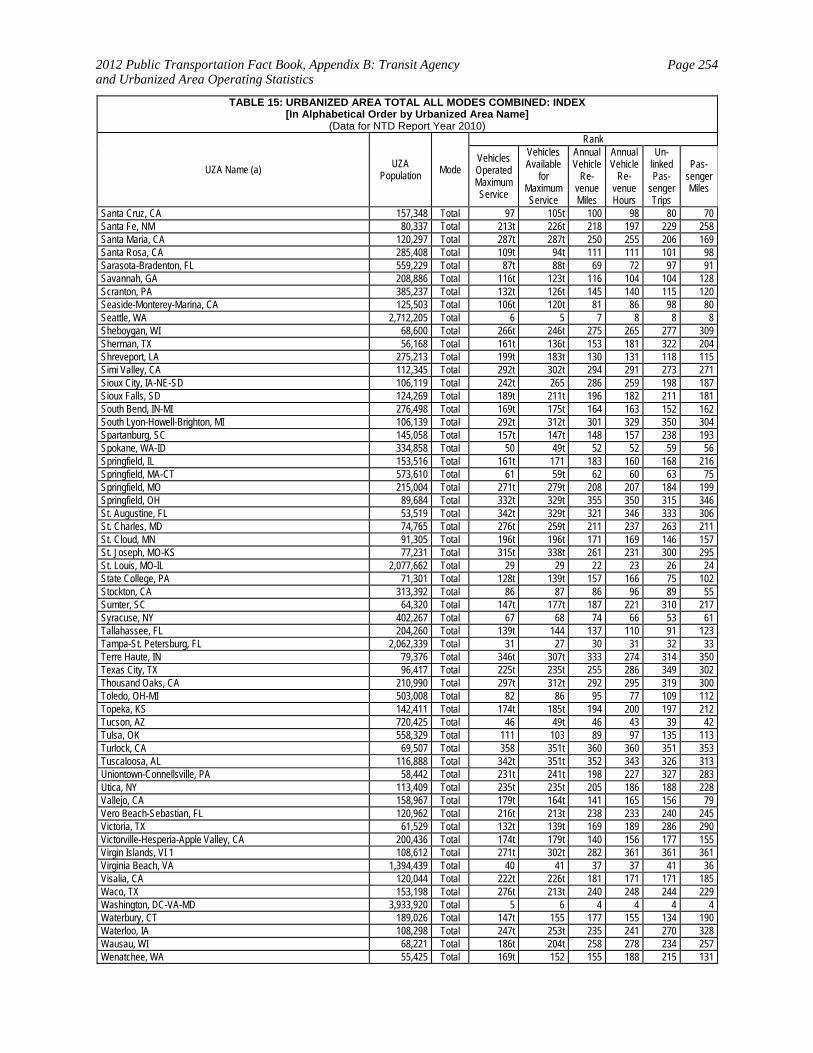
2012 Public Transportation Fact Book, Appendix B: Transit Agency and Urbanized Area Operating Statistics
Page 254
TABLE 15: URBANIZED AREA TOTAL ALL MODES COMBINED: INDEX [In Alphabetical Order by Urbanized Area Name]
(Data for NTD Report Year 2010)
UZA Name (a) UZA Population Mode
Rank
Vehicles Operated Maximum Service
Vehicles Available
for Maximum Service
Annual Vehicle
Re-venue Miles
Annual Vehicle
Re-venue Hours
Un-linked Pas-
senger Trips
Pas-senger Miles
Santa Cruz, CA 157,348 Total 97 105t 100 98 80 70 Santa Fe, NM 80,337 Total 213t 226t 218 197 229 258 Santa Maria, CA 120,297 Total 287t 287t 250 255 206 169 Santa Rosa, CA 285,408 Total 109t 94t 111 111 101 98 Sarasota-Bradenton, FL 559,229 Total 87t 88t 69 72 97 91 Savannah, GA 208,886 Total 116t 123t 116 104 104 128 Scranton, PA 385,237 Total 132t 126t 145 140 115 120 Seaside-Monterey-Marina, CA 125,503 Total 106t 120t 81 86 98 80 Seattle, WA 2,712,205 Total 6 5 7 8 8 8 Sheboygan, WI 68,600 Total 266t 246t 275 265 277 309 Sherman, TX 56,168 Total 161t 136t 153 181 322 204 Shreveport, LA 275,213 Total 199t 183t 130 131 118 115 Simi Valley, CA 112,345 Total 292t 302t 294 291 273 271 Sioux City, IA-NE-SD 106,119 Total 242t 265 286 259 198 187 Sioux Falls, SD 124,269 Total 189t 211t 196 182 211 181 South Bend, IN-MI 276,498 Total 169t 175t 164 163 152 162 South Lyon-Howell-Brighton, MI 106,139 Total 292t 312t 301 329 350 304 Spartanburg, SC 145,058 Total 157t 147t 148 157 238 193 Spokane, WA-ID 334,858 Total 50 49t 52 52 59 56 Springfield, IL 153,516 Total 161t 171 183 160 168 216 Springfield, MA-CT 573,610 Total 61 59t 62 60 63 75 Springfield, MO 215,004 Total 271t 279t 208 207 184 199 Springfield, OH 89,684 Total 332t 329t 355 350 315 346 St. Augustine, FL 53,519 Total 342t 329t 321 346 333 306 St. Charles, MD 74,765 Total 276t 259t 211 237 263 211 St. Cloud, MN 91,305 Total 196t 196t 171 169 146 157 St. Joseph, MO-KS 77,231 Total 315t 338t 261 231 300 295 St. Louis, MO-IL 2,077,662 Total 29 29 22 23 26 24 State College, PA 71,301 Total 128t 139t 157 166 75 102 Stockton, CA 313,392 Total 86 87 86 96 89 55 Sumter, SC 64,320 Total 147t 177t 187 221 310 217 Syracuse, NY 402,267 Total 67 68 74 66 53 61 Tallahassee, FL 204,260 Total 139t 144 137 110 91 123 Tampa-St. Petersburg, FL 2,062,339 Total 31 27 30 31 32 33 Terre Haute, IN 79,376 Total 346t 307t 333 274 314 350 Texas City, TX 96,417 Total 225t 235t 255 286 349 302 Thousand Oaks, CA 210,990 Total 297t 312t 292 295 319 300 Toledo, OH-MI 503,008 Total 82 86 95 77 109 112 Topeka, KS 142,411 Total 174t 185t 194 200 197 212 Tucson, AZ 720,425 Total 46 49t 46 43 39 42 Tulsa, OK 558,329 Total 111 103 89 97 135 113 Turlock, CA 69,507 Total 358 351t 360 360 351 353 Tuscaloosa, AL 116,888 Total 342t 351t 352 343 326 313 Uniontown-Connellsville, PA 58,442 Total 231t 241t 198 227 327 283 Utica, NY 113,409 Total 235t 235t 205 186 188 228 Vallejo, CA 158,967 Total 179t 164t 141 165 156 79 Vero Beach-Sebastian, FL 120,962 Total 216t 213t 238 233 240 245 Victoria, TX 61,529 Total 132t 139t 169 189 286 290 Victorville-Hesperia-Apple Valley, CA 200,436 Total 174t 179t 140 156 177 155 Virgin Islands, VI 1 108,612 Total 271t 302t 282 361 361 361 Virginia Beach, VA 1,394,439 Total 40 41 37 37 41 36 Visalia, CA 120,044 Total 222t 226t 181 171 171 185 Waco, TX 153,198 Total 276t 213t 240 248 244 229 Washington, DC-VA-MD 3,933,920 Total 5 6 4 4 4 4 Waterbury, CT 189,026 Total 147t 155 177 155 134 190 Waterloo, IA 108,298 Total 247t 253t 235 241 270 328 Wausau, WI 68,221 Total 186t 204t 258 278 234 257 Wenatchee, WA 55,425 Total 169t 152 155 188 215 131
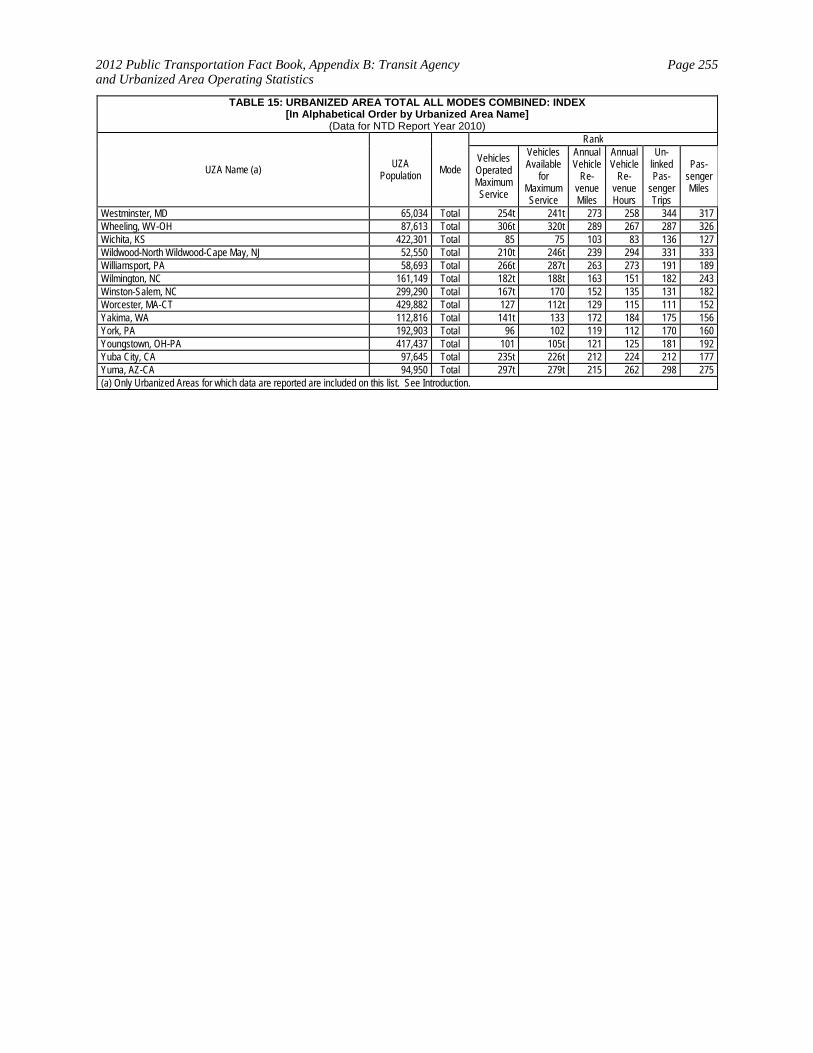
2012 Public Transportation Fact Book, Appendix B: Transit Agency and Urbanized Area Operating Statistics
Page 255
TABLE 15: URBANIZED AREA TOTAL ALL MODES COMBINED: INDEX [In Alphabetical Order by Urbanized Area Name]
(Data for NTD Report Year 2010)
UZA Name (a) UZA Population Mode
Rank
Vehicles Operated Maximum Service
Vehicles Available
for Maximum Service
Annual Vehicle
Re-venue Miles
Annual Vehicle
Re-venue Hours
Un-linked Pas-
senger Trips
Pas-senger Miles
Westminster, MD 65,034 Total 254t 241t 273 258 344 317 Wheeling, WV-OH 87,613 Total 306t 320t 289 267 287 326 Wichita, KS 422,301 Total 85 75 103 83 136 127 Wildwood-North Wildwood-Cape May, NJ 52,550 Total 210t 246t 239 294 331 333 Williamsport, PA 58,693 Total 266t 287t 263 273 191 189 Wilmington, NC 161,149 Total 182t 188t 163 151 182 243 Winston-Salem, NC 299,290 Total 167t 170 152 135 131 182 Worcester, MA-CT 429,882 Total 127 112t 129 115 111 152 Yakima, WA 112,816 Total 141t 133 172 184 175 156 York, PA 192,903 Total 96 102 119 112 170 160 Youngstown, OH-PA 417,437 Total 101 105t 121 125 181 192 Yuba City, CA 97,645 Total 235t 226t 212 224 212 177 Yuma, AZ-CA 94,950 Total 297t 279t 215 262 298 275 (a) Only Urbanized Areas for which data are reported are included on this list. See Introduction.
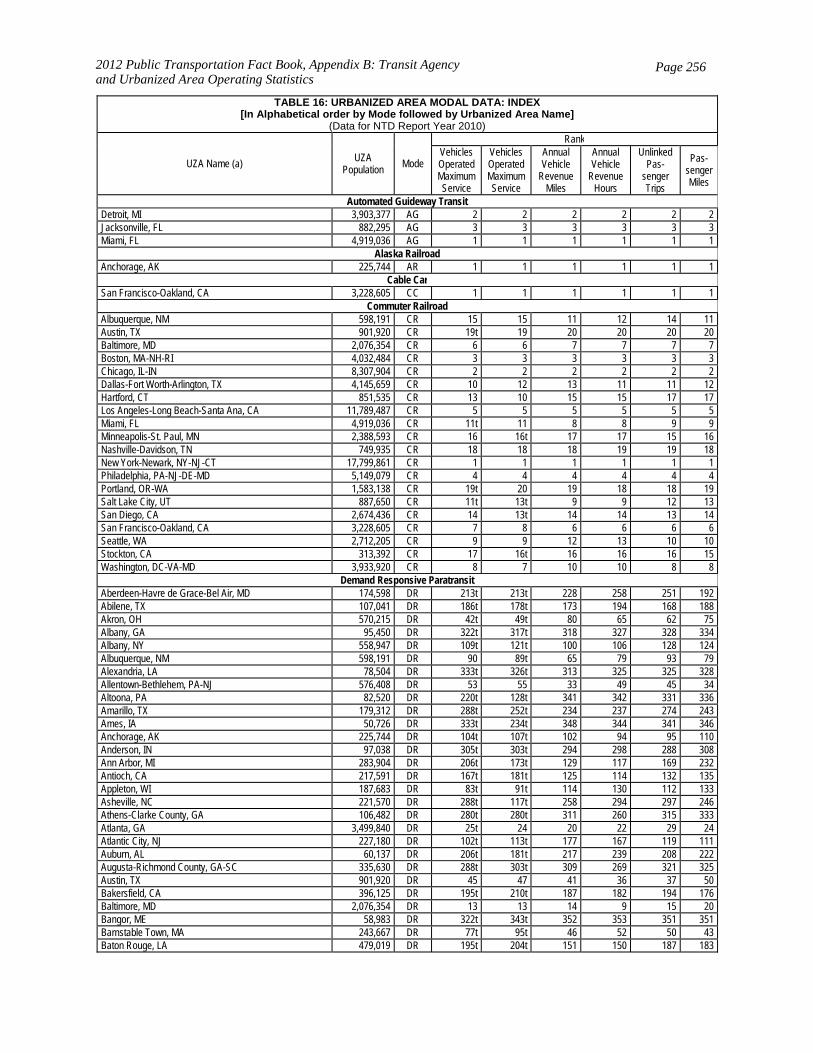
2012 Public Transportation Fact Book, Appendix B: Transit Agency and Urbanized Area Operating Statistics
Page 256
TABLE 16: URBANIZED AREA MODAL DATA: INDEX[In Alphabetical order by Mode followed by Urbanized Area Name]
(Data for NTD Report Year 2010)
UZA Name (a) UZA Population Mode
Rank Vehicles Operated Maximum Service
Vehicles Operated Maximum Service
Annual Vehicle
Revenue Miles
Annual Vehicle
Revenue Hours
Unlinked Pas-
senger Trips
Pas-senger Miles
Automated Guideway Transit Detroit, MI 3,903,377 AG 2 2 2 2 2 2 Jacksonville, FL 882,295 AG 3 3 3 3 3 3 Miami, FL 4,919,036 AG 1 1 1 1 1 1
Alaska Railroad Anchorage, AK 225,744 AR 1 1 1 1 1 1
Cable Car San Francisco-Oakland, CA 3,228,605 CC 1 1 1 1 1 1
Commuter Railroad Albuquerque, NM 598,191 CR 15 15 11 12 14 11 Austin, TX 901,920 CR 19t 19 20 20 20 20 Baltimore, MD 2,076,354 CR 6 6 7 7 7 7 Boston, MA-NH-RI 4,032,484 CR 3 3 3 3 3 3 Chicago, IL-IN 8,307,904 CR 2 2 2 2 2 2 Dallas-Fort Worth-Arlington, TX 4,145,659 CR 10 12 13 11 11 12 Hartford, CT 851,535 CR 13 10 15 15 17 17 Los Angeles-Long Beach-Santa Ana, CA 11,789,487 CR 5 5 5 5 5 5 Miami, FL 4,919,036 CR 11t 11 8 8 9 9 Minneapolis-St. Paul, MN 2,388,593 CR 16 16t 17 17 15 16 Nashville-Davidson, TN 749,935 CR 18 18 18 19 19 18 New York-Newark, NY-NJ-CT 17,799,861 CR 1 1 1 1 1 1 Philadelphia, PA-NJ-DE-MD 5,149,079 CR 4 4 4 4 4 4 Portland, OR-WA 1,583,138 CR 19t 20 19 18 18 19 Salt Lake City, UT 887,650 CR 11t 13t 9 9 12 13 San Diego, CA 2,674,436 CR 14 13t 14 14 13 14 San Francisco-Oakland, CA 3,228,605 CR 7 8 6 6 6 6 Seattle, WA 2,712,205 CR 9 9 12 13 10 10 Stockton, CA 313,392 CR 17 16t 16 16 16 15 Washington, DC-VA-MD 3,933,920 CR 8 7 10 10 8 8
Demand Responsive Paratransit Aberdeen-Havre de Grace-Bel Air, MD 174,598 DR 213t 213t 228 258 251 192 Abilene, TX 107,041 DR 186t 178t 173 194 168 188 Akron, OH 570,215 DR 42t 49t 80 65 62 75 Albany, GA 95,450 DR 322t 317t 318 327 328 334 Albany, NY 558,947 DR 109t 121t 100 106 128 124 Albuquerque, NM 598,191 DR 90 89t 65 79 93 79 Alexandria, LA 78,504 DR 333t 326t 313 325 325 328 Allentown-Bethlehem, PA-NJ 576,408 DR 53 55 33 49 45 34 Altoona, PA 82,520 DR 220t 128t 341 342 331 336 Amarillo, TX 179,312 DR 288t 252t 234 237 274 243 Ames, IA 50,726 DR 333t 234t 348 344 341 346 Anchorage, AK 225,744 DR 104t 107t 102 94 95 110 Anderson, IN 97,038 DR 305t 303t 294 298 288 308 Ann Arbor, MI 283,904 DR 206t 173t 129 117 169 232 Antioch, CA 217,591 DR 167t 181t 125 114 132 135 Appleton, WI 187,683 DR 83t 91t 114 130 112 133 Asheville, NC 221,570 DR 288t 117t 258 294 297 246 Athens-Clarke County, GA 106,482 DR 280t 280t 311 260 315 333 Atlanta, GA 3,499,840 DR 25t 24 20 22 29 24 Atlantic City, NJ 227,180 DR 102t 113t 177 167 119 111 Auburn, AL 60,137 DR 206t 181t 217 239 208 222 Augusta-Richmond County, GA-SC 335,630 DR 288t 303t 309 269 321 325 Austin, TX 901,920 DR 45 47 41 36 37 50 Bakersfield, CA 396,125 DR 195t 210t 187 182 194 176 Baltimore, MD 2,076,354 DR 13 13 14 9 15 20 Bangor, ME 58,983 DR 322t 343t 352 353 351 351 Barnstable Town, MA 243,667 DR 77t 95t 46 52 50 43 Baton Rouge, LA 479,019 DR 195t 204t 151 150 187 183

2012 Public Transportation Fact Book, Appendix B: Transit Agency and Urbanized Area Operating Statistics
Page 257
TABLE 16: URBANIZED AREA MODAL DATA: INDEX[In Alphabetical order by Mode followed by Urbanized Area Name]
(Data for NTD Report Year 2010)
UZA Name (a) UZA Population Mode
Rank Vehicles Operated Maximum Service
Vehicles Operated Maximum Service
Annual Vehicle
Revenue Miles
Annual Vehicle
Revenue Hours
Unlinked Pas-
senger Trips
Pas-senger Miles
Battle Creek, MI 79,135 DR 288t 291t 297 280 282 298 Bay City, MI 74,048 DR 206t 230t 169 200 217 212 Beaumont, TX 139,304 DR 305t 291t 289 288 307 283 Bellingham, WA 84,324 DR 130t 131t 123 119 107 129 Beloit, WI-IL 56,462 DR 344t 317t 353 354 353 352 Bend, OR 57,525 DR 248t 252t 284 270 223 272 Benton Harbor-St. Joseph, MI 61,745 DR 175t 199t 175 158 117 151 Billings, MT 100,317 DR 236t 234t 272 256 203 224 Binghamton, NY-PA 158,884 DR 161t 168t 120 129 137 106 Birmingham, AL 663,615 DR 138t 150t 109 104 141 138 Bismarck, ND 74,991 DR 143t 158t 137 136 108 156 Blacksburg, VA 57,236 DR 288t 269t 327 297 316 338 Bloomington, IN 92,456 DR 280t 303t 298 267 284 312 Bloomington-Normal, IL 112,415 DR 264t 303t 262 252 260 262 Boise City, ID 272,625 DR 226t 252t 218 202 235 239 Bonita Springs-Naples, FL 221,251 DR 123t 141t 98 111 146 121 Boston, MA-NH-RI 4,032,484 DR 6 4 7 7 6 5 Bowling Green, KY 58,314 DR 288t 280t 340 340 337 341 Bremerton, WA 178,369 DR 51t 58 89 97 59 87 Bridgeport-Stamford, CT-NY 888,890 DR 57t 56 79 59 56 82 Brooksville, FL 102,193 DR 206t 192t 244 300 267 202 Brownsville, TX 165,776 DR 264t 269t 275 271 254 256 Buffalo, NY 976,703 DR 74 82 94 98 121 104 Burlington, VT 105,365 DR 195t 199t 213 208 233 255 Canton, OH 266,595 DR 152t 117t 106 118 130 120 Cape Coral, FL 329,757 DR 111t 113t 104 107 152 119 Casper, WY 57,719 DR 280t 280t 242 247 209 231 Cedar Rapids, IA 155,334 DR 118t 125t 190 177 157 161 Champaign, IL 123,938 DR 186t 181t 155 155 111 233 Charleston, WV 182,991 DR 226t 241t 201 203 264 204 Charleston-North Charleston, SC 423,410 DR 180t 192t 133 145 178 141 Charlotte, NC-SC 758,927 DR 67 65t 54 61 80 71 Charlottesville, VA 81,449 DR 75 86t 85 81 60 58 Chattanooga, TN-GA 343,509 DR 175t 178t 181 172 182 185 Cheyenne, WY 68,202 DR 288t 291t 288 304 300 245 Chicago, IL-IN 8,307,904 DR 3 3 3 3 3 4 Chico, CA 89,221 DR 167t 168t 188 156 144 166 Cincinnati, OH-KY-IN 1,503,262 DR 34 39 35 40 47 40 Clarksville, TN-KY 121,775 DR 264t 280t 220 227 271 260 Cleveland, OH 1,786,647 DR 23 26 25 26 25 28 Cleveland, TN 58,192 DR 305t 336t 304 265 303 323 College Station-Bryan, TX 132,500 DR 93t 104 87 101 160 95 Colorado Springs, CO 466,122 DR 56 45t 86 67 66 93 Columbia, MO 98,779 DR 288t 291t 282 254 266 309 Columbia, SC 420,537 DR 175t 204t 152 179 181 146 Columbus, GA-AL 242,324 DR 288t 303t 252 284 317 290 Columbus, OH 1,133,193 DR 77t 84t 44 57 78 69 Concord, CA 552,624 DR 66 68 74 76 81 74 Corpus Christi, TX 293,925 DR 138t 138t 90 110 99 102 Cumberland, MD--WV 52,115 DR 264t 280t 271 291 309 266 Dallas-Fort Worth-Arlington, TX 4,145,659 DR 14 15 11 13 12 9 Danbury, CT-NY 154,455 DR 195t 146t 189 191 190 217 Danville, IL 53,223 DR 333t 317t 349 352 336 348 Danville, VA 50,902 DR 333t 326t 330 339 308 295 Davenport, IA-IL 270,626 DR 180t 181t 197 174 151 201 Dayton, OH 703,444 DR 37t 41 37 39 42 47 Daytona Beach-Port Orange, FL 255,353 DR 82 81 61 60 74 70 Decatur, AL 52,315 DR 123t 158t 156 163 91 177

2012 Public Transportation Fact Book, Appendix B: Transit Agency and Urbanized Area Operating Statistics
Page 258
TABLE 16: URBANIZED AREA MODAL DATA: INDEX[In Alphabetical order by Mode followed by Urbanized Area Name]
(Data for NTD Report Year 2010)
UZA Name (a) UZA Population Mode
Rank Vehicles Operated Maximum Service
Vehicles Operated Maximum Service
Annual Vehicle
Revenue Miles
Annual Vehicle
Revenue Hours
Unlinked Pas-
senger Trips
Pas-senger Miles
Decatur, IL 96,454 DR 288t 326t 301 292 305 316 DeKalb, IL 55,805 DR 157t 178t 139 149 123 114 Denton-Lewisville, TX 299,823 DR 236t 262t 209 209 229 214 Denver-Aurora, CO 1,984,889 DR 12 14 15 15 17 17 Des Moines, IA 370,505 DR 136t 131t 113 109 92 81 Detroit, MI 3,903,377 DR 24 25 30 29 23 29 Dothan, AL 60,792 DR 123t 128t 112 102 110 130 Dover-Rochester, NH-ME 80,456 DR 344t 326t 339 348 350 344 Dubuque, IA-IL 65,251 DR 264t 252t 245 241 201 247 Duluth, MN-WI 118,265 DR 305t 291t 253 262 293 288 Durham, NC 287,796 DR 77t 71t 62 71 77 76 Eau Claire, WI 91,393 DR 138t 158t 167 169 177 152 El Centro, CA 52,954 DR 288t 303t 247 285 252 181 El Paso, TX-NM 674,801 DR 93t 84t 66 70 83 77 Elkhart, IN-MI 131,226 DR 236t 222t 265 289 192 263 Elmira, NY 67,159 DR 257t 269t 239 266 219 249 Erie, PA 194,804 DR 73 88 103 80 75 99 Eugene, OR 224,049 DR 107t 98t 99 84 105 94 Evansville, IN-KY 211,989 DR 226t 252t 241 231 227 229 Fairbanks, AK 51,926 DR 288t 317t 283 290 310 285 Fairfield, CA 112,446 DR 288t 317t 255 277 304 270 Fargo, ND-MN 142,477 DR 220t 222t 198 196 199 199 Fayetteville, NC 276,368 DR 248t 252t 227 243 236 225 Fayetteville-Springdale, AR 172,585 DR 226t 141t 248 240 265 292 Flagstaff, AZ 57,050 DR 264t 291t 310 310 280 286 Flint, MI 365,096 DR 50 37 28 32 30 26 Florence, AL 71,299 DR 91t 98t 161 143 54 122 Florence, SC 67,314 DR 57t 62 72 96 94 64 Fond du Lac, WI 50,058 DR 288t 326t 277 272 250 274 Fort Collins, CO 206,757 DR 138t 123t 219 213 225 236 Fort Smith, AR-OK 106,470 DR 322t 269t 263 273 277t 251 Fort Walton Beach, FL 152,741 DR 120t 141t 131 142 163 153 Fort Wayne, IN 287,759 DR 248t 252t 235 246 232 198 Frederick, MD 119,144 DR 195t 158t 172 215 175 194 Fresno, CA 554,923 DR 83t 97 81 83 76 113 Gainesville, FL 159,508 DR 161t 117t 202 218 231 208 Gainesville, GA 88,680 DR 248t 280t 278 299 281 254 Galveston, TX 54,770 DR 333t 326t 333 326 318 318 Glens Falls, NY 57,627 DR 354t 354t 354 350 354 354 Grand Forks, ND-MN 56,573 DR 236t 262t 226 207 193 265 Grand Junction, CO 92,362 DR 322t 336t 322 334 335 317 Grand Rapids, MI 539,080 DR 36 45t 49 46 43 35 Great Falls, MT 64,387 DR 288t 241t 299 293 295 330 Greeley, CO 93,879 DR 305t 280t 287 278 298 313 Green Bay, WI 187,316 DR 161t 168t 180 164 188 173 Greensboro, NC 267,884 DR 61t 60 43 41 48 44 Greenville, SC 302,194 DR 333t 336t 336 336 347 340 Gulfport-Biloxi, MS 205,754 DR 213t 222t 230 206 212 112 Hagerstown, MD-WV-PA 120,326 DR 344t 348t 335 337 338 331 Hanford, CA 69,639 DR 264t 241t 316 276 261 302 Harrisburg, PA 362,782 DR 104t 103 88 95 100 78 Harrisonburg, VA 52,647 DR 305t 303t 324 314 320 324 Hartford, CT 851,535 DR 39 44 48 33 46 54 Hickory, NC 187,808 DR 97t 105t 122 135 145 105 High Point, NC 132,844 DR 280t 303t 300 281 270 277 Holland, MI 91,921 DR 149t 141t 205 188 161 172 Honolulu, HI 718,182 DR 31 31 27 27 24 19 Houston, TX 3,822,509 DR 16 18 9 11 13 11
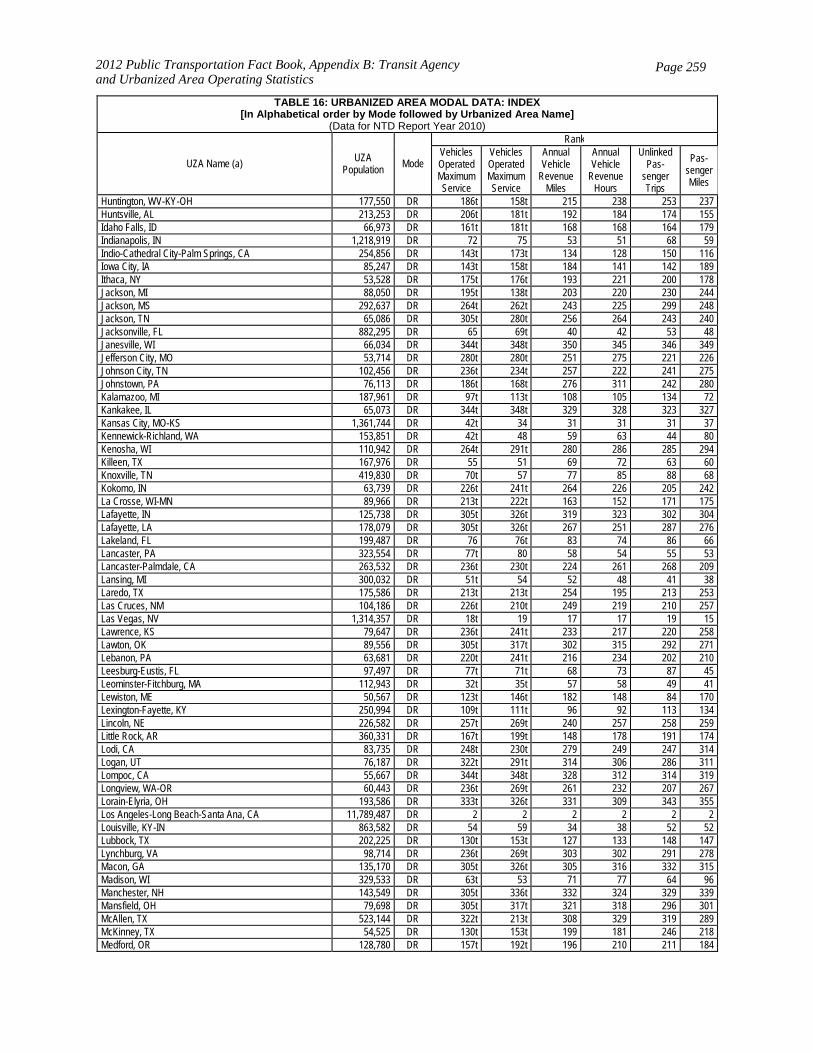
2012 Public Transportation Fact Book, Appendix B: Transit Agency and Urbanized Area Operating Statistics
Page 259
TABLE 16: URBANIZED AREA MODAL DATA: INDEX[In Alphabetical order by Mode followed by Urbanized Area Name]
(Data for NTD Report Year 2010)
UZA Name (a) UZA Population Mode
Rank Vehicles Operated Maximum Service
Vehicles Operated Maximum Service
Annual Vehicle
Revenue Miles
Annual Vehicle
Revenue Hours
Unlinked Pas-
senger Trips
Pas-senger Miles
Huntington, WV-KY-OH 177,550 DR 186t 158t 215 238 253 237 Huntsville, AL 213,253 DR 206t 181t 192 184 174 155 Idaho Falls, ID 66,973 DR 161t 181t 168 168 164 179 Indianapolis, IN 1,218,919 DR 72 75 53 51 68 59 Indio-Cathedral City-Palm Springs, CA 254,856 DR 143t 173t 134 128 150 116 Iowa City, IA 85,247 DR 143t 158t 184 141 142 189 Ithaca, NY 53,528 DR 175t 176t 193 221 200 178 Jackson, MI 88,050 DR 195t 138t 203 220 230 244 Jackson, MS 292,637 DR 264t 262t 243 225 299 248 Jackson, TN 65,086 DR 305t 280t 256 264 243 240 Jacksonville, FL 882,295 DR 65 69t 40 42 53 48 Janesville, WI 66,034 DR 344t 348t 350 345 346 349 Jefferson City, MO 53,714 DR 280t 280t 251 275 221 226 Johnson City, TN 102,456 DR 236t 234t 257 222 241 275 Johnstown, PA 76,113 DR 186t 168t 276 311 242 280 Kalamazoo, MI 187,961 DR 97t 113t 108 105 134 72 Kankakee, IL 65,073 DR 344t 348t 329 328 323 327 Kansas City, MO-KS 1,361,744 DR 42t 34 31 31 31 37 Kennewick-Richland, WA 153,851 DR 42t 48 59 63 44 80 Kenosha, WI 110,942 DR 264t 291t 280 286 285 294 Killeen, TX 167,976 DR 55 51 69 72 63 60 Knoxville, TN 419,830 DR 70t 57 77 85 88 68 Kokomo, IN 63,739 DR 226t 241t 264 226 205 242 La Crosse, WI-MN 89,966 DR 213t 222t 163 152 171 175 Lafayette, IN 125,738 DR 305t 326t 319 323 302 304 Lafayette, LA 178,079 DR 305t 326t 267 251 287 276 Lakeland, FL 199,487 DR 76 76t 83 74 86 66 Lancaster, PA 323,554 DR 77t 80 58 54 55 53 Lancaster-Palmdale, CA 263,532 DR 236t 230t 224 261 268 209 Lansing, MI 300,032 DR 51t 54 52 48 41 38 Laredo, TX 175,586 DR 213t 213t 254 195 213 253 Las Cruces, NM 104,186 DR 226t 210t 249 219 210 257 Las Vegas, NV 1,314,357 DR 18t 19 17 17 19 15 Lawrence, KS 79,647 DR 236t 241t 233 217 220 258 Lawton, OK 89,556 DR 305t 317t 302 315 292 271 Lebanon, PA 63,681 DR 220t 241t 216 234 202 210 Leesburg-Eustis, FL 97,497 DR 77t 71t 68 73 87 45 Leominster-Fitchburg, MA 112,943 DR 32t 35t 57 58 49 41 Lewiston, ME 50,567 DR 123t 146t 182 148 84 170 Lexington-Fayette, KY 250,994 DR 109t 111t 96 92 113 134 Lincoln, NE 226,582 DR 257t 269t 240 257 258 259 Little Rock, AR 360,331 DR 167t 199t 148 178 191 174 Lodi, CA 83,735 DR 248t 230t 279 249 247 314 Logan, UT 76,187 DR 322t 291t 314 306 286 311 Lompoc, CA 55,667 DR 344t 348t 328 312 314 319 Longview, WA-OR 60,443 DR 236t 269t 261 232 207 267 Lorain-Elyria, OH 193,586 DR 333t 326t 331 309 343 355 Los Angeles-Long Beach-Santa Ana, CA 11,789,487 DR 2 2 2 2 2 2 Louisville, KY-IN 863,582 DR 54 59 34 38 52 52 Lubbock, TX 202,225 DR 130t 153t 127 133 148 147 Lynchburg, VA 98,714 DR 236t 269t 303 302 291 278 Macon, GA 135,170 DR 305t 326t 305 316 332 315 Madison, WI 329,533 DR 63t 53 71 77 64 96 Manchester, NH 143,549 DR 305t 336t 332 324 329 339 Mansfield, OH 79,698 DR 305t 317t 321 318 296 301 McAllen, TX 523,144 DR 322t 213t 308 329 319 289 McKinney, TX 54,525 DR 130t 153t 199 181 246 218 Medford, OR 128,780 DR 157t 192t 196 210 211 184
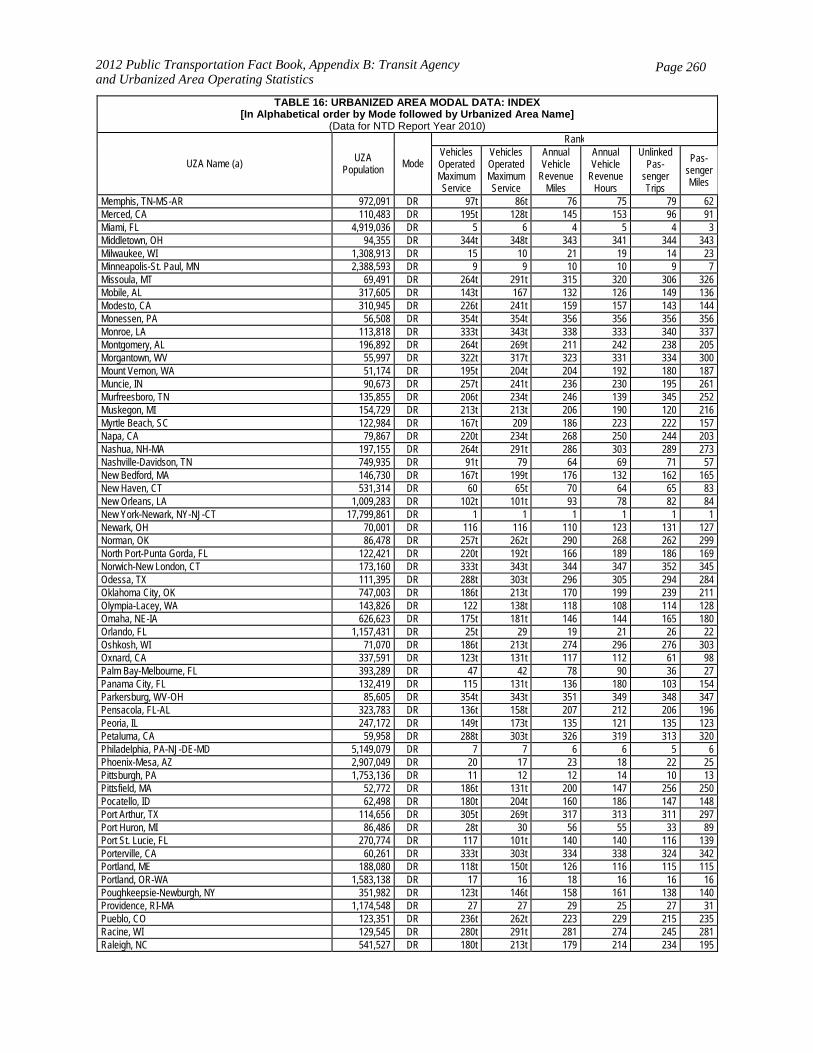
2012 Public Transportation Fact Book, Appendix B: Transit Agency and Urbanized Area Operating Statistics
Page 260
TABLE 16: URBANIZED AREA MODAL DATA: INDEX[In Alphabetical order by Mode followed by Urbanized Area Name]
(Data for NTD Report Year 2010)
UZA Name (a) UZA Population Mode
Rank Vehicles Operated Maximum Service
Vehicles Operated Maximum Service
Annual Vehicle
Revenue Miles
Annual Vehicle
Revenue Hours
Unlinked Pas-
senger Trips
Pas-senger Miles
Memphis, TN-MS-AR 972,091 DR 97t 86t 76 75 79 62 Merced, CA 110,483 DR 195t 128t 145 153 96 91 Miami, FL 4,919,036 DR 5 6 4 5 4 3 Middletown, OH 94,355 DR 344t 348t 343 341 344 343 Milwaukee, WI 1,308,913 DR 15 10 21 19 14 23 Minneapolis-St. Paul, MN 2,388,593 DR 9 9 10 10 9 7 Missoula, MT 69,491 DR 264t 291t 315 320 306 326 Mobile, AL 317,605 DR 143t 167 132 126 149 136 Modesto, CA 310,945 DR 226t 241t 159 157 143 144 Monessen, PA 56,508 DR 354t 354t 356 356 356 356 Monroe, LA 113,818 DR 333t 343t 338 333 340 337 Montgomery, AL 196,892 DR 264t 269t 211 242 238 205 Morgantown, WV 55,997 DR 322t 317t 323 331 334 300 Mount Vernon, WA 51,174 DR 195t 204t 204 192 180 187 Muncie, IN 90,673 DR 257t 241t 236 230 195 261 Murfreesboro, TN 135,855 DR 206t 234t 246 139 345 252 Muskegon, MI 154,729 DR 213t 213t 206 190 120 216 Myrtle Beach, SC 122,984 DR 167t 209 186 223 222 157 Napa, CA 79,867 DR 220t 234t 268 250 244 203 Nashua, NH-MA 197,155 DR 264t 291t 286 303 289 273 Nashville-Davidson, TN 749,935 DR 91t 79 64 69 71 57 New Bedford, MA 146,730 DR 167t 199t 176 132 162 165 New Haven, CT 531,314 DR 60 65t 70 64 65 83 New Orleans, LA 1,009,283 DR 102t 101t 93 78 82 84 New York-Newark, NY-NJ-CT 17,799,861 DR 1 1 1 1 1 1 Newark, OH 70,001 DR 116 116 110 123 131 127 Norman, OK 86,478 DR 257t 262t 290 268 262 299 North Port-Punta Gorda, FL 122,421 DR 220t 192t 166 189 186 169 Norwich-New London, CT 173,160 DR 333t 343t 344 347 352 345 Odessa, TX 111,395 DR 288t 303t 296 305 294 284 Oklahoma City, OK 747,003 DR 186t 213t 170 199 239 211 Olympia-Lacey, WA 143,826 DR 122 138t 118 108 114 128 Omaha, NE-IA 626,623 DR 175t 181t 146 144 165 180 Orlando, FL 1,157,431 DR 25t 29 19 21 26 22 Oshkosh, WI 71,070 DR 186t 213t 274 296 276 303 Oxnard, CA 337,591 DR 123t 131t 117 112 61 98 Palm Bay-Melbourne, FL 393,289 DR 47 42 78 90 36 27 Panama City, FL 132,419 DR 115 131t 136 180 103 154 Parkersburg, WV-OH 85,605 DR 354t 343t 351 349 348 347 Pensacola, FL-AL 323,783 DR 136t 158t 207 212 206 196 Peoria, IL 247,172 DR 149t 173t 135 121 135 123 Petaluma, CA 59,958 DR 288t 303t 326 319 313 320 Philadelphia, PA-NJ-DE-MD 5,149,079 DR 7 7 6 6 5 6 Phoenix-Mesa, AZ 2,907,049 DR 20 17 23 18 22 25 Pittsburgh, PA 1,753,136 DR 11 12 12 14 10 13 Pittsfield, MA 52,772 DR 186t 131t 200 147 256 250 Pocatello, ID 62,498 DR 180t 204t 160 186 147 148 Port Arthur, TX 114,656 DR 305t 269t 317 313 311 297 Port Huron, MI 86,486 DR 28t 30 56 55 33 89 Port St. Lucie, FL 270,774 DR 117 101t 140 140 116 139 Porterville, CA 60,261 DR 333t 303t 334 338 324 342 Portland, ME 188,080 DR 118t 150t 126 116 115 115 Portland, OR-WA 1,583,138 DR 17 16 18 16 16 16 Poughkeepsie-Newburgh, NY 351,982 DR 123t 146t 158 161 138 140 Providence, RI-MA 1,174,548 DR 27 27 29 25 27 31 Pueblo, CO 123,351 DR 236t 262t 223 229 215 235 Racine, WI 129,545 DR 280t 291t 281 274 245 281 Raleigh, NC 541,527 DR 180t 213t 179 214 234 195

2012 Public Transportation Fact Book, Appendix B: Transit Agency and Urbanized Area Operating Statistics
Page 261
TABLE 16: URBANIZED AREA MODAL DATA: INDEX[In Alphabetical order by Mode followed by Urbanized Area Name]
(Data for NTD Report Year 2010)
UZA Name (a) UZA Population Mode
Rank Vehicles Operated Maximum Service
Vehicles Operated Maximum Service
Annual Vehicle
Revenue Miles
Annual Vehicle
Revenue Hours
Unlinked Pas-
senger Trips
Pas-senger Miles
Rapid City, SD 66,780 DR 226t 222t 231 204 179 230 Reading, PA 240,264 DR 85t 91t 95 93 73 86 Redding, CA 105,267 DR 195t 192t 210 211 196 223 Reno, NV 303,689 DR 104t 109t 101 99 90 101 Richmond, VA 818,836 DR 68 69t 50 53 70 56 Riverside-San Bernardino, CA 1,506,816 DR 21 21 24 23 20 18 Roanoke, VA 197,442 DR 195t 105t 153 175 218 167 Rochester, MN 91,271 DR 322t 336t 269 287 240 228 Rochester, NY 694,396 DR 114 83 84 86 104 100 Rockford, IL 270,414 DR 167t 125t 154 160 159 150 Rome, GA 58,287 DR 322t 291t 306 308 283 296 Sacramento, CA 1,393,498 DR 35 38 38 37 51 55 Saginaw, MI 140,985 DR 280t 230t 325 332 312 310 Salem, OR 207,229 DR 28t 35t 36 35 39 32 Salisbury, MD-DE 59,426 DR 152t 168t 143 154 173 108 Salt Lake City, UT 887,650 DR 32t 32 47 44 35 33 San Angelo, TX 87,969 DR 85t 98t 130 124 122 117 San Antonio, TX 1,327,554 DR 22 23 16 20 18 14 San Diego, CA 2,674,436 DR 30 33 32 34 32 36 San Francisco-Oakland, CA 3,228,605 DR 10 11 13 12 11 12 San Jose, CA 1,538,312 DR 18t 20 22 24 21 21 San Juan, PR 2,216,616 DR 120t 76t 115 56 139 149 San Luis Obispo, CA 53,498 DR 226t 241t 195 236 273 213 Sandusky, OH 50,693 DR 213t 222t 222 201 156 182 Santa Barbara, CA 196,263 DR 195t 222t 183 205 228 238 Santa Clarita, CA 170,481 DR 161t 192t 141 162 154 142 Santa Cruz, CA 157,348 DR 130t 131t 229 198 170 168 Santa Fe, NM 80,337 DR 213t 213t 237 235 237 287 Santa Maria, CA 120,297 DR 305t 303t 291 301 301 305 Santa Rosa, CA 285,408 DR 113 111t 138 146 176 163 Sarasota-Bradenton, FL 559,229 DR 57t 61 67 62 67 63 Savannah, GA 208,886 DR 111t 109t 147 138 183 158 Scranton, PA 385,237 DR 186t 153t 273 279 275 282 Seaside-Monterey-Marina, CA 125,503 DR 152t 176t 111 115 155 92 Seattle, WA 2,712,205 DR 8 8 8 8 8 10 Sheboygan, WI 68,600 DR 264t 252t 238 233 197 200 Sherman, TX 56,168 DR 88t 64 75 87 101 46 Shreveport, LA 275,213 DR 257t 241t 194 193 255 207 Simi Valley, CA 112,345 DR 226t 252t 259 245 216 268 Sioux City, IA-NE-SD 106,119 DR 248t 262t 292 283 249 215 Sioux Falls, SD 124,269 DR 167t 192t 142 122 124 131 South Bend, IN-MI 276,498 DR 236t 241t 232 244 226 206 South Lyon-Howell-Brighton, MI 106,139 DR 167t 181t 144 176 140 97 Spartanburg, SC 145,058 DR 88t 71t 63 68 72 49 Spokane, WA-ID 334,858 DR 49 52 51 50 34 42 Springfield, IL 153,516 DR 248t 210t 208 187 204 234 Springfield, MA-CT 573,610 DR 46 43 45 47 57 67 Springfield, MO 215,004 DR 322t 336t 307 322 322 306 Springfield, OH 89,684 DR 333t 336t 346 346 333 291 St. Augustine, FL 53,519 DR 305t 280t 337 335 342 329 St. Charles, MD 74,765 DR 257t 234t 260 259 272 221 St. Cloud, MN 91,305 DR 186t 199t 164 159 125 162 St. Louis, MO-IL 2,077,662 DR 37t 40 26 28 28 30 State College, PA 71,301 DR 280t 303t 295 330 259 264 Stockton, CA 313,392 DR 157t 125t 266 263 257 269 Sumter, SC 64,320 DR 95 107t 105 120 109 61 Syracuse, NY 402,267 DR 97t 91t 116 103 127 137 Tallahassee, FL 204,260 DR 220t 222t 185 173 189 193
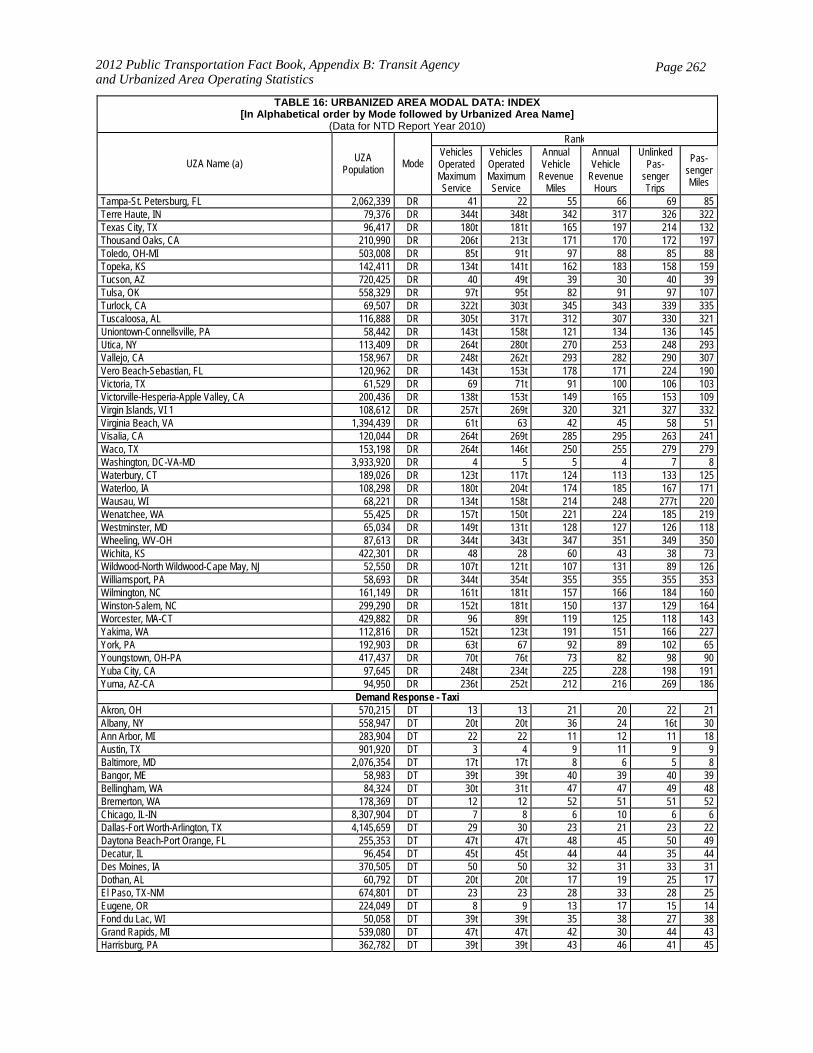
2012 Public Transportation Fact Book, Appendix B: Transit Agency and Urbanized Area Operating Statistics
Page 262
TABLE 16: URBANIZED AREA MODAL DATA: INDEX[In Alphabetical order by Mode followed by Urbanized Area Name]
(Data for NTD Report Year 2010)
UZA Name (a) UZA Population Mode
Rank Vehicles Operated Maximum Service
Vehicles Operated Maximum Service
Annual Vehicle
Revenue Miles
Annual Vehicle
Revenue Hours
Unlinked Pas-
senger Trips
Pas-senger Miles
Tampa-St. Petersburg, FL 2,062,339 DR 41 22 55 66 69 85 Terre Haute, IN 79,376 DR 344t 348t 342 317 326 322 Texas City, TX 96,417 DR 180t 181t 165 197 214 132 Thousand Oaks, CA 210,990 DR 206t 213t 171 170 172 197 Toledo, OH-MI 503,008 DR 85t 91t 97 88 85 88 Topeka, KS 142,411 DR 134t 141t 162 183 158 159 Tucson, AZ 720,425 DR 40 49t 39 30 40 39 Tulsa, OK 558,329 DR 97t 95t 82 91 97 107 Turlock, CA 69,507 DR 322t 303t 345 343 339 335 Tuscaloosa, AL 116,888 DR 305t 317t 312 307 330 321 Uniontown-Connellsville, PA 58,442 DR 143t 158t 121 134 136 145 Utica, NY 113,409 DR 264t 280t 270 253 248 293 Vallejo, CA 158,967 DR 248t 262t 293 282 290 307 Vero Beach-Sebastian, FL 120,962 DR 143t 153t 178 171 224 190 Victoria, TX 61,529 DR 69 71t 91 100 106 103 Victorville-Hesperia-Apple Valley, CA 200,436 DR 138t 153t 149 165 153 109 Virgin Islands, VI 1 108,612 DR 257t 269t 320 321 327 332 Virginia Beach, VA 1,394,439 DR 61t 63 42 45 58 51 Visalia, CA 120,044 DR 264t 269t 285 295 263 241 Waco, TX 153,198 DR 264t 146t 250 255 279 279 Washington, DC-VA-MD 3,933,920 DR 4 5 5 4 7 8 Waterbury, CT 189,026 DR 123t 117t 124 113 133 125 Waterloo, IA 108,298 DR 180t 204t 174 185 167 171 Wausau, WI 68,221 DR 134t 158t 214 248 277t 220 Wenatchee, WA 55,425 DR 157t 150t 221 224 185 219 Westminster, MD 65,034 DR 149t 131t 128 127 126 118 Wheeling, WV-OH 87,613 DR 344t 343t 347 351 349 350 Wichita, KS 422,301 DR 48 28 60 43 38 73 Wildwood-North Wildwood-Cape May, NJ 52,550 DR 107t 121t 107 131 89 126 Williamsport, PA 58,693 DR 344t 354t 355 355 355 353 Wilmington, NC 161,149 DR 161t 181t 157 166 184 160 Winston-Salem, NC 299,290 DR 152t 181t 150 137 129 164 Worcester, MA-CT 429,882 DR 96 89t 119 125 118 143 Yakima, WA 112,816 DR 152t 123t 191 151 166 227 York, PA 192,903 DR 63t 67 92 89 102 65 Youngstown, OH-PA 417,437 DR 70t 76t 73 82 98 90 Yuba City, CA 97,645 DR 248t 234t 225 228 198 191 Yuma, AZ-CA 94,950 DR 236t 252t 212 216 269 186
Demand Response - Taxi Akron, OH 570,215 DT 13 13 21 20 22 21 Albany, NY 558,947 DT 20t 20t 36 24 16t 30 Ann Arbor, MI 283,904 DT 22 22 11 12 11 18 Austin, TX 901,920 DT 3 4 9 11 9 9 Baltimore, MD 2,076,354 DT 17t 17t 8 6 5 8 Bangor, ME 58,983 DT 39t 39t 40 39 40 39 Bellingham, WA 84,324 DT 30t 31t 47 47 49 48 Bremerton, WA 178,369 DT 12 12 52 51 51 52 Chicago, IL-IN 8,307,904 DT 7 8 6 10 6 6 Dallas-Fort Worth-Arlington, TX 4,145,659 DT 29 30 23 21 23 22 Daytona Beach-Port Orange, FL 255,353 DT 47t 47t 48 45 50 49 Decatur, IL 96,454 DT 45t 45t 44 44 35 44 Des Moines, IA 370,505 DT 50 50 32 31 33 31 Dothan, AL 60,792 DT 20t 20t 17 19 25 17 El Paso, TX-NM 674,801 DT 23 23 28 33 28 25 Eugene, OR 224,049 DT 8 9 13 17 15 14 Fond du Lac, WI 50,058 DT 39t 39t 35 38 27 38 Grand Rapids, MI 539,080 DT 47t 47t 42 30 44 43 Harrisburg, PA 362,782 DT 39t 39t 43 46 41 45
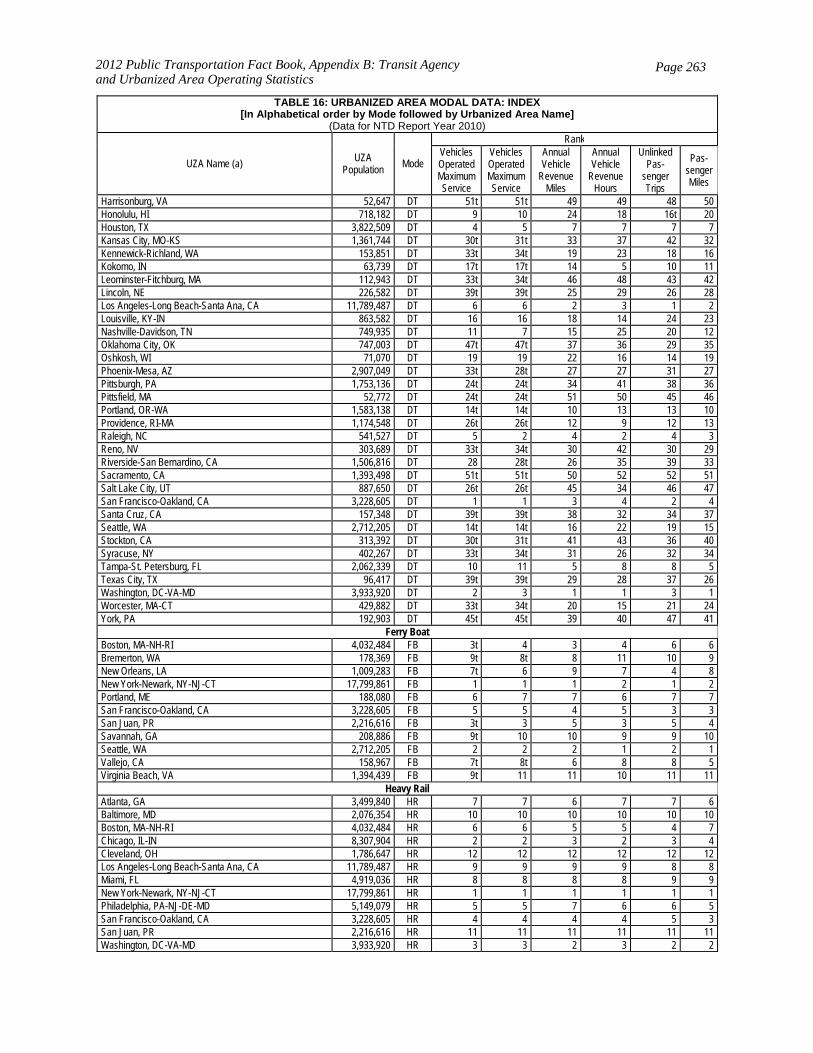
2012 Public Transportation Fact Book, Appendix B: Transit Agency and Urbanized Area Operating Statistics
Page 263
TABLE 16: URBANIZED AREA MODAL DATA: INDEX[In Alphabetical order by Mode followed by Urbanized Area Name]
(Data for NTD Report Year 2010)
UZA Name (a) UZA Population Mode
Rank Vehicles Operated Maximum Service
Vehicles Operated Maximum Service
Annual Vehicle
Revenue Miles
Annual Vehicle
Revenue Hours
Unlinked Pas-
senger Trips
Pas-senger Miles
Harrisonburg, VA 52,647 DT 51t 51t 49 49 48 50 Honolulu, HI 718,182 DT 9 10 24 18 16t 20 Houston, TX 3,822,509 DT 4 5 7 7 7 7 Kansas City, MO-KS 1,361,744 DT 30t 31t 33 37 42 32 Kennewick-Richland, WA 153,851 DT 33t 34t 19 23 18 16 Kokomo, IN 63,739 DT 17t 17t 14 5 10 11 Leominster-Fitchburg, MA 112,943 DT 33t 34t 46 48 43 42 Lincoln, NE 226,582 DT 39t 39t 25 29 26 28 Los Angeles-Long Beach-Santa Ana, CA 11,789,487 DT 6 6 2 3 1 2 Louisville, KY-IN 863,582 DT 16 16 18 14 24 23 Nashville-Davidson, TN 749,935 DT 11 7 15 25 20 12 Oklahoma City, OK 747,003 DT 47t 47t 37 36 29 35 Oshkosh, WI 71,070 DT 19 19 22 16 14 19 Phoenix-Mesa, AZ 2,907,049 DT 33t 28t 27 27 31 27 Pittsburgh, PA 1,753,136 DT 24t 24t 34 41 38 36 Pittsfield, MA 52,772 DT 24t 24t 51 50 45 46 Portland, OR-WA 1,583,138 DT 14t 14t 10 13 13 10 Providence, RI-MA 1,174,548 DT 26t 26t 12 9 12 13 Raleigh, NC 541,527 DT 5 2 4 2 4 3 Reno, NV 303,689 DT 33t 34t 30 42 30 29 Riverside-San Bernardino, CA 1,506,816 DT 28 28t 26 35 39 33 Sacramento, CA 1,393,498 DT 51t 51t 50 52 52 51 Salt Lake City, UT 887,650 DT 26t 26t 45 34 46 47 San Francisco-Oakland, CA 3,228,605 DT 1 1 3 4 2 4 Santa Cruz, CA 157,348 DT 39t 39t 38 32 34 37 Seattle, WA 2,712,205 DT 14t 14t 16 22 19 15 Stockton, CA 313,392 DT 30t 31t 41 43 36 40 Syracuse, NY 402,267 DT 33t 34t 31 26 32 34 Tampa-St. Petersburg, FL 2,062,339 DT 10 11 5 8 8 5 Texas City, TX 96,417 DT 39t 39t 29 28 37 26 Washington, DC-VA-MD 3,933,920 DT 2 3 1 1 3 1 Worcester, MA-CT 429,882 DT 33t 34t 20 15 21 24 York, PA 192,903 DT 45t 45t 39 40 47 41
Ferry Boat Boston, MA-NH-RI 4,032,484 FB 3t 4 3 4 6 6 Bremerton, WA 178,369 FB 9t 8t 8 11 10 9 New Orleans, LA 1,009,283 FB 7t 6 9 7 4 8 New York-Newark, NY-NJ-CT 17,799,861 FB 1 1 1 2 1 2 Portland, ME 188,080 FB 6 7 7 6 7 7 San Francisco-Oakland, CA 3,228,605 FB 5 5 4 5 3 3 San Juan, PR 2,216,616 FB 3t 3 5 3 5 4 Savannah, GA 208,886 FB 9t 10 10 9 9 10 Seattle, WA 2,712,205 FB 2 2 2 1 2 1 Vallejo, CA 158,967 FB 7t 8t 6 8 8 5 Virginia Beach, VA 1,394,439 FB 9t 11 11 10 11 11
Heavy Rail Atlanta, GA 3,499,840 HR 7 7 6 7 7 6 Baltimore, MD 2,076,354 HR 10 10 10 10 10 10 Boston, MA-NH-RI 4,032,484 HR 6 6 5 5 4 7 Chicago, IL-IN 8,307,904 HR 2 2 3 2 3 4 Cleveland, OH 1,786,647 HR 12 12 12 12 12 12 Los Angeles-Long Beach-Santa Ana, CA 11,789,487 HR 9 9 9 9 8 8 Miami, FL 4,919,036 HR 8 8 8 8 9 9 New York-Newark, NY-NJ-CT 17,799,861 HR 1 1 1 1 1 1 Philadelphia, PA-NJ-DE-MD 5,149,079 HR 5 5 7 6 6 5 San Francisco-Oakland, CA 3,228,605 HR 4 4 4 4 5 3 San Juan, PR 2,216,616 HR 11 11 11 11 11 11 Washington, DC-VA-MD 3,933,920 HR 3 3 2 3 2 2
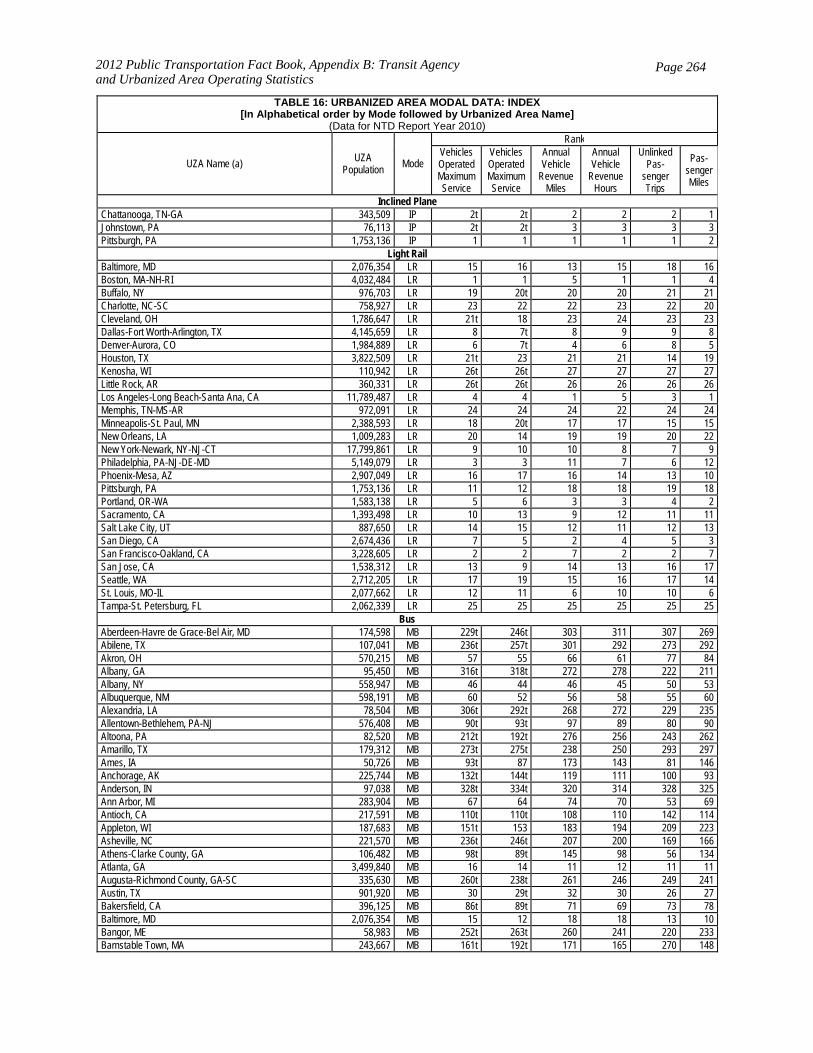
2012 Public Transportation Fact Book, Appendix B: Transit Agency and Urbanized Area Operating Statistics
Page 264
TABLE 16: URBANIZED AREA MODAL DATA: INDEX[In Alphabetical order by Mode followed by Urbanized Area Name]
(Data for NTD Report Year 2010)
UZA Name (a) UZA Population Mode
Rank Vehicles Operated Maximum Service
Vehicles Operated Maximum Service
Annual Vehicle
Revenue Miles
Annual Vehicle
Revenue Hours
Unlinked Pas-
senger Trips
Pas-senger Miles
Inclined Plane Chattanooga, TN-GA 343,509 IP 2t 2t 2 2 2 1 Johnstown, PA 76,113 IP 2t 2t 3 3 3 3 Pittsburgh, PA 1,753,136 IP 1 1 1 1 1 2
Light Rail Baltimore, MD 2,076,354 LR 15 16 13 15 18 16 Boston, MA-NH-RI 4,032,484 LR 1 1 5 1 1 4 Buffalo, NY 976,703 LR 19 20t 20 20 21 21 Charlotte, NC-SC 758,927 LR 23 22 22 23 22 20 Cleveland, OH 1,786,647 LR 21t 18 23 24 23 23 Dallas-Fort Worth-Arlington, TX 4,145,659 LR 8 7t 8 9 9 8 Denver-Aurora, CO 1,984,889 LR 6 7t 4 6 8 5 Houston, TX 3,822,509 LR 21t 23 21 21 14 19 Kenosha, WI 110,942 LR 26t 26t 27 27 27 27 Little Rock, AR 360,331 LR 26t 26t 26 26 26 26 Los Angeles-Long Beach-Santa Ana, CA 11,789,487 LR 4 4 1 5 3 1 Memphis, TN-MS-AR 972,091 LR 24 24 24 22 24 24 Minneapolis-St. Paul, MN 2,388,593 LR 18 20t 17 17 15 15 New Orleans, LA 1,009,283 LR 20 14 19 19 20 22 New York-Newark, NY-NJ-CT 17,799,861 LR 9 10 10 8 7 9 Philadelphia, PA-NJ-DE-MD 5,149,079 LR 3 3 11 7 6 12 Phoenix-Mesa, AZ 2,907,049 LR 16 17 16 14 13 10 Pittsburgh, PA 1,753,136 LR 11 12 18 18 19 18 Portland, OR-WA 1,583,138 LR 5 6 3 3 4 2 Sacramento, CA 1,393,498 LR 10 13 9 12 11 11 Salt Lake City, UT 887,650 LR 14 15 12 11 12 13 San Diego, CA 2,674,436 LR 7 5 2 4 5 3 San Francisco-Oakland, CA 3,228,605 LR 2 2 7 2 2 7 San Jose, CA 1,538,312 LR 13 9 14 13 16 17 Seattle, WA 2,712,205 LR 17 19 15 16 17 14 St. Louis, MO-IL 2,077,662 LR 12 11 6 10 10 6 Tampa-St. Petersburg, FL 2,062,339 LR 25 25 25 25 25 25
Bus Aberdeen-Havre de Grace-Bel Air, MD 174,598 MB 229t 246t 303 311 307 269 Abilene, TX 107,041 MB 236t 257t 301 292 273 292 Akron, OH 570,215 MB 57 55 66 61 77 84 Albany, GA 95,450 MB 316t 318t 272 278 222 211 Albany, NY 558,947 MB 46 44 46 45 50 53 Albuquerque, NM 598,191 MB 60 52 56 58 55 60 Alexandria, LA 78,504 MB 306t 292t 268 272 229 235 Allentown-Bethlehem, PA-NJ 576,408 MB 90t 93t 97 89 80 90 Altoona, PA 82,520 MB 212t 192t 276 256 243 262 Amarillo, TX 179,312 MB 273t 275t 238 250 293 297 Ames, IA 50,726 MB 93t 87 173 143 81 146 Anchorage, AK 225,744 MB 132t 144t 119 111 100 93 Anderson, IN 97,038 MB 328t 334t 320 314 328 325 Ann Arbor, MI 283,904 MB 67 64 74 70 53 69 Antioch, CA 217,591 MB 110t 110t 108 110 142 114 Appleton, WI 187,683 MB 151t 153 183 194 209 223 Asheville, NC 221,570 MB 236t 246t 207 200 169 166 Athens-Clarke County, GA 106,482 MB 98t 89t 145 98 56 134 Atlanta, GA 3,499,840 MB 16 14 11 12 11 11 Augusta-Richmond County, GA-SC 335,630 MB 260t 238t 261 246 249 241 Austin, TX 901,920 MB 30 29t 32 30 26 27 Bakersfield, CA 396,125 MB 86t 89t 71 69 73 78 Baltimore, MD 2,076,354 MB 15 12 18 18 13 10 Bangor, ME 58,983 MB 252t 263t 260 241 220 233 Barnstable Town, MA 243,667 MB 161t 192t 171 165 270 148
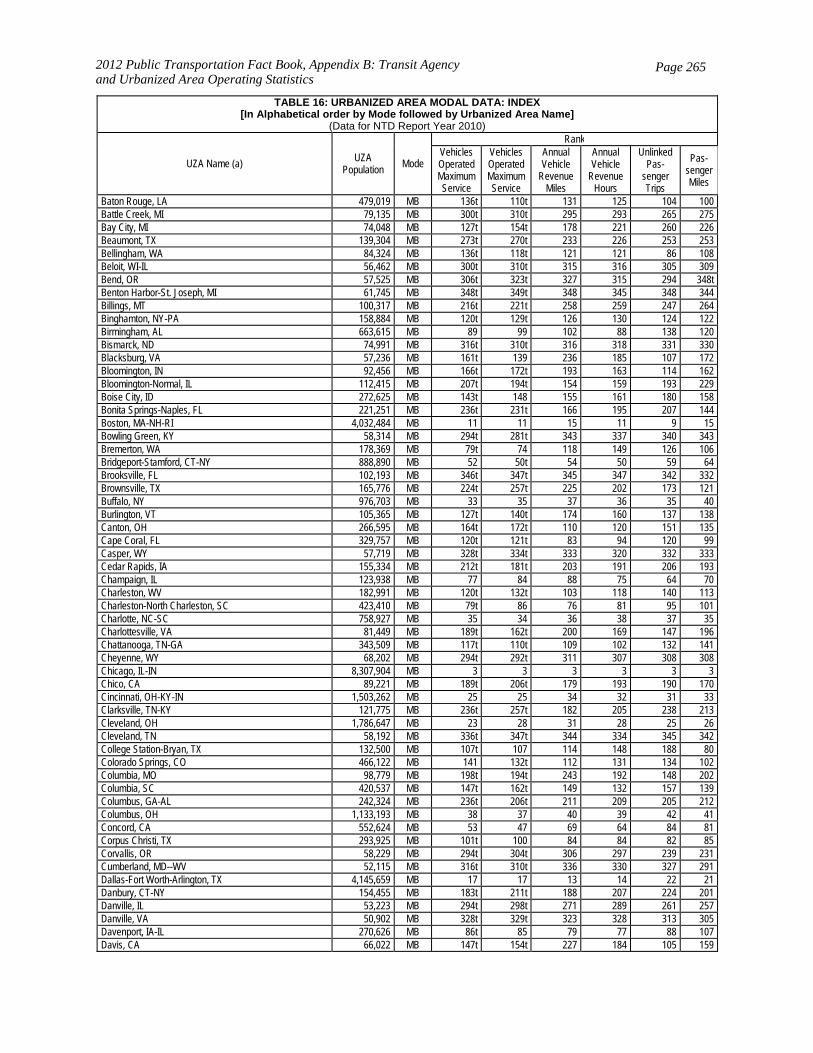
2012 Public Transportation Fact Book, Appendix B: Transit Agency and Urbanized Area Operating Statistics
Page 265
TABLE 16: URBANIZED AREA MODAL DATA: INDEX[In Alphabetical order by Mode followed by Urbanized Area Name]
(Data for NTD Report Year 2010)
UZA Name (a) UZA Population Mode
Rank Vehicles Operated Maximum Service
Vehicles Operated Maximum Service
Annual Vehicle
Revenue Miles
Annual Vehicle
Revenue Hours
Unlinked Pas-
senger Trips
Pas-senger Miles
Baton Rouge, LA 479,019 MB 136t 110t 131 125 104 100 Battle Creek, MI 79,135 MB 300t 310t 295 293 265 275 Bay City, MI 74,048 MB 127t 154t 178 221 260 226 Beaumont, TX 139,304 MB 273t 270t 233 226 253 253 Bellingham, WA 84,324 MB 136t 118t 121 121 86 108 Beloit, WI-IL 56,462 MB 300t 310t 315 316 305 309 Bend, OR 57,525 MB 306t 323t 327 315 294 348t Benton Harbor-St. Joseph, MI 61,745 MB 348t 349t 348 345 348 344 Billings, MT 100,317 MB 216t 221t 258 259 247 264 Binghamton, NY-PA 158,884 MB 120t 129t 126 130 124 122 Birmingham, AL 663,615 MB 89 99 102 88 138 120 Bismarck, ND 74,991 MB 316t 310t 316 318 331 330 Blacksburg, VA 57,236 MB 161t 139 236 185 107 172 Bloomington, IN 92,456 MB 166t 172t 193 163 114 162 Bloomington-Normal, IL 112,415 MB 207t 194t 154 159 193 229 Boise City, ID 272,625 MB 143t 148 155 161 180 158 Bonita Springs-Naples, FL 221,251 MB 236t 231t 166 195 207 144 Boston, MA-NH-RI 4,032,484 MB 11 11 15 11 9 15 Bowling Green, KY 58,314 MB 294t 281t 343 337 340 343 Bremerton, WA 178,369 MB 79t 74 118 149 126 106 Bridgeport-Stamford, CT-NY 888,890 MB 52 50t 54 50 59 64 Brooksville, FL 102,193 MB 346t 347t 345 347 342 332 Brownsville, TX 165,776 MB 224t 257t 225 202 173 121 Buffalo, NY 976,703 MB 33 35 37 36 35 40 Burlington, VT 105,365 MB 127t 140t 174 160 137 138 Canton, OH 266,595 MB 164t 172t 110 120 151 135 Cape Coral, FL 329,757 MB 120t 121t 83 94 120 99 Casper, WY 57,719 MB 328t 334t 333 320 332 333 Cedar Rapids, IA 155,334 MB 212t 181t 203 191 206 193 Champaign, IL 123,938 MB 77 84 88 75 64 70 Charleston, WV 182,991 MB 120t 132t 103 118 140 113 Charleston-North Charleston, SC 423,410 MB 79t 86 76 81 95 101 Charlotte, NC-SC 758,927 MB 35 34 36 38 37 35 Charlottesville, VA 81,449 MB 189t 162t 200 169 147 196 Chattanooga, TN-GA 343,509 MB 117t 110t 109 102 132 141 Cheyenne, WY 68,202 MB 294t 292t 311 307 308 308 Chicago, IL-IN 8,307,904 MB 3 3 3 3 3 3 Chico, CA 89,221 MB 189t 206t 179 193 190 170 Cincinnati, OH-KY-IN 1,503,262 MB 25 25 34 32 31 33 Clarksville, TN-KY 121,775 MB 236t 257t 182 205 238 213 Cleveland, OH 1,786,647 MB 23 28 31 28 25 26 Cleveland, TN 58,192 MB 336t 347t 344 334 345 342 College Station-Bryan, TX 132,500 MB 107t 107 114 148 188 80 Colorado Springs, CO 466,122 MB 141 132t 112 131 134 102 Columbia, MO 98,779 MB 198t 194t 243 192 148 202 Columbia, SC 420,537 MB 147t 162t 149 132 157 139 Columbus, GA-AL 242,324 MB 236t 206t 211 209 205 212 Columbus, OH 1,133,193 MB 38 37 40 39 42 41 Concord, CA 552,624 MB 53 47 69 64 84 81 Corpus Christi, TX 293,925 MB 101t 100 84 84 82 85 Corvallis, OR 58,229 MB 294t 304t 306 297 239 231 Cumberland, MD--WV 52,115 MB 316t 310t 336 330 327 291 Dallas-Fort Worth-Arlington, TX 4,145,659 MB 17 17 13 14 22 21 Danbury, CT-NY 154,455 MB 183t 211t 188 207 224 201 Danville, IL 53,223 MB 294t 298t 271 289 261 257 Danville, VA 50,902 MB 328t 329t 323 328 313 305 Davenport, IA-IL 270,626 MB 86t 85 79 77 88 107 Davis, CA 66,022 MB 147t 154t 227 184 105 159
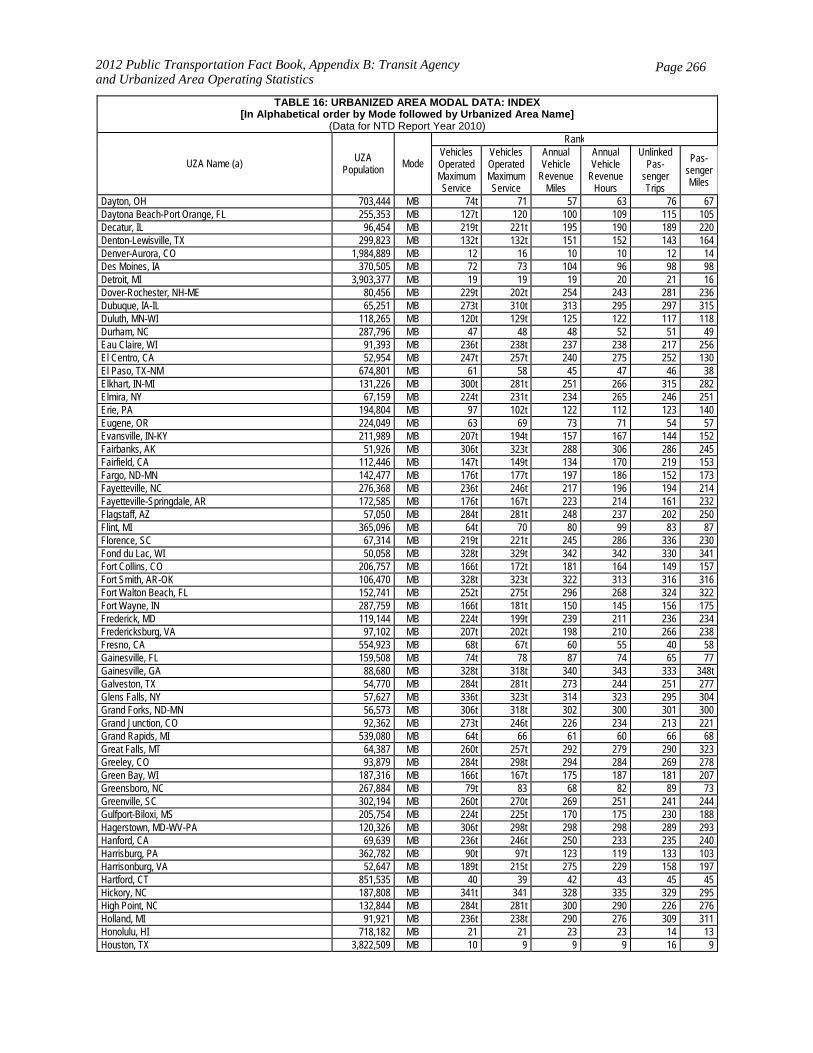
2012 Public Transportation Fact Book, Appendix B: Transit Agency and Urbanized Area Operating Statistics
Page 266
TABLE 16: URBANIZED AREA MODAL DATA: INDEX[In Alphabetical order by Mode followed by Urbanized Area Name]
(Data for NTD Report Year 2010)
UZA Name (a) UZA Population Mode
Rank Vehicles Operated Maximum Service
Vehicles Operated Maximum Service
Annual Vehicle
Revenue Miles
Annual Vehicle
Revenue Hours
Unlinked Pas-
senger Trips
Pas-senger Miles
Dayton, OH 703,444 MB 74t 71 57 63 76 67 Daytona Beach-Port Orange, FL 255,353 MB 127t 120 100 109 115 105 Decatur, IL 96,454 MB 219t 221t 195 190 189 220 Denton-Lewisville, TX 299,823 MB 132t 132t 151 152 143 164 Denver-Aurora, CO 1,984,889 MB 12 16 10 10 12 14 Des Moines, IA 370,505 MB 72 73 104 96 98 98 Detroit, MI 3,903,377 MB 19 19 19 20 21 16 Dover-Rochester, NH-ME 80,456 MB 229t 202t 254 243 281 236 Dubuque, IA-IL 65,251 MB 273t 310t 313 295 297 315 Duluth, MN-WI 118,265 MB 120t 129t 125 122 117 118 Durham, NC 287,796 MB 47 48 48 52 51 49 Eau Claire, WI 91,393 MB 236t 238t 237 238 217 256 El Centro, CA 52,954 MB 247t 257t 240 275 252 130 El Paso, TX-NM 674,801 MB 61 58 45 47 46 38 Elkhart, IN-MI 131,226 MB 300t 281t 251 266 315 282 Elmira, NY 67,159 MB 224t 231t 234 265 246 251 Erie, PA 194,804 MB 97 102t 122 112 123 140 Eugene, OR 224,049 MB 63 69 73 71 54 57 Evansville, IN-KY 211,989 MB 207t 194t 157 167 144 152 Fairbanks, AK 51,926 MB 306t 323t 288 306 286 245 Fairfield, CA 112,446 MB 147t 149t 134 170 219 153 Fargo, ND-MN 142,477 MB 176t 177t 197 186 152 173 Fayetteville, NC 276,368 MB 236t 246t 217 196 194 214 Fayetteville-Springdale, AR 172,585 MB 176t 167t 223 214 161 232 Flagstaff, AZ 57,050 MB 284t 281t 248 237 202 250 Flint, MI 365,096 MB 64t 70 80 99 83 87 Florence, SC 67,314 MB 219t 221t 245 286 336 230 Fond du Lac, WI 50,058 MB 328t 329t 342 342 330 341 Fort Collins, CO 206,757 MB 166t 172t 181 164 149 157 Fort Smith, AR-OK 106,470 MB 328t 323t 322 313 316 316 Fort Walton Beach, FL 152,741 MB 252t 275t 296 268 324 322 Fort Wayne, IN 287,759 MB 166t 181t 150 145 156 175 Frederick, MD 119,144 MB 224t 199t 239 211 236 234 Fredericksburg, VA 97,102 MB 207t 202t 198 210 266 238 Fresno, CA 554,923 MB 68t 67t 60 55 40 58 Gainesville, FL 159,508 MB 74t 78 87 74 65 77 Gainesville, GA 88,680 MB 328t 318t 340 343 333 348t Galveston, TX 54,770 MB 284t 281t 273 244 251 277 Glens Falls, NY 57,627 MB 336t 323t 314 323 295 304 Grand Forks, ND-MN 56,573 MB 306t 318t 302 300 301 300 Grand Junction, CO 92,362 MB 273t 246t 226 234 213 221 Grand Rapids, MI 539,080 MB 64t 66 61 60 66 68 Great Falls, MT 64,387 MB 260t 257t 292 279 290 323 Greeley, CO 93,879 MB 284t 298t 294 284 269 278 Green Bay, WI 187,316 MB 166t 167t 175 187 181 207 Greensboro, NC 267,884 MB 79t 83 68 82 89 73 Greenville, SC 302,194 MB 260t 270t 269 251 241 244 Gulfport-Biloxi, MS 205,754 MB 224t 225t 170 175 230 188 Hagerstown, MD-WV-PA 120,326 MB 306t 298t 298 298 289 293 Hanford, CA 69,639 MB 236t 246t 250 233 235 240 Harrisburg, PA 362,782 MB 90t 97t 123 119 133 103 Harrisonburg, VA 52,647 MB 189t 215t 275 229 158 197 Hartford, CT 851,535 MB 40 39 42 43 45 45 Hickory, NC 187,808 MB 341t 341 328 335 329 295 High Point, NC 132,844 MB 284t 281t 300 290 226 276 Holland, MI 91,921 MB 236t 238t 290 276 309 311 Honolulu, HI 718,182 MB 21 21 23 23 14 13 Houston, TX 3,822,509 MB 10 9 9 9 16 9
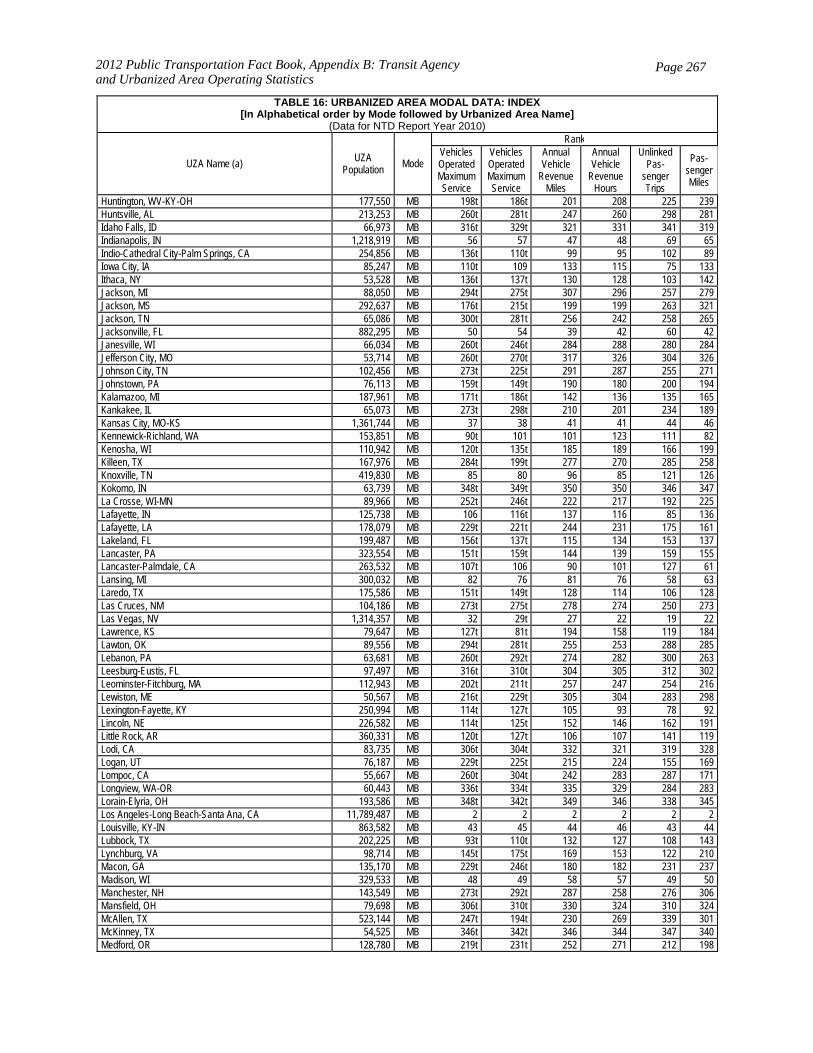
2012 Public Transportation Fact Book, Appendix B: Transit Agency and Urbanized Area Operating Statistics
Page 267
TABLE 16: URBANIZED AREA MODAL DATA: INDEX[In Alphabetical order by Mode followed by Urbanized Area Name]
(Data for NTD Report Year 2010)
UZA Name (a) UZA Population Mode
Rank Vehicles Operated Maximum Service
Vehicles Operated Maximum Service
Annual Vehicle
Revenue Miles
Annual Vehicle
Revenue Hours
Unlinked Pas-
senger Trips
Pas-senger Miles
Huntington, WV-KY-OH 177,550 MB 198t 186t 201 208 225 239 Huntsville, AL 213,253 MB 260t 281t 247 260 298 281 Idaho Falls, ID 66,973 MB 316t 329t 321 331 341 319 Indianapolis, IN 1,218,919 MB 56 57 47 48 69 65 Indio-Cathedral City-Palm Springs, CA 254,856 MB 136t 110t 99 95 102 89 Iowa City, IA 85,247 MB 110t 109 133 115 75 133 Ithaca, NY 53,528 MB 136t 137t 130 128 103 142 Jackson, MI 88,050 MB 294t 275t 307 296 257 279 Jackson, MS 292,637 MB 176t 215t 199 199 263 321 Jackson, TN 65,086 MB 300t 281t 256 242 258 265 Jacksonville, FL 882,295 MB 50 54 39 42 60 42 Janesville, WI 66,034 MB 260t 246t 284 288 280 284 Jefferson City, MO 53,714 MB 260t 270t 317 326 304 326 Johnson City, TN 102,456 MB 273t 225t 291 287 255 271 Johnstown, PA 76,113 MB 159t 149t 190 180 200 194 Kalamazoo, MI 187,961 MB 171t 186t 142 136 135 165 Kankakee, IL 65,073 MB 273t 298t 210 201 234 189 Kansas City, MO-KS 1,361,744 MB 37 38 41 41 44 46 Kennewick-Richland, WA 153,851 MB 90t 101 101 123 111 82 Kenosha, WI 110,942 MB 120t 135t 185 189 166 199 Killeen, TX 167,976 MB 284t 199t 277 270 285 258 Knoxville, TN 419,830 MB 85 80 96 85 121 126 Kokomo, IN 63,739 MB 348t 349t 350 350 346 347 La Crosse, WI-MN 89,966 MB 252t 246t 222 217 192 225 Lafayette, IN 125,738 MB 106 116t 137 116 85 136 Lafayette, LA 178,079 MB 229t 221t 244 231 175 161 Lakeland, FL 199,487 MB 156t 137t 115 134 153 137 Lancaster, PA 323,554 MB 151t 159t 144 139 159 155 Lancaster-Palmdale, CA 263,532 MB 107t 106 90 101 127 61 Lansing, MI 300,032 MB 82 76 81 76 58 63 Laredo, TX 175,586 MB 151t 149t 128 114 106 128 Las Cruces, NM 104,186 MB 273t 275t 278 274 250 273 Las Vegas, NV 1,314,357 MB 32 29t 27 22 19 22 Lawrence, KS 79,647 MB 127t 81t 194 158 119 184 Lawton, OK 89,556 MB 294t 281t 255 253 288 285 Lebanon, PA 63,681 MB 260t 292t 274 282 300 263 Leesburg-Eustis, FL 97,497 MB 316t 310t 304 305 312 302 Leominster-Fitchburg, MA 112,943 MB 202t 211t 257 247 254 216 Lewiston, ME 50,567 MB 216t 229t 305 304 283 298 Lexington-Fayette, KY 250,994 MB 114t 127t 105 93 78 92 Lincoln, NE 226,582 MB 114t 125t 152 146 162 191 Little Rock, AR 360,331 MB 120t 127t 106 107 141 119 Lodi, CA 83,735 MB 306t 304t 332 321 319 328 Logan, UT 76,187 MB 229t 225t 215 224 155 169 Lompoc, CA 55,667 MB 260t 304t 242 283 287 171 Longview, WA-OR 60,443 MB 336t 334t 335 329 284 283 Lorain-Elyria, OH 193,586 MB 348t 342t 349 346 338 345 Los Angeles-Long Beach-Santa Ana, CA 11,789,487 MB 2 2 2 2 2 2 Louisville, KY-IN 863,582 MB 43 45 44 46 43 44 Lubbock, TX 202,225 MB 93t 110t 132 127 108 143 Lynchburg, VA 98,714 MB 145t 175t 169 153 122 210 Macon, GA 135,170 MB 229t 246t 180 182 231 237 Madison, WI 329,533 MB 48 49 58 57 49 50 Manchester, NH 143,549 MB 273t 292t 287 258 276 306 Mansfield, OH 79,698 MB 306t 310t 330 324 310 324 McAllen, TX 523,144 MB 247t 194t 230 269 339 301 McKinney, TX 54,525 MB 346t 342t 346 344 347 340 Medford, OR 128,780 MB 219t 231t 252 271 212 198

2012 Public Transportation Fact Book, Appendix B: Transit Agency and Urbanized Area Operating Statistics
Page 268
TABLE 16: URBANIZED AREA MODAL DATA: INDEX[In Alphabetical order by Mode followed by Urbanized Area Name]
(Data for NTD Report Year 2010)
UZA Name (a) UZA Population Mode
Rank Vehicles Operated Maximum Service
Vehicles Operated Maximum Service
Annual Vehicle
Revenue Miles
Annual Vehicle
Revenue Hours
Unlinked Pas-
senger Trips
Pas-senger Miles
Memphis, TN-MS-AR 972,091 MB 54 60 50 54 63 47 Merced, CA 110,483 MB 183t 164t 162 183 227 287 Miami, FL 4,919,036 MB 8 8 6 8 8 6 Middletown, OH 94,355 MB 341t 342t 337 338 318 310 Milwaukee, WI 1,308,913 MB 24 23 25 25 23 25 Minneapolis-St. Paul, MN 2,388,593 MB 9 10 14 15 10 12 Missoula, MT 69,491 MB 198t 202t 228 223 196 228 Mobile, AL 317,605 MB 202t 186t 164 154 204 181 Modesto, CA 310,945 MB 127t 118t 124 117 118 131 Monessen, PA 56,508 MB 176t 206t 206 228 279 127 Monroe, LA 113,818 MB 247t 231t 221 227 197 217 Montgomery, AL 196,892 MB 189t 186t 160 173 183 167 Morgantown, WV 55,997 MB 207t 231t 187 212 218 317 Mount Vernon, WA 51,174 MB 252t 238t 229 245 259 200 Muncie, IN 90,673 MB 183t 186t 216 213 154 180 Murfreesboro, TN 135,855 MB 328t 329t 318 325 322 339 Muskegon, MI 154,729 MB 284t 292t 279 267 248 249 Myrtle Beach, SC 122,984 MB 207t 177t 184 206 262 259 Napa, CA 79,867 MB 189t 177t 191 176 245 266 Nashua, NH-MA 197,155 MB 316t 334t 309 299 277 267 Nashville-Davidson, TN 749,935 MB 62 62 62 66 68 51 New Bedford, MA 146,730 MB 117t 121t 167 156 160 149 New Haven, CT 531,314 MB 68t 72 72 62 67 72 New Orleans, LA 1,009,283 MB 73 65 55 56 57 55 New York-Newark, NY-NJ-CT 17,799,861 MB 1 1 1 1 1 1 Norman, OK 86,478 MB 252t 263t 289 273 187 246 Norwich-New London, CT 173,160 MB 219t 215t 186 198 208 176 Odessa, TX 111,395 MB 273t 263t 232 236 272 320 Oklahoma City, OK 747,003 MB 113 88 95 103 128 116 Olympia-Lacey, WA 143,826 MB 104t 110t 93 90 90 94 Omaha, NE-IA 626,623 MB 58 63 65 67 96 95 Orlando, FL 1,157,431 MB 41 42 30 31 30 28 Oshkosh, WI 71,070 MB 260t 263t 267 252 221 255 Oxnard, CA 337,591 MB 95t 93t 82 87 94 91 Palm Bay-Melbourne, FL 393,289 MB 198t 121t 139 174 165 156 Panama City, FL 132,419 MB 260t 238t 249 254 233 224 Parkersburg, WV-OH 85,605 MB 284t 281t 297 277 296 318 Pensacola, FL-AL 323,783 MB 159t 158 153 155 198 185 Peoria, IL 247,172 MB 120t 96 120 144 129 115 Petaluma, CA 59,958 MB 328t 334t 339 332 325 327 Philadelphia, PA-NJ-DE-MD 5,149,079 MB 7 7 8 7 4 7 Phoenix-Mesa, AZ 2,907,049 MB 14 13 12 13 20 20 Pittsburgh, PA 1,753,136 MB 13 15 16 19 18 18 Pittsfield, MA 52,772 MB 260t 231t 214 249 267 209 Pocatello, ID 62,498 MB 284t 304t 326 308 275 272 Port Arthur, TX 114,656 MB 336t 323t 331 336 335 313 Port Huron, MI 86,486 MB 260t 270t 270 264 232 274 Port St. Lucie, FL 270,774 MB 260t 246t 299 291 323 289 Porterville, CA 60,261 MB 316t 298t 312 302 268 268 Portland, ME 188,080 MB 202t 211t 208 188 174 182 Portland, OR-WA 1,583,138 MB 18 18 17 16 15 17 Portsmouth, NH-ME 50,912 MB 189t 206t 286 301 203 242 Poughkeepsie-Newburgh, NY 351,982 MB 84 81t 78 105 163 76 Providence, RI-MA 1,174,548 MB 39 40 38 40 38 37 Pueblo, CO 123,351 MB 252t 281t 259 248 215 247 Racine, WI 129,545 MB 171t 181t 172 168 176 195 Raleigh, NC 541,527 MB 70t 61 70 68 71 79 Rapid City, SD 66,780 MB 316t 310t 319 322 306 312

2012 Public Transportation Fact Book, Appendix B: Transit Agency and Urbanized Area Operating Statistics
Page 269
TABLE 16: URBANIZED AREA MODAL DATA: INDEX[In Alphabetical order by Mode followed by Urbanized Area Name]
(Data for NTD Report Year 2010)
UZA Name (a) UZA Population Mode
Rank Vehicles Operated Maximum Service
Vehicles Operated Maximum Service
Annual Vehicle
Revenue Miles
Annual Vehicle
Revenue Hours
Unlinked Pas-
senger Trips
Pas-senger Miles
Reading, PA 240,264 MB 134t 140t 148 129 125 154 Redding, CA 105,267 MB 273t 263t 246 240 244 222 Reno, NV 303,689 MB 101t 108 89 78 72 83 Richmond, VA 818,836 MB 51 53 52 49 48 52 Riverside-San Bernardino, CA 1,506,816 MB 34 33 28 29 32 32 Roanoke, VA 197,442 MB 151t 154t 138 137 139 129 Rochester, MN 91,271 MB 176t 167t 192 203 171 190 Rochester, NY 694,396 MB 42 43 53 51 41 43 Rockford, IL 270,414 MB 176t 164t 161 157 170 163 Rome, GA 58,287 MB 183t 181t 282 294 242 203 Sacramento, CA 1,393,498 MB 31 32 35 35 34 36 Saginaw, MI 140,985 MB 171t 159t 224 239 211 227 Salem, OR 207,229 MB 100 116t 113 108 92 125 Salisbury, MD-DE 59,426 MB 189t 215t 156 319 299 296 Salt Lake City, UT 887,650 MB 22 22 26 33 33 30 San Angelo, TX 87,969 MB 336t 334t 308 309 317 337 San Antonio, TX 1,327,554 MB 28 26 21 21 24 23 San Diego, CA 2,674,436 MB 20 20 20 17 17 19 San Francisco-Oakland, CA 3,228,605 MB 6 6 7 5 6 8 San Jose, CA 1,538,312 MB 26 27 29 27 27 24 San Juan, PR 2,216,616 MB 44 41 49 37 47 48 San Luis Obispo, CA 53,498 MB 183t 175t 159 197 168 96 Santa Barbara, CA 196,263 MB 76 77 91 86 70 66 Santa Clarita, CA 170,481 MB 86t 97t 86 104 101 59 Santa Cruz, CA 157,348 MB 78 91t 77 83 79 62 Santa Fe, NM 80,337 MB 183t 206t 202 179 223 248 Santa Maria, CA 120,297 MB 236t 246t 219 225 201 160 Santa Rosa, CA 285,408 MB 98t 79 94 97 99 88 Sarasota-Bradenton, FL 559,229 MB 95t 91t 64 72 97 86 Savannah, GA 208,886 MB 114t 129t 98 91 109 124 Scranton, PA 385,237 MB 101t 102t 111 106 110 109 Seaside-Monterey-Marina, CA 125,503 MB 83 93t 67 79 93 74 Seattle, WA 2,712,205 MB 5 5 5 6 7 4 Sheboygan, WI 68,600 MB 229t 211t 263 255 278 314 Sherman, TX 56,168 MB 316t 323t 310 339 343 288 Shreveport, LA 275,213 MB 145t 144t 107 113 116 104 Simi Valley, CA 112,345 MB 306t 304t 281 281 271 260 Sioux City, IA-NE-SD 106,119 MB 212t 231t 253 232 195 179 Sioux Falls, SD 124,269 MB 171t 199t 231 220 216 183 South Bend, IN-MI 276,498 MB 134t 135t 135 138 150 151 Spartanburg, SC 145,058 MB 306t 318t 324 312 264 261 Spokane, WA-ID 334,858 MB 59 59 51 53 61 54 Springfield, IL 153,516 MB 119 140t 163 151 164 206 Springfield, MA-CT 573,610 MB 55 56 63 65 62 71 Springfield, MO 215,004 MB 216t 225t 176 178 178 186 Springfield, OH 89,684 MB 284t 281t 329 317 302 334 St. Augustine, FL 53,519 MB 316t 318t 283 310 320 294 St. Charles, MD 74,765 MB 252t 238t 189 215 256 204 St. Cloud, MN 91,305 MB 164t 167t 165 172 145 147 St. Joseph, MO-KS 77,231 MB 229t 257t 209 181 291 280 St. Louis, MO-IL 2,077,662 MB 27 31 22 24 28 31 State College, PA 71,301 MB 107t 121t 136 135 74 97 Stockton, CA 313,392 MB 70t 75 75 80 91 75 Sumter, SC 64,320 MB 219t 238t 280 303 326 286 Syracuse, NY 402,267 MB 49 50t 59 59 52 56 Tallahassee, FL 204,260 MB 104t 102t 117 92 87 117 Tampa-St. Petersburg, FL 2,062,339 MB 29 24 24 26 29 29 Terre Haute, IN 79,376 MB 300t 238t 293 235 303 336
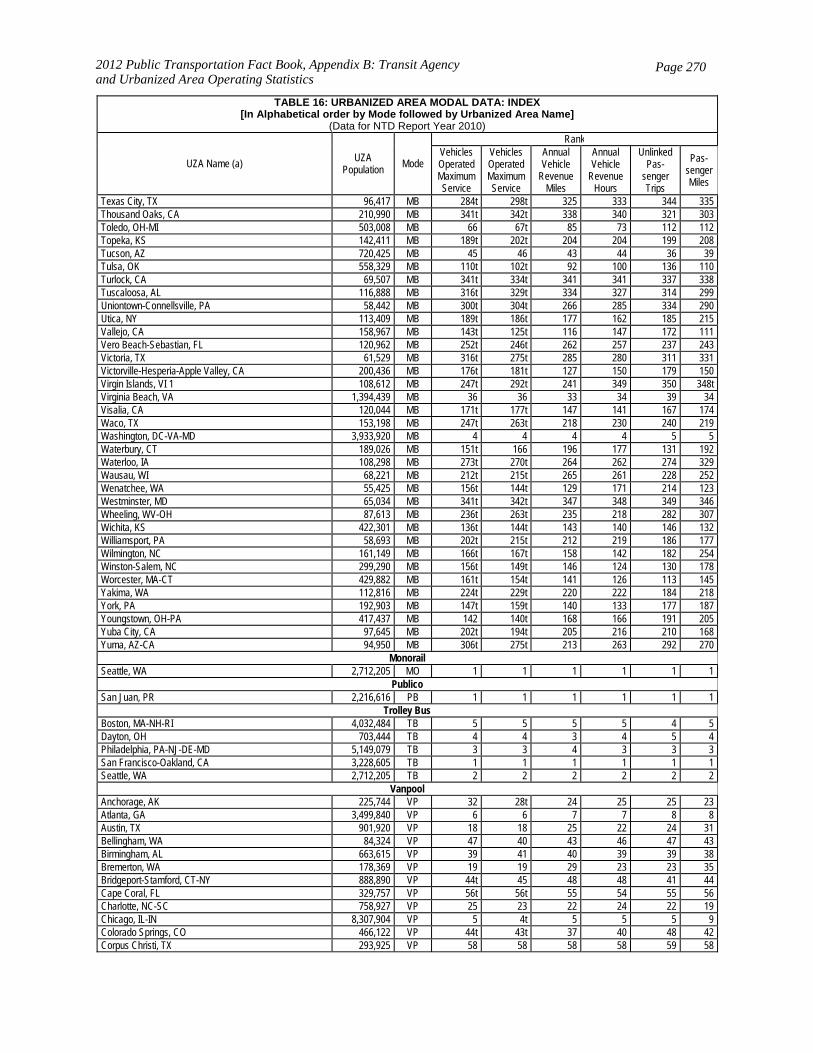
2012 Public Transportation Fact Book, Appendix B: Transit Agency and Urbanized Area Operating Statistics
Page 270
TABLE 16: URBANIZED AREA MODAL DATA: INDEX[In Alphabetical order by Mode followed by Urbanized Area Name]
(Data for NTD Report Year 2010)
UZA Name (a) UZA Population Mode
Rank Vehicles Operated Maximum Service
Vehicles Operated Maximum Service
Annual Vehicle
Revenue Miles
Annual Vehicle
Revenue Hours
Unlinked Pas-
senger Trips
Pas-senger Miles
Texas City, TX 96,417 MB 284t 298t 325 333 344 335 Thousand Oaks, CA 210,990 MB 341t 342t 338 340 321 303 Toledo, OH-MI 503,008 MB 66 67t 85 73 112 112 Topeka, KS 142,411 MB 189t 202t 204 204 199 208 Tucson, AZ 720,425 MB 45 46 43 44 36 39 Tulsa, OK 558,329 MB 110t 102t 92 100 136 110 Turlock, CA 69,507 MB 341t 334t 341 341 337 338 Tuscaloosa, AL 116,888 MB 316t 329t 334 327 314 299 Uniontown-Connellsville, PA 58,442 MB 300t 304t 266 285 334 290 Utica, NY 113,409 MB 189t 186t 177 162 185 215 Vallejo, CA 158,967 MB 143t 125t 116 147 172 111 Vero Beach-Sebastian, FL 120,962 MB 252t 246t 262 257 237 243 Victoria, TX 61,529 MB 316t 275t 285 280 311 331 Victorville-Hesperia-Apple Valley, CA 200,436 MB 176t 181t 127 150 179 150 Virgin Islands, VI 1 108,612 MB 247t 292t 241 349 350 348t Virginia Beach, VA 1,394,439 MB 36 36 33 34 39 34 Visalia, CA 120,044 MB 171t 177t 147 141 167 174 Waco, TX 153,198 MB 247t 263t 218 230 240 219 Washington, DC-VA-MD 3,933,920 MB 4 4 4 4 5 5 Waterbury, CT 189,026 MB 151t 166 196 177 131 192 Waterloo, IA 108,298 MB 273t 270t 264 262 274 329 Wausau, WI 68,221 MB 212t 215t 265 261 228 252 Wenatchee, WA 55,425 MB 156t 144t 129 171 214 123 Westminster, MD 65,034 MB 341t 342t 347 348 349 346 Wheeling, WV-OH 87,613 MB 236t 263t 235 218 282 307 Wichita, KS 422,301 MB 136t 144t 143 140 146 132 Williamsport, PA 58,693 MB 202t 215t 212 219 186 177 Wilmington, NC 161,149 MB 166t 167t 158 142 182 254 Winston-Salem, NC 299,290 MB 156t 149t 146 124 130 178 Worcester, MA-CT 429,882 MB 161t 154t 141 126 113 145 Yakima, WA 112,816 MB 224t 229t 220 222 184 218 York, PA 192,903 MB 147t 159t 140 133 177 187 Youngstown, OH-PA 417,437 MB 142 140t 168 166 191 205 Yuba City, CA 97,645 MB 202t 194t 205 216 210 168 Yuma, AZ-CA 94,950 MB 306t 275t 213 263 292 270
Monorail Seattle, WA 2,712,205 MO 1 1 1 1 1 1
Publico San Juan, PR 2,216,616 PB 1 1 1 1 1 1
Trolley Bus Boston, MA-NH-RI 4,032,484 TB 5 5 5 5 4 5 Dayton, OH 703,444 TB 4 4 3 4 5 4 Philadelphia, PA-NJ-DE-MD 5,149,079 TB 3 3 4 3 3 3 San Francisco-Oakland, CA 3,228,605 TB 1 1 1 1 1 1 Seattle, WA 2,712,205 TB 2 2 2 2 2 2
Vanpool Anchorage, AK 225,744 VP 32 28t 24 25 25 23 Atlanta, GA 3,499,840 VP 6 6 7 7 8 8 Austin, TX 901,920 VP 18 18 25 22 24 31 Bellingham, WA 84,324 VP 47 40 43 46 47 43 Birmingham, AL 663,615 VP 39 41 40 39 39 38 Bremerton, WA 178,369 VP 19 19 29 23 23 35 Bridgeport-Stamford, CT-NY 888,890 VP 44t 45 48 48 41 44 Cape Coral, FL 329,757 VP 56t 56t 55 54 55 56 Charlotte, NC-SC 758,927 VP 25 23 22 24 22 19 Chicago, IL-IN 8,307,904 VP 5 4t 5 5 5 9 Colorado Springs, CO 466,122 VP 44t 43t 37 40 48 42 Corpus Christi, TX 293,925 VP 58 58 58 58 59 58
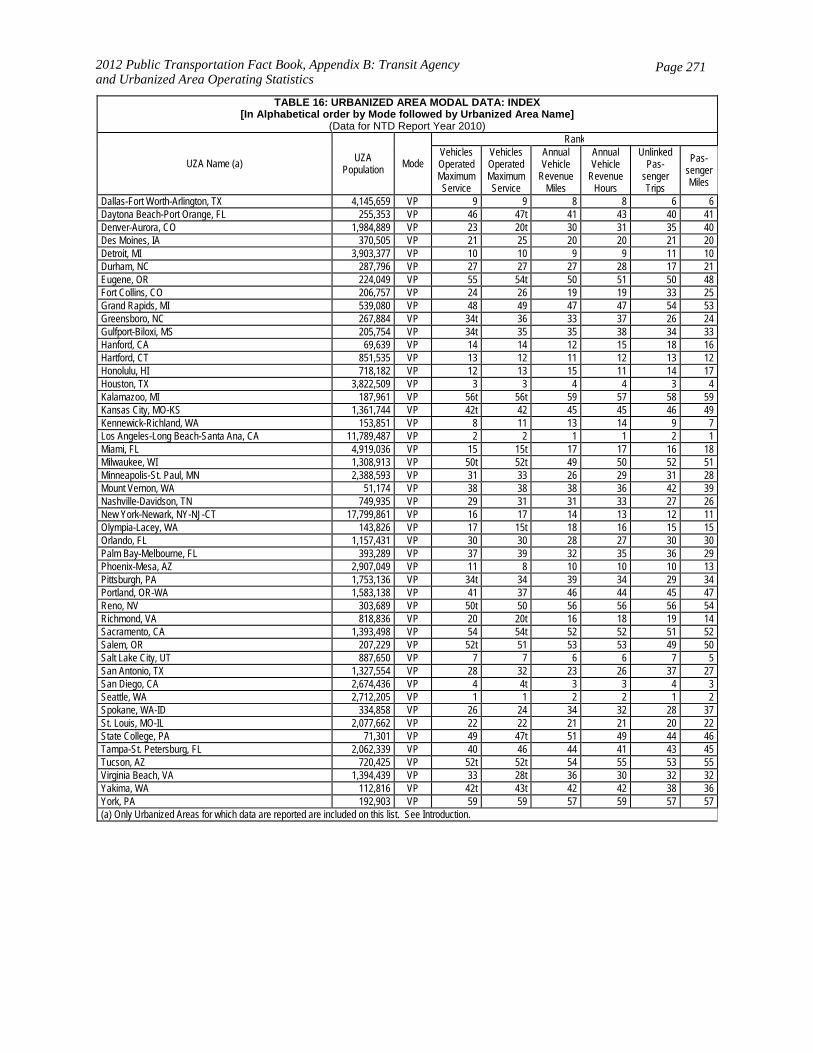
2012 Public Transportation Fact Book, Appendix B: Transit Agency and Urbanized Area Operating Statistics
Page 271
TABLE 16: URBANIZED AREA MODAL DATA: INDEX[In Alphabetical order by Mode followed by Urbanized Area Name]
(Data for NTD Report Year 2010)
UZA Name (a) UZA Population Mode
Rank Vehicles Operated Maximum Service
Vehicles Operated Maximum Service
Annual Vehicle
Revenue Miles
Annual Vehicle
Revenue Hours
Unlinked Pas-
senger Trips
Pas-senger Miles
Dallas-Fort Worth-Arlington, TX 4,145,659 VP 9 9 8 8 6 6 Daytona Beach-Port Orange, FL 255,353 VP 46 47t 41 43 40 41 Denver-Aurora, CO 1,984,889 VP 23 20t 30 31 35 40 Des Moines, IA 370,505 VP 21 25 20 20 21 20 Detroit, MI 3,903,377 VP 10 10 9 9 11 10 Durham, NC 287,796 VP 27 27 27 28 17 21 Eugene, OR 224,049 VP 55 54t 50 51 50 48 Fort Collins, CO 206,757 VP 24 26 19 19 33 25 Grand Rapids, MI 539,080 VP 48 49 47 47 54 53 Greensboro, NC 267,884 VP 34t 36 33 37 26 24 Gulfport-Biloxi, MS 205,754 VP 34t 35 35 38 34 33 Hanford, CA 69,639 VP 14 14 12 15 18 16 Hartford, CT 851,535 VP 13 12 11 12 13 12 Honolulu, HI 718,182 VP 12 13 15 11 14 17 Houston, TX 3,822,509 VP 3 3 4 4 3 4 Kalamazoo, MI 187,961 VP 56t 56t 59 57 58 59 Kansas City, MO-KS 1,361,744 VP 42t 42 45 45 46 49 Kennewick-Richland, WA 153,851 VP 8 11 13 14 9 7 Los Angeles-Long Beach-Santa Ana, CA 11,789,487 VP 2 2 1 1 2 1 Miami, FL 4,919,036 VP 15 15t 17 17 16 18 Milwaukee, WI 1,308,913 VP 50t 52t 49 50 52 51 Minneapolis-St. Paul, MN 2,388,593 VP 31 33 26 29 31 28 Mount Vernon, WA 51,174 VP 38 38 38 36 42 39 Nashville-Davidson, TN 749,935 VP 29 31 31 33 27 26 New York-Newark, NY-NJ-CT 17,799,861 VP 16 17 14 13 12 11 Olympia-Lacey, WA 143,826 VP 17 15t 18 16 15 15 Orlando, FL 1,157,431 VP 30 30 28 27 30 30 Palm Bay-Melbourne, FL 393,289 VP 37 39 32 35 36 29 Phoenix-Mesa, AZ 2,907,049 VP 11 8 10 10 10 13 Pittsburgh, PA 1,753,136 VP 34t 34 39 34 29 34 Portland, OR-WA 1,583,138 VP 41 37 46 44 45 47 Reno, NV 303,689 VP 50t 50 56 56 56 54 Richmond, VA 818,836 VP 20 20t 16 18 19 14 Sacramento, CA 1,393,498 VP 54 54t 52 52 51 52 Salem, OR 207,229 VP 52t 51 53 53 49 50 Salt Lake City, UT 887,650 VP 7 7 6 6 7 5 San Antonio, TX 1,327,554 VP 28 32 23 26 37 27 San Diego, CA 2,674,436 VP 4 4t 3 3 4 3 Seattle, WA 2,712,205 VP 1 1 2 2 1 2 Spokane, WA-ID 334,858 VP 26 24 34 32 28 37 St. Louis, MO-IL 2,077,662 VP 22 22 21 21 20 22 State College, PA 71,301 VP 49 47t 51 49 44 46 Tampa-St. Petersburg, FL 2,062,339 VP 40 46 44 41 43 45 Tucson, AZ 720,425 VP 52t 52t 54 55 53 55 Virginia Beach, VA 1,394,439 VP 33 28t 36 30 32 32 Yakima, WA 112,816 VP 42t 43t 42 42 38 36 York, PA 192,903 VP 59 59 57 59 57 57 (a) Only Urbanized Areas for which data are reported are included on this list. See Introduction.
2012 Public Transportation Fact Book, Appendix B: Transit Agency and Urbanized Area Operating Statistics
Page 272
GLOSSARY MODE OF SERVICE CODES AND DEFINITIONS: Mode is a system for carrying transit passengers described by specific right-of-way, technology, and operational features. AG: Automated Guideway Transit (also called personal rapid transit, group rapid transit, people mover) is an electric railway (single or multi-car trains) of guided transit vehicles operating without an onboard crew. Service may be on a fixed schedule or in response to a passenger activated call button. AR: Alaska Railroad is the Alaska Railroad with operations similar to commuter rail service. CC: Cable Car is an electric railway with individually controlled transit vehicles attached to a moving cable located below the street surface and powered by engines or motors at a central location not on board the vehicle. CR: Commuter Rail is a mode of transit service (also called metropolitan rail, regional rail, or suburban rail) characterized by an electric or diesel propelled railway for urban passenger train service consisting of local short distance travel operating between a central city and adjacent suburbs. Service must be operated on a regular basis by or under contract with a transit operator for the purpose of transporting passengers within urbanized areas, or between urbanized areas and outlying areas. Such rail service, using either locomotive hauled or self propelled railroad passenger cars, is generally characterized by multi-trip tickets, specific station to station fares, railroad employment practices and usually only one or two stations in the central business district. Intercity rail service is excluded, except for that portion of such service that is operated by or under contract with a public transit agency for predominantly commuter services. Most service is provided on routes of current or former freight railroads. DR: Paratransit is a mode of transit service (also called demand response or dial-a-ride) characterized by the use of comprised of passenger automobiles, vans or small buses operating in response to calls from passengers or their agents to the transit operator, who then dispatches a vehicle to pick up the passengers and transport them to their destinations. The vehicles do not operate over a fixed route or on a fixed schedule except, perhaps, on a temporary basis to satisfy a special need; and typically, the vehicle may be dispatched to pick up several passengers at different pick-up points before taking them to their respective destinations and may even be interrupted en route to these destinations to pick up other passengers. The following types of operations fall under the above definitions provided they are not on a scheduled fixed route basis: many origins-many destinations, many origins-one destination, one origin-many destinations, and one origin-one destination. DT: Paratransit – Taxi is a special form of demand response operated through taxicab providers. FB: Ferry Boat is a transit mode comprised of vessels carrying passengers and/or vehicles over a body of water, and that are generally steam or diesel-powered. When at least one terminal is within an urbanized area, it is urban ferryboat service. Such service excludes international, rural, rural interstate, island, and urban park ferries. HR: Heavy Rail is a mode of transit service (also called metro, subway, rapid transit, or rapid rail) operating on an electric railway with the capacity for a heavy volume of traffic. It is characterized by high speed and rapid acceleration passenger rail cars operating singly or in multi-
2012 Public Transportation Fact Book, Appendix B: Transit Agency and Urbanized Area Operating Statistics
Page 273
car trains on fixed rails; separate rights-of-way from which all other vehicular and foot traffic are excluded; sophisticated signaling, and high platform loading. IP: Inclined Plane is a railway operating over exclusive right-of-way on steep grades (slopes) with powerless vehicles propelled by moving cables attached to the vehicles and powered by engines or motors at a central location not on board the vehicle. The special tramway type of vehicles have passenger seats that remain horizontal while the undercarriage (truck) is angled parallel to the slope. LR: Light Rail is a mode of transit service (also called streetcar, tramway, or trolley) operating lightweight passenger rail cars singly (or in short, usually two-car or three-car, trains) on fixed rails in right-of-way that is not separated from other traffic for part or much of the way. Light rail vehicles are typically driven electrically with power being drawn from an overhead electric line via a trolley or a pantograph; driven by an operator on board the vehicle; and may have either high platform loading or low level boarding using steps. MB: Bus is a mode of transit service (also called motor bus) characterized by roadway vehicles powered by diesel, gasoline, battery or alternative fuel engines contained within the vehicle. Vehicles operate on streets and roadways in fixed-route or other regular service. Types of bus service include local service, where vehicles may stop every block or two along a route several miles long. When limited to a small geographic area or to short-distance trips, local service is often called circulator, feeder, neighborhood, trolley, or shuttle service. Other types of bus service are express service, limited-stop service, and Bus rapid transit (BRT). Data for all of these types of bus service are included in the bus mode on these historical data tables. Disaggregated data are not available for any of the bus service categories. MO: Monorail is an electric railway of guided transit vehicles operating singly or in multi-car trains. The vehicles are suspended from or straddle a guideway formed by a single beam, rail, or tube. Their most common use is in the non-transit settings of amusement parks. If the trains do not have an onboard crew, they are considered automated guideways. PB: Publico is a mode similar to jitney, operated solely in Puerto Rico, which is comprised of passenger vans or small buses operating with fixed routes but no fixed schedules. Publicos are a privately owned and operated mass transit service which is market oriented and unsubsidized, but regulated through a public service commission, state, or local government. Publicos are operated under franchise agreements, fares are regulated by route, and there are special insurance requirements. Vehicle capacity varies from 8 to 24, and the vehicles may be owned or leased by the operator. TB: Trolleybus is a mode of transit service (also called trolley coach) using vehicles propelled by a motor drawing current from overhead wires via a connecting pole called a trolley pole from a central power source not on board the vehicle. VP: Van Pool is comprised of vans (and very rarely, small buses and other vehicles) operating as a ridesharing arrangement, providing transportation to a group of individuals traveling directly between their homes and a regular destination within the same geographical area. The vehicles have a minimum seating capacity of seven persons, including the driver. It is considered mass transit service if it is operated by a public entity or is one in which a public entity owns, purchases, or leases the vehicle(s). Vanpool(s) must also be in compliance with mass transit rules including Americans with Disabilities Act (ADA) provisions, and be open to the public and that availability must be made known. Other forms of public participation to encourage ridesharing arrangements
2012 Public Transportation Fact Book, Appendix B: Transit Agency and Urbanized Area Operating Statistics
Page 274
such as the provision of parking spaces, use of high occupancy vehicle (HOV) lanes, coordination or clearing house service, do not qualify as public vanpools. OPERATING STATISTICS: Vehicles Operated Maximum Service is the largest number of vehicles in operation in revenue service (i.e., the time when a vehicle is available to the general public and there is an expectation of carrying passengers) at any one time, typically during the morning or evening peak period or rush hour on a weekday. Vehicles Available for Maximum Service are vehicles that a transit agency has available to operate revenue service regardless of the legal relationship thorough which they are owned, leased, or otherwise controlled by the transit agency. Also called revenue vehicles owned and leased. Vehicle Revenue Miles are the miles traveled when the vehicle is in revenue service (i.e., the time when a vehicle is available to the general public and there is an expectation of carrying passengers). Vehicles operated in fare-free service are considered in revenue service. Revenue service excludes school bus service and charter service. For conventionally scheduled services, vehicle revenue miles are comprised of running miles available to passengers only; "deadhead" miles are not included. Vehicle Revenue Hours are the hours traveled when the vehicle is in revenue service (i.e., the time when a vehicle is available to the general public and there is an expectation of carrying passengers). Vehicles operated in fare-free service are considered in revenue service. Revenue service excludes school bus service and charter service. For conventionally scheduled services, vehicle revenue hours include running time and layover/recovery time. Unlinked Passenger Trips is the number of times passengers board public transportation vehicles. Passengers are counted each time they board vehicles no matter how many vehicles they use to travel from their origin to their destination and regardless of whether they pay a fare, use a pass or transfer, ride for free, or pay in some other way. Also called boardings. Passenger Miles is the cumulative sum of the distances ridden by each passenger.