2012-01-04 PLUS Investor Presentation final
21
© ePlus inc. EXCELLENCE THROUGH EXPERIENCE ePlus Investor Presentation January 4, 2013
Transcript of 2012-01-04 PLUS Investor Presentation final

© ePlus inc. E X C E L L E N C E T H R O U G H E X P E R I E N C E© ePlus inc.
E X C E L L E N C E T H R O U G H E X P E R I E N C E
ePlus
Investor PresentationJanuary 4, 2013
© ePlus inc. E X C E L L E N C E T H R O U G H E X P E R I E N C E
Safe Harbor Statement
Statements in this presentation, which are not historical facts, may be deemed to be "forward‐lookingstatements.” Actual and anticipated future results may vary due to certain risks and uncertainties,including, without limitation; possible adverse effects resulting from the recent uncertainty in theeconomic environment and general slowdown of the U.S. economy such as our current and potentialcustomers delaying or reducing technology purchases, increasing credit risk associated with our customersand vendors, reduction of vendor incentive programs, the possibility of additional goodwill impairmentcharges, and restrictions on our access to capital necessary to fund our operations; the existence ofdemand for, and acceptance of, our products and services; our ability to maintain effective disclosurecontrols and procedures and internal control over financial reporting; our ability to adapt to changes in theIT industry and/or rapid change in product standards; our ability to hire and retain sufficient personnel; ourability to protect our intellectual property; our ability to raise capital and obtain non‐recourse financing forour transactions; our ability to realize our investment in leased equipment; our ability to reserveadequately for credit losses; our ability to successfully integrate acquired businesses; significant adversechanges in, reductions in, or losses of relationships with major customers or vendors; the possibility ofdefects in our products or catalog content data; and other risks or uncertainties detailed in the Company’sAnnual Report on Form 10‐K for the fiscal year ended March 31, 2012 and other periodic filings with theSecurities and Exchange Commission and available at the SEC’s website at http://www.sec.gov.
We wish to caution you that these factors could affect our financial performance and could cause actualresults for future periods to differ materially from any opinions or statements expressed with respect tofuture periods in any current statements. All information set forth in this presentation is current as of thedate of this presentation and ePlus undertakes no duty or obligation to update this information.
2
© ePlus inc. E X C E L L E N C E T H R O U G H E X P E R I E N C E
Why Invest in ePlus
Phil Norton, CEO
3

© ePlus inc. E X C E L L E N C E T H R O U G H E X P E R I E N C E
Company Overview
4
ePlus Highlights (NASDAQ NGS: PLUS)
+ Revenues were $947.8 million for TTM ending 9/30/12.+ Net earnings were $3.88 per diluted share TTM ending 9/30/12.+ National footprint: 851 employees (as of 9/30/2012) in 25 offices nationwide+ Cloud is the new market dynamic, which requires systems integration for technology products
and engineering talent to execute multi‐vendor solutions
ePlus provides technology solutions and IT products, specializing in advanced technologyengineering services, leasing, and proprietary software, to automate the supply chain includingspend analytics, procurement and asset management.

© ePlus inc. E X C E L L E N C E T H R O U G H E X P E R I E N C E
ePlus Strategy
+ Maintain strong balance sheet
+ Drive growth
+ Capture more spend within customer base
Advanced technology solutions: eCloud, Security, Collaboration
Create recurring revenue through expanding managed services, staff augmentation, and professional services
Expand services for architecture, design and implementation of solutions
Leverage OneSource© to become our customers’ preferred web portal for IT product searches, procurement, and supply chain management
+ Accretive acquisitions
Gain new customers, technologies, managed services, professional services delivery capability in new and existing geographies
+ Operational Excellence Continue to improve operating platforms and processes, retain and develop talent to
ensure scalability, improve operating ratios, and remain an effective platform for acquisitions.
5
© ePlus inc. E X C E L L E N C E T H R O U G H E X P E R I E N C E
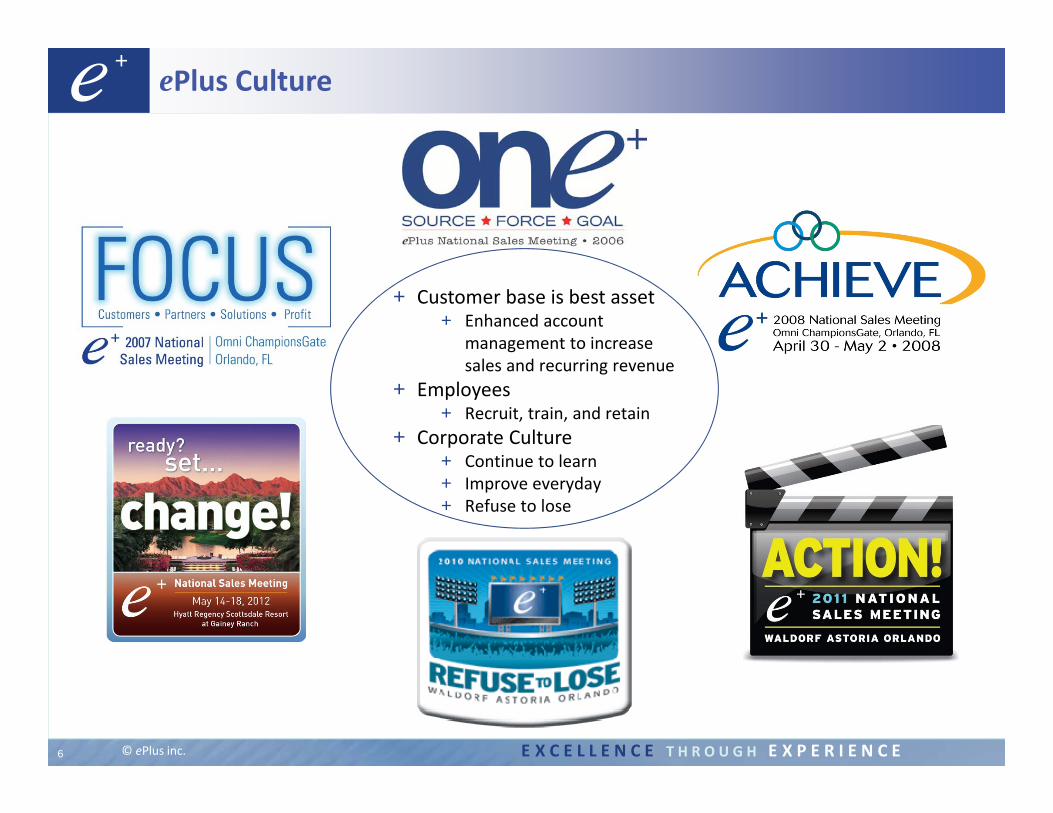
ePlus Culture
6
+ Customer base is best asset+ Enhanced account
management to increase sales and recurring revenue
+ Employees+ Recruit, train, and retain
+ Corporate Culture+ Continue to learn+ Improve everyday+ Refuse to lose
© ePlus inc. E X C E L L E N C E T H R O U G H E X P E R I E N C E
Business Overview
Mark Marron, COO
7

© ePlus inc. E X C E L L E N C E T H R O U G H E X P E R I E N C E
Business Overview
8
+ We deliver world‐class IT solutions: integrating technology products and software from top manufacturers with long‐term experience integrating multi‐vendor solutions
+ We facilitate transaction flow by offering flexible lease financing and proprietary software, which provides multiple benefits to our customers
+ We have national direct sales and national engineering teams supported by inside sales and telesales personnel:
~354 sales and marketing associates~251 technical support associates
+ We are certified with world’s technology leaders:
© ePlus inc. E X C E L L E N C E T H R O U G H E X P E R I E N C E
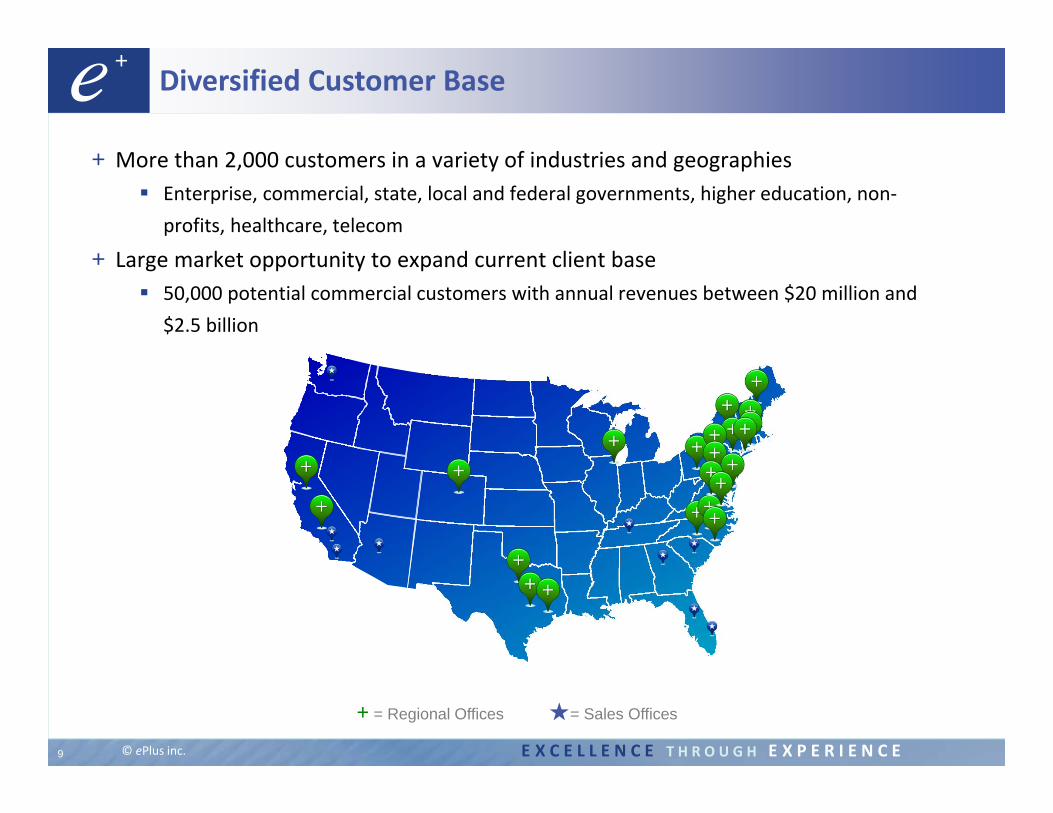
Diversified Customer Base
+ More than 2,000 customers in a variety of industries and geographies Enterprise, commercial, state, local and federal governments, higher education, non‐
profits, healthcare, telecom
+ Large market opportunity to expand current client base 50,000 potential commercial customers with annual revenues between $20 million and
$2.5 billion
9
+ = Regional Offices ★= Sales Offices

© ePlus inc. E X C E L L E N C E T H R O U G H E X P E R I E N C E
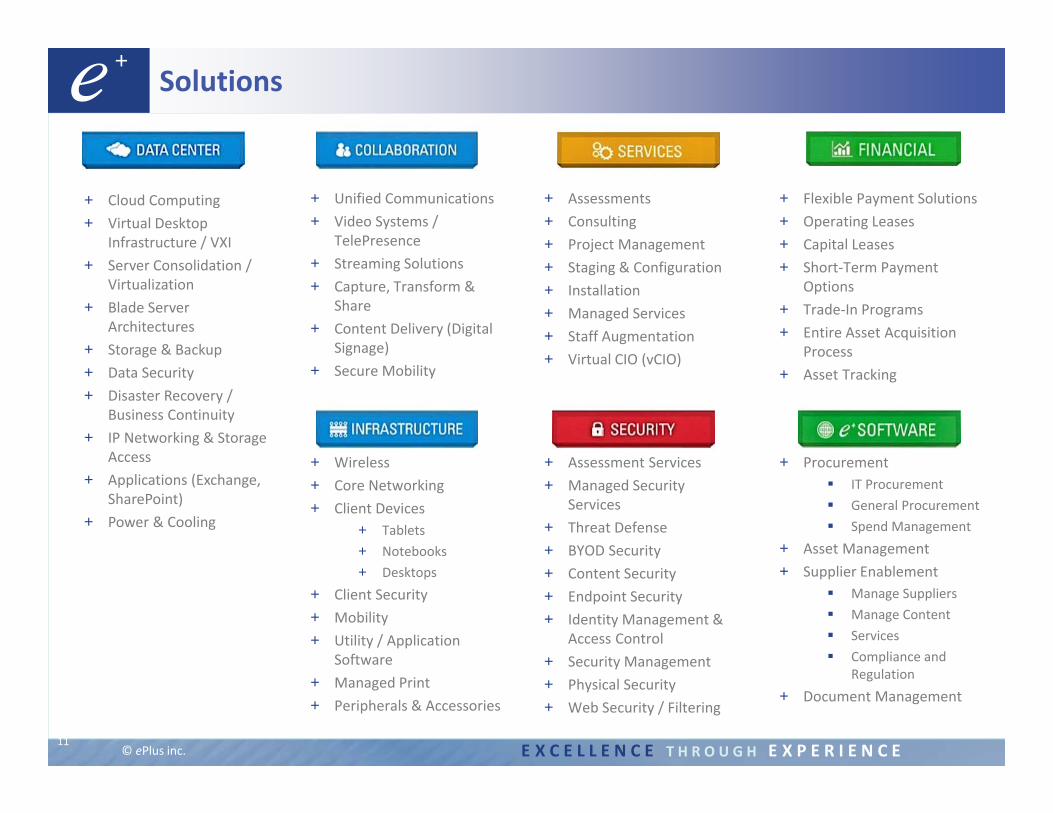
Comprehensive Solutions
© ePlus inc. E X C E L L E N C E T H R O U G H E X P E R I E N C E
+ Cloud Computing+ Virtual Desktop
Infrastructure / VXI+ Server Consolidation /
Virtualization+ Blade Server
Architectures+ Storage & Backup+ Data Security+ Disaster Recovery /
Business Continuity+ IP Networking & Storage
Access+ Applications (Exchange,
SharePoint)+ Power & Cooling
+ Unified Communications+ Video Systems /
TelePresence+ Streaming Solutions+ Capture, Transform &
Share+ Content Delivery (Digital
Signage)+ Secure Mobility
+ Wireless+ Core Networking+ Client Devices
+ Tablets+ Notebooks+ Desktops
+ Client Security+ Mobility+ Utility / Application
Software+ Managed Print+ Peripherals & Accessories
+ Assessments+ Consulting+ Project Management+ Staging & Configuration+ Installation+ Managed Services+ Staff Augmentation+ Virtual CIO (vCIO)
+ Procurement IT Procurement General Procurement Spend Management
+ Asset Management+ Supplier Enablement
Manage Suppliers Manage Content Services Compliance and
Regulation+ Document Management
+ Assessment Services+ Managed Security
Services+ Threat Defense+ BYOD Security+ Content Security+ Endpoint Security+ Identity Management &
Access Control+ Security Management+ Physical Security + Web Security / Filtering
11
Solutions
+ Flexible Payment Solutions + Operating Leases + Capital Leases + Short‐Term Payment
Options+ Trade‐In Programs+ Entire Asset Acquisition
Process+ Asset Tracking

© ePlus inc. E X C E L L E N C E T H R O U G H E X P E R I E N C E
Acquisitions
12
+ Strategy: Complement or expand our business from a technology or geographic perspective
+ Recent Transactions Pacific Blue Micro, February 2012, Southern California, managed services, Cisco expertise
Vanticore, January 2012, Northern New England, managed services, Cisco Call Center Express
NCC, June 2011, Chicago, security, security operations center
ITI, November 2010, Southern New Jersey/metro Philadelphia, Tandburg/video expertise
+ 15 acquisitions since 1997+ Cost savings, operational expertise, expanded product set
© ePlus inc. E X C E L L E N C E T H R O U G H E X P E R I E N C E
Why Clients Choose ePlus
13
+ Our Focus on the Customer• Our customer‐centric, project management approach ensures customer
satisfaction+ Our Complete Solution Set
• Comprehensive, end‐to‐end IT supply chain provider, including lifecycle management, world‐class technology products and software, advanced engineering capabilities, managed services, supply chain logistics, sourcing, and financing
+ Our Team• Industry leading engineers, account managers and inside sales representatives
to support our clients+ Our Proprietary Software & Business Methods Reduce Costs
• Our web portal, OneSource IT®, helps streamline and optimize the supply chain for our clients

© ePlus inc. E X C E L L E N C E T H R O U G H E X P E R I E N C E
Financial Overview
Elaine Marion, CFO
14

© ePlus inc. E X C E L L E N C E T H R O U G H E X P E R I E N C E
Segment Results
15
+ Technology SegmentSales
For the year ended March 31, 2012 (FYE12), Cisco sales generated 45% of revenue; HP sales generated 15% of revenue
Tiered manufacturer incentive programs and rebates
Broad range of product categories
Services
Revenues are both project based as well as recurring managed services and staff augmentation
ePlus Software
Revenues are primarily SAAS, annual maintenance, and services
+ Financing Segment Operating and direct finance lease revenue Ability to hold leases on balance sheet or
syndicate debt and equity
Quarter Ended September 30, 2012($000s) Technology Finance
2012 2011%
Change 2012 2011 % ChangeRevenue $ 251,769 $ 195,621 28.7% $ 8,282 $ 8,034 3.1%PreTax Earnings 14,864 9,203 61.5% 2,044 2,645 (22.7%)

© ePlus inc. E X C E L L E N C E T H R O U G H E X P E R I E N C E
Financial Results for the Year Ended March 31, 2012
16
+ Revenues totaled $825.6 million, up 14.9% to year‐over‐year+ Sales of product & services totaled $785.0 million, up 16.8% year‐over‐year+ Gross margin on products & services was 17.8%, as compared to 17.9% in FY11+ Net earnings totaled $23.4 million, or $2.84 per diluted share, as compared to $23.7
million, or $2.82 per diluted share, for the year ended March 31, 2011
16
$696.1 $581.9 $550.6
$718.5 $825.6
$0
$300
$600
$900
FY08 FY09 FY10 FY11 FY12
Revenue($ millions)
$1.95 $1.52 $1.50
$2.82 $2.84
($0.10)$0.40$0.90$1.40$1.90$2.40$2.90
FY08 FY09 FY10 FY11 FY12
Diluted Earnings Per Share
© ePlus inc. E X C E L L E N C E T H R O U G H E X P E R I E N C E
Financial Results for the Quarter Ended 9/30/2012 (2Q13)
17
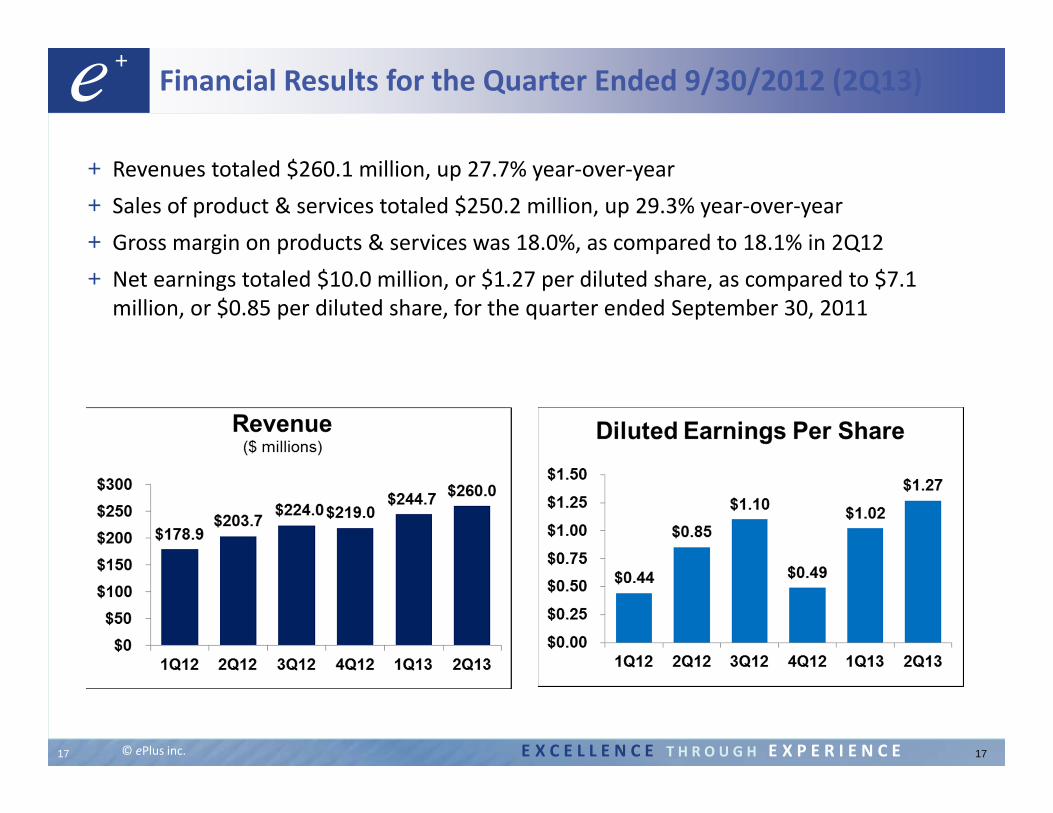
+ Revenues totaled $260.1 million, up 27.7% year‐over‐year+ Sales of product & services totaled $250.2 million, up 29.3% year‐over‐year+ Gross margin on products & services was 18.0%, as compared to 18.1% in 2Q12+ Net earnings totaled $10.0 million, or $1.27 per diluted share, as compared to $7.1
million, or $0.85 per diluted share, for the quarter ended September 30, 2011
17

© ePlus inc. E X C E L L E N C E T H R O U G H E X P E R I E N C E
Balance Sheet
+ Strong Cash Position as of 9/30/2012: Cash and short‐term investments: $45.9 million Total debt: $34.7 million
+ Uses of cash: Invest in human capital, high credit quality leases, acquisitions, and share repurchases
18
$157
$121
$155
$124$140
$94 $85
$54$30
$28
$-$20 $40 $60 $80
$100 $120 $140 $160 $180
FYE08 FYE09 FYE10 FYE11 FYE12
Financing SegmentFinanced Assets Notes Payable
($ in millions)

© ePlus inc. E X C E L L E N C E T H R O U G H E X P E R I E N C E
Shareholder’s Equity and Share Price
+ Solid Financial Position (as of 9/30/2012) Shareholders’ equity: $238.7 million Book value: $29.54 per share Book value less goodwill: $25.98 per share
19
© ePlus inc. E X C E L L E N C E T H R O U G H E X P E R I E N C E
Investment Summary
20
+ Large addressable market CY 2012 forecast by Forrester Research: $1 trillion market for IT products and services
spending in U.S., 6.6% growth Highly fragmented: 50,000 potential middle market to larger companies with annual
revenues between $25 million and $2.5 billion+ Diversified customer base: commercial, federal, and state/local governments and educational institutions (“SLED”)
+ Differentiated business model serving entire IT lifecycle & process+ Key industry partnerships (Cisco, HP, Microsoft, IBM, VMware, EMC, NetApp)
+ Deep expertise in key technologies+ History of strong organic growth and successful acquisitions+ Solid balance sheet with significant tangible net worth+ National presence via direct sales force, supported by inside sales and telesales
+ Included in Russell 2000 ® Index and Russell 3000 ® Index
© ePlus inc. E X C E L L E N C E T H R O U G H E X P E R I E N C E
Contact Information
Kley Parkhurst, SVPePlus inc.(703) 984‐8150
ePlus inc.13595 Dulles Technology Drive
Herndon, VA 20171‐3413(703) 984‐8400www.eplus.com
21