Investor day-2016-final
110
TSX: YRI | NYSE: AUY True Value Proposition Investor Day January 14, 2016
-
Upload
yamanagold2016 -
Category
Investor Relations
-
view
357 -
download
0
Transcript of Investor day-2016-final

TSX: YRI | NYSE: AUY
True Value Proposition
Investor Day
January 14, 2016
Cautionary Note Regarding Forward-looking Statement
CAUTIONARY NOTE REGARDING FORWARD-LOOKING STATEMENTS: This presentation contains “forward-looking statements” within the meaning of the United States
Private Securities Litigation Reform Act of 1995 and applicable Canadian securities legislation. Except for statements of historical fact relating to the Company,
information contained herein constitutes forward-looking statements, including any information as to the Company’s strategy, plans or future financial or operating
performance. Forward-looking statements are characterized by words such as “plan,” “expect”, “budget”, “target”, “project”, “intend,” “believe”, “anticipate”,
“estimate” and other similar words, or statements that certain events or conditions “may” or “will” occur. Forward-looking statements are based on the opinions,
assumptions and estimates of management considered reasonable at the date the statements are made, and are inherently subject to a variety of risks and
uncertainties and other known and unknown factors that could cause actual events or results to differ materially from those projected in the forward-looking
statements. These factors include the Company’s expectations in connection with the expected production and exploration, development and expansion plans at the
Company’s projects discussed herein being met, the impact of proposed optimizations at the Company’s projects, the impact of the proposed new mining law in
Brazil and the impact of general business and economic conditions, global liquidity and credit availability on the timing of cash flows and the values of assets and
liabilities based on projected future conditions, fluctuating metal prices (such as gold, copper, silver and zinc), currency exchange rates (such as the Brazilian Real,
the Chilean Peso, the Argentine Peso, and the Mexican Peso versus the United States Dollar), possible variations in ore grade or recovery rates, changes in the
Company’s hedging program, changes in accounting policies, changes in mineral resources and mineral reserves, risk related to non-core mine dispositions, risks
related to acquisitions, changes in project parameters as plans continue to be refined, changes in project development, construction, production and commissioning
time frames, risk related to joint venture operations, the possibility of project cost overruns or unanticipated costs and expenses, higher prices for fuel, steel,
power, labour and other consumables contributing to higher costs and general risks of the mining industry, failure of plant, equipment or processes to operate as
anticipated, unexpected changes in mine life, final pricing for concentrate sales, unanticipated results of future studies, seasonality and unanticipated weather
changes, costs and timing of the development of new deposits, success of exploration activities, permitting time lines, government regulation and the risk of
government expropriation or nationalization of mining operations, environmental risks, unanticipated reclamation expenses, title disputes or claims, limitations on
insurance coverage and timing and possible outcome of pending litigation and labour disputes, as well as those risk factors discussed or referred to in the Company’s
current and annual Management’s Discussion and Analysis and the Annual Information Form for the year ended December 31st, 2014 filed with the securities
regulatory authorities in all provinces of Canada and available at www.sedar.com, and the Company’s Annual Report on Form 40-F for the year ended December
31st, 2014 filed with the United States Securities and Exchange Commission. Although the Company has attempted to identify important factors that could cause
actual actions, events or results to differ materially from those described in forward-looking statements, there may be other factors that cause actions, events or
results not to be anticipated, estimated or intended. There can be no assurance that forward-looking statements will prove to be accurate, as actual results and
future events could differ materially from those anticipated in such statements. The Company undertakes no obligation to update forward-looking statements if
circumstances or management’s estimates, assumptions or opinions should change, except as required by applicable law. The reader is cautioned not to place undue
reliance on forward-looking statements. The forward-looking information contained herein is presented for the purpose of assisting investors in understanding the
Company’s expected financial and operational performance and results as at and for the periods ended on the dates presented in the Company’s plans and
objectives and may not be appropriate for other purposes.
All amounts are expressed in United States dollars unless otherwise indicated.

Cautionary Note Regarding Mineral Reserves and Mineral
Resources
CAUTIONARY NOTE REGARDING MINERAL RESERVES AND MINERAL RESOURCES: Readers should refer to the Annual Information Form of the Company for the year
ended December 31, 2014 and other continuous disclosure documents filed by the Company since January 1, 2014 available at www.sedar.com, for further
information on mineral reserves and mineral resources, which is subject to the qualifications and notes set forth therein.
CAUTIONARY NOTE TO UNITED STATES INVESTORS CONCERNING ESTIMATES OF MINERAL RESERVES AND MINERAL RESOURCES
This Presentation has been prepared in accordance with the requirements of the securities laws in effect in Canada, which differ in certain material respects from
the disclosure requirements of United States securities laws. The terms “mineral reserve”, “proven mineral reserve” and “probable mineral reserve” are Canadian
mining terms as defined in accordance with Canadian National Instrument 43-101 Standards of Disclosure for Mineral Projects (“NI 43-101”) and the Canadian
Institute of Mining, Metallurgy and Petroleum (the “CIM”) - CIM Definition Standards on Mineral Resources and Mineral Reserves, adopted by the CIM Council, as
amended. These definitions differ from the definitions in the disclosure requirements promulgated by the Securities and Exchange Commission (the “Commission”)
and contained in Industry Guide 7 (“Industry Guide 7”). Under Industry Guide 7 standards, a “final” or “bankable” feasibility study is required to report mineral
reserves, the three-year historical average price is used in any mineral reserve or cash flow analysis to designate mineral reserves and the primary environmental
analysis or report must be filed with the appropriate governmental authority.
In addition, the terms “mineral resource”, “measured mineral resource”, “indicated mineral resource” and “inferred mineral resource” are defined in and required
to be disclosed by NI 43-101. However, these terms are not defined terms under Industry Guide 7 and are not permitted to be used in reports and registration
statements of United States companies filed with the Commission. Investors are cautioned not to assume that any part or all of the mineral deposits in these
categories will ever be converted into mineral reserves. “Inferred mineral resources” have a great amount of uncertainty as to their existence, and great
uncertainty as to their economic and legal feasibility. It cannot be assumed that all or any part of an inferred mineral resource will ever be upgraded to a higher
category. Under Canadian rules, estimates of inferred mineral resources may not form the basis of feasibility or pre-feasibility studies, except in rare cases.
Investors are cautioned not to assume that all or any part of an inferred mineral resource exists or is economically or legally mineable. Disclosure of “contained
ounces” in a mineral resource is permitted disclosure under Canadian regulations. In contrast, the Commission only permits U.S. companies to report mineralization
that does not constitute “mineral reserves” by Commission standards as in place tonnage and grade without reference to unit measures.
Accordingly, information contained in this Presentation may not be comparable to similar information made public by U.S. companies subject to the reporting and
disclosure requirements under the United States federal securities laws and the rules and regulations of the Commission thereunder.

Peter Marrone Chairman and CEO

Presentation Agenda
5
o Welcome and Introduction
Peter Marrone
o Health, Safety and Sustainable Development
Ross Gallinger
o Strategy and Overview
Peter Marrone
Charles Main
o Operations and Projects
Gerardo Fernandez
William Wulftange
Gil Clausen
Daniel Racine
Barry Murphy
o Balance Sheet Review
Charles Main
Jason LeBlanc

HEALTH, SAFETY and SUSTAINABLE
DEVELOPMENT

Ross Gallinger Health, Safety and Sustainable Development

Health, Safety, Environment and
Community(HSEC) - Overview
8
Strong Vision
A Zero Harm vision to focus Yamana’s HSEC management approach
Supported by a cost-conscious, performance-drive strategy that focuses on risk management, governance, people development and strategic support for operations.
Strong Resources
Experienced, professional HSEC staff at operations, regions and corporate
Established policies for Heath and Safety, Environment and Community
Employee Code of Conduct covering HSEC, ethical conduct, human rights
Strong Performance
HSEC Management System in place for 10 years – System evaluation in 2016
Independently assessed standards, including the Conflict-Free Gold Standard
Risk assessment, risk management and crisis plans across operations

Yamana operated sites have a
management system conforming to
OHSAS 18001
Injury statistics comparable to
industry peers (assessed on an
annual basis)
Basic industrial hygiene program
established (ie noise, dust)
2014 - Chapada awarded Best
Practices in Occupational Health and
Safety in Emergency Responses and
in Effective Systems for Worker
Training, by Brazilian Mining Institute
2015 El Peñón – National Safety
Award from the Chilean Safety
Association
9
Health and Safety
Year to date is as of November 2015

International Cyanide Management Institute Cyanide Code signatory; audited verification at each operation
Yamana operated sites have a management system conforming to ISO 14001
Programs in place for energy conservation and greenhouse gas reduction
Water management programs established to maximize recycle, minimize fresh water use and decrease discharges
Environmental impact assessments conducted for new operations and significant expansions
Waste reduction and waste management established
Monitoring programs in place for air quality, surface and ground water, terrestrial and aquatic environment
Dedicated Corporate Manager actively reviewing Tailings Management to ensure safety and integrity of facilities
10
Environment

Community
Social License continuously monitored and evaluated at operations
Management approach is to maintain consistent, proactive and transparent dialogue with communities with mix of formal and informal meetings
Actively maintained grievance mechanisms ensure timely responses and helps abate potential future grievances
Yamana contributes to host communities through direct community investment, local supplier programs and extensive employee volunteering by operations
In Canada, positive relationships with Aboriginal communities and working towards the establishment of impact benefit agreements for exploration and project development
11 Named Best 50 Corporate Citizens by Corporate Knights – 3rd consecutive year

STRATEGY and OVERVIEW

Peter Marrone Chairman and CEO
14
Value Chain

Strategic Focus
15
Protect Downside and Plan for Upside
Streamline Organizational Structure
Improve Quality of Management Especially in
– Exploration: LifeBlood of Mining is New Ounces: Bringing those Ounces to
Production
– Operations: Efficiently and Effectively Mining those Ounces
– Health, Safety, Communities and Environment: Protecting Our People
from Harm and Damage
Improve Mine Plans and Deliver Production at Reasonable and Improving
Costs
Increase Production and Better Costs
Spend Exploration Funds on Identified Ore Bodies or Areas of Known
Mineralization
Focus Exploration, Development and Operations on Cash Flow
Generation and Increasing Free Cash Flow
Improve Balance Sheet
Deliver Value to Shareholders

Frequently Asked Questions: Defining Our Company
16
“We take a portfolio approach to our business. Every mine and asset in the
portfolio is evaluated based on it’s production, costs, potential and planned
returns. We are agnostic on assets as we strive to create value: we set key
performance indicators and expect our assets, particularly our mines, to meet
these. This implies that an asset may be sold if we conclude it is not meeting
the key performance indicators. This is not to say that it does not have value,
rather that it has more value to someone else than to us and the sales proceeds
can be better applied to our other assets. We will exercise patience and
maintain discipline although we will also be flexible as opportunities and risks
are assessed. We strive to balance ourselves across the jurisdictions in which we
operate. We have one of the better balanced portfolios of mines and non-
producing assets carrying significant value and opportunity for organic growth
and, where appropriate, monetization.”
? How Do We Manage Our Business (Portfolio Approach)?

17
“We are in five high quality countries for mining. We are an Americas focused
company. Do not expect us to migrate beyond the Americas. Our focus is North
and South America. Our focus is also to be in places that are mining friendly
with established mining pedigrees. We also look to have enough critical mass in
any particular jurisdiction to be relevant in that jurisdiction. Our view is that
risk is better managed and mitigated in established mining jurisdictions.”
What is our Jurisdictional Approach? ?
Frequently Asked Questions: Defining Our Company

18
?
“This is difficult to define because while size and scale matter, they are not
the only criteria to distinguish Core and Non-Core. Generally, we look at a
balance among size and scale, cost, location, opportunity for development and
improvement. In addition, we evaluate the amount of management time
needed as compared to the value, potential and opportunity. The important
point, going back to the portfolio approach, is that Non-Core Assets, in the
right circumstances, will be monetized. We will always strive to maximize the
value we can get for our assets, including Non-Core assets up for sale. Equally,
we will be flexible and look to improve our view: is an asset carry more value
in the portfolio or if sold?”
What is Core and Non-Core?
Frequently Asked Questions: Defining Our Company

19
?
“We struck a deal in late 2015 that was at a point properly balancing reasonable
value to us and expediency. We did not get the deal we wanted. We recognized
that the deal we struck was at that tipping point of that balance, below which
we would not go. We recognize that the Brio Gold division carried considerably
more value than was on offer in the deal although the deal was on the right
side of reasonable and it was fast tracked. We refused to entertain anything on
the wrong side of that balance, below the deal value. Since then, we have had
to seriously consider if we should sell these assets at all. In late 2014, we set
out to improve the assets in a way that did not distract management from the
core business. We also felt that these assets were taking more management
time than the value of the assets could justify. Since then, they have been
improved with quality production, low cost, increased cash flow and EBITDA
generation, improved resource models, mine plans and increased mine lives,
now requiring a more measured amount of management time. They may be
transitioning from Non-Core.”
Why Have We Not Sold Brio Gold Division? And Should We Sell It Or Keep It?
Frequently Asked Questions: Defining Our Company
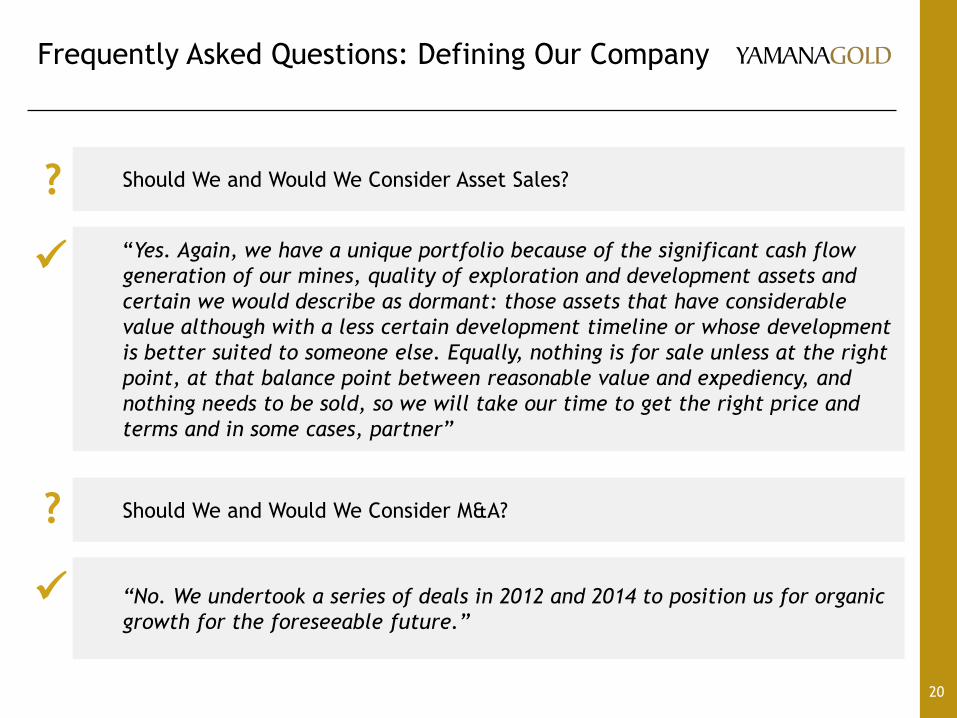
20
?
“Yes. Again, we have a unique portfolio because of the significant cash flow
generation of our mines, quality of exploration and development assets and
certain we would describe as dormant: those assets that have considerable
value although with a less certain development timeline or whose development
is better suited to someone else. Equally, nothing is for sale unless at the right
point, at that balance point between reasonable value and expediency, and
nothing needs to be sold, so we will take our time to get the right price and
terms and in some cases, partner”
Should We and Would We Consider Asset Sales?
Should We and Would We Consider M&A?
“No. We undertook a series of deals in 2012 and 2014 to position us for organic
growth for the foreseeable future.”
Frequently Asked Questions: Defining Our Company
?

21
?
How Are We Positioned For Growth Internally?
“We are exceptionally well positioned for organic growth with Cerro Moro,
Chapada expansion, Canadian Malartic developments, Deep Carbonates project,
Monument Bay project and Kirkland Lake opportunities. More on that will
follow.”
Frequently Asked Questions: Defining Our Company

22
?
“We did not meet the challenges of several development stage projects which
ran over budget and well beyond planned start-up. We got caught in the
whirlwind of a robust mining cycle particularly in Brazil that created systemic
challenges with all projects, not only our projects. That systemic issue
intersected with several organic issues including a bureaucratic and over
centralized management and insufficient project evaluation. As importantly, we
did not realize early enough that we were challenged in development skills and
depth. In that context, we also spent more than planned and failed to generate
cash flow from these projects to cover the expenditure and generate a return.
Finally, we borrowed on our revolving credit facility as the robust cash flow
from our producing mines was insufficient to cover this additional burden.
However, we also produced according to plan at our producing mines, generated
robust cash flow from those mines, acquired Canadian Malartic to bolster our
production and cash flows and began a program of quality enhancement, quality
assurance and quality management. On the challenges of those Brazilian
development stage projects, we also began their rehabilitation.”
What Happened in 2014?
Frequently Asked Questions: Defining Our Company

23
?
“This was a transition year. We solidified our management and organization,
improved our operations, established better practices for evaluation of
projects, advanced several development projects and plans, including Cerro
Moro, and improved our balance sheet. We were within our production range
and our core mines had lowest quartile costs. We improved those assets in the
Brio Gold division. We positioned ourselves for continuing operational
performance into 2016 and future years”
What Happened in 2015?
Frequently Asked Questions: Defining Our Company

24
?
“We have streamlined our operations and management, improved our core
management particularly in exploration, development, operations and health and
safety. We have improved our resource models and mine plans and we have given
ourselves more time for evaluation and development. This is true for projects as
well as development at existing mines. We have also given due attention to
important health, safety, environmental and sustaining protocols so as to earn,
maintain and benefit from our social license. It is not a coincidence that this
leads to better dialogue over permitting. Finally, we have undertaken a program
of improved and often complete engineering before undertaking the heavy lifting
on a project, expansion, development or plan.”
Why Are We Confident In Our Production and Production Growth Plans?
Frequently Asked Questions: Defining Our Company

25
?
“We believe that it is important to maintain financial strength and flexibility.
As part of this philosophy we believe that a revolving credit facility should be
used only as a short-term financing tool. We are targeting a zero balance for
this. In addition, we renegotiate on an annual basis to maintain a five year
term. The tenor of debt is well positioned and balanced for repayment over the
long term. With respect to Long Term Debt Ratios, on a normalized basis we
believe that a Debt/EBITDA level in the range of 1.5 to 2.0 times is prudent.
The balance sheet is managed through a combination of actions including, first
and foremost, generating Free Cash Flow.”
What Is Our Approach to Debt and Balance Sheet Management?
Frequently Asked Questions: Defining Our Company

26
?
“Cash Flow after non-discretionary items define Free Cash Flow. Expansionary
capital is deducted to determine Free Cash Flow when it is committed and,
based on any change in circumstances, cannot be reduced or withdrawn. Free
Cash Flow is before Dividends as Dividends are, and should be, paid only from
residual Free Cash Flow after all other items including committed capital.”
How Do We Define Free Cash Flow?
Frequently Asked Questions: Defining Our Company
?
“The generation of Free Cash Flow drives our strategy with respect to capital
spending. Production growth in effect can be the result of capital spending. In
more challenging markets, hurdle rates for new projects tend to increase and
targeted growth will or may be sacrificed for financial stability in
circumstances where it would increase Free Cash Flow. ”
How Do We Balance Production Growth, Capital Spending and Free Cash Flow?

Charles Main Finance

2016-2018 Expectations
Gold Production
28
2015E 2016 2017 2018
Gold Ounces
Chapada 119k 116k – 122k 110k 90k
El Peñón 227k 235k – 250k 245k 245k
Canadian Malartic (50%) 286k 280k – 290k 300k 305k
Gualcamayo 181k 150k – 165k 155k 150k
Mercedes 84k 85k – 90k 88k 82k
Minera Florida 113k 110k – 115k 110k 110k
Jacobina 96k 110k – 115k 120k 130k
Brio Gold 144k 148k – 158k 165k 163k
Pilar 83k 85k – 90k 100k 98k
Fazenda Brasileiro 61k 63k – 68k 65k 65k
Cerro Moro - - - 76k
Total Yamana 1.275M(1) 1.23M – 1.31M 1.29M 1.35M
Continue to project year over year gold production growth
(1) Includes 25k oz from Alumbrera

2016-2018 Expectations
Silver and Copper Production
29
2015E 2016 2017 2018
Silver Ounces
Chapada 274k 270k - 278k 270k 245k
El Peñón 7.693M 5.8M – 6.0M 5.8M 6.0M
Mercedes 383k 345k – 365k 355k 335k
Minera Florida 661k 500k – 530k 515k 525k
Cerro Moro - - - 3.347M
Total Yamana 9.0M 6.9M – 7.2M 6.9M 10.5M
2015E 2016 2017 2018
Copper Pounds
Chapada 131M 122M – 125M 122M 115M
Significant revenue contribution from copper and silver; meaningful silver production
increase in 2018
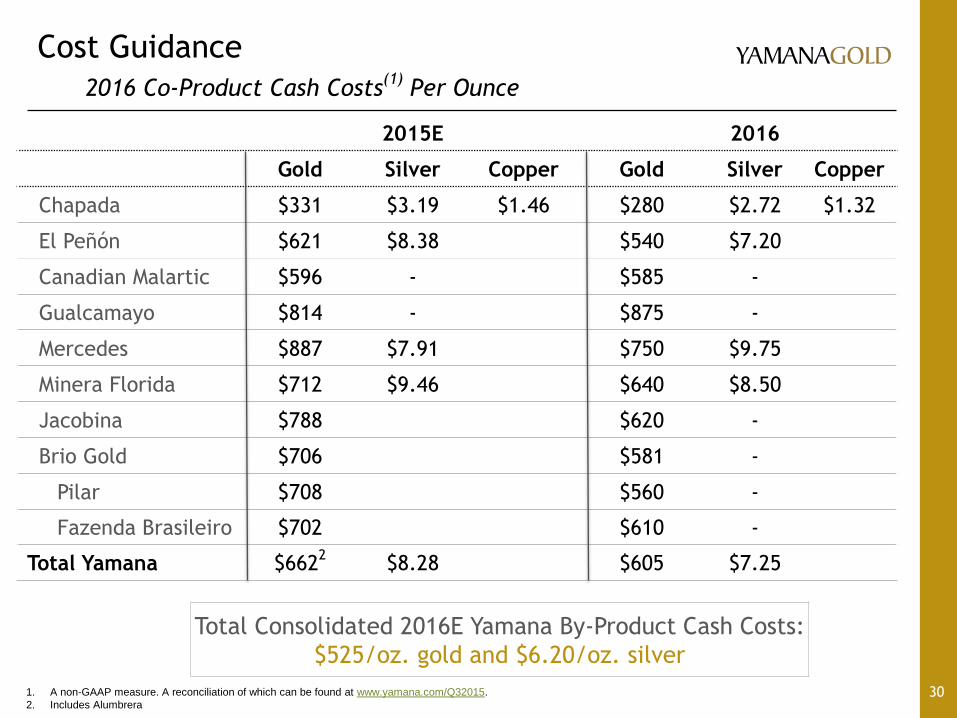
Cost Guidance
2016 Co-Product Cash Costs(1)
Per Ounce
30 1. A non-GAAP measure. A reconciliation of which can be found at www.yamana.com/Q32015.
2. Includes Alumbrera
2015E 2016
Gold Silver Copper Gold Silver Copper
Chapada $331 $3.19 $1.46 $280 $2.72 $1.32
El Peñón $621 $8.38 $540 $7.20
Canadian Malartic $596 - $585 -
Gualcamayo $814 - $875 -
Mercedes $887 $7.91 $750 $9.75
Minera Florida $712 $9.46 $640 $8.50
Jacobina $788 $620 -
Brio Gold $706 $581 -
Pilar $708 $560 -
Fazenda Brasileiro $702 $610 -
Total Yamana $6622
$8.28 $605 $7.25
Total Consolidated 2016E Yamana By-Product Cash Costs:
$525/oz. gold and $6.20/oz. silver
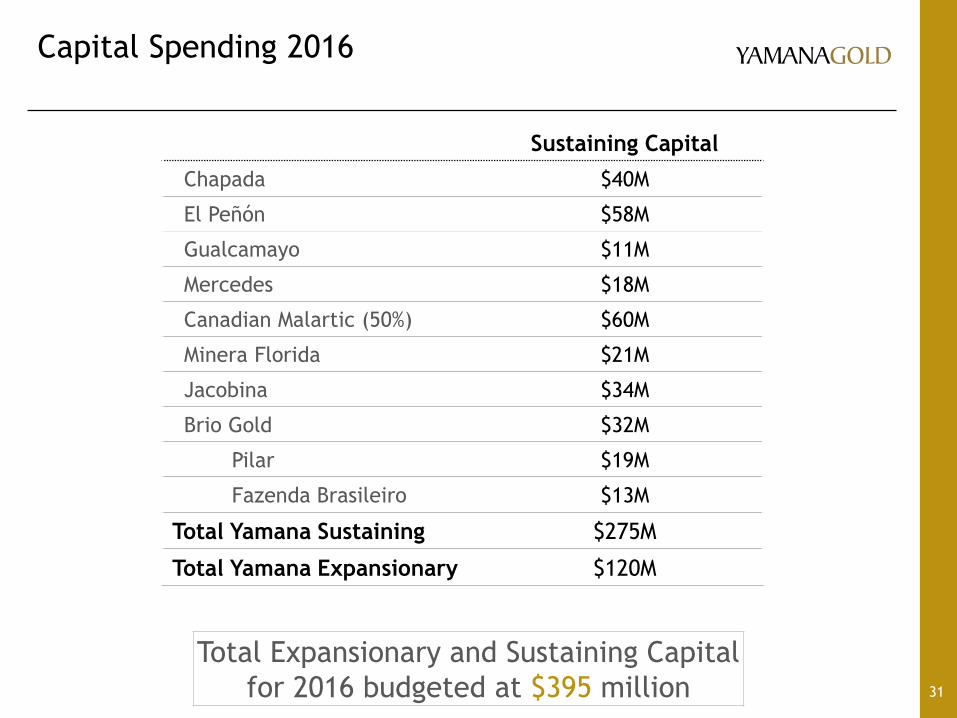
Capital Spending 2016
31
Sustaining Capital
Chapada $40M
El Peñón $58M
Gualcamayo $11M
Mercedes $18M
Canadian Malartic (50%) $60M
Minera Florida $21M
Jacobina $34M
Brio Gold $32M
Pilar $19M
Fazenda Brasileiro $13M
Total Yamana Sustaining $275M
Total Yamana Expansionary $120M
Total Expansionary and Sustaining Capital
for 2016 budgeted at $395 million

Exploration Spending 2016
Budget Set at $82M
32
Chapada 8%
El Peñón 34%
Gualcamayo 6% Mercedes
3%
Canadian Malartic (50%)
10%
Minera Florida 10%
Jacobina 7%
Pilar 6%
Fazenda Brasileiro
3%
C1 Santa Luz 3%
Monument Bay 4%
Cerro Moro 6%
• Chapada - $6M
• El Penon - $24M
• Minera Florida - $7M
• Mercedes - $2M
• Gualcamayo - $4M
• Cerro Moro - $4M
• Jacobina - $5M
• Brio Gold
• Pilar - $4M
• Fazenda Brasileiro - $2M
• C1 Santa Luz - $2M
• Canadian Malartic Corporation - $7M
• Monument Bay - $3M
• Other – Projects, Land Costs, and Overhead - $12M
*Approximately 70% of exploration spending is expected to be capitalized

Co-Product Site Level AISC Guidance
2016 AISC(1)
Per Ounce
33 1. A non-GAAP measure. A reconciliation of which can be found at www.yamana.com/Q32015.
2. Includes cash costs, corporate general and administrative expense, sustaining capital and exploration expense
Gold Silver Copper/
lb.
Chapada $350 $3.35 $1.60
El Peñón $730 $10.00
Canadian Malartic $800 -
Gualcamayo $940 -
Mercedes $935 $12.15
Minera Florida $825 $11.00
Jacobina $915 -
Brio Gold $781 -
Pilar $760 -
Fazenda Brasileiro $810 -
Total Consolidated Yamana
Co-Product AISC(2):
$840/oz. gold and $10.75/oz. silver
Co-Product Site
Level AISC:
cash costs (incl.
site level G&A),
sustaining capital
and exploration
expense
Targeted Consolidated Yamana
By-Product AISC(2):
$800/oz. gold and $10.20/oz. silver

AISC1,2
Calculation Breakdown
For Illustration Purposes
34
1. A non-GAAP measure. A reconciliation of which can be found at www.yamana.com/Q32015. By-product costs based on budget of $2.25/lb copper for 2016.
2. Includes cash costs, sustaining capital, corporate general and administrative expense, and exploration expense.
3. Exclude share based compensation of approximately $15M.
4. Numbers may not add due to rounding and approximations.
Gold Silver Total
Production Costs
2016E By-Product Cash Cost1 per Oz $525 $6.20 N/A
2016E Production Mid-Point (Oz) 1.27M 7.04M N/A
2016E Total By-Product Cash Costs $667M $44M $711M
Other Components Based on Revenue
Contribution by Metal
Revenue Input Assumption (per Oz) $1,100 $14.75 N/A
Revenue Split 93% 7% 100%
Sustaining Capital $255M $19M $275M
Exploration Expense (~30% of total spend) $23M $2M $25M
Corporate G&A3, excluding share-based comp $79M $6M $85M
Total AISC $1,024M $72M $1,096M
Total Consolidated By-Product AISC per Oz $805 $10.20 N/A

Cash Cost Allocation Methodology
35
Prior Period
Spot Price
($)
Period
Production
(units)
Contribution ($)
x
x
Gold
Silver
=
=
# of Oz
# of Oz
Gold
Silver
Total $ Contribution
/
/
Total
Total
Gold
Silver
100%
=
=
Contribution (%)
Non-commodity specific costs allocated to metal based on the relative value of revenue as illustrated above
Chapada non-commodity-specific costs are split 80% to copper and 20% to gold/silver for co-product costs. Overseas transport costs are allocated 100% to copper.

Budget Assumptions and Input Sensitivities
36
Base Assumption Change
2016 Impact
Operating Cash
Flow AISC/oz Au(1)
Gold (US$/oz) 1,100 $50 $48M n/a
Silver (US$/oz) 14.75 $1.00 $5M n/a
Copper (US$/lb) 2.25 $0.25 $22M n/a
C$/US$ 1.35 5% $7M $8
CLP/US$ 725 5% $7M $8
BRL/US$ 4.20 5% $10M $9
ARS/US$ 15.00 5% $2M $2
MXN/US$ 17.00 5% $2M $2
Percent of Costs in Local Currency
Chapada Jacobina El Peñon Minera
Florida
Canadian
Malartic Gualcamayo Mercedes Brio Gold
Opex 84% 95% 79% 83% 76% 37% 70% 80%
Capex 60% 86% 57% 48% 76% 14% 33% 90%
1. All-in sustaining cash costs Includes cash costs, sustaining capital, corporate general and administrative expense, and exploration expense.

Other Guidance
37
2016 Guidance
Corporate General & Administrative Expenses
Cash based G&A: $85M
Non-cash based G&A: $15M
Total G&A: $100M
Tax Expense Total: $90M
Cash tax expected to be ~$50M
Depreciation, Depletion & Amortization $570M
DD&A per Unit $372/oz Au
$5.22/oz Ag
$0.30/lb Cu
Note: In December of 2015, the newly elected Argentinian government reduced the rate for export duty
(charged on gross revenues) from 5% to nil.

Quarterly Trend for 2016
38
0
60
120
180
240
300
360
Ounces
000s
Gold Production
0
5
10
15
20
25
30
35
40
Pounds
M
Copper Production
Q1 Q2 Q3 Q4
Chapada and Canadian Malartic account for most of the difference from Q1 to Q4: large, open pit
mines that are seasonally affected

OPERATIONS and PROJECTS

Gerardo Fernandez Southern Operations

Chapada
2016 Expectations
41
2016 Production
Tonnes Processed (000s) ±21,400
Strip Ratio (operating) 1.3
Grade – gold (g/t)
- copper (%)
0.29
0.32%
Recovery – gold
- copper
59%
83%
Production – gold (000s)
- copper (M lbs)
116 to 122
122 to 125
Cost
Outlook Cash Cost(1,2) AISC(3)
2015E $331/Oz Gold
$1.46/lb Copper
$415/Oz Gold
$1.77/lb Copper
2016E $280/Oz Gold
$1.32/lb Copper
$350/Oz Gold
$1.60/lb Copper
0
20
40
60
80
100
120
140
2015E 2016E 2017E 2018E
Production
Gold (koz) Copper (Mlbs)
2016 Costs
Mine $/t milled 3.60
Plant $/tonne 2.60
G&A & Other(4) $/tonne 3.00
Total $/tonne 9.20
17% 8%
5%
21% 32%
6% 11%
2016 Cash Cost Breakdown
Consumables Labour MaintenanceOther Contractors PowerFuel
1. Cash costs on a co-product basis.
2. A non-GAAP measure. A reconciliation of which can be found at www.yamana.com/Q32015.
3. Includes cash costs, sustaining capital, site G&A expense, and exploration expense.
4. Includes TC/RCs

Short Term (Minimum Capex)
• Operational improvements including productivity increases at the mine and processing plant, OEE, tonnes/h, and recoveries for gold and copper
• External expenditures reduction including enhanced supply chain management
Medium Term (Modest Capex)
• Debottlenecking and improvements • Flotation circuit retrofit scheduled for Q2 2016, expected to increase recoveries
by 2% • MMD bypass scheduled for Q1 2017, expected to increase throughput by 2% • Improve production profile with near mine discoveries
Long Term
• Throughput Expansion project • Oxides inventory assessment • Sucupira and Santa Cruz, other near mine targets
0
Execution • Significant upside for the short and medium term with modest investment • Lean management implementation; McKinsey engaged • “Desafia” (Challenge) program: External expense, Productivity, Recovery
Chapada Opportunities
Maximize cash flow generation and develop future growth
42 Optimizations and exploration upside demonstrate potential for further value creation

Chapada Exploration – Near Mine
$6M – 26k drill metres
43
• Delineation of Sucupira
• Test Near Mine targets
• Interpits, Santa Cruz, HW
Corpo Sul, Flanco Leste,
Suruca W, Sucupira
Structure, Hidrothermalito
NM122
EXTENSION
FAR SW
2016 RESOURCE
DELINEATION POTENTIAL
1,400m
Main Goals
• Increase resources at Sucupira
• Advance Near Mine targets
• New Discovery
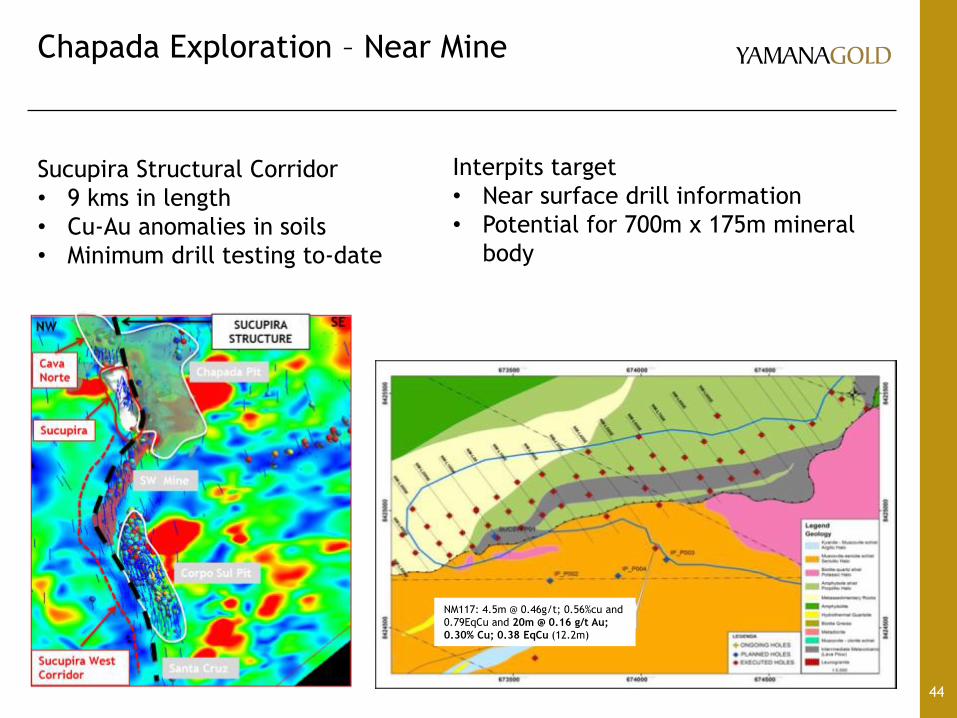
Chapada Exploration – Near Mine
44
NM117: 4.5m @ 0.46g/t; 0.56%cu and
0.79EqCu and 20m @ 0.16 g/t Au;
0.30% Cu; 0.38 EqCu (12.2m)
Sucupira Structural Corridor
• 9 kms in length
• Cu-Au anomalies in soils
• Minimum drill testing to-date
Interpits target
• Near surface drill information
• Potential for 700m x 175m mineral
body

El Peñón
2016 Expectations
45 1. A non-GAAP measure. A reconciliation of which can be found at www.yamana.com/Q32015.
2. Includes cash costs, sustaining capital, site G&A expense, and exploration expense.
2016 Production
Tonnes Processed (000s) ±1,500
Grade – gold (g/t)
- silver (g/t)
5.41
156.7
Recovery – gold
- silver
94%
78%
Production – gold (000s)
- silver (000s)
235 to 250
5,800 to 6,000
2016 Costs
Mine $/t milled 72.00
Plant $/tonne 28.00
G&A & Other $/tonne 16.00
Total $/tonne 116.00
0.0
1.0
2.0
3.0
4.0
5.0
6.0
7.0
8.0
9.0
0
50
100
150
200
250
300
2015E 2016E 2017E 2018E
Production
Gold (koz) Silver (Moz - right axis)
9%
29%
5% 10%
37%
7% 2%
2016 Cash Cost Breakdown
Consumables Labour MaintenanceOther Contractors PowerFuel
Cost
Outlook Cash Cost(1) AISC(2)
2015E $621/oz gold
$8.38/oz silver
$792/oz gold
$10.67/oz silver
2016E $540/oz gold
$7.20/oz silver
$730/oz gold
$10.00/oz silver

Short Term (Minimum Capex)
• Continue improving operation efficiency • Increase mine productivity by 5% in 2016 - increase in production or cost
reductions • Continue contract negotiations and internal demand control • Improve maintenance performance and costs • Cost reduction compared to 2014 equals $15M a year
Medium Term (Modest Capex)
• Increase recoveries project • 5% increase in silver recover rates • +0.5% gold recovery
• Near mine veins brought into production including Ventura • Mine development ongoing and exploration drilling
Long Term
• Target new discovery in the North Block. • Budget of $24M and 166,000 metres of drilling per year
0
Execution • Focus on capturing short term gains in operations • Continue exploration strategy to extend mine life • Promptly bring into production near mine discoveries
El Peñón Opportunities
Maximize cash flow generation and develop future growth
46 Optimizations and exploration upside demonstrate potential for further value creation

El Peñón Exploration
$24M – 166k drill metres
47
2016 Budget : $24.1M ($20M Capex;
$4.1M Opex).
Objective: 528K GEO (M+I); 420K GEO
(Inf); 200k GEO(Geologic Potential).
166,000m of drilling focussed on :
30,000m of Distrital exploration
drilling in Targets: Tres Tontos W,
Cerro Pampa Providencia and Borde
Norte.
70,000m of exploration drilling in
near Mine Targets: Ventura,
Corredor and Dorada Sur Blocks.
66,000m of infill drilling to
upgrade resources to reserves, and
delineation (production) drilling in
Ventura, Corredor and Dorada Sur
Blocks.
Strategy: (1),Continue to extend
known veins; (2), discover new veins
near the mine; and (3), upgrade
resources to support production plans
and SLOM.

El Peñón Exploration and Infill
Targeting: Potential of 720koz of gold and 8M+oz of silver
48
VENTURA
LA PALOMA
DORADA
SUR
ALESTE SUR SUR
BONANZA
ESTE
ABUNDANCIA
W
BORDE OESTE
Exploration Target Areas Infill Target Areas
• Potential – 700k ounces Au
- 8M ounces Ag
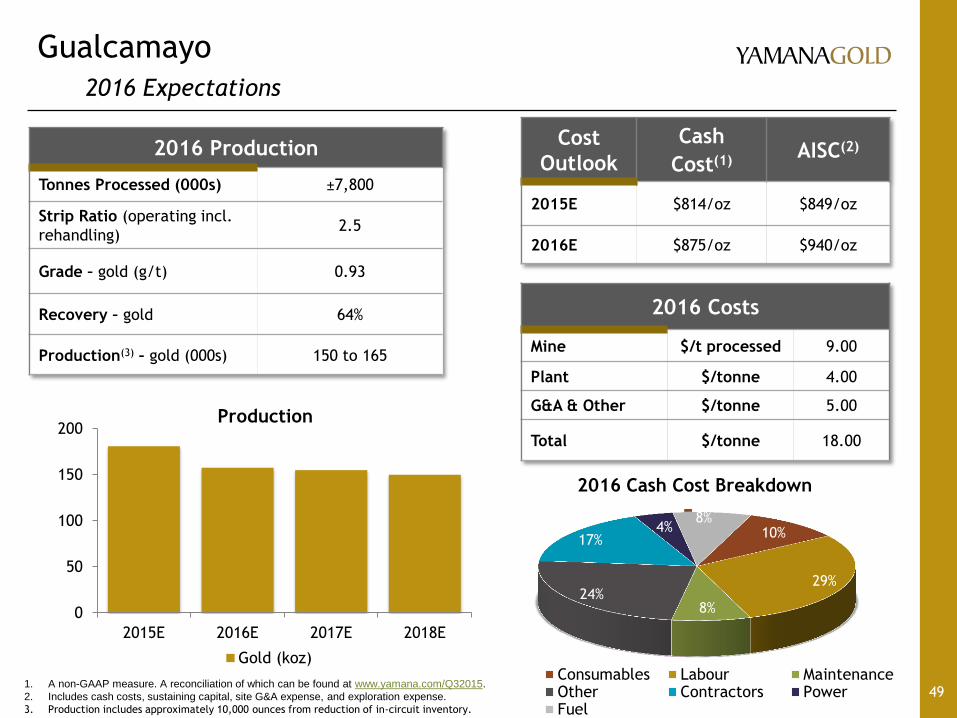
Gualcamayo
2016 Expectations
49
2016 Production
Tonnes Processed (000s) ±7,800
Strip Ratio (operating incl.
rehandling) 2.5
Grade – gold (g/t) 0.93
Recovery – gold 64%
Production(3) – gold (000s) 150 to 165
0
50
100
150
200
2015E 2016E 2017E 2018E
Production
Gold (koz)
10%
29%
8% 24%
17% 4%
8%
2016 Cash Cost Breakdown
Consumables Labour MaintenanceOther Contractors PowerFuel
2016 Costs
Mine $/t processed 9.00
Plant $/tonne 4.00
G&A & Other $/tonne 5.00
Total $/tonne 18.00
Cost
Outlook
Cash
Cost(1) AISC(2)
2015E $814/oz $849/oz
2016E $875/oz $940/oz
1. A non-GAAP measure. A reconciliation of which can be found at www.yamana.com/Q32015.
2. Includes cash costs, sustaining capital, site G&A expense, and exploration expense.
3. Production includes approximately 10,000 ounces from reduction of in-circuit inventory.

Short Term (Minimum Capex)
• Improve contract and service terms to reduce external expenditures • Improve heap leach inventory balance with 10koz reduction in 2016 • Underground
• Optimizing mine plan in 2016 for grade • Improve productivity in SLC
Medium Term (Modest Capex)
• Increase oxide resources • Drilling strategy for 2016 in adjacent surface deposits • Increase resources UG at QDDLW • Optimize ore recovery from remaining resources around OP and UG
Long Term
• Las Vacas oxide target to expand mine life • Deep Carbonates project update
0
Execution • ADR expansion project completed and operating • Mine plan optimization ongoing • Comprehensive exploration program for oxides
Gualcamayo Opportunities
Build on production base extending mine life
50 Good exploration upside in oxides to extend mine life

Gualcamayo Exploration and Infill
$4M – 18k drill metres
51
QDD – 5.5k metres
• Infill main pit
• Test for deep extension and targets
proximal to the current pit.
QDDLW – 2.5k metres
• Extend to the east
AIM – 3.0k metres
• Test potential of surficial targets
Las Vacas – 7k metres
• Discover a new deposit – Geophysical
targets
• Infill of known surface mineral body,
• Geometallurgical characterization

Gualcamayo Exploration and Infill
Las Vacas
52

Minera Florida
2016 Expectations
53
2016 Production
Tonnes Processed (000s) ±1,900
Grade – gold (g/t)
- silver (g/t)
2.23
16.1
Recovery – gold
- silver
82%
53%
Production – gold (000s)
- silver (000s)
110 to 115
500 to 530
2016 Costs
Mine(3) $/t milled 17.70
Plant $/tonne 20.50
G&A & Other $/tonne 2.10
Total $/tonne 40.30
16%
24%
6% 11%
31%
10% 1%
2016 Cash Cost Breakdown
Consumables Labour MaintenanceOther Contractors PowerFuel
0
20
40
60
80
100
120
0
200
400
600
800
2015E 2016E 2017E 2018E
Production
Silver (koz) Gold (koz - right axis)
Cost
Outlook Cash Cost(1) AISC(2)
2015E $712/oz gold
$9.46/oz silver
$884/oz gold
$11.74/oz silver
2016E $640/oz gold
$8.50/oz silver
$825/oz gold
$11.00/oz silver
1. A non-GAAP measure. A reconciliation of which can be found at www.yamana.com/Q32015.
2. Includes cash costs, sustaining capital, site G&A expense, and exploration expense.
3. Includes impact of tailings processing which has no associated mining costs.

Short Term (Minimum Capex)
• Reduce dilution improving drilling and blasting controls • Improve productivity at the mine with LEAN • Improve recoveries with enhanced process controls
Medium Term (Modest Capex)
• Increase zinc production • Increase treatment capacity to increase net recoveries • Improve third party ore agreements and/or replace with new discoveries at
the mine (near mine exploration upside)
Long Term
• Significant exploration upside • Continue development of Tribuna and Lorena corridors as well as core mine • Incorporate new zones into the production plan in the medium term
0
Execution • Start implementation of LEAN in Q1 • Continue aggressive exploration program • Consolidate land position
Minera Florida Opportunities
Production growth through exploration upside
54 Stable operation, with significant upside for growth

Minera Florida Exploration
$7M – 20k drill metres
55
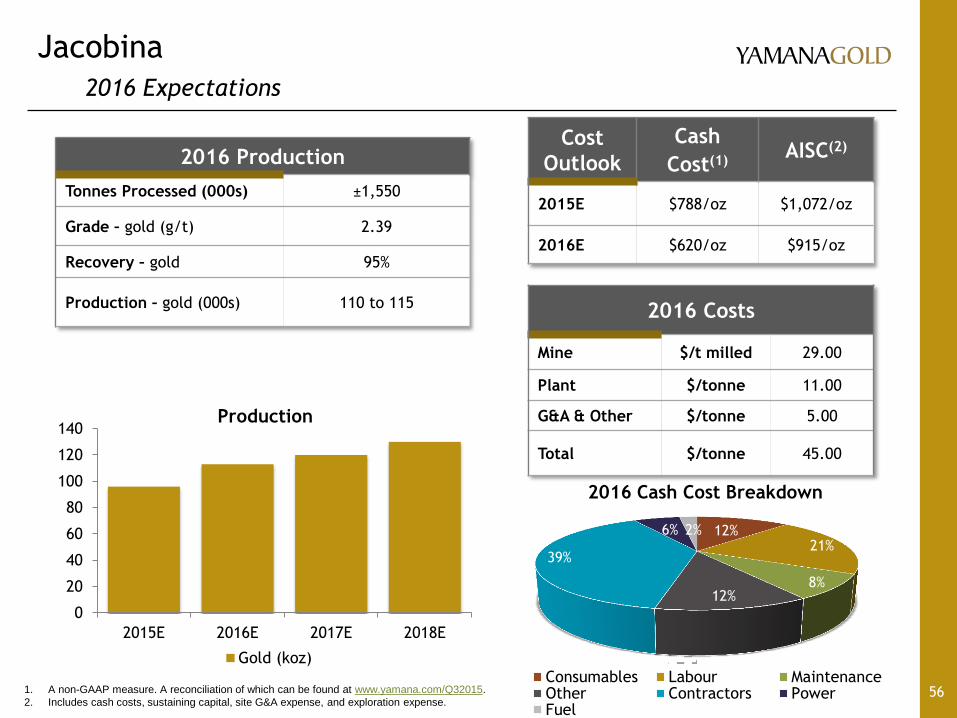
Jacobina
2016 Expectations
56
12% 21%
8% 12%
39%
6% 2%
2016 Cash Cost Breakdown
Consumables Labour MaintenanceOther Contractors PowerFuel
2016 Costs
Mine $/t milled 29.00
Plant $/tonne 11.00
G&A & Other $/tonne 5.00
Total $/tonne 45.00
2016 Production
Tonnes Processed (000s) ±1,550
Grade – gold (g/t) 2.39
Recovery – gold 95%
Production – gold (000s) 110 to 115
0
20
40
60
80
100
120
140
2015E 2016E 2017E 2018E
Production
Gold (koz)
Cost
Outlook
Cash
Cost(1) AISC(2)
2015E $788/oz $1,072/oz
2016E $620/oz $915/oz
1. A non-GAAP measure. A reconciliation of which can be found at www.yamana.com/Q32015.
2. Includes cash costs, sustaining capital, site G&A expense, and exploration expense.

Jacobina Opportunities
Turn around continues, growth upside
57 Improved performance with large resource base and upside for growth
Short Term (Minimum Capex)
• Continue delineation drilling improving ore body knowledge • Continue improving grade control and dilution • Improve productivity and reduce maintenance costs through implementation
of LEAN • External expense s reduction in services and supplies
Medium Term (Modest Capex)
• Improve automation in the mine to improve work time • Near mine geological upside and positive results in delineation drilling • Increase plant recoveries and mine throughput to support growth in production
Long Term
• Exploration targets in deep Main Reef and CAN with higher grades
0
Execution • Focus on mine development and delineation drilling on time • Reduction of costs and increase in productivity

Jacobina Exploration – Infill and Delineation
$5M – 46k drill metres
58
Joao Belo
Morro do Vento
Canavieras Sul
Joao Belo
Morro do Vento Canavieras Central
Morro do Cuscuz

Jacobina Exploration
Main Reef Deep
59
Canavieras Morro do Vento

Gil Clausen Brio Gold

Pilar
2016 Expectations
61
2016 Costs
Mine $/t milled 27.00
Plant $/tonne 13.00
G&A & Other $/tonne 5.00
Total $/tonne 45.00
0
20
40
60
80
100
120
2015E 2016E 2017E 2018E
Production
Gold (koz)
Cost
Outlook
Cash
Cost(1) AISC(2)
2015E $708/oz $862/oz
2016E $560/oz $760/oz
1. A non-GAAP measure. A reconciliation of which can be found at www.yamana.com/Q32015.
2. Includes cash costs, sustaining capital, site G&A expense, and exploration expense.
13%
27%
11% 11%
28%
6% 3%
2016 Cash Cost Breakdown
Consumables Labour Maintenance
Other Contractors Power
Fuel
2016 Production
Tonnes Processed (000s) ±1,075
Grade – gold (g/t) 2.67
Recovery – gold 95%
Production – gold (000s) 85 to 90

62
Continued focus on cost improvements • Achieved significant improvements to date
• Improved productivity and efficiency
• Reductions expected to continue into 2016
Potential to increase production levels • Maria Lazarus fully in production with further expansion potential
• Annual production expected to increase to ~100,000 ounces of gold
with contribution from Maria Lazarus over next two years
Robust exploration program continues at Pilar for reserve and
resource expansion • Approximately 40,000 metres drilled in 2015 targeted at upgrading
resources to reserves and mine life extension
• Approximately 68,000 metres planned to be drilled in 2016
Future supplemental low cost ounces expected with other near mine
open pit satellite deposit, Tres Buracos
Potential to increase production levels to over 100,000 ounces
Pilar Opportunities

Pilar Exploration
63
CRIXAS
CAIAMAR
MARIA LAZARA
PILAR
TRES BURACOS
CHAPADA
(70KM from Pilar)

Fazenda Brasileiro
2016 Expectations
64
2016 Costs
Mine $/t milled 18.00
Plant $/tonne 11.00
G&A & Other $/tonne 4.00
Total $/tonne 33.00
2016 Production
Tonnes Processed (000s) ±1,200
Grade – gold (g/t) 1.88
Recovery – gold 90%
Production – gold (000s) 63 to 68
0
10
20
30
40
50
60
70
2015E 2016E 2017E 2018E
Production
Gold (koz)
Cost
Outlook
Cash
Cost(1) AISC(2)
2015E $702/oz $905/oz
2016E $610/oz $810/oz
1. A non-GAAP measure. A reconciliation of which can be found at www.yamana.com/Q32015.
2. Includes cash costs, sustaining capital, site G&A expense, and exploration expense.
14%
36%
11% 9%
16%
11% 4%
2016 Cash Cost Breakdown
Consumables Labour Maintenance
Other Contractors Power
Fuel

65
Increased reserve and extended mine life
• Reserves increased 179% to 405,000 ounces of gold in 2015
• Expected mine life, based on reserves only, now over seven years
• Currently at highest level of mineral reserves since acquisition
• Mineral reserve and resource expansion for mine life extension and
higher production levels continues to be the focus in 2016
• 80,000 metres of drilling planned for 2016, targeted at high potential
areas, near surface and existing infrastructure
Quick exploration turnaround, from discovery to mineable ounces
• New mineralized zone, E388, was discovered in mid 2015 and already
contributing to production
• Opportunity for grade improvements in "Gap Zones"
• Investment in mine infrastructure to increase production at depth
Further opportunity for reserve expansion and mine life extension
Fazenda Brasileiro Opportunities

Fazenda Brasileiro Exploration
66

C1 Santa Luz
Update and Outlook
67
Outlook
Committed to the re-start of C1
Santa luz
Drill program currently underway –
six drills in operations
Major conversion of resources
to reserves expected by the
end of Q1 2016
Detailed construction engineering
underway
Plant modifications required for the
re-commissioning to be completed
in 2016
0
20
40
60
80
100
120
140
2016E 2017E 2018E
Production
Gold (koz)
re-start
PEA Highlights 1
Annual gold production (LOM) of
approx. 100,000 oz
Ten year mine life
Expected average recoveries of 83.7%
Avg grade of 1.48 g/t gold (open pit)
After-tax IRR of 56% 2
NPV of $199 MM vs. $48 MM capital
1. As announced on August 13, 2015
2. Based on a long-term Brazilian Real to U.S. Dollar exchange rate of 3.40 and a flat gold price of $1,250 per ounce. NPV derived at 5% discount rate
Daniel Racine Northern Operations

Canadian Malartic
2016 Expectations
69
2016 Production
Tonnes Processed (000s – 100%) ±19,400
Strip Ratio 2.4
Grade – gold (g/t) 1.03
Recovery – gold 89%
Production – gold (000s – 50%) 280 to 290
20%
21%
24%
2%
17%
7% 9%
2016 Cash Cost Breakdown
Consumables Labour MaintenanceOther Contractors PowerFuel
2016 Costs
Mine $/t milled 7.30
Plant $/tonne 6.75
G&A & Other $/tonne 3.20
Total $/tonne 17.25
0
50
100
150
200
250
300
350
2015E 2016E 2017E 2018E
Production
Gold (koz)
Cost
Outlook Cash Cost(1) AISC(2)
2015E $596 $738
2016E $585 $800
1. A non-GAAP measure. A reconciliation of which can be found at www.yamana.com/Q32015.
2. Includes cash costs, sustaining capital, site G&A expense, and exploration expense.

Short Term
• Improvement of SAG mill liners • Reduce plant shutdowns to 3x from 4x per year
• Positive grade and tonnage reconciliation could potentially increase gold production
• Modify injection points of cyanide including installation and relocation of analyzer’s probe for improved cyanide control
• Improve truck cycle by decreasing waiting time at the crusher • Increase mill throughput by keeping the gyratory box full • Thickener upgrade resulting in a higher solid percentage • More production from North Zone which would result in higher mined grades
• Would require purchasing an additional remote shovel
Medium Term • Milling 55,000 tpd • Optimize rock fragmentation to increase annual tonnes milled
Long Term
• Potential to expand mill • Odyssey zone could potentially add production
0
Execution • Achieving 53,000 tpd • Permitting Barnat and road deviation (ongoing)
Canadian Malartic Opportunities
70 Focus remains on optimizations including increasing throughput

Canadian Malartic Exploration
$3M (50%) – 60k metres
71
North
South
Porphyry #12
Odyssey Deposit
Odyssey North • Gold occurs along the
margins of Porphyry #12
• 550m to 1400m beneath the
surface
• 1500m along strike (approx.)
Odyssey South • Gold occurs along the margins
of Porphyry #12
• 200m to 550m beneath the
surface
• 1500m along strike (approx.)
Pontiac Grp.
Porphyry #12
Porphyry #12
Piche Grp. View to NW

Canadian Malartic - Near Mine Upside $1.1M in budget to examine and quantify economics
72

Kirkland Lake
73
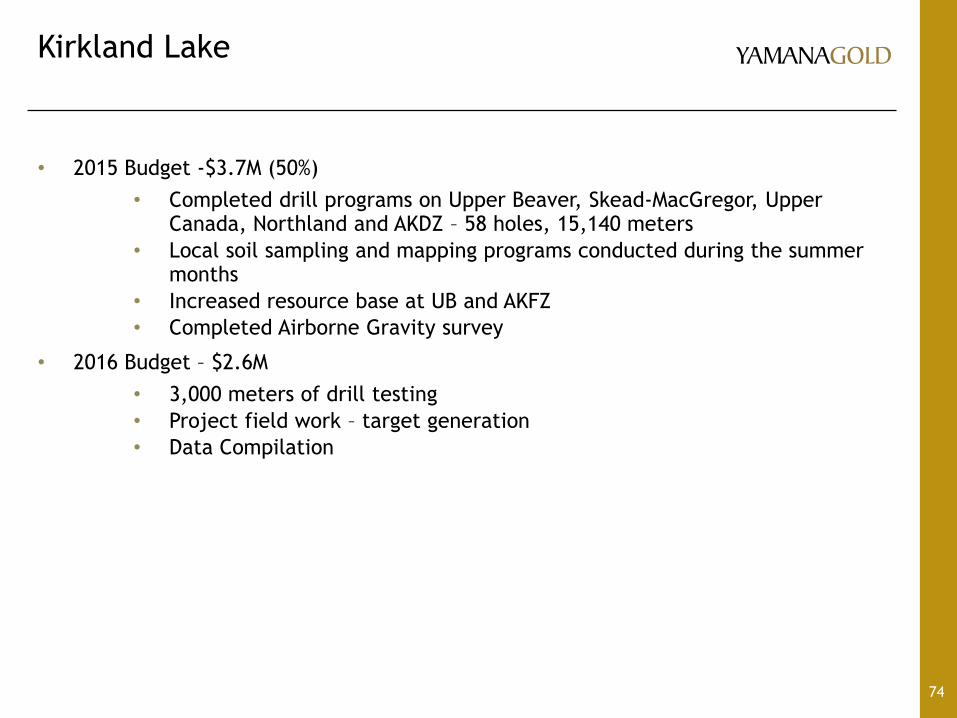
Kirkland Lake
• 2015 Budget -$3.7M (50%)
• Completed drill programs on Upper Beaver, Skead-MacGregor, Upper Canada, Northland and AKDZ – 58 holes, 15,140 meters
• Local soil sampling and mapping programs conducted during the summer months
• Increased resource base at UB and AKFZ
• Completed Airborne Gravity survey
• 2016 Budget – $2.6M
• 3,000 meters of drill testing
• Project field work – target generation
• Data Compilation
74

75
The Monument Bay Project
2011
2015
2016

Monument Bay Overview 4 km of Continuous Mineralization Within the Potential Twin Lakes Open Pit
76
2015 Twin Lakes Potential Open Pit
Twin Lake S.
Seeber River
Burn Lake
Twin Lake N.
Natural Flow Path
Natural Flow Path
Optional Flow Diversion
(using natural river tributary)
AZ Zone
Mid East Zone
• Current resource consists of
three deposits; Twin Lakes,
Mid-East & AZ.
• Recent drilling and
geophysical modelling has
defined parallel
mineralized structures
within 4 km South of
existing pit outline.
• Environmental work in
progress has demonstrated
the proposed flow diversion
as viable.
• Maximum Water Depth
is 1.5M

2014 Monument Bay Resource Review USD$1300/ounce and USD $400/MTU Tungsten Concentrate
77
Deposit Cut-Off
Category Classification
Tonnes Au Grade WO3 Grade Au Ounces WO3
(mtu) Au
Equivalent
Ounces (000’s) (g/t) (%) (000’s) (000's)
Twin Lakes
Open Pit
> 0.7 g/t Au
Measured (M) Au Only 10,795 1.86 N/A 645 N/A 645
Measured (M) Au + WO3 - - - - - -
Indicated (I) Au 29,973 1.38 N/A 1,326 N/A 1,326
Indicated (I) Au + WO3 1,430 1.80 0.17 83 248 145
Subtotal M & I 42,198 1.52 N/A 2,054 248 2,116
Inferred Au Only 9,887 1.52 0 482 0 482
Inferred Au + WO3 469 1.88 0.20 28 95 52
Subtotal Inferred 10,356 1.58 N/A 510 95 534
Underground
> 4.0 g/t Au
Measured (M) 35 7.98 N/A 9 N/A 9
Indicated (I) 109 5.17 N/A 18 N/A 18
Subtotal M & I 144 5.86 N/A 27 N/A 27
Inferred 492 4.91 N/A 78 N/A 78
AZ &
Mid-East
Open Pit
> 0.4 g/t Au
Measured (M) - - - - - -
Indicated (I) 4,529 0.55 - 80 - 80
Subtotal M & I 4,529 0.50 - 80 - 80
Inferred 18,238 0.53 - 312 - 312
Combined Total M& I 46,871 1.43 N/A 2,161 248 2,223
Total Inferred 29,086 0.96 N/A 900 95 924
Mining Costs: 1.47/t
Processing and G&A costs: $9.69/t Au only and $12.68/t APT
Exchange: 1.15

Monument Bay Project Work Completed Since April 2015 Acquisition
1. Core drilling: 11 holes, 2705 meters (west end of Twin Lakes Deposit)
2. Old Core Assay Sample Program: 33 holes reviewed, 1448 samples assayed for Au and 1,859 samples assayed for W.
3. Airborne EM survey over core of property area.
4. Re-model of geology and definition of “high grade” and “low grade” Au domains and W domains.
5. Updated geologic model and resource estimate.
78

Monument Bay-Twin Lakes Deposit Updated 2015 High-Grade Au-W Interpretation
79
600 m
Updated high-grade gold and tungsten wireframe models, long section view looking north
• Theoretical open pit in transparent green.
• Gold zones are defined by composite gold grades above 3 g/t Au over 2 m
• Tungsten zones are defined by composites tungsten grades above 0.05 WO3% over 2 m.
4 km
600 m

Monument Bay Dec. 2015 vs. Oct. 2014 Resource (at 0.7 g/t Au cutoff)
• Model incorporates new parameters:
• Lower cap grades, tighter search distances, resource classifications, reduced slope angles
• Current Resource Classification:
• Measured <=30m spacing from drill holes plus multiple composites/drill holes
• Indicated <=60m spacing from drill holes plus multiple composites/drill holes
• Inferred <=90m spacing from drill holes plus multiple composites/drill holes
• Even with more conservative criteria, the new model:
• Increased the overall resource (MII) within Open pit by ~512K ounces (17% increase)
• Increase overall grade within the open pit by 0.2 g/t Au to 1.73 g/t Au (12% increase)
80

Mercedes
2016 Expectations
81
2016 Production
Tonnes Processed (000s) 670
Grade – gold (g/t)
- silver (g/t)
4.31
49.8
Recovery – gold
- silver
94%
33%
Production – gold (000s)
- silver (000s)
85 to 90
345 to 365
2016 Costs
Mine $/t milled 64.00
Plant $/tonne 22.00
G&A & Other $/tonne 14.00
Total $/tonne 100.00
14%
20%
8% 19%
28%
7% 4%
2016 Cash Cost Breakdown
Consumables Labour MaintenanceOther Contractors PowerFuel
0
100
200
300
400
2015E 2016E 2017E 2018E
Production
Gold (koz) Silver (koz)
Cost
Outlook Cash Cost(1) AISC(2)
2015E $887/oz gold
$7.91/oz silver
$1,078/oz gold
$9.61/oz silver
2016E $750/oz gold
$9.75/oz silver
$935/oz gold
$12.15/oz silver
1. A non-GAAP measure. A reconciliation of which can be found at www.yamana.com/Q32015.
2. Includes cash costs, sustaining capital, site G&A expense, and exploration expense.

Short Term • Utilization of smaller mining equipment
• Better dilution control
Medium Term • Enhanced mine operation training and mentoring program
• Resulting in higher productivity • lower unit cost per tonne
Long Term
• Increase mining rate by gaining access to more active mining zones and increasing efficiency at active zones
0
Execution • Lower costs and increase productivity
Mercedes Opportunities
82 Continuing to advance plans to improve mining efficiency and improve dilution control

Mercedes Exploration
$2M – 10k drill metres
83
Project Geology Widespread Gold Anomalies

Mercedes Exploration
84
2016 Goals
• Discover new mineral bodies close to existing development
• Support Mine production needs
2016 Strategy – Drill
• Test Near Mine targets supported by geology and geochem
• Test District Targets supported by geology, geochem, and geophysics
• Infill and delineation drilling as needed

Barry Murphy Technical Services

Cerro Moro Project
(Argentina)
Execution Phase

Cerro Moro - Overview
87
Located in the Santa Cruz
province in southern Argentina,
70km inland of Puerto Deseado
1,000 tpd mill feed rate
Combined open-pit and
underground mining operation
Conventional concentrator with
CCD and Merrill Crowe circuits
LOM average mined grade of
~10.8 g/t Au and 536 g/t Ag
All necessary permits are in
hand
Union agreements in place
Site infrastructure and
underground mining works to
commence in January 2016
CERRO
MORO

Financial Assumptions
88
Assumption 2016 2017 2018 Long term
ER (USD /ARS) 15 17 19 19
Inflation Rate 25% 20% 20% N/A
Gold Price (USD / oz) 1.100 1.125 1.150 1.225
Silver Price (USD / oz) 14,75 15,00 15,25 17,00

Initial Capital Expenditure
89
(Figures stated in M$)
Projected capital expenditures of $285M (previous estimate - $265M)
2017 and 2018 capex breakdown pending finalization of mine plans (currently
in progress)

90
Cerro Moro - Key Operating Metrics
Throughput (tpd) 1,000
Modelled Mine Life (years) 7
Au Grade (g/t) 10.8
Au Recovery (%) 95%
Annual Au Production (koz) 102
Average Au Production - First Three Years (koz) 135
Ag Grade (g/t) 536
Ag Recovery (%) 93%
Annual Ag Production (koz) 5,000
Average Ag Production - First Three Years (koz) 6,700
Au AISC ($/oz) 547-557
Ag AISC ($/oz) 7.60-7.80
Parameters and estimates as per press release dated February 11, 2015. Based on
Mineral Reserves Only
Final design criteria pending finalization of the mine plans (currently in progress)

91
Cerro Moro - Life of Mine Production Profile
Based on Mineral Reserves Only
-
1,000,000
2,000,000
3,000,000
4,000,000
5,000,000
6,000,000
7,000,000
8,000,000
0
20,000
40,000
60,000
80,000
100,000
120,000
140,000
160,000
180,000
FY18 FY19 FY20 FY21 FY22 FY23 FY24
Production - Gold (oz) Production - Silver (oz) First 3 Full Years Average - Silver First 3 Full Years Average - Gold
Silver Oz Gold Oz
Potential to improve production profile with inclusion of mineral resources

Cerro Moro - 2016 Advance Mining Strategy
92
Continue the development of Escondida FW decline
Develop drifts in argillic and fresh rock zones ore to better understand vein and
rock behavior (weathered/non weathered zones)
Confirm key technical parameters including continuity of mineralization and rock
mass quality
Approximately 600 m of development with 150m within the vein structures
93
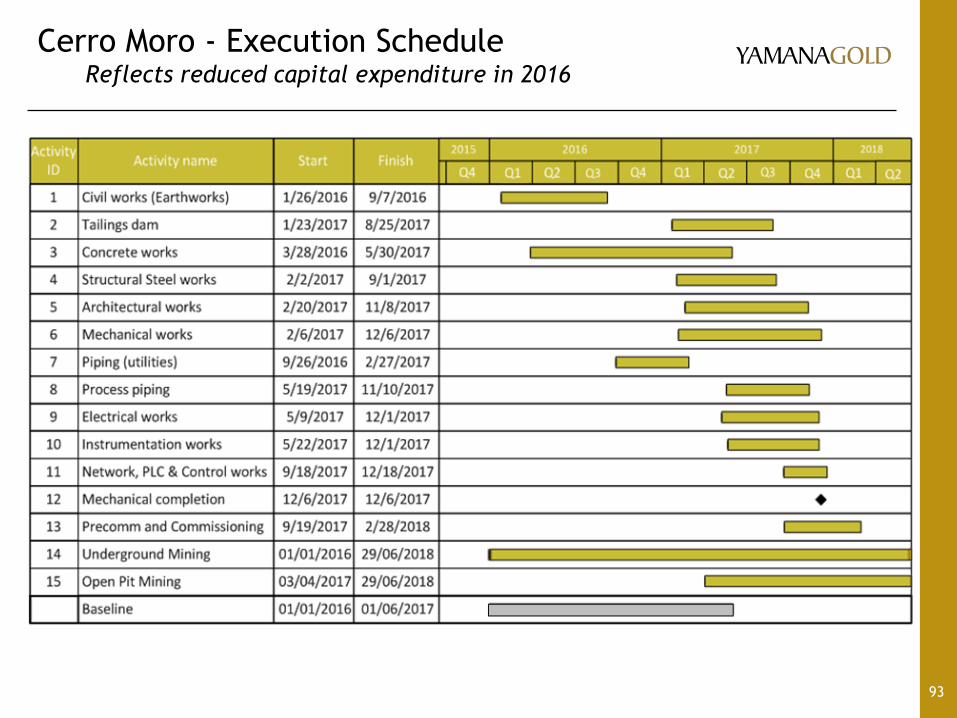
Cerro Moro - Execution Schedule Reflects reduced capital expenditure in 2016

94
Cerro Moro - Exploration Program
Upside Potential
94
2016 Exploration Focus
• Main Goals: Discover a new high grade structure and expand the current
Indicated resource.
• Targets to be tested include down dip extensions and known inferred zones
along the Escondida structure and numerous geochem and structural targets in
the La Negrita block (northern half of Cerro Moro Property)
Satellite Deposits
• Bahia Laura-Fomicruz JV. Using the know-how acquired in Cerro Moro to
develop an attractive target that can create value that impact the company
and the market. Regional focus in CM consolidation lands
2016 Budget
• $4.0 M
• 16,000 metres

Deep Carbonate Project - Gualcamayo
(Argentina)
Conceptual Study Phase

Deep Carbonates Project - Overview
96
Brownfields project associated with the Gualcamayo operation in central
Argentina
Co-located carbonate resource with average gold grade of 3.09gpt
~1.1Moz saleable gold @ an average of 170koz/y for 6.5 years
Combined open-pit and underground mining operation
6,000 tpd mill feed rate

Deep Carbonates Project – Study Progress
Update
97
Conceptual study continued during H2 2015, with focus on:
• Evaluation of suitable mining methodologies for the SW ore-body (80% of
current resource)
• Continuation of metallurgical test-work:
– Arsenic treatment
– Settling and rheology behaviour
– Reagent and energy consumption
Work programme for 2016:
• Refinement of the chosen mining alternatives and confirmation of
development and operating costs at a conceptual study level
• Identification of a viable arsenic treatment technology
• Determination of SW resource dimension

C1 Santa Luz
(Brazil)
Prefeasibility Study Phase
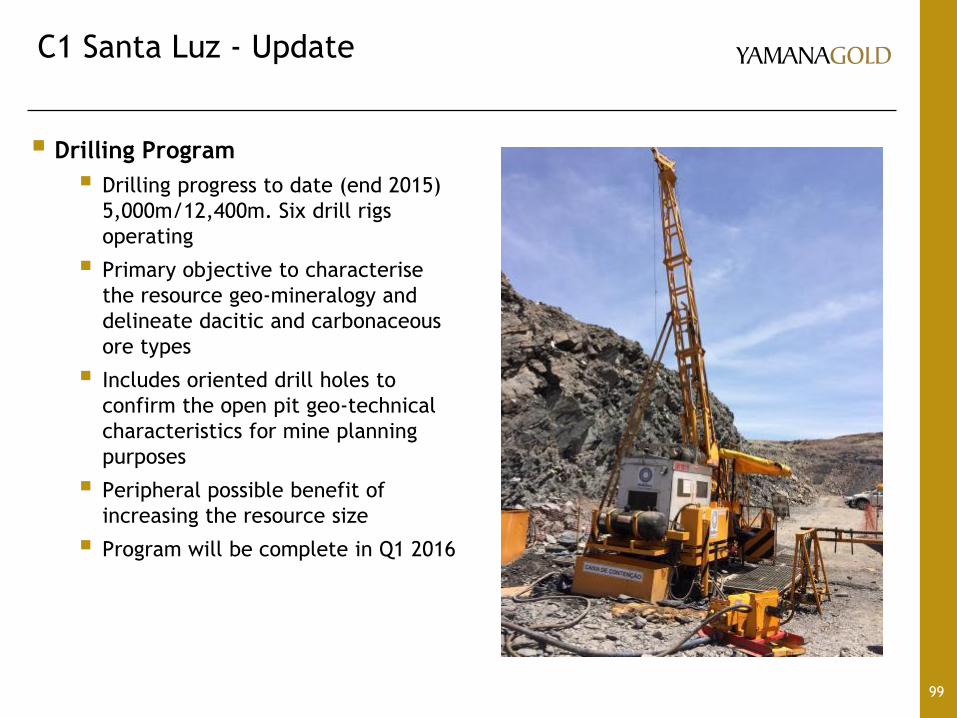
C1 Santa Luz - Update
99
Drilling Program
Drilling progress to date (end 2015)
5,000m/12,400m. Six drill rigs
operating
Primary objective to characterise
the resource geo-mineralogy and
delineate dacitic and carbonaceous
ore types
Includes oriented drill holes to
confirm the open pit geo-technical
characteristics for mine planning
purposes
Peripheral possible benefit of
increasing the resource size
Program will be complete in Q1 2016

C1 Santa Luz - Update
100
Metallurgical Testwork
Characterize processing parameters
for the dacitic ore
Optimize processing parameters for
carbonaceous ores
Characterize carbon in the ores and
studies for activated carbon
regeneration
Pre-Feasibility Study
Resource and Reserve to be updated based on drilling results
Geo-metallurgical model and mine plan to be developed to establish ore
processing schedule
Study to be prepared by independent 3rd Party Consultants – RPA and
Ausenco
Charles Main
Jason LeBlanc Balance Sheet Review

102
Impairment Approach Under IFRS
Under IFRS, an assessment is made periodically, or when indicators
of impairment are present; when the market capitalization of a
company is lower than its net equity value, an indicator of
impairment may be present.
Estimated recoverable amount for exploration assets is determined
based on observable fair value (which has seen a significant decline
over the past few years) and in the case of an operating mine, it is
based with reference to the estimated discounted future cash flow
projection of that unit, along with any values related to exploration
properties and potential of the mine.
Excess amount in the comparison is impaired and reflected as a non-
cash adjustment in the in the period it is identified.

103
Impairment Approach Under IFRS
IFRS allows a reversal of the impairment when market reference for
exploration concessions increase and metal prices are higher.
Impairment testing for YE 2015 has not yet been concluded. The
Company is analyzing the carrying value of various exploration
concessions and the cash flow projections of its mines in the context
of the deterioration of metal prices over the last several years and
the recognition that capital had been expended, at several mines,
during periods when metal prices were significantly in excess of the
current levels.
Carrying value includes such expended capital, and given the lower
metal prices, the portion of the carrying value based on such
expenditure may not be supportable at the current lower metal
prices.
Any potential impairment would likely affect exploration concessions
and smaller mines.

Dividend Policy
104
1) Yamana is committed to maintaining a dividend
Instills financial discipline
Compensates shareholders
2) Need to balance the financial discipline of paying a dividend with
managing the business in the context of current markets
3) Dividends will be revised to $0.02/ share annually compared to
current annualized rate of $0.06/share beginning with the first
quarter 2016 dividend payable in Q2
4) Will continue to evaluate dividend level on regular basis and
consider special dividends and/or share buybacks when
circumstances warrant

Debt Profile
105
0
100
200
300
400
500
600
700
2016 2017 2018 2019 2020 2021 2022 2023 2024
$M
illions
Senior Debt Notes Malartic Debt
Significant balance sheet flexibility due
to modest debt repayments over
short-term
• The 2016 Senior Debt maturity of $73.5M has a payment date of December, and will be repaid using
cash flow generated throughout the year
• Yamana has a strategic objective to focus on monetization initiatives, which serve to reduce debt and
increase cash balances. As part of this strategy, the Company is committed to reducing the
outstanding balance on its credit facility and holding sufficient funds for some or all of the scheduled
debt repayments in 2016 and 2017.
• As is normal practice the Company will seek to refinance the credit facility prior to maturity in May
2020
• Proceeds from the stream in Q4 were used to reduce the outstanding balance on the credit facility
*Note: As of September 30, 2015

Appendix

108
Sandstorm Stream Summary
Yamana Gold received cash of $140 million and warrants valued at $18.2 million associated with
the Silver and Copper agreements.
The deferred revenue associated with silver and copper is evenly split between the two metals at
$79.1 million, as the fair value of both agreements were virtually the same.
Deferred revenue will be amortized over the life of the arrangement, on a straight line basis,
based on the number of silver ounces or copper pounds expected to be delivered under the
arrangement. The number of ounces or pounds to be delivered under the arrangement may be
updated annually, as mine plans are updated.
Currently, it is expected that delivered metal will result in an amortization of deferred revenue of
$1.44/lb of copper and $7.82/oz of silver.
Amortization of Deferred Revenue by Year in Millions of USD
Year of Delivery 2016 2017 2018 2019 2020 2021 2022 2023 2024 2025 2026 2027 2028 2029 2030 2031 2032 2033 2034 2035
Copper 5.6 5.6 5.6 5.6 5.6 5.6 5.6 5.4 5.2 4.9 3.6 3.1 3.6 3.8 3.3 1.7 2.0 1.3 1.0 1.0
Silver 2.2 2.3 2.1 9.4 9.4 9.4 9.4 9.4 3.6 4.4 4.4 4.4 4.4 4.4 - - - - - -
7.8 7.9 7.7 15.0 15.0 15.0 15.0 14.8 8.9 9.3 8.0 7.5 8.0 8.2 3.3 1.7 2.0 1.3 1.0 1.0
109
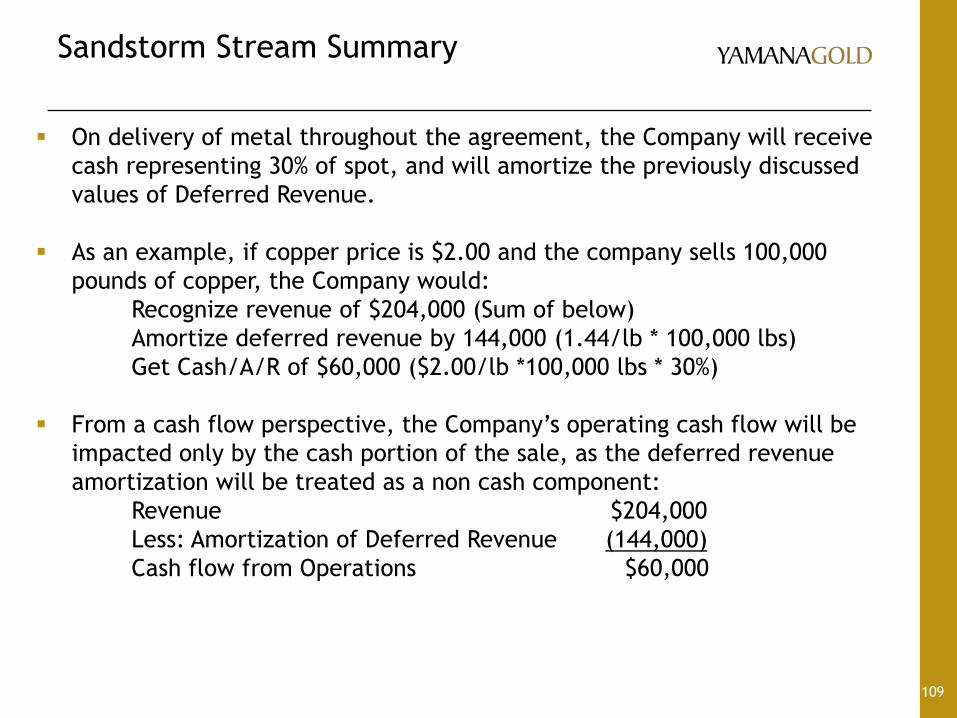
Sandstorm Stream Summary
On delivery of metal throughout the agreement, the Company will receive
cash representing 30% of spot, and will amortize the previously discussed
values of Deferred Revenue.
As an example, if copper price is $2.00 and the company sells 100,000
pounds of copper, the Company would:
Recognize revenue of $204,000 (Sum of below)
Amortize deferred revenue by 144,000 (1.44/lb * 100,000 lbs)
Get Cash/A/R of $60,000 ($2.00/lb *100,000 lbs * 30%)
From a cash flow perspective, the Company’s operating cash flow will be
impacted only by the cash portion of the sale, as the deferred revenue
amortization will be treated as a non cash component:
Revenue $204,000
Less: Amortization of Deferred Revenue (144,000)
Cash flow from Operations $60,000

Quotational Period Hedging & TC/RC Update
Quotational Period Hedging
In order to minimize variability between the copper price at the time of shipment/invoice
and the time of cash realization, Yamana enters into Quotational Period hedges on the
copper contained in its concentrate
This helps to ensure cash certainty while smoothing out changes in revenue due to changes
in the copper price, and aims to reduce the difference between Yamana’s realized
quarterly copper price and the quarterly market average copper price
Currently, Yamana has hedged 44 million lbs at a price of $2.20 per lb for the first half of
2016. This represents approximately 37% of payable copper for 2016.
Treatment Charges & Refining Charges
2016 TC/RCs on Yamana’s copper concentrate are expected to be lower compared to 2015
levels
For 2016, based on projected sales of 230,000 dmt, the weighted average treatment
charge will be $104 per dmt, and the refining charge will be 10.4¢ per lb of copper
This compares to actual 2015 treatment charges of $106 per dmt, and 10.6¢ per lb of
copper
Higher-cost legacy smelting contract will expire in 2018
110


![PM 2014 investor day 2014-06-26-Operations Investor Day Slides [FINAL]](https://static.fdocuments.us/doc/165x107/577cbc651a28aba7118da314/pm-2014-investor-day-2014-06-26-operations-investor-day-slides-final.jpg)