2011 Dallas Hotel Conference - Final Powerpo WWorth:orth: AprilApril vvss.. JJululyy 2011 Employment...
69
Transcript of 2011 Dallas Hotel Conference - Final Powerpo WWorth:orth: AprilApril vvss.. JJululyy 2011 Employment...

Presentation:Texas Market Update
Randy McCaslin
Vice President-Practice Leader
PKF Consulting
2011 Dallas Hotel Conference2011 Dallas Hotel Conference
“Journey Through Uncertainty”“Journey Through Uncertainty”
November 17, 2011November 17, 2011
I. The Economy
II.II. Lodging ForecastsLodging Forecasts
III.III. Journey Through UncertaintyJourney Through Uncertainty
I. The Economy
II.II. Lodging ForecastsLodging Forecasts
III.III. Journey Through UncertaintyJourney Through Uncertainty
Presentation OutlinePresentation Outline
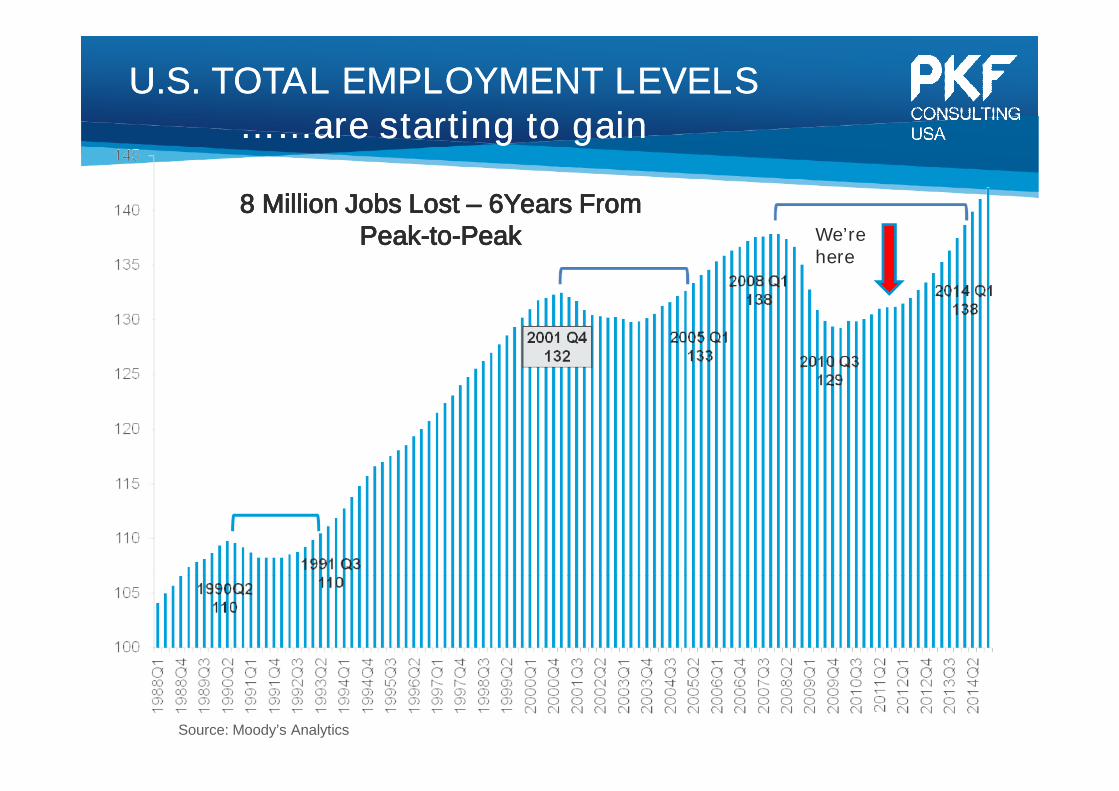
U.S. TOTAL EMPLOYMENT LEVELSU.S. TOTAL EMPLOYMENT LEVELS……are starting to gain……are starting to gain
8 Million Jobs Lost8 Million Jobs Lost –– 6Years From6Years FromPeakPeak--toto--PeakPeak
Source: Moody’s Analytics
We’rehere
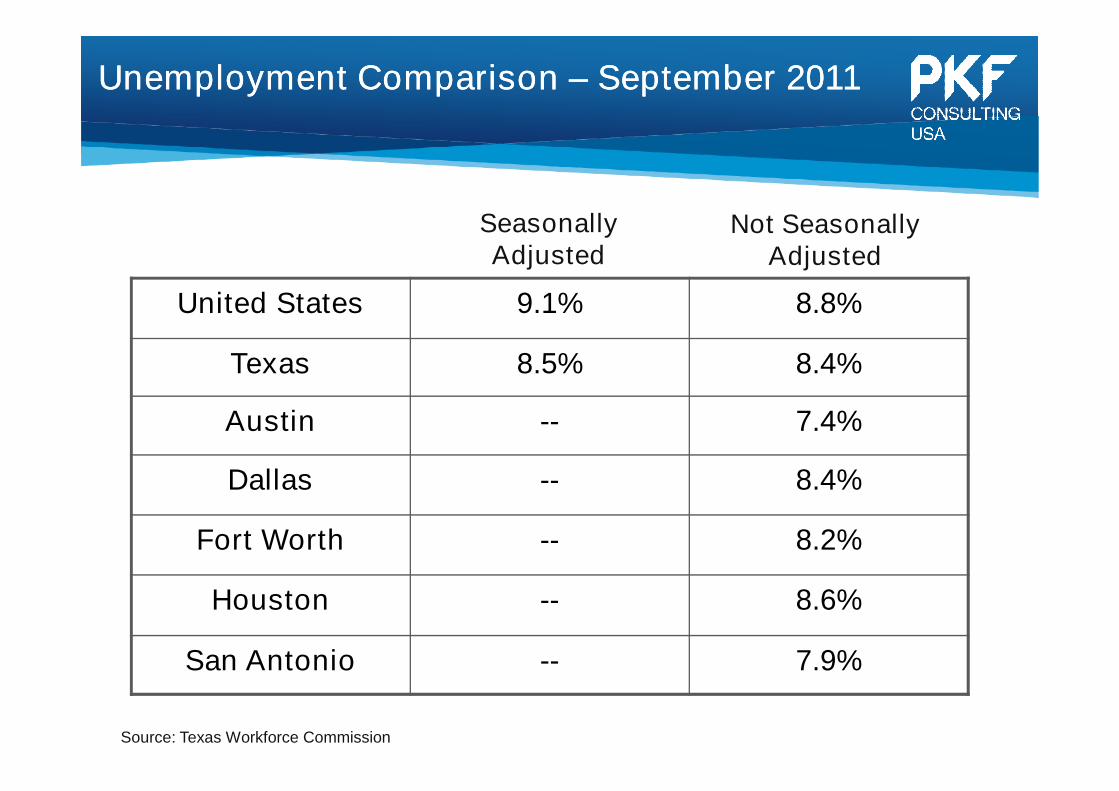
Unemployment ComparisonUnemployment Comparison –– September 2011September 2011
Not SeasonallyAdjusted
Source: Texas Workforce Commission
United States 9.1% 8.8%
Texas 8.5% 8.4%
Austin -- 7.4%
Dallas -- 8.4%
Fort Worth -- 8.2%
Houston -- 8.6%
San Antonio -- 7.9%
SeasonallyAdjusted

Uncertainties That Affect RecoveryUncertainties That Affect Recovery
••U.S. Debt CrisisU.S. Debt Crisis –– S&P’s RatingS&P’s Rating
••Global Financial CrisisGlobal Financial Crisis
••JapanJapan –– Long Term ImpactLong Term Impact
••Middle East & LibyaMiddle East & Libya
••Price of Oil & GasPrice of Oil & Gas
••U.S. CongressU.S. Congress
••2012 Election2012 Election
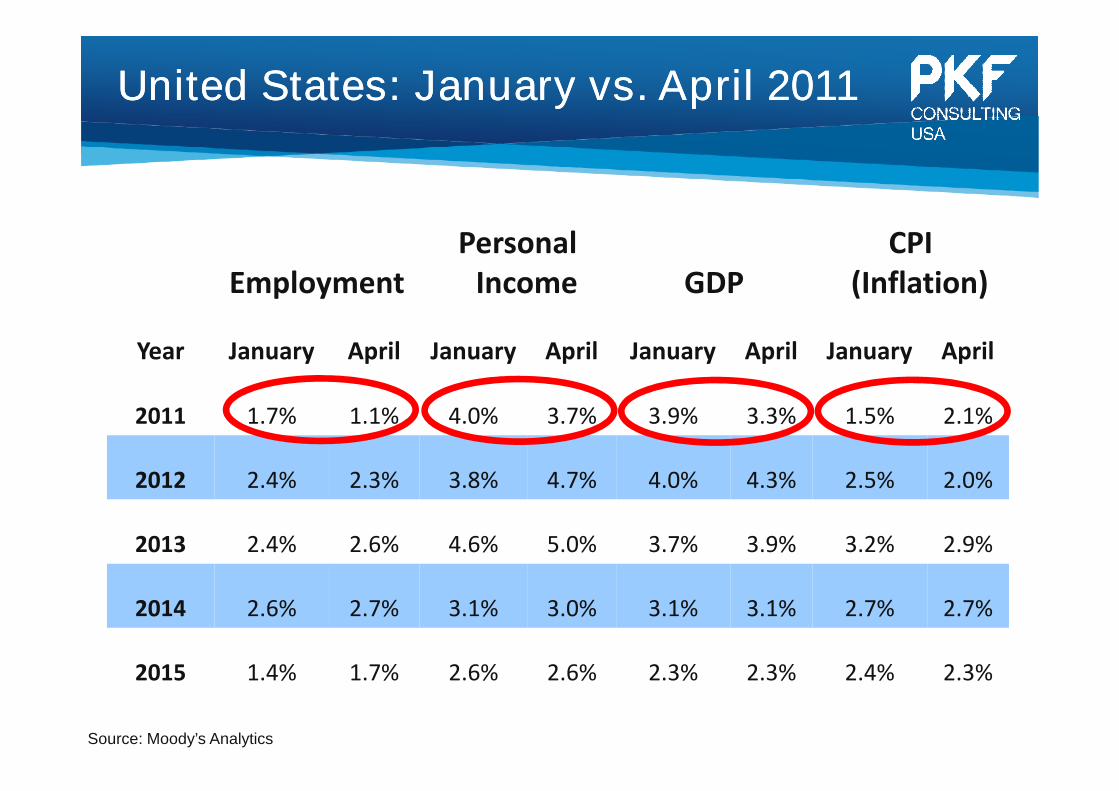
United States: January vs. April 2011United States: January vs. April 2011
EmploymentPersonal
Income GDPCPI
(Inflation)
Year January April January April January April January April
2011 1.7% 1.1% 4.0% 3.7% 3.9% 3.3% 1.5% 2.1%
2012 2.4% 2.3% 3.8% 4.7% 4.0% 4.3% 2.5% 2.0%
2013 2.4% 2.6% 4.6% 5.0% 3.7% 3.9% 3.2% 2.9%
2014 2.6% 2.7% 3.1% 3.0% 3.1% 3.1% 2.7% 2.7%
2015 1.4% 1.7% 2.6% 2.6% 2.3% 2.3% 2.4% 2.3%
Source: Moody’s Analytics
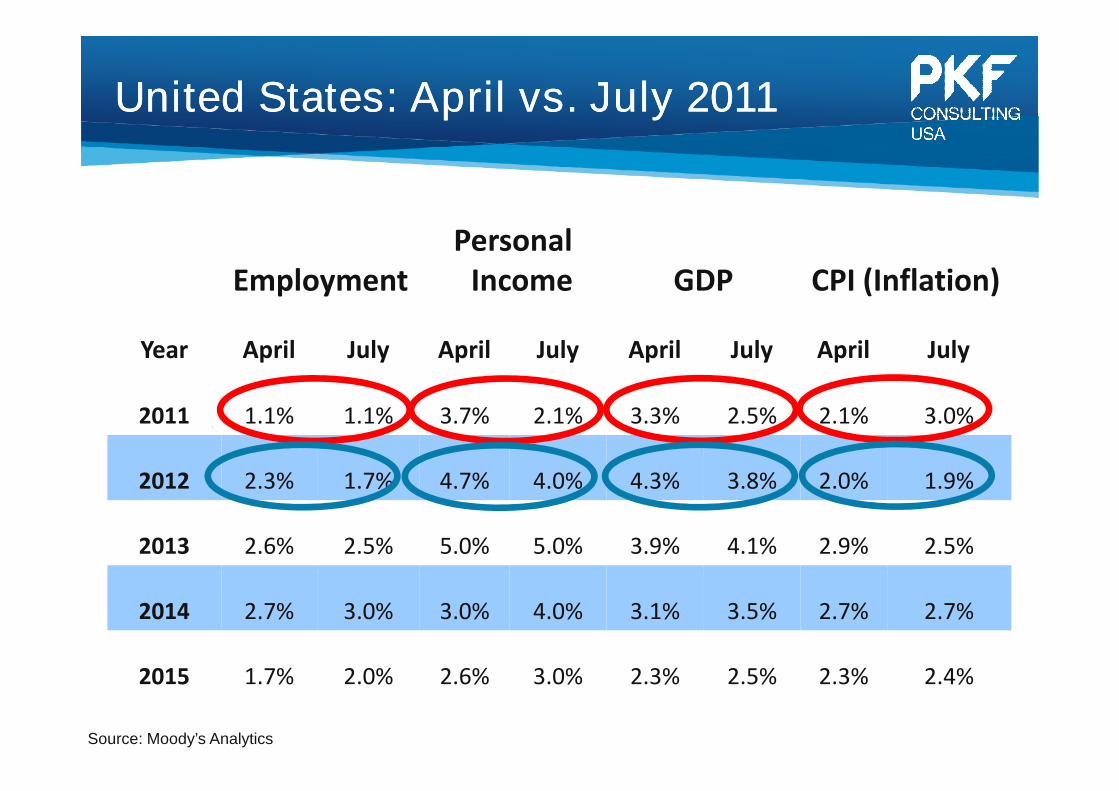
United States: April vs. July 2011United States: April vs. July 2011
EmploymentPersonal
Income GDP CPI (Inflation)
Year April July April July April July April July
2011 1.1% 1.1% 3.7% 2.1% 3.3% 2.5% 2.1% 3.0%
2012 2.3% 1.7% 4.7% 4.0% 4.3% 3.8% 2.0% 1.9%
2013 2.6% 2.5% 5.0% 5.0% 3.9% 4.1% 2.9% 2.5%
2014 2.7% 3.0% 3.0% 4.0% 3.1% 3.5% 2.7% 2.7%
2015 1.7% 2.0% 2.6% 3.0% 2.3% 2.5% 2.3% 2.4%
Source: Moody’s Analytics

United States: July vs. October 2011United States: July vs. October 2011
EmploymentPersonal
Income GDPCPI
(Inflation)
Year July October July October July October July October
2011 1.1% 1.0% 2.1% 2.7% 2.5% 1.8% 3.0% 3.0%
2012 1.7% 0.7% 4.0% 4.9% 3.8% 2.7% 1.9% 1.8%
2013 2.5% 1.7% 5.0% 4.0% 4.1% 3.5% 2.5% 2.4%
2014 3.0% 3.1% 4.0% 3.4% 3.5% 3.8% 2.7% 3.0%
2015 2.0% 2.8% 3.0% 3.1% 2.5% 3.5% 2.4% 2.4%
Source: Moody’s Analytics
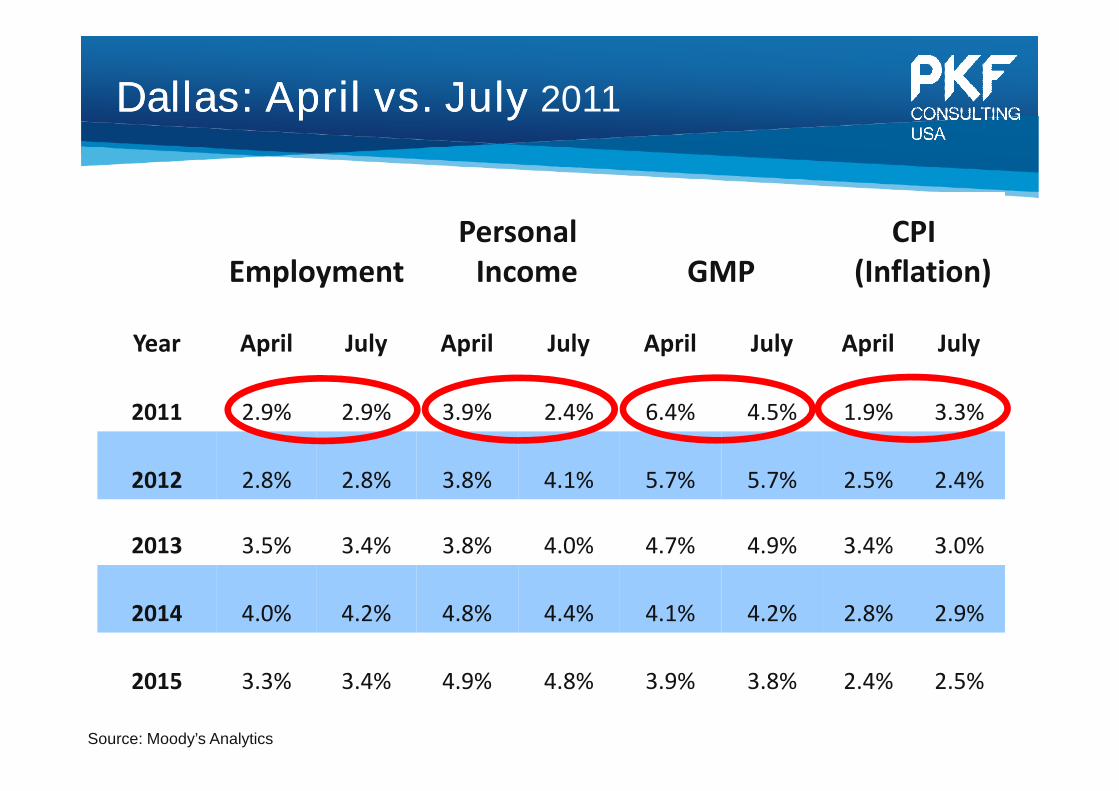
Dallas: April vs. JulyDallas: April vs. July 2011
EmploymentPersonal
Income GMPCPI
(Inflation)
Year April July April July April July April July
2011 2.9% 2.9% 3.9% 2.4% 6.4% 4.5% 1.9% 3.3%
2012 2.8% 2.8% 3.8% 4.1% 5.7% 5.7% 2.5% 2.4%
2013 3.5% 3.4% 3.8% 4.0% 4.7% 4.9% 3.4% 3.0%
2014 4.0% 4.2% 4.8% 4.4% 4.1% 4.2% 2.8% 2.9%
2015 3.3% 3.4% 4.9% 4.8% 3.9% 3.8% 2.4% 2.5%
Source: Moody’s Analytics
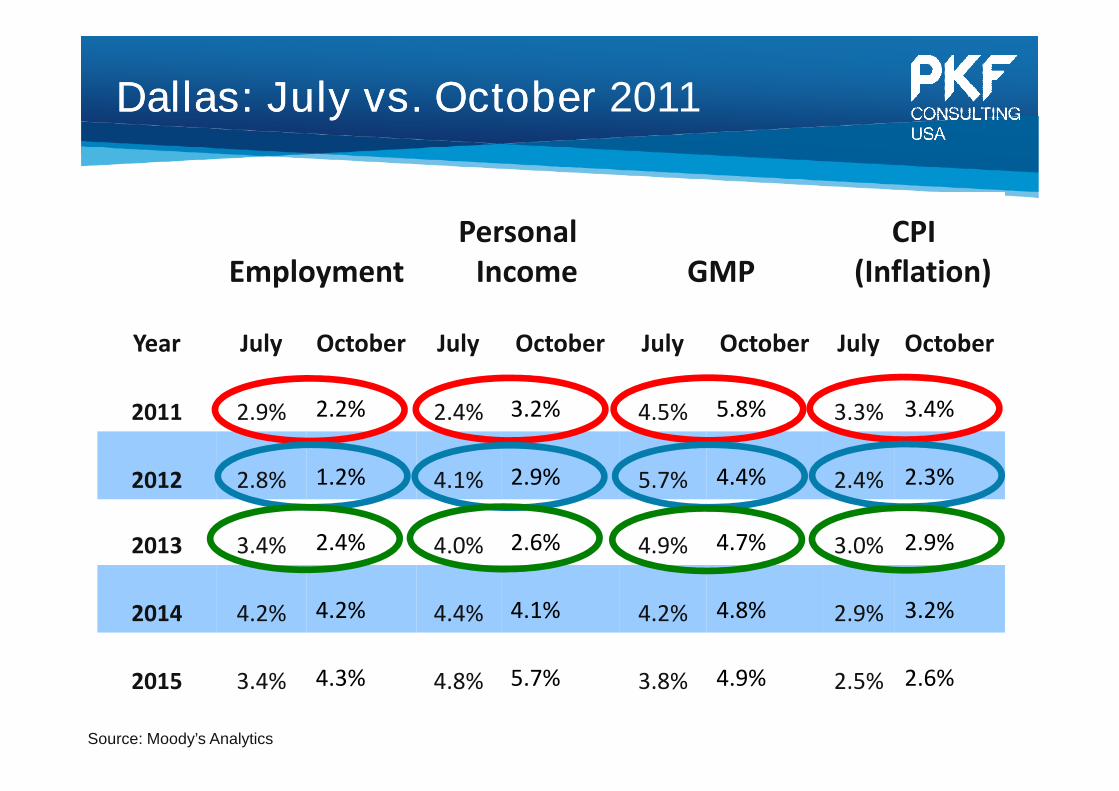
Dallas: July vs. OctoberDallas: July vs. October 2011
EmploymentPersonal
Income GMPCPI
(Inflation)
Year July October July October July October July October
2011 2.9% 2.2% 2.4% 3.2% 4.5% 5.8% 3.3% 3.4%
2012 2.8% 1.2% 4.1% 2.9% 5.7% 4.4% 2.4% 2.3%
2013 3.4% 2.4% 4.0% 2.6% 4.9% 4.7% 3.0% 2.9%
2014 4.2% 4.2% 4.4% 4.1% 4.2% 4.8% 2.9% 3.2%
2015 3.4% 4.3% 4.8% 5.7% 3.8% 4.9% 2.5% 2.6%
Source: Moody’s Analytics
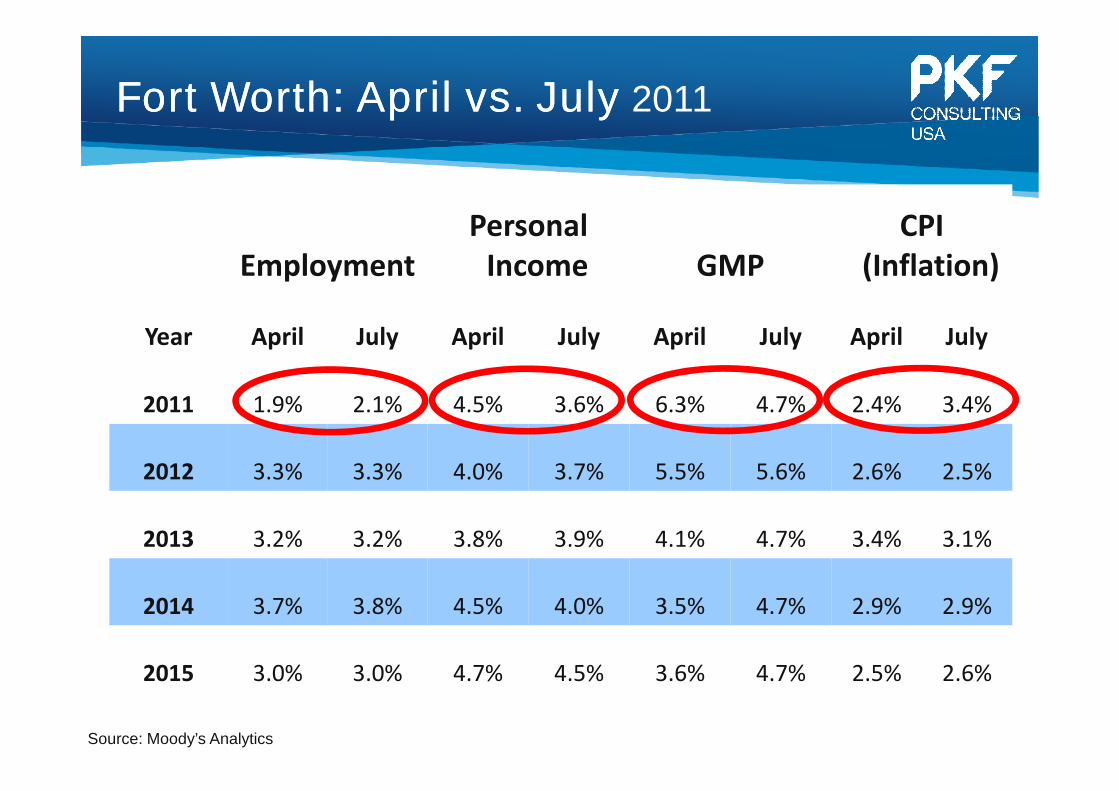
Fort Worth: April vs. JulyFort Worth: April vs. July 2011
EmploymentPersonal
Income GMPCPI
(Inflation)
Year April July April July April July April July
2011 1.9% 2.1% 4.5% 3.6% 6.3% 4.7% 2.4% 3.4%
2012 3.3% 3.3% 4.0% 3.7% 5.5% 5.6% 2.6% 2.5%
2013 3.2% 3.2% 3.8% 3.9% 4.1% 4.7% 3.4% 3.1%
2014 3.7% 3.8% 4.5% 4.0% 3.5% 4.7% 2.9% 2.9%
2015 3.0% 3.0% 4.7% 4.5% 3.6% 4.7% 2.5% 2.6%
Source: Moody’s Analytics

Fort Worth: July vs. OctoberFort Worth: July vs. October 2011
EmploymentPersonal
Income GMPCPI
(Inflation)
Year July October July October July October July October
2011 2.1% 1.8% 3.6% 4.8% 4.7% 5.6% 3.4% 3.4%
2012 3.3% 2.1% 3.7% 2.8% 5.6% 4.4% 2.5% 2.4%
2013 3.2% 2.5% 3.9% 2.8% 4.7% 4.5% 3.1% 2.9%
2014 3.8% 4.0% 4.0% 3.9% 4.7% 5.2% 2.9% 3.2%
2015 3.0% 4.0% 4.5% 5.4% 4.7% 5.8% 2.6% 2.6%
Source: Moody’s Analytics
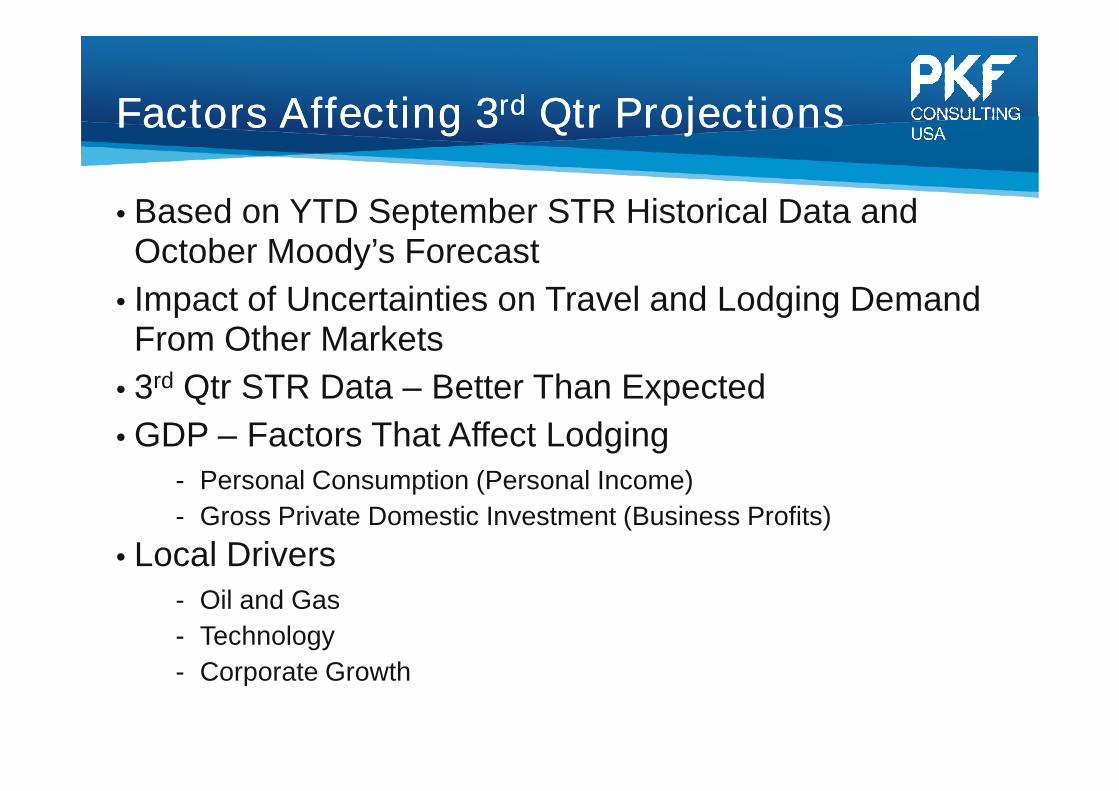
Factors Affecting 3Factors Affecting 3rdrd Qtr ProjectionsQtr Projections
• Based on YTD September STR Historical Data andOctober Moody’s Forecast
• Impact of Uncertainties on Travel and Lodging DemandFrom Other Markets
• 3rd Qtr STR Data – Better Than Expected
• GDP – Factors That Affect Lodging- Personal Consumption (Personal Income)
- Gross Private Domestic Investment (Business Profits)
• Local Drivers- Oil and Gas
- Technology
- Corporate Growth
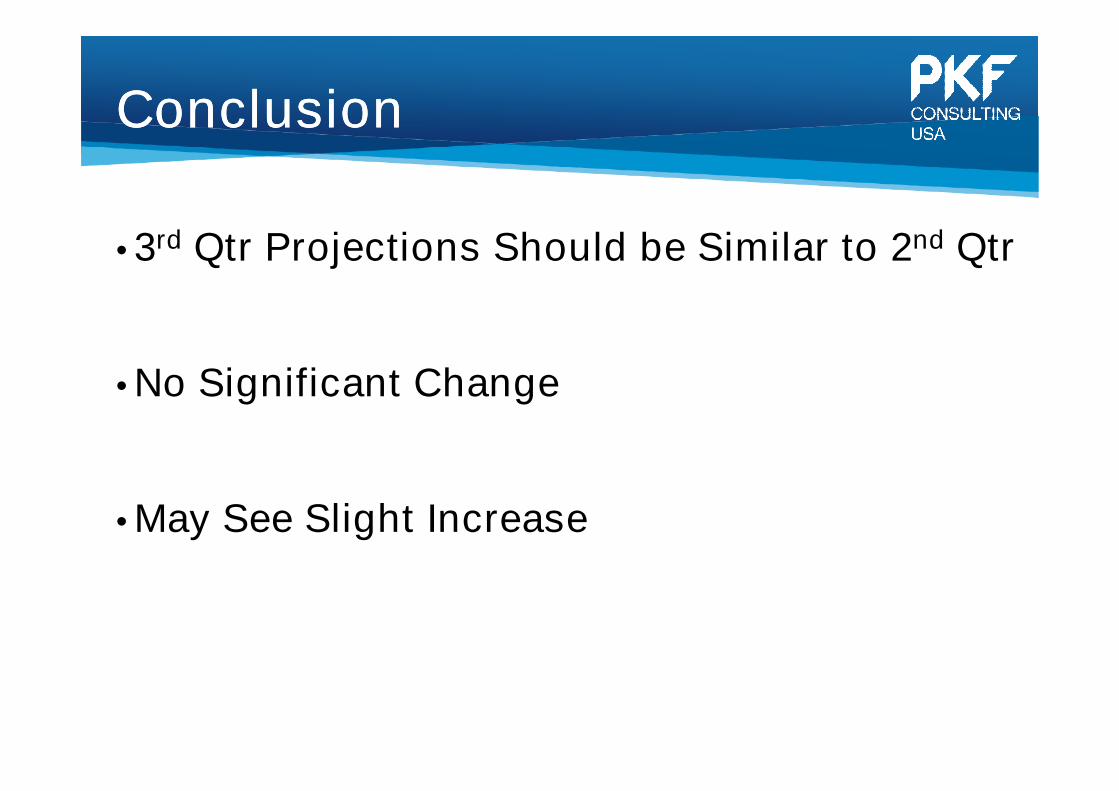
ConclusionConclusion
• 3rd Qtr Projections Should be Similar to 2nd Qtr
• No Significant Change
• May See Slight Increase
I.I. The EconomyThe Economy
II. Lodging Forecasts
III.III. Journey Through UncertaintyJourney Through Uncertainty
I.I. The EconomyThe Economy
II. Lodging Forecasts
III.III. Journey Through UncertaintyJourney Through Uncertainty
Presentation OutlinePresentation Outline

= Below/Above Long RunAverage
LongTerm
Average 2008 2009 2010 2011 2012F 2013F 2014F 2015F
Supply 2.1% 2.4% 2.9% 1.8% 0.6% 0.7% 1.1% 1.7% 2.0%
Demand 1.8% -2.5% -6.1% 7.5% 4.5% 3.1% 3.8% 3.4% 1.3%
Occupancy 62.0% 59.8% 54.5% 57.6% 59.8% 61.2% 62.8% 63.9% 63.4%
ADR 2.8% 2.9% -8.6% -0.1% 3.2% 4.8% 5.3% 5.2% 4.0%
RevPAR 2.5% -2.0% -16.6% 5.5% 7.2% 7.3% 8.1% 7.0% 3.2%
United StatesUnited States22ndnd Quarter 2011Quarter 2011
Source: PKF Hospitality Research – 2nd Quarter 2011 Hotel Horizons® Report, Smith Travel Research
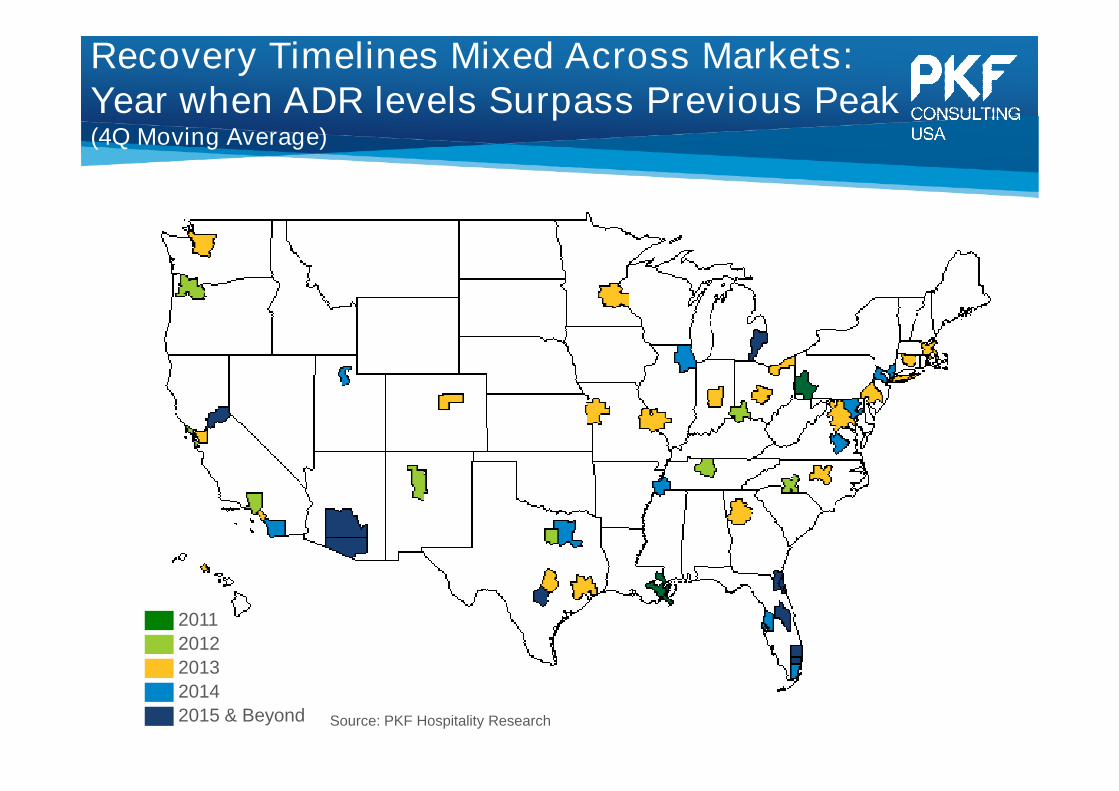
Recovery Timelines Mixed Across Markets:Year when ADR levels Surpass Previous Peak(4Q Moving Average)
2011
2012
2013
2014
2015 & Beyond Source: PKF Hospitality Research

Texas SummaryTexas Summary
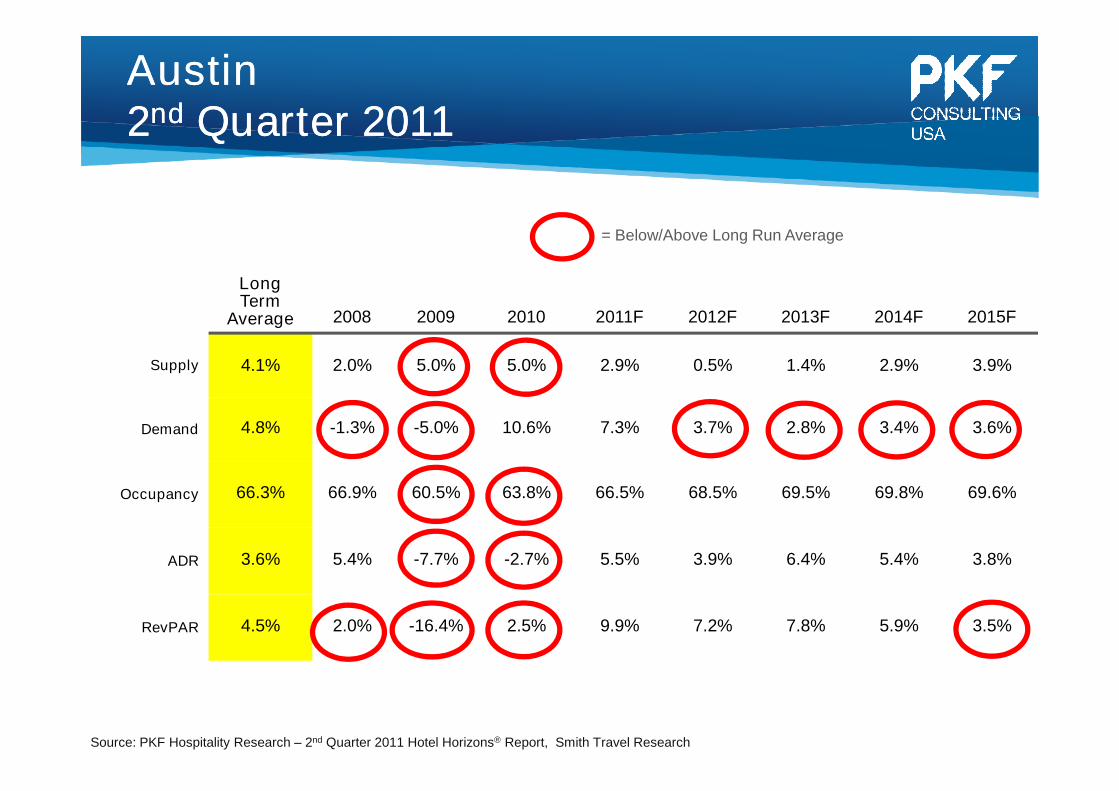
= Below/Above Long Run Average
LongTerm
Average 2008 2009 2010 2011F 2012F 2013F 2014F 2015F
Supply 4.1% 2.0% 5.0% 5.0% 2.9% 0.5% 1.4% 2.9% 3.9%
Demand 4.8% -1.3% -5.0% 10.6% 7.3% 3.7% 2.8% 3.4% 3.6%
Occupancy 66.3% 66.9% 60.5% 63.8% 66.5% 68.5% 69.5% 69.8% 69.6%
ADR 3.6% 5.4% -7.7% -2.7% 5.5% 3.9% 6.4% 5.4% 3.8%
RevPAR 4.5% 2.0% -16.4% 2.5% 9.9% 7.2% 7.8% 5.9% 3.5%
AustinAustin22ndnd Quarter 2011Quarter 2011
Source: PKF Hospitality Research – 2nd Quarter 2011 Hotel Horizons® Report, Smith Travel Research

= Below/Above Long Run Average
LongTerm
Average 2008 2009 2010 2011F 2012F 2013F 2014F 2015F
Supply 3.6% 2.8% 6.1% 6.4% 3.1% 0.8% 0.8% 1.5% 2.6%
Demand 4.1% 5.0% -12.1% 6.0% 8.3% 2.3% 3.7% 3.7% 4.1%
Occupancy 62.8% 67.2% 55.6% 55.4% 58.1% 59.0% 60.7% 62.0% 63.0%
ADR 3.0% 9.3% -8.3% -4.0% 4.3% 4.8% 5.1% 4.4% 3.4%
RevPAR 3.6% 11.5% -24.1% -4.4% 9.5% 6.3% 8.1% 6.7% 4.9%
HoustonHouston22ndnd Quarter 2011Quarter 2011
Source: PKF Hospitality Research – 2nd Quarter 2011 Hotel Horizons® Report, Smith Travel Research

= Below/Above Long Run Average
LongTerm
Average 2008 2009 2010 2011F 2012F 2013F 2014F 2015F
Supply 4.2% 6.8% 6.9% 8.7% 2.7% 0.9% 0.7% 2.0% 3.3%
Demand 4.2% 3.9% -6.3% 12.7% 5.9% 3.4% 3.5% 3.7% 3.1%
Occupancy 65.4% 64.2% 56.2% 58.3% 60.1% 61.6% 63.3% 64.4% 64.2%
ADR 3.0% 4.3% -10.1% 0.2% -0.7% 2.0% 4.0% 4.0% 3.4%
RevPAR 3.2% 1.6% -21.3% 3.9% 2.4% 4.6% 6.9% 5.7% 3.2%
San AntonioSan Antonio22ndnd Quarter 2011Quarter 2011
Source: PKF Hospitality Research – 2nd Quarter 2011 Hotel Horizons® Report, Smith Travel Research

MetroplexMetroplex –– Local FactorsLocal Factors
•• Super Bowl EffectSuper Bowl Effectoo 20112011 –– Increased Occupancy & RateIncreased Occupancy & Rate
oo 20122012 –– Occupancy & Rate AdjustmentOccupancy & Rate Adjustment
•• Omni Convention Center HotelOmni Convention Center Hotel
•• Convention ActivityConvention Activity
•• Government Per Diem/Budget CutsGovernment Per Diem/Budget Cuts
•• II--635 Construction / SH 121 Completion635 Construction / SH 121 Completion
•• Dart ConnectivityDart Connectivity
•• Woodall Rodgers ParkWoodall Rodgers Park
•• George Bush LibraryGeorge Bush Library
•• Southwest Purchase of Air TranSouthwest Purchase of Air Tran
•• Sea Life Aquarium/Lego LandSea Life Aquarium/Lego Land
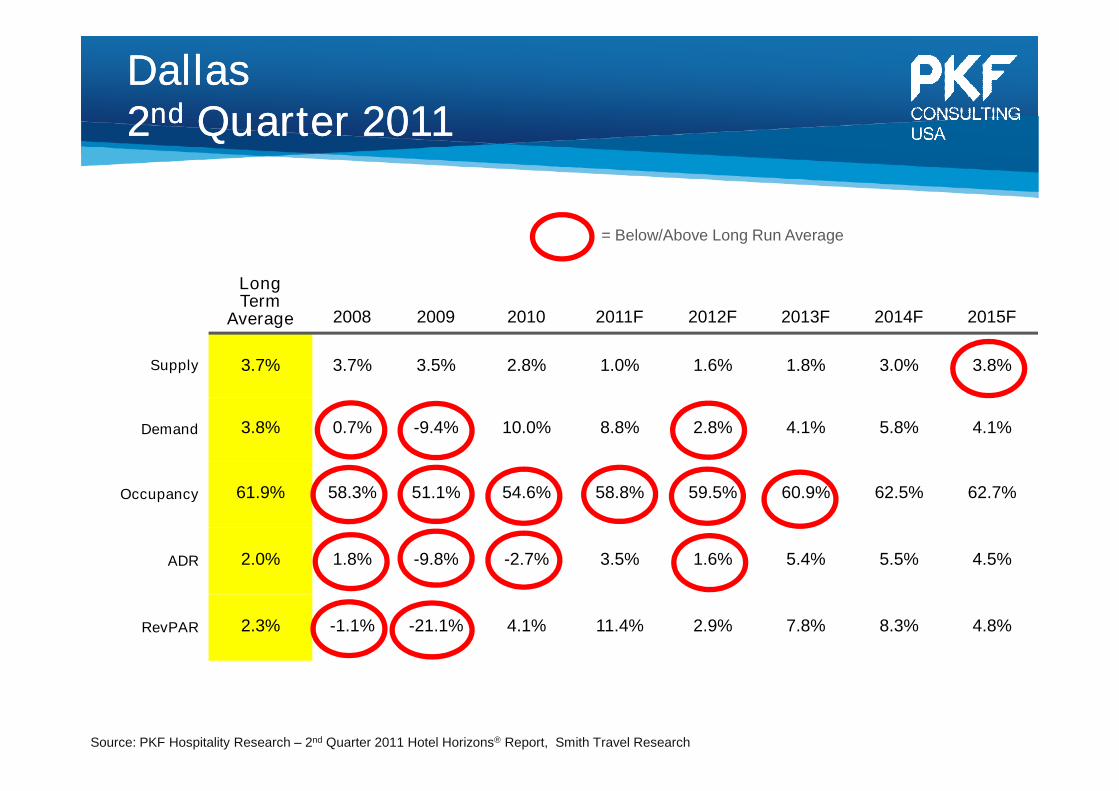
= Below/Above Long Run Average
LongTerm
Average 2008 2009 2010 2011F 2012F 2013F 2014F 2015F
Supply 3.7% 3.7% 3.5% 2.8% 1.0% 1.6% 1.8% 3.0% 3.8%
Demand 3.8% 0.7% -9.4% 10.0% 8.8% 2.8% 4.1% 5.8% 4.1%
Occupancy 61.9% 58.3% 51.1% 54.6% 58.8% 59.5% 60.9% 62.5% 62.7%
ADR 2.0% 1.8% -9.8% -2.7% 3.5% 1.6% 5.4% 5.5% 4.5%
RevPAR 2.3% -1.1% -21.1% 4.1% 11.4% 2.9% 7.8% 8.3% 4.8%
DallasDallas22ndnd Quarter 2011Quarter 2011
Source: PKF Hospitality Research – 2nd Quarter 2011 Hotel Horizons® Report, Smith Travel Research

= Below/Above Long Run Average
LongTerm
Average 2008 2009 2010 2011F 2012F 2013F 2014F 2015F
Supply 4.8% 9.1% 10.0% 3.9% 1.9% 0.8% 0.5% 1.3% 2.0%
Demand 5.0% 3.4% -7.0% 7.8% 6.5% 2.7% 4.3% 4.0% 2.7%
Occupancy 63.4% 64.0% 54.1% 56.1% 58.6% 59.8% 62.0% 63.6% 64.1%
ADR 3.7% 4.8% -1.2% -1.0% 1.5% 2.1% 5.2% 4.2% 3.2%
RevPAR 4.0% -0.6% -16.4% 2.7% 6.0% 4.1% 9.1% 7.0% 3.9%
Fort WorthFort Worth22ndnd Quarter 2011Quarter 2011
Source: PKF Hospitality Research – 2nd Quarter 2011 Hotel Horizons® Report, Smith Travel Research
I.I. The EconomyThe Economy
II.II. Lodging ForecastsLodging Forecasts
III. Journey Through Uncertainty
I.I. The EconomyThe Economy
II.II. Lodging ForecastsLodging Forecasts
III. Journey Through Uncertainty
Presentation OutlinePresentation Outline
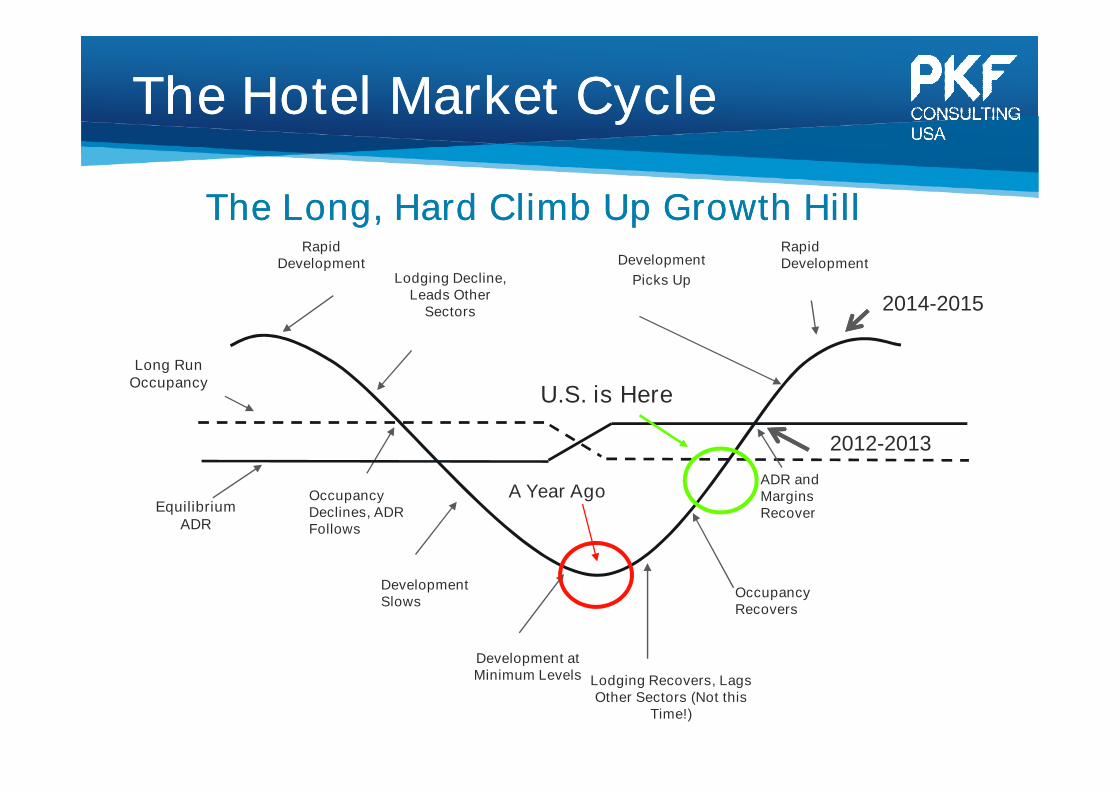
The Hotel Market CycleThe Hotel Market Cycle
RapidDevelopment
OccupancyDeclines, ADRFollows
Development atMinimum Levels
Lodging Decline,Leads Other
Sectors
OccupancyRecovers
ADR andMarginsRecover
Development
Picks Up
DevelopmentSlows
Lodging Recovers, LagsOther Sectors (Not this
Time!)
Long RunOccupancy
RapidDevelopment
EquilibriumADR
U.S. is Here
2012-2013
2014-2015
A Year Ago
The Long, Hard Climb Up Growth HillThe Long, Hard Climb Up Growth Hill

Lessons LearnedLessons Learned
•Certain to Be Uncertainties
•Slow Down Through 2012 Elections
•Occupancy – Up 1 to 2 Points
•Rate - Up About 4%
•Recovery Delayed to 2013 and 2014
For a Copy of This PresentationPlease Visit
www.pkfc.com/presentationsor
Contact: Randy McCaslinEmail: [email protected]
713.621.5252 Ext. 21

Panel:The Capital Markets: What is being bought,
sold, and financed; and who is doing it?
Moderator:Chuck Bedsole, Managing Director – Global Leader Hospitality &
Leisure Group, Alvarez & Marsal Real Estate Advisory Services, LLC
Panelists:Monty Bennett, CEO, Ashford Hospitality Trust, Inc.
Jonathan Falik, Managing Director, Cantor Fitzgerald
Dan Peek, Senior Managing Director, Holliday Fenoglio Fowler, L.P.
Bernie Siegel, Principal, KSL Capital Partners

Presentation:Social Media in the Hospitality Industry
John Fareed
Executive Vice President
Anson-Stoner

Conversations Matter:Global Trends In Social Media (SoMe)

Who was the first person to fly acrossthe Atlantic Ocean solo?

Who was the second?
Bert Hinkler(Sorry, no postage stamp available.)
Who was the third?

Early adopters win.

Engage consumers where they live -SoMe“Which of the following Web sites do you visit at least monthly?”
58%
40%
32%
15%
9%
8%
3%
Source: Forrester’s North American Technographics Travel Online Survey, 2010

Allow me a few moments to review:
The Basics

There are no experts:If anyone tells you they’re an expert, run.

SoMe is no fad:It’s the newest marketing channel.
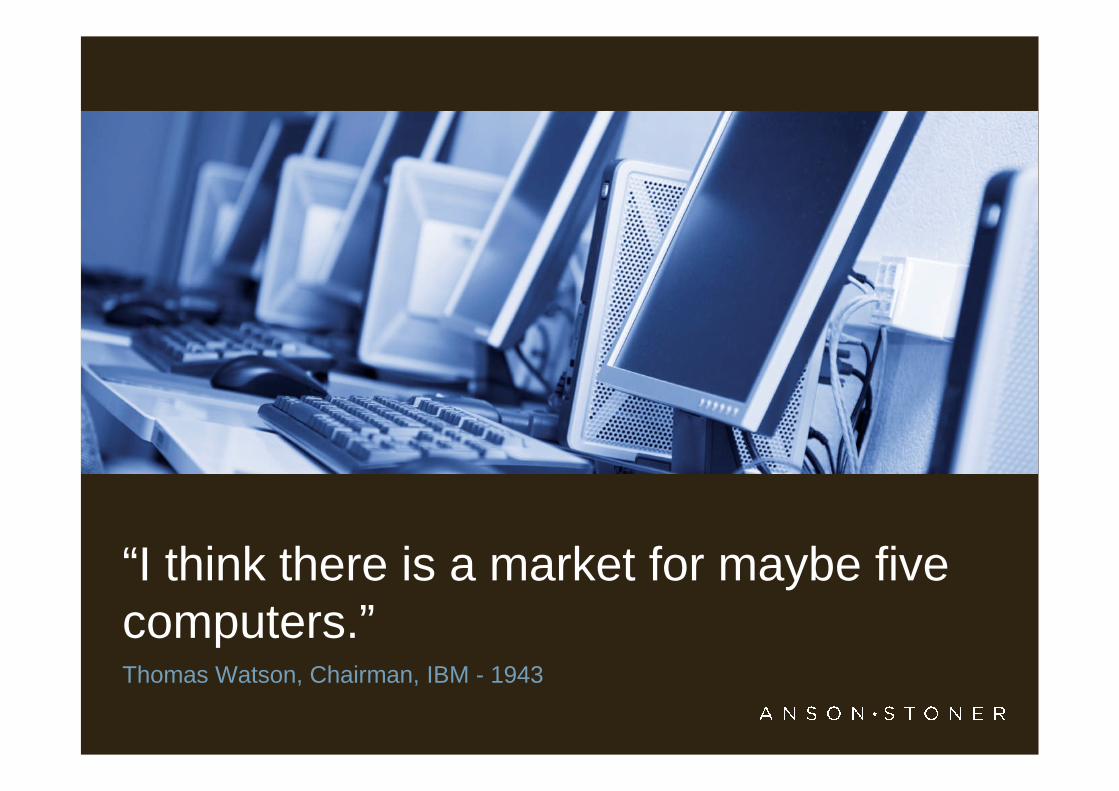
“I think there is a market for maybe fivecomputers.”Thomas Watson, Chairman, IBM - 1943

“There is no reason anyone would wanta computer in their home.”Ken Olsen, Founder, Digital Equipment Corp. - 1977

“It is not the strongest of the species thatsurvives, nor the most intelligent. It istheone that is most adaptable to change.”
- Charles Darwin

Think strategy first:Why? What’s the message? Have a plan.

Get online:At least have the basics.
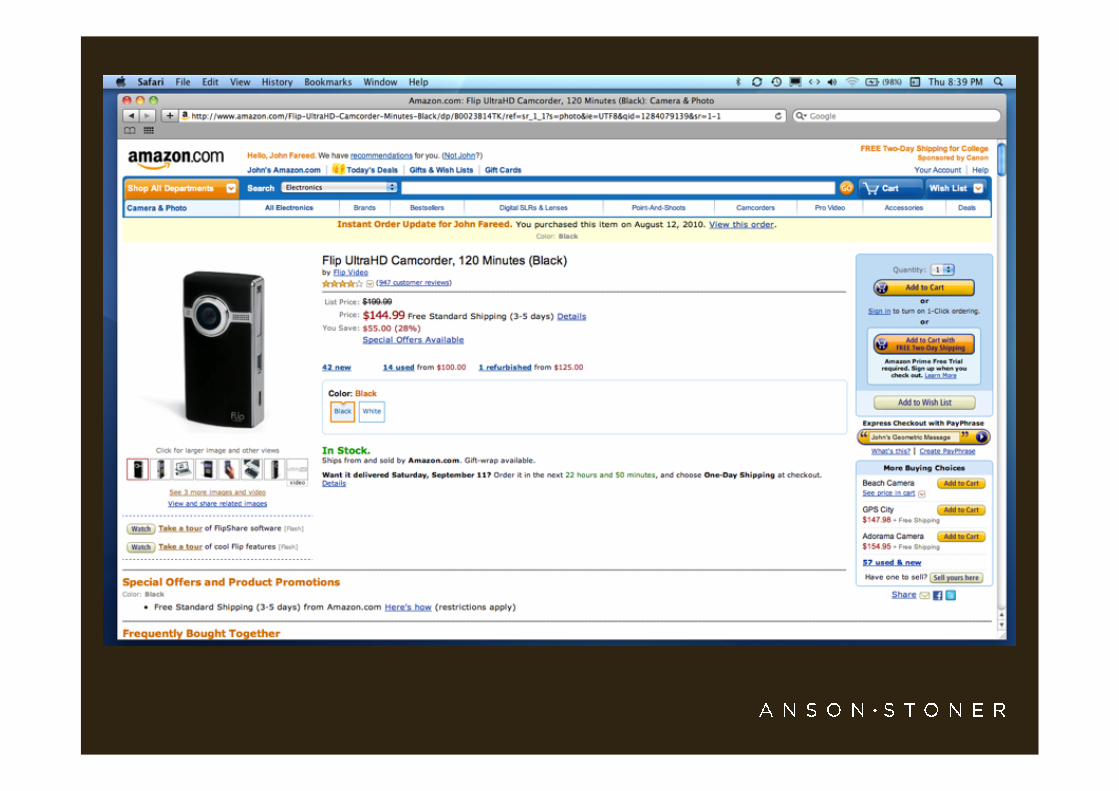
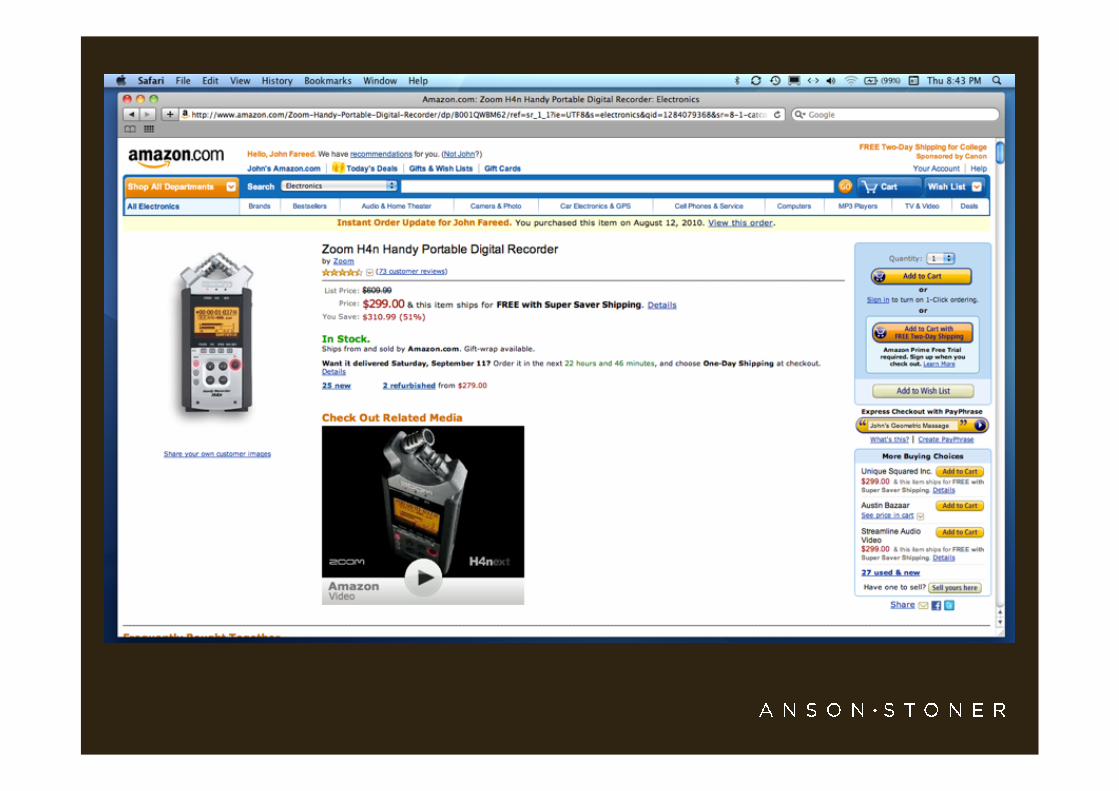
Online reviews, comments andcritiques:Monitor. Respond. Analyze. Improve.

Measure:Unique views. Followers. Fans. Likes. Bookings.

RIGHT NOW

RIGHT NOW
You should be staffing for social media.

RIGHT NOW
You should be finalizing your Social SOP

RIGHT NOW
You should be preparing your social graph forbrand protection and support as much as acustomer communication outlet

RIGHT NOW
Your website should be mobile ready.

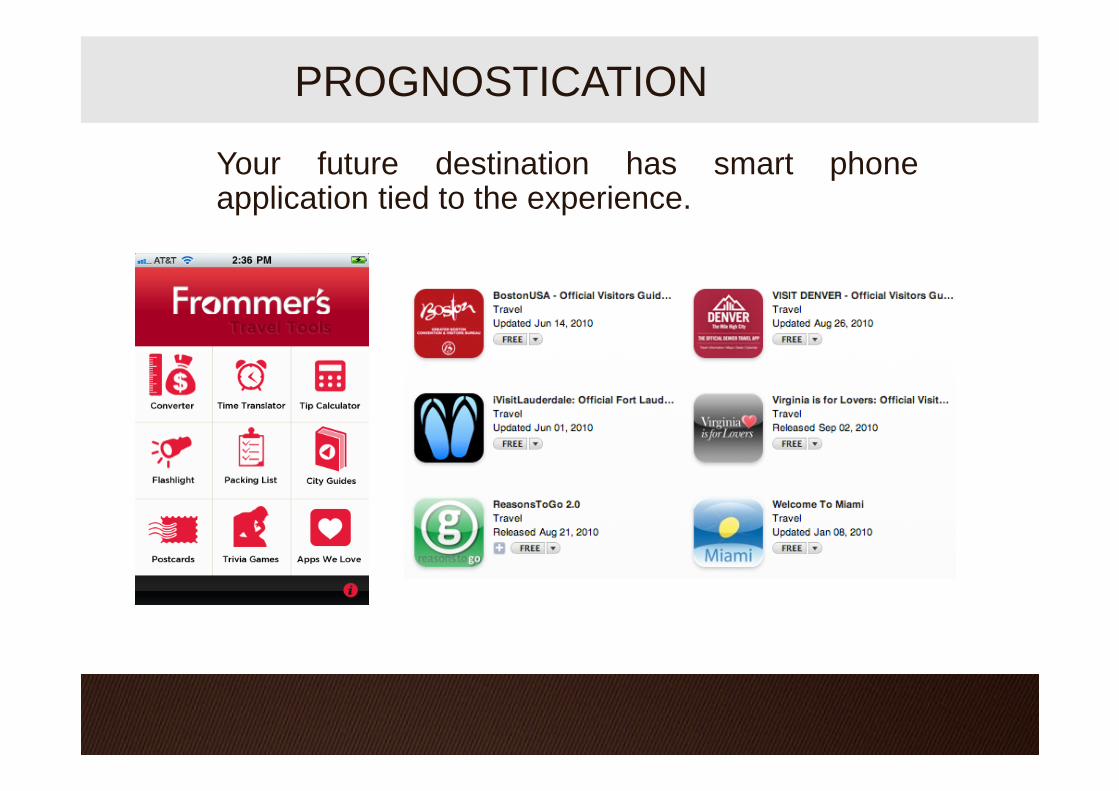
PROGNOSTICATION
PROGNOSTICATION
Your future destination has smart phoneapplication tied to the experience.

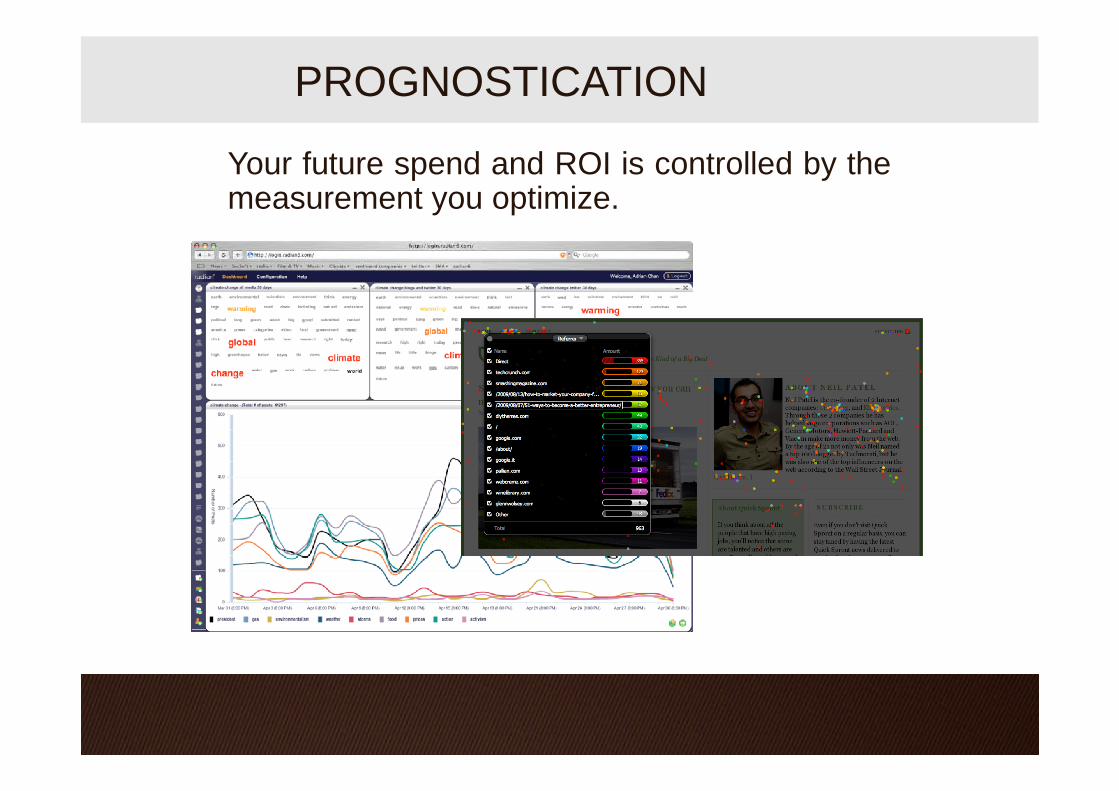
PROGNOSTICATION
Your future is location-based rewarded.

PROGNOSTICATION
Your future customer is customizable.
PROGNOSTICATION
Your future spend and ROI is controlled by themeasurement you optimize.
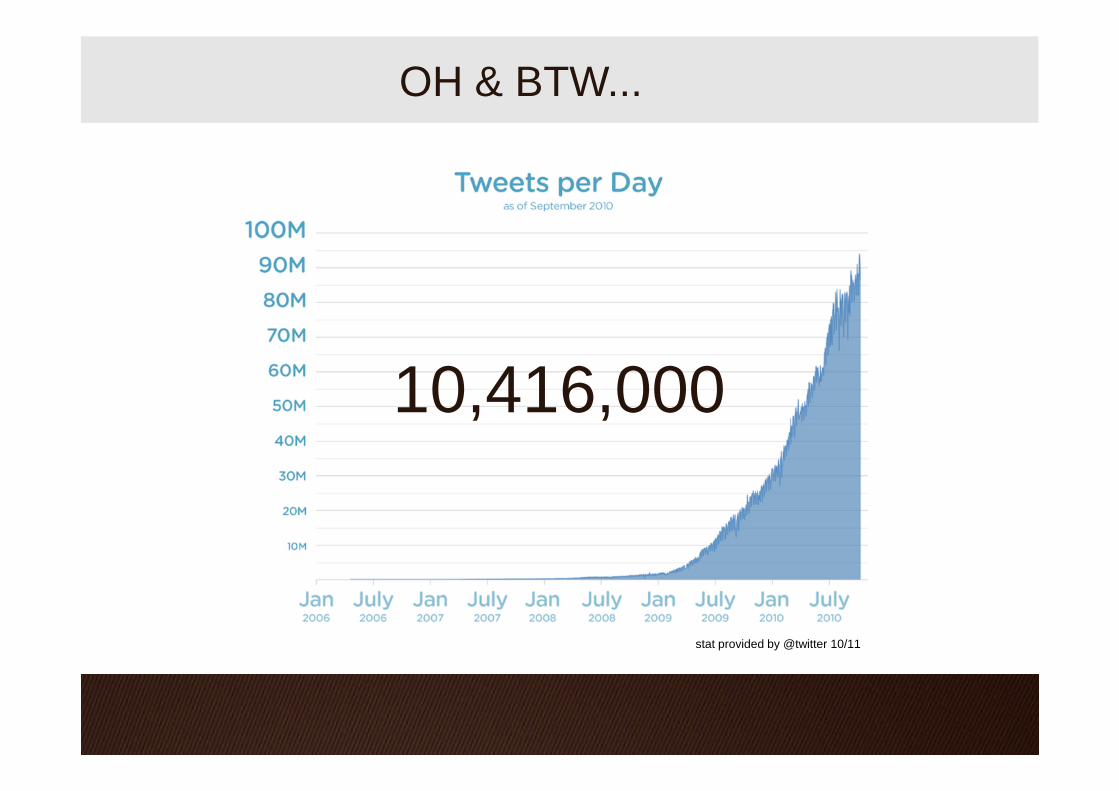
OH & BTW...
10,416,000
stat provided by @twitter 10/11

[email protected]:www.anson-stoner.com

Panel:Owners, Managers and Brands:
Where does the relationship stand?
Moderator:Dave Johnson, President & CEO, Aimbridge Hospitality LP
Panelists:Tom Corcoran, Chairman, Felcor Lodging Trust
Mike Deitemeyer, President, Omni Hotels
Todd Giannoble, President, Archon Hospitality
Bob Warman, President & COO, The West Paces Hotel Group, LLC

Thank you for being our guest at the 2011 Dallas Hotel Conference.
For more information on the Dallas Hotel Conference Sponsors, please see below.
For general conference questions, please contact Jennifer Boren at [email protected]
David W. JohnsonPresident and CEOAimbridge Hospitality [email protected]
Chuck BedsoleManaging Director –Global Leader of Hospitality & Leisure GroupAlvarez & Marsal Real Estate Advisory Services, [email protected]
Clifford J. RismanPartner and Chair, Hospitality Industry TeamGardere Wynne Sewell [email protected]
Daniel C. PeekSenior Managing DirectorHolliday Fenoglio Fowler, [email protected]