2011 Census: Language - · PDF filewho speak a Chinese language, 37% speak Cantonese, ......
22
October 25, 2012 2011 Census: Language The 2011 Census Day was May 9, 2011. Today, Statistics Canada released its fourth set of data from this Census on the language characteristics of Canadians. The population of Toronto in 2011 was 2,615,060, an increase of 4.5% since 2006. The data are not adjusted for undercoverage. For a definition of the concepts and definitions used in this backgrounder, please refer to page 13. Mother Tongue • Toronto continues to be a mosaic of languages. According to the 2011 Census, 45% of Toronto residents had a mother tongue other than English or French. This represents a slight 2-percent decrease from the 2006 figure of 47% (see methodological note on comparability on page 13). • The City of Toronto, York Region, and Peel Region are the most linguistically diverse areas in the Greater Toronto and Hamilton Area. Statistics Canada has identified about 160 mother tongues in the Toronto Census Metropolitan Area. This is a conservative estimate given the exclusion of some languages and dialects that are suppressed due to sampling purposes. • Just over one half of all Toronto residents (51%) reported English as their mother tongue. Languages Spoken Regularly at Home (Home Language) • 28% of people in Toronto regularly spoke a language other than English or French at home (down from the 2006 figure of 31%), compared to 19% in the rest of the GTA/H. • 182,550 (7%) Toronto residents reported regularly speaking multiple languages at home, up from 4% in 2006. • It is interesting to note that there are transformations happening within certain language families. For example: o People who speak Chinese languages regularly at home, including Cantonese, Mandarin and other dialects, make up 7% of Toronto's population. Among those who speak a Chinese language, 37% speak Cantonese, while 28% speak Mandarin. o Mandarin as a home language has increased by 32% since 2006, while Cantonese has decreased by 11% o Indo-Aryan home languages, including Urdu, Gujarati, Bengali, Panjabi (Punjabi), Hindi, Sinhala (Sinhalese), Sindhi, and other languages, collectively make up 4%
Transcript of 2011 Census: Language - · PDF filewho speak a Chinese language, 37% speak Cantonese, ......

October 25, 2012
2011 Census: Language
The 2011 Census Day was May 9, 2011. Today, Statistics Canada released its fourth set of data from this Census on the language characteristics of Canadians. The population of Toronto in 2011 was 2,615,060, an increase of 4.5% since 2006. The data are not adjusted for undercoverage. For a definition of the concepts and definitions used in this backgrounder, please refer to page 13. Mother Tongue
• Toronto continues to be a mosaic of languages. According to the 2011 Census, 45% of Toronto residents had a mother tongue other than English or French. This represents a slight 2-percent decrease from the 2006 figure of 47% (see methodological note on comparability on page 13).
• The City of Toronto, York Region, and Peel Region are the most linguistically diverse areas in the Greater Toronto and Hamilton Area. Statistics Canada has identified about 160 mother tongues in the Toronto Census Metropolitan Area. This is a conservative estimate given the exclusion of some languages and dialects that are suppressed due to sampling purposes.
• Just over one half of all Toronto residents (51%) reported English as their mother tongue.
Languages Spoken Regularly at Home (Home Language)
• 28% of people in Toronto regularly spoke a language other than English or French at home (down from the 2006 figure of 31%), compared to 19% in the rest of the GTA/H.
• 182,550 (7%) Toronto residents reported regularly speaking multiple languages at home, up from 4% in 2006.
• It is interesting to note that there are transformations happening within certain language families. For example:
o People who speak Chinese languages regularly at home, including Cantonese, Mandarin and other dialects, make up 7% of Toronto's population. Among those who speak a Chinese language, 37% speak Cantonese, while 28% speak Mandarin.
o Mandarin as a home language has increased by 32% since 2006, while
Cantonese has decreased by 11%
o Indo-Aryan home languages, including Urdu, Gujarati, Bengali, Panjabi (Punjabi), Hindi, Sinhala (Sinhalese), Sindhi, and other languages, collectively make up 4%

2
of the total population of Toronto. 29% report Urdu as their home language, while around 20% each identify Gujarati and Bengali as their home language.
o The number of people who speak Bengali regularly at home has increased by
22% since 2006, while the number of people identifying Urdu, Gujarati, Panjabi, Sinhala, or Sindhi as a home language has decreased.
• Chinese languages, Tamil, Spanish, Tagalog, and Italian were the top non-English languages spoken at home.
o The top non-English home languages for seniors 65 and over were Chinese languages, Italian, Portuguese, Greek, and Tamil.
o The top non-English home languages for those under 35 were Chinese languages, Tamil, Spanish, Urdu, and Persian (Farsi).
• Of the top-15 non-English home languages in Toronto, Mandarin is the fastest growing, increasing by 32% since 2006. The number of Bengali, Persian, Tagalog, and Spanish speakers is also increasing.
• 5% of Torontonians had no knowledge of either official language, the same percentage as in 2006.
Top-15 Home Languages in the City of Toronto (Excluding English and Multiple Languages)
Persons
% of Toronto
Rank in 2006
Change since 2006
1. Cantonese 67,210 2.8 2 −11%
2. Other Chinese dialects* 64,075 2.7 1 −24%
3. Mandarin 50,430 2.1 6 +32%
4. Tamil 48,680 2.0 3 −4%
5. Spanish 45,330 1.9 5 +3%
6. Tagalog 37,195 1.5 8 +10%
7. Italian 35,025 1.5 4 −21%
8. Portuguese 34,580 1.4 7 −9%
9. Persian (Farsi) 30,595 1.3 11 +11%
10. Russian 26,935 1.1 10 −4%
11. Urdu 26,590 1.1 9 −14%
12. Korean 23,380 1.0 12 −2%
13. Gujarati 19,255 0.8 13 −13%
14. Bengali 17,820 0.7 19 +22%
15. Vietnamese 17,680 0.7 14 −16%
* "Other Chinese dialects" include Hakka, Fukien, Shanghainese, Taiwanese, dialects not otherwise specified, as well as responses of "Chinese" that do not specify a dialect.

3
Top-5 Home Languages in Greater Toronto & Hamilton Region (Excluding English and Multiple Languages)
Durham Region
Persons
1. French 3,745
2. Urdu 3,155
3. Persian (Farsi) 2,240
4. Tamil 2,200
5. Spanish 1,995
York Region
Persons
1. Cantonese 58,370
2. Other Chinese 35,380
3. Russian 23,480
4. Mandarin 20,570
5. Persian (Farsi) 19,720
Peel Region
Persons
1. Panjabi (Punjabi) 86,185
2. Urdu 31,710
3. Polish 20,455
4. Spanish 15,920
5. Tamil 14,395
Halton Region
Persons
1. Spanish 4,650
2. Urdu 3,740
3. Polish 3,720
4. French 3,420
5. Panjabi (Punjabi) 3,115
Hamilton Region
Persons
1. Italian 6,090
2. Spanish 4,335
3. Arabic 3,970
4. Other Chinese 3,550
5. Portuguese 3,410

4
Figures:
• Mother tongue (pages 5-8)
• Home language (pages 9-12)
Maps:
• Top-5 non-official home languages
• Linguistic diversity of Toronto CMA
• Distribution of people with no knowledge of either official language
Need assistance readingthis document? ContactSPAR at [email protected]
5
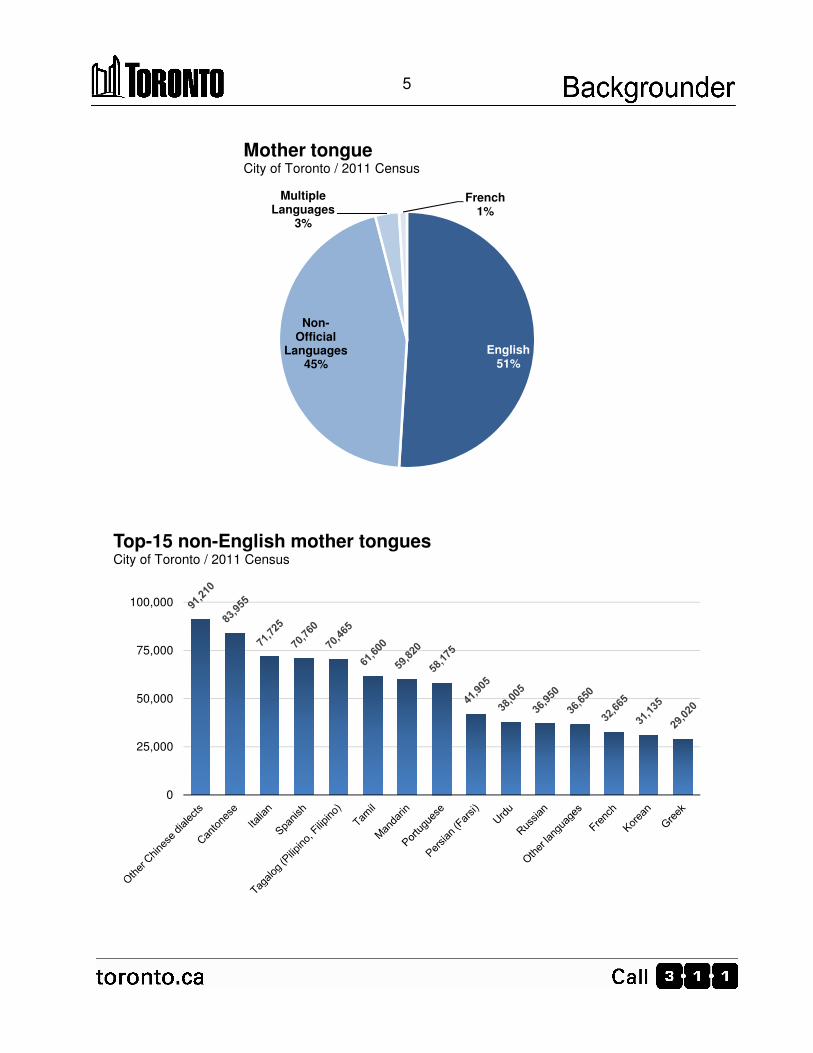
English51%
Non-Official
Languages45%
Multiple Languages
3%
French1%
Mother tongueCity of Toronto / 2011 Census
0
25,000
50,000
75,000
100,000
Top-15 non-English mother tonguesCity of Toronto / 2011 Census

6
49.1 49.4 49.0
26.224.6
15.8
0.0
10.0
20.0
30.0
40.0
50.0
60.0
Toronto Peel York Hamilton Halton Durham
Percentage of people with a non-English mother tongueGreater Toronto and Hamilton Area / 2011 Census

7
Toronto’s language mosaicNumber of people with non-English mother tongues in 2011
Change since 2006
Each box represents the amount of people in the City of
Toronto with a particular mother tongue. The colour of the
box represents the percentage change since the 2006
Census.
For example, there are many people in Toronto with
Italian as a mother tongue, but that number is actually
decreasing over time. Conversely, the number of people
with Bengali as a mother tongue is smaller. However,that number has grown in the last five years.
Mother Tongue
Although the majority of
Torontonians speak English
on a regular basis, many
learned other languages when
growing up. This treemap
illustrates the mosaic of
languages that can be spokenby the Toronto’s residents.
Note: The data for this graphicis summarized on page 8.
Akan
(Twi)
4,760
Amharic
5,690
Arabic
26,075
Armenian
6,485
Bengali
24,320Bisayan
languages
3,435
Bosnian
1,030
Bulgarian4,530
Cantonese
83,955
Cree
105
Creoles
2,880
Croatian
6,035
Czech
3,430
Danish
715
Dutch
3,575
Estonian
2,400
Finnish
1,590Flemish150
French
32,665
German
16,785
Greek
29,020
Gujarati
28,245
Hebrew
4,415
Hindi
12,955 Hungarian
13,525
Ilocano
5,120
Italian
71,725Japanese
6,230
Khmer
1,365
Korean
31,135
Kurdish
1,475
Lao
695
Latvian
1,940
Lithuanian
2,065
Macedonian
6,765
Malay
1,805
Malayalam
3,005
Maltese
1,710
Mandarin
59,820
Nor wegian
265
Ojibway
230
Other Chinese dialects
91,210
Other languages
36,650
Panjabi
(Punjabi)
23,000
Pashto
3,570
Persian (Farsi)
41,905
Polish
27,885
Portuguese
58,175
Romanian
13,300
Russian
36,950
Serbian
13,420
Serbo−Croatian
1,695
Sindhi
2,565
Sinhala
(Sinhalese)
3,280
Slovak
2,410
Slovenian
2,120
Somali
12,200 Spanish
70,760Swahili
2,065
Swedish690
Tagalog
70,465
Tamil
61,600
Telugu
2,490
Tig rigna
3,290
Turkish
7,860
Ukrainian
15,640Urdu
38,005
Vietnamese
23,575
Yiddish
3,320
−40% −30% −20% −10% 0.0 10% 20% 30% 40% 50% 60%

8
4,760
5,120
5,690
6,035
6,230
6,485
6,765
7,860
12,200
12,955
13,300
13,420
13,525
15,640
16,785
23,000
23,575
24,320
26,075
27,885
28,245
29,020
31,135
32,665
36,650
36,950
38,005
41,905
58,175
59,820
61,600
70,465
70,760
71,725
83,955
91,210
Akan (Twi)
Ilocano
Amharic
Croatian
Japanese
Armenian
Macedonian
Turkish
Somali
Hindi
Romanian
Serbian
Hungarian
Ukrainian
German
Panjabi (Punjabi)
Vietnamese
Bengali
Arabic
Polish
Gujarati
Greek
Korean
French
Other languages
Russian
Urdu
Persian (Farsi)
Portuguese
Mandarin
Tamil
Tagalog (Pilipino, Filipino)
Spanish
Italian
Cantonese
Other Chinese dialects
Toronto Mother Tongues
5
10
15
105
150
230
265
690
695
715
1,030
1,365
1,475
1,590
1,695
1,710
1,805
1,940
2,065
2,065
2,120
2,400
2,410
2,490
2,565
2,645
2,880
3,005
3,280
3,290
3,320
3,430
3,435
3,570
3,575
4,415
4,530
Dene
Mi'kmaq
Inuktitut
Cree
Flemish
Ojibway
Norwegian
Swedish
Lao
Danish
Bosnian
Khmer (Cambodian)
Kurdish
Finnish
Serbo-Croatian
Maltese
Malay
Latvian
Lithuanian
Swahili
Slovenian
Estonian
Slovak
Telugu
Sindhi
Other Indo-Aryan
Creoles
Malayalam
Sinhala (Sinhalese)
Tigrigna
Yiddish
Czech
Bisayan languages
Pashto
Dutch
Hebrew
Bulgarian
Note:
"Other Chinese dialects" refers to dialects other than
Mandarin or Cantonese, as well as
those who only indicate "Chinese".

9
English64%
Non-Official
Languages28%
Multiple Languages
7%
French1%
Language spoken at homeCity of Toronto / 2011 Census
0
25,000
50,000
75,000
Top-15 non-English home languagesCity of Toronto / 2011 Census

10
36.0 36.133.9
15.9
13.3
8.1
0.0
5.0
10.0
15.0
20.0
25.0
30.0
35.0
40.0
Toronto Peel York Hamilton Halton Durham
Percent of people with a non-English home languageGreater Toronto and Hamilton Area / 2011 Census

11
Home languages in TorontoNumber of people who speak a language other than English regularly at home in 2011
Change since 2006
Each box represents the amount of people in the City of
Toronto with a particular home language. The colour of
the box represents the percentage change since the2006 Census.
For example, there are fewer people who speak Tagalog
regularly at home than than Cantonese. But the number
of people speaking Tagalog at home has increased, while
the number of Cantonese speakers has decreased.
Home Language
Many Toronto residents do not
speak English on a regularbasis at home.
This treemap illustrates the
diverse range of languages
that Torontonians are
comfortable speaking.
Note: The data for this graphicis summarized on page 12.
Akan
(Twi)
2,960
Amha ric
3,435
Arabic
15,800
Armenian
4,085
Bengali
17,820
Bisayan
languages
1,205
Bosnian
550
Bulga rian
2,720
Cantonese
67,210
Creoles
1,670
Croatian
2,510
Czech
1,480
Danish50
Dutch
355
Estonian815
Finnish400
French
13,535
German
2,550 Greek
14,470
Gujarati
19,255
Hebrew
1,895
Hindi
7,275
Hungarian
6,840Ilocano
1,930
Italian
35,025
Japanese
2,955
Khmer(Cambodian)
820
Korean
23,380Kurdish
830
Lao
395
Latvian
725
Lithuanian
800
Macedonian
3,375
Malay660
Malayalam
1,560
Maltese545
Mandarin
50,430
Ojibway75
Other Chinese dialects
64,075
Other languages
20,265
Panjabi
(Punjabi)15,890
Pashto
2,655
Persian (Farsi)
30,595
Polish
13,345
Portuguese
34,580
Romanian
7,540
Russian
26,935
Serbian
8,840
Serbo−
Croatian810
Sindhi
1,315
Sinhala
(Sinhalese)
1,695
Slovak
880Slovenian680
Somali
8,935
Spanish
45,330
Swahili
1,010
Swedish115
Tagalog
37,195
Tamil
48,680
Telugu
1,560
Tigrigna
1,925
Turkish
5,445
Ukrainian
7,630
Urdu
26,590
Vietnamese
17,680
Yiddish
430
−60% −40% −20% 0.0 20% 40% 60% 80%

12
2,655
2,720
2,955
2,960
3,375
3,435
4,085
5,445
6,840
7,275
7,540
7,630
8,840
8,935
13,345
13,535
14,470
15,800
15,890
17,680
17,820
19,255
20,265
23,380
26,590
26,935
30,595
34,580
35,025
37,195
45,330
48,680
50,430
64,075
67,210
Pashto
Bulgarian
Japanese
Akan (Twi)
Macedonian
Amharic
Armenian
Turkish
Hungarian
Hindi
Romanian
Ukrainian
Serbian
Somali
Polish
French
Greek
Arabic
Panjabi (Punjabi)
Vietnamese
Bengali
Gujarati
Other languages
Korean
Urdu
Russian
Persian (Farsi)
Portuguese
Italian
Tagalog (Pilipino, Filipino)
Spanish
Tamil
Mandarin
Other Chinese dialects
Cantonese
Toronto Home Languages
5
5
20
25
45
50
75
115
355
395
400
430
545
550
660
680
725
800
810
815
820
830
880
1,010
1,205
1,315
1,480
1,560
1,560
1,575
1,670
1,695
1,895
1,925
1,930
2,510
2,550
Inuktitut
Mi'kmaq
Flemish
Cree
Norwegian
Danish
Ojibway
Swedish
Dutch
Lao
Finnish
Yiddish
Maltese
Bosnian
Malay
Slovenian
Latvian
Lithuanian
Serbo-Croatian
Estonian
Khmer (Cambodian)
Kurdish
Slovak
Swahili
Bisayan languages
Sindhi
Czech
Malayalam
Telugu
Other Indo-Aryan
Creoles
Sinhala (Sinhalese)
Hebrew
Tigrigna
Ilocano
Croatian
German
Note:
"Other Chinese dialects" refers to dialects other than
Mandarin or Cantonese, as well as
those who only indicate "Chinese".

13
CONCEPTS AND DEFINITIONS: Mother tongue: First language learned at home in childhood and still understood at the time of the census. Home language: Language spoken most often at home or on a regular basis at home. Knowledge of official languages: Ability to conduct a conversation in English or French. Other Chinese dialects: Dialects other than Cantonese or Mandarin (e.g. Hakka, Fukien, Taiwanese, and Shanghainese) as well as anyone responding "Chinese" without specifying a specific dialect ("Chinese n.o.s"). Other languages: Languages not otherwise specified. For comparability purposes, languages included in the 2011 Census but not included in the 2006 Census, and vice versa, are also categorized as "other languages". Linguistic diversity: The probability that any two people selected at random would have different mother tongues. Calculated using Greenberg's Linguistic Diversity Index. FREQUENTLY ASKED QUESTIONS: What is meant by the term “undercoverage”? Statistics Canada's numbers upon release and as reported above do not account for undercoverage. Although Statistics Canada makes a great effort to count every person, in each Census a notable number of people are left out for a variety of reasons. For example, people may be traveling, some dwellings are hard to find, and some people simply refuse to participate. While Statistics Canada takes this into account and estimates an ‘undercoverage’ rate for the urban region (CMA) every Census, it does not estimate undercoverage for the City. However, based on the Annual Demographic Estimates, Cat. No. 91-214-XWE released March 7, 2012, the implied net undercoverage rate for the City of Toronto in 2011 is estimated to be 4.69%. Net undercoverage also varies by age and sex and is highest for those between 15 and 44 years of age. In 2006, net undercoverage peaked at 9.91% for males and 6.08% for females 24-34 years of age, per the 2006 Census Technical Report: Coverage, Cat. No. 92-567-X, released March 2010. How do the changes in the 2011 Census methodology affect this release? There have been changes in the way information has been collected for portions of the 2011 Census. This will impact the extent to which comparisons can be made with previous Census

14
periods on some Census variables. Questions on language that previously appeared in the long-form Census were, for the first time, included in the 2011 'short-form' Census. Statistics Canada reports that there have been changes in response patterns to both the mother tongue and home language questions. Canadians may have been less inclined to report a non-official language mother tongue. They may have also been more likely to report multiple mother tongues and home languages. Statistics Canada plans to release a report in the future analyzing the comparability of language data. Has the City of Toronto completed backgrounders on any other 2011 Census data? The City of Toronto will be preparing Backgrounders coinciding with each release of data from the 2011 Census and the National Household Survey. The backgrounders will be available on the City's web site at www.toronto.ca/demographics. The 2011 Census release schedule is as follows:
• Population and Dwellings – February 8, 2012 (Backgrounder: http://www.toronto.ca/demographics/pdf/2011-census-backgrounder.pdf)
• Age and Sex – May 29, 2012 (Backgrounder: http://www.toronto.ca/demographics/pdf/censusbackgrounder_ageandsex_2011.pdf) • Families, Households and Marital Status – September 19, 2012 (Backgrounder:
http://www.toronto.ca/demographics/pdf/censusbackgrounder_hhds_2011.pdf) • Structural Type of Dwelling and Collectives – September 19, 2012 (Backgrounder:
http://www.toronto.ca/demographics/pdf/censusbackgrounder_hhds_2011.pdf) • Language – October 24, 2012
The results of the new voluntary National Household Survey (NHS) will be released in 2013: • Immigration, Citizenship, Language, Ethnic Origin, Visible Minorities, Religion,
Aboriginal Peoples – May 8, 2013 • Labour, Education, Place of Work, Commuting, Mobility, Migration, Language of Work
– June 26, 2013 • Income, Earnings, Housing and Shelter Costs – August 14, 2013
When are the City’s Ward Profiles and Neighbourhood Profiles being released? The Ward Profiles are based on a series of custom tabulations from what are now the Census and the NHS. City Planning staff will update the Ward Profiles when they can obtain the necessary custom tabulations from Statistics Canada based on 2011 data from both Surveys, beginning in late 2013. The current Ward Profiles can be found at: http://app.toronto.ca/wards/jsp/wards.jsp The Neighbourhood Profiles will be released through the Social Development Finance & Administration Division a few weeks after each Census and NHS release. These profiles are released sooner than the Ward Profiles because the data are not based on custom tabulations. The current Neighbourhood Profiles can be found at: http://www.toronto.ca/demographics/neighbourhoods.htm

15
Will these data be found anywhere else on the City's website? Yes. Portions of the Census and National Household Survey will also be found in WELLBEING TORONTO – an online mapping application that provides a wide range of socio-economic indicators that help measure quality of life in the City's 140 neighbourhoods. The data on WELLBEING TORONTO are also available free for downloading at www.toronto.ca/wellbeing. Prepared by:
• Social Policy, Analysis & Research, Social Development, Finance & Administration
• Office of the Deputy City Manager's Office, Cluster A
• Toronto Children's Services
• Toronto Public Library For questions on this release, contact: Wayne Chu Planning Analyst, Social Policy, Analysis & Research Social Development Finance & Administration Tel. No. 416-392-6125, Fax No. 416-392-4976 Email: [email protected] For media inquiries and other questions about the Census, contact: Harvey Low Manager, Social Policy, Analysis & Research Social Development Finance & Administration Tel. No. 416-392-8660, Fax No. 416-392-4976 Email: [email protected]

Legend
Chinese Dialects
0 - 40
41 - 80
81 - 170
171 - 450
451 - 4,350
Source: Statistics Canada, Census 2011; City of Toronto.
Copyright (c) 2012 City of Toronto. All Rights Reserved.Published: October 24, 2012Prepared by: Social Policy Analysis & ResearchContact: [email protected]
0 1 2 3 4
Km
Home Language - Chinese DialectsBy Census Tract
* "Chinese dialects" include Cantonese, Mandarin,Hakka, Shanghainese, Taiwanese,dialects not otherwise specified, as well asresponses of "Chinese" that do not specify a dialect.

Legend
Tamil
0
1 - 10
11 - 40
41 - 155
156 - 1,995
Source: Statistics Canada, Census 2011; City of Toronto.
Copyright (c) 2012 City of Toronto. All Rights Reserved.Published: October 24, 2012Prepared by: Social Policy Analysis & ResearchContact: [email protected]
0 1 2 3 4
Km
Home Language - TamilBy Census Tract

Legend
Spanish
0 - 20
21 - 40
41 - 75
76 - 135
136 - 850
Source: Statistics Canada, Census 2011; City of Toronto.
Copyright (c) 2012 City of Toronto. All Rights Reserved.Published: October 24, 2012Prepared by: Social Policy Analysis & ResearchContact: [email protected]
0 1 2 3 4
Km
Home Language - SpanishBy Census Tract

Legend
Tagalog (Pilipino, Filipino)
0 - 10
11 - 30
31 - 60
61 - 120
121 - 1,030
Source: Statistics Canada, Census 2011; City of Toronto.
Copyright (c) 2012 City of Toronto. All Rights Reserved.Published: October 24, 2012Prepared by: Social Policy Analysis & ResearchContact: [email protected]
0 1 2 3 4
Km
Home Language - TagalogBy Census Tract
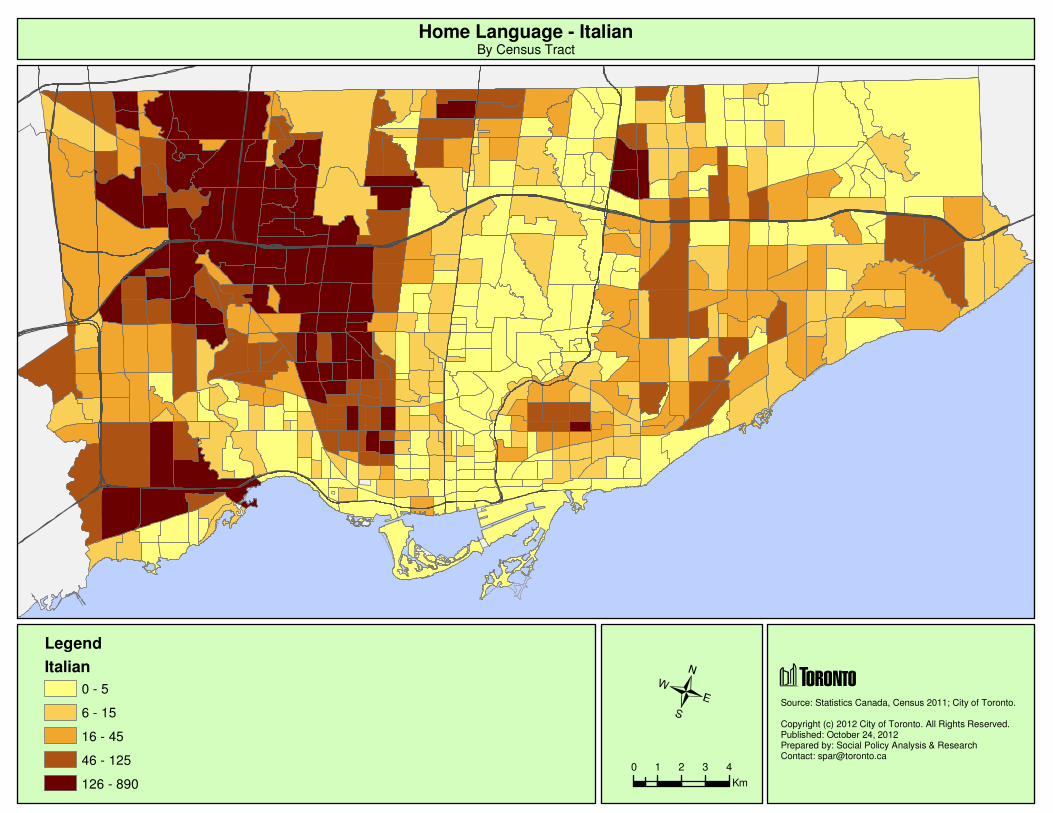
Legend
Italian
0 - 5
6 - 15
16 - 45
46 - 125
126 - 890
Source: Statistics Canada, Census 2011; City of Toronto.
Copyright (c) 2012 City of Toronto. All Rights Reserved.Published: October 24, 2012Prepared by: Social Policy Analysis & ResearchContact: [email protected]
0 1 2 3 4
Km
Home Language - ItalianBy Census Tract

Legend
Linguistic Diversity Index Value
Less Diverse
0.10 - 0.30
0.31 - 0.46
0.47 - 0.62
0.63 - 0.75
0.76 - 0.91
No Data
Source: Statistics Canada, Census 2011; City of Toronto.
Copyright (c) 2012 City of Toronto. All Rights Reserved.Published: October 24, 2012Prepared by: Social Policy Analysis & ResearchContact: [email protected]
0 2.5 5 7.5 10
Km
Linguistic Diversity IndexBy Census Tract
More Diverse
Linguistic diversity:The probability that any two people selectedat random would have different mother tongues.Calculated using Greenberg's LinguisticDiversity Index.

Legend
Neither English nor French
0 - 65
66 - 140
141 - 240
241 - 390
391 - 1,990
Source: Statistics Canada, Census 2011; City of Toronto.
Copyright (c) 2012 City of Toronto. All Rights Reserved.Published: October 24, 2012Prepared by: Social Policy Analysis & ResearchContact: [email protected]
0 1 2 3 4
Km
Distribution of People with no Knowledge of Either Official LanguageBy Census Tract