2010 Peer Comparison
15
Comparison of Performance Measures for the 30 Largest Motorbus/Trolleybus Transit Agencies in the United States 2010 Source: 2010 and 2006 National Transit Database of the Federal Transit Administration
-
Upload
king-county-metro-transit -
Category
Documents
-
view
212 -
download
0
description
Comparison of Performance Measures for the 30 Largest Motorbus/Trolleybus Transit Agencies in the United States.
Transcript of 2010 Peer Comparison

Comparison of Performance Measures for the 30 Largest Motorbus/Trolleybus Transit
Agencies in the United States
2010
Source: 2010 and 2006 National Transit Database of the Federal Transit Administration

34.8
35.9
36.6
37.2
37.7
41.3
42.2
48.5
53.4
56.4
56.4
60.5
61.4
66.5
66.9
68.0
70.3
73.2
73.2
76.2
109.0
111.3
120.2
128.4
158.6
162.2
183.6
306.0
366.0
829.2
0 100 200 300 400 500 600 700 800 900
Austin
Cleveland
Detroit
Phoenix
Dallas
San Antonio
Milwaukee
San Diego
Orange
Pittsburgh
Las Vegas
Portland
Oakland
Houston
Minneapolis
Atlanta
Miami
Honolulu
Baltimore
Denver
King County
Boston
MTA New York Bus
Washington DC
San Francisco
New Jersey
Philadelphia
Chicago
Los Angeles
MTA New York City Transit
2010 Boardings in MillionsMotorbus and Trolley Bus
1

-9.5%
-8.3%
-6.1%
-5.9%
-5.3%
-3.5%
-3.0%
-2.6%
-2.2%
-2.1%
-2.1%
-1.5%
-1.5%
-1.4%
-0.8%
-0.4%
-0.3%
-0.2%
-0.2%
0.0%
0.3%
0.6%
0.6%
0.9%
1.0%
1.0%
1.6%
2.0%
5.3%
-2.1%
0.7%
-12% -10% -8% -6% -4% -2% 0% 2% 4% 6% 8%
New Jersey
Austin
Boston
Chicago
Denver
Philadelphia
Minneapolis
Honolulu
King County
San Diego
MTA New York Bus
Cleveland
Atlanta
Detroit
Washington DC
Las Vegas
Pittsburgh
Portland
Oakland
Baltimore
Los Angeles
MTA New York City Transit
Milwaukee
Miami
Orange
Phoenix
Houston
Dallas
Average
San AntonioSan Francisco
Average Annual Percent Change in BoardingsMotorbus and Trolley Bus, 2006 to 2010
2
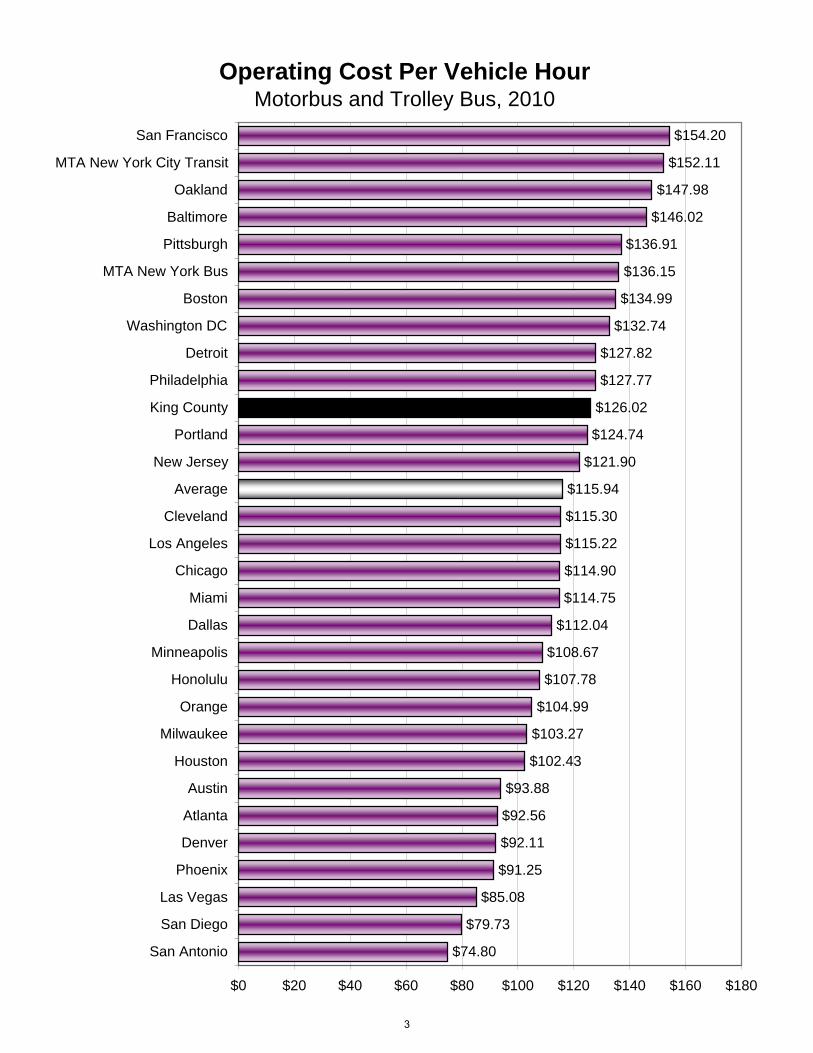
$74.80
$79.73
$85.08
$91.25
$92.11
$92.56
$93.88
$102.43
$103.27
$104.99
$107.78
$108.67
$112.04
$114.75
$114.90
$115.22
$115.30
$115.94
$121.90
$124.74
$126.02
$127.77
$127.82
$132.74
$134.99
$136.15
$136.91
$146.02
$147.98
$152.11
$154.20
$0 $20 $40 $60 $80 $100 $120 $140 $160 $180
San Antonio
San Diego
Las Vegas
Phoenix
Denver
Atlanta
Austin
Houston
Milwaukee
Orange
Honolulu
Minneapolis
Dallas
Miami
Chicago
Los Angeles
Cleveland
Average
New Jersey
Portland
King County
Philadelphia
Detroit
Washington DC
Boston
MTA New York Bus
Pittsburgh
Baltimore
Oakland
MTA New York City Transit
San Francisco
Operating Cost Per Vehicle HourMotorbus and Trolley Bus, 2010
3

-1.8%
-1.2%
-0.5%
0.8%
2.4%
2.7%
2.9%
3.0%
3.0%
3.5%
3.6%
3.7%
3.7%
3.8%
4.0%
4.1%
4.2%
4.2%
4.4%
4.5%
4.8%
5.2%
5.3%
5.4%
6.0%
6.1%
6.7%
6.9%
7.0%
7.6%
10.2%
-4% -2% 0% 2% 4% 6% 8% 10% 12%
Austin
San Antonio
Orange
Minneapolis
Atlanta
New Jersey
Los Angeles
King County
Denver
Honolulu
Oakland
Washington DC
Average
Milwaukee
Houston
Phoenix
Dallas
Miami
Portland
Philadelphia
MTA New York City Transit
Las Vegas
San Francisco
Boston
Cleveland
Pittsburgh
Baltimore
MTA New York Bus
Detroit
Chicago
Average Annual Percent Change in OperatingCost Per Vehicle Hour, 2006 to 2010
San Diego
4
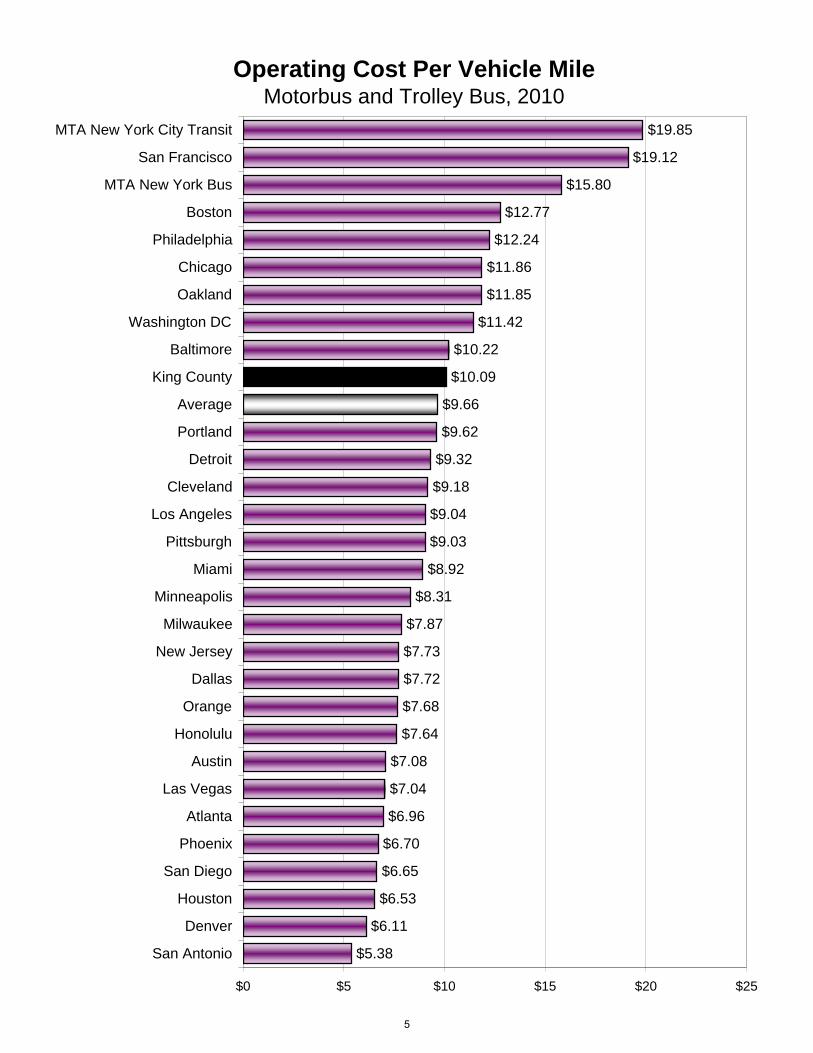
$5.38
$6.11
$6.53
$6.65
$6.70
$6.96
$7.04
$7.08
$7.64
$7.68
$7.72
$7.73
$7.87
$8.31
$8.92
$9.03
$9.04
$9.18
$9.32
$9.62
$9.66
$10.09
$10.22
$11.42
$11.85
$11.86
$12.24
$12.77
$15.80
$19.12
$19.85
$0 $5 $10 $15 $20 $25
San Antonio
Denver
Houston
San Diego
Phoenix
Atlanta
Las Vegas
Austin
Honolulu
Orange
Dallas
New Jersey
Milwaukee
Minneapolis
Miami
Pittsburgh
Los Angeles
Cleveland
Detroit
Portland
Average
King County
Baltimore
Washington DC
Oakland
Chicago
Philadelphia
Boston
MTA New York Bus
San Francisco
MTA New York City Transit
Operating Cost Per Vehicle MileMotorbus and Trolley Bus, 2010
5

-1.0%
-0.6%
1.5%
2.5%
2.8%
2.8%
3.0%
3.6%
3.8%
4.0%
4.0%
4.1%
4.2%
4.3%
4.7%
4.7%
4.8%
5.5%
5.6%
5.7%
5.7%
5.9%
5.9%
6.0%
6.1%
6.2%
7.0%
7.9%
7.9%
8.5%
13.0%
-2% 0% 2% 4% 6% 8% 10% 12% 14%
Austin
Atlanta
New Jersey
San Antonio
Orange
King County
Oakland
Houston
Minneapolis
Denver
Washington DC
Honolulu
Milwaukee
Los Angeles
Average
Dallas
Las Vegas
Phoenix
Philadelphia
Miami
San Diego
Pittsburgh
MTA New York City Transit
Portland
Boston
Baltimore
San Francisco
Cleveland
MTA New York Bus
Average Annual Percent Change in OperatingCost Per Vehicle Mile, 2006 to 2010
Detroit
Chicago
6

17.2
21.2
22.3
24.9
25.4
26.1
26.2
27.4
28.9
29.0
29.4
29.4
29.6
29.7
30.2
30.3
30.3
30.6
30.9
31.6
32.5
33.3
34.4
37.6
41.7
42.3
44.6
48.4
49.5
55.1
62.5
0 10 20 30 40 50 60 70
Dallas
Houston
Phoenix
Denver
New Jersey
San Antonio
Miami
Pittsburgh
Cleveland
Orange
San Diego
MTA New York Bus
Atlanta
Detroit
Austin
Minneapolis
Oakland
Washington DC
King County
Portland
Milwaukee
Average
Baltimore
Las Vegas
Philadelphia
Boston
Los Angeles
Honolulu
Chicago
MTA New York City Transit
San Francisco
Boardings Per Vehicle HourMotorbus and Trolley Bus, 2010
7

-8.5%
-7.9%
-6.6%
-3.9%
-3.2%
-3.0%
-2.7%
-2.4%
-2.3%
-2.3%
-1.8%
-1.4%
-1.4%
-1.1%
-0.9%
-0.8%
-0.7%
-0.7%
-0.3%
0.0%
0.1%
0.3%
0.3%
0.5%
0.8%
1.0%
1.2%
2.5%
3.0%
3.4%
4.6%
-10% -8% -6% -4% -2% 0% 2% 4% 6%
Philadelphia
Minneapolis
Honolulu
Detroit
King County
Miami
MTA New York Bus
Denver
Pittsburgh
Boston
Chicago
San Diego
Cleveland
Phoenix
Atlanta
Baltimore
Orange
Dallas
Houston
Washington DC
Portland
San Antonio
MTA New York City Transit
Los Angeles
Average
Average Annual Percentage Change inBoardings Per Vehicle Hour, 2006 to 2010
Austin
San Francisco
New Jersey
Las Vegas
Milwaukee
Oakland
8

5.2
6.1
6.9
7.6
7.7
7.9
8.2
8.3
8.7
8.8
8.9
9.0
9.3
9.3
9.3
10.2
10.2
10.2
10.4
10.4
10.4
10.7
11.0
11.1
11.7
11.8
13.1
14.2
15.0
15.9
18.1
0 5 10 15 20
Dallas
Phoenix
Oakland
Milwaukee
Pittsburgh
San Antonio
Washington DC
Denver
Cleveland
San Diego
Atlanta
Houston
Austin
Portland
Orange
Boston
Average
MTA New York Bus
Las Vegas
King County
Minneapolis
New Jersey
Miami
Detroit
Philadelphia
Chicago
Baltimore
Los Angeles
San Francisco
MTA New York City Transit
Honolulu
Passenger Mile Per Vehicle MileMotorbus and Trolley Bus, 2010
9

-10.8%
-8.1%
-7.9%
-4.8%
-3.9%
-3.2%
-2.8%
-2.1%
-1.7%
-1.5%
-1.0%
-0.2%
0.0%
0.2%
0.2%
0.4%
0.5%
1.6%
1.6%
1.6%
1.6%
1.9%
2.0%
2.4%
3.1%
3.9%
4.5%
4.6%
5.1%
8.9%
10.5%
-15% -10% -5% 0% 5% 10% 15%
Cleveland
Average
Denver
MTA New York City Transit
Philadelphia
Los Angeles
Pittsburgh
San Francisco
New Jersey
Chicago
Milwaukee
Baltimore
Minneapolis
Austin
San Diego
Honolulu
Miami
Boston
Average Annual Percentage Change inPassenger Mile Per Vehicle Mile, 2006 to 2010
MTA New York Bus
Phoenix
Oakland
Houston
Las Vegas
Atlanta
King County
Washington DC
San Antonio
Orange
Portland
Dallas
Detroit
10

$2.23
$2.26
$2.32
$2.47
$2.58
$2.72
$2.76
$2.87
$3.06
$3.11
$3.13
$3.18
$3.19
$3.59
$3.62
$3.70
$3.71
$3.95
$3.99
$4.08
$4.10
$4.25
$4.31
$4.34
$4.38
$4.63
$4.80
$4.83
$4.88
$5.00
$6.52
$0 $1 $2 $3 $4 $5 $6 $7
Honolulu
Las Vegas
Chicago
San Francisco
Los Angeles
San Diego
MTA New York City Transit
San Antonio
Philadelphia
Austin
Atlanta
Milwaukee
Boston
Minneapolis
Orange
Average
Denver
Portland
Cleveland
King County
Phoenix
Baltimore
Detroit
Washington DC
Miami
MTA New York Bus
New Jersey
Houston
Oakland
Pittsburgh
Dallas
Operating Cost Per BoardingMotorbus and Trolley Bus, 2010
11

-4.1%
-2.1%
0.2%
1.1%
2.3%
2.8%
3.0%
3.3%
3.4%
3.8%
3.9%
4.1%
5.3%
5.3%
5.7%
5.8%
6.1%
6.5%
6.5%
7.0%
7.0%
7.0%
7.3%
8.2%
8.4%
8.9%
10.2%
11.2%
14.6%
18.1%
19.5%
-10% -5% 0% 5% 10% 15% 20% 25%
San Diego
Austin
Denver
Minneapolis
King County
Boston
Honolulu
New Jersey
Miami
Pittsburgh
Philadelphia
Milwaukee
Washington DC
Los Angeles
Average
San Antonio
Orange
San Francisco
Portland
Las Vegas
Oakland
Atlanta
MTA New York City Transit
MTA New York Bus
Cleveland
Baltimore
Houston
Phoenix
Dallas
Chicago
Average Annual Percent Change inOperating Cost Per Boarding, 2006 to 2010
Detroit
12

$0.42
$0.64
$0.68
$0.68
$0.72
$0.72
$0.73
$0.76
$0.76
$0.78
$0.78
$0.80
$0.81
$0.82
$0.84
$0.97
$0.98
$1.01
$1.03
$1.04
$1.05
$1.05
$1.10
$1.18
$1.25
$1.26
$1.27
$1.39
$1.50
$1.54
$1.73
$0.00 $0.25 $0.50 $0.75 $1.00 $1.25 $1.50 $1.75 $2.00
Honolulu
Los Angeles
Las Vegas
San Antonio
New Jersey
Houston
Denver
San Diego
Austin
Atlanta
Baltimore
Minneapolis
Miami
Orange
Detroit
King County
Average
Chicago
Portland
Milwaukee
Philadelphia
Cleveland
Phoenix
Pittsburgh
MTA New York City Transit
Boston
San Francisco
Washington DC
Dallas
MTA New York Bus
Oakland
Operating Cost Per Passenger MileMotorbus and Trolley Bus, 2010
13

-2.5%
-2.5%
-2.4%
-2.2%
-1.0%
-0.9%
-0.7%
0.1%
0.8%
2.0%
2.9%
3.6%
3.9%
4.1%
4.3%
4.3%
4.6%
5.5%
5.8%
5.9%
5.9%
6.2%
6.4%
6.4%
8.3%
9.4%
10.0%
10.7%
19.9%
20.0%
41.8%
-5% 0% 5% 10% 15% 20% 25% 30% 35% 40% 45%
Minneapolis
New Jersey
Milwaukee
Los Angeles
Denver
Philadelphia
Pittsburgh
Orange
Baltimore
San Antonio
MTA New York City Transit
Average
San Francisco
Atlanta
King County
Washington DC
Portland
Cleveland
Houston
Las Vegas
Oakland
Phoenix
Dallas
MTA New York Bus
Austin
Chicago
Honolulu
Detroit
San Diego
Miami
Boston
Average Annual Percent Change in OperatingCost Per Passenger Mile, 2006 to 2010
14