2010-072 Business opportunities in the Mexican dairy industry
126
Business opportunities in the Mexican dairy industry
Transcript of 2010-072 Business opportunities in the Mexican dairy industry

Business opportunities in the Mexican dairy industry

Business opportunities in the Mexican dairy industry
Jo H.M. Wijnands
Bibiana M. Armenta Gutiérrez
Judith J. Poelarends (Wageningen UR Livestock Research)
Olga M.C. van der Valk
LEI-report 2010-072 Wageningen UR Livestock Research report 397 September 2010 LEI project code 2271000008 LEI, part of Wageningen UR, The Hague

2

3
Business opportunities in the Mexican dairy industry
Wijnands, J.H.M., B.M. Armenta Gutiérrez, J.J. Poelarends and O.M.C. van der Valk LEI-report 2010-072 ISBN/EAN: 978-90-8615-460-9 Price € 26,75 (including 6% VAT) 124 p., fig., tab., app. This study explores the Mexican and Dutch business opportunities in the dairy industry in Mexico. The report discusses first the external environment of the Mexican dairy sector: the economic developments, the country's overall com-petitiveness, and the economic and agricultural policies. Next, it describes all links in the dairy supply chain - suppliers, farmers, processors, retailers and consumers - as well as the supporting and enhancing environment. Business opportunities are analysed in a strategic management framework. Este estudio explora las oportunidades de negocio holandesas y mexicanas en la industria de lácteos en México. El informe analiza, en primer lugar, el entorno externo del sector lácteo mexicano: el desarrollo económico, la competitividad general del país y las políticas agrícolas y económicas. A continuación, el infor-me describe los distintos eslabones de la cadena de suministro lácteo: provee-dores, ganaderos, procesadores, minoristas y consumidores, así como el entorno de mejora y apoyo. Las oportunidades de negocio se analizan dentro de un marco de gestión estratégica. Dit onderzoek verkent de kansen voor Mexico en Nederland in de Mexicaanse zuivelindustrie. Eerst wordt de externe omgeving van de Mexicaanse zuivelsec-tor besproken: de economische ontwikkelingen, het concurrentievermogen van het land en het beleid op het gebied van economie en landbouw. Vervolgens gaan we in op alle actoren in de zuivelketen - leveranciers, veehouders, fabri-kanten, winkeliers en consumenten - en het ondersteunende en stimulerende omgeving. De kansen worden geanalyseerd binnen een strategisch manage-mentkader.

4
BOCI code BO-10-010-121, 'The Mexican dairy chain' This research has been carried out in the framework of the Policy Research Cluster International (BOCI) by Commission of the Dutch Ministry of Agriculture, Nature and Food Quality (LNV).
Photo: Judith J. Poelarends (Wageningen UR Livestock Research) Orders
+31.70.3358330 [email protected] © LEI, part of Stichting Dienst Landbouwkundig Onderzoek (DLO foundation), 2010 Reproduction of contents, either whole or in part, is permitted with due reference to the source.
LEI is ISO 9001:2008 certified.

5
Contents Acronyms 7 Preface 9 Summary 10 Resumen 14
Samenvatting 14
1 Introduction: goal and method 22
2 Country profile and policies 24
2.1 Country profile 24 2.2 Trade policies 27 2.3 Agricultural policies 29
3 Dairy production and trade: an international benchmark 35
3.1 Benchmark countries and self sufficiency 35 3.2 Dairy production and yields 36 3.3 Import of dairy products by Mexico 37
4 Suppliers to the dairy chain 39
4.1 Breeding 39 4.2 Feed industry 42 4.3 Credit facilities 44 4.4 Animal health 45 4.5 Milk quality control 46 4.6 Machinery and equipment 49
5 Structure and performance of dairy farms 52
5.1 Structure 52 5.2 Economic indicators 57 5.3 Challenges and perspectives 59 5.4 Veal production 62
6 Processing industry 64
7 Wholesalers, retail and consumption of dairy products 68

6
8 Supporting and enhancing environment 73
8.1 Farmers and dairy processors associations 73 8.2 Knowledge infrastructure: research and extension 75 8.3 Sustainability 77
9 SWOT analysis 78
9.1 Introduction 78 9.2 SWOT: Strengths, Weaknesses, Opportunities and Threats 79 9.3 Key Success Factors and business opportunities 83
10 Recommendations and Dutch Business opportunities 86
10.1 Recommendations 86 10.2 Dutch Business opportunities 87
References 90
Appendices
1 List of interviewed persons during fact finding mission 95 2 Administrative regions, capital, population and area 97 3 Sagarpa programmes in 2010 99 4 Output and input use based Producer Support estimates (PSE) 100 5 National milk Production, number of cows and yield per cow 101 6 Regional distribution of milk production and price per litre 103 7 Import of dairy products by Mexico 105 8 Dairy trade of selected countries 107 9 Personnel and production value in the dairy milk industry a) 108 10 List of companies related to the Mexican Dairy sector 109

7
Acronyms
AI Artificial Insemination ANGLAC Asociación Nacional de Ganaderos Lecheros
bn billion = 1,000,000,000 CANILEC National Chamber of Milk Processors
CNOG Confederación Nacional de Organizaciones Ganaderas CNC Confederación Nacional de Campesinos
Cofocalec Mexican Council for the Quality of Milk and Dairy Products CONAFAB National Council of Manufactures of Concentrates and
Animal Feed CVA Centro de Valor Agregado
EEUU Estados Unidos de America EKN Embassy of the Kingdom of the Netherlands in Mexico
EU European Union EUR Euro, Currency of the European Union
FAO Food Agricultural Organisation of the United Nations FICA Agribusiness Capital Investment Fund
FIRA Trust Funds for Rural Development) FNDPCL Frente Nacional para la Defensa de los Productores y
Consumidores de Leche
FOCIR Capitalisation and Investment Fund for the Rural Sector Ggavatt Cattle ranchers' technology validation and transfer groups
HACCP Hazard Analysis and Critical Control Point system GDP Gross Domestic Production
INIFAP Instituto Nacional de Investigaciones Forestales, Agrícolas y Pecuarias
LNV Dutch Ministry of Agriculture, Nature and Food Quality KI Kunstmatige Inseminatie
m million =1,000,000 MXN Mexican Pesos
NAFINSA Nacional Financiera S.N.C. is a Development Bank NAFTA North American Free Trade Agreement
NMX Normas Mexicanas, voluntary norms NOM Norma Oficiales Mexicana

8
NPC Nominal Protection Coefficient (% domestic producer price above border prices)
OECD Organisation for Economic Co-operation and Development
PROGAN Enhancing sustainable use of natural resources programme of Sagarpa
Prolea Productores de Leche de Acatic
Profeco Procuraduria Federal del Consumidor (Consumer protection agency)
PSE Producer Support Estimates (Support in % of farm receipt) Sagarpa Secretary of Agriculture, Livestock, Rural Development,
Fisheries and Food SE Secretary of Economy
Sedesol Secretary of Social Development SIAP Servicio de Información Agroalimentaria y Pesquera
SIEM Sistema de Información Empresarial Mexicano (Entrepreneurial Information System of Mexico)
Soporte Sagarpa programme on technical assistance and training
SWOT Strengths, Weaknesses, Opportunities, and Threats analysis TCLAN Tratado de Libre Comercio de América del
TPC Total Plate Count UNPP Unión nacional de Productores Pecuarios
USA United States of America USD United States of America Dollar
WTO World Trade Organisation WUR Wageningen UR (University and Research centre)

9
Preface This report analyses the opportunities for firms and organisations on the Mexican dairy market. The opportunities are addressed to firms and organisa-tions in all levels of the supply chain ranging from suppliers to processors in the dairy industry. The opportunities are for Mexican as well as Dutch actors. During the fact-finding missions in Mexico, we met numerous Mexican entre-preneurs, government officials, and representatives of non-profit and research organisations. Appendix 1 provides the list of the consulted stakeholders. Their cooperation contributed largely to this final report. We would like to thank them for their time, openness, and inspiring input. In addition, we thank the Agricultural Counsellor, Gabrielle Nuytens-Vaarkamp, and the Agricultural Assistant, Leonora Hammer, both of the Em-bassy of the Kingdom of the Netherlands in Mexico (EKN), and the region Officer of the Dutch Ministry of Agriculture, Nature and Food Quality, Jochem Porte, for their support during the research and their valuable comments on earlier drafts of this report. The statements, findings, interpretations and conclusions expressed in this report are those of the authors and do not necessarily reflect the views of, or are endorsements from the Dutch Ministry of Agriculture, Nature and Food Quality or representatives from the Embassy of the Kingdom of the Netherlands in Mexico. Reading suggestion Each chapter presents at the beginning the Key findings for a quick overview of the contents. The summary, the SWOT analysis in Chapter 9, and the conclu-sions and recommendations in Chapter 10, provide the main information for policymakers. The other chapters provide in-depth background information for the interested readers. Prof. Dr R.B.M. Huirne Managing Director LEI

10
Summary Does the expanding Mexican dairy sector offer opportunities for investments, by either domestic or Dutch firms or organisations? This report shows that the Mexican dairy sector offers opportunities for: 1. Enhancing a higher performance of the large semi-specialised and dual-
purpose cow's farmers. This can be achieved by enhancing farmers' man-agement capabilities and milking infrastructure.
2. Levelling the seasonality of the milk supply. There is a gap of 30% between domestic milk production and consumption. Seasonality results in periods of peaks and dips. Levelling will improve the Mexican self-sufficiency on dairy products. Milk based on imported milk powder is cheaper than domestic fresh milk. Investments in milk powder plants in Mexico will be hardly profit-able due to the low import prices and a self-sufficiency of milk below 100% during the whole year.
3. A focussed agenda setting strategy. This strategy needs to be shared by all chain actors and organisations, to enhance the Mexican dairy industry as a whole. Table 9.1 provides Key Success Factors, actions and opportunities addressed to each chain actor.
4. Veal production as in the Netherlands is no opportunity: the Mexican con-sumers do not know such meat and production resources have better op-portunities.
Within this framework of Mexican opportunities, a major possibility for Dutch organisations is to enhance the capabilities of Mexican enterprises in the dairy sector. Table S1 provides an overview of business opportunities for specific actors. The study is based on a literature review, analyses of databases, and a fact-finding mission in July 2010.

11
Table S1 Dutch business opportunities
Firm or organisation What Key Success Factor
Seed breeders Improved grass and roughage
seeds
Knowledge transfer in feed/grass
management
Cattle breeders and
Artificial Insemination
Semen and embryos Awareness at semi-specialised
farms Infrastructure of AI stations
Feed industry Technology for concentrates
and feed management
Producing concentrates at
competitive prices
Knowledge transfer in feed
management
Milk production control
at cow level
Equipment and connected IT Awareness at semi-specialised
firms
Capabilities on milk quality and
cattle management
Processing industry Joint ventures Exploiting consumer preferences
Dutch exporters Final products Exploiting low cost prices and
differentiated products
Knowledge organisations Transfer of knowledge Enhancing the opportunities of
Mexican firms and organisations
Dutch Government Business linkage Providing information on style and
culture of Mexican dairy industry
Economics, policies, and international trade The Netherlands ranks 10th and Mexico 64th on the Global Competitiveness In-dex. Corruption, crime, and theft rank high as problematic factors in doing busi-ness in Mexico. Membership of NAFTA opened the Mexican economy. Farmers' subsidies and trade protection have been largely abolished. Mexico has 111m inhabitants and the Netherlands 17m. Milk production in both countries is almost on the same level, 11m tonnes. The annual growth is 1.9% in Mexico and 0.4% in the Netherlands. Mexico is a net importer of dairy products, 45% of the import value is milk powder. USA supplies over 55% of all dairy products, the Netherlands 2%, mainly cheese (USD27m). The main trade partner for machinery is the USA. Mexico imports a negligi-ble amount of machinery from the Netherlands. The import of vaccines for vet-erinary medicines from the Netherlands is below 10% of the total imports: the USA supplies over two-thirds.

12
Suppliers to the dairy chain Milk production control per cow is almost not practiced in Mexico and hampers proficient farm management and breeding. Only 2 to 3% of the farms, but 95% of large farms, use artificial insemination. Maize is important feed, with total feed costs of 60% of the milk cost price. Farmers own 65% of the processing capacity of concentrate feed. Credit facilities, largely supported by the government, offer soft loans and/or subsidies. This did not improve the position of farmers. Lack of sufficient capital and interest rates up to 14% are threats for the dairy farmers. The per-ception of high risks and low return and farmers' attitude (loans are subsidies) do not improve access to credit facilities. This perception does not match the real risks in dairy farming. Mexico has public and private standards for milk quality. Initiatives focus on improving the poor awareness of the quality. The conditions and support of the processors determine the use of milk machines and cooling tanks. Structure and performance of dairy farms Mexico's dairy farms can be classified in three systems: from semi-specialised or smallholders, dual-purpose farms to large state-of-the-art operations. The lat-ter are comparable with those in the USA, have good infrastructure (cold chain), supply to large processors, and are quality conscious. Dual-purpose farms are common in the tropic regions. Many semi-specialised farms lack access to or do not use the cold chain. They supply their milk to artisan cheese makers, the milk quality is not perceived as reliable. The average yield per animal (5,000kg of milk) is on a fair level compared to most benchmark countries. The milk yield per cow ranges between 700 to over 9,000kg per cow. The milk production shows seasonality: high milk deliveries in spring and summer, low in the autumn and winter. Mexico allows the use of BST to increase milk production. Some milk processors refuse this 'BST-milk'. Farm gate prices of Mexican milk are slightly below the price in the USA. The milk price in 2008-2009 is approximately MXN4.50 (EUR0.27). Farm man-agement related to feed, cattle care, roughage production and rearing calves is seen as a major weakness. Stakeholders expect a production growth at better-managed farms. Improving management is clearly an opportunity.
13
Processing retail and consumption The dairy processing industry gives direct employment to 37,000 and indirect employment to 200,000 people on over 300 dairy processors. These compa-nies use on average 80% of their production capacity and almost all have their own milk quality control system. The three largest milk processors - Lala, Nestlé and Sigma - process over two-thirds of the total milk. Over 2,000, not officially registered artisanal cheese-makers mainly process uncooled raw milk. Supermarkets and convenience stores are the main outlet for processed fresh milk; the daily/week market for raw milk. Milk and milk products take al-most 3% of the consumer budget (10% of the food expenditures). Retail sales of traditional products are stable: flavoured milk and yoghurts show annual growths of 2 to 3%. The per capita dairy consumption of 300 ml/day is too low according to the FAO recommendations of 600 ml/day. The Mexican milk con-sumption will increase with a growing population (1.3%) and income. Supporting and enhancing environment Farmers' associations represent farmers in different ways from enhancing ca-pabilities to political pressure group activities. Canilec represents the dairy proc-essors. Different stakeholders comment that practical training and professional education is lacking for service providers. Also applied research is poor. Sustainability is of growing concern for both government and private sector. The Government is targeting the primary sector with specific programmes and Nestlé focuses on sustainability of their suppliers, which are mainly farms with dual-purpose cows.

14
Resumen ¿ Ofrece el creciente sector lechero mexicano oportunidades de inversión para empresas y organizaciones sean domésticas u holandesas? Este informe de-muestra que el sector lechero mexicano ofrece oportunidades para: 1. Obtener un mayor rendimiento en las granjas lecheras semi-especializadas
y de doble propósito. Esto puede lograrse al mejorar las capacidades de gestión y de administración de los agricultores y al mejorar la infrae-structura de ordeña.
2. Mejorar la autosuficiencia nacional en productos lácteos al nivelar la estacionalidad de la producción de leche. Existe una diferencia del 30% en-tre la producción doméstica de leche y el consumo nacional. Sin embargo, es más barato elaborar productos lácteos basados en leche en polvo impor-tada que utilizar la leche fresca de producción doméstica. Como conse-cuencia, mientras que los precios de importación de productos lácteos sigan más bajos que los de la leche fresca doméstica, estará en riesgo la rentabilidad de inversiones en plantas deshidratadoras para producir leche en polvo en México.
3. Definir una agenda compartida por todos los actores y organizaciones hacia el mejoramiento de la industria mexicana de lácteos en su totalidad. Tabla 9.1 proporciona factores clave de éxito, acciones y oportunidades de cada actor de la cadena productiva.
4. La producción de carne de ternera como se hace en Holanda no representa una oportunidad: los consumidores mexicanos no tienen preferencia para este tipo de carne y hay mejores oportunidades de utilización de los recur-sos productivos.
Dentro del marco de oportunidades en México, las organizaciones holande-sas pueden contribuir al fortalecimiento de las capacidades de las empresas mexicanas. Tabla R1 proporciona una visión general de las oportunidades de negocio para actores específicos. El estudio realizado se basa en un revisión de literatura, análisis de bases de datos y una gira por el sector lechero mexi-cano (Julio 2010).

15
Tabla R1 Oportunidades de negocios para empresas holandesas
Empresa u
organización
Oportunidad Factor clave de éxito
Productores de
semillas
Semillas mejoradas
de hierba y fibra
Transferencia de conocimientos en la
gestión de la alimentación/pasto
Criadores de ganado
e inseminación
artificial
Semen y embriones Mayor conciencia en las granjas semi-
especializadas; infraestructura de centros de
Inseminación Artificial
Industria de alimentos
balanceados
Tecnología para con-
centrados y adminis-
tración de alimentos
balanceados
La producción de concentrados a precios
competitivos.
Transferencia de conocimientos en la admi-
nistración de alimentos balanceados
Control de producción
de leche de vaca
Equipos y paquetes
de informática co-
rrespondientes
Mayor conciencia en las granjas semi-
especializadas
Capacidades en la administración de la cali-
dad de la leche y de los bovinos
Industria de
transformación
Alianzas Explotar las preferencias de los
consumidores
Exportadores
holandeses
Productos finales Explotación precios bajos de costo y produc-
tos diferenciados
Instituciones de inves-
tigación y formación
Transferencia de co-
nocimientos
Aumentar las oportunidades de las
empresas mexicanas y organizaciones
Gobierno holandés Vinculación de nego-
cios
Proporcionar información sobre el estilo y la
cultura de la industria mexicana de lácteos
Economía, políticas nacionales y comercio internacional Los Países Bajos y México ocupan los lugares 10 y 64 respectivamente en el índice de competitividad global. La corrupción, el crimen y el robo son conside-rados como factores de riesgo al hacer negocios en México. La economía mexicana se abrió al entrar en vigor el TLCAN. En gran medida se han eliminado las subvenciones y la protección comercial de los agricultores. México tiene 111 millones de habitantes contra 17 millones en los Países Bajos. La producción de leche (11 millones de toneladas) está prácticamente en el mismo nivel en ambos países. El crecimiento anual es del 1.9% en México y de un 0.4% en los Países Bajos. México es un importador neto de productos lácteos, de los cuales la leche en polvo representa el 45% del valor de importa-ción. De todos los productos lácteos, los EEUU suministra más del 55%, y los Países Bajos 2%, principalmente queso (27 millones de dólares).

16
Los EEUU es el principal proveedor de equipo agrícola. México importa una cantidad insignificante de equipo de origen holandés. La importación de vacu-nas para los medicamentos veterinarios provenientes de los Países Bajos está por debajo del 10% de las importaciones totales, mientras que los EEUU sumi-nistra más de dos tercios. Proveedores a la cadena de productos lácteos La práctica de control de la producción de leche por vaca es casi inexistente en México y obstaculiza la administración eficiente de la granja y de la cría. Aunque el 95% de las grandes granjas utiliza inseminación artificial, se estima que a nivel nacional este porcentaje no supera el 2 a 3%. Maíz es el alimento más importante, los costos de la alimentación son el 60% del precio de costo de la leche. Las granjas integradas tienen el 65% de la capacidad total de la in-dustria de alimentos balanceados. Las facilidades de crédito, en gran medida apoyadas por el Gobierno, ofrecen préstamos a condiciones favorables y/o subvenciones. No obstante, esto no ha mejorado la posición de los agricultores. La falta de capital suficiente y las tazas de interés de hasta el 14%, forman las amenazas para los agricultores de leche. El acceso a crédito se dificulta por la percepción de riesgos elevados en el sector agrícola; su baja rentabilidad y por los agricultores que consideran préstamos como subvenciones. Esta percep-ción sin embargo no coincide con los riesgos reales en la ganadería lechera. México tiene normas públicas y privadas para el control de la calidad de la leche. Hay iniciativas para promover la mayor conciencia de calidad. Los apoyos y las condiciones de compra manejados por los procesadores de leche determinan el uso de equipo de ordeña y tanques de enfriamiento. Estructura y rendimiento de las granjas lecheras Las granjas lecheras en México pueden clasificarse en tres sistemas que van desde semi-especializadas y pequeñas, de doble propósito, a grandes ope-raciones de tecnología de punta. Estas últimas son comparables a las de los EEUU en cuanto a eficiencia: tienen buena infraestructura (cadena de enfrío), suministran a los procesadores grandes y manejan control de calidad. Las gran-jas de doble propósito se ubican en las regiones tropicales. Muchas granjas semi-especializadas carecen de acceso a la cadena de enfrío o no la tienen. Suministran su leche, cuya calidad no es percibida como fiable a los procesa-dores de queso artesanal. El rendimiento promedio por animal (5000 kg de leche) está a un nivel com-parable a la mayoría de los países de referencia; y oscila entre los 700 y

17
9000 kg/vaca. La producción de leche se caracteriza por estacionalidad, con altas entregas de leche en primavera y verano contra bajas entregas en otoño e invierno. México permite el uso de BST para aumentar la producción de leche. Algunos procesadores de leche rechazan la 'leche con BST'. Los precios al productor están ligeramente por debajo del precio en los EEUU. El precio de la leche en 2008-2009 estaba cerca de de 4,50 MXN (0,27 euros). El nivel de administración granjera relacionado con la alimentación, la atención al ganado, la producción de la fibra y la cría de terneros se considera una debilidad importante, afectando la producción. Así que se destacan claras oportunidades en el mejoramiento de la administración. Procesamiento; ventas al menudeo y el consumo La industria de lácteos genera 37.000 empleos directos y 200.000 empleos indirectos en los más de 300 procesadores. Estas empresas utilizan en prome-dio el 80% de su capacidad de producción y casi todas tienen su propio siste-ma de control de calidad de la leche. Los tres procesadores de leche más grandes - Lala, Nestlé y Sigma- procesan más de dos tercios del total de pro-ductos lácteos. Más de 2.000 procesadores no oficialmente registrados, fabri-can queso artesanal, utilizando principalmente leche cruda no enfriada. La leche fresca procesada se comercializa a los supermercados y tiendas de conveniencia; la leche cruda se destina al tianguis. La leche y los productos lácteos forman casi el 3% del presupuesto del consumidor (el 10% de los gas-tos en alimentos). Las ventas al menudeo de los productos tradicionales son estables: la leche y los yogures con sabor muestran un crecimiento anual de 2 a 3%. El consumo de productos lácteos por día per cápita de 300 ml es más bajo que el consumo recomendado por la FAO de 600 ml. El consumo mexica-no de leche aumentará al crecer la población 1.3%y los ingresos. El entorno de apoyo al sector lechero Las asociaciones de agricultores se empeñan en mejorar las capacidades de gestión y ejercen presiones políticas. Canilec representa a los procesadores de productos lácteos. Distintos actores comentan que el sector lechero carece de educación profesional y de formación práctica para proveedores de servicios. También la investigación aplicada es considerada de pobre calidad. La sustentabilidad es una preocupación emergente para el Gobierno y el sector privado. El Gobierno se enfoca al sector primario con programas especí-ficos relacionados al cambio climatológico. Empresas como Nestlé promueven la sustentabilidad de sus proveedores, que son principalmente las granjas de vacas de doble propósito.

18
Samenvatting Biedt de groeiende Mexicaanse zuivelsector kansen voor investeringen door Mexicaanse of Nederlandse bedrijven of organisaties? De Mexicaanse zuivelsec-tor biedt kansen voor: 1. Versterking van de bekwaamheden van de grote semi-gespecialiseerde
veehouders en veehouders met dubbeldoelkoeien. Dit kan worden bereikt door het management en de zuivelinfrastructuur van de boeren te verbete-ren, de verliezen te reduceren en transparantie in de keten te stimuleren.
2. Afvlakking van seizoensfluctuaties van de melkaanvoer. In Mexico wordt 30% minder melk geproduceerd dan dat er wordt geconsumeerd. Door de seizoensfluctuaties ontstaan er pieken en dalen en wordt de verwerkings-capaciteit mogelijk niet maximaal benut tijdens periodes waarin er weinig rauwe melk wordt aangevoerd. Afvlakking van de seizoensfluctuaties zal de zelfvoorziening van Mexico op het gebied van zuivelproducten verbeteren. Melk op basis van geïmporteerd melkpoeder is goedkoper dan verse melk uit Mexico zelf. Het is nauwelijks winstgevend om te investeren in melkpoe-derfabrieken in Mexico vanwege de lage importprijzen en vanwege het feit dat Mexico het hele jaar door niet 100% zelfvoorzienend in melk is.
3. Vaststellen van een duidelijk gedefinieerde strategie. Deze dient gedragen te worden door alle actoren en organisaties in de keten om de zuivelindu-strie in Mexico als geheel te verbeteren. In tabel 9.1 staan de belangrijkste succesfactoren, acties en kansen van elke actor in de keten.
4. Kalfsvleesproductie zoals in Nederland is geen kans: de Mexicaanse con-sument eet geen kalfsvlees en de productiebronnen kunnen beter worden benut.
Binnen dit kader van kansen voor Mexico kunnen ook Nederlandse organisa-ties bijdragen aan het verbeteren van de capaciteiten van Mexicaanse bedrijven in de zuivelsector. Tabel 1 geeft een overzicht van de kansen voor specifieke actoren: van leveranciers tot consumenten, beleid, ondersteunende en stimule-rende organisaties. Het onderzoek is gebaseerd op een literatuuronderzoek, analyses van databases en een informatie verzameling tijdens een veldbezoek in Mexico.

19
Tabel S1 Kansen voor Nederland
Bedrijf of
organisatie
Wat Belangrijkste succesfactoren
Zaadveredelaars Verbeterd graszaad
en ruwvoer
Kennisoverdracht op het gebied van voer-
/grasmanagement
Veefokkers en KI Sperma en embryo's Bewustheid onder semi-gespecialiseerde vee-
houders, infrastructuur van KI-centra
Diervoederindustrie Kennis over techno-
logie voor krachtvoer
en voermanagement
Productie van geconcentreerd voer tegen
concurrerende prijzen
Kennisoverdracht op het gebied van voerma-
nagement
Melkproductiecontrole
per koe
Machines en bijbeho-
rende IT-
infrastructuur
Kennis bij semi-gespecialiseerde veehouders
Kennisoverdracht op het gebied van melkkwa-
liteit en rundveehouderij
Verwerkende industrie Samenwerkings-
verbanden
Inspelen op de voorkeuren van consumenten
Nederlandse expor-
teurs
Eindproducten Uitbaten van lage kostprijs en gedifferenti-
eerde producten
Kennisorganisaties Kennisoverdracht Vergroten van de kansen van Mexicaanse be-
drijven en organisaties
Nederlandse overheid Business linkage Vestrekken van informatie over de vorm en
cultuur van de Mexicaanse zuivelindustrie
Economie, beleid en internationale handel Mexico heeft 111 miljoen inwoners en Nederland 17 miljoen. De primaire land-bouw vormt 4% van het BBP in Mexico, de industrie 37% en de dienstverle-ningssector 59%. In Nederland zijn deze respectievelijk 2%, 25% en 73%. Nederland staat 10e en Mexico 64e op de Global Competitiveness Index. De bedrijven in Mexico hebben met name te maken met corruptie, criminaliteit en diefstal. Door lidmaatschap van NAFTA is de Mexicaanse economie open. Sub-sidies voor boeren en handelsbescherming zijn grotendeels afgeschaft. De melkproductie (11 miljoen ton) is in beide landen ongeveer even hoog. De jaarlijkse groei is 1,9% in Mexico en 0,4% in Nederland. Mexico is een netto-importeur van zuivelproducten: 45% van de importwaarde is melkpoeder. De VS leveren meer dan 55% van alle zuivelproducten. Mexico importeert 2% van hun zuivelproducten uit Nederland, vooral kaas (USD27 miljoen). De belangrijkste handelspartner voor machines zijn de VS. Het aantal machi-nes dat Mexico uit Nederland importeert, is verwaarloosbaar. De import van

20
vaccins voor veterinaire medicijnen uit Nederland vormt minder dan 10% van de totale import: de VS leveren meer dan twee derde. Het ministerie van Landbouw en dat van Sociale Ontwikkeling richten zich op het verbeteren van de productiviteit, de zuivelinfrastructuur (melkmachines en koeltanks), de fokprogramma's, de innovatie en de capaciteitsopbouw. Leveranciers in de zuivelketen Er is bijna geen melkproductiecontrole per koe in Mexico en dat vormt een be-lemmering voor professionele bedrijfsvoering en fokkerij. Hoewel 95% van de grote veehouderijen gebruik maakt van kunstmatige inseminatie, is dat in Mexi-co slechts 2 à 3% van de veehouders. Maïs vormt een belangrijk onderdeel van het voer en de voerkosten vormen 60% van de kostprijs van de melk. 65% van de verwerkingscapaciteit van krachtvoer is in handen van veehouders. De kredietmogelijkheden die grotendeels door de overheid worden aange-boden, zijn zachte leningen en/of subsidies. Dit heeft echter niet gezorgd voor een betere positie van de veehouders. Een gebrek aan voldoende geldmiddelen en rentevoeten tot 14% vormen een bedreiging voor melkveehouders. Het idee dat kredietfaciliteiten een hoog risico vormen en maar weinig opbrengen en de houding van veehouders (leningen zijn subsidies) maken de kredietfaciliteiten niet toegankelijker. De perceptie van de risico's komt echter niet overeen met de daadwerkelijke risico's van de melkveehouderij. Mexico heeft publieke en private normen voor de melkkwaliteit. Initiatieven zijn erop gericht om melkveehouders meer bewust te maken van de kwaliteit. De fabrieksomstandigheden en de ondersteuning van de fabrikant bepalen of er wel of geen gebruik wordt gemaakt van melkmachines en koeltanks. Structuur en prestaties van melkveehouders Melkveebedrijven in Mexico kunnen in drie categorieën worden onverdeeld: se-mi-gespecialiseerde of kleine bedrijven, veehouders met dubbeldoelkoeien en grote, hypermoderne ondernemingen. De laatste categorie is vergelijkbaar met bedrijven in de VS. Deze hebben een goede infrastructuur (koelketen), leveren aan grote fabrikanten en zijn zich bewust van de kwaliteit. Melkveehouders met dubbeldoelkoeien komen veel voor in de tropische gebieden van het land. Veel semi-gespecialiseerde melkveehouders hebben geen toegang tot of maken geen gebruik van de koelketen. Ze leveren hun melk aan ambachtelijke kaasma-kers en hun melkkwaliteit wordt niet als betrouwbaar ervaren. De gemiddelde opbrengst per dier (5.000 kg) is redelijk ten opzichte van de meeste benchmarklanden. De melkopbrengst varieert van 700 tot meer dan
21
9.000 kg per koe. Sommige melkveehouders hebben zelfs koeien met een op-brengst van 13.000 kg per koe De melkproductie is seizoensgebonden: in de lente en zomer is de melkopbrengst hoog, in de herfst en winter laag. Mexico staat het gebruik van BST om de melkproductie te verhogen toe. Sommige melkfabrikanten weigeren echter 'BST-melk'. De af-boerderij-prijzen van Mexicaanse melk liggen net onder de prijs in de VS. De melkprijs in 2008-2009 was ongeveer MXN 4,50 (EUR 0,27). Het onder-nemerschap op het gebied van voer, rundveeverzorging, ruwvoerproductie en opfok van kalveren is zeer zwak. Stakeholders verwachten dat de productie zal toenemen als er een beter bedrijfsmanagement wordt toegepast. Het verbete-ren van het management is duidelijk een kans. Verwerking, retail en consumptie Voor de zuivelindustrie werken direct 37.000 en indirect 200.000 personen in meer dan 300 fabrieken. Deze gebruiken gemiddeld 80% van hun productieca-paciteit en bijna alle hebben hun eigen controlesysteem voor de melkkwaliteit. De drie grote zuivelfabrikanten – Lala, Nestlé en Sigma – verwerken meer dan twee derde van de totale melk. Meer dan 2.000 niet officieel geregistreerde ambachtelijke kaasmakers verwerken voornamelijk niet-gekoelde, rauwe melk. Verwerkte verse melk wordt vooral verkocht in supermarkten en gemaks-winkels; de rauwe melk gaat naar dag- en weekmarkten. Consumenten besteden ongeveer 3% van hun budget (10% van hun voedselbudget) aan zuivel. De de-tailhandel in traditionele producten is stabiel: de verkoop van drinkyoghurt en yoghurt groeit jaarlijks met 2 à 3%. De zuivelconsumptie per hoofd van de be-volking van 300 ml/dag is te laag volgens de aanbeveling van de FAO van 600 ml/dag/hoofd van de bevolking. De Mexicaanse melkconsumptie zal toenemen naarmate de bevolking groeit (1,3%) en het inkomen stijgt. Ondersteunende en stimulerende omgeving Organisaties vertegenwoordigen veehouders op verschillende manieren: van verbetering van bekwaamheden tot politieke pressiegroepactiviteiten. Canilec vertegenwoordigt de zuivelfabrikanten. Verschillende stakeholders zijn van me-ning dat er een gebrek is aan praktijkopleidingen en onderwijs voor dienstverle-ners. Ook de kwaliteit van het toegepaste onderzoek is niet goed. Duurzaamheid vraagt een toenemende aandacht van de overheid en de pri-vate sector. De overheid houdt zich bezig met specifieke programma's voor de primaire sector en Nestlé richt zich op duurzaamheid van hun leveranciers, voor-namelijk veehouders met dubbeldoelkoeien.

22
1 Introduction: goal and method Key findings - This report addresses the question: Does the expanding Mexican dairy sec-
tor offer opportunities for investments, by either domestic or Dutch firms or organisations?
- A literature review, analyses of databases, and a fact-finding mission are the input for the SWOT analysis.
- The report discusses the environment of the dairy chain and the dairy chain from suppliers to consumers. The business opportunities are derived from a SWOT analysis.
Does the expanding Mexican dairy sector offer opportunities for invest-ments, by either domestic or Dutch firms or organisations? The office of the Dutch Ministry of Agriculture, Nature and Food Quality in Mexico already pub-lished a report on business opportunities in the poultry, pig and feed sector (Klok, 2007). A market report on the dairy industry is lacking, while several de-velopments in the Mexican dairy sector are of interest. Mexico's dairy produc-tion and consumption is growing, thanks to a supportive government offering subsidies for domestic production. The NAFTA agreement promotes trade of dairy products by the abolishment of tariffs. The government aims at stimulating the domestic production and at becoming less dependent on imports mainly from the USA. An important issue is the improvement of the social economic situation of the Mexican agricultural sector. An in-depth study of the Mexican dairy chain identifies the possible market opportunities for the Dutch agribusi-ness. The main goal is to identify possible market opportunities for the Mexican dairy industry. The Dutch agribusiness' opportunities are framed in the opportu-nities on the Mexican market. The focus is on products based on cow milk; goat milk has not been studied. Goats produce about 1.5% (165,000 tonnes) of the total milk production (SIAP, 2009). A second goal is to explore the possibilities of veal production: male calves are not suited for reproduction of dairy cows. A strategic management approach frames the research. The opportunities are derived from a Strengths, Weaknesses, Opportunities, and Threats (SWOT) analysis. The approach is as follows: first, a desk research to review literature and to analyse databases; second, a fact-finding mission and; third, an integra-tion of the facts and opinions to derive opportunities. During the mission in July

23
2010, stakeholders from government officials, professional organisations and researchers to dairy processors in Mexico have been consulted (see Appendix 1). Structure of the report The structure of the report is as follows. Chapter 2 first presents the country profiles of Mexico and the Netherlands and then the Mexican trade and agricul-tural policy. It mainly describes the external environment of the industry. Developments in production and trade of dairy products are subject of Chap-ter 3 portraying the performance of the dairy industry of Mexico benchmarked against the main dairy trade partners. Chapter 4 to 7 describes the Mexican dairy supply chain. We follow the production downstream, from suppliers to consumers. The supporting and enhancing environment are addressed in Chap-ter 8. Chapters 3 to 8 describe the internal environment of the dairy industry. The internal and external analyses are the input for the SWOT analysis, pre-sented in Chapter 9. The conclusions and recommendations are subject of Chapter 10.

24
2 Country profile and policies Key findings - Mexico is 57 times as large as the Netherlands and has 7 times as many in-
habitants and the GDP per capita, USD10.000, is 20% of the Dutch level. - Primary agriculture in Mexico accounts for 4% of the GDP, in the Nether-
lands 2%. - The Netherlands ranks 10th and Mexico 64th on the Global Competitiveness
Index. - Membership of NAFTA opened the Mexican economy. Farmers' subsidies
and trade protection have been largely abolished. - The Ministries of Agriculture and of Social Development aim at enhancing
productivity, dairy infrastructure (milking machines and cooling tanks), breed-ing, innovation and at capacity building.
- Stakeholders have doubts about the effectiveness of the support and subsi-dies to the sector.
2.1 Country profile
Mexico is a federal republic, the president Felipe de Jesus Calderon Hinojosa (since 1 December 2006) is both chief of state and head of government. He is elected by popular vote for a single six-year term. The legislative system is a bi-cameral National Congress (Congreso de la Union). The Senate (Camara de Senadores) has 128 seats; 96 members elected by popular vote to serve six-year terms, and 32 seats allocated based on each party's popular vote. The Chamber of Deputies (Camara de Diputados) has 500 seats; 300 members are elected by popular vote; the remaining 200 members are allocated based on each party's popular vote; members serve three-year terms. The legal system is a mixture of US constitutional and civil law system. The Mexican economy dependency on primary agriculture (4% of the GDP) is slightly higher than the Dutch (2%). The service sector dominates the economy in both countries, 59% in Mexico and 73% in the Netherlands. The USA is the main trade partner for Mexico, as Germany is for the Netherlands (table 2.1).

25
Table 2.1 Key facts of Mexico and the Netherlands
Indicator Mexico Netherlands
Population
(2009)
111.2m, 7 times that of
the Netherlands
Growth rate 1.3%
Urban population 82%
16.7m
Growth rate 0.4%
Urban population 87%
Capital Mexico City, The Federal District:
11,286,000 inhabitants
Amsterdam 740,000 inhabitants
Climate From tropical to desert Temperate, marine
Terrain High, rugged mountains; low coastal
plains; high plateaus; desert
Altitudes: -10 to 5,700m
Mostly coastal lowland and
reclaimed land
Altitudes: -7 to 322m
Land Area 2008 194m ha: 57 times
the Netherlands
3.4m ha
Agricultural land
2007
106.8m ha, 55% of land area
Arable land 13%, permanent crops
1% of land area
1.9m ha, 57% of land area
Arable land 31%, permanent crops
1% of land area
GDP USD1,085m USD860m
GDP-growth 1.8% in 2008; between 3.2 and 4.8%
in 2003-2007
2.1% in 2008; between 1.5 and
3.5% in 2003-2007
Origin GDP Agriculture 4%, industry 37%, and
services 59%
Agriculture 2%, industry 25% and
services 73%
GDP/capita USD10,211 USD52,321
Currency
1 August 2010
1 August 2008
MXN100=USD7.90=EUR6.05
MXN 100=USD9.97=EUR6.39
EUR1=MXN16.48=USD1.30
EUR1=MXN15.64=USD1.56
Inflation 3.6% (2009); 6.5% (2008) 1.2% (2009); 2.5% (2008)
Competitiveness Rank 60 out of 134 countries Rank 10 out of 134 countries
Main exports Manufactured goods, oil and
oil products, silver, fruits,
vegetables, coffee, cotton
Machinery and equipment,
chemicals, fuels; food
Export to US 80.5%, Canada 3.6%,
Germany 1.4%
Germany 25.4%, Belgium 13.7%,
France 8.9%, UK 8.8%, Italy 5.2%
Main imports
from
US 48%, China 13.5%, Japan 4.8%,
South Korea 4.6%,
Germany 4.1%
Germany 16.6%, China 10.1%, Bel-
gium 8.7%, US 7.5%, UK 5.8%,
Russia 5.4%, France 4.4% Sources: https://www.cia.gov/library/publications/the-world-factbook/geos/mx.html, Schwab, 2009,
http://data.worldbank.org/data-catalog/world-development-indicators, and http://www.geonames.org

26
Figure 2.1 Mexico
Mexico has 32 administrative zones: 31 states and 1 Federal district. The state of Mexico (11.7m inhabitants), Mexico-City Federal District (8.7), and Ve-racruz (7.1) have the largest population. Appendix 2 provides information of the population and area for each administrative zone. The largest cities are: Mexico City, Monterrey, Guadalajara and Querétaro. Over 82% of the population is ur-ban, which is slightly below the Dutch level. Mexico ranks 60th out of the 134 countries on the Global Competitiveness Index (table 2.2). That position is comparable with other South American trade partners in dairy products. The USA ranks 2nd and the Netherlands ranks 10th on the Global Competitiveness Index. Compared to these two countries Mexico has a relatively low rank on most indicators except for macro-economic stability. Foreign investors need to recognise these differences, especially the institu-tional framework. Corruption, crime and theft are the most problematic factors in doing business in Mexico (Schwab, 2009).

27
Table 2.2 Competitiveness indicators in 2009/2010 a)
Indicators Mexic
o
Arg
entina
Bra
zil
Chile
Uru
guay
USA
Neth
erl
ands
Global Competitiveness Index 2009-2010 60 85 56 30 65 2 10
Basic requirements 59 84 91 32 49 28 12
Institutions 98 126 93 35 40 34 10
Infrastructure 69 88 74 30 66 8 15
Macroeconomic stability 28 48 109 19 78 93 38
Health and primary 65 59 79 69 52 36 14
Efficiency enhancers 55 84 42 33 82 1 10
Higher education and training 74 55 58 45 50 7 10
Goods market efficiency 90 124 99 26 78 12 6
Labour market 115 123 80 41 119 3 27
Financial market sophistication 73 116 51 32 88 20 23
Technological readiness 71 68 46 42 51 13 2
Market size 11 23 10 44 88 1 18
Innovation and sophistication factors 67 76 38 43 77 1 9
Business sophistication 62 73 32 39 85 5 6
Innovation 78 86 43 49 67 1 13
a) Ranking 1 is best, 134 is worst.
Source: Schwab (2009).
2.2 Trade policies
Mexico has 11 free-trade agreements with 41 countries. The North America Free Trade Agreement (NAFTA), which came in force in 1994, is the most im-portant for the economy. Under NAFTA, on 1 January 2003 the process of tariff elimination was finished for the majority of foods with the exception of maize, beans, powder milk, orange juice, and sugar. The tariffs for these products were eliminated on 1 January 2008. The partnership agreement with the EU, called the EU-Mexico Economic Partnership, Political Coordination and Coopera-tion Agreement, entered into force in 2000. As is shown in Table 2.3, imports from the US are free from import duties.

28
Table 2.3 Tariffs of main dairy products
Import tariff Product Exemptions Features
10% Fresh milk No tariff for United States,
Chile and Uruguay
International trade of fresh
milk is low
20% Cheese No tariff for United States
and Chile. Uruguay has a
preferential tariff
Production is mainly fresh
and regional cheeses. Main
imports are hard cheeses
125% Powder milk No tariff for United States
and Uruguay
Mexico is first importer of
Non-fat Dry Milk
Source: Iruegas et al. (2007).
Figure 2.2 Nominal Protection Coefficients (NPC) of dairy products
NPC-ratio
0
1
2
3
4
5
6
7
1986
1987
1988
1989
1990
1991
1992
1993
1994
1995
1996
1997
1998
1999
2000
2001
2002
2003
2004
2005
2006
2007
2008
2009
EU-27 Mexico N-Zealand USA Brazil
Source: Based on OECD Database 1986-2009 Producer and Consumer Support Estimates.
An overall indicator of protection is the Nominal Protection Coefficient (NPC) provided by the OECD is. An NPC of 1.2 for a country indicates that domestic producer prices are on average 20% above border prices for the same com-modities. The development of the NPC (Figure 2.2) shows high ratios in the eighties and recently rather low levels. New Zealand shows almost no protection during all the years. The Mexican NPC is on the same level as the other bench-mark countries.
29
2.3 Agricultural policies
The federal administration launched its Plan Nacional de Desarrollo 2007-2012 to make Mexico more competitive and include social policies, directed at the development of the rural areas. The economic policies entail five points of interests: 1. Constitutional state and security; 2. Creating employment by a competitive economy; 3. Equal opportunities; 4. Environmental sustainability; 5. Effective democracy and responsible foreign policies. The policies by the Ministry of Economy (SE) aims at fulfilling consumers' demand, at maintaining the supply of goods, at an overall economic growth, at complying with Free Trade Agreements, and at keeping inflation down. The Ministries of Agriculture (Sagarpa) and Social Development (Sedesol) focus on rural development and poverty reduction. Respondents comment on conflicting policies by the Mexican Government. Interviewed stakeholders stated that the government is mixing social policy with production policy. The latter has failed: the industry sector has not grown, so there are poor employment opportunities for the agricultural population in the Mexican industry. Half a million Mexicans enter the USA per year, mostly ille-gally, because of insufficient employment. Policies concerning the cattle sector, form part of the Special Competitive-ness Programme for Sustainable Rural Development 2009-2020 (FMEI, 2009). The aforementioned five points of interest are reflected in the National Sector Development Plan 2007-2012 by SAGARPA. The objectives are: 1. Development of human capital in rural and coastal areas. 2. Supply of internal market with safe quality products of Mexican origin. 3. Improvement of farmers' income by elevating their presence in global mar-
kets, integrating them into value aggregating processes and the production of bio-energy.
The livestock sector programme set by SAGARPA for 2010 amounts to MXN11,000m: MXN5,302m (48%) is earmarked for beef and dual-purpose cat-tle, and MXN1,481m (13%) for dairy cattle. Appendix 3 provides the allocation of funds per production system and type of programme. Programmes for beef and milk production aim at:

30
1. Stabilising producer prices The Stabilisation Fund for the marketing of milk to buffer temporal over-supply of milk to a maximum of MXN1 per litre of fresh milk, with a maxi-mum of 15,000 litres per day per beneficiary through the milk processor (SAGARPA, 2008).
2. Improving productive assets Programmes are subdivided per sector (agriculture; cattle, aquaculture) and there is one overall programme for rural development. The programme for cattle supports improvement and sustainability of forage areas; genetic im-provement; strengthening milk collection and processing animal products and infrastructure investments. The total support to animal production sys-tems for 2010 aims at MXN1,600m for 16,000 projects benefiting 92,000 farmers. Of this budget, MXN613m (38%) is allocated to beef and MXN487m (30%) to milk and dual-purpose cattle farmers (SAGARPA, 2010).
3. Enhancing sustainable use of natural resources (PROGAN) This programme focuses on improvement of animal productivity, through the support of sustainable technical practices of production, technical assis-tance, capacity building, and financial funds. Beneficiaries are divided into two categories: category A, in which milk and beef cattle production sys-tems with 5 to 35 animals may receive up to MXN350 per animal; category B, in which dual-purpose production systems with 36-300 beef cattle receive up to MXN300 per animal. For milk production systems, category B does not apply. To beef and dual-purpose cattle, 87% has been allocated, 4% to dairy, and the rest (9%) to other animal production systems. Almost two-thirds (62%) of PROGAN resources will go to category A; one-third (38%) to category B. PROGAN reaches beneficiaries through the states. Table 2.4 gives an estimate of number of animals that will be supported in 2010. Progan has a quality programme for smallholder farms (about 5-35 cows/ farm) to improve quality of milk: 'Progan leche' from Sagarpa. In this pro-gramme, 26,000 farms in 21 states are registered. They receive MXN375 under the condition that they work on milk quality improvement. Cofocalec sees improvement in the quality of milk, but the actual quality is still low (high Total Plate Count (TPC)). This is no surprise as these farms often lack electricity for e.g. cooling the milk. The government started collection centres of milk (Centro de servicios ganaderos). Small dairy farms (with approximately 15-20 cows) can deliver their raw milk to collection centres where it is cooled. The centres also have consultants who help the farmers with management of the cows and achiev-

31
ing better quality of milk. If the centres run well, the government wants to transfer the centres to the cattle associations (Anaya, 2010).
Table 2.4 Number of supported animals in 2010 in 1,000 heads
Production system Category A Category B Total
Beef and dual-purpose cattle 4,674 3,655 8,329
Dairy cows 396 0 396
Total 5,070 3,655 8,725
Source: SAGARPA (2010).
Examples of programmes targeting the agricultural sector in general are Alianza para el Campo (Alliance for the countryside) or Soporte. Producers need to be organised for receiving subsidies. Through the programme Alianza para el campo the federal government assigns resources, functions and programmes to the state governments. It has three subprogrammes: 1. Support to rural investment projects; 2. Development of capacities in rural areas; 3. Strengthening of rural enterprises and organisations. The Soporte programme provides technical assistance and training on dif-ferent issues, including beef and dairy. The Soporte programme includes agree-ments between the federal funds and funds for technical assistance of each state. Third parties may tender for finance by elaborating specific programmes for the support of the sector. An example is the programme as operated by the Unión Ganadera de Jalisco (Box 2.1). An example of an initiative financed by Sedesol is the Centro de Valor Agre-gado (Centre of Added Value) in Jalisco to develop agro-industry with products from the state. The Centre is an incubator of new enterprises, for the develop-ment and try-out of new food products complying with international standards of food safety. Ideas are evaluated for their innovativeness, market potential, and profitability. The most promising ideas will be developed as pilot projects in the Centre. In a first phase, the Centre will concentrate on fruits, vegetables, meat and milk products (CVA, 2010). Stakeholders made some critical remarks on the government policies: - Farmers receive MXN150 per hectare, some buy seeds, some buy beers,
the government does not control. - Sagarpa has mainly social programmes, directed at keeping producers in a
margin of comfort

32
Box 2.1 Case: Unión Ganadera Regional de Jalisco
The Unión Ganadera de Jalisco is a second-tier organisation of the CNOG, integrated by
138 first tier regional organisations in Jalisco, of which 22 are organisations of milk farmers
and the rest of beef farmers. There are between 12,000 and 14,000 milk producers. Chap-
ter 8 provides more information on professional organisations. Jalisco is Mexico's biggest
dairy state, yearly milk production is around 1.8m tonnes, produced by 14,000-16,000 dairy
farmers (ranging from 5 to 500 cows). To be a member of the union, farmers need to have at
least 5 cows and pay once MXN150. The Union finances itself with the emission of permits
for the transportation of cattle to slaughterhouse (MXN12 per permit).
With Federal and State finance (mainly SAGARPA: SOPORTE, Productive Assets), the Un-
ion executes a programme for the development of the primary dairy sector, which consists of
three parts:
1. Improve the status of the farms. The Union estimates of all farmers, 60% does not have
a milking machine and 25% does not have a cooling tank. The Union assists farmers in
getting subsidy from the government to buy equipment and competitive offers from
equipment companies. The goal is to help 400 farmers every year with a subsidy (2010
is the third year).
The Union also offers technical assistance to achieve better milk quality and improve pro-
duction. In Jalisco, 37 technicians support farmers. The government also has a subsidy
for this assistance.
The Union concerns about the small and medium producers, because the bigger ones
have more cash flow and can invest in better management.
2. Collect and sell milk for the farmers. The Union is working on a proposal for this. They
want to build three centres for milk collection with subsidy from the SAGARPA-Jalisco.
The centres would have a capacity of 15,000-20,000 kg per day and used by farmers
that do not have their own cooling tank. The dairy producers pay for the services of col-
lecting and cooling the milk. The centres (as non-profit enterprise) also take care of sell-
ing the milk to processors and return the profit to the producers depending on amount
and quality of their milk. About 200 farmers deliver milk to the three centres. Their ad-
vantage is the assurance of having a buyer, weekly payments and a better price.
3. Build an own industry plant to pasteurise milk and to make milk powder. They already
conducted a market study, designed a plant, they have the budget and an alliance with
two local processors in Jalisco. The purpose is to collect all the milk if the supply cannot
be absorbed by the market at fair prices.

33
- The subsidies by the government are a way to buy 'votes' for the next election.
- Subsidies lead to farmers not knowing their own cost price and getting used to 'getting' 50% of the money to buy a bull, for instance. In no way does this lead to more productivity or efficiency of farms. If the subsidy stops, then they have a problem, because they do not know how to survive without, they have not learnt anything to improve management. The government should keep the subsidy and take care of good and fair milk prices.
- Farmers in Jalisco also say that the government should stop with the subsi-dies and make good regulations for fair milk prices. The amount of subsidy per farmer in Jalisco is only MXN0.03 per kg of milk and this is not enough to keep them all in business. Subsidies are seen as 'bread to live' and not as 'a loan to improve production'.
The programmes above suggest many efforts to enhance the capabilities of farmers and of the infrastructure of the dairy supply chain. The OECD publishes the level of producers' subsidies for several countries. A Producer Support Es-timates (PSE) of 20% means that the estimated value of transfers to individual producers from consumers and taxpayers is equivalent to 20% of gross farm receipts (OECD, 2010). In most years, almost all the subsidies are related to output. Only in 1996 to 2002 less than 2% of the subsidies are allocated to 'on farm services': an input use based support. Appendix 4 shows detailed informa-tion on the PSE for the Mexican milk producers. Figure 2.3 shows the PSE for Mexico and benchmark countries. New Zealand has a negligible PSE over 20 years. The other selected countries reduced the subsidies in the nineties and even more since 2005: the PSE dropped from above 50% to below 20%. The subsidies in recent years have been largely abolished in most countries.

34
Figure 2.3 PSE: subsidies on milk as percentage of farm receipt
PSE %
-20
0
20
40
60
80
10019
86
1987
1988
1989
1990
1991
1992
1993
1994
1995
1996
1997
1998
1999
2000
2001
2002
2003
2004
2005
2006
2007
2008
2009
EU-27 Mexico N-Zealand USA Brazil
Source: Based on OECD Database 1986-2009 Producer and Consumer Support Estimates.

35
3 Dairy production and trade: an international benchmark Key findings - The Mexican raw milk production (10.8m tonnes) is slightly below the Dutch
production (11.3m tonnes). - The average yield per animal (5,000kg) is on a fair level compared to most
benchmark countries. - The total national milk production growth (1.9%) is just below world average
(2.2%) and above the Dutch level (0.4%). - Mexico is a net importer of dairy products (45% milk powder). USA supplies
over 55%. Self-sufficiency of raw milk is around 70%. - Mexico imports 2% of their dairy products from the Netherlands, mainly
cheese (USD27m).
3.1 Benchmark countries and self sufficiency
This chapter provides an overview of the Mexican dairy industry compared to benchmark countries. Section 3.2 deals with the production and consumption, Section 3.3 with the trade developments. The benchmark countries are trade partners of Mexico or important produc-ers in Central- and South-America. Table 3.1 provides the key figures of the se-lected countries. Mexico ranks number 16 as world producer of cow milk, with a share of 2% of the world production. The cow milk production in Mexico is a little below the Dutch production, despite a population that is seven times the Dutch. Mexico is world's tenth important importer of dairy products and has a negligible export of dairy products. A first opportunity for the Mexican dairy in-dustry might be to substitute the imports by domestic production. Mexico produced almost 11bn litres of milk but consumption amounts around 15.6bn litres, resulting in imports of approximately 5bn litres of milk and dairy products indicated by low self-sufficiency indices for butter and milk. The Mexican milk production covers about 70% of the total volume of raw milk re-quired to satisfy the domestic demand. This gap tends to widen, due to higher growth rates of dairy consumption market compared with the growth rate of milk production. The consumption developments are discussed in Chapter 7.
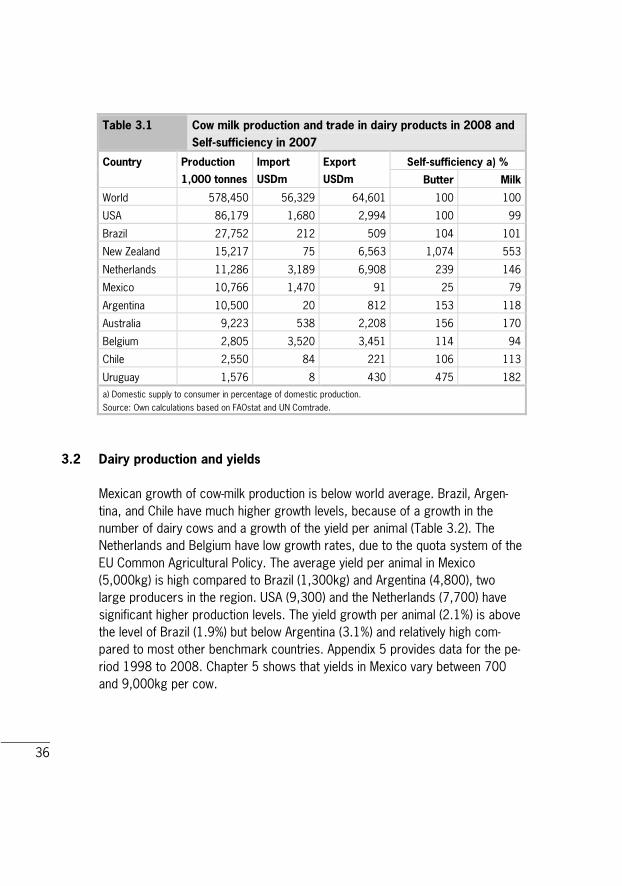
36
Table 3.1 Cow milk production and trade in dairy products in 2008 and
Self@sufficiency in 2007
Self@sufficiency a) % Country Production
1,000 tonnes
Import
USDm
Export
USDm Butter Milk
World 578,450 56,329 64,601 100 100
USA 86,179 1,680 2,994 100 99
Brazil 27,752 212 509 104 101
New Zealand 15,217 75 6,563 1,074 553
Netherlands 11,286 3,189 6,908 239 146
Mexico 10,766 1,470 91 25 79
Argentina 10,500 20 812 153 118
Australia 9,223 538 2,208 156 170
Belgium 2,805 3,520 3,451 114 94
Chile 2,550 84 221 106 113
Uruguay 1,576 8 430 475 182
a) Domestic supply to consumer in percentage of domestic production.
Source: Own calculations based on FAOstat and UN Comtrade.
3.2 Dairy production and yields
Mexican growth of cow-milk production is below world average. Brazil, Argen-tina, and Chile have much higher growth levels, because of a growth in the number of dairy cows and a growth of the yield per animal (Table 3.2). The Netherlands and Belgium have low growth rates, due to the quota system of the EU Common Agricultural Policy. The average yield per animal in Mexico (5,000kg) is high compared to Brazil (1,300kg) and Argentina (4,800), two large producers in the region. USA (9,300) and the Netherlands (7,700) have significant higher production levels. The yield growth per animal (2.1%) is above the level of Brazil (1.9%) but below Argentina (3.1%) and relatively high com-pared to most other benchmark countries. Appendix 5 provides data for the pe-riod 1998 to 2008. Chapter 5 shows that yields in Mexico vary between 700 and 9,000kg per cow.

37
Table 3.2 Dairy production in 2008 and annual growth 2003@2008
Production Dairy Cows Yield/animal Country
1,000 tonnes growth % 1,000 heads growth % kg growth %
World 578,450 2.2 246,862 1.2 427 -1.0
USA 86,179 2.2 9,224 0.3 9,343 1.9
Brazil 27,752 3.9 21,198 1.9 1,309 1.9
New Zealand 15,217 1.2 4,348 2.1 3,500 -0.9
Netherlands 11,286 0.4 1,466 -1.1 7,698 1.5
Mexico 10,766 1.9 2,153 -0.2 5,000 2.1
Argentina 10,500 5.1 2,200 1.9 4,773 3.1
Australia 9,223 -2.2 1,728 -3.4 5,337 1.2
Belgium 2,805 -3.8 500 -2.2 5,610 -1.6
Chile 2,550 3.7 1,725 3.5 1,478 0.1
Uruguay 1,576 0.9 950 1.6 1,659 -0.7
Source: own calculation based on FAOstat.
Appendix 6 provides the production and price for each administrative zone. The zones Jalisco (1,861m litres), Coahuila (1,365m litres), and Durango (1,037m litres) in the middle of Mexico are the regions with the largest produc-tion. These areas have a good infrastructure of roads, communication, and electricity. The price of milk between the regions shows some variation: the av-erage is MXN4.32 per litre whereas the price is above MXN7 per litre in the Federal district and in Baja California Sur and in Colima (near Mexico City) just below MXN7 per litre.
3.3 Import of dairy products by Mexico
The Mexican import growth of dairy products (14.1%) in the period 2001-2003 to 2006-2008 is higher than the world average (12.7%). Concentrated milk and cream (powder) accounts for 43% and cheese for 26% of the total value of im-ports by Mexico. The USA supplies 57% of the total dairy imports by Mexico. The USA is for many dairy products the largest supplier, and has an above av-erage growth rate. However, Uruguay got a large share in the imports (60%) of the category buttermilk, yoghurt: since 2004, Uruguay doubled its export value in this category each year. New Zealand supplies 60% of the butter and 26% of the concentrated milk and cream. New Zealand's growth rate in the Mexican im-port is below average. The Netherlands has a share of a mere 2% in the imports

38
by Mexico, mainly cheese. Countries in the region have the highest import growth rates. Appendix 7 and 8 provide detailed information on shares and growths percentages.
Table 3.3 Import of selected products by Mexico in USDm
(average 2006@2008) and growth 2001@2003 to 2006@2008
in %
Milk & cream,
concentrated
Whey Butter Cheese Total
HS@code 402 404 405 406 Growth
World 591.2 219.7 149.3 311.7 1364.8 14
USA 355.3 196.9 18.4 160.0 774.9 25
Brazil 0.6 0.6 25
New Zealand 153.8 10.5 89.0 25.0 283.5 10
Netherlands 0.1 0.1 0.8 26.8 27.8 8
Argentina 19.6 1.6 5.2 4.3 31.8 -3
Australia 8.7 3.0 8.8 0.3 21.0 -6
Belgium 1.7 15.1 16.8 3
Chile 31.3 0.1 0.9 51.6 85.4 35
Uruguay 5.3 0.3 4.5 32.0 82.4 19
Source: UN Comtrade.

39
4 Suppliers to the dairy chain Key findings - Only 2 to 3% of the farms use Artificial Insemination, according to stake-
holders 95% on the large farms. - Milk production control per cow is almost not practiced in Mexico and ham-
pers proficient farm management and breeding. Large farms seem to use milk production control.
- Farmers own 65% of the processing capacity of concentrate feed. - Credit facilities, largely supported by the government, offer soft loans
and/or subsidies. This did not improve the position of farmers. Lack of suffi-cient capital and interest rates up to 14% are threats for the dairy farmers.
- The perception of high risks and low return, not in line with the reality, and farmers' attitude (loans are subsidies) do not improve access to credit facilities.
- Mexico allows the use of BST to increase milk production. Some processors do not accept BST-milk.
- The import of vaccines for veterinary medicines from the Netherlands is be-low 10% of the total imports: the USA supplies over two-thirds.
- Mexico has public and private standards for milk quality. Several initiatives focus on improvement of the quality.
- Using milk machines and cooling tanks is related to the conditions and sup-port of the processors.
- The main trade partner for machinery is the USA. Mexico imports a negligi-ble amount of machinery from the Netherlands.
4.1 Breeding
In 2008, Mexico imported USD20m of bovine semen, mainly from the USA (67%) and Canada (17%). The import from the Netherlands (3%) increased from around USD150,000 end nineties to over USD400,000 in the last 5 years, with an all high in 2008 of USD589,000. Figure 4.1 shows that the imports from France (5%) and Spain (4%) are still higher than from the Netherlands.

40
Figure 4.1 Import of Bovine Semen (HS code 051110) by Mexico in USDm
Import Bovine Semen (million USD)
0
5
10
15
20
2519
95
1996
1997
1998
1999
2000
2001
2002
2003
2004
2005
2006
2007
2008
USA Canada France Spain Netherlands Rest of World
Source: Own calculation based on UN Comtrade database.
Imports of semen, as in the case of other animal genetic products like em-bryos, are subject to a high level of risk analysis before these products can ac-tually be imported. After having verified the zero-risk of these products, the Mexican veterinary authorities issue a list of import requirements that involve country of origin, procedures, testing, and other health specifications. This hampers maintaining a market position, as rules change according to the coun-try's animal health status, additional requirements from the authorities and country-to-country negotiations and agreements. As an example: veterinary rea-sons prevent import of semen from Brazil, although the cross breeds would fit perfectly in the tropical areas of Mexico (Reproducción Animal, 2010). The mar-ket is not really growing; the number of cows is stable, which results in a fierce competition between companies. The largest competition in semen is from na-tional bulls, not tested in official breeding programmes and therefore without of-ficial breeding values. Owners of the bulls promote their bulls with data on the production of the daughters. This seems to work, because they have a great

41
share of the market in semen. Farmers tend to have more belief in these bulls than bulls from outside the country. Although these bulls lack official breeding values, they can have good quality daughters. Reproducción Animal (2010) es-timates that from all semen for AI, 50% is national and another 50% is imported. The use of Artificial Insemination is not a common practice yet on all farms. If it is used, then it is only for dairy cows, not for beef cattle. The Union from Jalisco estimates that Artificial Insemination is only practiced on 2-3% of the farms (mainly large farms). Small farms often do not see the advantages of artificial insemination with semen of high genetic quality. The specialised dairy farmers (with good infrastructure, equipment, and management) used to select only for milk production, because milk processors are used to pay for volume of milk. Recently they started to require a minimum level of protein. Productive life, calv-ing ease, and fertility are getting more important. What is needed to increase the use of Artificial Insemination/good genetics is awareness among farmers of the benefits, confidence in genetics and good infrastructure to provide full ser-vice at any time (Reproducción Animal, 2010).
Box 4.1 Reproducción Animal
One of the importers of bovine semen is Reproduccion Animal (a full Mexican Company
founded in 1972). The strategy of Reproducción Animal is to promote healthy and profitable
cows for commercial farms. It has distributors all over the country that deliver semen at dairy
farms. RA imports semen of different breeds, especially Holstein, but also e.g. Swedish red,
Fleckvieh or Montbeliarde for crossbreeding. Semen is imported from the USA, the Nether-
lands, Germany, Sweden, and France. Reproducción Animal is a distributing agent for Coop-
erative Resources International (USA); CRV (Netherlands), Viking Genetics (Sweden, Denmark,
Finland), München Grub (Germany); AmBreed (New Zealand) and Coopex (France), among
others. Reproducción Animal gives advice for animal reproduction strategies for milk or beef
cattle, using semen according to the different regions. Cows are examined for their physical
traits (not health), before being recommended to a specific bull. Reproducción Animal also
sells (increasingly) sexed semen. The market for embryos is very small. They sell most se-
men in La Laguna in the Coahuila region.
In the Netherlands milk production control at the level of an individual animal is widely accepted and seen as a useful tool to monitor all kind of management aspects like feeding or breeding. In addition, these data can be used to esti-mate breeding values of bulls. According to Reproducción Animal, the govern-ment says that 300,000 dairy cows are in milk production control, but they estimate this is only 40,000. The reason for this low participation in milk pro-

42
duction control is that farmers are not interested in sharing data. The special-ised farmers are satisfied with data on milk production from their own milking parlour computer and the results of bulk tank composition. Furthermore, taking part in milk control is expensive (Reproducción Animal, 2010).
4.2 Feed industry
The National Council of Manufactures of Concentrates and Animal Feed regis-tered 152 commercial (specialised) industry units, selling to third parties repre-senting 35% of the national manufacturing capacity of 32.5m tonnes. The second type is cattle farmers with proper infrastructure to produce animal feed. The National Council registered 258 units of this type, representing 65% of the national processing capacity. The industry generates 42,000 direct jobs. The industry has an overcapacity: only 75% of the available processing capacity is used. Smaller plants of organised farmers that do not possess advanced tech-nology are first out if business. In 2004, the total value of inputs was MXN25,000m, mainly cereals and seeds. Of all forage grains in feed, 60% is imported; of which the main part (62%) is maize, followed by sorghum (31%). México is a large producer of white maize, but yellow maize has to be imported. The same goes for oilseed cakes, over 90% is imported. In 2006, 2.4m tonnes of feed was used for cattle breeding, and 4.2m tonnes for dairy production. Per 2008, import tariffs in NAFTA for maize became zero. Main feed inputs used by two subgroups of production systems (see Chap-ter 5) are shown in Table 4.1.
Table 4.1 Percentage of the type of feed used by farm types
Farm type Feed type
smallholders specialised
Maize 31 24
Agro industrial by-products and others 36 30
Commercial concentrates 33 46
Total 100 100
Source: Espinoza Ortega et al. (2005).

43
Box 4.2 Prolea (Productores de Leche de Acatic)
Prolea is a cooperative of farmers in the state Jalisco founded in 1991. Members of the co-
operative are 552 farmers. Prolea has 4 departments:
1. Selling and processing of milk. Prolea produces 54,000l per day (2004), and sells to dif-
ferent buyers, according to the quality of the milk;
2. Feed. They buy ingredients and mix their own concentrates for dairy cows in a small
plant. The purpose is to make the cheapest but best feed for dairy cows. Their prices are
30% below market level. Non-members pay a slightly higher price than members do.
Besides own feed production, they buy ingredients for feed. A nutritionist helps mixing
the concentrates. They also import African grass seeds to increase grass production and
therefore milk production;
3. Agriculture. Prolea also offers agricultural contractor services to harvest corn and
grain. In 1991, the first joint cooling tanks were installed with soft loans from Lechera
de Guadalajara;
4. Rearing calves.
Furthermore, the cooperative supplies credit, extension services and health care to its
members.
Feed accounts for the largest cost in production systems (see Table 4.2, Chapter 5 provides information of all costs). Differences in costs result from a large use of maize by the smallholders group while the specialised group uses more concentrates that are commercial.
Table 4.2 Impact of maize 60% price increase on production costs of
Mexican livestock
Product Forage
grains a)/
feed costs
Feed costs/
total produc@
tion costs
Forage grains/
production
costs
Increase
of forage
grains
Impact on
production
costs
Milk 40% 65% 26% 60% 15.6%
Poultry 65% 62% 40% 60% 24.2%
Eggs 60% 55% 33% 60% 19.8%
Cattle 65% 60% 39% 60% 23.4%
Pork 72% 56% 40% 60% 24.2%
a) Mainly maize and sorghum.
Source: PROLECHE (2007).
Not only milk production but also livestock production will be affected by higher maize prices (an important forage grain). Table 4.2 gives the percentages of

44
cost variations in different Mexican livestock industries due to a rise of 60% of forage grains. It shows that the impact is smaller for dairy than for chicken meat and pork. The Union of Jalisco estimated that feed has a share of 60%-65% of the cost price, which is in line with the 65% in Table 4.2.
4.3 Credit facilities
Some organisations to finance the development of the agricultural sector are: 1. Financiera RuralFinanciera Rural Mexico's rural government agency started in
2003 aiming at improving the quality of life by in increasing productivity and profitability in rural areas. Financiera Rural provides loans and services in the field of training, advisory and technical assistance. In 2007 Financiera Rural lent MXN17,038m and in 2008 MXN26,398m. Financiera Rural grants credit to individual rural producers and entrepreneurs and rural financial intermedi-aries through 97 branches located throughout the country (http://www.financierarural.gob.mx/).
2. FIRA (Trust Funds for Rural Development) FIRA is a development bank that offers credit for fixed assets, as working capital and for supporting services. The supporting activities involve capac-ity building, advice, demonstration, and enhancing organisational capacity (in the form of vouchers to producers). In 2008, FIRA granted MXN16,054m credits to the livestock sector, an increase of 23% compared to 2007. Cat-tle took MXN11,279m (70%) of the total.
3. FOCIR (Capitalisation and Investment Fund for the Rural Sector) FOCIR is a governmental institution created in 1994 to promote investment in the rural and agribusiness sector. In 2008, it changed from a public trust fund to a specialised financial agent. The federal government, state govern-ments, and the private sector are shareholders. Financial instruments of-fered by FOCIR vary from stop-loss programmes to long term financing programmes for small and medium enterprises, as the Ministry of Econ-omy's Development Programme does. FOCIR developed the Agribusiness Capital Investment Fund (FICA), a trust fund with mixed capital participations through cash deposits made by both state and federal governments, as well as private investors. FICA focuses on financing between USD4m and USD10m. Ministries of Agriculture and of Economy programmes offer loans below USD4mfor the agricultural sector.
4. Nacional Financiera, S.N.C. NAFINSA is a Development Bank, channelling its funds mainly through com-

45
mercial banks and non-banking financial intermediaries. The principal sources of NAFINSA are loans from among others the International Bank for Reconstruction and Development, the Inter-American Development Bank, foreign banks, and securities. NAFINSA targets small and medium-sized en-terprises (SMEs) to provide better access to financing and other assistance schemes. In 2008, NAFINSA's private sector loan portfolio was MXN101,853m.
5. Credit Unions Credit unions facilitate loans, credits, and guarantees for their members. Companies, like Lala and Alpura (see Chapter 6) have their Credit Unions, and channel resources mainly from FIRA through commercial Banks to their members. For instance, the industry Group Lala operates the Unión de Crédito Industrial y Agropecuario de la Laguna. In the third quarter of 2009, their portfolio involved MXN2,582m in outstanding loans and MXN782m in liquidity (FitchRatings, 2009).
6. Another source of finance is the programme 'Alianza para el campo' (men-tioned in Section 2.2) which helps to balance the decline of credit assigned to the sector. These subsidies have had an impact specially on provisioning milking and cooling tanks.
During the fact mission stakeholders expressed the following opinions. Lack of sufficient capital for the primary agricultural sector and interest rates up to 14% are some threats for the dairy farmers. The perception of high risks and low return is not in line with reality. This does not improve the credit facilities. The large companies in the food industry (e.g. Lala, Alpura or Sigma) have a better access to capital. The foundations by government of banks like FOCIR or FICA have apparently not improved the position of the farmers. The farmers can also partly be blamed for their weak position. They consider credits from the government as a subsidy and they do not consider profitability if they solicit for a loan.
4.4 Animal health
Mexico, as the USA, allows legally the use of BST (Bovine Somatotropin or bo-vine growth hormone). However, it is 100% forbidden in several other milk-producing countries like Canada, Australia, New Zealand, Japan, and Europe. In the United States, concern about potential side effects has slowly grown, with a number of products and retailers now becoming BST-free. In Mexico on
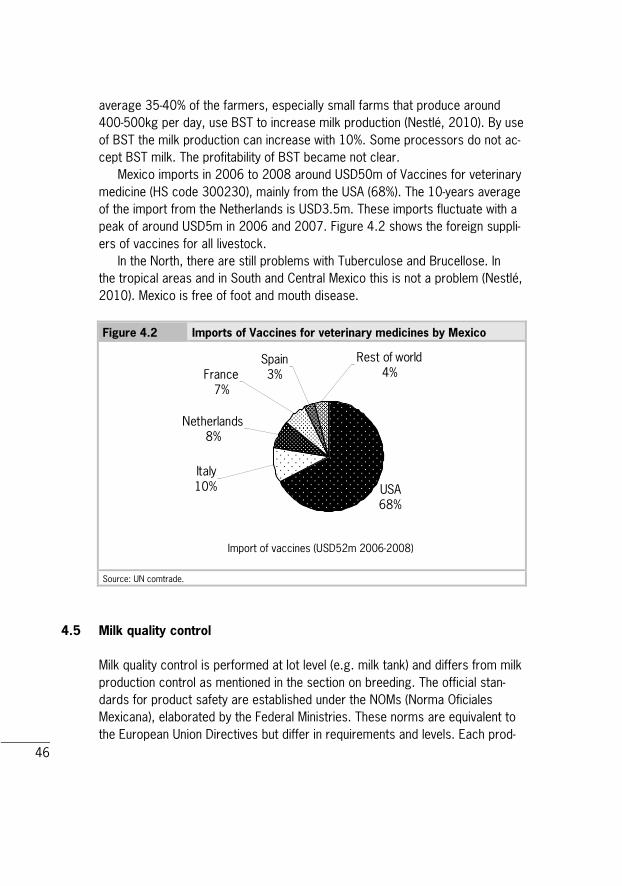
46
average 35-40% of the farmers, especially small farms that produce around 400-500kg per day, use BST to increase milk production (Nestlé, 2010). By use of BST the milk production can increase with 10%. Some processors do not ac-cept BST milk. The profitability of BST became not clear. Mexico imports in 2006 to 2008 around USD50m of Vaccines for veterinary medicine (HS code 300230), mainly from the USA (68%). The 10-years average of the import from the Netherlands is USD3.5m. These imports fluctuate with a peak of around USD5m in 2006 and 2007. Figure 4.2 shows the foreign suppli-ers of vaccines for all livestock. In the North, there are still problems with Tuberculose and Brucellose. In the tropical areas and in South and Central Mexico this is not a problem (Nestlé, 2010). Mexico is free of foot and mouth disease.
Figure 4.2 Imports of Vaccines for veterinary medicines by Mexico
Import of vaccines (52 Million USD 2006-2008)
USA68%
Italy10%
Netherlands8%
Spain3%France
7%
Rest of world4%
Source: UN comtrade.
4.5 Milk quality control
Milk quality control is performed at lot level (e.g. milk tank) and differs from milk production control as mentioned in the section on breeding. The official stan-dards for product safety are established under the NOMs (Norma Oficiales Mexicana), elaborated by the Federal Ministries. These norms are equivalent to the European Union Directives but differ in requirements and levels. Each prod-
Import of vaccines (USD52m 2006-2008)

47
uct must be tested according to the national, mandatory NOM standards by an accredited Mexican laboratory. Examples of NOMs for milk products are (Gain, 2009): - NOM 120 applies to processing milk; - NOM 155 applies to finished milk product; - NOM 251 will apply to HACCP requirements, which until now, contrary to
the European Union, are not mandator; - NOM-243 will soon be published and refers to the labelling of milk products; - Cofocalec (Consejo para el Fomento de la Calidad de la Leche y Sus
Derivados, A.C.) has certified final milk products of Alpura (12), Pasteurisa-dora Aguascalientes (3), La Concordia (7) and Lechera de Guadalajara (2), 12 other products are in process of certification. These are voluntary certifi-cations. For the list of products, see www.lactodata.info/lactodata/ lactodata_calidad.php?menu=calidad
Besides the NOM, there are NMX (Normas Mexicanas) which are voluntary. As the NOM are mandatory by law, the NMX may be more stringent than the NOM, but not less. The NMX are elaborated by the COFOCALEC, the Mexican Standard NMX-F-700 as elaborated by COFOCALEC in 2004, which establishes the physical, chemical and hygienic specifications, as well as methods for analysis of raw cow milk. COFACALEC's laboratory in Lagoa de Moreno con-ducts raw milk analysis for 5 processors. A third category of standards concerns the 'Pliego de Condiciones' (Stan-dards specifications). These tend to be stricter than NOM or MNX. An example are the standards as have been set for milk certified under the certification scheme Mexico Calidad Suprema, which apply to food safety, intrinsic product quality and information to the consumer (labelling). Mexico Calidad Suprema is a joint initiative of the Ministry of Agriculture; Ministry of Social Development and Bancomext to promote Mexican export products. WalMart has accepted Mexico Calidad Suprema certification for its purchases since 2007. Sagarpa subsidises 50% of Mexico Calidad Suprema certification through its programme Soporte.

48
Box 4.3 Quality control at farm level: Lechera de Guadalajara
Every farmer who delivers milk to Lechera de Guadalajara has a cooling tank of at least
1,000kg per farm. In total 700 farmers, deliver a total volume of 1.1 to 1.4m kg of milk.
Quality standards exist for fat, freezing point, sediments, taste, Total Plate Count (TPC)
(<100,000 CPU) and antibiotic residues. There is no standard for Bulk Milk Somatic Cell
Count (BMSCC) yet, but they want to set this at <400,000 cells per ml (now 70% is below
700,000 cells per ml). A milk sample is taken from every delivery and once a week the raw
milk is (randomly) tested for these standards. Antibiotic residue is tested every delivery
(35,000kg milk from 16 farmers). Lechera de Guadalajara does not have a quality control
programme for the production of milk at the dairy farm, but they do have regulations in the
payment scheme. The requirements are: some specifications for the milking place, participa-
tion in the governmental programme for Tuberculosis and Brucellosis, good road conditions,
electricity, availability of a veterinarian, water, milk room, pest control, control of medicines,
control of purchased feed, equipment in line (no hand milking). The driver of the milk truck
does some quick checks for temperature, alcohol test, and cleanliness of the tank. Lechera
de Guadalajara takes care of maintenance of the tank and the farmers need to take care of
the cleaning of the tank. If Lechera de Guadalajara sees a quality problem on a farm, they of-
fer technical assistance and help the farmer to solve the problem by taking milk samples and
hygiene measures.
Source: Lechera Guadalajara (2010).
According to Cofocalec (2010) quality standards that processors use are in-ternal company standards. Quality is often attached to price, so they want to keep their own policies and make their own decisions. The policies are quite dif-ferent between processors and they change between seasons. In winter/spring, when there is a lack of milk, the price of raw milk goes up and standards almost disappear, because they want all the milk they can get. In summer, they use the higher international standards because they want to be able to reject more milk because there is peak in the supply. Canilec (2010) says that processors work all with the same quality standards and their opinion differs from Cofocalec. Quality control is difficult to enforce. Profeco (Procuraduria Federal del Consumidor, the consumer protection agency), checks food according to over 200 norms, but has only one laboratory and limited human resources (Cofocalec, 2010). According to Cofocalec antibiotic residues are a big prob-lem. Farmers were not used not-delivering milk from treated cows during the withdrawal period, causing residues in milk. Of the 300-500 samples, Cofocalec analyses every week, about 15% contains antibiotic residues (Cofocalec, 2010).

49
Canilec (2010) estimated that 40% of total milk is of a good quality; 35% of a medium and 25% is of a low quality, according to the Mexican standards. No NOM for raw milk exists, but a voluntary standard, the NMX 700/730. Up till now, only 50 ranches are certified according to NMX 700/730. They all deliver their milk to a processor in Aguascalientes who promised a bonus of MXN0.08 per kg if the farm is certified. For the farmers the bonus was the trig-ger, but after being certified, the production process got more efficient and they got more insight in prevention of losses and in quality. Therefore, although it costs money and time, the bonus and efficiency increase made it worth (Cofocalec, 2010).
4.6 Machinery and equipment
No formal information on the presence of milking and cooling equipment on dairy farms could be retrieved. The impression is that many small farms do not have such technology. If they cannot deliver their milk to a processor or collec-tion centre, they will often sell the not cooled milk to small local cheese makers often at a lower price. Some small farms make artisan cheeses themselves and sell it at local markets. Some farms share a cooling tank, and sometimes they can deliver the milk to collection centres in the neighbourhood. During the mission, we got some estimates about equipment on dairy farms: - Of the 4,500 farms that sell the milk to Nestlé, the second largest proces-
sor, 90% have a milking machine and cooling tank. The others share cooling tanks with e.g. family members. Nestlé only buys cooled milk.
- Prolea, a small processor/cooperative in Jalisco, says 95% of their (approxi-mately 200) dairy farmers have a milking machine. The milk of the farms that do not have a cooling tank is used for cheese production.
- In the state of Jalisco, the Union estimates that 60% of the 14,000 to 16,000 dairy farms (ranging from 5 to 500 cows) does not have a milking machine and 25% does not have a cooling tank. Farmers can get subsidy from the government to buy equipment. The Union helps them getting the subsidy, and work on good jointly offers from equipment companies (Union, 2010).
- The bigger farms with well-equipped milking parlours also have electronic milk production registration.
In order to meet quality standards in the future it will be necessary to cool the raw milk after milking, either on the farm or in collection centres. Second,

50
as milk production and farm size increase a milking machine will be the next necessary investment. All technology that is imported from Europe into the USA is also available in Mexico. For example, milking equipment is often sold by Westfalia and Delaval (Union, 2010). Table 4.3 distinguishes five categories of imports of machinery: 1. Milking machines (UN comtrade code 843410); 2. Dairy machinery, excluding cream separators (UN comtrade code 843420); 3. Parts of milking machines & dairy machinery (UN comtrade code 843490); 4. Harvesting and grading (UN Comtrade code 8433). Harvesting or threshing
machinery, including straw or fodder balers; grass or hay mowers; machines for cleaning, sorting or grading eggs, fruit or other agricultural produce;
5. Soil cultivation (UN Comtrade code 8432). Agricultural, horticultural or for-estry machinery for soil preparation or cultivation; lawn or sports-ground rollers.
The selected countries are the Netherlands and countries, which have at least for one category a share in the imports of 5%. The main supplier is the USA for most products. The Netherlands has a share of 1% in the categories harvesting/grading and soil cultivation. Almost all other selected countries out-perform the Netherlands in all categories. Germany is an important supplier of dairy machinery. Table 4.3 Imports of agricultural equipment average 2006@2008 in
1,000 USD
Country Milking
machines
Dairy
machinery
Parts of milking and
dairy machinery
Harvesting/
grading
Soil
cultivation
World 5,183 15,335 3,619 197,900 47,655
USA 1,386 2,482 1,685 146,734 26,930
Germany 623 6,562 435 10,977 291
Brazil 65 11,665 2,918
Italy 9 852 332 4,635 4,544
France 1,187 35 1,459 5,940
Netherlands 125 25 2,360 403
Sweden 73 1,762 193 5 31
New Zealand 1,126 4 197 164 2
Source: UN Comtrade.

51
Stakeholders said that the average age of Mexican agricultural equipment increased dramatically over the last 30 years. Industry experts estimate that it has increased from 17 years in the 1970s to 25 years in the year 2005. As a direct result, the parts and servicing market has grown. Mexican farmers tend to be conservative and reluctant to change. Post-sales service is a key factor to purchase decisions because of the extended life of machinery. This has contrib-uted to the success of American brands that benefit from large well-established distribution networks (US Commerical Service, 2005).

52
5 Structure and performance of dairy farms Key findings - Mexico's dairy farms range from small 'backyard' to large state-of-the-art
operations. - The milk yield per cow ranges between 700 to over 9,000kg per cow. - Milk deliveries show a seasonal supply pattern, stronger than in
the Netherlands. - Farm gate prices of Mexican milk fluctuate below the price in the USA. - Farm management is seen as a major weakness. Practical training is impor-
tant, but poorly available. - Feed management and roughage production and preservation can be
enhanced. - Maize is an important feed, feed costs are 60% of the milk cost price. - Poor management in rearing young livestock. - Stakeholders expect a production growth at better-managed farms. - Veal production as in the Netherlands is no opportunity in Mexico: con-
sumers do not know such meat and production resources have better opportunities.
5.1 Structure
Mexico's dairy farms range from smallholder or 'backyard' to large state-of-the-art-parlour-free-stall farms. Most authors recognise three dairy farming systems (Dobson and Jesse, 2009). Mexico lacks good data on the number of farms, the number of cows and milk production. There are an estimated 1m Holstein cows in Mexico (Reproducción Animal, 2010). Besides, there will be many non-special-ised cattle, especially on small family farms. During the fact-finding mission, it appeared that most people use the distinction in region to describe farm types. Below are some characteristics of the farms in the regions, mentioned by the stakeholders. 1. Specialised, intensive, or confined production systems
The leading dairy area in México in terms of farm size and technology is situated in the area of La Laguna, on the border of the Mexican states of

53
Coahuila and Durango, with very big high-tech farms (500 - >1,000 cows), which grow alfalfa and corn for feed. In La Laguna the average milk produc-tion per cow can reach 9,000kg per lactation, some individual cows over 10,000kg. The production is very efficient, they often milk three times a day. Most of the farmers of Alpura and Lala are located in La Laguna. These systems are very similar to the specialised, intensive dairy systems in the USA. They use high technology, have high yields, import a big part of the inputs, have mechanical milking systems, use forage feed, have cooling sys-tems, and skilled labour. Nearly all milk is sold through the formal marketing chain. Most producers are members of full-service cooperatives that not only process their milk, but also supply inputs and services.
2. Dual-purpose systems They sell beef and milk, use local resources, and are regional providers. These are found mainly in the coastal range of the Mexican Gulf ((Tamauli-pas, Veracruz) and Chiapas. Most farmers have crossbreeds that are more suited to the tropics (Brownswiss, Montbeliarde). The average milk produc-tion per cow is 700-1,000kg per year. Milk from these farms typically will be marketed during periods of high beef prices, as these farmers tailor their output in response to both beef and milk prices. Most milk is sold on the in-formal market. In the Northern coastline there are also some big farms with crossbreeds, but management lacks, they do not use their sources effi-ciently (Reproducción Animal, 2010). According to Nestlé (2010) the in-crease in milk production is very slow, because of the limiting land and cow production; the grasses do not offer enough feed for more cows or in-creased production. However, the tropical areas produce milk efficiently with low cost of production according to Nestlé. Rabobank (2010) thinks that dual-purpose farms should invest in optimising grazing systems and breed-ing. They are lagging behind because they are not part of a formal structure like a cooperative, they are not integrated in a value chain, and they have a lack of infrastructure like cooling. Nevertheless, there still will be a future for the dual-purpose farms in rural areas.
3. Semi-specialised or smallholders also called family and sometimes 'back-yard' because the cows are held in corals or in the backyards of the houses (in case of very small farms) This production system does not have the genetic quality of the specialised systems but it is considered of good quality. The feed is grass, forage and crops grown by the producer; it is characterised by high costs and low profit margins (Nava et al., 2005; Palacios Muñóz, 2002). Investment in equip-ment is minimal and the farm family provides most labour (Dobson and

54
Jesse, 2009). In Jalisco the milk production per cow on average is 4,000-4,500kg per year. Farms have good genetics in this region, but good man-agement is lacking. They spend most money on semen and farmers like to go to dairy shows (Reproducción Animal, 2010). In this area, the centre of Mexico, there is a pressure on agriculture and labour. Farms that are not in-tegrated and that do not meet the quality standards, will have difficulties in the future (Rabobank, 2010). Those farms must become more efficient and of better quality.
Table 5.1 gives the main figures of each production system and Figure 5.1 presents the three different supply chains.
Figure 5.1 Three most common dairy supply chains
Confined /specialized dairy production system
Dual-purpose production system
Semi-specialized dairy production system
Familiy / backyard dairy production
Home consumption
Small cooperatives
Big cooperat
ive corporations (Lala
and Alpura)
Large sized processors at national level
Medium sized processors at state level
Liconsa
Supermarkets Informal market
Convenience stores
Markets
Nestlé Local cheese makers
Unchilled milk.
Chilled milk.

55
Table 5.1 Main characteristics of dairy production systems for three
dominating dairy farming systems
Characteristics Intensive specialised Dual@purpose
(milk and beef)
Semi@specialised
(smallholders)
Percentage over
national milk
supply
25-50% 20-30% 30-45%
Average herd
size, number
of cows
Around 100-500 and
more
Around 40-80 Around 5-100
Percentage over
total cows
17% 60% (75% Dobson and
Jesse)
23%
Yield
(lt/cow/year)
From 4,000 to 9,000 Below 1,200 From 1,800 to 4,500
Productive
life cows
2-3 lactations 7-8 lactations 5 lactations
Main regions Northern states South and tropics Central states
Main feed Alfalfa, corn silage
and concentrates
(20-22 pounds of
grain per day)
Grazing or forages
from cultivated pas-
tures or native grasses
Grazing part of the
year, mixture of grains
(11-13 pounds per
day), corn stover and
other by-products and
forages
Genetics 95% Holsteins F1 crossbreds,
Holstein or Brown
Swiss with Zebu, Criollo
Holsteins and Brown
Swiss. Lesser genetic
potential than special-
ised farms
Marketing Production sold
through the formal
marketing chain,
Lala and Alpura
Output is tailored in
response to both milk
and beef prices
Output sold to Liconsa
and other processors,
farm or local cheese
production
Milking and
cooling equip-
ment
Milking machines,
cooling tanks on farm
Hand milking, regional
milk collection centres
Minimal equipment,
often hand milking, few
cooling tanks on farms
Sources: Ávila Téllez (2002); Del Valle Rivera et al. (1997); Dobson and Jesse (2009); Hernández Laos et al.
(2000); Nava et al. (2005); Nicholson (1995); Palacios Muñóz (2002); San Juan et al. (2009) and Canilec (2010).

56
Box 5.1 A large farm: Posta El Cuatro
Posta El Cuatro has 6 units at different places. The unit we visited has 1,100 dairy cows,
produces 32,000kg milk/day and they use BST. Cow production on average is 31kg per day
per cow, milked three times per day. Production per lactation is around 13,000kg. In Jalisco
there are around 5 of these big farms. Compared to the northern regions Torreone in
Coahuila and Chihuahua this farm is medium sized.
Thirty people work at this farm/location; milking (3 x 7 hours) demands almost all labour.
Cows are kept in corals in production groups (from 6-35 days in milk, 35-120, >120 days in
milk) and are fed alfalfa, corn and oat. They grow 20% and buy 80% of the feed. The feed is
adjusted to the group and milk production. All female calves are kept for replacement and the
male calves are all slaughtered at three days old.
They have a formal contract with Danone, including production quota. Besides the
Holstein cows, they also have some Jersey cows (5%) and crossbreds (10%) because
Danone wants a higher fat percentage in the milk. The Holstein semen is from Canada and
Australia. Their largest challenge is to keep the cows in good health. In the raining season,
the cows suffer from udder and claw problems and in December, problems of getting a cold.
Yearly 25% of the cows are replaced.
Mexico produced about 11m tonnes of milk in 2008 from 2.2m cows, which means 5,000kg per cow according to the statistics of the FAO (see Sec-tion 3.2). Other sources indicate around 6.9m cows: this number includes dual-purpose cows that account for about two-thirds of reported milking cows. These cows produce between 10 and 30% of milk production (Dobson and Jesse, 2009). The milk production per cow has a wide range: from 700kg per cow for dual-purpose cows to 9,000kg per cow on the specialised dairy farms. Box 5.1 shows that 13,000kg per lactation can be achieved. About 25% to 33% of the produced milk goes into the informal circuit (IFCN, 2008; Dobson and Jesse, 2009). In this informal market, the milk product qual-ity may be considerably lower than in products sold in the formal market. Milk production shows seasonality: 6 months of a production below average and 6 months above. The period of above-average production in Mexico ends when winter begins and less forage is available. In the Netherlands, the produc-tion in the winter is above average. The fluctuation in the Mexican milk deliver-ies (coefficient of variation 5.0%) is larger than of the Dutch (coefficient of variation 3.5%).

57
Figure 5.2 Seasonality in milk deliveries (1,000 tonnes) in Mexico and
the Netherlands (average 2006@2008)
750
800
850
900
950
1,000
Jan Feb Mar Apr May Jun Jul Aug Sep Oct Nov Dec
1,00
0 to
n
Mexico 2006-2008
Mexico average
Netherlands 2006-2008
Netherlands average
Source: CBSstatline and USDA, 2008 and 2009.
5.2 Economic indicators
Stakeholders mentioned the low prices the farmers receive for their milk, espe-cially compared to the USA. Figure 5.3 compares the farm gate prices of USA, New Zealand, and the EU with the Mexican prices. From 1999 to 2009, the farm gate price of the USA was about 10% and of EU around 20% above the Mexican price. The average price in Mexico in the period 2005 to 2009 was EUR0.24 per kg. New Zealand's farm gate price is during the 10-year period 75% of the Mexican price. Producers complain about the cheap import espe-cially for milk powder, which indicates a lower performance in Mexico in milk powder production. The farm gate price differences are except for New Zealand not an incentive for import by Mexico from these countries, this in contrast to the opinion of the stakeholders. The below average import growth (Chapter 2) by Mexico from New Zealand seems related to rise of the farm gate price.

58
Figure 5.3 Farm gate prices (EUR per kg) in % of farm gate price Mexico
40%
60%
80%
100%
120%
140%
160%
1999 2000 2001 2002 2003 2004 2005 2006 2007 2008 2009
USA New Zealand EU-27
Source: Calculation based on OECD farm gate price and Eurostat exchange rates.
Prices received by farmers within Mexico vary between regions. In the tropi-cal zones, prices were lower in 2007 than those received by large farmers from central and northern regions. Quality and lacking sufficient demand from mod-ern processors might be the reason for the low price as mentioned above. During the fact-finding mission, stakeholders indicated farm gate prices (cost price + profit) vary between MXN4.00 and 4.40. The indications per litre are: - North: cost price is MXN3.80, profit is MXN0.60; - Jalisco: cost price is MXN3.50-3.60 (no external labour). The cost price is
relatively high, compared to the very large farms in the North. They have a profit of around MXN0.50 on a regular basis;
- Tropics: cost price is around MXN3.00-3.20, profit is around MXN1.20. The profit depends on milk/beef share, but milk is important for 'every day money'.
Little information on the cost structure has been found. Section 4.2 indi-cated that feed costs have a share 65% in the cost price. A study of Álvarez Fuentes et al. (2004) provides an overview as all costs of the average dairy farms. The share for feed differs, by the variation (indicated by the standard de-viations is high).

59
Table 5.2 Costs and profit indicators for milk production as % of
total costs
Value Standard deviation
Feed 50.4 28.3
Labour 21.5 21.0
Depreciation of cattle 10.5 10.6
Financial costs 8.5 6.4
Other 11.7 6.4
Total costs 100.0
Source: Álvarez Fuentes et al. (2004).
Table 5.3 presents financial indicators for each of the subgroups. The small-holders group is the least favoured. The dual-purpose group is similar in herd size and land ownership to the specialised group but with less educated labour, poorer access to subsidies, technical and management consultancy. The spe-cialised group has the best performance: the gross margin (difference between sales and direct production costs) is the highest per cow, ha and litre.
Table 5.3 Economic analysis of family systems
Production system
specialised dual@purpose smallholders
Total Gross Margin per farm (USD) 3,857 1,688 614
Gross Margin per cow (USD per cow) 391 143 122
Gross Margin (USD per ha) 555 176 201
Gross Margin per litre (USD per litre) 0.07 0.029 0.027
Production cost (total) (USD per litre) 0.25 0.27 0.26
Source: Espinoza Ortega et al. (2005).
5.3 Challenges and perspectives
Several factors propel a growth in production of milk, such as technological im-provements, governmental support, and better herd management practices. Sagarpa plans to increase milk production in Mexico includes actions for infra-structure and genetic improvements, training and technical assistance, farmers support to improve milking practices and parlours, and to purchase grains, by advising them in negotiating contract terms (Dobson and Jesse, 2009).

60
A major player in the milk industry worldwide has also taken actions to sup-port milk production in Mexico, namely Nestlé that has operated in Mexico for more than 60 years. Nestlé developed 'districts' in the tropical region of Mexico to collect milk for its processing plants. These districts enhance the quality and quantity of the milk, provide technical assistance, and offer micro loans to farmers that supply their plants (Dobson and Jesse, 2009). Notwithstanding governmental and Nestlé's actions, national production growth is affected by financial crisis, non-competitive dairy producers and cur-rent droughts (San Juan et al., 2009). Identified sources of low production are (Ávila Téllez, 2002; San Juan et al., 2009): - Land tenure problems, which hampers land as collateral. - Insecurity: thefts, assaults and kidnapping. - Inadequate development of management practices: low percentage of farm-
ers use an automatic milking system; it is common that foreign systems are adopted but not adapted to local characteristics, such as climate, mainte-nance availability and quality, labour, et cetera.
- A low percentage of the cattle is artificially inseminated with higher quality semen than that of the cattle itself. Therefore, genetic improvement is mea-gre. Short productive life of the cattle on average is a waste of the genetic potential.
- Frequent diseases and alterations reduce production levels or cattle's life-time (tuberculosis, brucellosis, anaplasmosis, babesiosis, fertility problems, mastitis, ecto- and endoparasites, hoof problems). Mexico is Foot and Mouth Disease free.
- Poor management in rearing young livestock. - Livestock is slaughtered at low ages due to lack of productivity and infertil-
ity. Breeding investments do not pay off. - Marketing of inputs has too many intermediaries that increase costs. - Lack of proper commercialisation channels. - Imports of sub-products from United States and Canada saturate the market
of fresh milk. - Problems with sanitation, transportation and processing capacity on fresh
fluid milk. - Inadequate cold storage and refrigeration infrastructure. - Lack of facilities to produce milk powder. Supply in the season of abundance
cannot be processed and stored for the season with low deliveries. This re-sults in an increase of imports.
- Lack of professionals in veterinary medicine, animal husbandry and agronomy.

61
- Some entities' practices might have an influence on low production: - Monopolistic practices of business groups in the commercialisation of
the milk. - Abolition and reduction of specialised milk producing herds. - Inaccessible credits to the agribusiness industry. - Unfair selling prices.
Aforementioned factors do not enhance an increase of the milk production not at small, but also not at medium sized farms. However, large farms are con-tinuing to make modest productivity gains through improved genetics and herd management practices (USDA, 2009). How do stakeholders see the future of the dairy farms? Farmers need to increase their production to be able to stay in business. This production growth should be achieved by higher yields per cow and not only by keeping more cows according to the Union (2010). It is important to increase milk production efficiently per cow, as there is a water and roughage shortage. To increase milk yield per cow, the cow demands more energy. Growing and/or importing corn or grains can achieve this. Also better techniques for feeding are needed. Nowadays farmers feed the cows during milking, but they should im-plement feeding outside the parlour so cows have more time to eat. Besides, they should keep the cows in production groups so feeding can be adjusted to the stage of lactation. In addition to the necessary increase in feeding efficiency, farmers need to make more use of AI and good genetics to improve genetic quality of the herd. They can make a quick jump forward with the right use of good semen. Farmers are aware of the necessary improvements, but they do not always have the re-sources to make investments or changes (Union, 2010). We asked stakeholders their opinion on the perspective for the different farm types: - Intensive specialised farms
The minimum size in LaLaguna will be above 300-500 cows in order to sur-vive. In Jalisco this is 100 cows nowadays, but will be above 200 cows in the future. With only 80 cows, they cannot survive (Reproducción Animal, 2010). A farm should produce at least more than 1,000kg per day to be able to survive if there is no job outside the farm. Besides, farms should be able to produce 50-60% of their own feed (Nestlé, 2010).

62
- Dual-purpose farms Farms with 30-50 cows and no off-farm jobs will not survive (Posta El Cuatro, 2010). Medium sized farms (around 100 cows) need to make their own labour more efficient by mechanisation, then they can survive in the fu-ture (La Daga, 2010), not with external labour. Canilec also mentioned the need for more efficiency on medium sized farms. The Union of Jalisco thinks that part of the medium sized producers may stop, because of the high cost price. According to the Union 20% of the medium producers stopped in the last six years, indicating a need for more efficiency.
- Semi-specialised, smallholders farms There are many small producers without the required infrastructure and equipment to produce like the bigger ones. This also affects the milk quality and as a result the price that is paid for it (Cofocalec, 2010). Some proces-sors work with preferred suppliers and demand cooled, high quality milk, and of a certain amount. It is difficult for small producers to meet these de-mands. If small farms cannot deliver to a dairy plant or processor like Nestlé, Lechera de Guadalajara or Liconsa they often deliver the milk to small local cheese makers or make artisan cheese themselves for the in-formal market. The price they get from the local cheese makers however is lower than the milk price paid by formal processors (Union, 2010). To be able to live as a family on a small farm they often have non-farm income so they still can survive and keep producing some milk, also for home con-sumption. Not integrated farms that cannot meet the quality standards will have difficulties in the future in selling their milk (Canilec, 2010). However, although there might be some difficulties in selling milk, the Union thinks that small producers will remain, because they have low cost of production (no equipment, pasture feeding). Canilec thinks that the small farms (100 litres per day) can impossibly live from that profit. They should increase produc-tion to at least 300kg per day which is the break-even point for a family to live from or make sure they get a partly job outside or other income accord-ing to Canilec.
5.4 Veal production
Male calves born at a dairy farm are often slaughtered at 3 to 10 days old. The meat resembles the meat of goat and lamb that is very popular in Mexico (Nestlé, 2010, Prolea, 2010). Some farmers keep the male calves on a plot of land as a kind of savings account (Nestlé, 2010).

63
In literature and during the fact-finding mission it appeared difficult to obtain numbers about veal production. During the fact-finding mission, it was said that there are a couple of men who raise male Holstein calves to about 500kg. Most stakeholders shared the same opinion 'meat is just beef!' and 'why raise and slaughter Holstein calves for meat?' Many people asked that question, besides they doubt if there would be a market for the meat in Mexico, as people are used to the 'real beef meat'. The general opinion is that veal production, as is done in The Netherlands, costs a lot of money, and the question is whether the margins are higher than compared to professional beef production. There are already many pure and crossbred beef cattle. Furthermore, according to Nestlé (2010), there is not enough feed and water to raise the male calves. Male calves are inefficient in the production of meat, so the feed and water can better be used for pigs or poultry.

64
6 Processing industry Key findings - The dairy processing industry gives direct employment to 37,000 and indi-
rect employment to 200,000 people. - Over 300 dairy processors are official registered, they use on average 80%
of their production capacity. - Over 2,000, not officially registered, artisanal cheese makers process
mainly uncooled raw milk. - The three larges milk processors - Lala, Nestlé and Sigma- process over
two-thirds of the total milk. - Almost all processors have their own milk quality control system. - Milk powder production does not appear to be attractive: imports are cheap
and there is no period in which Mexico is self-sufficient in milk. According to 2009 statistics of CANILEC (National Chamber of Milk Proces-sors), the Mexican milk processing industry is formed by 310 formal enterprises that give direct employment to 37,000 people and indirect employment to 200,000 people. Table 6.1 provides information on personnel and number of firms for three main types of dairy manufacturers: milk processors and packag-ing; cream, butter and cheese manufacturers and condensed, evaporated and powder milk processors. Largest activity in terms of personnel, and production value is the processing and packaging of milk. However, only 6 firms (1.5% of the dairy firms) carry out this activity. It is also the activity with the highest ca-pacity usage. 10% of dairy processers are dedicated to manufacture cream, cheese, and butter. The minor activity of the three in terms of employment and production values is the manufacturing of condensed, evaporated, and powder milk. Stakeholders mention that import of milk powder is cheap. From Chapter 3 and 4 we can conclude that Mexico is never self-sufficient in milk. Milk powder production seems not to be attractive. The remaining 85% of firms are dedi-cated to manufacturing other milk products. Appendix 9 shows the number of people directly involved in milk production in Mexico from 1998 until 2008. It shows a slight but continuous increase of personnel, while the number of hours worked increases more rapidly. Similarly, production and sales values increase more rapid than the payments to personnel. Table 6.1 presents the number of official firms registered at SIEM. All established firms subject to taxation have to register in the SIEM. This latter is the reason that artisanal cheese makers are

65
not included. During the fact-finding mission, stakeholders mentioned over 2,000 artisanal cheese makers: in the region of Chiapas alone around 600.
Table 6.1 Firms, personnel and production value of dairy processors
in 2008
Firms Personnel Total
payment
Production
value
Capacity
used
Processors
number persons MXNm MXNm %
Milk and packaging 6 22,431 2,954 45,045 91
Cream, butter and cheese 43 11,784 1,320 25,308 73
Condensed, evaporated
and powder milk
10 2,546 584 20,144 78
All dairies 2008 310 36,822 4,858 90,496 81
All dairies 2000 32,417 2,716 48,529 71
Source: SIAP (2009); SIEM (2010).
Table 6.2 allows us to compare the cost structure of the different dairy in-dustries. The industry with the highest variable costs is the liquid milk mainly purchase of raw milk while the highest fixed costs (by the author indicated as other fixed costs) are for the other 2 Mexican industry classes. These high other fixed costs are unclear to us. The cost structure of the Mexican industry class liquid milk resembles the performance structure of the dairy industry in Euro-pean countries. The shares in Europe showed little variations for 1997 to 2007.
Table 6.2 Cost structure of dairy industries (%)
Liquid
milk
Cream,
butter and
cheese
Condensed
and powder
milk
Dairy processors
(average 2003@2007)
Indicator
Mexico Mexico Mexico Germany France UK
Purchases of inputs 88 63 64 88% 87% 83%
Labour 7 7 8 7% 9% 10%
Fixed costs + profits 5 30 28 4% 4% 7%
Source: Hernández Laos et al. (2000) and Eurostat.
The three larges milk processors in the country are Lala, Nestlé and Sigma. These three firms together process 68% of total milk. Other major dairy firms in Mexico are Alpura and Chilcota. Lala and Alpura are dairy cooperatives, while Sigma, Nestlé and Chilchota are private firms. Table 6.3 shows the processing

66
share of each of these firms in Mexico. Besides these main processing firms, other smaller firms supply more regionally than nationally. Among these, there are two well-known international firms: Danone and Kraft foods (Dobson and Jesse, 2009). Table 6.3 does not include the extra 3.6bn litres that are proc-essed by small operators into artisan products or consumed on farms.
Table 6.3 Major processing companies and Liconsa in Mexico
Firm Quantity processed annually (billion litres) Processing share (%)
Lala 1.75-1.95 30
Nestlé 0.8-1.3 20
Sigma 0.35-0.65 18
Alpura 0.78-0.80 12
Chilchota 0.30-0.65 10
Liconsa 0.42 6
Other 0.23 4
Total 10.1 100
Source: Dobson and Jesse (2009).
Structural quality monitoring of bulk tank milk depends on the policy of the processor. Almost all processors have their own laboratories in which they can do their own analysis of milk samples, e.g. analysis of incoming milk for antibi-otic residues. The milk price they pay often depends on the quality of the raw milk. The disadvantage is that this analysis is not independent and sometimes farmers argue with the processors about the results. In these cases, Cofocalec offers her services to farmers to do a second opinion (Cofocalec, 2010). Additives to milk and the use of milk ingredients instead of raw milk are a hot topic in Mexico, mainly practiced by medium processors. These processors, who serve local markets and the periphery of big cities, do not comply with the requirements of the large supermarket chains. The smaller processors use only local raw milk without heat treatment, sold in unbranded bags.

67
Box 6.1 Liconsa
LICONSA is a parastatal company that produces and distributes milk to low-income citizens.
Milk is sold to consumers at MXN4 to 5 per litre, while its production cost is around MXN8
(4.50 purchase price plus MXN3.50 of production costs). Federal budget finances that gap.
LICONSA is trying to support national production by decreasing non-fat dry milk powders im-
ports. Liconsa processed 1,000m litres milk in 2009: 630m litres from its domestic suppli-
ers and the rest is imported milk powder. Liconsa does not provide services anymore that
formed part of the programme in the '80s. Liconsa purchases cooled and not chilled ('warm')
milk. In 2010, the budget is fixed for 1,200 litres of which 50% have to be from domestic
farmers. The price paid by LICONSA to producers gives a premium for quality milk, partly
paid by SAGARPA (San Juan et al., 2009). A governmental monitoring group sets the pur-
chase price based on actual market prices. The purchase price is revised every three
months. The premiums can add up to MXN0.60 and are for:
- Stimulus Fat content 30-32 grams/32-34 grams/>35 grams 0.05/0.10/0.15
- Protein content >30 grams 0.05
- Low total plate count 0.05
- Low somatic cell count 0.05-0.15
- Negative sampling of antibiotics 0.05
- Permanence in Liconsa Register >1 year 0.15

68
7 Wholesalers, retail and consumption of dairy products Key Findings - Supermarkets and convenience stores are the main outlet for processed
fresh milk, the daily/week market for raw milk. - Traditional products have the largest volumes in sales, but low or even nega-
tive growth rates. Flavoured milk and yoghurts have growth rates between 2 to 3% annually.
- Milk and milk products take almost 3% of the consumer budget (10% of the food expenditures).
- The dairy consumption of 300ml per day per capita is too low compared to the FAO recommendations of 600ml per day per capita.
- The Mexican milk consumption will increase with a growing population and income.
Little information could be retrieved on the structure and performance and on the distribution of dairy products. Table 7.1 provides the number of whole-sale and retail officially registered by SIEM. The low numbers in wholesaling in-dicates that large numbers of non-registered entities are active on the Mexican market.
Table 7.1 Number wholesalers and retailers officially registered in SIEM
Description Firms
Wholesale of natural milk 340
Wholesale delicatessen products and creamery 56
Retail of milk 1,443
Retail trade of food in supermarkets and convenience stores 8,438
Retail trade of food in non-specialised stores 1,584
Source: SIEM (2010).
Since 2003, the market with the USA is fully open, but according to the president of Canilec (2010); final products from the USA have not yet entered the Mexican retail. The processors experienced a high loyalty to their brands and managed to realise an annual market growth of 4% the last 6 years. Mexi-can processors are now exporting and investing in other countries: Lala in the

69
USA, Esmeralda in Uruguay (2 factories) and Argentina (1 factory) and exporting condensed milk to North and South America (45,000 tonnes per year). A case study in the State of Mexico showed that the producer gets 53% of the consumer dollar and the rest of the chain receives 47% (Nava et al., 2005). Self-service is the leading practice for Mexican consumers to acquire fresh milk. Figure 7.1 shows the main channels of fresh milk and raw milk.
Figure 7.1 Market channels for fresh and raw milk
0
20
40
60
80
100
Fresh Raw
OtherMarketConvenience storeSupermarket
Source: Proleche (2007).
Figure 7.2 shows that the main retail formats for dairy products are super-/ hypermarkets and discounters. Both formats, market share in 1998 62% and in 2010 72%, got a larger share at the expense of the independent small grocers and non-grocery retailers. Their markets shares declined from 26% viz 10% in 1998 to 20% viz 2% in 2010. The market share of convenience stores, doubles in that period from 2% in 1998 to 4% in 2003 and remained on that level in the following years. As in many other countries, the sales of 'traditional' drinking milk and cheese products are stable or even declining. In volumes, these products are the larg-est. Milk categories are for almost 60% consumed by children. Products with more convenience, like flavoured milk drinks and yoghurts shows an annual growth of 2 to 3%, as is shown in Table 7.2. The highest growth rate showed drinks based on soymilk, the volume is less than 2% of all dairy drinks.

70
Figure 7.2 Market channels for dairy products in % of total sales
0
10
20
30
40
50
60
70
80
90
100
1998 1999 2000 2001 2002 2003 2004 2005 2006 2007 2008 2009 2010
Supermarkets/Hypermarkets Discounters Convenience Stores Independent Small Grocers Others
Source: Based on Euromonitor international.
Table 7.2 Sales of dairy products in Mexico
Product Metrics 2004 2005 2006 2007 2008 2009 Yearly
growth
Fresh/pasteurised
milk
million litres 3,397 3,375 3,282 3,303 3,094 3,033 -2.2%
Long-life/UHT milk million litres 1,562 1,548 1,501 1,675 1,666 1,579 0.2%
Flavoured milk drinks million litres 125 137 148 160 155 144 2.9%
Soy drinks million litres 14 28 39 73 71 71 38.2%
Powder milk 1,000 tonnes 69 69 75 81 80 77 2.1%
Drinking yoghurt million litres 251 272 297 316 301 288 2.8%
Spoonable yoghurt 1,000 tonnes 205 224 239 251 248 239 3.1%
Processed cheese 1,000 tonnes 23 26 27 28 27 25 1.2%
Soft cheese 1,000 tonnes 271 301 307 315 299 266 -0.3%
Hard cheese 1,000 tonnes 107 116 122 125 120 108 0.2%
Source: Euromonitor International: Country Sector Briefing on Drinking Milk Products, Yoghurt and Cheese Mexico,
December 2009.
The composition of total households' expenditure in Mexico is shown in Ta-ble 7.3. It shows that 29% is spent on food, beverages, and tobacco. Expendi-tures on milk and milk products count for 2.8% and are among the smallest

71
category. Liquid milk represents 64% of dairy consumption, from which 52% is spent in pasteurised liquid milk. Liquid milk is preferred because it is perceived as cheaper, healthier and stronger, while consumption of processed dairy prod-ucts has been affected by the financial crisis (San Juan et al., 2009).
Table 7.3 Households basket composition as percentage of total expen@
ditures
Total (%) Food (%) % of milk
(products)
Food, beverage, tobacco 29 29
Tobacco, alcoholic and other beverages 3.0
Outside house consumption 6.9
Fruits and vegetables 3.1
Milk and milk products 2.8 100
Pasteurised liquid milk and UTH 52
Powder, condensed or evaporated milk 7
Other milk: such as raw, donkey, goat milk 5
Cheese 24
Yogurt 7
Cream 3
Other dairy products 2
Meat and egg 6.2
Fats and vegetable protein 7.4
Clothing and dwelling 15
Cleaning and domestic expenditures 6
Health and personal care 9
Transport 19
Education and leisure 16
Other 6
Source: CANILEC (2008).
Table 7.4 present the consumption of dairy products for the selected coun-tries. It shows that the Mexican consumption is modest, but more or less on the same level as other countries with a comparable income. Consumption of dairy products rises with a rising GDP per head. The expected rise in GDP per head and population growth (Section 2) will result in a growth in the total consumption of dairy products. The population growth alone accounts for 1.3% annual

72
growth. The consumption of dairy products per capita in the period 2000-2005 was stable according to FAO consumption data.
Table 7.4 Dairy supply quantity (kg/capita/yr) and GDP/capita
(current USD) in 2005
Country Butter Cheese Cream Milk GDP
USA 2.1 15.4 0.02 256.5 41,873
Brazil 0.4 0.2 120.8 4,741
New Zealand 6.5 3.1 0.19 165.2 26,223
Netherlands 2.1 20.0 0.36 339.9 38,785
Argentina 1.4 8.0 0.08 186.1 4,728
Mexico 0.7 2.2 0.06 117.1 8,216
Australia 3.9 11.4 232.8 33,088
Belgium 6.3 16.5 10.05 244.5 35,838
Chile 0.9 3.5 0.09 104.3 7,257
Uruguay 1.4 3.4 149.8 5,252
Source: FAOstat.
Mexican population has been growing at a constant peace. It has also been transforming since 1950 from rural to urban: 33.5% urban population in 1950 and 74.63% in 2000. Milk production has been growing at every time lower peace. Hence, demand surpasses production. Moreover, demand is focused on price and not on health contents and quality (Ávila Téllez, 2002). However, poli-cies aim at reducing the calorie intake to prevent obesity among youth. Dairy organisations have joined to protest that milk will be put on a list of food prod-ucts prohibited to be sold inside schools. The dairy organisations state that there is not enough information to justify that only non-fat milk is on the list of al-lowed products, while whole milk, yoghurts, et cetera are on the not-allowed list. Per capita dairy consumption is too low, 300 ml per day per capita, while FAO recommends 600 ml.

73
8 Supporting and enhancing environment Key Findings - Farmers association represents farmers in different ways from enhancing
capabilities to political pressure. - Dairy processors are represented by their own organisation Canilec. - Different stakeholders comment that practical training and professional edu-
cation is lacking. In addition, applied research is poor. - Sustainability is of growing concern for both government and private sector.
The Government is targeting the primary sector with specific programmes. - Nestlé focuses on sustainability of their suppliers mainly farms with dual-
purpose cows.
8.1 Farmers and dairy processors associations
Associations are important as intermediaries between sector and the govern-ment, to develop a sector strategy and to support interests of the sector. In Mexico, farmers associations have strong roots in the historical agrarian strug-gle for land rights. In the '80s and '90s with withdrawing government support, farmer organisations started to focus on 'the control of productive processes', that is, integration into market chains (Bartra et al., 2008). Nevertheless, farm-ers' movements maintain a highly political character. The most important na-tional cattle associations in Mexico are: 1. ANGLAC (Asociación Nacional de Ganaderos Lecheros)
ANGLAC represents the large producers, those companies (about 200) with over a thousand cows on one site with ample resources and technology. They are mainly located in La Laguna and represent about 80% of national milk production. Most ANGLAC members are also member of Canilec.
2. CNOG (Confederación Nacional de Organizaciones Ganaderas) The CNOG is a lobbying organisation and - contrary to the UNPP - not at-tached to a specific political party. The CNOG integrates not only milk pro-ducers but also sheep farms, cattle raisers and beef genetic companies. The CNOG is formed by regional Unions of farmers at state level in ten states of Mexico, which differ in importance (Jalisco is important). Some states have more than one Union, as they are also specialised according to commodity (Cofocalec, 2010, Union, 2010). The Union is particularly con-
74
cerned about the small and medium producers, who are commercially most affected by the internationalisation of dairy supply chains. According to the secretary of the Unión Ganadera de Jalisco, all factors are against them: they have to purchase feed at high cost but receive low price for their milk. The Unión Ganadera de Jalisco operates supporting programmes for milk producers financed by the state of Jalisco and federal resources from the Secretary of Agriculture (Sagarpa). It focuses on production conditions to improve milk quality and performance, on the collection of warm surplus milk to regulate market price and on the construction of a milk powder plant (see Box 2.1). CNOG integrates also beef cattle farmers.
3. UNPP (Unión nacional de Productores Pecuarios) The UNPP is the livestock arm of the CNC (Confederación Nacional de Cam-pesinos), which in turn is linked to the Partido Revolucionario Institutional (PRI), ruling party in Mexico for over 70 years until the presidential elections of 2000. It has a strong political component, visible by its many manifesta-tions outside the Ministry of Agriculture to claim farmers' rights. The CNC has the historical culture, perceptible to a more or lesser degree in all farm-ers' associations, of trading-off votes against benefits for the voters, as con-trary to a more entrepreneurial focus.
4. FNDPCL (Frente Nacional para la Defensa de los Productores y Consumidores de Leche) The FNDPCL originates also from the CNOG. It is very outspoken in the me-dia on dairy issues. In 2009, it posed a complaint before the WTO of dump-ing milk by integrants of NAFTA, claiming that North American producers receive an equivalent of MXN5 per litre which is sold to Mexico at a price of MXN2.30 for whole milk and MXN2.80 for skimmed milk (El Financiero, 2009). This statement does not comply with the protection rates as showed in Section 2.2 An investigation to prove practices of 'dumping' subsidised milk is expensive (requires hiring international lawyer consultants) and com-plicated (Cofocalec, 2010).
The CNOG, UNPP, and FNDPCL together represent about 150,000 non-integrated small dairy farms, the majority with less than 50 cows. They repre-sent about 20% of national milk production. Dairy processors are organised in Canilec (Cámara Nacional de Industriales de la Leche). Canilec represents 146 dairy processors, of which around 100 represent 77% of the total consumption of final dairy products in Mexico. Among others, Lala, Alpura, Nestlé, Chichota, Danone, Alpura and Sigma are members. Canilec secures the position of its members in the national end mar-

75
ket. To become member of Canilec, a processor must comply with the Codex Alimentarius and the USA Food and Drug Administration (FDA) regulations. CANILEC promotes sustainability diminishing methane gas emission, wastewater treatment plants, conversion of energy use from gasoline to gas; treatment of animal waste.
8.2 Knowledge infrastructure: research and extension
INIFAP (Instituto Nacional de Investigaciones Forestales, Agrícolas y Pecuarias) is a governmental network of research institutes that has as mandate ' … to generate scientific and technological innovations in agriculture and forestry, as a response to demands and needs in the agro-industrial chains and in the sev-eral types of producers in order to contribute to sustainable development …'. INIFAP counts 1,052 researchers in 38 regional research centres and experi-mental stations. Of the researchers, 64% work on agricultural issues, 25% on livestock issues, and 11% on forest issues (INIFAP, 2009). INIFAP has a special network for beef cattle including governmental institutions, service providers, and private sector enterprises covering the whole chain. INIFAP works closely together with Sagarpa on the implementation of e.g. PROGAN. INIFAP works with different modules for the transference of knowledge and technologies to farmers and service providers, such as the GGAVAT groups, field schools, and through diplomats and workshops for the private sector on the issues of artifi-cial insemination, vaccines, software, et cetera. Sagarpa and INIFAP finance and promote 'Ggavatt-groups' (Cattle ranchers' technology validation and transfer groups). GGAVATT groups consist of 10 to 20 cattle farmers with the same production site characteristics, who have to be organised in order to receive extension service aiming at improving production systems. Since the '80s, triangles between researchers, service providers/ change agents and farmers are promoted. Leading universities (Tecnológico de Monterrey, Universidad de Chapingo, UAM, UNAM) have their departments for livestock research. Agricultural extension services form a large part of the many support pro-grammes implemented by Sagarpa. Sagarpa staff does these extension ser-vices, but also third parties may inscribe. Stakeholders from the dairy sector comment that applied research is lack-ing. They also think that farmers have a lack of knowledge, with the exception of the large farms. Farmers do not really evaluate the strategy of breeding, feed-ing, and grazing. They do not implement specific improvement or investments:

76
they only focus at milk production and number of calves that are born. They can make an improvement in management if a good source of knowledge and train-ing exists. What is needed according to Reproducción Animal are practical train-ing centres, where farmers learn how to manage a dairy herd, feed production and feeding. The very big farms in LaLaguna solve this by hiring external advi-sors like veterinarians and nutritionists from the USA. However, for the medium sized farmers, who want to improve their performance and to specialise practi-cal knowledge and training/education is needed (Reproducción Animal, 2010).
Box 8.1 Nestlé
Nestlé buys milk from 4,500 producers, 2.3m litres per day. Nestlé's relationship with the
producers is strictly to buy the milk. Nestlé is not a cooperative. They have informal contracts
with the farmers, which mean 'informal (oral) understanding'. Farmers can decide to deliver
their milk to another buyer, but they must inform their decision in advance to Nestlé.
Much variation between the producers selling the milk to Nestlé exists:
- a few very big farms: 20 farmers with >20,000kg per day;
- 30 farmers with approximately 5,000kg per day;
- the other farms deliver on average 500kg per day (between 10 and 5,000kg per day).
Trucks are collecting all milk. Nestlé only buys cooled milk. There are no collection cen-
tres owned by Nestlé. About 90% of the farmers have a milking machine and cooling tank.
Some small farms share a cooling tank (e.g. family members). Nestlé provides technical as-
sistance and also financial resources if necessary. Small farms (<1,000kg per day) can get
loans from Nestlé to use for investments, but only if Nestlé sees future perspective and if the
farm can produce their own feed. If farms are near the city or without land, Nestlé does not
provide loans.
Nestlé has a policy to develop. They have several reasons for this:
- Nestlé prefers 1,000 farms of 1,000kg per day instead of 100 farms of 10,000kg per
day. They think it is better for food safety and environment. Nestlé is concerned about
the environment, as no legislation exists.
- If you have many small farms, more persons benefit profit and more employees in total,
so you keep people at work. Many small farms that produce the same amount of milk
than a big one.
- The interdependence is bigger when farms are large. Buying milk from many small farms
gives more flexibility for Nestlé and allows the application of their principle of business:
Creating Share Value.

77
Box 8.1 Nestlé (continued)
Quality and Pricing
Nestlé takes milk samples from every delivery from every farmer. Milk samples are analyzed
ad random three times in two weeks (farmers do not know when). Nestlé pays a basic price
with premiums (e.g. if a farm is free from Tuberculosis and Brucellosis, have a good TPC and
Solids content) and penalties (for antibiotic residues). Price also depends on cost price of
production, region, market, and competition, so not all farmers in the country receive the
same price from Nestlé. Total Plate Count (number of bacteria in the milk) is also analyzed,
but Somatic Cell Count not everywhere.
Nestlé does not promote the use of BST, but does not forbid it either, it is the farmer's
decision in consideration that in the Mexican Law it is allowed.
In the future Nestlé wants to buy more milk from tropical areas, because they have a big
potential and good use of natural resources of production. Nestlé says they need efficient
farmers in order to survive.
8.3 Sustainability
Farmers and processors do not yet recognise environment and sustainability as important. Stakeholders tell that in the near future, more attention should be paid to the water shortage in the North, CH4 emission, bio-fuel production (e.g. from manure) and deforestation in the South (Canilec, 2010). According to sev-eral newspaper sources, in Mexico, every year around 260,000 hectares of forest disappears and the principal hydrological water basins are contaminated with salt and arsenic. In comparison with the period of 1990-1994, 1.9m of hectares of the productive potential of land deteriorated and 67.7% presents some kind of degradation (chemical, hydrological, physical). Aquifers are over-exploited or contaminated with salts. In the region of La Laguna, the hydrologi-cal balance is negative: the quantity of water extracted, exceeds the natural re-charge of the aquifers. In the region of La Laguna agriculture uses 80% of water resources, cities and-household 15%, and the industry 5%. The government support financially 'green' programmes, but technology and knowledge is lack-ing in Mexico.

78
9 SWOT analysis Key Findings - Opportunities of the dairy industry in Mexico frame the opportunities for
Dutch enterprises and organisations. - Farmers' capabilities of management on cattle, feed and roughage produc-
tion and milking infrastructure in Mexico need to be strengthened. - Seasonality in raw milk supply results in low prices during spring. - Key Success Factors, actions and opportunities are addressed to each
chain actor in Table 9.1. - A focussed agenda setting strategy, shared by all chain actors and environ-
ment, will enhance the Mexican dairy industry.
9.1 Introduction
This chapter analyses the Strengths, Weaknesses, Opportunities, and Threats (SWOT) of the Mexican dairy sector. The Opportunities and developments (Sec-tion 9.2) on the Mexican market frame the opportunities for the Dutch suppliers. The Key Success Factors and the business opportunities are presented in Sec-tion 9.3 and addresses specific chain actors. The Dutch business opportunities will be addressed in Section 9.4. A SWOT analysis recognises two viewpoints: 1. External analysis
The threats and opportunities are the main items for analysing the external environment and are out of control for the industry. These threats and op-portunities are derived from the macro-environment and the industry envi-ronment. The elements are political, legal, economic, technological, and social forces that affect the industry. An example is given to clarify the im-pact of the industry focus. Let us assume that the Mexican goal is to achieve a higher level of employment in the dairy sector and thus increasing the milk production and decreasing the imports. This is clearly an opportunity for the Mexican dairy farmers and breeders. It is, however, a threat for Dutch exporters of dairy products to Mexico. It might be opportunity for the Dutch to support the Mexican aim by providing consultancy knowledge or high-valued semen.

79
2. Internal analysis The industry's strengths and weaknesses, the internal environment, have to be categorised. These issues are under control of the industry. On these issues the performance of the industry is compared with others or self-imposed standards based on the own experiences in the past. Competitive advantage refers to resources that cannot fully be duplicated by other coun-tries. The main resources in this respect are human, organisational, and physical resources. A competitive advantage in Mexican dairy might be raw milk with a cost price below import prices. Abundant availability of labour of land or high yields, as such, is not a competitive advantage. They are an ad-vantage if it results in a lower price or a better quality for the same price compared to the competitors.
We discuss in the following sections the dairy industry. Veal production is not considered as an opportunity in Mexico: consumers do not know veal and demand is uncertain. Production is economic not desirable due to shortage of water and feed, according to stakeholders. Market introduction of veal will be costly and will demand many efforts. This will be already a hard job for a do-mestic enterprise, who knows the Mexican culture and market.
9.2 SWOT: Strengths, Weaknesses, Opportunities and Threats
Strengths - Knowledge and farm management on large and modern farms
Large-scale and modern farms are located in Mexico, with up-to-date tech-nology and management. They have milk control, confidence in genetics and equipment to handle proficiently the cattle and milk. They hire international experts and their performance is on a comparable level as farms in the USA.
- Dairy processing knowledge Foreign dairy processors as well as Mexican processors with foreign sub-sidiaries are active on the Mexican market. These firms provide economies of scope: technology and product knowledge from different countries can be exploited on the Mexican market.
- Farmers and processors associations Farmers associations and the processors association support enhancing the performance of the members and implementing technologies that are more advanced. However, it became not clear whether they developed a business strategy shared by suppliers, farmers, processors, supporting and enhanc-

80
ing industries as well public authority. Some associations are policy oriented (pressure group).
- Knowledge transfer Nestlé, one of the largest multi-national dairy processors, supports small and medium-sized farms in improving their management. This social respon-sibility enhances the competencies and capabilities of a large number of farmers. Lecheria Guadalajara has a similar strategy on a smaller scale. The Union (CNOG) provides farmers technical assistance to improve milk quality and production.
- Sector growth and decreasing support levels The milk production grew annually by 1.9%, while at the same time subsidies and protection rates decreased. The dairy sector showed to be competitive. This competitiveness is not strong: the Mexican import grew faster than the monetary world imports.
Weaknesses - Weak infrastructure and poor management on farms
Many farmers have no cooling tank or access to a cooling tank, which is a prerequisite for an acceptable level of milk quality. Other technologies seem also inadequate. Milk quality control, disease control, feed management, and breeding are at a poor level. The result is a poor economic performance.
- Seasonality in milk supply In spring and summer, a season with sufficient roughage, a peak in raw milk supply exists. This seems to originate from the farms with dual-purpose cat-tle. Dairy consumption remains on an equal level during the year. This re-sults in price variations.
- Not self-sufficient Mexico is a net importer of diary products and in no period, the production is sufficient to match the domestic consumption. Processors will be reluc-tant to invest in milk powder plants, as these plants will be a major part of the year idle and imported milk powder is cheap.
- Poor knowledge of farmers on own performance Lacking information systems on milk production per cow and on economic indicators prevent farmers improving their management on all subjects: breeding, feed management, profitability.
- Credit facilities The primary sector is hampered by credit facilities and credit is rather costly. The image of the agricultural sector is poor. Moreover, farmers con-sider credits from the government as subsidies, which do not increase their

81
credibility. Business plans, based on sound economics, are needed to con-vince credit providers, that the loan including a fair interest can and will be paid back.
- Breeding Veterinary reasons might prevent import of semen of some countries, but in general, sufficient semen can be imported. Improvement of the genetic qual-ity of dairy cattle is hampered by the low use of Artificial insemination (AI). AI requires a minimum farm size and a good infrastructure of AI services.
- Animal health Frequent diseases reduce production levels or cattle's lifetime (tuberculosis, brucellosis, anaplasmosis, babesiosis, fertility problems, mastitis, ecto- and endoparasites, hoof problems). Mexico is Foot and Mouth disease free.
- Milk production control systems Milk production control systems at the cow level are needed. Such a system is in the Netherlands widely accepted and seen as a useful tool to monitor all kind of management aspects like feeding and breeding.
- Low effectiveness of government programmes In general the government programmes have sound objectives. However, the implementation needs strong improvement in effectiveness and effi-ciency. Farmers' attitude should change. Subsidies should be used for the goals for which they are granted. Loans should be paid back with interest and should not be seen as subsidies.
- Knowledge Infrastructure Practical training and professional education is lacking, for farmers as well as for service providers. Applied research is seen as poor.
- Feed production and preserving Feed production and preserving for periods outside the growing season have a poor level of proficiency. Roughage production can be improved be better grassland seeds and grassland management.
- Feeding Better techniques for feeding are needed: outside the parlour and adjusted to the stage of lactation.
- Weak competitiveness Despite lower farm gate prices in Mexico than in the USA, Mexico has to im-port dairy products. Milk powder is a cheap substitute for domestic pro-duced raw milk. It suggests a poor performance of producer or/and at processor.
82
- Food law not strict The processing industry only cares about the lowest price for their ingredi-ents wherever it comes from. Sometimes they use vegetable ingredients to make milk or cheese. Quality awareness among chain participants and con-sumers is low.
- Food safety artisanal products unclear Artisanal producers are unclear in food safety aspects and pay a low price to producers. As the market develops to a higher end market, these prod-ucts are not competitive.
- Quality control Supply chain wide quality control of milk and dairy products is poorly prac-tised. Third party inspection and certification of dairy products is scarce but emerging.
- Sustainability. Sustainability is not yet an issue for farmers and processors, despite the money from the government for 'green' programmes. Environment has to be an issue, but Mexico lacks knowledge and technology to prevent environ-mental damage to the environment.
Opportunities - Population and income growth.
Population is growing, which will result as such in a larger market. The growth of the GDP per head will lead to a higher consumption of dairy prod-ucts per head. Even with these shift the actual consumption has to be dou-bled to reach the FAO recommendations.
- NAFTA membership Opening of the economy allows producers and processors to import tech-nology from other countries, without (prohibitive) import duties. This enables to modernise the industry by buying better technology that included embed-ded knowledge.
- High value products With rising income, the demand for differentiated consumer products (fla-voured milk and yoghurts) will increase. The growth rate of these products is higher than the 'traditional' dairy products. The urbanisation will also contrib-ute to a higher demand of these products. The international operating dairy suppliers can exploit economies of scope: they have recipes of deserts, convenience, or health products. These recipes have to be adapted to the Mexican consumer preferences.

83
Threats - Cheap import
An overall concern of farmers is the cheap import especially of milk powder. With the abolishment of subsidies and protection imposed by WTO or NAFTA, trade will have an increasing impact on the economic activities in Mexico. If Mexico succeeds in putting their economic performance on a competitive level with other countries, the country will benefit of the open-ness.
- Government support In general the government programmes have sound objective of increasing productivity and infrastructure of small farmers. However, the implementa-tion needs strong improvement in effectiveness and efficiency; aiming at making farmers' attitude market driven. Farmers are eligible for support if they are organised and from marginal areas, more than on the analysis of sound business plans. Politics is sometimes used to win votes instead of long-term support of the agricultural sector.
9.3 Key Success Factors and business opportunities
In general, one can state that the weaknesses have to be mitigated and threats have to be dealt with. A developed critical domestic market enhances perform-ance of the domestic industry according to Porter (1990). Table 9.1 provides the Key Success Factors, possible actions and the business opportunities. The actions are addressed to specific chain actors.

84
Table 9.1 Opportunities for enhancing the Mexican dairy industry
Actor Key Success
Factor
Action Opportunity
Supplier of
semen and
embryos
Genetic potential Increase awareness of
benefits. Enhance
knowledge transfer,
extension, and
accessibility of Artificial
Insemination. Include
more issues in breeding
strategy
Higher milk returns,
higher competitiveness
Credit
facilitators
Providing credit on
sound economic
business plan
Evaluate the dairy sector
on their business
characteristics and
performance
Lower risk on lending,
improvement of dairy
farms and firms
Feed producers Providing year
around well priced
concentrates
Optimising technology and
inputs (including by-
products from the food
industry)
Higher level of
business activities,
higher performance
Suppliers of
equipment for
farms and
processors
Tailored made
supply
Support farmer in
implementing beneficially
e.g. cooling tanks, milking
machinery
Increasing own
business activities
Dairy farmers Overall
competencies and
more specific
proficiency in
roughage
production, feeding
strategy and rearing
young stock
Improving their knowledge
and competencies by
training
Better performance.
Producing at
competitive prices
possibility of levelling
seasonal production
Artisanal
producers
Consumer trust and
quality
Develop a strategy for
improving and embedding
quality and food safety of
artisanal products
Consumers trust in
differentiated products,
better prices

85
Table 9.1 Opportunities for enhancing the Mexican dairy industry (continued)
Actor Key Success
Factor
Action Opportunity
Large
Processors
Develop consumer
market
Serving the market with
quality products at low
prices and enlarge market
with differentiated
products
Long term preferred
business partner for
farmers as well as
supermarkets
Professional
organisations
Capabilities and
knowledge of actors
(service providers
included) in supply
chain
Enhance capabilities by
organising training and
extension
Higher proficiency
levels for all actors in
the chain resulting in
better performance
Professional
organisations of
farmers and
processors
Strategy for dairy
industry
If not available: establish
one. Task: developing an
agenda setting strategy.
Lobbying to get funds to
realise strategy
Focus on improving
Key-Success Factors
Public
authorities
Industry enhancing
institutions
General public issues like:
Adequate infrastructure,
education aimed at dairy
or doing business issues
(e.g. solve problems of
land ownership)
Lower transactions
costs and higher
performance of the
industry. Income and
employment generation
All Shared strategy Develop an agenda
setting strategy to focus
the ambition on feasible
and realistic issues
Competitive,
responsive, innovative,
and viable dairy sector

86
10 Recommendations and Dutch Business opportunities Key Findings - Most important challenges are enhancing the competencies of all actors, es-
tablishing an efficient value chain, reducing losses and chain transparency. - Enhancing a higher performance of the larger semi-specialised and dual-
purpose farms is recommended - Levelling the seasonality of the milk supply will improve the Mexican self-
sufficiency on dairy products. - Dutch enterprises can support the Mexican opportunities. Enhancing the ca-
pabilities of Mexican enterprises in the dairy is a major possibility for Dutch organisations.
- Dairy experience tours to the Netherlands enhance 'being in the top of the Mexican stakeholders' minds'.
10.1 Recommendations
The most important challenges are enhancing the competencies of all actors, establishing an efficient value chain, reducing losses and chain transparency. Fostering entrepreneurship enhances realising opportunities. In Table 9.1 we provide several examples. To focus the recommendation we will be more specific: 1. Higher performance of farms
Several levels of proficiency of farmers are identified. The large modern, technology well-equipped farmers have enough sources and capabilities for an excellent performance. We recommend a focus on the larger semi-specialised and dual-purpose farms. A lower cost price per litre can be achieved by a higher yield per cow. This requires a better management on feed production, feeding, breeding and cattle care. Second, a higher quality of raw milk needs furthermore a better infrastructure (milking machines, cooling tanks, quality system). The challenges are enhancing farmers' capa-bilities, providing credit facilities based on sound economic and technical business plans, providing institutions on milk production control at cow level and on cattle breeding (e.g. Artificial Insemination). Credit and interests need

87
to be paid back from the higher farm income and that commitment needs to be clarified in a sound economic business plan.
2. Levelling seasonality of milk production Despite that, groups of farms can produce raw milk at a price competitive with USA, the main foreign supplier; imports grow faster than the domestic production. In the spring and summer period a peak in milk deliveries exists and a dip in the other seasons. A higher self-sufficiency can be achieved be a less pronounced seasonal supply. Feed strategies (including harvesting and storing of roughage) and management competencies should be ad-dressed to produce more raw milk in the autumn and winter period.
Achieving above recommendations demands a thoroughly elaborated strat-egy. All actors in the dairy industry from suppliers to wholesalers have to share this strategy. The focus has to be on the activities under control of the chain ac-tors. The performance of other countries will be a major benchmark for evaluat-ing the performance of each actor in the supply chain. Actors need to be aware that the conduct of actors in other countries is definitely out of their control.
10.2 Dutch Business opportunities
Abundant opportunities for the Mexican dairy industry are identified. Dutch firms can exploit these opportunities by supporting the Mexican dairy industry achiev-ing a higher performance. We distinguish opportunities for private firms and or-ganisations that can enhance the institutional and knowledge environment. We follow the supply chain downstream for the opportunities for private firms: 1. Seed producers
Enhancing grassland and roughage production and management contribute to lower production costs and availability of roughage year around. The lat-ter is a condition for mitigating the seasonal milk production. Netherlands is a renowned breeder of all types of seeds. Supplying improved seeds for grassland as well as other roughage like silage maize is an opportunity. Knowledge transfer how to exploit these seeds will strengthen business relations.
2. Cattle breeders and Artificial Insemination Semen and embryos from high productive dairy breeds can help the large group of semi-specialised farmers. Dutch firms who want to export need to enhance the infrastructure of Artificial Insemination. Awareness among farm-

88
ers of the benefits, confidence in genetics and good infrastructure to pro-vide full service at any time are Key Success Factors to make artificial in-semination and good genetics successful.
3. Feed management and production of concentrates Concentrates are poorly available for most dairy farms: the large specialised farms do produce it on their farm. Production and marketing of concentrates need to be supported by a better feed management. Some Dutch compa-nies started already a subsidiary in Mexico. Key Success Factor is providing technological know how and how to organise knowledge transfer on feed management.
4. Milk production control Milk production control at the level of the individual animal is an useful tool to monitor all kind of management aspects like feeding and breeding. In addi-tion, these data can be used to estimate breeding values of bulls. The actual participation in milk production control in Mexico is low because farmers are not interested in sharing data. Enhancing the supporting industry is again an important issue.
5. Joint ventures and subsidiaries Processing industry can establish joint ventures or subsidiaries in Mexico and exploit economies of scope. Opportunities can be found in differentiated high value consumer products and technical application based on raw milk.
6. Export of products The Netherlands can export their products, mainly consumer products. The low export performance, as expressed by the low import shares, shows that support by the Dutch government might be beneficial, especially in the cul-ture differences between both countries. Private firms are well capable to draft feasible business plans.
Opportunities 1 to 4 are mutual dependent to a large extent and demand support of knowledge transfer. The second strand of opportunities is in the field of enhancing the institutional environment of the Mexican dairy industry. The Dutch agricultural knowledge system is world wide renowned. Public-private or-ganisations have ample experience in training from professional to academic level. More specific: Dutch organisations provide training for farmers world wide, with a mix of training at location and at facilities in the Netherlands. Organ-ising responsive viable value chains, including logistics received last decades much attention at the Dutch universities and colleges.

89
Finally, companies and organisations who want to export to Mexico should tailor their product's marketing to suit the different farm styles and Mexican cul-ture of doing business. Inviting Mexican stakeholders to experience the Dutch way of dairy farming and processing will enhance the market opportunities of the Dutch on the Mexican market. Such tours can be organised in close collabo-ration with Mexican professional organisations (e.g. Canilec). Appendix 10 pro-vides a list of companies in Mexico related to the dairy industry.

90
References Anaya, Personal communications Rodrigo Anaya, 2010. Álvarez Fuentes, G., J.G. Herrera Haro, R. Barcena, R. Gama, F.E. Martínez Castañeda, A. Hernández Garay and J. Pérez Pérez, 'Calidad de la alimentación y rentabilidad de granjas lecheras familiares del sur de del Valle de México.' In: Red de Revistas Científicas de America Latina y el Caribe, España y Portugal 53 (201), 2004. Ávila Téllez, S., Estado actual de la ganadería bovina, comercialización, consumo e importancia de productos lácteos en Mexico, Producción de Leche con Ganado Bovino. Vol. Cápitulo 1., 2002. Bartra, A. and G. Otero, Movimientos indígenas campesinos en México: La lucha por la tierra, la autonomía y la democracia. From: 'Recuperando la tierra. El resurgimiento de movimientos rurales en África, Asia y América Latina'. Sam Moyo y Paris Yeros [coord.]. Buenos Aires: CLACSO, Consejo Latinoamericano de Ciencias Sociales. 2008. ISBN 978-987-1183-85-2. Canilec, La nueva fase del mercado agropecuario: de los commodities a los productos procesados. VIII Foro De Especttativas Del Sector Agroalimentario Y Pesquero, 2008. Canilec, Personal communications by Dr. Félix Martínez Cabrera. Presidente from Canilec, 2010. Cofocalec, Personal communications by Dr. Sergio Soltero Gardea. Director General from Cofocalec, 2010. CVA, Personal Communication by Rodrigo Anaya. Centro de Valor Agregado, 2010. Del Valle Rivera, M.C. and A.G. Álvarez Macías, La producción de leche en México en la encrucijada de la crisis y los acuerdos del TLCAN, LASA. Continental Plaza, Guadalajara, Jal. México, 1997.

91
Dobson, W.D. and E.V. Jesse, The Dairy Sector of Mexico: A Country Study. The Babcock Institute for International Dairy Research and Development. Madison, 2009 El Financiero en línea, 9 July 2009. El Siglo de Torreon.com.mx: 'La región hacia el colapso', article by Fabiola Pérez-Canedo Herrera, based on a technical study by the National Water Com-mision (CNA) for the actualization of hydrological knowledge of the Laguna Region, March 1, 2006. Espinoza Ortega, A., A. Álvarez Macías, Mdc. Del Valle and M. Chauvete, 'Small-holder (campesino) milk producion systems in the highlands of Mexico.' In: Téc Pecu Méx 43(1): pp. 39-56, 2005. Esquívez González, E., La Industria de Alimentos Balanceados. Factsheet by Director Agribusiness of FIRA, 2007. FIRA, 'La competitividad de la industria del maíz'. In: Boletín informativo Nueva Época, número 2, p. 128, 2008. FIRA, Apoyos FIRA para impulsar la Ganadería Nacional. Powerpoint presentation for the 4th National meeting of cattle farmers, CNOG, Nov. 8, 2007. FIRA, Informe de actividades. 2008. FIRA, 'Fideicomisos Instituidos en Relación con la Agricultura Government of the State of Sinaloa.' In: Sinaloa (ed.), 2010. FitchRatings, Unión de Crédito Industrial y Agropecuario de la Laguna (UCIALSA). Uniones de Crédito México, Análisis de Crédito, Noviembre 18, 2009. FMEI, Fundación Miguel Estrada Iturbide Programa Especial Concurrente para el Desarrollo Rural Sustentable (PEC), 2009-2010. <http://www.fmei.org.mx> Gain, Food and Agricultural Import Regulations and Standards - Narrative. GAIN report MX9325, 2009. <www.tradejunction.apeda.com/ir_standards/Import_Regulation/Mexico.pdf>

92
Garcia Kaplan, M., G. Fabian, A. Suarez and R. Martinez-Quesada, Mexico. In: The International Lawyer, summer vol. 43, no. 2, pp. 1139-1142, 2009. Gallegos, Dr. Pedro Brajcich, director General INIFAP, Investigación, Transferencia de Tecnología y, Capacitación en el INIFAP, Forum Mercado de Servicios Profesionales, FIRA, México, D.F. 27-29 enero, 2010. Gobierno de los Estados Unidos Mexicanos, Presidencia de la República, Plan Nacional de Desarrollo, 2007-2012. Poder Ejecutivo Federal, 2007. ISBN 978-970-734-184-5. Hernández Laos, E,. La industria láctea de México en el contexto del Tratado de Libre Comercio de America del Norte (TLCAN). Banco Interamericano de Desarrollo (BID). Del Valle Rivera MdC, 2000. IFCN, International Farm Comparison Network. Dairy Report 2008, 2008. IFCN, International Farm Comparison Network. Dairy Report 2009, 2009. INIFAP, INIFAP 2004-2009: Evolución, Logros y Retos. Instituto Nacional de Investigaciones Forestales, Agrícolas y Pecuarias, México, D.F., Octubre de 2009, Publicación Especial Núm. 3, 2009. ISBN 978-607-425-201-9. Iruegas, L.F. and M. Mich, Red leche en México. Análisis de la circunstancia actual, Lácteos y Cárnicos. Simposioum 2007. FIRA, Fidecomisos Instituidos en Relación con la Agricultura, Chihuahua, 2007. Klok, F., De dierlijke sector in Mexico. LNV-Landbouwraad Mexico, Mexico-City, 2007. La Daga, Personal Communication by Martín Gerardo-Gallardo, owner of La Daga dairy farm, 2010. Lechera Guadalajara, Personal communication by Hector Morales Reyes, Quality Manager of Lecherea Guadalajara S.A. de C.V., 2010.

93
Mariscal Aguayo, V., H. Estrella Quintero, A. Ruiz Flores, M. Sagarnaga Villegas, J.M. Salas González and M. González Alcorta, La cadena productiva de bovinos lecheros y el TLCAN. Universidad Autónoma Chapingo, Guadalajara, 2004. Nava, M.L.G., O.V. Espinosa, B.G. García. P.A. Alonso, G.R. Meléndez and H.L.A. García, Utilidad económica de la comercialización de la leche cruda en el sistema de producción familiar, Memorias del XXIX Congreso Nacional de Buiatria. Puebla, 2005. Nestlé, Personal communications by M.V.Z. Hector Enrique Loera, Gerente Unidad Agropecuario, 2010. Nicholson, C.F., Mexico's dairy sector in the 1990s: a descriptive analysis. Cornell University New York, 1995. OECD, Glossary of statistical terms. 2002. OECD, Introduction to the OECD producer support estimate and related indica-tors of agricultural support. OECD, Paris, 2010. <http://www.oecd.org/dataoecd/57/5/43411396.pdf> Palacios Muñóz, V.H., 'La industria cárnica y láctea en México. Problemas del desarrollo.' In: Revista Latinoamericana de Economía 33(130), 2002. Porter, M.E., The Competitive Advantage of Nations. Basingstoke [et cetera.], Macmillan, 1990. Posta El Cuatro, Personal communications El Cuatro Dairy farm, 2010. Prolea, Personal communications by Ing. Ramiro Ramirez Gonzalez from Prolea, 2010. PROLECHE, Panorama de la ganadería lechera en el mundo, en México y en Tabasco. Villa Hermosa, 2007. Reproducción Animal, Personal Communications by Dr. Remigio Esponosa from Reproducción Animal, S.A. de C.V., 2010.

94
Rabobank, Personal communications by Kenneth Shwedel from Rabobank Inter-national, Mexico, Representative Office, 2010. San Juan, Z. and D.R. Williams. Mexico Dairy and Products Annual. USDA Foreign Agricultural Service, 2009. Schwab, K., The Global Competitiveness Report 2009-2010. World Economic Forum, Geneva, 2009. SAGARPA, Secretaría de Agricultura, Ganadería, Desarrollo Rural, Pesca y Alimentación Sagarpa Programa Sectorial de Desarrollo Agropecuario y Pesquero 2-007-2012, ISBN 978-968-800-730-3, 2007. SAGARPA, Secretaría de Agricultura, Ganadería, Desarrollo Rural, Pesca y Alimentación: Lineamientos Operativos Fondo de Estabilización para la Comercialización de la Leche. Document downloaded from www.Sagarpa.gob.mx/ganadería, August 2010, 2008 SAGARPA, Secretaría de Agricultura, Ganadería, Desarrollo Rural, Pesca y Alimentación Sagarpa 'Programas Institucionales Para La Ganaderia 2010', Programa nacional Pecuario 2007-2012, powerpoint elaborated for the nacional Cattle Convention, June 2010. SIAP, Production, price and value of dairy cattle per state. http://www.siap.gob.mx/index.php?option=com_wrapper&view=wrapper&Itemid=371). 2008 SIAP, Boletín de Leche. Servicio de información agroalimentaria y pesquera. 2009. SIEM, Sistema de Información Empresarial Mexicano. 2010. Union, Personal communications by Mario Valencia Zarazúa, Director Técnico de Unión Ganadera Regional de Jalisco. 2010. US Commercial, The Agricultural Equipment and Machinery Market in Mexico. Summary. 11.17.2005. USDA, Gain Report 10/2/2009. Mexico: Dairy and Products Annual, 2009.
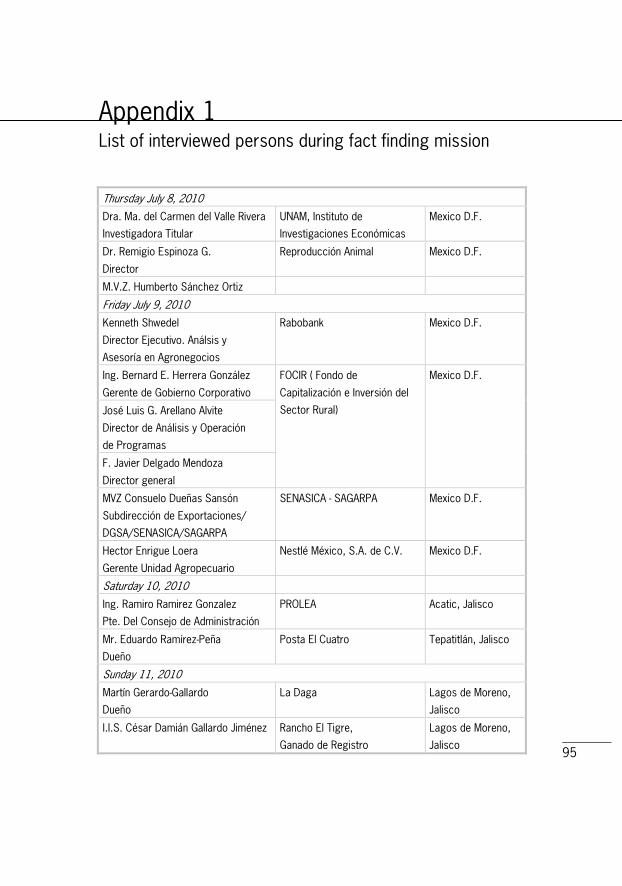
95
Appendix 1 List of interviewed persons during fact finding mission
Thursday July 8, 2010
Dra. Ma. del Carmen del Valle Rivera
Investigadora Titular
UNAM, Instituto de
Investigaciones Económicas
Mexico D.F.
Dr. Remigio Espinoza G.
Director
Reproducción Animal Mexico D.F.
M.V.Z. Humberto Sánchez Ortiz
Friday July 9, 2010
Kenneth Shwedel
Director Ejecutivo. Análsis y
Asesoría en Agronegocios
Rabobank Mexico D.F.
Ing. Bernard E. Herrera González
Gerente de Gobierno Corporativo
José Luis G. Arellano Alvite
Director de Análisis y Operación
de Programas
F. Javier Delgado Mendoza
Director general
FOCIR ( Fondo de
Capitalización e Inversión del
Sector Rural)
Mexico D.F.
MVZ Consuelo Dueñas Sansón
Subdirección de Exportaciones/
DGSA/SENASICA/SAGARPA
SENASICA - SAGARPA Mexico D.F.
Hector Enrigue Loera
Gerente Unidad Agropecuario
Nestlé México, S.A. de C.V. Mexico D.F.
Saturday 10, 2010
Ing. Ramiro Ramirez Gonzalez
Pte. Del Consejo de Administración
PROLEA Acatic, Jalisco
Mr. Eduardo Ramírez-Peña
Dueño
Posta El Cuatro Tepatitlán, Jalisco
Sunday 11, 2010
Martín Gerardo-Gallardo
Dueño
La Daga Lagos de Moreno,
Jalisco
I.I.S. César Damián Gallardo Jiménez Rancho El Tigre,
Ganado de Registro
Lagos de Moreno,
Jalisco

96
Juan Pablo Anaya-Zermeño
CEO
Lácteos Deshidratados
Mexicanos (LdeM)
Lagos de Moreno,
Jalisco
Rosa María Casillas-Buenrostro,
Lab Director
Cofocalec Lagos de Moreno,
Jalisco
Lic. Rodrigo Anaya Zermeño
Director
Centro de Valor Agregado
(CVA)
Lagos de Moreno,
Jalisco
Monday 12, 2010
Q.F.B. Álvaro Cerón Martínez
Jefe de control de calidad
Lechera de Guadalajara
S.A. de C.V.
Guadalajara
Ing. Hector Morales Reyes
Jefe de Aseguramiento de Calidad
Mario Valencia Zarazúa
Director Técnico
Unión Ganadera Regional
de Jalisco (CNOG)
Tlaquepaque,
Jalisco
MVZ Otilio Valdes Correa
Secretario
Blanca Rosa Reyes Cofocalec Guadalajara
Tuesday 13, 2010
Dr. Sergio Soltero Gardea
Director General
Cofocalec Guadalajara
MVZ Antonio Contreras Jiménez
Subdirector de desarrollo
Wednesday 14, 2010
Dr. Félix Martínez Cabrera
Presidente
CANILEC (Cámara Nacional de
Industriales de la Leche
Mexico D.F.
MVZ. José Manuel Villela Dadda
Coordinador General, Subdirección
de Maquila y Compra de Leche
Nacional
Liconsa Mexico D.F.

97
Appendix 2 Administrative regions, capital, population and area

98
Name of Subdivision Capital Population Area in km²
1 Aguascalientes Aguascalientes 1,032,680 5,500.8
2 Baja California Mexicali 1,806,829 73,051.1
3 Baja California Sur La Paz 475,586 72,710.5
4 Campeche Campeche 743,869 50,329.3
5 Chihuahua Chihuahua 3,316,178 248,115.3
6 Chiapas Tuxtla Gutiérrez 4,250,246 73,717.9
7 Coahuila Saltillo 2,415,862 150,745.5
8 Colima Colima 597,970 5,714.3
9 Distrito Federal Mexico 8,657,050 1,353.6
10 Durango Durango 1,460,178 120,706.3
11 Guerrero Chilpancingo 3,237,579 64,707.5
12 Guanajuato Guanajuato 4,908,056 30,516.8
13 Hidalgo Pachuca 2,356,133 21,327.1
14 Jalisco Guadalajara 6,653,364 79,856.5
15 Mexico Toluca de Lerdo 10,662,420 21,667.9
16 Michoacan Morelia 4,090,997 59,648.5
17 Morelos Cuernavaca 1,680,239 5,039.1
18 Nayarit Tepic 941,442 27,391.9
19 Nuevo Leon Monterrey 4,123,418 65,230.0
20 Oaxaca Oaxaca 3,625,487 92,845.7
21 Puebla Puebla 5,522,918 34,356.9
22 Queretaro Queretaro 1,568,610 12,047.4
23 Quintana Roo Chetumal 1,090,281 51,321.1
24 Sinaloa Culiacán 2,641,696 57,876.7
25 San Luis Potosi San Luis Potosí 2,391,929 64,186.5
26 Sonora Hermosillo 2,351,427 180,806.2
27 Tabasco Villahermosa 2,041,286 24,345.7
28 Tamaulipas Ciudad Victoria 2,976,339 79,409.6
29 Tlaxcala Tlaxcala 1,044,369 3,976.0
30 Veracruz Veracruz 7,058,898 71,393.9
31 Yucatan Mérida 1,761,761 37,975.5
32 Zacatecas Zacatecas 1,363,577 75,068.1
Source: http://www.geonames.org/MX/administrative-division-mexico.html

99
Appendix 3 Sagarpa programmes in 2010
Production system MXNm
Beef and dual-purpose cattle 5,302
Milk cattle 1,481
Sheep 474
Pork 922
Bees 276
Goats 217
Other 60
Poultry 770
Non production system specific 1,561
11,024
Support to MXNm
Natural resources and productivity 4,433
Productive investments 2,559
Health and food safety 1,770
Support to organization 44
Support to organisation costs 1,300
Promotion 106
Risk administration 812
11,024
Source: Sagarpa (2010).

100
Appendix 4 Output and input based Producer Support Estimates (PSE)
Production
(at farm gate)
Total
support
Support based
on outputs
Payments based
on input use
PSE
Quantity
Valu
e
Mark
et
pri
ce
Paym
ents
on o
utp
ut
Vari
able
inputs
Fix
ed
capital
On@f
arm
serv
ices
Year
1,000
tonnes
MXNm MXNm MXNm MXNm MXNm MXNm MXNm %
1986 6,571 690 544 544 0 0 0 0 79
1987 6,393 1,451 1,075 1,075 0 0 0 0 74
1988 6,350 2,587 1,536 1,536 0 0 0 0 59
1989 5,750 3,458 817 817 0 0 0 0 24
1990 6,332 3,980 320 320 0 0 0 0 8
1991 6,925 5,555 1,797 1,797 0 0 0 0 32
1992 7,182 6,200 1,998 1,998 0 0 0 0 32
1993 7,634 6,875 2,912 2,912 0 0 0 0 42
1994 7,547 6,881 2,782 2,782 0 0 0 0 40
1995 7,628 8,804 -1,317 -1,317 0 0 0 0 -15
1996 7,822 14,111 852 739 0 0 0 112 6
1997 8,091 16,324 3,690 3,576 0 0 0 114 22
1998 8,573 19,237 7,166 7,056 0 0 0 109 37
1999 9,171 23,305 8,924 8,785 0 0 0 139 38
2000 9,600 25,327 9,334 9,209 0 0 0 125 37
2001 9,766 26,475 6,080 5,947 0 0 0 133 23
2002 9,958 26,246 11,135 10,963 0 0 0 172 42
2003 10,088 26,780 6,834 6,834 0 0 0 0 26
2004 10,170 28,153 2,066 2,066 0 0 0 0 7
2005 10,174 30,779 895 895 0 0 0 0 3
2006 10,401 33,595 3,651 3,651 0 0 0 0 11
2007 10,667 39,242 -6 -6 0 0 0 0 0
2008 10,918 48,712 200 0 200 0 0 0 0
2009 11,092 47,766 8,569 8,369 200 0 0 0 18
Source: Based on OECD Database 1986-2009 Producer and Consumer Support Estimates.

101
Appendix 5 National milk production, number of cows and yield per cow
Milk production in million tonnes
199
8
199
9
200
0
200
1
200
2
200
3
200
4
200
5
200
6
200
7
200
8
annual gro
wth
03
@08
World 475 483 490 497 511 518 527 543 559 571 578 2.2%
USA 71 74 76 75 77 77 78 80 82 84 86 2.2%
Brazil 19 20 20 21 22 23 24 25 26 27 28 3.9%
New Zealand 11 11 12 13 14 14 15 15 15 16 15 1.2%
Netherlands 11 11 11 11 11 11 11 11 11 11 11 0.4%
Mexico 8 9 9 9 10 10 10 10 10 10 11 1.9%
Argentina 10 11 10 10 9 8 8 10 10 11 11 5.1%
Australia 9 10 11 11 11 10 10 10 10 10 9 -2.2%
Belgium 0 0 4 4 3 3 3 3 3 3 3 -3.8%
Chile 2 2 2 2 2 2 2 2 2 2 3 3.7%
Uruguay 1 1 1 2 1 2 1 2 2 2 2 0.9%
Source: FAOstat.

102
Million dairy cows
19
98
19
99
20
00
20
01
20
02
20
03
20
04
20
05
20
06
20
07
20
08
annual gro
wth
03
@08
World 219.2 220.6 221.5 224.6 227.3 232.7 235.5 240.1 242.5 244.9 246.9 1.2%
USA 9.2 9.2 9.2 9.1 9.1 9.1 9.0 9.0 9.1 9.1 9.2 0.3%
Brazil 17.3 17.4 17.9 18.2 19.0 19.3 20.0 20.6 20.9 21.1 21.2 1.9%
New
Zealand
3.5 3.4 3.3 3.6 3.7 3.9 4.1 4.1 4.1 4.2 4.3 2.1%
Netherlands 1.6 1.6 1.5 1.5 1.6 1.5 1.6 1.4 1.4 1.4 1.5 -1.1%
Mexico 1.8 1.9 2.1 2.1 2.2 2.2 2.2 2.1 2.1 2.1 2.2 -0.2%
Argentina 2.5 2.5 2.5 2.5 2.2 2.0 2.0 2.1 2.2 2.2 2.2 1.9%
Australia 2.1 2.2 2.2 2.2 2.1 2.0 2.0 1.9 1.9 1.8 1.7 -3.4%
Belgium 0.0 0.0 0.6 0.6 0.6 0.6 0.5 0.5 0.5 0.5 0.5 -2.2%
Chile 1.5 1.5 1.5 1.5 1.4 1.5 1.6 1.6 1.7 1.7 1.7 3.5%
Uruguay 0.9 0.8 0.8 0.9 0.9 0.9 0.9 1.0 0.9 1.0 1.0 1.6%
Source: FAOstat.
Yield kg milk/cow
19
98
19
99
20
00
20
01
20
02
20
03
20
04
20
05
20
06
20
07
20
08
annual gro
wth
03
@08
World 462 456 452 452 445 449 447 442 434 429 427 -1.0%
USA 7,798 8,061 8,254 8,228 8,439 8,508 8,605 8,877 9,050 9,219 9,343 1.9%
Brazil 1,115 1,130 1,140 1,162 1,174 1,192 1,209 1,231 1,250 1,276 1,309 1.9%
New
Zealand
3,282 3,241 3,666 3,689 3,701 3,653 3,663 3,553 3,667 3,748 3,500 -0.9%
Netherlands 6,825 7,037 7,417 7,096 6,884 7,164 7,029 7,569 7,739 7,829 7,698 1.5%
Mexico 4,585 4,763 4,488 4,426 4,425 4,510 4,415 4,798 4,844 4,905 5,000 2.1%
Argentina 3,937 4,260 4,131 3,987 4,090 4,099 4,050 4,719 4,770 4,773 4,773 3.1%
Australia 4,582 4,723 4,996 4,847 5,309 5,038 4,944 5,215 5,366 5,336 5,337 1.2%
Belgium 0 0 5,990 5,909 5,760 6,078 5,639 5,781 5,592 5,758 5,610 -1.6%
Chile 1,359 1,399 1,372 1,495 1,499 1,469 1,452 1,451 1,450 1,420 1,478 0.1%
Uruguay 1,707 1,761 1,755 1,713 1,684 1,714 1,660 1,704 1,723 1,659 1,659 -0.7%
Source: FAOstat.

103
Appendix 6 Regional distribution of milk production and price per litre
Region Production
(1,000 litre)
Price
(MXN per litre)
Production value
(1,000 MXN)
Aguascalientes 369,872 4.22 1,559,007
Baja California 193,422 4.72 912,506
Baja California Sur 46,636 7.34 342,481
Campeche 34,984 5.38 188,168
Coahuila 1,364,585 4.45 6,076,276
Colima 36,525 6.71 245,121
Chiapas 372,249 3.58 1,332,905
Chihuahua 901,830 4.59 4,138,681
Distrito federal 12,322 7.68 94,609
Durango 1,037,452 4.49 4,659,088
Guanajuato 684,202 3.91 2,673,266
Guerrero 82,045 4.72 387,404
Hidalgo 452,977 4.39 1,987,368
Jalisco 1,861,333 4.15 7,714,352
Mexico 464,624 4.38 2,036,234
Michoacan 334,850 4.36 1,460,683
Morelos 18,809 4.72 88,841
Nayarit 62,019 3.68 228,180
Nuevo Leon 39,696 3.92 155,644
Oaxaca 145,213 5.87 851,993
Puebla 385,066 4.78 1,840,807
Queretaro 195,791 4.21 824,209
Quintana Roo 5,601 3.68 20,603
San Luis Potosi 141,778 4.45 630,268
Sinaloa 108,075 4.15 448,833
Sonora 131,937 4.86 640,743
Source: SIAP, 2008

104
Region Production
(1,000 litre)
Price
(MXN per litre)
Production value
(1,000 MXN)
Tabasco 110,694 3.4 375,810
Tamaulipas 30,209 3.92 118,457
Tlaxcala 110,924 4.43 491,765
Veracruz 683,203 3.74 2,551,558
Yucatan 5,608 5.08 28,487
Zacatecas 164,950 4.07 670,832
National 10,589,481 4.32 45,775,180
Source: SIAP, 2008
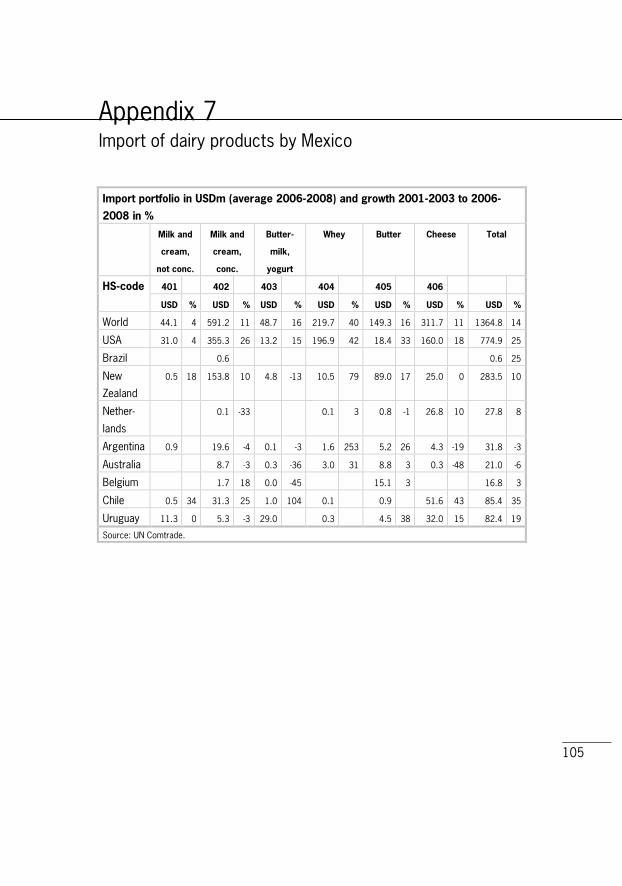
105
Appendix 7 Import of dairy products by Mexico
Import portfolio in USDm (average 2006@2008) and growth 2001@2003 to 2006@
2008 in %
Milk and
cream,
not conc.
Milk and
cream,
conc.
Butter@
milk,
yogurt
Whey Butter Cheese Total
HS@code 401 402 403 404 405 406
USD % USD % USD % USD % USD % USD % USD %
World 44.1 4 591.2 11 48.7 16 219.7 40 149.3 16 311.7 11 1364.8 14
USA 31.0 4 355.3 26 13.2 15 196.9 42 18.4 33 160.0 18 774.9 25
Brazil 0.6 0.6 25
New
Zealand
0.5 18 153.8 10 4.8 -13 10.5 79 89.0 17 25.0 0 283.5 10
Nether-
lands
0.1 -33 0.1 3 0.8 -1 26.8 10 27.8 8
Argentina 0.9 19.6 -4 0.1 -3 1.6 253 5.2 26 4.3 -19 31.8 -3
Australia 8.7 -3 0.3 -36 3.0 31 8.8 3 0.3 -48 21.0 -6
Belgium 1.7 18 0.0 -45 15.1 3 16.8 3
Chile 0.5 34 31.3 25 1.0 104 0.1 0.9 51.6 43 85.4 35
Uruguay 11.3 0 5.3 -3 29.0 0.3 4.5 38 32.0 15 82.4 19
Source: UN Comtrade.

106
Import in USDm and growth based on average 2001@2003 to average 2006@2008 in
%
Product Milk and
cream, not
concentrated
Milk and
cream, con@
centrated
Buttermilk,
yogurt
Whey Butter, milk
fats, dairy
spreads
Cheese
and curd
HS
code
401 402 403 404 405 406
1998 14.3 256.9 18.0 43.9 52.6 82.7
1999 12.3 233.3 16.6 36.6 65.2 98.7
2000 22.0 301.7 21.1 38.6 58.2 128.8
2001 27.4 441.0 25.6 45.9 66.1 181.9
2002 37.5 278.3 21.8 39.8 69.6 179.3
2003 46.6 325.6 20.9 38.0 81.1 189.7
2004 50.5 385.9 18.2 53.1 144.9 223.6
2005 47.1 506.7 26.3 101.6 181.6 256.8
2006 27.5 393.9 21.4 179.2 111.0 257.3
2007 63.0 683.5 57.8 327.4 157.7 344.7
2008 41.9 696.1 67.0 152.4 179.2 333.3
Growth 4% 11% 16% 40% 16% 11%
Source: UN Comtrade.

107
Appendix 8 Dairy trade of selected countries
Dairy trade in 2008 and annual growth 2003@2008
Import Export Country
USDm growth % USDm growth %
World 56,329 15.3 64,601 14.9
USA 1,680 7.2 2,994 38.1
Brazil 212 13.6 509 60.0
New Zealand 75 29.7 6,563 19.0
Netherlands 3,189 10.2 6,908 10.0
Argentina 20 9.6 812 24.6
Mexico 1,470 17.5 91 14.2
Australia 538 24.2 2,208 10.8
Belgium 3,520 15.2 3,451 11.5
Chile 84 4.9 221 34.5
Uruguay 8 40.7 430 26.0
Source: UN Comtrade.

108
Appendix 9 Personnel and production value in the dairy milk industry a)
Pers
onnel
invo
lved
Hours
@men
work
ed
Tota
l pay@
ment
Pro
duction
valu
e
Sale
s va
lue
Charg
ed f
or
maquila b
)
Use
of
in@
stalled c
a@
pacity
Year
number
persons
1,000
hrs
MXNm MXNm MXNm MXNm %
1998 29,222 72,291 1,876 34,707 33,734 32
1999 30,403 75,356 2,206 42,321 40,857 74
2000 32,417 80,717 2,716 48,529 47,912 65 71
2001 33,218 82,944 3,027 51,155 51,037 71 70
2002 33,733 84,018 3,405 54,851 53,811 78 65
2003 34,743 86,754 3,722 59,860 59,401 171 62
2004 35,413 90,134 3,934 69,461 67,759 56 62
2005 36,498 93,613 4,170 73,465 73,338 78 67
2006 37,010 95,397 4,410 78,818 79,390 143 78
2007 36,389 93,589 4,579 87,108 86,741 265 84
2008 36,822 94,817 4,858 90,496 89,924 111 81
a) In the table are taken into account: condensed, evaporated and powder milk, cream, butter and cheese.
Not included ice-cream, caramel and other dairy derivatives; b) Imported inputs processed in a factory in Mexico
for costs-tariff reasons and generally re-exported.
Source: SIAP (2009).

109
Appendix 10 List of companies related to the Mexican dairy sector

110
Not
e: F
or a
ll te
leph
one
com
mun
icat
ions
, pl
ease
dia
l +52
bef
ore
each
num
ber.
Nam
e
Str
eet
Pla
ce
Tele
phone
UR
L
Pro
ducts
/
Activi
ties
Dairy
pro
duce
rs
ALIA
NZA
DE
PRO
DU
CTO
RES
RURA
LES
DE
LEC
HE
DE
LA
PIED
AD, S
.A. D
E C
.V.
Cal
z. e
l Cui
tzillo
No.
509
59
360
La P
ieda
d, M
ich.
(3
52) 5
22-6
6-34
Fres
h m
ilk
ALIM
ENTO
S J.
GAR
CIA
,
S.A.
DE
C.V
.
25 d
e M
ayo
No.
137
66
149
Sta.
Cat
arin
a, N
.L.
(81)
833
6-17
47
Po
wde
red
milk
CAM
PO A
LEG
RE A
LIM
ENTO
S C
arr.
Sah
uayo
La
Barc
a
Km. 6
5900
0 Sa
huay
o, M
ich.
(3
53) 5
72-0
5-57
Dai
ry
CO
MER
CIA
L AL
IMES
A,
S.A.
DE
C.V
.
Frat
erni
dad
No.
411
91
710
Vera
cruz
, Ver
. (2
29) 9
38-1
2-37
w
ww
.alim
esa.
com
.mx
Fres
h m
ilk
CO
RPO
RATI
VO S
MP
C
arre
tera
a M
orel
ia
No.
358
3
4564
5 Tl
ajom
ulco
de
Zuñi
ga J
alis
co (
(33)
120
1-22
36
ww
w.c
orpo
rativ
osm
p
.com
/
Dai
ry
CRE
MER
IA A
GU
ASC
ALIE
NTE
S Km
. 545
Car
r.
Pana
mer
ican
a
2090
9 Je
sús
Mar
ía, A
gs.
(449
) 910
-92-
70
ww
w.c
rem
eria
agua
s
calie
ntes
.com
.mx
Fres
h m
ilk
CRE
MER
IA D
EL Y
AQU
I,
S.A.
DE
C.V
.
Cal
le d
e la
Pla
ta N
o. 3
72
8329
9 H
erm
osill
o, S
on.
(662
) 251
-07-
54
Fr
esh
milk
DIS
TRIB
UID
ORA
DE
LAC
TEO
S
ALG
IL, S
.A. D
E C
.V.
Inst
ituto
Téc
nico
Indu
stria
l
No.
172
1134
0 M
éxic
o, D
.F.
(55)
508
9-28
00
ww
w.e
smer
alda
.
com
.mx
Fres
h m
ilk
(dis
trib
utor
)
DM
LAT
TEE,
S.A
. DE
C.V
. Tu
xpan
No.
15
54
500
Atiz
apán
(5
5) 5
397-
5359
Fres
h m
ilk fo
r in
-
dust
rial u
se

111
Nam
e
Str
eet
Pla
ce
Tele
phone
UR
L
Pro
ducts
/
Activi
ties
EMBO
TELL
ADO
RA L
A
VIC
TORI
A, S
.A. D
E C
.V.
Av. C
onst
ituye
ntes
No.
40
Ote
.
7604
0 Q
ueré
taro
, Qro
(4
42) 2
11-4
0-44
Fres
h m
ilk
GAN
ADER
OS
PRO
DU
CTO
RES
DE
LEC
HE
PURA
, S.A
. DE
C.V
.
Km. 3
7.4
Auto
pist
a
Méx
ico-
Que
réta
ro
5473
0 C
uaut
itlán
Izca
lli,
(55)
589
9-20
00
ww
w.a
lpur
a.co
m
Fres
h m
ilk,
dairy
pro
duct
s
GRA
NJA
PLA
NTA
LA
PERL
A,
S.A.
Av. M
agno
lia N
o. 1
979
Ote
.
6455
0 M
onte
rrey
, N.L
. (8
1) 8
375-
0561
Fres
h m
ilk
GRU
PO L
A JO
LLA
El
ectr
icis
tas
No.
590
23
060
La P
az, B
.C.S
. (6
12) 1
21-1
1-85
Fres
h m
ilk
GRU
PO R
EAL
DE
GAN
ADER
OS,
S.A.
DE
C.V
.
Eje
Orie
nte-
Poni
ente
Man
z. 5
Lte
. 5
4380
0 Ti
zayu
ca, H
go.
(779
) 796
-01-
17
Fr
esh
milk
IND
UST
RIAL
IZAD
ORA
DE
LEC
HE
DEL
ICIA
S, S
.A.
Av. P
luta
rco
Elía
s C
alle
s
No.
700
3300
0 C
d. D
elic
ias,
Chi
h.
(639
) 472
-50-
51
ww
w.a
lpur
a.co
m.m
x D
airy
LA C
REM
A, S
.A. D
E C
.V.
Día
z M
irón
No.
921
Ote
. 89
000
Tam
pico
, Tam
ps.
(833
) 214
-07-
83
Fr
esh
milk
LAC
TE D
U M
ON
DE,
S.A.
DE
C.V
.
Poch
teca
s N
o. 6
1
0904
0 M
éxic
o, D
.F.
(55)
569
4-68
87
ww
w.la
cted
umon
de.
com
Dai
ry p
rodu
cts
LAC
TEO
S D
E G
UAY
MAS
,
S.A.
DE
C.V
.
Cal
z. A
gust
ín G
. Lóp
ez y
Atún
S/N
8542
7 G
uaym
as, S
on.
(622
) 222
-03-
70
Fr
esh
milk
LAC
TEO
S IN
DUS
TRIA
LIZA
DO
S,
S.A.
DE
C.V
.
Alfo
nso
Bern
al S
ahag
ún
No.
102
2029
0 Ag
uasc
alie
ntes
,
Ags
(449
) 971
-02-
35
Fr
esh
milk
LAG
RAN
GE,
S.A
. DE
C.V
. C
alle
jón
de S
anto
Dom
ingo
No.
100
0
6649
9 Sa
n N
icol
as d
e
los
Gar
za, N
.L.
(81)
835
3-22
00
ww
w.la
gran
ge.
com
.mx
Fres
h m
ilk

112
Nam
e
Str
eet
Pla
ce
Tele
phone
UR
L
Pro
ducts
/
Activi
ties
LALA
MEX
ICO
, S.A
. DE
C.V
. Av
. Cey
lán
No.
101
6 02
300
Méx
ico,
D.F
. (5
5) 5
729-
3200
w
ww
.lala
.com
.mx
Fres
h m
ilk
LEC
HE
DIE
CIN
UEV
E H
NO
S.,
S.A.
DE
C.V
.
Km. 5
Car
r. T
otot
lán-
Atot
onilc
o
4773
0 To
tótla
n, J
al.
(391
) 916
-07-
97
ww
w.1
9hno
s.
com
.mx
Fres
h m
ilk
LEC
HE
LA E
SCO
ND
IDA
C
arr.
J. G
ómez
Por
tuga
l
Km. 1
2090
0 Ag
uasc
alie
ntes
,
Ags
(449
) 973
-07-
90
ww
w.a
groi
ndus
tria
liz
ador
a.co
m
Fres
h m
ilk
LEC
HE
LA P
ERLA
Av
. de
los
Com
etas
No.
23
Her
mos
illo, S
on.
(662
) 251
-01-
04
ww
w.la
perla
.com
.mx
Fres
h m
ilk
LEC
HE
SAN
MAR
CO
S
Jose
fa O
. de
Dom
íngu
ez
No.
84
7690
0 Q
ueré
taro
, Qro
. (4
42) 2
25-0
7-37
w
ww
.gils
a.co
m
Fres
h m
ilk
LEC
HER
A G
UAD
ALAJ
ARA,
S.A.
DE
C.V
.
Río
Alam
o N
o. 2
381
S.R.
44
890
Gua
dala
jara
, Jal
. (3
3) 3
657-
9297
w
ww
.sel
loro
jo.
com
.mx
Fres
h m
ilk
LIC
ON
SA, S
.A. D
E C
.V.
Av. R
icar
do T
orre
s N
. 1
5339
0 N
auca
lpan
, (5
5) 5
237-
9100
w
ww
.lico
nsa.
gob.
mx
Fres
h m
ilk
MEG
ALAC
, S.A
. DE
C.V
. Av
. Hue
huet
oca
No.
3
5471
4 C
uaut
itlán
Izca
lli
(55)
536
5-89
94
Po
wde
red
milk
NES
TLE
MEX
ICO
, S.A
. DE
C.V
. Av
. Ejé
rcito
Nac
iona
l
No.
453
1152
0 M
éxic
o, D
.F.
(55)
526
2-50
00
ww
w.n
estle
.com
.mx
Dai
ry p
rodu
cts,
NU
EVA
IND
UST
RIA
DE
GAN
ADER
OS
DE
CU
LIAC
AN,
S.A.
DE
C.V
.
Dr.
Mor
a N
o. 1
230
80
060
Cul
iacá
n, S
in.
(667
) 760
-60-
47
ww
w.s
anta
mon
ica.
com
.mx
Fres
h m
ilk
ORG
ANIS
MO
AG
ROIN
DUS
TRIA
L L
ópez
Mat
eos
No.
34
54
713
Cua
utitl
án Iz
calli
, (5
5) 5
872-
1643
w
ww
.org
anis
moa
groi
ndus
tria
l.com
.mx
Fres
h m
ilk,
chee
se, d
airy

113
Nam
e
Str
eet
Pla
ce
Tele
phone
UR
L
Pro
ducts
/
Activi
ties
PAST
EURI
ZAD
ORA
DE
LOS
PRO
DUC
TORE
S D
E LE
CH
E,
S.A.
DE
C.V
.
Rica
rdo
Flor
es M
agón
No.
420
1
3103
0 C
hihu
ahua
, Chi
h.
(614
) 418
-645
1 w
ww
.lech
ezar
agoz
a.
com
Fres
h m
ilk
PAST
EURI
ZAD
ORA
FRO
NTE
RIZA
, S.A
. DE
C.V
.
Texc
oco
No.
415
88
631
Cd.
Rey
nosa
,
Tam
ps.
(899
) 923
-304
8 w
ww
.paf
rosa
.
com
.mx
Fres
h m
ilk
PAST
EURI
ZAD
ORA
HIL
L C
REST
DE
TAM
PIC
O, S
.A.
Av. E
jérc
ito M
exic
ano
No.
302
8912
0 Ta
mpi
co, T
amps
. (8
33) 2
13-2
3-90
Fres
h m
ilk
PAST
EURI
ZAD
ORA
JER
SEY
DEL
NO
ROES
TE, S
.A.
Cal
le 1
ra. A
rtíc
ulo
123
No.
686
1
2200
0 Ti
juan
a, B
.C.
(664
) 687
-17-
01
ww
w.je
rsey
.com
.mx
Fres
h m
ilk,
chee
se, c
ream
,
yogh
urt
PAST
EURI
ZAD
ORA
MAU
LEC
,
S.A.
DE
C.V
.
13 S
ur N
o. 3
108
72
410
Pueb
la, P
ue.
(222
) 237
-25-
81
ww
w.ta
mar
iz.c
om.
mx/
/mau
lec/
Fres
h m
ilk
PRO
DUC
TORE
S D
E LE
CH
E
DE
PARR
AL, S
.A.
Car
r. E
smer
alda
Km
. 1
3382
0 Pa
rral
, Chi
h.
(627
) 522
-50-
00
ww
w.le
chez
arag
oza.
com
Fres
h m
ilk
PRO
DUC
TOS
ARAC
ELI
Car
r. Q
ueré
taro
-La
Grie
ga
Km. 1
S/N
7624
0 El
Mar
quez
, Qro
. (4
42) 2
21-5
3-33
w
ww
.foqu
e.co
m.m
x Fr
esh
milk
PRO
TEIN
A AN
IMAL
S.A.
DE
C.V
.
Gus
tavo
baz
Pra
da
No.
333
3
5403
0 Tl
alne
pant
la
01-8
00-8
32-2
7-45
w
ww
.pro
an.c
om.m
x
Fres
h m
ilk
REAL
DE
TIZA
YUC
A,
S.A.
DE
C.V
.
Eje
Orie
nte
Poni
ente
Mz.
5 L
t. 5
4380
0 Ti
zayu
ca, H
go.
(779
) 796
-01-
17
Fr
esh
milk

114
Nam
e
Str
eet
Pla
ce
Tele
phone
UR
L
Pro
ducts
/
Activi
ties
ULT
RALA
CTE
OS,
S.A
. DE
C.V
. Av
. Ado
lfo R
uiz
Cor
tines
No.
222
1
8610
0 Vi
llahe
rmos
a, T
ab.
(993
) 310
-02-
50
ww
w.u
ltral
acte
os.
com
.mx
Fres
h m
ilk,
yogh
urt,
butte
r,
chee
se
UN
IFO
OD
S, S
.A. D
E C
.V.
Poni
ente
122
No.
459
02
300
Méx
ico,
D.F
. (5
5) 5
333-
1200
w
ww
.uni
food
s.
com
.mx
Fres
h m
ilk
UN
ION
DE
GAN
ADER
OS
LEC
HER
OS
DE
CD
. JU
AREZ
,
S.A.
DE
C.V
.
Ram
ón R
ayón
No.
135
1
3255
3 C
d. J
uáre
z, C
hih.
(6
56) 8
92-5
0-00
w
ww
.fuen
tesa
groi
ndu
stria
l.com
Fres
h m
ilk
UN
ION
DE
PAST
EURI
ZAD
ORE
S
DE
JUAR
EZ, S
.A.
Cal
le 1
4 N
o. 2
650
44
940
Gua
dala
jara
, Jal
. (3
3) 3
812-
0290
Fres
h m
ilk,
yogh
urt
UN
ION
DE
PRO
DU
CTO
RES
DE
LEC
HE
DE
QU
ERET
ARO
,
S.A.
DE
C.V
.
Av. 5
de
Febr
ero
No.
273
Km. 5
.5
7613
0 Q
ueré
taro
, Qro
. (4
42) 2
17-0
2-28
GAN
ADER
OS
PRO
DU
CTO
RES
DE
LEC
HE
PURA
, S.A
. DE
C.V
.
Kilo
met
ro 3
7.4
Auto
pist
a
Méx
ico
- Que
réta
ro
Cua
titlá
n Iz
calli
547
30
52 5
5 58
99 2
000
ww
w.a
lpur
a.co
m.m
x M
anuf
actu
ring
and
dist
ribut
ion
of
dairy
GRU
PO IN
DUS
TRIA
L LA
LA,
S.A.
DE
C.V
.
Láza
ro C
árde
nas
No.
185
G
ómez
Pal
acio
350
70
52 8
71 7
29 3
123
ww
w.la
la.c
om.m
x
LALA
DER
IVAD
OS
LAC
TEO
S,
S.A.
DE
C.V
.
Adol
fo A
ymes
No.
99
Torr
eón
3509
0 52
871
750
652
9
M
anuf
actu
ring
and
dist
ribut
ion
of
dairy
pro
duct
s

115
Nam
e
Str
eet
Pla
ce
Tele
phone
UR
L
Pro
ducts
/
Activi
ties
TEC
NIC
A M
EXIC
ANA
DE
ALIM
ENTA
CIO
N, S
.A. D
E C
.V.
Av. A
dolfo
Lóp
ez M
ateo
s
No.
81
5476
9 M
exic
o C
ity
52 5
5 50
00 3
400
ww
w.c
afem
ex.
com
.mx
GER
BER
ALIM
ENTA
,
S.A.
DE
C.V
.
Av. M
éxic
o 20
1 06
100
Mex
ico
City
52
55
5212
169
1
ww
w.g
erbe
rcal
.com
Tr
adin
g of
(can
ned)
dai
ry
prod
ucts
PRO
VEED
OR
INTE
RNAC
ION
AL
DE
QU
IMIC
OS,
S.A
. DE
C.V
.
Filib
erto
Góm
ez
No.
100
A
5403
0 M
exic
o C
ity
52 5
5 53
90 9
099
ww
w.p
rove
inte
rqui
m.
com
.mx
Man
ufac
turin
g an
d
dist
ribut
ion
of
food
add
itive
s an
d
dairy
pre
para
tions
NES
TLE
MEX
ICO
, S.A
. DE
C.V
. Ej
érci
to N
acio
nal N
o. 4
53
1152
0 M
exic
o C
ity
52 5
5 52
62 5
000
ww
w.n
estle
.com
.mx
Man
ufac
turin
g
and
dist
ribut
ion
of
food
pro
duct
s
UN
ILEV
ER D
E M
EXIC
O,
S. D
E R.
L. D
E C
.V.
Pase
o de
Tam
arin
dos
#150
Mex
ico
City
52
(55)
110
5-44
86
ww
w.u
nile
ver.
com
.mx
Prod
uctio
n of
hous
ehol
d an
d
food
pro
duct
s
NU
TRIC
AL, S
.A. D
E C
.V.
Av. P
alm
as N
o. 2
15
Des
p. 4
01Lo
mas
de
Cha
pulte
pec
Méx
ico
1100
0 52
55
5284
612
0 w
ww
.nut
rical
.com
.mx
Man
ufac
turin
g,
trad
ing,
impo
rts
and
expo
rts
of
raw
mat
eria
ls fo
r
the
dairy
and
food
indu
stry

116
Nam
e
Str
eet
Pla
ce
Tele
phone
UR
L
Pro
ducts
/
Activi
ties
DAN
ON
E D
E M
EXIC
O,
S.A.
DE
C.V
.
Gui
llerm
o G
onzá
lez
Cam
aren
a N
o. 3
33
Méx
ico
0121
0 52
55
5258
720
0
ww
w.d
anon
e.co
m.m
x M
anuf
actu
ring
and
trad
ing
of
fres
h da
iry p
rod-
ucts
HO
OG
WEG
T M
EXIC
O,
S.A.
DE
C.V
.
Av. T
ecno
lógi
co
No.
100
-705
Que
réta
ro 7
6000
+
52 4
42 2
15
9312
ww
w.h
oogw
egt.c
om
Who
lesa
le tr
adin
g
of d
airy
pro
duct
s
ALIM
ENTO
S J.
GAR
CIA
,
S.A.
DE
C.V
.
25 d
e M
ayo
No.
213
-D
Sant
a C
atar
ina
6614
9 +
52 8
1 83
36
1747
M
anuf
actu
ring
and
trad
ing
of m
ilk
pow
der
ECO
VAL
DAI
RY T
RAD
E,
S.A.
DE
C.V
.
Hom
ero
No.
180
4
Int.
1003
Méx
ico
1151
0 +
52 5
5 55
57
8020
ww
w.o
aktr
adin
g
grou
p.co
m
Dai
ry tr
ade
DAN
ISC
O M
EXIC
ANA,
S.A.
DE
C.V
.
Poni
ente
No.
627
M
éxic
o 02
300
+52
55
5078
4400
ww
w.d
anis
co.c
om
Trad
e of
food
ad-
ditiv
es a
nd in
gre-
dien
ts.
GRU
PO IN
DUS
TRIA
L
CU
ADRI
TOS
BIO
TEK,
S.A.
DE
C.V
.
Ranc
ho S
an J
orge
de
la
Con
cepc
ión
Km. 9
Cel
aya
3810
4 +
52 4
61 6
18 3
00
ww
w.c
uadr
itos.
com
.mx
Man
ufac
turin
g of
dairy
pro
duct
s
ESTA
BLO
NAC
ION
AL,
S.A.
DE
C.V
.
Av. P
anam
eric
ana
Poni
ente
No.
4
San
Juan
del
Río
768
00
+52
427
272
7766
ww
w.p
rodu
ct
ossa
njua
n.co
m.m
x
Man
ufac
turin
g an
d
trad
ing
of d
airy
prod
ucts
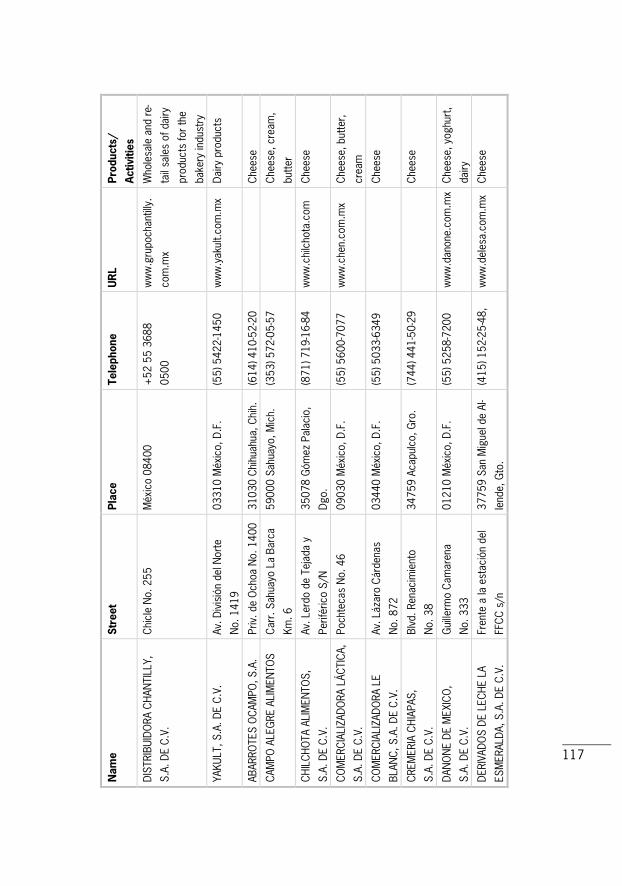
117
Nam
e
Str
eet
Pla
ce
Tele
phone
UR
L
Pro
ducts
/
Activi
ties
DIS
TRIB
UID
ORA
CH
ANTI
LLY,
S.A.
DE
C.V
.
Chi
cle
No.
255
M
éxic
o 08
400
+52
55
3688
0500
ww
w.g
rupo
chan
tilly
.
com
.mx
Who
lesa
le a
nd r
e-
tail
sale
s of
dai
ry
prod
ucts
for
the
bake
ry in
dust
ry
YAKU
LT, S
.A. D
E C
.V.
Av. D
ivis
ión
del N
orte
No.
141
9
0331
0 M
éxic
o, D
.F.
(55)
542
2-14
50
ww
w.y
akul
t.com
.mx
Dai
ry p
rodu
cts
ABAR
ROTE
S O
CAM
PO, S
.A.
Priv
. de
Och
oa N
o. 1
400
31
030
Chi
huah
ua, C
hih.
(6
14) 4
10-5
2-20
Che
ese
CAM
PO A
LEG
RE A
LIM
ENTO
S
Car
r. S
ahua
yo L
a Ba
rca
Km. 6
5900
0 Sa
huay
o, M
ich.
(3
53) 5
72-0
5-57
Che
ese,
cre
am,
butte
r
CH
ILC
HO
TA A
LIM
ENTO
S,
S.A.
DE
C.V
.
Av. L
erdo
de
Teja
da y
Perif
éric
o S/
N
3507
8 G
ómez
Pal
acio
,
Dgo
.
(871
) 719
-16-
84
ww
w.c
hilc
hota
.com
C
hees
e
CO
MER
CIA
LIZA
DO
RA L
ÁCTI
CA,
S.A.
DE
C.V
.
Poch
teca
s N
o. 4
6
0903
0 M
éxic
o, D
.F.
(55)
560
0-70
77
ww
w.c
hen.
com
.mx
Che
ese,
but
ter,
crea
m
CO
MER
CIA
LIZA
DO
RA L
E
BLAN
C, S
.A. D
E C
.V.
Av. L
ázar
o C
árde
nas
No.
872
0344
0 M
éxic
o, D
.F.
(55)
503
3-63
49
C
hees
e
CRE
MER
IA C
HIA
PAS,
S.A.
DE
C.V
.
Blvd
. Ren
acim
ient
o
No.
38
3475
9 Ac
apul
co, G
ro.
(744
) 441
-50-
29
C
hees
e
DAN
ON
E D
E M
EXIC
O,
S.A.
DE
C.V
.
Gui
llerm
o C
amar
ena
No.
333
0121
0 M
éxic
o, D
.F.
(55)
525
8-72
00
ww
w.d
anon
e.co
m.m
x C
hees
e, y
oghu
rt,
dairy
DER
IVAD
OS
DE
LEC
HE
LA
ESM
ERAL
DA,
S.A
. DE
C.V
.
Fren
te a
la e
stac
ión
del
FFC
C s
/n
3775
9 Sa
n M
igue
l de
Al-
lend
e, G
to.
(415
) 152
-25-
48,
ww
w.d
eles
a.co
m.m
x C
hees
e

118
Nam
e
Str
eet
Pla
ce
Tele
phone
UR
L
Pro
ducts
/
Activi
ties
DIL
ASA,
S.A
. To
lteca
s N
o. 3
32
5403
0 Tl
alne
pant
la,
Edo.
de
Méx
ico
(55)
539
0-08
78
C
hees
e
DIS
TRIB
UID
ORA
D L
ACTE
OS
Pu
ente
Coa
tzac
oalc
os
No.
72
5815
0 M
orel
ia, M
ich.
(4
43) 3
26-0
3-07
Che
ese
DIS
TRIB
UID
ORA
DE
LAC
TEO
S
ALG
IL, S
.A. D
E C
.V.
Inst
ituto
Téc
nico
Indu
stria
l
No.
172
1134
0 M
éxic
o, D
.F.
(55)
508
9-28
00
ww
w.e
smer
alda
.
com
.mx
Che
ese
ELAB
ORA
CIO
N D
E
PRO
DUC
TOS
LAC
TEO
S
31 p
onie
nte
No.
292
4-A
7240
0 Pu
ebla
, Pue
. (2
22) 2
49-4
7-79
Che
ese
ESTA
BLO
NAC
ION
AL
S.A.
DE
C.V
.
Pana
mer
ican
a Po
nien
te
No.
4
7680
0 Sa
n Ju
an d
el R
io,
Qro
.
(427
) 272
-00-
63
ww
w.p
rodu
ct
ossa
njua
n.co
m.m
x
Che
ese,
cre
am,
butte
r
FOO
D T
ECH
NO
LOG
IES
TRAD
ING
, S.A
. DE
C.V
.
Robl
e M
anz.
63
Lote
8
5292
4 At
izap
án d
e
Zara
goza
(55)
534
1-82
88
C
hees
e
GRU
PO IN
DUS
TRIA
L
CU
ADRI
TOS
BIO
TEK,
S.A.
DE
C.V
.
Km. 9
Car
r. C
el.-
S. M
igue
l Alle
nde
3810
4 C
elay
a, G
to.
(461
) 618
-83-
00
ww
w.g
rupo
cuad
ritos
.
com
.mx
Che
ese,
cre
am,
butte
r
IBER
TRAD
E
Texa
s N
o. 1
00
0381
0 M
éxic
o, D
.F.
(55)
554
3-99
33
ww
w.a
limen
tos
euro
peos
.com
Che
ese
IND
UST
RIAL
QU
ESER
A
SAN
EST
EBAN
Av. d
el P
arqu
e O
rient
e
No.
713
3300
0 C
d. D
elic
ias,
Chi
h.
(639
) 474
-04-
62
C
hees
e

119
Nam
e
Str
eet
Pla
ce
Tele
phone
UR
L
Pro
ducts
/
Activi
ties
IND
UST
RIAL
IZAD
ORA
DE
LAC
TEO
S SA
NTA
AN
ITA,
S.A.
DE
C.V
.
Av. P
atria
No.
134
7-22
45
054
Zapo
pan,
Jal
. (3
3) 3
628-
7394
Che
ese
IND
UST
RIAS
CO
R, S
.A. D
E C
.V.
Av. L
a C
añad
a N
o. 1
9
7624
6 Sa
ntia
go d
e
Que
réta
ro, Q
ro.
(442
) 221
-52-
52
ww
w.ly
ncot
t.com
.mx
Che
ese
ND
UST
RIAS
LAC
TEL,
S.A.
DE
C.V
.
Prol
onga
ción
Cua
uhté
moc
No.
262
7690
5 Vi
lla C
orre
gido
ra,
Qro
.
(442
) 225
-04-
77
ww
w.la
ctel
.com
.mx
C
hees
e, y
oghu
rt
KRAF
T FO
OD
S D
E M
EXIC
O,
S.A.
DE
C.V
.
Con
gres
o de
la U
nión
No.
584
0
0782
0 M
éxic
o, D
.F.
(55)
572
9-28
00
C
hees
e
LA R
ISU
EÑA,
S.A
. DE
C.V
. Be
cerr
a N
o. 2
0
1187
0 M
éxic
o, D
.F.
(55)
527
1-92
73
C
hees
e
LAC
TEO
S AB
UN
DIS
Av
. 8 P
onie
nte
No.
303
33
000
Cd.
Del
icia
s, C
hih.
(6
39) 4
72-2
5-58
Che
ese,
cre
am,
butte
r
LAC
TEO
S D
EL C
ON
CH
OS
Km
. 113
al N
orte
33
620
Sauc
illo,
Chi
h.
(621
) 475
-06-
12
C
hees
e
LAC
TEO
S G
OSA
, S.A
. DE
C.V
. H
ombr
es Il
ustr
es N
o. 5
55
4740
0 La
gos
de
Mor
eno,
Jal
.
(474
) 742
-09-
10
ww
w.la
cteo
sgos
a.
com
Che
ese,
cre
am
LAC
TEO
S Y
CAR
NES
FRI
AS
LOPE
Z, S
.A. D
E C
.V.
Aram
berr
i y G
uerr
ero
6400
0 M
onte
rrey
, N.L
. (8
1) 8
343-
5857
Che
ese
LAC
TIC
A, S
.A. D
E C
.V.
Poch
teca
s N
o. 4
6
0903
0 M
éxic
o, D
.F.
(55)
560
0-70
77
ww
w.c
hen.
com
.mx
C
hees
e
LAC
TIC
INO
S D
EL N
ORT
E,
S.A.
DE
C.V
.
Antig
ua C
arr.
a R
oma
Km. 8
.5
6660
0 Ap
odac
a, N
.L.
(81)
838
6-14
67
C
hees
e, m
ilk

120
Nam
e
Str
eet
Pla
ce
Tele
phone
UR
L
Pro
ducts
/
Activi
ties
LAC
TO P
ROD
UC
TOS
DE
ORI
ENTE
, S.A
. DE
C.V
.
Av. C
d. M
ilita
r N
o. 1
5
7238
0 Pu
ebla
, Pue
. (2
22) 2
35-4
9-01
Che
ese,
cre
am,
yogh
urt
LAG
RAN
GE,
S.A
. DE
C.V
. C
alle
jón
de S
anto
Dom
ingo
No.
100
0
6649
9 Sa
n N
icol
as d
e
los
Gar
za, N
.L.
(81)
835
3-23
00
ww
w.la
gran
ge.
com
.mx
Che
ese
NEW
ZEA
LAN
D M
ILK
MEX
ICO
,
S.A.
DE
C.V
.
Av. d
e la
Exp
orta
ción
No.
205
4569
0 El
Sal
to, J
al.
(33)
368
9-12
48
ww
w.s
igm
a.co
m
Che
ese
ORG
ANIZ
ACIO
N K
ESO
S Y
KOSA
S
Av. C
hapu
ltepe
c N
o. 8
00
Bod.
238
-239
6714
0 G
uada
lupe
, N.L
.
(81)
831
7-06
56
Che
ese
PAST
EURI
ZAD
ORA
LAG
UN
A,
S.A.
DE
C.V
.
Cal
z. C
uauh
tém
oc
No.
142
2 N
te.
2700
0 To
rreó
n, C
oah.
87
1) 7
13-1
3-12
Che
ese
PRO
CES
ADO
RA D
E LA
CTE
OS,
S.A.
Cay
etan
o An
drad
e
Mz.
38
Lt. 1
0951
0 M
éxic
o, D
.F.
(55)
573
2-88
30
C
hees
e
PRO
DUC
TOS
ALIM
ENTI
CIO
S
MEN
ON
ITAS
, S.A
. DE
C.V
.
Av. L
os A
ngel
es
No.
100
0 Bo
d. 3
08-A
6648
0 Sa
n N
icol
ás d
e
los
Gar
za, N
.L.
(81)
835
1-08
65
ww
w.m
enon
itas.
com
.mx
Che
ese,
yog
hurt
PRO
DUC
TOS
CAR
RAN
CO
,
S.A.
DE
C.V
.
Vale
ntín
Gam
a N
o. 5
10
7822
0 Sa
n Lu
is P
otos
í,
S.L.
P.
(444
) 813
-13-
32
ww
w.c
arra
nco.
com
.mx
Che
ese,
cre
am,
butte
r
PRO
DUC
TOS
LAC
TEO
S
DE
CAL
IDAD
Fres
no N
o. 1
76
0640
0 M
éxic
o, D
.F.
(55)
554
7-04
69
C
hees
e
BED
ACO
M
Torr
es L
anda
No.
204
, 38
010
Mex
ico
52 4
61 6
15 8
908
ww
w.b
edac
om.
com
.mx
Proc
essi
ng, p
ack-
agin
g an
d tr
adin
g
of d
airy
pro
duct
s

121
Nam
e
Str
eet
Pla
ce
Tele
phone
UR
L
Pro
ducts
/
Activi
ties
CRE
MER
IA S
AN J
OSE
C
entr
al d
e Ab
asto
s -
Bode
ga G
-79
0941
0 M
éxic
o, D
.F.
+52
55
5694
1463
Im
port
er a
nd d
is-
trib
utor
of c
hees
e
DIS
TRIB
UID
ORA
DE
LAC
TEO
S
ALG
IL
Inst
ituto
Téc
nico
Indu
stria
l
No.
172
1340
Mex
ico
+52
55
5089
2800
ww
w.e
smer
alda
.
com
.mx
Man
ufac
ture
and
trad
e of
dai
ry
prod
ucts
EURO
LAC
M
aqui
lado
res
No.
211
Le
ón 3
7490
+
52 4
77 7
63
6444
ww
w.e
urol
ac.
com
.mx
Man
ufac
turin
g an
d
trad
e of
dai
ry
prod
ucts
IND
UST
RIAS
CO
R Av
. La
Cañ
ada
No.
19
El M
arqu
és 7
6264
Que
réta
ro
+52
442
221
5252
ww
w.ly
ncot
t.com
.mx
Prod
ucer
and
dis
-
trib
utor
of d
airy
prod
ucts
PRO
DUC
TOS
LAC
TEO
S
EL S
ABIN
O
Revo
luci
ón S
/N
Zona
Cen
tro
San
José
de
Gra
cia
5950
0
+52
381
537
0023
ww
w.e
lsab
ino.
com
.mx
Man
ufac
turin
g an
d
trad
e of
dai
ry
prod
ucts
RIEX
, S.A
. DE
C.V
. So
lidar
idad
200
8
Col
. Fra
ccio
nam
ient
o
Uni
dad
Nac
iona
l
6635
0 Sa
nta
Cat
arin
a,
Nue
vo L
eón
+52
81
83-3
6-
13-5
0
ww
w.r
iex.
com
.mx
Impo
rt a
nd d
istr
i-
butio
n of
che
eses
QU
ESO
S PA
DIL
LA
Tulip
anes
No.
10
Col
. Val
le d
e O
ro
San
Juan
del
Río
768
02
+52
427
266
0282
M
anuf
actu
re a
nd
trad
e of
dai
ry
prod
ucts

122
Nam
e
Str
eet
Pla
ce
Tele
phone
UR
L
Pro
ducts
/
Activi
ties
Dairy
org
aniz
atio
ns
ASO
CIA
CIÓ
N N
ACIO
NAL
DE
GAN
ADER
OS
LEC
HER
OS,
A.C
.
(AN
GLA
C)
MEL
CH
OR
OC
AMPO
# 40
5-20
1
1159
0 M
exic
o, D
.F.
(+52
-55)
52
55-
18 3
3
HO
LSTE
IN D
E M
EXIC
O, A
.C.
52 4
42 2
1202
69
ww
w.h
olst
ein.
com
.mx
CÁM
ARA
NAC
ION
AL D
E LA
IND
UST
RIA
DE
LA L
ECH
E
CAN
ILEC
Av. B
enja
mín
Fra
nklin
No.
134
1180
0 M
éxic
o, D
.F.
+52
55
5271
-210
0
CIG
AL
Fran
cisc
o Fa
goag
a
No.
10
C.P
. 760
00 Q
ueré
ta
+52
-442
-224
-168
4 w
ww
.cig
al.b
iz\
Con
sejo
par
a el
Fom
ento
de
la C
alid
ad d
e la
Lec
he y
sus
Der
ivad
os C
OFO
CAL
EC
Sim
ón B
olív
ar 4
46
4416
0 G
uada
laja
ra,
Jalis
co
+52
33
36 3
0
58 3
1
ww
w.c
ofoc
alec
.
org.
mx
Anim
al B
reed
ing
Mat
eria
l and
Vacc
ines
Repr
oduc
ción
Ani
mal
,
S.A.
DE
C.V
./H
olla
nd G
enet
ics
Vive
ros
de A
tizap
án 6
2
5408
0 Tl
alne
pant
la,
+52
-55
53-6
2-
14-0
0
ww
w.r
epro
ducc
iona
ni
mal
.com
.mx
and
ww
w.h
g.nl
Bovi
ne s
emen

123
Nam
e
Str
eet
Pla
ce
Tele
phone
UR
L
Pro
ducts
/
Activi
ties
Inte
rvet
Méx
ico,
S.A
. DE
C.V
. Av
. Pas
eo d
e lo
s
Frai
les
22
5260
0 Sa
ntia
go
Tian
quis
teng
o
+52
713
13
50 0
0 w
ww
.inte
rvet
.
com
.mx
Vacc
ines
, med
i-
cine
s, fe
ed e
n-
hanc
ers
Anim
al F
eed
DSM
Nut
ritio
nal P
rodu
cts
Km. 2
2.5
Car
rete
ra
Gua
dala
jara
4568
0 El
Sal
to, J
alis
co
+52
-33
36 6
8
60 1
9
ww
w.d
smnu
triti
onal
p
rodu
cts.
com
Anim
al n
utrit
ion
prod
ucts
Sem
illas
Papa
lotla
Slo
ten
-
Anim
al F
eed
and
Phar
mac
euti-
cal D
ivis
ions
(Nut
reco
)
Oriz
aba
195
06
700
Mex
ico
DF
+52
-55
52-6
4-
03-6
4
ww
w.g
rupo
papa
lotla
.
com
and
ww
w.s
lote
n.co
m
Milk
rep
lace
rs,
elec
trol
ite m
ixtu
re,
gluc
ose,
am
inoa
c-
ids
andV
itam
ins
Trou
w N
utrit
ion
(Nut
reco
) Lu
is E
nriq
ue W
illia
ms
792
45
150
Zapo
pan,
Jal
isco
+
52-3
3 36
-56-
64-0
0
ww
w.tr
ouw
nutr
ition
.
com
Anim
al n
utrit
ion
prod
ucts
(pre
-
mix
es) a
nd v
ita-
min
s
Prov
imi M
éxic
o Bo
sque
de
Dur
azno
s 63
11
700
Mex
ico,
D.F
. +
52 5
5 52
51
10 0
9
ww
w.p
rovi
mi.c
om
Anim
al n
utrit
ion
prod
ucts

124
Nam
e
Str
eet
Pla
ce
Tele
phone
UR
L
Pro
ducts
/
Activi
ties
Anim
al P
roce
ssin
g an
d M
achi
nery
Stor
k M
exic
o Am
ores
334
03
100
Mex
ico,
D.F
. +
52-5
5 56
-82-
29-0
8
ww
w.s
tork
.com
and
ww
w.fd
s.st
ork
grou
p.co
m
Food
pro
cess
ing
mac
hine
ry (d
airy
and
poul
try)
Van
Aars
en d
e M
exic
o C
alle
12
No.
191
97
137
Mér
ida,
Yuc
atán
+
52-9
99 9
26-
74-3
3
ww
w.a
arse
n.co
m
Equi
pmen
t for
the
prod
uctio
n of
ani
-
mal
feed

Wageningen UR (University & Research centre) is a leading international knowledge institute in the fields of nutrition and health, sustainable agricultural systems, environmental quality and processes of social change. Our path-breaking research and innovative education form a vital contribution to the quality of life.
More information: www.wur.nl
LEI report 2010-072Wageningen UR Livestock Research report 397