2008 Commissioners Indaba 19 – 21 st November 2008 Sun City, North West Province Pro-Poor Economic...
18
2008 Commissioners Indaba 19 – 21 st November 2008 Sun City, North West Province Pro-Poor Economic Growth and the Labour Market in South Africa: Exploring the Interactions Haroon Bhorat
-
Upload
emmeline-bishop -
Category
Documents
-
view
213 -
download
0
Transcript of 2008 Commissioners Indaba 19 – 21 st November 2008 Sun City, North West Province Pro-Poor Economic...
2008 Commissioners Indaba
19 – 21st November 2008Sun City, North West Province
Pro-Poor Economic Growth and the Labour Market in South
Africa: Exploring the InteractionsHaroon Bhorat
Introduction
Release of New Data, Enables a 10-year Overview
2008 COMMISSIONERS INDABA 19 - 21 November 2008 Sun City
Consistent Positive Economic Growth post-1994
BUT what has the Impact been on Poverty & Inequality
Evidence from 1995 – 2000: No Major Shifts in Poverty Levels, but Increase in Inequality
2008 COMMISSIONERS INDABA 19 - 21 November 2008 Sun City
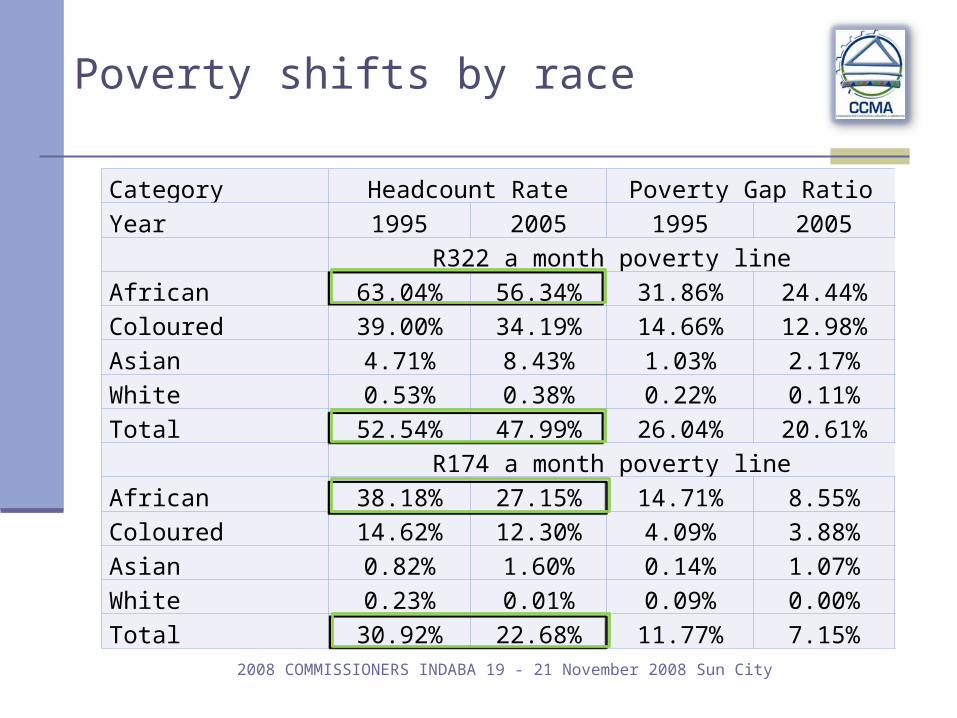
Category Headcount Rate Poverty Gap Ratio
Year 1995 2005 1995 2005
R322 a month poverty line
African 63.04% 56.34% 31.86% 24.44%
Coloured 39.00% 34.19% 14.66% 12.98%
Asian 4.71% 8.43% 1.03% 2.17%
White 0.53% 0.38% 0.22% 0.11%
Total 52.54% 47.99% 26.04% 20.61%
R174 a month poverty line
African 38.18% 27.15% 14.71% 8.55%
Coloured 14.62% 12.30% 4.09% 3.88%
Asian 0.82% 1.60% 0.14% 1.07%
White 0.23% 0.01% 0.09% 0.00%
Total 30.92% 22.68% 11.77% 7.15%
Poverty shifts by race
2008 COMMISSIONERS INDABA 19 - 21 November 2008 Sun City
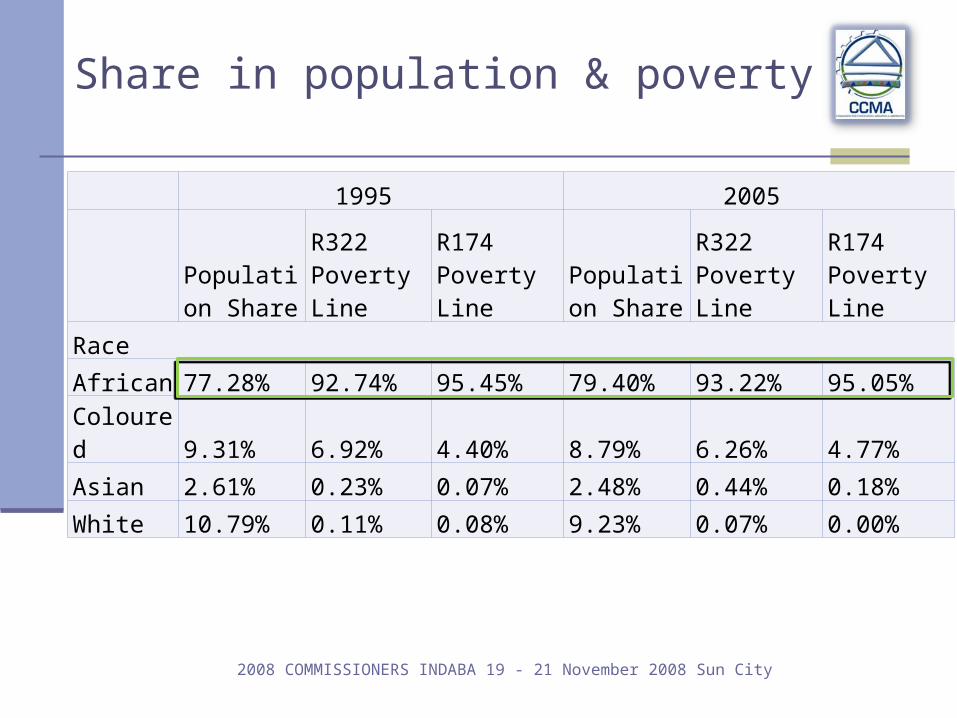
Share in population & poverty
1995 2005
Population Share
R322 Poverty Line
R174 Poverty Line
Population Share
R322 Poverty Line
R174 Poverty Line
Race
African 77.28% 92.74% 95.45% 79.40% 93.22% 95.05%
Coloured 9.31% 6.92% 4.40% 8.79% 6.26% 4.77%
Asian 2.61% 0.23% 0.07% 2.48% 0.44% 0.18%
White 10.79% 0.11% 0.08% 9.23% 0.07% 0.00%
2008 COMMISSIONERS INDABA 19 - 21 November 2008 Sun City
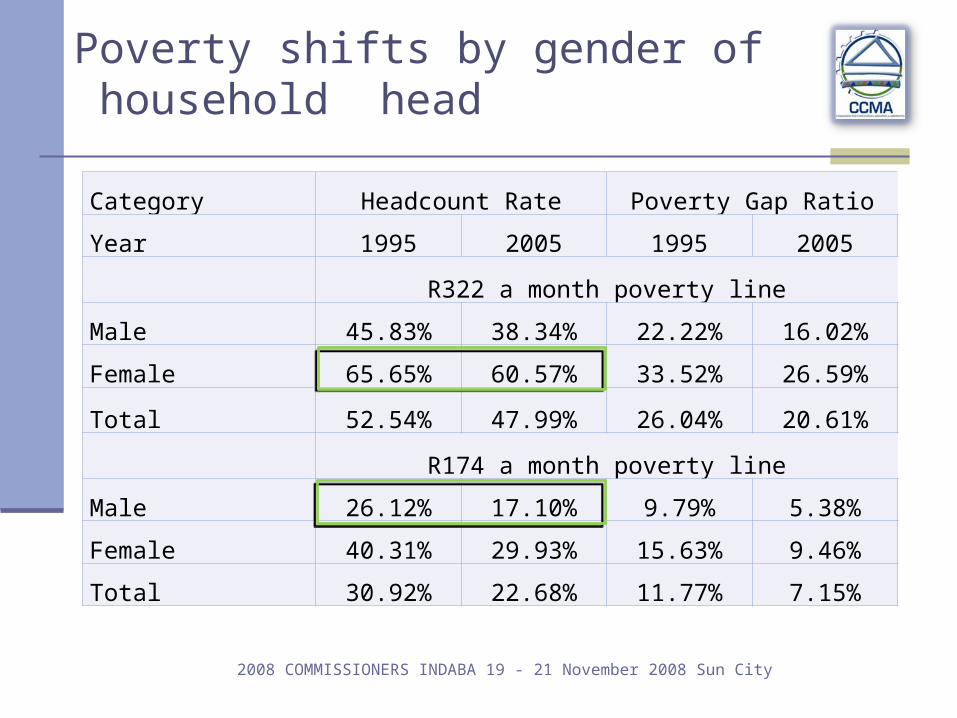
Poverty shifts by gender of household head
Category Headcount Rate Poverty Gap Ratio
Year 1995 2005 1995 2005
R322 a month poverty line
Male 45.83% 38.34% 22.22% 16.02%
Female 65.65% 60.57% 33.52% 26.59%
Total 52.54% 47.99% 26.04% 20.61%
R174 a month poverty line
Male 26.12% 17.10% 9.79% 5.38%
Female 40.31% 29.93% 15.63% 9.46%
Total 30.92% 22.68% 11.77% 7.15%
2008 COMMISSIONERS INDABA 19 - 21 November 2008 Sun City
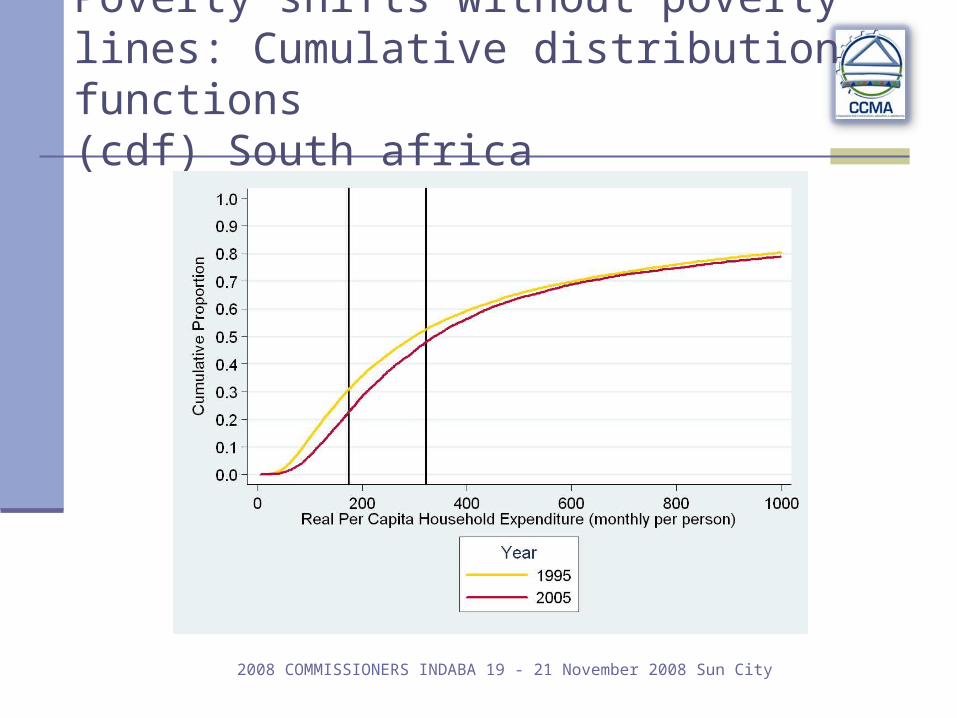
Poverty shifts without poverty lines: Cumulative distribution functions (cdf) South africa
2008 COMMISSIONERS INDABA 19 - 21 November 2008 Sun City
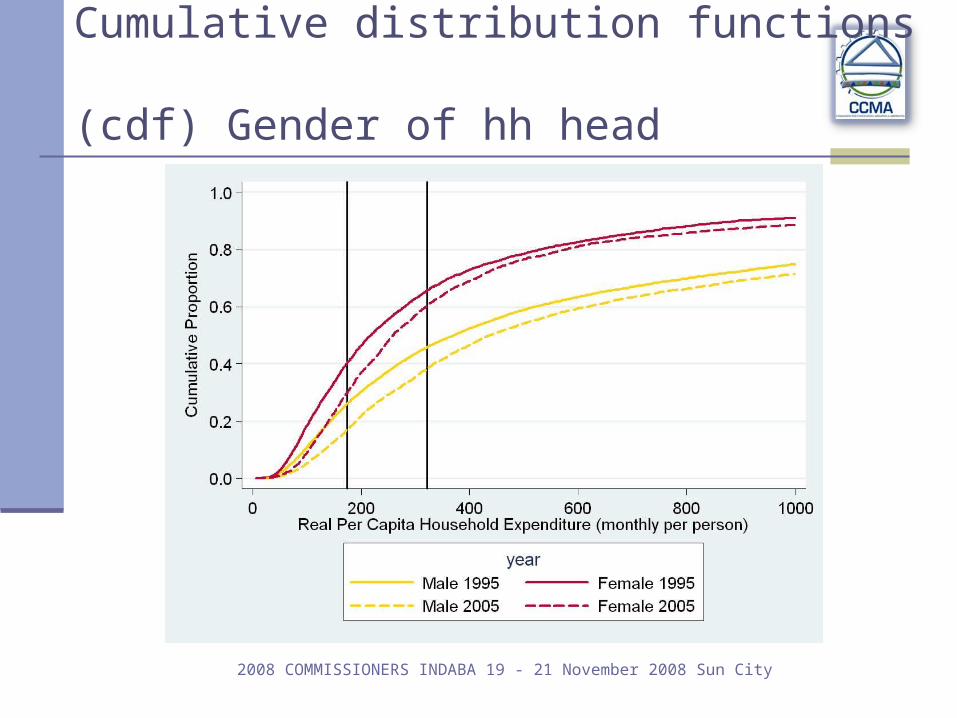
Cumulative distribution functions (cdf) Gender of hh head
2008 COMMISSIONERS INDABA 19 - 21 November 2008 Sun City
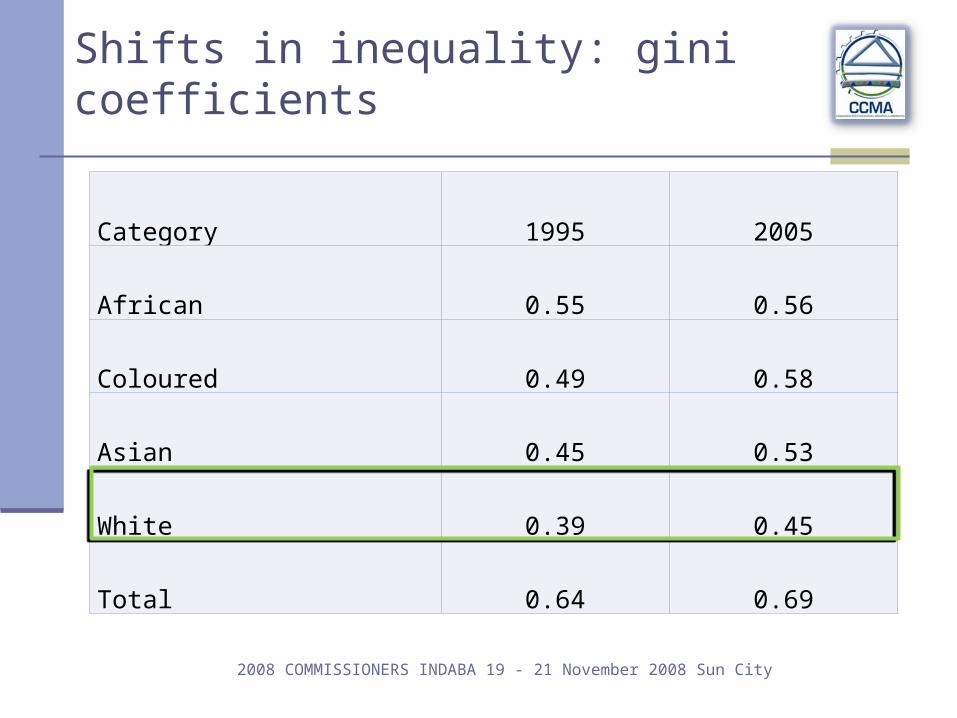
Shifts in inequality: gini coefficients
Category 1995 2005
African 0.55 0.56
Coloured 0.49 0.58
Asian 0.45 0.53
White 0.39 0.45
Total 0.64 0.69
2008 COMMISSIONERS INDABA 19 - 21 November 2008 Sun City
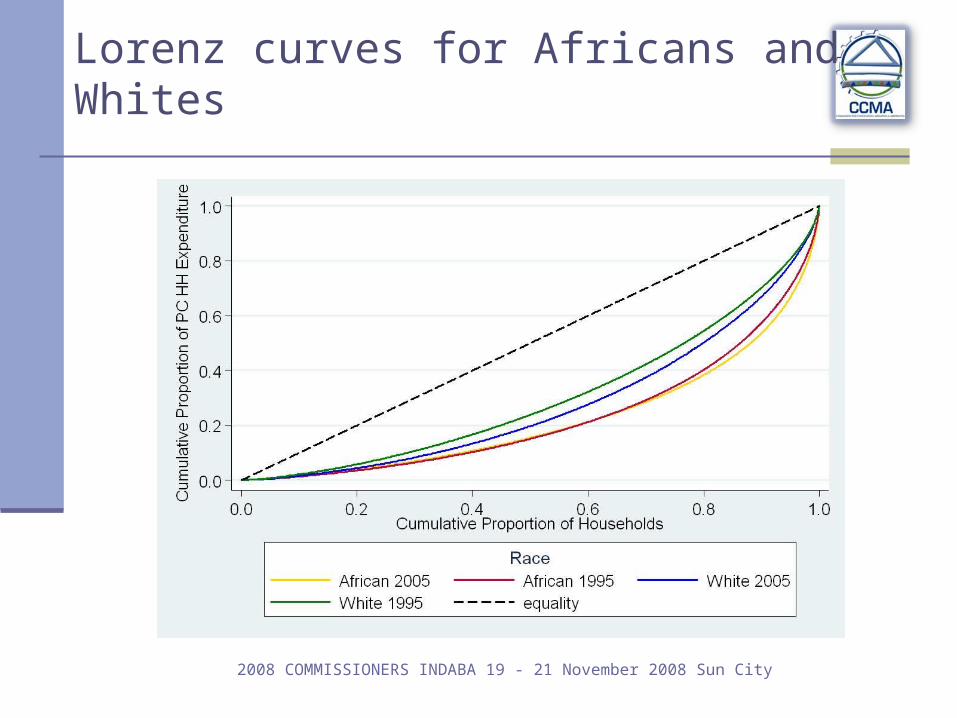
Lorenz curves for Africans and Whites
2008 COMMISSIONERS INDABA 19 - 21 November 2008 Sun City
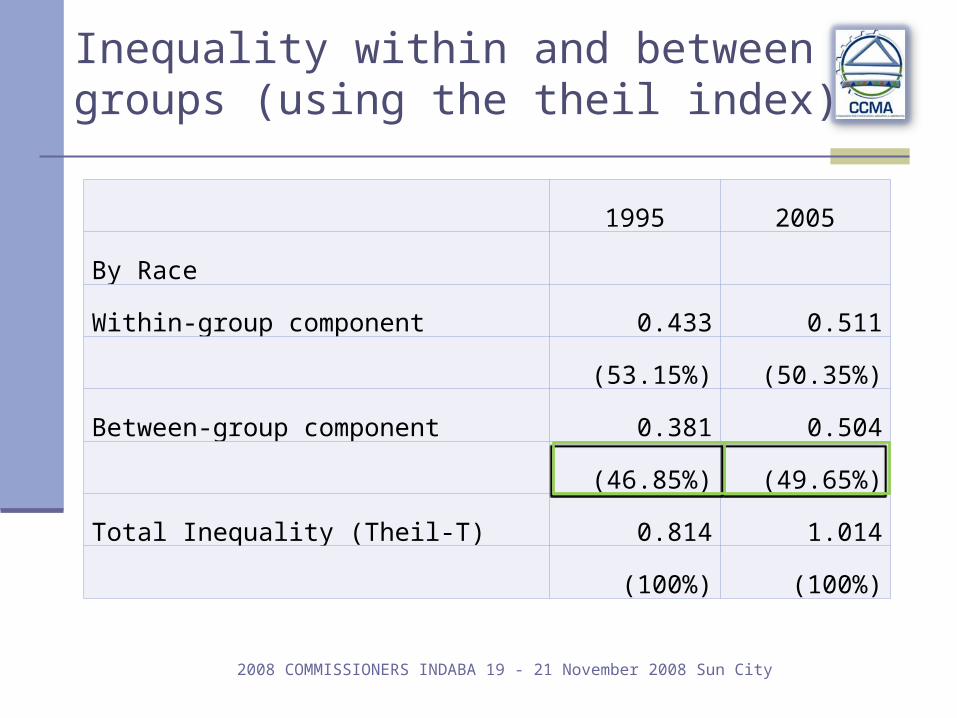
Inequality within and between groups (using the theil index)
1995 2005
By Race
Within-group component 0.433 0.511
(53.15%) (50.35%)
Between-group component 0.381 0.504
(46.85%) (49.65%)
Total Inequality (Theil-T) 0.814 1.014
(100%) (100%)
2008 COMMISSIONERS INDABA 19 - 21 November 2008 Sun City
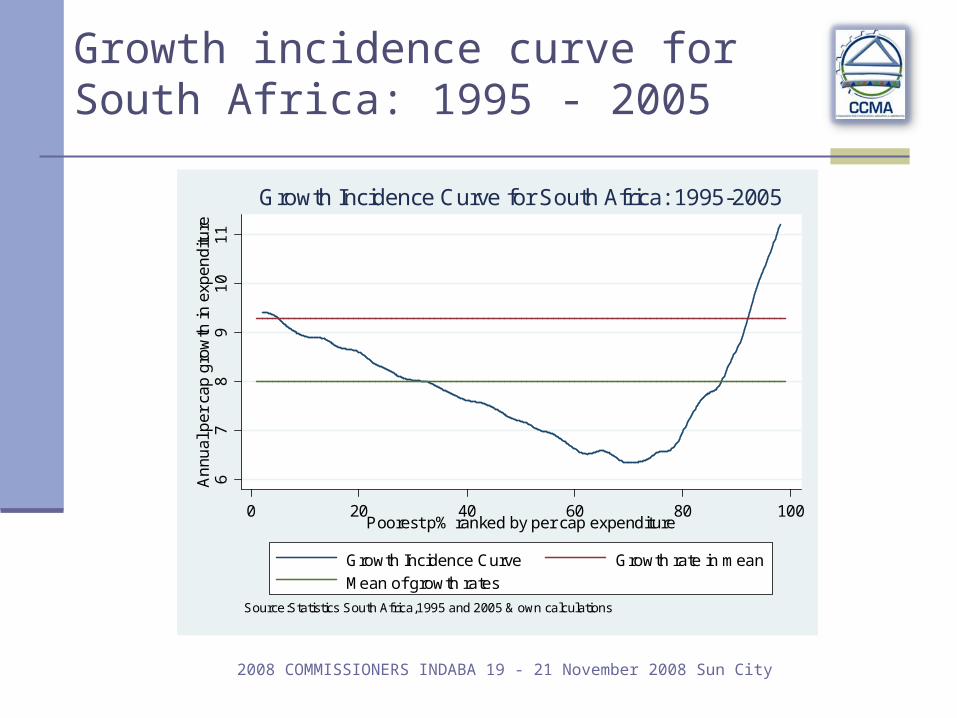
Growth incidence curve for South Africa: 1995 - 2005
67
89
10
11
An
nual
per
cap
gro
wth
in e
xpen
ditu
re
0 20 40 60 80 100Poorest p% ranked by per cap expenditure
Growth Incidence Curve Growth rate in mean
Mean of growth rates
Source:Statistics South Africa,1995 and 2005 & own calculations
Growth Incidence Curve for South Africa: 1995-2005
2008 COMMISSIONERS INDABA 19 - 21 November 2008 Sun City
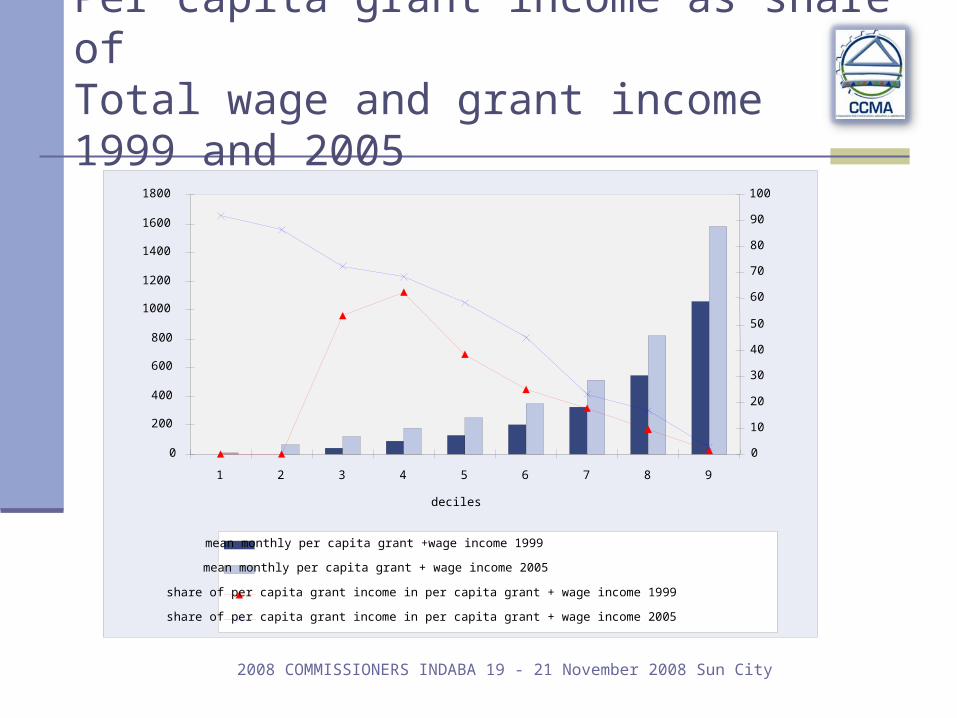
Per capita grant income as share of Total wage and grant income 1999 and 2005
0
200
400
600
800
1000
1200
1400
1600
1800
1 2 3 4 5 6 7 8 9
deciles
0
10
20
30
40
50
60
70
80
90
100
mean monthly per capita grant +wage income 1999
mean monthly per capita grant + wage income 2005
share of per capita grant income in per capita grant + wage income 1999
share of per capita grant income in per capita grant + wage income 2005
2008 COMMISSIONERS INDABA 19 - 21 November 2008 Sun City
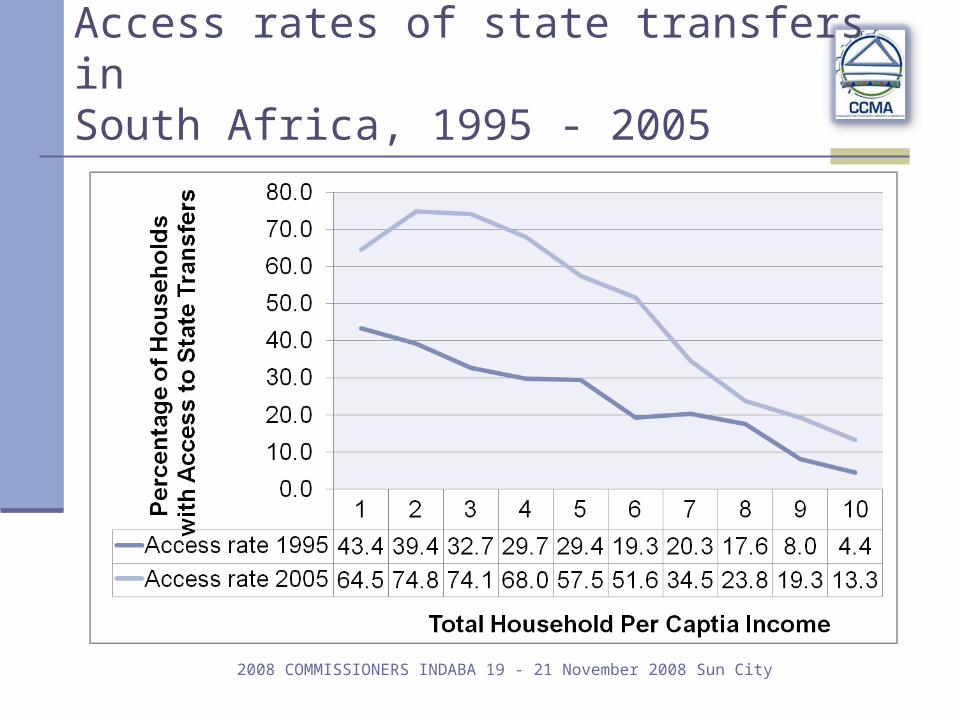
Access rates of state transfers inSouth Africa, 1995 - 2005
2008 COMMISSIONERS INDABA 19 - 21 November 2008 Sun City
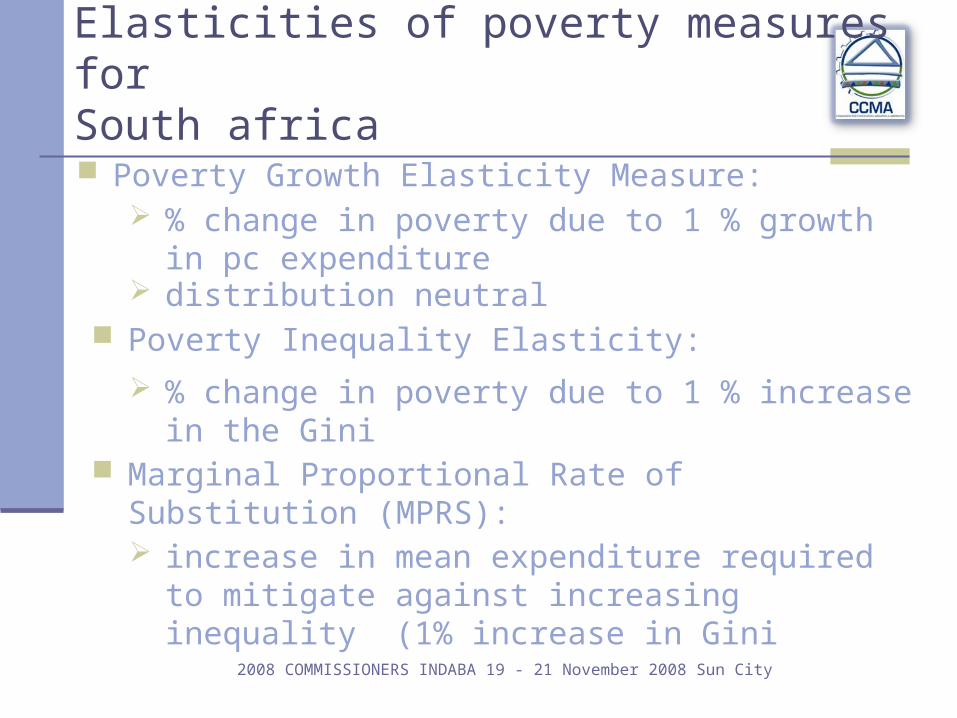
Elasticities of poverty measures for South africa
Poverty Growth Elasticity Measure:
Poverty Inequality Elasticity:
Marginal Proportional Rate of Substitution (MPRS):
% change in poverty due to 1 % growth in pc expenditure
distribution neutral
% change in poverty due to 1 % increase in the Gini
increase in mean expenditure required to mitigate against increasing inequality (1% increase in Gini
2008 COMMISSIONERS INDABA 19 - 21 November 2008 Sun City
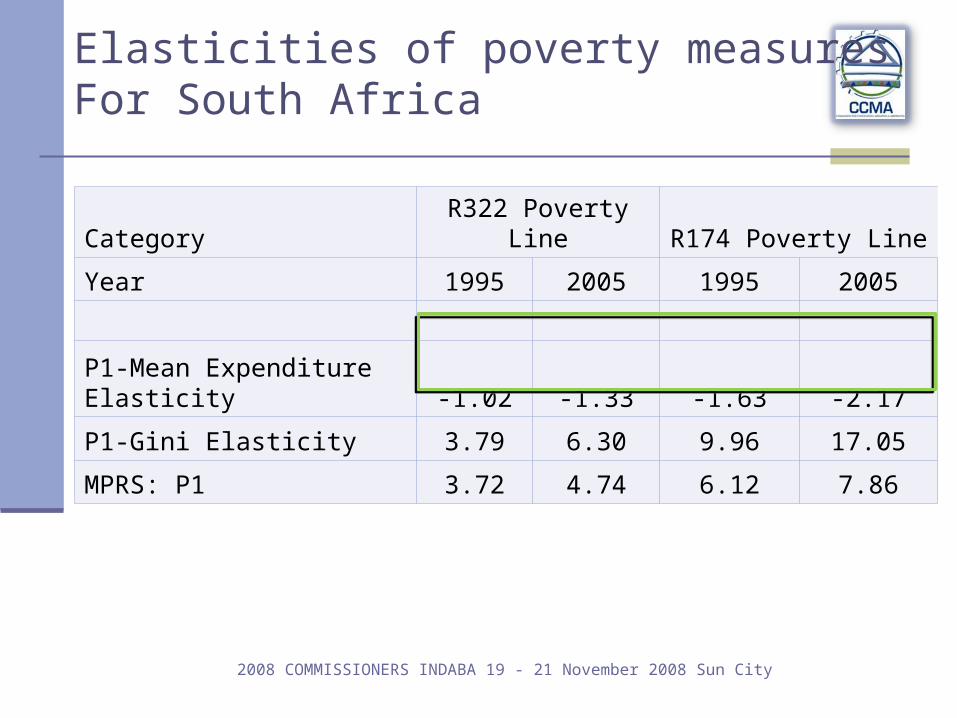
Elasticities of poverty measures For South Africa
Category R322 Poverty Line R174 Poverty Line
Year 1995 2005 1995 2005
P1-Mean Expenditure Elasticity -1.02 -1.33 -1.63 -2.17
P1-Gini Elasticity 3.79 6.30 9.96 17.05
MPRS: P1 3.72 4.74 6.12 7.86
2008 COMMISSIONERS INDABA 19 - 21 November 2008 Sun City
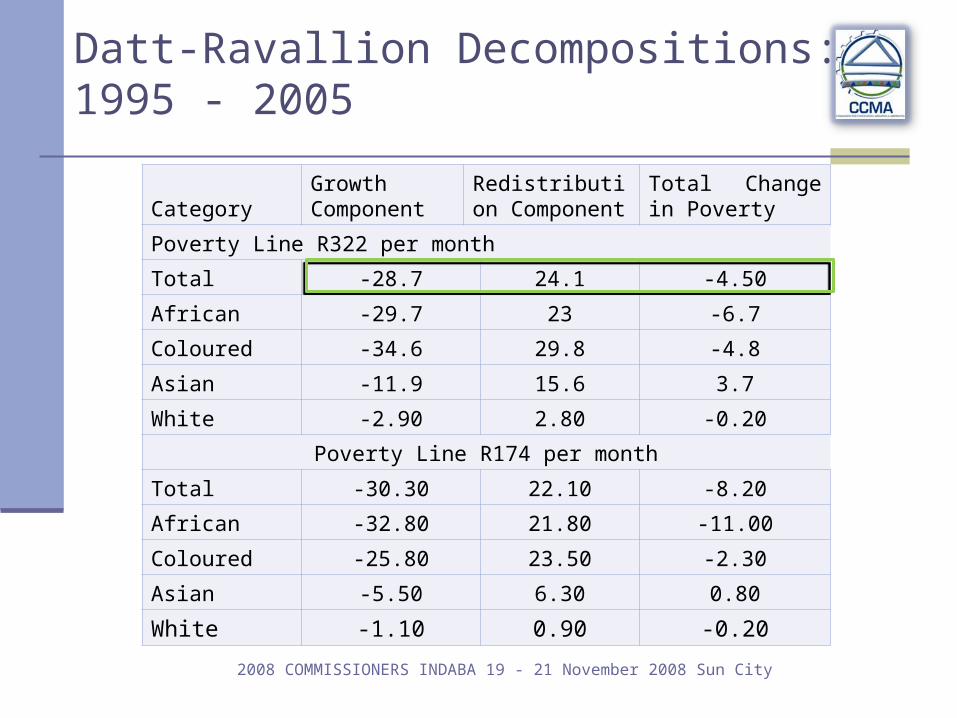
Datt-Ravallion Decompositions: 1995 - 2005
CategoryGrowth Component
Redistribution Component
Total Change in Poverty
Poverty Line R322 per month
Total -28.7 24.1 -4.50
African -29.7 23 -6.7
Coloured -34.6 29.8 -4.8
Asian -11.9 15.6 3.7
White -2.90 2.80 -0.20
Poverty Line R174 per month
Total -30.30 22.10 -8.20
African -32.80 21.80 -11.00
Coloured -25.80 23.50 -2.30
Asian -5.50 6.30 0.80
White -1.10 0.90 -0.20
2008 COMMISSIONERS INDABA 19 - 21 November 2008 Sun City
Conclusions
Statistically significant decline in poverty: race, gender of HH head, location
Increase in inequality -> driven by inequality between race groups
Absolute pro-poor growth but not relative pro-poor growth
2008 COMMISSIONERS INDABA 19 - 21 November 2008 Sun City
Conclusions
Crucial role of social grants at the bottom of the expenditure
Increase in inequality has eroded some of the poverty reduction gains of economic growth
High initial inequalities = key constraint on poverty reduction