2007 - CMAR · 2 VOYAGE SUMMARY – SS02/2007 Itinerary Depart Hobart 2200hrs, Wednesday 28th March...
12
2007 voyage summary SS02/2007 RV Southern Surveyor program
Transcript of 2007 - CMAR · 2 VOYAGE SUMMARY – SS02/2007 Itinerary Depart Hobart 2200hrs, Wednesday 28th March...

2007
voyagesummarySS02/2007
R V S o u t h e r n S u r v e y o r
program
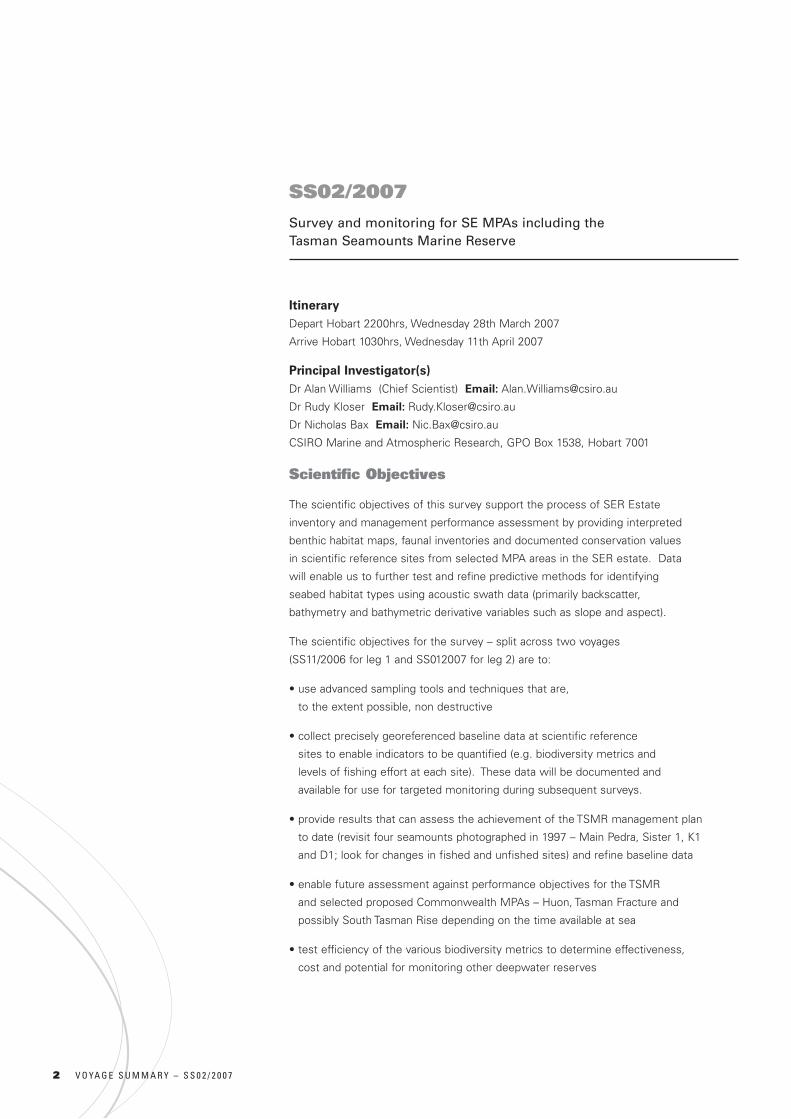
2 V O YA G E S U M M A R Y – S S 0 2 / 2 0 0 7
Itinerary Depart Hobart 2200hrs, Wednesday 28th March 2007
Arrive Hobart 1030hrs, Wednesday 11th April 2007
Principal Investigator(s) Dr Alan Williams (Chief Scientist) Email: [email protected]
Dr Rudy Kloser Email: [email protected]
Dr Nicholas Bax Email: [email protected]
CSIRO Marine and Atmospheric Research, GPO Box 1538, Hobart 7001
Scientific Objectives
The scientific objectives of this survey support the process of SER Estate
inventory and management performance assessment by providing interpreted
benthic habitat maps, faunal inventories and documented conservation values
in scientific reference sites from selected MPA areas in the SER estate. Data
will enable us to further test and refine predictive methods for identifying
seabed habitat types using acoustic swath data (primarily backscatter,
bathymetry and bathymetric derivative variables such as slope and aspect).
The scientific objectives for the survey – split across two voyages
(SS11/2006 for leg 1 and SS012007 for leg 2) are to:
• use advanced sampling tools and techniques that are,
to the extent possible, non destructive
• collect precisely georeferenced baseline data at scientific reference
sites to enable indicators to be quantified (e.g. biodiversity metrics and
levels of fishing effort at each site). These data will be documented and
available for use for targeted monitoring during subsequent surveys.
• provide results that can assess the achievement of the TSMR management plan
to date (revisit four seamounts photographed in 1997 – Main Pedra, Sister 1, K1
and D1; look for changes in fished and unfished sites) and refine baseline data
• enable future assessment against performance objectives for the TSMR
and selected proposed Commonwealth MPAs – Huon, Tasman Fracture and
possibly South Tasman Rise depending on the time available at sea
• test efficiency of the various biodiversity metrics to determine effectiveness,
cost and potential for monitoring other deepwater reserves
SS02/2007Survey and monitoring for SE MPAs including the Tasman Seamounts Marine Reserve

3 V O YA G E S U M M A R Y – S S 0 2 / 2 0 0 7
• provide samples for key taxa that can be used in subsequent genetic research
to refine definition and extent of endemicity in deepwater fauna
• complete swath mapping of relevant parts of continental
slope between Hobart and SW Cape
These scientific objectives aim to:
1. Develop specific and generic research and monitoring options
for the benthic ecosystems of offshore MPAs using ecological
indicators identified though comparative deep water surveys
2. Trial and develop these through scientific survey of
selected MPA areas in the SE estate
3. Evaluate and report the baseline data acquired
a) at established scientific reference/ monitoring sites within and outside MPAs
b) in forms that can be understood by, and are available to, all stakeholders
c) in forms that can be presented to general public
through the print and television media
Voyage Objectives
The overall voyage objectives were to:
1. Generate swath acoustic maps of target areas with the Simrad EM300 multibeam;
2. Collect targeted biological, physical and photographic ground-truth samples with
a sediment grab, rock sled, epibenthic sleds and the CMR SVS or MVS camera
platform from regions of upper continental slope seabed (~100-2000 m);
3. Collect and curate benthic invertebrates to provide a biological inventory
at various scales of taxonomic resolution, including a functional
morphological classification developed for the deep sea fauna.
These objectives are split across two legs (separate voyages): during leg 1
(SS11/2006) the areas of interest were mapped using the EM300 multibeam
and ground-truthed using the towed camera system. A program of sediment
sampling was also undertaken using a Smith-MacIntyre sediment grab. On this
voyage we made the complementary biological collections using an epibenthic
sled. Sample locations were based on the mapping and photographic ground-
truthing done on leg 1. Additional camera work was also completed at new sites,
including an offshore site (the Cascade Plateau) not visited during leg 1.

4 V O YA G E S U M M A R Y – S S 0 2 / 2 0 0 7
Figure 1: Map showing the survey areas for SS02/2007 within the proposed Huon
and Tasman Fracture MPA regions, and the offshore Cascade Plateau.

5 V O YA G E S U M M A R Y – S S 0 2 / 2 0 0 7
Results
A total of 78 operations were completed (Table 1): these included calibration of the
Sondardyne tracking system, 15 successful camera transect and 52 successful sled
transects. In addition, fill-in mapping was completed using the EM300 multibeam sonar
(MBS) on the inner and outer shelf, upper and mid-slope and seamounts areas of each
of the proposed Huon and Tasman Fracture MPAs, and most of the Cascade Plateau
was mapped with high resolution data for the first time. All biological collections were
sorted to the lowest possible taxon on board, preserved and packed for immediate
distribution to the relevant museum experts. Representatives of all unique taxa
were photographed and catalogues made in real time to assist with continuity of
identifications. Camera imagery (video tapes and digital still images), together with
telemetry data (depth, position, CTD etc.), were archived. Still images were renamed
to enable database entry, and were georeferenced. One deep deployment included
a calibration bar for experiments to estimate depth-related calibration errors. Seabed
mapping data were processed, and electronic copies loaded into a GIS for navigation and
mapping of stations. All underway data, ADCP data and single beam acoustic data were
logged and archived. All station data were captured in the shipboard Oracle database.
The highly successful sampling program across both voyages
will enable all project objectives to be met.
Voyage Narrative
Wednesday 28th March
Southern Surveyor departed Hobart late Wednesday
evening at 2200 hours following mobilization.
Thursday 29th March
Early in the morning (daylight) we commenced a Sonardyne calibration (op 1) in 85
meters of water off Adventure Bay. Once the calibration data was collected, we
proceeded to retrieve the moored Sonardyne beacon but the float line was cut off
as it became entangled with the propeller. A grapple was deployed and a single tow
successfully snagged the ground line and the beacon was retrieved. We headed to
the Huon site where the first Sherman epibenthic sled operation was completed
(op 2) at Huon 100 m. The target was overshot so the shot was repeated (op 3)
targeting the reef top and based on camera system and swath information collected
during leg 1. An adequate sample of hard and soft bottom epifauna was collected.
The next sled shot (op 4) was deployed to sample bryozoan communities at 200 m
coinciding along the corresponding camera tow. A large sample was collected.
Friday 30th March
The processing of the two large sled samples was time consuming so lines to
the east of the site were steamed to collect swath data. We returned to the Huon
study area by breakfast but deteriorating weather conditions prevented us from
being able to deploy the sled. We continued collecting swath data in the region
until ~1300 hours when we decided to return to Storm Bay to repeat a Sonardyne
calibration (op 5) as the previously collected calibration data had problems.

6 V O YA G E S U M M A R Y – S S 0 2 / 2 0 0 7
Saturday 31st March
The Sonardyne calibration was started at first light and completed successfully
at ~1000 hours when we steamed back to the Huon area for a sled tow in
400 m (op 6). This provided a diverse 2-bin sample. Next sled tow (op 7) was
completed in 1000 m (Huon 1000) but the sample size was inadequate.
Sunday 1st April
A repeat tow for Huon 1000 was completed (op 8) resulting in a good sample consisting
of several types of corals, pancake urchins, crustaceans and molluscs. Operation
9 was another attempt to sample the Huon 1000 m sit; the net was caught inside
the sled mouth, but contained a reasonable quantity and diversity, and was judged
acceptable. Another sample from Huon 1000 (op 10) resulted in a good sample of
corals and crustaceans. Swath data was collected to allow time for processing the
sample and we then positioned ourselves for a sled tow (op 11) down the south west
side of Main Pedra. On retrieval of the sled we found only a small sample and the
tow bridle broken. The outer protective net was also shredded so a replacement was
fitted and repairs made whilst collecting swath data to the south. Once the sled was
ready for redeployment we completed a sled tow down the southern side of Hill U
(op 12). A good sample of ~220 kg of coral and other invertebrates was collected.
Monday 2nd April
A deeper sled tow (op 13) on Hill U resulting in a large sample. Another sled tow (op
14) was completed on Hill U but this time down the western side. This also resulted
in a good sample of corals and other invertebrates. Operation 15 was a sled tow
down the eastern side of Hill U and resulted in a large sample (6+ boxes) largely of
dead stony coral but with other animals throughout. A tow down the western side
of Hill U (op 16) resulted in a big bag of coral. Operation 17 was a sled tow down the
western side of Pedra (op 17); only a small sample was collected, but this was judged
to be representative. Data from Sonardyne was becoming unreliable for several sled
tows and this greatly compromised our ability to estimate positions for touch-down
and lift off of the sled. Another tow down the western side of Pedra (op 18) provided
a small adequate sample. Operations 19, 20 and 21 were on Z27 Little Mongrel;
these were targeted at the rich coral area at its base, but there were missed on each
occasion with only small samples of mostly dead coral and barnacle shells taken.
Tuesday 3rd April
Completed a sled shot on Z16 (op 22) and retrieved a very large sample of ~20
bins, mostly of dead stony coral, but containing many other species. The next
two shots (ops 23 and 24) were in a southwesterly direction down Main Pedra.
Both samples were small but adequate consisting of some fish, hermit crabs,
molluscs, sea stars and urchins. The Sonardyne continued to be unreliable and
it seems as though over heating was contributing to this. We started switching
the system off between shots and this fixed it. The next two shots (ops 25 and
26) were on Dory Hill and Hill Z15; both produced large samples of coral – mostly
dead, but with a range of associated fauna. Swath lines were run to complete
coverage to the south of the survey area, and hole-fill along the shelf edge.

7 V O YA G E S U M M A R Y – S S 0 2 / 2 0 0 7
Wednesday 4th April
Completed shelf edge swath transect before doing a sled sample (op27) on the margin
in 800-1000 m on a previous photo transect. Operation 28 was a sled tow in 1000
meters of water resulting in a large (150 kg+) sample mostly of dead corals with a small
number of invertebrates throughout. We then steamed west to the Tasman Fracture MPA
collecting shelf-break swath data en-route. A sled tow (op 29) was completed in 200 m
resulting in a large sized sample of bryozoans and other invertebrates. Next operation
was a sled tow in 100 m targeting hard rocky ground (op 30). This tow was unsuccessful
and repeated (op 31) resulting in a good sample of sponges and other inverts.
Thursday 5th April
A sled tow on the upper-slope in 400 m (op 32) was completed before moving to Mini
Maat – a small unfished coral hill seaward to the Main Matt seamount. Five consecutive
sled tows (ops 33, 34, 35, 36 and 37) on the SSW flank provided replicate samples.
Samples were generally good with 5-10 bins collected during each shot. The samples
were largely of dead Solensmilia with some live corals and other invertebrates. The
CTD was deployed to collect LADCP data (op 38) at Main Maat. Operation 39 was
a sled tow on the mid-slope in 1200 m of water. A small but interesting sample of
animals was collected. A repeat tow was completed at the same site (op 40) but from
NW to SE to maximize the opportunity to sample some hard ground on a ridge.
Friday 6th April
By now (Easter Good Friday) the weather had started to improve as winds eased
from the persistent and strong W-SW stream we had experienced for most of
the trip to date. A sled tow (op 41) was targeted to sample between 800 and 880
meters resulting in a small but diverse invertebrate sample. Operation 42 was the
first camera tow for the survey and was a 30 min down-slope tow from 1120 to 1295
m in the Tasman Fracture region. The video revealed a suitable bottom with enough
animals to warrant a sled tow. Following this first camera deployment, some minor
setting and operational changes were made to improve performance. The sled was
deployed (op 43) along the same track as the previous camera tow and a good sample
of animals was collected. The camera system was again deployed (op 44) for a 1
hour tow between 1100 and 1200 meters across contrasting areas of backscatter
from swath. Another camera tow (op 45) started in 1080 m and transected to 1300
m recording ~1 hour of video. Operation 46 was a sled tow from 1100 to 1200 m.
Three LADCP casts (ops 47, 48 and 49) were completed around Main Maat; one
dip on the peak, one on the flank and the final at the base of the seamount.
8 V O YA G E S U M M A R Y – S S 0 2 / 2 0 0 7
Saturday 7th April
A sled tow (op 50) was completed on the north eastern outer flank of Main Maat
between 1050 and 1230 meters. We then steamed to the east returning to the Huon
region. Weather and sea conditions remained favorable for deploying our traps. The
1,800 m trap line was set (op 51) on a gently sloping area to the north of Hill Z19 in
~1350 m. The trap line had 30 baited scavenging crustacean traps interspersed with
ten baited crab traps. This was followed by a sled tow on Hill Z56 (op 52) to the NW.
A large sample was retrieved – much being dead material. Operation 53 was a camera
tow down a steep corner on the margin of the Huon region. This tow was also to collect
calibration data for the effect of depth on stereo video measurements. A calibration bar
was mounted in the field of view of the stereo cameras and the laser array employed
throughout the tow. The camera touched-down at ~615 m and was flown down steep
escarpments to 1115 m. A significant number of corals (some moderately large) were
seen throughout the tow. The work program in Huon was completed with camera tows
on three seamounts – Patience (op 54), Z69 (op 55), Z9 (op 56) – the trap line retrieval
(op 57), and two sleds (ops 58 and 59) respectively on Z9 and the margin in 1000 m.
Sunday 8th April
Due to the excellent progress made to this point in the survey, and a well-timed
window of good weather, we took the opportunity to steam out to the Cascade
Plateau (a large, flat-topped seamount named after the famous Hobart brewery).
The aim was to make a comparative collection of fauna at corresponding depths
and latitude from a relatively highly isolated feature. We began the 140 n.m. nautical
mile steam east during the early hours and arrived at about 1600 hours when
we commenced swath mapping the northern portion. This was followed by two
sled tows (ops 60, 61) on the lightly fished eastern flank (position 1, ‘Bitter’).
Monday 9th April
Sampling commenced with camera tows at position 1: (op 62)
along the line of the sled tows from ~1000 m to 1300 m on the
eastern flank, and another (op 63) from 800 to 1000 m.
Two more camera tows (ops 64 and 65) were completed at position 2 (‘Draught’) on the
northeastern part of the plateau. A sled tow (op 66) sampled between 800 and 1000
m at position 1. A long camera tow (op 67) was completed at the head of the canyon
feature at the northern end of the plateau (position 3 ‘Light’) between ~700 and 1300
m depths. Operations 68 and 69 were the sled tows at ‘Light’, respectively sampling
the shallow and deep depth ranges. Operation 68 pinned up on the strip of very rugged
rocky bottom running between ~870 and 1050 m depths, but still returned an adequate
sample. Very few large epifauna animals were seen by cameras or caught by sleds.

9 V O YA G E S U M M A R Y – S S 0 2 / 2 0 0 7
Tuesday 10th April
Operation 70 was a deep sled tow (1200) at position 2 (‘Draught’). A camera tow (op
71) targeted a rocky peak at the shallowest point (~580 m) of the Cascade Plateau
(position 4, the ‘Premium’ site), and a repeat tow (op 72) that got closer to the peak,
revealed the only area of diverse attached invertebrate fauna seen on the Plateau. A
800-1000 m camera tow (op 73) was completed on the eastern side (Position 4, the
‘Pale’ site), in the area of several canyon-like drainage features. A mix of sediments
and rough rocky steep ground but little epifauna was observed. As a consequence
of this, and a shortage of time, no sled samples were taken at ‘Pale”. A CTD cast (op
74) was made to collect seawater from 200 m but there were problems with firing
the bottles. We returned to position 5 at the peak and completed a sled tow (op 75)
which yielded a large and diverse sample. Operation 76 was a CTD cast to collect both
ADCP data and a water sample. Operation 77 was another sled tow at the shallowest
point of the Cascade Plateau that provided a replicate sample at this site. Another
CTD cast was made (op 78) to collect more seawater. Two additional swath lines
were run before the vessel commenced its steam homeward to Hobart at 18:30.
Wednesday 11th April
After a bumpy return trip from the Cascade Plateau, we
berthed at the CMAR wharf in Hobart at 10:30.
Summary
This was a highly successful voyage that succeeded in meeting its ambitious
sampling schedule for the proposed Huon and Tasman Fracture marine protected
areas, and in addition, was able to take the first scientific benthic samples from the
Cascade Plateau. The variety, volume, and quality of the data collected has ensured
that the overarching scientific objectives dependent on this voyage can be met.
Acknowledgements
The success of this voyage can be attributed to the wide variety of expertise and hard
work provided by the science team which, in addition to staff from CSIRO, also included
representatives from Geoscience Australia, Museum Victoria, the Australian Museum,
Queensland Museum and New Zealand’s National Institute of Water and Atmospheric
Research (NIWA). Our success was also attributable to the very high standard of
support given by the entire marine crew – but especially the Bridge Officers for skilful
deployment of the benthic sled and cameras over challenging seabed terrains. We
would also like to acknowledge the efforts of other support staff at CSIRO Marine and
Atmospheric Research – particularly Dave Kube and his team from the mechanical and
Matt Sherlock from the electronic workshops, as well as the administration section,
particularly Greg Lyden – for their support in getting this survey mobilized and the
overarching project organised. This survey was co-funded by CSIRO Marine and
Atmospheric Research, and the Department of the Environment and Water Resources.

10 V O YA G E S U M M A R Y – S S 0 2 / 2 0 0 7
Personnel
Scientific participants
Alan Williams CMAR Chief Scientist (Principal investigator)
Bruce Barker CMAR Watch Leader/ camera systems
Jeff Cordell CMAR Voyage Manager/ electronics support/
Camera systems
Bernadette Heaney CMAR Computing support
Karen Gowlett-Holmes CMAR Invertebrate taxonomy
Mark Lewis CMAR Gear operations/ camera systems
Cameron Buchanan GA Multibeam sonar
Tim O’Hara MV Invertebrate taxonomy
Steve Keable AM Invertebrate taxonomy
Karen Miller UTAS Invertebrate taxonomy
Monika Schlacher UQ Invertebrate taxonomy
Mireille Consalvey NIWA Invertebrate taxonomy/ communications
Julian Finn MV Invertebrate taxonomy
Trudy Costa MV Invertebrate taxonomy
Marine Crew
Ian Taylor Master
John Boyes First Mate
Mike Tuck Second Mate
Roger Thomas Chief Engineer
Rob Cave First Engineer
Sean Connolly Second Engineer
Graham McDougall Boatswain
John Howard Integrated Rating
Matt Barrett Integrated Rating
Darren Guy Integrated Rating
Paul O’Neill Integrated Rating
John Hall Integrated Rating
Craig Waters Chief Cook
Julie Porch Second Cook
Lisa Cook Chief Steward
This voyage summary is in accordance with the directions of
the Marine National Facility Steering Committee.
Dr Alan Williams
Chief Scientist (on behalf of the project investigators, Rudy Kloser and Nic Bax)

11 V O YA G E S U M M A R Y – S S 0 2 / 2 0 0 7
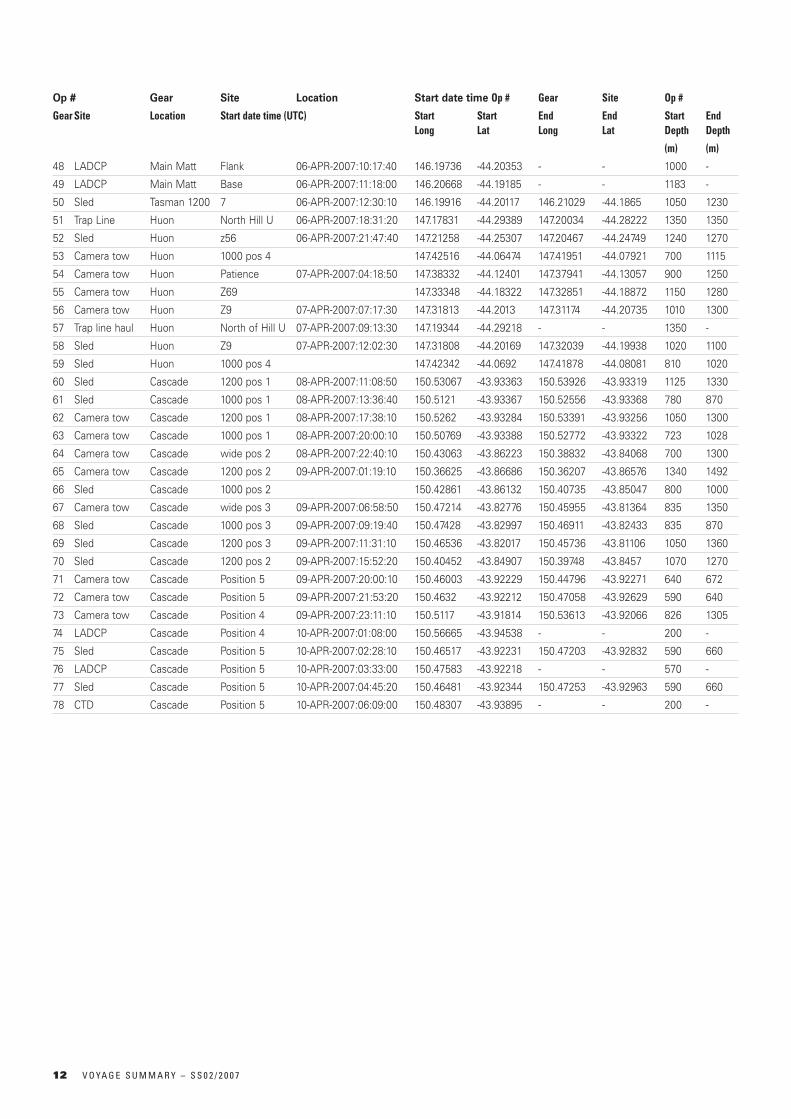
Table 1: List of operations
Op # Gear Site Location Start date time (UTC) Start Start End End Start End Long Lat Long Lat Depth Depth
(m) (m)
1 Sonardyne Storm Bay 80 m 28-MAR-2007:22:31:10 147.5 -43.3 - - 80 -
2 Sled Huon 100 100 m 29-MAR-2007:08:17:10 146.97655 -43.69146 146.97344 -43.69334 100 110
3 Sled Huon 100 100 m 29-MAR-2007:09:15:10 146.97566 -43.69182 146.97266 -43.69391 100 110
4 Sled Huon 200 200 m 29-MAR-2007:13:03:00 147.53832 -43.97835 147.53238 -43.97233 180 237
5 Sonardyne Storm Bay 65 m 30-MAR-2007:21:00:40 147.47181 -43.36914 - - 65 -
6 Sled Huon 400 400 m 31-MAR-2007:04:39:00 147.54616 -43.9916 147.56322 -43.9949 370 410
7 Sled Huon1000 1000 m 31-MAR-2007:06:48:20 147.58026 -44.0307 147.58107 -44.03686 ~840 1030
8 Sled Huon 1000 1000 m 31-MAR-2007:09:08:00 147.5796 -44.03061 147.58187 -44.03559 ~830 1030
9 Sled Huon 1000 1000 m 31-MAR-2007:14:00:50 147.12766 -44.15407 147.131 -44.16193 ~800 920
10 Sled Huon 1000 1000 m 31-MAR-2007:16:09:30 147.12884 -44.15413 147.13204 -44.16355 800 950
11 Sled Pedra Main SW 31-MAR-2007:22:28:20 147.09695 -44.25993 147.09173 -44.26587 730 1000
12 Sled Hill U S 01-APR-2007:04:34:10 147.17963 -44.32506 147.17949 -44.32654 1140 1200
13 Sled Hill U S 01-APR-2007:09:33:20 147.17923 -44.32693 147.179 -44.32885 1200 1300
14 Sled Hill U W 01-APR-2007:14:13:30 147.17799 -44.32092 147.17525 -44.32159 1150 1280
15 Sled Hill U E 01-APR-2007:15:34:50 147.18085 -44.32245 147.18494 -44.32223 1100 1200
16 Sled Hill U Top/ west 02-APR-2007:01:55:40 147.17516 -44.32567 147.17755 -44.32403 1100 1160
17 Sled Pedra West 02-APR-2007:06:26:20 147.09201 -44.25853 147.08661 -44.25673 850 1000
18 Sled Pedra West 02-APR-2007:09:31:30 147.09325 -44.2592 147.08563 -44.2567 850 1000
19 Sled Z27 LMongrel NW 02-APR-2007:11:51:30 147.12393 -44.24491 147.12079 -44.24314 1200 1200
20 Sled Z27 LMongrel NW 02-APR-2007:13:13:20 147.12396 -44.24522 147.1207 -44.24166 1200 1200
21 Sled Z27 LMongrel NW 02-APR-2007:15:18:10 147.1188 -44.24066 147.12507 -44.24568 1200 1200
22 Sled Hill Z16 SW 02-APR-2007:17:24:00 147.06693 -44.29226 147.06485 -44.29447 1100 1300
23 Sled Pedra SW 02-APR-2007:22:10:40 147.09724 -44.26103 147.09183 -44.26627 730 1000
24 Sled Pedra SW 03-APR-2007:00:16:10 147.09705 -44.26161 147.08814 -44.26513 730 1000
25 Sled Dory Hill W 03-APR-2007:03:53:50 147.11893 -44.32626 147.11401 -44.32606 1100 1200
26 Sled Hill Z15 SW 03-APR-2007:10:17:00 147.47266 -44.23179 147.46757 -44.23528 1100 1350
27 Sled Huon 1000 1000 m 03-APR-2007:16:05:00 147.24786 -44.12562 147.24826 -44.13342 800 1000
28 Sled Huon 1000 1000 m 03-APR-2007:19:00:00 147.24906 -44.12509 147.24981 -44.13145 800 950
29 Sled Tas Frac 200 200 m 03-APR-2007:15:20:00 146.32959 -44.00001 146.32852 -44.00179 200 220
30 Sled Tas Frac 100 100 m 04-APR-2007:05:03:20 146.27134 -43.7234 146.26972 -43.72369 110 117
31 Sled Tas Frac 100 100 m 04-APR-2007:06:13:10 146.27091 -43.72352 146.26814 -43.72407 116 122
32 Sled Tas Frac 400 400 m 04-APR-2007:11:50:20 146.31158 -44.04167 146.30714 -44.04893 410 450
33 Sled Mini Matt SSW 04-APR-2007:14:25:40 146.16427 -44.24473 146.16139 -44.24882 1120 1360
34 Sled Mini Matt SSW 04-APR-2007:17:48:20 146.16476 -44.24388 146.16204 -44.24797 1120 1310
35 Sled Mini Matt SSW 04-APR-2007:20:53:50 146.16445 -44.24496 146.16105 -44.24873 1120 1360
36 Sled Mini Matt SSW 05-APR-2007:01:47:30 146.16426 -44.24493 146.16086 -44.24787 1120 1350
37 Sled Mini Matt SSW 05-APR-2007:04:21:00 146.16498 -44.24423 146.16094 -44.24917 1120 1380
38 LADCP Main Matt Peak 05-APR-2020:07:14:00 146.19138 -44.21448 - - - -
39 Sled Tasman 1200 1 05-APR-2007:09:32:00 146.15028 -44.13529 146.14139 -44.14022 1130 1180
40 Sled Tasman 1200 1 05-APR-2007:11:33:20 146.14415 -44.1322 146.15131 -44.13734 1140 1180
41 Sled Tasman 1000 SW 05-APR-2007:14:42:10 146.23396 -44.06578 146.22369 -44.07366 800 880
42 Camera tow Tasman 1200 3 05-APR-2007:18:00:00 146.27936 -44.11147 146.27216 -44.11813 1100 1300
43 Sled Tasman 1200 3 05-APR-2007:20:29:00 146.27916 -44.11238 146.27409 -44.11594 1100 1200
44 Camera tow Tasman 1200 4 06-APR-2007:01:32:20 146.11755 -44.12223 146.0972 -44.14221 1100 1200
45 Camera tow Tasman 1200 5 06-APR-2007:03:33:30 146.07358 -44.09508 146.05043 -44.1085 1080 1300
46 Sled Tasman 1200 3 06-APR-2007:07:02:40 146.28119 -44.11011 146.27159 -44.11822 1100 1200
47 LADCP Main Matt Peak 06-APR-2007:09:24:10 146.19102 -44.21448 - - 650 -
12 V O YA G E S U M M A R Y – S S 0 2 / 2 0 0 7
Op # Gear Site Location Start date time Op # Gear Site Op #
Gear Site Location Start date time (UTC) Start Start End End Start End Long Lat Long Lat Depth Depth
(m) (m)
48 LADCP Main Matt Flank 06-APR-2007:10:17:40 146.19736 -44.20353 - - 1000 -
49 LADCP Main Matt Base 06-APR-2007:11:18:00 146.20668 -44.19185 - - 1183 -
50 Sled Tasman 1200 7 06-APR-2007:12:30:10 146.19916 -44.20117 146.21029 -44.1865 1050 1230
51 Trap Line Huon North Hill U 06-APR-2007:18:31:20 147.17831 -44.29389 147.20034 -44.28222 1350 1350
52 Sled Huon z56 06-APR-2007:21:47:40 147.21258 -44.25307 147.20467 -44.24749 1240 1270
53 Camera tow Huon 1000 pos 4 147.42516 -44.06474 147.41951 -44.07921 700 1115
54 Camera tow Huon Patience 07-APR-2007:04:18:50 147.38332 -44.12401 147.37941 -44.13057 900 1250
55 Camera tow Huon Z69 147.33348 -44.18322 147.32851 -44.18872 1150 1280
56 Camera tow Huon Z9 07-APR-2007:07:17:30 147.31813 -44.2013 147.31174 -44.20735 1010 1300
57 Trap line haul Huon North of Hill U 07-APR-2007:09:13:30 147.19344 -44.29218 - - 1350 -
58 Sled Huon Z9 07-APR-2007:12:02:30 147.31808 -44.20169 147.32039 -44.19938 1020 1100
59 Sled Huon 1000 pos 4 147.42342 -44.0692 147.41878 -44.08081 810 1020
60 Sled Cascade 1200 pos 1 08-APR-2007:11:08:50 150.53067 -43.93363 150.53926 -43.93319 1125 1330
61 Sled Cascade 1000 pos 1 08-APR-2007:13:36:40 150.5121 -43.93367 150.52556 -43.93368 780 870
62 Camera tow Cascade 1200 pos 1 08-APR-2007:17:38:10 150.5262 -43.93284 150.53391 -43.93256 1050 1300
63 Camera tow Cascade 1000 pos 1 08-APR-2007:20:00:10 150.50769 -43.93388 150.52772 -43.93322 723 1028
64 Camera tow Cascade wide pos 2 08-APR-2007:22:40:10 150.43063 -43.86223 150.38832 -43.84068 700 1300
65 Camera tow Cascade 1200 pos 2 09-APR-2007:01:19:10 150.36625 -43.86686 150.36207 -43.86576 1340 1492
66 Sled Cascade 1000 pos 2 150.42861 -43.86132 150.40735 -43.85047 800 1000
67 Camera tow Cascade wide pos 3 09-APR-2007:06:58:50 150.47214 -43.82776 150.45955 -43.81364 835 1350
68 Sled Cascade 1000 pos 3 09-APR-2007:09:19:40 150.47428 -43.82997 150.46911 -43.82433 835 870
69 Sled Cascade 1200 pos 3 09-APR-2007:11:31:10 150.46536 -43.82017 150.45736 -43.81106 1050 1360
70 Sled Cascade 1200 pos 2 09-APR-2007:15:52:20 150.40452 -43.84907 150.39748 -43.8457 1070 1270
71 Camera tow Cascade Position 5 09-APR-2007:20:00:10 150.46003 -43.92229 150.44796 -43.92271 640 672
72 Camera tow Cascade Position 5 09-APR-2007:21:53:20 150.4632 -43.92212 150.47058 -43.92629 590 640
73 Camera tow Cascade Position 4 09-APR-2007:23:11:10 150.5117 -43.91814 150.53613 -43.92066 826 1305
74 LADCP Cascade Position 4 10-APR-2007:01:08:00 150.56665 -43.94538 - - 200 -
75 Sled Cascade Position 5 10-APR-2007:02:28:10 150.46517 -43.92231 150.47203 -43.92832 590 660
76 LADCP Cascade Position 5 10-APR-2007:03:33:00 150.47583 -43.92218 - - 570 -
77 Sled Cascade Position 5 10-APR-2007:04:45:20 150.46481 -43.92344 150.47253 -43.92963 590 660
78 CTD Cascade Position 5 10-APR-2007:06:09:00 150.48307 -43.93895 - - 200 -