2006 JETRO WHITE PAPER ON INTERNATIONAL TRADE AND …
38
2006 JETRO WHITE PAPER ON INTERNATIONAL TRADE AND FOREIGN DIRECT INVESTMENT (Summary) Japanese Corporate Activity in New Growth Markets and the Emerging East Asian Free Trade Zone JAPAN EXTERNAL TRADE ORGANIZATION
Transcript of 2006 JETRO WHITE PAPER ON INTERNATIONAL TRADE AND …

2006 JETRO WHITE PAPER ON
INTERNATIONAL TRADE AND FOREIGN DIRECT INVESTMENT
(Summary)
Japanese Corporate Activity in New Growth Markets and the Emerging East Asian Free Trade Zone
JAPAN EXTERNAL TRADE ORGANIZATION

This same information can be viewed on JETRO’s website at www.jetro.go.jp
CONTENTS
1. Economic, Trade and Investment Trends .......................................................................................... 1
A. Global Economy ................................................................................................................................... 1
B. Japanese Economy ................................................................................................................................ 6
C. Counterfeiting ..................................................................................................................................... 13
D. WTO and Free Trade Agreements....................................................................................................... 14
2. Opportunities in Emerging Economies............................................................................................ 18
A. Growth of Emerging Economies......................................................................................................... 18
B. Western and ROK Firms in India ........................................................................................................ 19
C. ROK Firms in China and Brazil.......................................................................................................... 20
D. Chinese Firms in Emerging Economies .............................................................................................. 21
E. Turkish Firms in Russia ...................................................................................................................... 22
F. Brazilian and Mexican Firms in Latin America .................................................................................. 23
G. Japanese Firms Entering Emerging Economies .................................................................................. 24
3. Japan’s Deepening Business Ties with East Asia ............................................................................ 26
A. East Asian Free Trade Zone ................................................................................................................ 26
B. Increasing Ties with China, India and Beyond.................................................................................... 26
C. Major Issues Going Forward............................................................................................................... 28
1
2006 JETRO White Paper on Trade and Investment 1. Economic, Trade and Investment Trends A. Global Economy 1) Near 5% Growth for Three Straight Years Expected
The global economy, after growing 5.3% in 2004, held at 4.8% in 2005 and is forecast to finish at 4.9% in 2006, a brisk pace of around 5% for three consecutive years. Developing economies grew 7.2%, the first time in 30 years they have grown at least 7% in two consecutive years. East Asian economies grew 8.3%, their third consecutive year at 8% or higher, and accounted for 37.4% of global economic growth.
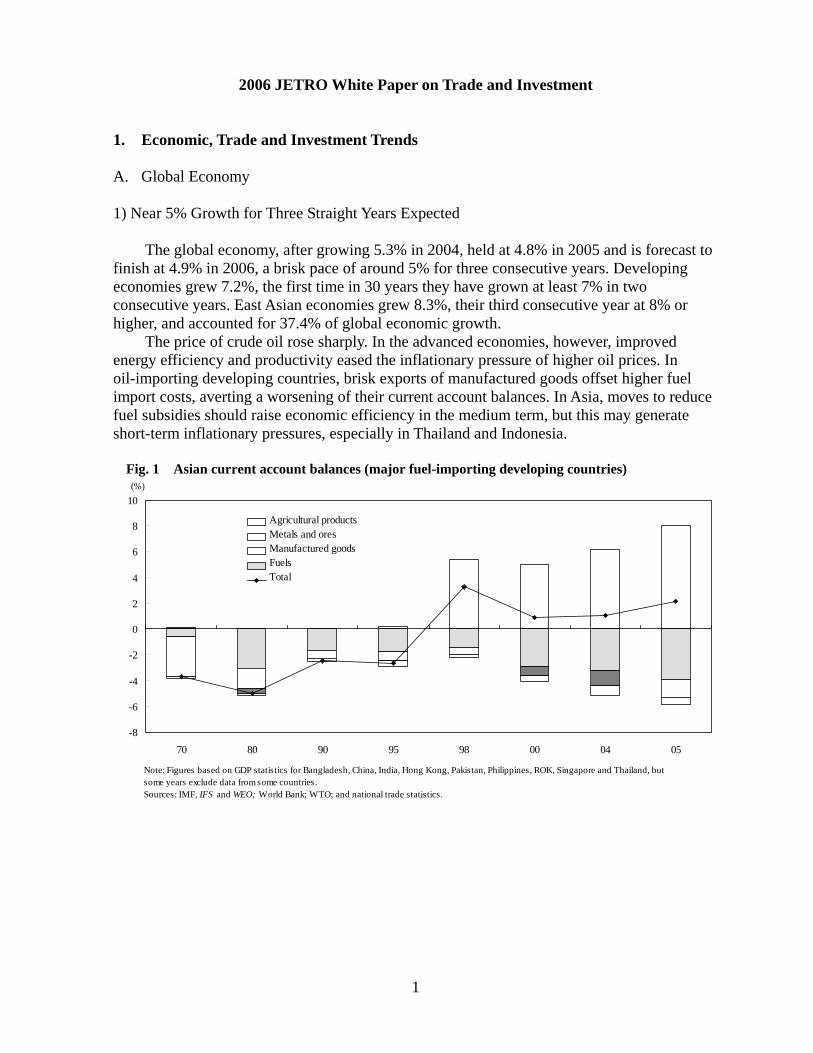
The price of crude oil rose sharply. In the advanced economies, however, improved energy efficiency and productivity eased the inflationary pressure of higher oil prices. In oil-importing developing countries, brisk exports of manufactured goods offset higher fuel import costs, averting a worsening of their current account balances. In Asia, moves to reduce fuel subsidies should raise economic efficiency in the medium term, but this may generate short-term inflationary pressures, especially in Thailand and Indonesia.
Fig. 1 Asian current account balances (major fuel-importing developing countries)
-8
-6
-4
-2
0
2
4
6
8
10
70 80 90 95 98 00 04 05
農産品
金属・鉱石
製品
燃料
全体
(%)
Note: Figures based on GDP statistics for Bangladesh, China, India, Hong Kong, Pakistan, Philippines, ROK, Singapore and Thailand, butsome years exclude data from some countries.Sources: IMF, IFS and WEO; World Bank; WTO; and national trade statistics.
Agricultural productsMetals and oresManufactured goodsFuelsTotal
Agricultural productsMetals and oresManufactured goodsFuelsTotal
Agricultural productsMetals and oresManufactured goodsFuelsTotal
Agricultural productsMetals and oresManufactured goodsFuelsTotal
2
Fig. 2 Inflation rates when oil prices rise (%, points)
1974 Change 1980 Change 2005 Change
Industrialized economies 14.3 9.4 13.0 5.0 2.3 0.9Non-oil-exporting developing economies 25.6 15.3 31.9 15.7 4.6 -0.7Africa 13.7 8.0 16.5 1.1 6.3 -2.6Asia 29.8 23.4 15.4 9.5 3.5 1.6Central and South America 32.2 13.4 48.2 20.5 6.4 -2.7Notes: 1. Changes (points) show 1974 compared with 1972, 1980 with 1978, and 2005 with 2002.2. Figures exclude oil-exporting nations.Source: IMF, IFS.
PresentSecond oil shockFirst oil shock
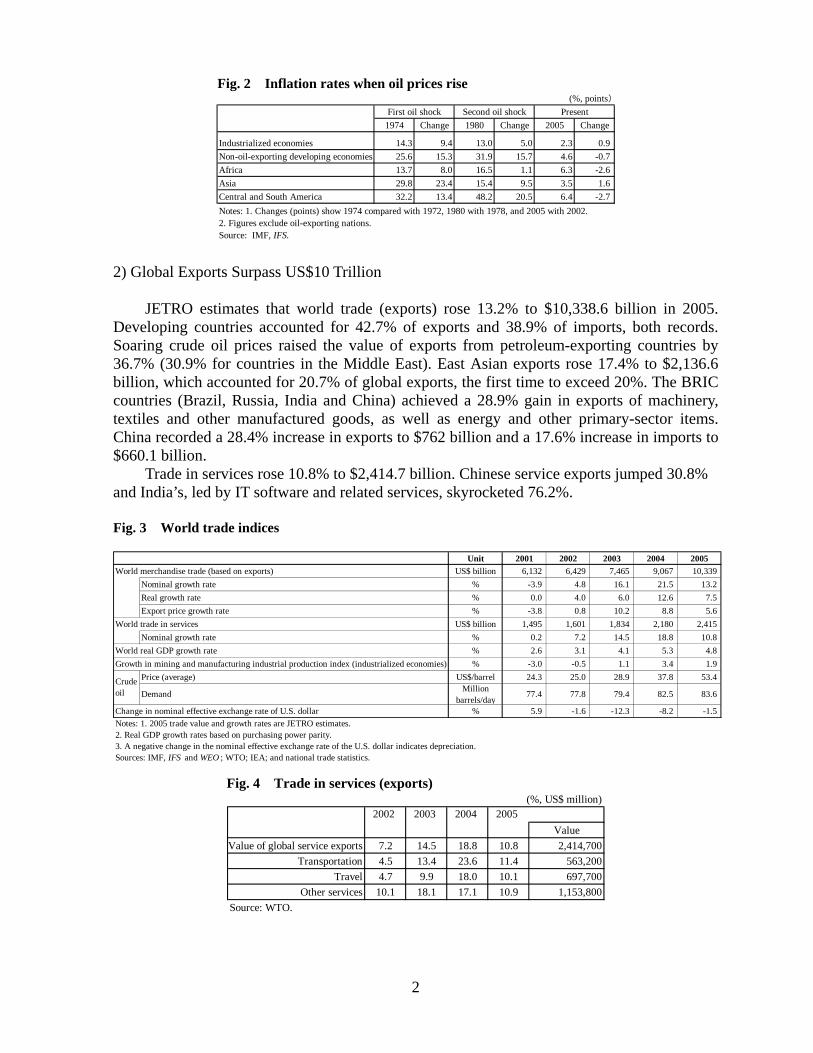
2) Global Exports Surpass US$10 Trillion
JETRO estimates that world trade (exports) rose 13.2% to $10,338.6 billion in 2005. Developing countries accounted for 42.7% of exports and 38.9% of imports, both records. Soaring crude oil prices raised the value of exports from petroleum-exporting countries by 36.7% (30.9% for countries in the Middle East). East Asian exports rose 17.4% to $2,136.6 billion, which accounted for 20.7% of global exports, the first time to exceed 20%. The BRIC countries (Brazil, Russia, India and China) achieved a 28.9% gain in exports of machinery, textiles and other manufactured goods, as well as energy and other primary-sector items. China recorded a 28.4% increase in exports to $762 billion and a 17.6% increase in imports to $660.1 billion.
Trade in services rose 10.8% to $2,414.7 billion. Chinese service exports jumped 30.8% and India’s, led by IT software and related services, skyrocketed 76.2%. Fig. 3 World trade indices
Unit 2001 2002 2003 2004 2005World merchandise trade (based on exports) US$ billion 6,132 6,429 7,465 9,067 10,339
Nominal growth rate % -3.9 4.8 16.1 21.5 13.2Real growth rate % 0.0 4.0 6.0 12.6 7.5Export price growth rate % -3.8 0.8 10.2 8.8 5.6
World trade in services US$ billion 1,495 1,601 1,834 2,180 2,415Nominal growth rate % 0.2 7.2 14.5 18.8 10.8
World real GDP growth rate % 2.6 3.1 4.1 5.3 4.8Growth in mining and manufacturing industrial production index (industrialized economies) % -3.0 -0.5 1.1 3.4 1.9
Price (average) US$/barrel 24.3 25.0 28.9 37.8 53.4
Demand Millionbarrels/day
77.4 77.8 79.4 82.5 83.6
Change in nominal effective exchange rate of U.S. dollar % 5.9 -1.6 -12.3 -8.2 -1.5Notes: 1. 2005 trade value and growth rates are JETRO estimates.2. Real GDP growth rates based on purchasing power parity.3. A negative change in the nominal effective exchange rate of the U.S. dollar indicates depreciation.Sources: IMF, IFS and WEO ; WTO; IEA; and national trade statistics.
Crudeoil
Fig. 4 Trade in services (exports)
ValueValue of global service exports 7.2 14.5 18.8 10.8 2,414,700
Transportation 4.5 13.4 23.6 11.4 563,200Travel 4.7 9.9 18.0 10.1 697,700
Other services 10.1 18.1 17.1 10.9 1,153,800Source: WTO.
(%, US$ million)20052002 2003 2004
3
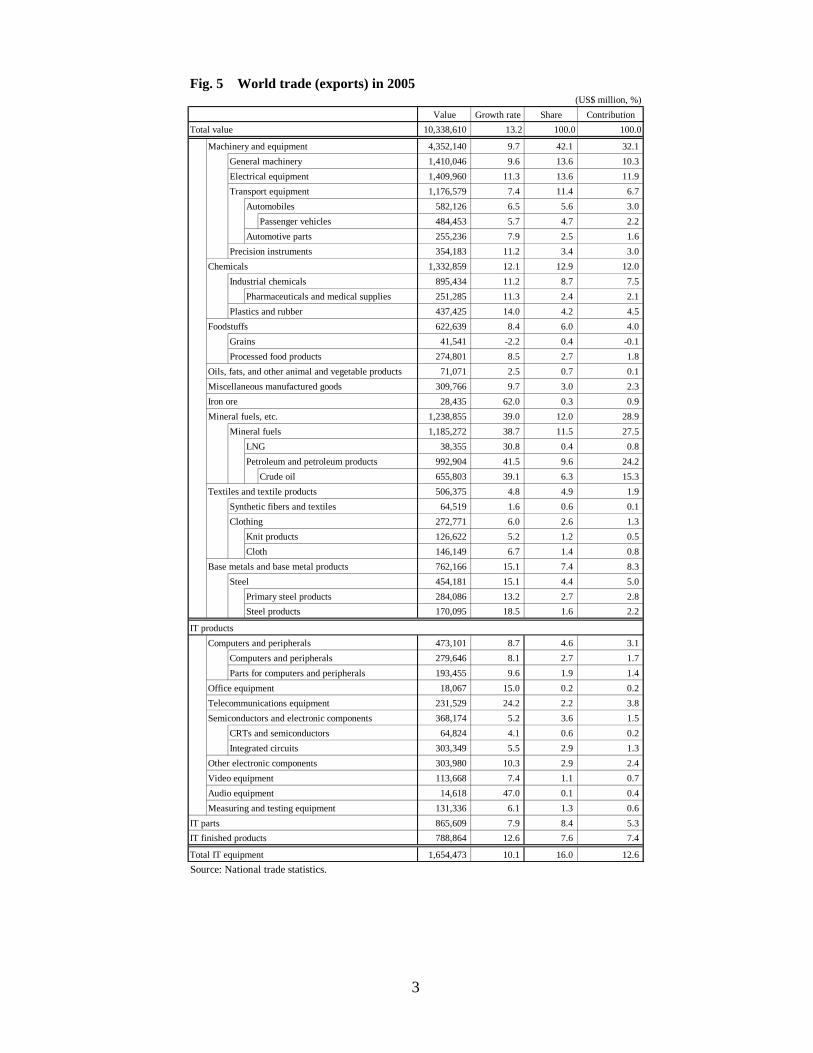
Fig. 5 World trade (exports) in 2005 (US$ million, %)
Value Growth rate Share ContributionTotal value 10,338,610 13.2 100.0 100.0
Machinery and equipment 4,352,140 9.7 42.1 32.1General machinery 1,410,046 9.6 13.6 10.3Electrical equipment 1,409,960 11.3 13.6 11.9Transport equipment 1,176,579 7.4 11.4 6.7
Automobiles 582,126 6.5 5.6 3.0Passenger vehicles 484,453 5.7 4.7 2.2
Automotive parts 255,236 7.9 2.5 1.6Precision instruments 354,183 11.2 3.4 3.0
Chemicals 1,332,859 12.1 12.9 12.0Industrial chemicals 895,434 11.2 8.7 7.5
Pharmaceuticals and medical supplies 251,285 11.3 2.4 2.1Plastics and rubber 437,425 14.0 4.2 4.5
Foodstuffs 622,639 8.4 6.0 4.0Grains 41,541 -2.2 0.4 -0.1Processed food products 274,801 8.5 2.7 1.8
Oils, fats, and other animal and vegetable products 71,071 2.5 0.7 0.1Miscellaneous manufactured goods 309,766 9.7 3.0 2.3Iron ore 28,435 62.0 0.3 0.9Mineral fuels, etc. 1,238,855 39.0 12.0 28.9
Mineral fuels 1,185,272 38.7 11.5 27.5LNG 38,355 30.8 0.4 0.8Petroleum and petroleum products 992,904 41.5 9.6 24.2
Crude oil 655,803 39.1 6.3 15.3Textiles and textile products 506,375 4.8 4.9 1.9
Synthetic fibers and textiles 64,519 1.6 0.6 0.1Clothing 272,771 6.0 2.6 1.3
Knit products 126,622 5.2 1.2 0.5Cloth 146,149 6.7 1.4 0.8
Base metals and base metal products 762,166 15.1 7.4 8.3Steel 454,181 15.1 4.4 5.0
Primary steel products 284,086 13.2 2.7 2.8Steel products 170,095 18.5 1.6 2.2
IT productsComputers and peripherals 473,101 8.7 4.6 3.1
Computers and peripherals 279,646 8.1 2.7 1.7Parts for computers and peripherals 193,455 9.6 1.9 1.4
Office equipment 18,067 15.0 0.2 0.2Telecommunications equipment 231,529 24.2 2.2 3.8Semiconductors and electronic components 368,174 5.2 3.6 1.5
CRTs and semiconductors 64,824 4.1 0.6 0.2Integrated circuits 303,349 5.5 2.9 1.3
Other electronic components 303,980 10.3 2.9 2.4Video equipment 113,668 7.4 1.1 0.7Audio equipment 14,618 47.0 0.1 0.4Measuring and testing equipment 131,336 6.1 1.3 0.6
865,609 7.9 8.4 5.3788,864 12.6 7.6 7.4
1,654,473 10.1 16.0 12.6Source: National trade statistics.
IT partsIT finished products
Total IT equipment

4
3) FDI Up 23.2% and Cross-Border M&A Jump 84.9%
Global inward direct investment on an international balance of payments basis increased 23.2% to $964.7 billion. Investment in China rose 44.7% to $79.1 billion. Investment in East Asia was up 24.3% to $152.5 billion, or 15.8% of the global total.
Outward direct investment declined 8.2% to $759.6 billion. This decline was due largely to a sharp reduction in U.S. outward investment, the result of U.S. foreign subsidiaries repatriating large amounts of earnings back to the U.S.A. to reduce tax obligations. U.S. corporations’ reinvestment shifted from a $157.3 billion outflow in 2004 to an $11.2 billion inflow in 2005.
Cross-border merger and acquisition transactions increased dramatically by 84.9% to $819.3 billion, led by Europe. Notable were the $80.3 billion restructuring of Royal Dutch Shell and vigorous activity in the electric power, mobile phone and banking sectors. The value of EU25 buyouts increased 130% to $498.3 billion, accounting for 60% of global cross-border M&A.
Fig. 6 FDI of major economies (net flows based on balance of payments) (US$ million, %)
2004 2005 Growth rate Contribution Share 2004 2005 Growth rate Contribution ShareU.S.A. 133,162 109,754 -17.6 -3.0 11.4 244,128 9,072 -96.3 -28.4 1.2Canada 1,533 33,822 2105.7 4.1 3.5 43,254 34,083 -21.2 -1.1 4.5EU25 308,897 493,175 59.7 23.5 51.1 379,300 575,297 51.7 23.7 75.7EU15 280,469 458,487 63.5 22.7 47.5 374,719 569,430 52.0 23.5 75.0
Luxembourg 77,215 70,638 -8.5 -0.8 7.3 81,664 80,703 -1.2 -0.1 10.6France 54,095 76,104 40.7 2.8 7.9 18,297 50,185 174.3 3.9 6.6Germany -15,114 32,662 n.a. 6.1 3.4 1,883 45,633 2323.6 5.3 6.0Italy 16,815 19,921 18.5 0.4 2.1 19,262 41,754 116.8 2.7 5.5Netherlands 442 44,277 9916.6 5.6 4.6 17,282 120,830 599.2 12.5 15.9Spain 24,761 22,987 -7.2 -0.2 2.4 60,532 38,772 -35.9 -2.6 5.1Sweden 12,609 13,389 6.2 0.1 1.4 20,985 25,938 23.6 0.6 3.4UK 77,659 159,501 105.4 10.5 16.5 98,559 102,799 4.3 0.5 13.5
10 new EU members 28,429 34,687 22.0 0.8 3.6 4,581 5,867 28.1 0.2 0.8Czech 4,974 10,991 121.0 0.8 1.1 1,014 856 -15.6 0.0 0.1Hungary 4,661 6,485 39.1 0.2 0.7 1,111 1,282 15.5 0.0 0.2Poland 12,873 8,241 -36.0 -0.6 0.9 794 1,525 92.1 0.1 0.2
Australia 42,022 -36,903 n.a. -10.1 n.a. 17,483 -39,889 n.a. -6.9 n.a.Japan 7,809 3,223 -58.7 -0.6 0.3 30,968 45,461 46.8 1.8 6.0East Asia 122,685 152,452 24.3 3.8 15.8 70,611 63,165 -10.5 -0.9 8.3
China 54,936 79,127 44.0 3.1 8.2 1,805 11,306 526.4 1.1 1.5Asian NIEs 60,000 61,952 3.3 0.2 6.4 66,041 48,442 -26.6 -2.1 6.4 Rep. of Korea 9,246 4,339 -53.1 -0.6 0.4 4,658 4,312 -7.4 0.0 0.6 Taiwan 1,898 1,625 -14.4 0.0 0.2 7,145 6,028 -15.6 -0.1 0.8 Hong Kong 34,036 35,905 5.5 0.2 3.7 45,726 32,582 -28.7 -1.6 4.3 Singapore 14,820 20,083 35.5 0.7 2.1 8,512 5,519 -35.2 -0.4 0.7ASEAN4 7,749 11,374 46.8 0.5 1.2 2,765 3,417 23.6 0.1 0.4 Thailand 1,414 4,008 183.4 0.3 0.4 125 284 126.9 0.0 0.0 Malaysia 4,624 3,976 -14.0 -0.1 0.4 2,061 2,971 44.2 0.1 0.4 Indonesia 1,023 2,258 120.8 0.2 0.2 n.a. n.a. n.a. n.a. n.a. Philippines 688 1,132 64.5 0.1 0.1 579 162 -72.0 -0.1 0.0
India 5,474 6,598 20.5 0.1 0.7 2,024 1,364 -32.6 -0.1 0.2Latin America (20) 60,658 67,093 10.6 0.8 7.0 16,192 18,068 11.6 0.2 2.4Mexico 18,674 18,055 -3.3 -0.1 1.9 4,432 6,171 39.2 0.2 0.8Brazil 18,146 15,066 -17.0 -0.4 1.6 9,807 2,517 -74.3 -0.9 0.3Argentina 4,274 4,730 10.7 0.1 0.5 442 1,151 160.5 0.1 0.2Colombia 3,117 10,378 232.9 0.9 1.1 142 4,623 3145.6 0.5 0.6Venezuela 1,144 2,957 158.5 0.2 0.3 -158 1,460 n.a. 0.2 0.2Russia 15,444 14,183 -8.2 -0.2 1.5 13,782 12,393 -10.1 -0.2 1.6Turkey 2,837 9,686 241.4 0.9 1.0 859 1,048 22.0 0.0 0.1Israel 1,757 5,585 217.9 0.5 0.6 4,544 2,491 -45.2 -0.2 0.3South Africa 798 6,382 699.8 0.7 0.7 1,350 68 -95.0 -0.2 0.0World 782,839 964,744 23.2 23.2 100.0 827,368 759,643 -8.2 -8.2 100.0Notes: 1. JETRO estimates for the world.2. The ten new EU members are Czech, Hungary, Poland, Slovakia, Slovenia, Estonia, Latvia, Lithuania, Cyprus, and Malta.3. The twenty Central and South American nations are Argentina, Bolivia, Brazil, Chile, Colombia, Costa Rica, Dominica, Ecuador, El Salvador, Honduras, Jamaica, Mexico, Nicaragua, Panama, Paraguay, Peru, Trinidad, Tobago, Uruguay, and Venezuela.Sources: IMF; OECD; UN ECLAC; and national and regional balance of payment statistics.
Inward FDI Outward FDI

5
Fig. 7 World cross-border M&A (by nation) (US$ million)
2003 2004 2005 2003 2004 2005World 331,271 443,012 819,280 331,271 443,012 819,280U.S.A. 72,408 85,143 108,643 91,197 125,039 154,010EU25 147,357 220,990 498,279 146,704 195,655 459,540Japan 12,530 10,252 2,833 7,398 5,989 11,009East Asia 19,691 24,901 48,837 16,329 21,224 35,043China 4,856 8,814 13,720 4,651 2,290 8,516Asian NIEs 12,195 11,603 25,305 7,765 16,078 21,052ASEAN4 2,640 4,484 9,812 3,913 2,856 5,475Note: Data as of July 7, 2006.Source: Thomson Financial.
Sellers Purchasers
Fig. 8 World cross-border M&A (by industry) (US$ million)
2005 2006Total 819,280 415,046Primary industries 134,620 21,602
Petroleum, natural gas (petroleum refining) 118,894 11,149Manufacturing 236,017 96,387Service 448,642 297,057
Power, gas, water 65,278 6,286Transportation 35,577 22,282Telecommunications 71,060 85,222Construction 6,267 19,239Retail 32,271 19,616Real estate leasing, brokerage 54,453 24,678Finance, insurance 102,803 71,089
Banking, bank holding companies 59,531 34,875Investment, security, trust 22,558 14,137Insurance 15,103 17,649
Lodging (including casinos) 7,498 9,920Other services 73,436 38,726
Note: Based on industries of sellers. Data as of July 7, 2006.Source: Thomson Financial.
Fig. 9 Global foreign direct investment and cross-border M&A
0
200
400
600
800
1,000
1,200
1,400
1,600
90 91 92 93 94 95 96 97 98 99 2000 2001 2002 2003 2004 2005
Inward investment
Outward investment
Cross-border M&A
Note: 2005 data on inward investment are JETRO estimates. M&A figures are completed deals.Sources: Prepared from IMF national trade statistics and Thomson Financial data.
(US$ billion)

6
Fig. 10 U.S. outward direct investment
-50
0
50
100
150
200
250
300
99 00 01 02 03 04 05Equity capital Reinvested earningsOther capital Outward direct investment
(US$ billion)
Note: Current pricesSource: Prepared by JETRO from U.S. Department of Commerce data
B. Japanese Economy 1) Exports Rise 5.9% and Imports Jump 14.1%
Japanese exports (customs basis) rose 5.9% to $598.2 billion. Imports rose 14.1% to $518.6 billion. On a volume basis, exports grew 0.8% and imports 2.9%, down sharply from 10.6% and 7.0%, respectively, in 2004. Exports of electronic components to Asian NIEs and ASEAN countries were slowed by efforts to reduce inventory surpluses worldwide in the IT industry. This was offset, however, by healthy exports of automobiles to the United States.
Although the value of crude oil imports rose as prices soared, volume showed little change from the previous year. IT imports from East Asia increased, reflecting growing domestic demand.
Exports to the United States increased 6.4% to $134.9 billion, while imports from the United States rose 3.3% to $64.5 billion. Exports to East Asia rose 5.5% to $279.4 billion, while imports from East Asia were up 11.9% to $219.3 billion. Exports to China rose 8.8% to $80.3 billion, while imports from China climbed 15.8% to $109.1 billion.

7
Fig. 11 Trends in Japanese trade (US$ million, %)
2006Q1 Q2 Q3 Q4 Q1
Exports 565,039 598,215 144,301 147,373 150,649 155,892 151,243YoY change (%) 20.3 5.9 7.0 6.5 6.3 3.9 4.8
Imports 454,669 518,638 121,480 127,887 133,325 135,946 137,887YoY change (%) 19.2 14.1 13.7 16.6 15.8 10.5 13.5
Trade balance 110,370 79,577 22,821 19,486 17,324 19,947 13,356YoY change (%) 22,035 -30,792 -5,164 -9,256 -9,302 -7,070 -9,465
Export volume index 113.4 114.4 107.1 112.6 116.0 121.4 119.2YoY change (%) 10.6 0.8 -2.0 -1.0 0.9 5.1 11.2
Import volume index 114.6 117.9 114.8 116.6 119.1 120.8 121.0YoY change (%) 7.0 2.9 3.1 3.6 4.1 0.7 5.4
Crude oil import price (US$/barrel) 36.4 51.1 40.7 49.7 56.1 57.3 59.5YoY change (%) 24.5 40.5 29.6 42.6 45.9 41.3 46.1
Ratio of oil imports 12.3 15.4 13.0 14.2 17.1 17.1 17.5Ratio of manufactured imports 61.3 58.6 60.8 58.9 57.5 57.2 56.5
Exchange rate (¥/$ avg.) 108.2 110.2 104.5 107.6 111.2 117.3 116.9YoY change (%) 7.2 -1.8 2.6 1.9 -1.2 -9.7 -10.6
Real GDP growth rate 2.3 2.6 1.3 1.3 0.3 1.1 0.8Notes: 1. The base year for volume indices is 2000.2. Exchange rates are the interbank central rate averages for the period.3. Quarterly growth rates are YoY comparisons. 4. Real GDP growth rates per quarter are seasonally adjusted YoY comparisonsSources: Ministry of Finance, Trade Statistics; Cabinet Office, The System of National Accounts ; and Bank of Japan, Economic Statistics Monthly
20052004 2005
Fig. 12 Japan's import/export trends with major trading partners (US$ million, %)
2006Q1 Q2 Q3 Q4 Q1
Value 126,839 134,889 32,776 33,297 33,144 35,672 34,428YoY change 9.9 6.4 7.2 7.4 4.9 5.9 5.0
Value 62,435 64,497 15,312 16,673 16,472 16,041 16,392YoY change 6.4 3.3 2.0 2.8 8.2 0.4 7.1
3.6 2.1 -0.1 1.5 1.7 5.0 9.39.0 1.6 1.3 1.3 7.2 -2.5 0.2
Value 88,903 88,036 22,637 21,629 21,187 22,583 22,627YoY change 18.4 -1.0 -1.1 1.5 0.3 -4.2 0.0
Value 57,796 59,066 15,134 14,870 14,532 14,529 14,864YoY change 16.1 2.2 2.1 7.8 3.6 -4.1 -1.8
7.3 -5.2 -10.3 -6.4 -2.8 -1.5 3.85.0 0.2 -1.7 1.2 2.1 -0.6 1.8
Value 264,762 279,429 66,174 69,456 71,591 72,208 67,928YoY change 25.5 5.5 7.4 5.8 5.5 3.7 2.7
Value 195,919 219,305 52,974 54,499 55,269 56,564 56,789YoY change 21.1 11.9 16.5 15.0 10.9 6.3 7.2
Value 139,490 145,467 35,122 36,366 36,993 36,987 35,258YoY change 26.3 4.3 6.7 5.1 3.7 1.9 0.4
Value 46,600 51,048 12,239 12,749 12,747 13,313 13,867YoY change 20.0 9.5 9.0 9.4 10.8 8.9 13.3
12.5 -5.5 -3.6 -7.5 -8.1 -2.7 5.14.4 5.8 -3.5 -3.0 9.4 18.8 28.8
Value 51,454 53,622 13,066 13,888 13,593 13,075 12,343YoY change 18.9 4.2 8.1 9.9 1.8 -2.2 -5.5
Value 55,091 59,153 14,631 14,725 14,982 14,815 15,285YoY change 15.4 7.4 12.6 11.1 4.9 1.8 4.5
11.3 1.4 -1.0 3.0 1.2 2.5 3.43.1 -1.6 3.7 -0.1 -4.6 -4.4 -1.9
Value 73,818 80,340 17,986 19,202 21,005 22,146 20,327YoY change 29.0 8.8 8.5 4.2 11.5 10.9 13.0
Value 94,227 109,105 26,104 27,025 27,540 28,436 27,638YoY change 25.3 15.8 22.8 20.3 14.5 7.5 5.9
16.5 2.4 -5.0 -4.4 4.7 13.3 19.013.4 11.2 12.0 15.4 10.3 7.5 8.8
Notes: 1. The Asian NIEs are Korea, Taiwan, Hong Kong, and Singapore.2. The ASEAN4 are Indonesia, Thailand, the Philippines, and Malaysia. 3. The figures for the ASEAN10 import and export volume YoY change were used for the ASEAN4. Source: Ministry of Finance, Trade Statistics.
Exports
Imports
Exports
Imports
Export volume YoY changeImport volume YoY change
Export volume YoY change*Import volume YoY change*
Export volume YoY changeImport volume YoY change
Exports
Imports
Exports
Imports
Exports
Imports
Exports
Imports
U.S.A.
EU25
Export volume YoY changeImport volume YoY change
2005 2005
China
Asian NIEs
ASEAN4
2004
East Asia9
Export volume YoY changeImport volume YoY change

8
Fig. 13 Japanese exports by product (2005) (US$ million, %)
Value YoY Value YoY Value YoY Value YoY Value YoY Value YoY Total value 598,215 5.9 134,889 6.4 88,036 -1.0 80,340 8.8 145,467 4.3 53,622 4.2Foodstuffs 2,894 10.6 510 12.6 111 -2.0 353 19.9 1,401 10.3 216 30.4Raw materials 6,757 15.5 329 7.7 484 -1.1 2,711 33.7 2,249 8.5 562 4.9Mineral fuels 4,243 97.8 660 99.7 398 433.5 1,216 97.4 1,094 69.1 133 -36.4Chemicals 53,273 10.4 6,931 -0.1 6,537 2.3 10,466 14.3 20,286 16.1 4,843 7.7Basic manufactures 67,432 11.7 7,862 6.8 5,348 6.4 13,246 10.2 20,174 10.6 10,375 16.5Iron and steel 27,724 19.1 1,626 34.6 668 12.2 5,649 15.7 9,489 11.7 5,707 29.7General machinery 121,776 4.6 30,433 8.1 21,940 5.6 17,080 0.3 25,411 -4.8 12,272 10.0Electrical equipment 132,459 -0.2 23,547 0.9 20,716 -6.9 20,780 7.2 41,676 -3.2 14,415 -1.9Transportation equipment 138,524 6.3 49,803 8.4 21,857 -7.8 4,040 -3.4 8,206 17.2 6,063 -2.8Automobiles 90,467 6.3 36,209 9.2 14,909 -9.1 1,291 -21.4 2,643 11.4 2,373 -11.4Other 70,858 6.9 14,813 5.7 10,645 5.5 10,447 14.7 24,971 8.3 4,743 -6.0Source: Ministry of Finance, Trade Statistics.
Asian NIEs ASEAN4World U.S.A. EU25 China
Fig. 14 Japanese imports by product (2005)
(US$ million, %)
Value YoY Value YoY Value YoY Value YoY Value YoY Value YoY Total value 518,638 14.1 64,497 3.3 59,066 2.2 109,105 15.8 51,048 9.5 59,153 7.4Foodstuffs 50,710 3.5 13,377 3.5 5,558 -2.4 7,903 6.8 2,699 -7.0 4,342 5.7Raw materials 31,945 12.4 3,578 -4.2 2,052 2.3 1,688 9.0 997 13.4 5,672 18.9Mineral fuels 132,204 34.0 1,218 -17.8 141 6.1 3,301 1.8 3,674 9.5 15,938 19.2Chemicals 39,445 11.9 8,087 3.7 14,252 6.4 4,281 40.8 4,769 21.6 2,416 19.5Basic manufactured goods 49,437 10.1 3,643 9.5 5,322 1.5 13,190 18.3 6,666 23.5 6,105 1.9General machinery 51,661 8.1 10,240 1.3 7,300 6.9 18,696 23.6 7,955 -3.2 5,388 -5.7Electrical equipment 67,395 6.5 10,526 0.4 5,722 1.3 20,851 18.8 14,875 4.4 12,941 -1.2Transportation equipment 18,778 5.7 5,658 7.2 8,207 -2.0 1,575 23.3 781 6.5 749 10.5Other 77,061 10.7 8,172 11.9 10,511 0.4 37,620 11.0 8,633 24.2 5,603 5.0Source: Ministry of Finance, Trade Statistics.
Asian NIEs ASEAN4World U.S.A. EU25 China
2) Outward FDI Reaches 15-Year High Japan’s outward foreign direct investment (balance of payments basis) rose 46.8% to $45.5 billion, the highest level since the early ‘90s. Manufacturing investment accounted for more than half at $26.1 billion.
Strong sales of autos in the U.S. drove increased investment in the automotive sector. Investment was also active in East Asia, fueled by expectations of further market expansion. In the financial and insurance sector, direct investment was up 53.4% to $16.2 billion, of which 61.1%, or $12.1 billion, was invested in the United States.

9
Fig. 15 Trends in Japanese FDI (based on balance of payments)
0
10,000
20,000
30,000
40,000
50,000
85 86 87 88 89 90 91 92 93 94 95 96 97 98 99 00 01 02 03 04 05
(US$ million)
Notes: These data lack strict continuity due to differences in yen-dollar exchange rate calculation methods, changing definitions of direct investment, andother factors. For 1985-1994, dollar-denominated published values were used. For 1995-2004, yen-denominated published values were converted to dollarsfor each six month period using the average Bank of Japan interbank rate for the period. For 2005, the conversions were calculated on a quarterly basis.Sources: Ministry of Finance, Balance of Payments Statistics ; Bank of Japan, Foreign Exchange Rates ; and others.
Returned to this level for first time in 15 years
Fig. 16 Japan's outward FDI, by industry (balance of payments, net and flow)
(US$ million, %)
Share26,146 57.5
Foodstuffs 1,685 3.7Chemicals and pharmaceuticals 3,363 7.4Petroleum 531 1.2Ferrous and non-ferrous metals 1,331 2.9General machinery 1,296 2.9Electrical machinery 4,377 9.6Transportation equipment 8,611 18.9Precision machinery 1,419 3.1
19,315 42.5Mining 1,372 3.0Construction 148 0.3Transportation 824 1.8Communications 1,712 3.8Wholesale and retail 4,623 10.2Financial, insurance 9,227 20.3Real estate -851 n.a.Services 1,086 2.4
45,461 100.0
Non-manufacturing
Total
Manufacturing
Sources: Ministry of Finance, Balance of PaymentsStatistics ; and Bank of Japan, Foreign Exchange Rates.
Notes: 1. Yen amounts converted to U.S. dollars using Bankof Japan average interbank rate for each period.2. “-” indicates net outflow.
2005

10
Fig. 17 Japan's outward FDI, by country/region (balance of payments, net and flow)
(US$ million, %)
Share Growth rateAsia 10,552 16188 35.6 53.4
China 5,868 6575 14.5 12.0ASEAN4 2,546 4276 9.4 67.9 Thailand 1,874 2125 4.7 13.4 Indonesia 503 1185 2.6 135.7Hong Kong 488 1782 3.9 265.1ROK 771 1736 3.8 125.0India 139 266 0.6 91.6
North America 7,570 13168 29.0 73.9U.S.A. 7,527 12126 26.7 61.1
Central and South America 3,138 6402 14.1 104.0Brazil -66 953 2.1 n.a.Cayman Islands 2,748 3915 8.6 42.4
Oceania 1,862 943 2.1 -49.3Western Europe 7,088 7509 16.5 5.9Eastern Europe, Russia, etc. 437 721 1.6 65.0Middle East -62 542 1.2 n.a.Africa 381 25 0.1 -93.5World 30,968 45461 100.0 46.8
EU 7,334 7872 17.3 7.3For reference:
Notes: 1. For 2004, yen-denominated published values were converted to dollarsfor each six month period using the average Bank of Japan interbank rate for theperiod; for 2005, the conversions were calculated on a quarterly basis.
5. “World” includes countries not included in the regional classifications; thattotal is therefore not necessarily equal to the sum of the regional subtotals.
20052004
Sources: Ministry of Finance, Balance of Payments Statistics ; and Bank of Japan,Foreign Exchange Rates .
3. Growth rates are YoY comparisons.4. From the second quarter of 2004, the EU data include 10 new member states.
2. “-” indicates a net outflow.
Fig. 18 Foreign investment by major Japanese auto makers (announcements since January 2005)
Company Region When announced Amount invested(approximate)
February 2006 US$950 million Expanding SUV production facilities with second Canadian plant; annual output of 150,000 vehicles.
May 2005 US$120 million Expanding automatic transmission production capacity at its West Virginia, U.S.A., plant
China October 2005 US$52.99 million Adding a new production line at Guangqi Toyota Engine, increasing engine manufacturing capacity to 500,000 engines annually
ASEAN April 2005 US$41 billion Expanding manufacturing capacity of Toyota Motor Thailand, its auto manufacturing and sales company in Thailand
April 2005 ¥27 billion Beginning production of a new pickup truck and IMV series SUV in South Africa
April 2005 ¥15 billion Decision to build a new plant in St. Petersburg, its first in Russia
May 2005 US$100 million Building a new transmission plant in the state of Georgia, U.S.A.
June 2006 US$550 million Building a four-wheeled-vehicle plant with annual manufacturing capacity of 200,000 vehicles
China October 2005 US$98 million Established a company to manufacture powertrain components in Guangdong; it will produce driveshafts and engine parts, andsupply them to Honda's four-wheeled-vehicle assembly companies in China.
July 2005 ¥4 billion Expanding the manufacturing capacity of its Thai four-wheeled-vehicle manufacturing and sales company's engine plant from150,000 to 300,000 engines annually.
September 2005 US$140 million A third two-wheeled-vehicle plant goes on line in Indonesia; total output of the three plants is 15 million units.
Other November 2005 US$100 million Expanding production facilities at the Sumare, Sao Paolo, Brazil plant, to raise manufacturing capacity to over 80,000 vehicles byearly 2007 and to 100,000 in 2008.
NAFTA September 2005 US$1.3 billion Beginning production of the Bertha, a new compact model, in 2006 at its Mexico plant; annual manufacturing capacity will rise from200,000 vehicles currently to 350,000 vehicles in 2007.
China September 2005 ¥30 billion Expanding automobile production line at its Huadu, Guangdong, plant by 2008, doubling manufacturing capacity to 200,000vehicles.
ASEAN May 2005 ¥50 billion Overall renewal of its Thai production facilities, adding a new pickup truck gearbox assembly line and updating older presses,painting robots and other production equipment for the entire process.
Other April 2006 US$200 million Building a new auto assembly plant in St. Petersburg, Russia, with planned manufacturing capacity of 50,000 vehicles annually.
Sources: Japan Corporate Watcher ; auto manufacturers’ press releases; newspapers; and JETRO Daily.
Nissan
Toyota
Other
NAFTA
Honda
ASEAN
NAFTA

11
3) Inward FDI Remains High Amidst Brisk Capital Outflows
Foreign direct investment (FDI) entering Japan slumped 7.1% to $30.1 billion. Capital outflows increased 9.3% to $26.9 billion, resulting in a net inflow of $3.2 billion. Capital outflows were led by foreign funds that recouped their investments in the restructuring of Japanese firms once these firms had gotten back on track (such as Lone Star Group’s sale of shares in Tokyo Star Bank). Another factor was the withdrawal of foreign firms from the Japanese market, such as GM’s dissolution of its capital tie-up with Fujitsu Heavy Industry and the withdrawal of French retailer Carrefour.
Inward FDI was supported by large investments in the shipping, financial services and retail sectors. Leading examples include Cerberus’ investment in the financial restructuring of the Kokusai Kogyo Group, the incorporation of Deutsche Securities and Wal-Mart’s increased stake in Seiyu. Fig. 19 Japan’s direct inward investment
-40
-30
-20
-10
0
10
20
30
40
50
96 97 98 99 2000 2001 2002 2003 2004 2005
Other capital (outward)Other capital (inward) Reinvested revenues (inward) Equity capital (outward)Equity capital (inward)Total (net)
(US$ billion)
Repatri-ation
(outward)
Invest-ment
(inward)
Note: For 2004, yen-denominated published values were converted to dollars for each six month period using the average Bank of Japaninterbank rate for the period; for 2005, conversions were calculated on a quarterly basis.Sources: Ministry of Finance, Balance of Payments Statistics ; and Bank of Japan, Foreign Exchange Rates .

12
Fig. 20 Japan's inward FDI, by country/region (balance of payments, net and flow)
(US$ million, %)
Share Growth rateAsia 996 1,565 48.5 57.1
China -10 11 0.4 n.a.ASEAN10 394 592 18.4 50.3Singapore 391 598 18.6 53.1Asian NIEs3 621 965 29.9 55.5Hong Kong 298 960 29.8 222.1
North America 2,249 -636 n.a. n.a.U.S.A. 1,370 308 9.6 -77.5Canada 881 -944 n.a. n.a.
Central and South America -1,131 1,278 39.6 n.a.Cayman Islands -771 1,069 33.2 n.a.British Virgin Islands n.a. 205 6.4 n,a.
Oceania -3 -114 n.a. n.a.Western Europe 5,685 1,123 34.8 -80.3
Germany 1,162 237 7.4 -79.6Netherlands 3,670 2,541 78.8 -30.8Belgium -418 -1,188 n.a. n.a.Luxembourg 261 363 11.3 39.2Switzerland 105 -748 n.a. n.a.
Eastern Europe, Russia, etc. -1 0 0.0 n.a.Middle East 3 9 0.3 218.3Africa -13 1 0.0 n.a.World 7,809 3,223 100.0 -58.7
EU 5,557 1,858 57.6 -66.6
Sources: Ministry of Finance, Balance of Payments Statistics; and Bank of Japan,Foreign Exchange Rates .
2005
For reference:
4. From the second quarter of 2004, the EU data include 10 new member states.5. “World” includes countries not included in the regional classifications; that totalis therefore not necessarily equal to the sum of the regional subtotals.
2004
Notes: 1. For 2004, yen-denominated published values were converted to dollars foreach six month period using the average Bank of Japan interbank rate for theperiod; for 2005, the conversions were calculated on a quarterly basis.
3. Growth rates are YoY comparisons.2. “-” indicates a net outflow.
Fig. 21 Japan's inward FDI, by industry (balance of payments basis, net and flow)
(US$ million, %)
Share-2,191 n.a.
Foodstuffs -211 n.a.Textiles 188 5.8Lumber and pulp -22 n.a.Chemicals and phamaceuticals -1,168 n.a.Petroleum -44 n.a.Rubber and leather 1 0.0Glass and ceramics 103 3.2Iron, non-ferrous and metals -34 n.a.General machinery 164 5.1Electric machinery -1,195 n.a.Transportation machinery 32 1.0Precision machinery -59 n.a.
5,414 168.0Farming and forestry -1 n.a.Fisheries and marine products 0 0.0Mining 0 0.0Construction 41 1.3Transportation 2,108 65.4Communications 912 28.3Wholesale and retail 1,157 35.9Finance and insurance 645 20.0Real estate 15 0.5Services 178 5.5
3,223 100.0
Sources: Ministry of Finance, Balance of Payments Statistics;and Bank of Japan, Foreign Exchange Rate s.
Notes: 1.The average Bank of Japan interbank rate for the periodwas used to convert yen amounts to U.S. dollars.2. “-” indicates a net outflow.3. “0” indicates a sum less than US$1 million.
Total
Manufacturing
2005
Non-manufacturing

13
Fig. 22 Buyouts, etc. of foreign ownership in Japanese firms
Industry Industry
January 2005 Asahi Security Co Ltd., Consumer productsand services The Carlyle Group Investment 190 Sold to Toyota Industries Corporation
February 2005 Cable & Wireless IDC Inc Telecommunications Cable and Wireless plc Telecommunications 133 Sold to SoftBankMarch 2005 Carrefour Japan Retail Carrefour Retail 96 Sold to AeonMay 2005 Colin Medical Technology Healthcare The Carlyle Group Investment - Sold to Omron
June 2005 Japan Telecom Telecommunications Ripplewood Holdings LLC(RHJ Holdings) Investment 133 Sold to SoftBank
August 2005 CapGemini Japan Business consultingservices CapGemini Business consulting
services 35 Sold to NTT Data
October 2005 Fuji Heavy Industries Ltd., Automobiles General Motors Corporation Automobiles 654 Sold 8.7% of outstanding shares to Toyota Motor. Acquired 8.0% astreasury stock.
October 2005 Tokyo-Star Bank Banks Lone Star (U.S.) Investment 718 Listing on Tokyo Stock Exchange
November 2005 First Credit Corp Mortgage bankingand loans Lone Star (U.S.) Investment 1,135 Sold to Sumitomo Trust & Banking for US$1,135,420,000.
Taiyo-RyokkaSunpark Sapporo Golf Club
Golf Seiyo
February 2006 Minit Japan Ltd., Consumer productsand services UBS Security brokerage,
dealing and floatations 123 Sold to a group of investors that includes the management team
Shin-Urayasu Oriental Holel Namba Oriental Hotel
Kobe Meriken Park Oriental HotelHakata Nakasu Washington Hotel Plaza
Nara Washington Hotel PlazaHotel Nikko Alivila
March 2006 Suzuki Motor Corporation Automobiles General Motors Corporation Automobiles 1,956 Suzuki acquired 17.4% of outstanding shares as treasury stock.April 2006 Vodafone Japan Telecommunications Vodafone Telecommunications 17,531 Sold to BB Mobile (a SofBank subsidiary).
April 2006 Isuzu Motors Automobiles General Motors Corporation Automobiles 268 Mitsubishi Corporation and Ito Chu each acquired 3.26% ofoutstanding shares.
Sources: Thomson Financial; press releases; newspapers.
Description
February 2006 Goldman Sachs Group Security brokerage,dealing and floatations 400
Date Target Name Acquiror Name US$ million
Golf courses
Hotels
Pacific Gold Management, which operates the golf courses listed on theleft, is listed on the Tokyo Stock ExchangeDecember 2005 Lone Star (U.S.) Investment 380
Japan Hotel and Resort, a REIT with six hotels, including three sold bythe Daiei group as part of its restructuring, via group member TKDevelopment, was listed on the Tokyo Stock Exchange.
C. Counterfeiting
Trade in counterfeit products remained rampant in global markets. Going forward, it will be necessary to prevent the manufacture of counterfeits at the source, including China and other countries, as well as to prevent their export. Europe, North America and Japan must step up border enforcement procedures, as well as enhance the protection of intellectual property through treaties and other cooperation.
1) Counterfeit and Pirated Products Crossing Borders
Customs authorities in Japan, the United States and Europe reported growing volumes of counterfeit products. In Japan, for example, discoveries of contraband by customs authorities rose 47.3% to 13,500 cases. Similar trends were seen in the United States and Europe. The OECD estimated that sales of counterfeit products accounted for 5% to 7% of total world trade. If this estimate is correct, the value of counterfeit trade was a staggering $600 billion in 2005.
China was the top source of contraband entering Japan, the United States and Europe. Chinese customs authorities uncovered exports of contraband in just 1,200 cases, a strong indication that Chinese customs operations must be beefed up. 2) International Cooperation to Strengthen Borders
Japan steadily expanded the range of potential counterfeit products it subjects to border enforcement procedures, both for imports and exports. In the EU, meanwhile, the need arose for penalties and other regulations to be unified across the union’s 25 member countries. China took steps to revise its laws in accordance with the TRIPS Agreement, but enforcement was blatantly inadequate.
Although companies must take resolute steps when their rights are violated, individual companies find it difficult to solve such problems by themselves, which is why a

14
national-level response is imperative. In Japan, joint efforts have included the creation of the International Intellectual Property Protection Forum (IIPPF), which has set up Intellectual Property Research Groups (IPGs) in Beijing, Shanghai and Guangzhou to exchange information on anti-counterfeiting measures and propose improvements in regulatory systems to the government of China.
Developing countries with insufficient oversight functions must work more closely with institutions such as Interpol and the World Customs Organization. The Japanese government has advocated strengthening the TRIPS Agreement, offering proposals to reduce the spread of counterfeit and pirated goods, but the key will be to ensure that multilateral treaties include the countries where counterfeit products are made.
Fig. 23 Counterfeit products seized by customs
2000 2001 2002 2003 2004 2005Japan 1,589 2,812 6,978 7,412 9,143 13,467U.S.A. 3,244 3,586 5,793 6,500 7,255 8,022EU 6,253 5,056 7,557 10,709 22,311 n.a.China 295 330 573 756 1,051 1,210
Note: Data for the U.S.A. are on a fiscal year basis. For Japan, the U.S.A. and the EU,figures are cases of imports seized; for China, most were exports.Sources: National customs statistics.
(number of cases)
D. WTO and Free Trade Agreements 1) New WTO Round Gridlocked
The Doha Round held in Qatar in late 2001 had hoped to negotiate a new world trade agreement. Some major member states, however, remained opposed to clauses concerning basic modalities for non-agriculture market access (NAMA) that would eliminate tariffs on agricultural and non-agricultural products. The biggest problems were:
• negotiations on market access for agricultural products (including eliminating tariffs
and product classifications), with the EU and the G10 (a group of agricultural product importers including Japan) the main obstacle,
• domestic agricultural subsidies, with the U.S.A. the main obstacle, and • NAMA, opposed by developing countries such as India and Brazil. The result has been a three-way impasse. An unofficial cabinet-level meeting on July 23, 2006 was unable to break this impasse.
WTO Director General Pascal Lamy expressed the opinion that an agreement is not pending, and that preparations for a new round remain frozen. Moreover, the likelihood of further delays is increasing as the expiration of the U.S. Trade Promotion Authority (TPA) in July 2007 approaches.

15
Fig. 24 Gridlock over agrimarket access, subsidies and NAMA
Source: Ministry of Economy, Trade and Industry.
Agricultural marketaccess
Domesticagricultural subsidies
NAMA
Defense: EU, G10, IndiaOffense: Exporting nations
Defense: Developing nationsOffense: Adv. industrial nations
Defense: U.S.A.Offense: Others
2) China’s Compliance with WTO
Since joining the WTO in 2001, China has made progress in reducing its customs duties
from 13.6% at the time of joining to 9.9% in 2006, and in the creation of a legal framework for trading rights, investment and services. However, according to Japanese firms doing business in China, there have been many cases in which the new legal frameworks have not been implemented thoroughly, or even applied:
Transparency: When permissions are requested, government replies are based on undisclosed regulations.
Inconsistencies between national and local governments: Applications made to local governments to do business are rejected, even when legal procedures are followed under the guidance of lawyers, because the local governments claim to be awaiting word from the central government.
Arbitrary interpretation of laws: Products for which there are no domestic suppliers are subject to anti-dumping investigations.
There have also been cases in which restrictive measures were introduced as a matter of
national government policy. For example, under the Law Concerning Management of Imports of Specialized Automotive Parts for Finished Automobiles, announced in 2005, if the total value of imported parts reaches 60% of the price of the finished vehicle, a 25% duty for a finished automobile is applied instead of a 10% customs duty on the imported parts. As a de facto demand for local content, this law may be in violation of the Trade Related Investment Measures (TRIM) agreement.
Joint public-private missions have sought improvements in these areas, with both the government of Japan and Japanese firms thoroughly familiar with WTO agreements drawing attention to the issue of China’s compliance. When confronting shared problems, Japan must cooperate with Europe and the United States in forcefully presenting its case to China.

16
Fig. 25 Laws China introduced or revised after joining WTO
Commitments New/revised laws StatusTrade rights Revision of the Foreign Trade Law In complianceAnti-dumping andcountervailing duties
Anti-dumping and countervailing duty regulations, and detailed rules ofenforcement In compliance
Safeguards Safeguard mechanism regulations and detailed rules for enforcement In compliance
Trade-related investment
Revision of the Foreign Corporation Law, Law on Chinese/Foreign JointVentures and Law on Chinese/Foreign Invested BusinessesLaw on Foreign Investment in Wholesaling and Retailing and detailedrules for enforcement
In compliance
Intellectual propertyPatent Law, Trademark Law, Copyright Law, Law Countering UnfairCompetition, Integrated Circuit Design Protection Regulations, ComputerSoftware Protection Regulation, and other laws covering procedures
In compliance
Government procurement Government Procurement Law of the People's Republic of China In compliance
Automobiles Revision of Automotive Industry Development Policies and introduction ofAuto Import Approval System and Automobile Brand Marketing Law In compliance
Pharmaceuticals Imported Pharmaceuticals Law and others In compliance
Retailing Law on Foreign Investment in Wholesaling and Retailing and detailedrules of enforcement In compliance
Logistics Rules for Foreign Investment in Land Transport and Law on ForeignInvestment in International Shipping Agencies In compliance
TelecommunicationsRevision of Rules for Foreign Investment in TelecommunicationsCompanies, Classification of Telecommunications Businesses, and Rulesfor Internet Information Services
Not yet
FinanceRevision of the People's Bank of China Law and People's Republic ofChina Commercial Banking Law, China Banking Regulatory Law, andothers.
In compliance
Construction Rules for Foreign Investment in Construction Companies In compliance
Source: METI, 2006 Report on Unfair Trade Policies; and Beijing Chamber of Commerce, China's Economy after WTO Accession.
Comprehensive
Industry-specific
Note: “In compliance” means China has introduced adequate legislation to meet this commitment; “Not yet” means some rules for enforcementhave yet to be put in place.
3) Japan and Developing Asia: FTA and EPA Trends
According to JETRO statistics compiled from WTO reports, 148 free trade agreements (FTAs) had been concluded worldwide as of June 15, 2006. In East Asia, many FTAs are now being negotiated, a trend suggesting that many new agreements will be introduced in the foreseeable future:
Agreements in effect, or finalized China: Agreement on Trade in Goods in effect since July 2005. FTA with Chile
scheduled to go into effect in mid-2006. Republic of Korea: Signed FTA with European Free Trade Association (EFTA), and
Framework Agreement and Agreement on Trade in Goods with ASEAN, both in December 2005. FTA with Singapore in effect since March 2006.
Singapore: FTAs with Jordan and India in effect, both since August 2005. Trans-Pacific FTA with New Zealand, Chile and Brunei, signed and awaiting ratification. FTA with Panama signed in March 2006. Negotiations with Qatar completed.
Thailand: FTA with New Zealand in effect since July 2005.
Agreements under negotiation China: Australia, New Zealand and Gulf Cooperation Council. ROK: Japan, Canada, India, the U.S.A. and EU (preliminary talks). Thailand: India (advanced stage), and U.S.A. and EFTA.

17
Singapore: Kuwait and Pakistan. ASEAN: Japan, India, Australia, New Zealand, the U.S.A. (Trade and Investment
Framework Agreement) and EU (research committee). Malaysia: U.S.A.
The EPA between Japan and Malaysia effective from July 13, 2006 represented Japan’s
third EPA, following agreements with Singapore and Mexico. After first concentrating on East Asia, Japan has expanded its scope to include Chile, the Gulf Cooperation Council, India, Australia and Switzerland. The main objectives include expanded business opportunities and ensuring stable supplies of resources. Agreements with India and Australia are, like agreements with ASEAN, the ROK and other East Asian partners, seen as steps toward concluding EPAs throughout Asia. Countries and regions with which Japan has concluded, is negotiating or is considering an EPA account for 32% of the country’s total trade.
Cooperative bodies taking shape throughout East Asia are expected to further the movement toward EPAs in the region. At the ASEAN Plus Three Summit in December 2005, the participants reaffirmed their conviction that the ASEAN Plus Three process would be the main vehicle for achieving an East Asian community, and they announced their intention to set forth the future direction of cooperation and East Asia community building. They also agreed to speed up implementation of the East Asia Study Group’s proposed measures for facilitating FTAs. In addition, during the first East Asia Summit, which took place two days later, representatives from the ASEAN Plus Three nations, joined by counterparts from Australia, New Zealand and India, announced their belief that the summit, chaired annually by ASEAN participants, will have a key role to play in the years to come.
Fig. 26 FTAs and EPAs in Asia (as of August 1, 2006)
Country/region In Effect Signed Basic Agreement Under Negotiation
Japan Singapore, Mexico,Malaysia
Philippines,Thailand
ROK (interrupted), ASEAN, Indonesia,Chile, GCC, Brunei
China Hong Kong, Macao,ASEAN Chile New Zealand, Australia, GCC
Rep. of Korea Chile, Singapore,ASEAN EFTA Japan (interrupted), Canada, India, U.S.A.
Hong Kong China New ZealandMacao ChinaTaiwan Panama, Guatemala NicaraguaASEAN AFTA, China, Korea Japan, India, Australia, New Zealand
SingaporeNew Zealand, Japan,
EFTA, Australia, U.S.,Jordan, India, Korea
Trans-Pacific (New Zealand,Chile, Brunei), Panama Qatar Canada (interrupted), Mexico (interrupted,
Kuwait, Pakistan
Thailand Australia, NewZealand
Bahrain (framework), Peru(framework), India
(framework), BIMST-EC(framework), (Bangladesh,India, Myanmar, Sri Lanka,
Nepal, Bhutan)
Japan U.S.A., EFTA
Malaysia Japan New Zealand, Australia, Pakistan, U.S.A.Indonesia Japan
Philippines Japan
Brunei Trans-Pacific (Singapore, NewZealand, Chile, Brunei) Japan
India Sri Lanka, Thailand,Singapore, SAFTA BIMST-EC
Australia U.S.A. Malaysia, China, ASEAN
New Zealand Australia Hong Kong, Malaysia, China, ASEANSources: JETRO, Overview of Major Japanese and Worldwide FTAs ; press reports; and other materials.

18
2. Opportunities in Emerging Economies A. Growth of Emerging Economies
Throughout the 1990s, industrialized nations powered global sales of consumer products such as automobiles and mobile phones. Since 2000, however, demand has also been growing in emerging economies such as Brazil, India and Russia, as well as East Asia. For example, global sales of four-wheeled vehicles rose by about seven million between 1999 and 2004, with China accounting for half and India more than 7%. Mexico, Thailand and other emerging economies have also contributed to rising sales of automobiles. Going forward, emerging economies such as Turkey, Thailand, Mexico and Indonesia, as well as the BRICs, are expected to fuel further demand for automobiles and mobile phones.
Among the emerging economies, India had the lowest rates of penetration for major consumer goods such as automobiles and televisions; per 100 persons, the rates included TVs–8.4, PCs–1.2 and mobile phones–4.4. Equivalent figures for China were 38.2, 4.1 and 25.8, respectively.
Fig. 27 Contributions to global market expansion
(%)
1 China 45.9 Indonesia 34.7 China 24.1 China 23.1 U.S.A. 21.62 Iran 7.9 India 26.7 U.S.A. 12.3 U.S.A. 7.6 China 9.83 India 7.4 Thailand 15.7 Japan 11.7 Russia 5.8 Japan 8.64 UK 6.7 Vietnam 11.1 Germany 7.4 Brazil 4.0 UK 4.75 Mexico 5.9 U.S.A. 8.9 ROK 3.2 Germany 3.8 ROK 4.66 Thailand 5.8 China 8.8 France 3.2 India 3.6 Germany 4.17 Russia 5.6 Brazil 5.5 UK 3.1 Japan 2.7 France 3.68 Indonesia 5.5 Philippines 2.1 Italy 2.7 UK 2.7 Russia 3.59 Turkey 5.0 Pakistan 1.5 Taiwan 2.5 Italy 2.6 Brazil 3.5
10 Brazil 4.6 Mexico 1.1 Australia 1.9 Mexico 2.4 Canada 3.011 Malaysia 2.8 Canada 0.3 India 1.9 Philippines 2.4 India 2.512 Australia 2.4 Colombia 0.3 Spain 1.8 Indonesia 2.2 Taiwan 2.013 South Africa 2.2 Bangladesh 0.3 Brazil 1.8 Turkey 2.1 Saudi Arabia 1.914 Ukraine 2.2 Peru 0.2 Russia 1.7 Thailand 2.0 Italy 1.915 Spain 2.0 Sri Lanka 0.2 Singapore 1.7 Spain 1.9 Mexico 1.8
Electronicsunit sales, 1999-2004 unit sales, 1999-2004
4-wheeled vehicles 2-wheeled vehicles
Notes: 1. Figures indicate share of growth.2. 2005 figures for electronics are estimates by Reed Electronics Research. Sources: Euromonitor; FOURIN, Global Automotive Manufacturers Yearbook, 2004 and 2005; Honda; Reed Electronics Research; and ITU.
Mobile phones Personal computers1999-2004 totalsubscribers, 1999-2004demand (nominal $), 2002-2005
Ranking
Fig. 28 Spread of products and services in major emerging markets
Autos Televisions PCs Mobile phones Internet AccessPersons per
autoTVs per 100
personsPCs per 100
personsSubscribers per
100 personsUsers per 100
personsPersons Units Units Persons Persons
2003 2003 2004 2004 2004China 54.7 38.2 4.1 25.8 7.2India 99.6 8.4 1.2 4.4 3.2Russia 5.0 34.6 13.2 51.6 11.1Indonesia 35.1 15.2 1.4 13.5 6.5South Korea 3.3 45.9 54.5 76.1 65.7Brazil 8.6 36.8 10.7 36.3 12.2Iran 16.3 17.4 10.5 6.2 7.9Thailand n.a. 29.0 6.0 44.2 11.3Turkey 11.1 54.2 5.1 48.0 14.1Mexico n.a. 28.3 10.7 36.6 13.4Taiwan 3.7 44.1 52.8 100.3 53.8South Africa 7.4 19.7 8.3 43.1 7.9Pakistan n.a. 8.2 - 3.3 1.3Ukraine 7.4 36.0 2.8 28.5 7.8Philippines n.a. 19.2 4.5 39.9 5.3Vietnam 189.7 20.9 1.3 6.0 7.1Argentina 6.6 32.8 8.0 35.4 16.1Bangladesh n.a. 7.3 1.2 2.0 0.2Saudi Arabia 3.4 28.2 34.0 36.8 6.4Poland 2.9 22.9 19.1 59.9 23.4Malaysia 3.8 21.8 19.2 57.1 38.6Reference: U.S.A. 1.3 95.0 76.2 62.1 63.0 Japan 1.7 84.3 54.2 71.6 50.2Sources: ITU; ITU Association of Japan; FOURIN, and Global Automotive Manufacturers Yearbook, 2005 .

19
B. Western and ROK Firms in India
India, the world’s second largest nation in terms of population, has been attracting increasing interest from a long-term perspective. As income levels rise in step with economic growth, the middle class and its purchasing power will expand accordingly, particularly in the cities. Business opportunities in India are also on the rise thanks to deregulation. Marketing and distribution infrastructure, however, remain underdeveloped, and the many linguistic and cultural differences between regions present unique marketing challenges.
How large is the middle class? According to India’s National Council for Applied Economic Research, as of 2001 households with annual incomes of $3,775 or more, the highest income bracket, accounted for 14.1 million, or 7.3% of India’s 193.6 million households in 2001.
Several foreign companies that have entered the Indian market have overcome challenges by using key strategies:
• Eli Lilly utilizes the sales network of a partner company. • Unilever has used saleswomen to increase sales in less urbanized regions. • LG Electronics advertises at sporting events and offers products well suited to local
needs. Fig. 29 Indian market entry: Western and ROK companies
Company Industry Entry Overview
Eli Lilly(U.S.A.) Pharmaceuticals 1993
• Established a joint venture named Eli Lilly Ranbaxy, emphasizing the firm's foreign connections to capitalize on the local image thatimported medications offer high quality.• Used Ranbaxy route to full extent, securing all necessary licenses from government to build a strong sales network.• Secured superior personnel, gave sales staff swift promotions and adapted U.S. parent's trainng program to local conditions.• Focused on niche treatments and introduced low-risk products. Manufactured medications locally, but did not follow mass-production, low-price strategy, instead using international prices as criterion. Did not introduce products vulnerable to patent violations to the Indian market.• Basically introduced pharmaceuticals in areas other firms would have difficulty entering. Divided product line into two groups:pharmaceuticals for which patents had expired but Eli Lilly had added unique value, and patent-protected pharmaceuticals in areas difficultto enter for other firms.• Sales calls to physicians emphasized the provision of added-value information about the drugs.
Unilever (UK) Toiletries 1931
• Launched the Project Shanty marketing program in 2000, under which women are appointed "entrepreneurs" to sell in designatedterritories. Remuneration can be paid to individuals, or groups, and low-interest financing is provided to help sales people start their ownbusinesses.• Products are made available in small sizes to make them affordable for low-income customers, yet sales margins are higher than for largesizes.• Trains female specialists in health and hygiene as a social contribution, and to improve its reputation.
LucentTechnologies
(U.S.A.)
Communi-cations
equipment
Latter half of1980s (as
AT&Toffice)
• In 1992, AT&T established a joint venture with Tata Telecom, a giant industrial group, and in 1994 it tied up with the Birla Group andsecured permission to offer mobile phone services in western India. Lucent Technologies, after being spun off from AT&T in 1998, acquiredin 1999 a majority share of Tata Lucent Technologies and renamed it Lucent Technologies Hindustan. Four of the five private-sector telecomoperators are now customersof Lucent's switching and transmission products. Lucent has a 35% share of the cable market.
Hyundai Motor(ROK) Automobiles
• Under decisive, top-down decision making it has invested more in production capacity than rivals, and now reaps the benefits of massproduction.• Working closely with the Indian government, it won approval to set up a wholly owned subsidiary and, by bringing its affiliated autopartsmakers along with it into the Indian market, can now battle local automaker Tata for second place in market share.
LG Electronics(ROK)
White goods andconsumerelectronics
Latter half of1990s
• Has improved its name recognition by sponsoring cricket matches and other events.• Has built up a sales network throughout India.• Carefully picks products that suit local needs.• Assigns corporate vice presidents to serve as presidents of the Indian operation, ensuring speedy decisions and demonstrating localcommitment.
Source: JETRO.

20
C. ROK Firms in China and Brazil
Companies from the Republic of Korea have been boosting investments in China at a dazzling rate, while also increasing substantially their investments in other developing countries. A distinctive feature of their common strategy has been to make bold investments at the start and get their businesses up and running in a short time, thanks to top-down decision making.
ROK companies that sell consumer goods have successfully targeted both the high-end and high-volume market segments. They also differentiate themselves by introducing products with specifications suited to local needs, and emphasize their local commitment through advertising and other image-enhancement efforts.
In China, Hyundai Motor outstripped Guangzhou Honda and other Japanese-affiliated manufacturers to achieve the fourth largest share of the automobile market in 2005. In India, its presence has grown so significantly that it is now competing with local carmaker Tata Motors for the second largest market share. Another ROK firm, LG Electronics, is an especially noteworthy foreign firm in China’s white goods market because it is vying for the top market share. Moreover, rapid decision-making has helped it gain top shares of 20-30% each in India’s air conditioner, refrigerator and washing machine markets. Fig. 30 ROK companies entering the Chinese market
Company Industry Entry Overview
Hyundai Motor Automobiles 2002
• Hyundai Kia Automotive Group has two passenger car joint ventures in China, Beijing Hyundai Motor Companyand Dongfeng Yueda Kia Automobile Company.• Beijing Hyundai is a 50:50 joint venture by Hyundai Motor and Dongfeng Yueda Kia Automobile Company. Salesin 2005 came to 234,000 vehicles, or 7.5% of the market, showing fast growth. It has the fourth largest market share,more than Japanese automakers such as Guangzhou Honda.• Beijing Hyundai succeeded in becoming one of the top manufacturers in a short period of time because it targetedthe demand for taxis in Beijing and offered price-sensitive customers prices 15-20% below those of competitors.
LG Electronics White goods and
consumerelectronics
1993
• LG Electronics has introduced products that suit Chinese consumer preferences, and are localizing humanresources, production, marketing and R&D.• It has enhanced its image through social contributions, such as donating hygienic supplies and equipment to majorhospitals.• It is competiting for top market share in white goods (washing machines, refrigerators, microwave ovens, etc.),making it unique among foreign-affiliated companies.
Source: JETRO. Fig. 31 ROK companies entering the Brazilian market
Company Industry Entry Overview
LGElectronicsand SamsungElectronics
Consumerelectronics
1996 &1995
• LG has production centers in the Manaus Free Trade Zone (ZFM) and in Taubate, Sao Paulo. It producesa broad range of products, including TVs (CRT, LCD, plasma and projection), plasma monitors, DVDplayers, air conditioners, audio equipment, and mobile phones.• Samsung began producing TVs in the ZFM and has expanded to products such as mobile phones, LCDmonitors, and hard disk drives.• Both market through retail chains funded by local capital and targeting middle- to lower-incomecustomers. Payments are usually by installment with zero-interest loans.• Using inexpensive imported components, they have succeeded in keeping their costs below those ofJapanese-affiliated competitors.• In 2005, LG's market share in LCD and plasma TVs equalled that of Philips.• Both LG and Samsung advertise aggressively via magazines, billboards and closed-circuit TV incommercial facilities, airports and other places.• LG installed 200 large-screen plasma TVs in six airports in April 2005.• Both sponsor soccer teams: Samsung the Corinthians and LG the FC Sao Paolo.
Source: JETRO.

21
D. Chinese Firms in Emerging Economies
Chinese firms are moving into emerging economies, particularly those of India, Russia and the ASEAN countries. Their fields include home appliances, motorcycles, telecommunications, personal computers and bicycles. Huawei increased export sales over 40-fold between 1999 and 2004, and its ratio of overseas to total sales rose from more than 40% in 2004 to about 62% in the first half of 2005.
Chinese firms are eager to enter emerging economies because their home market is maturing and competition is intensifying, cutting into profits. Chinese companies also view many emerging economies as being quite similar to China. Moreover, while these companies lack international name recognition, they are competitive in price, which tends to steer them toward developing countries. They generally focus on India and Russia in their planning because both countries lack strong local manufacturers.
A typical approach is to enter a market with low-tech products, then gain market share through low prices and superior after-sales service. They also emphasize brand enhancement, strategic selection of products with short-term return potential and the development of specific countries as potential production bases for exporting to third countries in the future.
Fig. 32 Chinese production and sales in emerging markets
India Russia ASEAN Brazil
Production
• Set up a subsidiary in March2004. Has 7 plants and 100 after-sales service centers and network ofnearly 2,700 salespersons.• Acquired the Tomson R&Dcenter, with over 40 engineers andother technical staff.
• Set up a subsidiary and 3production plants.
• Plants in Vietnam (600,000 colorTVs annually), Indonesia,Philippines and Thailand.• Acquired Tomson's R&D centerin Singapore with over 200engineers and other technicians.
Sales Color TV sales in 2005 topped600,000, or 6% of market.
Color TV sales topped 400,000 in2004, and was estimated at800,000 in 2005, or 10% ofmarket.
• 16% share of color TV market inVietnam in 2004.• Sold 80,000 air conditioners inIndonesia in 2004, or 4% marketshare, and nearly 120,000 units in2005.
Production
• Set up Huawei Telecom.• Founded Huawei TechnologiesIndia, its largest R&D centeroutside China, with over 1,000employees. Cumulative investmentof US$100 million.
• Founded Beto-Huawei, a jointventure with a Russian firm.• Set up an R&D center.
• Subsidiaries, branches orrepresentative offices in Singapore,Malaysia, Thailand, Cambodia,Vietnam, the Philippines andIndonesia, mainly for marketing.• Asia Pacific HQ in Malaysia.
• Huawei Brazil, joint venture witha Brazilian company.• Has about 800 employees inSouth America.• Planning a cell phone factory.
Sales
Supplied US$460 million worth oftelecom equipment to BSNL andMTNL, India's state-ownedtelephone companies.
• Sales topped US$300 million in2003 in former USSR states,making it Huawei's largest overseasmarket at that time.• More than 50% share ofbroadband market.
• 2005 sales estimated at US$600million.• Expected to exceed 50% share ofbroadband and next-generationnetwork components market and30% of mobile products market.
• Expected to double sales fromUS$100 million in 2004 in just oneyear.• Second largest share of broadbandmarket.
Production
• Ranks third, with 7% marketshare.• Business tie-ups with 1,000companies and 33 ThinkWorldshops to handle Think brandproducts exclusively.• In the third quarter of 2005,accounted for 14.8% of businessdesktop PC market and 28.4% ofbusiness notebook market.
Since trade between China andRussia in IT andtelecommunications areas has is notopen, Lenovo has almost nospeciality shops in Russia, whileIBM has a PC division in Russia.
In first quarter of 2005 had 11%market share, replacing HewlettPackard as No. 2.
• 4.8% share of market for businessdesktops and 14.4% for notebooks,ranking 4th in general PCs and 2ndin business PCs (Sept. 2005).• 60% of revenues from well-established customers. Has over 60sales route tie-ups.
Sales
• Plans to enter consumer market in2006, launching sales of Lenovodesktop and notebook PCs.• Plans to begin assemblyoperations, expanding capacity offormer IBM plant from 600,000 toone million PCs annually.
Offering low-priced PCs in effort togain larger share.
• Starting mobile phone sales inThailand, targeting 400,000 to500,000 handsets in 2006, andamong top five in share by 2008.• Moving into Vietnam's mobilephone market, aiming to be fourthlargest maker by 2006.
• Began retailing Lenovo desktopand notebook PCs in first half of2006, targeting small and midsizedfirms.• Targeting 420,000 PCs by 2008,the top share.
Source: Newspaper articles.
TCL
Huawei
Lenovo

22
Fig. 33 Lifan Group's investments and sales in ASEAN countries
Country Investments and Sales
Cambodia Main store, test marketing store and various branches form a growing sales network. Lifanmotorcycle sales reached about US$1 million in 2004.
Laos Lifan motorcycles were imported for the first time in 2000 at a profit of about US$250 per bike. Nowhas an assembly plant, and is also licensing production to a Laotian firm.
Indonesia One of the group's big five markets (along with Iran, Nigeria, the Philippines and Vietnam), salestopped US$10 million in 2005.
Vietnam
Biggest market in ASEAN region. More than 30% market share in 2002. Bought local joint ventureof former Chongqing Huawei Motorcycle Company in 2003 to found Lifan Vietnam MotorbikeManufacture JVC. Annual production capacity is 600,000 motorcycle engines and 200,000completed motorcycles.
Myanmar Alliance of 21 motorcycle companies, led by Lifan Group based in Chongqing, China, formed thefirst alliance to export to Myanmar. Members agreed to adhere strictly to minimum export prices.
Source: Newspaper articles. E. Turkish Firms in Russia
One factor behind the success of Turkish firms in export markets is the powerful international trading networks they have built up over the years. This, as well as geopolitical factors, positions them well to enter neighboring countries, many of which are widely regarded as risky and unimportant consumer markets. Moreover, former socialist states in the region have been receptive to the moderate quality of Turkish products. Accordingly, Turkey has been steadily increasing its share of the home appliance market in Europe. Anticipating increasingly fierce competition from Chinese products, they are also accelerating their efforts to establish manufacturing centers in Russia.
In the beverage segment, another category they view as potentially strategic in developing markets, Turkey’s largest brewery has made notable progress in Russia and other CIS countries. It is now the fourth largest beer producer in Russia, which has become its most important market, representing about 40% of total sales. Turkish glass companies, also investing aggressively in Russia, now meet 20% of the market’s demand for glass bottles. Turkish companies also excel in food distribution and retail (supermarkets), and have swiftly established more than 50 stores in Russia, with 34 in Moscow and an increasing number in regional cities.
Construction, however, has been the mainstay of Turkish international expansion. Between 1972 and 2005, Turkish companies received $47.6 billion in contracts for overseas projects. Libya was traditionally their largest customer, followed by Russia, accounting for $9.5 billion, a 20.0% share. Since the 1990s, however, Russia has become Turkey’s largest customer, thanks to the efforts of the Enka Group.
Fig. 34 Turkish companies in Russian market
Company Industry Entry OverviewVestel (Zorlu Group) Appliances 2003 Built TV plant in 2003, and invested in refrigerator and washing machine plants in 2004.
Arçelik (Koc Group) Appliances 2005 Built washing machine and refrigerator plants. Also bought European companies and brand-namecompanies in Austria and Germany to enter the European market.
Efes Group (AnadoluGroup) Beer 1999
Has five breweries. Between production under license and its own beer production, has 8% market share, orfourth largest. Success factors include its quick identification of consumer shift from hard liquor to beer informer Soviet states, and establishment of licensed-production tie-ups with local breweries.
Şişe-Cam Group GlassTurkey's largest glass manufacturer, has invested in Russia's beverage market. Currently supplies about 20%of all glass bottles in Russia, and plans to increase investment 150% over next five years.
Migros Group Retail Turkey's largest supermarket, with 720 stores. Working with Turkish construction giant ENKA Group, ithas set up 51 stores in Russia, including 32 in Moscow, and is rapidly expanding into other cities.
Source: JETRO.

23
F. Brazilian and Mexican Firms in Latin America
Brazilian foreign direct investment generally concentrates on 1) leveraging expertise in natural resources and extractive industries, 2) strengthening presence in the Americas and 3) building presence in Asian markets.
Ambev, the giant Brazilian beverage company, for example, has been moving aggressively to purchase other beverage manufacturers in the Americas. In Latin America, Ambev is the largest beverage company, with a 70% market share for beer and a 17% share for carbonated soft drinks.
Brazilian FDI is usually invested by manufacturers already operating in the host region. Greenfield foreign investments are rare, since most domestic Brazilian firms have low recognition and limited experience overseas. Rather, acquisitions have proven a more effective way to enter foreign markets.
Mexican mobile phone giant América Movil was spun off in 2000 from Telefonos de Mexico, Mexico’s largest telephone company, and is now moving into other Latin American markets at a breathtaking pace. In the five-year period ending in 2005, it added 80 million new subscribers and expanded operations to encompass 14 countries, including the United States, as well as Latin America. As of March 2006, it had 160 million total subscribers. The firm has been aggressively acquiring other mobile phone carriers in Latin America, spending a combined $16 billion on acquisitions and post-acquisition improvements in infrastructure. The drive to acquire foreign firms resulted in foreign operating revenues ($8.6 billion) exceeding domestic Mexican revenues ($8.4 billion) in 2005. Fig. 35 Brazilian companies with overseas bases
Company Industry Bases (incl. sales)in other countries Countries Countries
Petrobras Petroleum, gas 18 18 Angola, Argentina, Bolivia, Chile, Colombia, Dominican Republic, Ecuador,Mexico, Peru, Portugal, U.S.A., United Arab Emirates, Uruguay, Venezuela.
Odebrecht Construction, engineering 14 14 Angola, Argentina, Bolivia, Chile, Colombia, Dominican Republic, Ecuador,Mexico, Peru, Portugal, United Arab Emirates, U.S.A., Uruguay, Venezuela.
Companhia Valedo Rio Doce(CVRD)
Mining 17 16 Angola, Argentina, Australia, Chile, China, France, Gabon, India, Japan,Mongolia, Mozambique, Norway, Peru, South Africa, Switzerland, U.S.A.
Embraer Aircraft manufacturing 5 5 China, France, Portugal, Singapore, U.S.A.
Gerdau Iron and steel 14 7 Canada, Chile, Colombia, Spain, U.S.A., Uruguay, Argentina
WEG Electric motor production 20 19Argentina, Australia, Belgium, Chile, China, Colombia, France, Germany,India, Italy, Japan, Mexico, Netherlands, Portugal, Spain, Sweden, U.S.A.,UK, Venezuela.
Fundição Tupi Metal casting 8 8 Argentina, China, Germany, Italy, Japan, Mexico, UK, U.S.A.
Marcopolo Bus manufacturing 23 23Argentina, Bolivia, Chile, China, Colombia, Costa Rica, Cuba, Ecuador,France, Greece, India, Ireland, Mexico, Panama, Paraguay, Peru, Portugal,Russia, South Africa, UK, United Arab Emirates, Uruguay, Venezuela.
Tigre Plastics, tubes, piping production 12 11 Algeria, Angola, Argentina, Bolivia, Chile, Ecuador, Guatemala, Nigeria,Paraguay, U.S.A., Venezuela.
Andrade Gutierrez Construction, engineering 3 3 Peru, Portugal, U.S.A.Politec Software 2 2 Japan, U.S.A.
Votorantin Cement, paper, valve, finance, etc. 12 11 Australia, Bahamas, Belgium, Bolivia, Canada, Germany, Netherlands Peru, Singapore, U.S.A., UK.
Camargo Correa Construction, engineering 6 6 Argentina, Bolivia, Colombia, Peru, Surinam, Venezuela.
Sadia Foods (meat products) 10 10 Argentina, Chile, Germany, Japan, Russia, Turkey, UK, United Arab Emirates,Uruguay, Venezuela.
Sources: Tendencia (consulting firm) and company websites.

24
Fig. 36 América Movil's network (as of December 2005) (1,000 subscribers)
Country Industrial group Entry Subscribers Marketshare
Nationaltotal
Mexico Telcel - 35,914 75.7% 47,462Guatemala Telgua 2000 1,912 60.3% 3,168Ecuador Conecel 2000 4,100 65.6% 6,246Brazil Telecom Americas 2000 18,659 21.6% 86,210Colombia Comcel 2002 13,775 63.2% 21,800Nicaragua Sercom/Enitel 2002 748 66.8% 1,119El Salvador CTE 2003 859 35.6% 2,412Argentina CTI 2003 6,627 30.0% 22,100Honduras Megatel 2004 427 33.3% 1,282Uruguay CTI 2004 168 28.0% 600Paraguay CTI 2005 172 9.1% 1,887Chile Smartcom 2005 1,884 17.8% 10,570Peru Claro 2005 1,950 34.9% 5,583U.S.A. Tracfone 2000 6,135 3.0% 201,650
- 87,195 36.2% 240,544- 93,330 20.3% 458,794
Sources: América Movil's annual reports and ITU.
Latin America and CaribbeanAmericas, total
G. Japanese Firms Entering Emerging Economies
Japanese corporations have generally been more cautious than Western or ROK firms in entering emerging economies. But some companies have been remarkably proactive, and an examination of their strategies is instructive:
Low-cost products based on market research Sharp, which has the top market shares in the Philippines for compact televisions and single-tub washing machines, saw an opportunity under the ASEAN Free Trade Area (AFTA) agreement to begin incorporating lower-cost parts. This enabled it to undercut prices of competing products made in the ROK. It is now considering adapting this strategy for markets in other developing countries. Small-quantity product sizes are easier for consumers to purchase Hisamitsu Pharmaceutical in Brazil and Ajinomoto in Nigeria have kept prices low by selling products in smaller sizes, which has led to increased sales. Door-to-door sales Yakult, a fermented lactic beverage manufacturer, has increased sales in emerging economies through a home delivery system using saleswomen. Regional marketing through traditional distribution routes Acecook, an instant noodle manufacturer, has garnered a 60% share of the market in Vietnam. It has assigned monitors to each province to assess sales and ensure that products are not sold after their best-buy dates, thus maintaining product quality and strengthening brand image.

25
Fig. 37 Japanese companies in emerging markets
Firm (country) Field Entry Overview
HisamitsuPharmaceutical(Brazil)
Pharmaceuticals 1965
• Because Brazil is so vast, Hisamatsu secures sales channels by partnering with major distributors.• The company's Salonpas brand is well established. Since 2001, the company has sponsored the Salonpas Cupinternational volleyball tournament, which has helped to raise awareness and understanding of medicinal plastersand strengthen ties with major drugstore chains in Sao Paolo.• TV is also used to educate Brazilian consumers about medicinal plasters. In a tie-up with a nationwide varietyshow, a famous personality serving as master of ceremonies uses the product during the show.
Sharp(Philippines) Home appliances
• Partners with mass retailers of home appliances.• Headquarters and local sales departments work to develop high-quality products that suit local markets.Responds swiftly and flexibly to market trends, and provides thorough after-sales service.• Works to increase local content ratio and keep prices down.• Almost all local employees, including factory workers, speak English, which facilitates communication.• Upgrading Sharp brand image by introducing LCD televisions and fully automatic washing machines.
Yakult (various) Beverages 1964-2006
• 20 overseas offices, and sales of Yakult and other fermented lactic acid beverages in 24 countries.• Moved into Taiwan, Brazil and other markets in 1960s, then has focused mainly on emerging markets (ROK,Philippines and Singapore in '70s; Mexico in '80s and Indonesia and Argentina in '90s). Entered Europe andother advanced industrialized countries only from '90s.• Sales in emerging markets accounted for about 16% of total sales in 2005. Top-selling Japanese beverageoverseas (unit sales).• Unique home delivery system using female sales staff called the Yakult Ladies.
Kumon (various) Education 1970s
• Flexible membership fees and other measures used to provide services to as wide a segment of a developingcounty population as possible, not just the high-income segment.• Repeated interviews required before hiring to find people who believe in the Kumon system. Trains instructorscarefully and provides opportunities for additional learning, in part to strengthen shared values.• Emphasizes educational fundamentals of reading, writing, arithmetic, rather than Japanese academic curricula.Programs are readily accepted worldwide.
Mandom(Indonesia) Cosmetics 1969
• Extensive range of hair and scalp products, plus fragrances and makeup.• Sales in Indonesia rose 113% to 904.7 million rupiahs in 2005. Setting income records year after year.• Stresses consumer-driven products priced affordably, then allocates necessary expenses.• 20% of production is for export to over 100 countries.• Product development is based on surveys of Indonesian consumers.• Products are sold in small quantities and containers to keep prices down.• Uses mass media with impact for promotions.• Uses advertising and sales promotions to rollout important new products.
Source: JETRO.

26
3. Japan’s Deepening Business Ties with East Asia A. East Asian Free Trade Zone
Discussion of an East Asian economic community began in earnest at the East Asian
Summit in December 2005. By about 2015, it is anticipated that a framework will have been concluded to encompass the five ASEAN Plus One economic agreements formed with Japan, China, the Republic of Korea, India, Australia and New Zealand.
The nine East Asian economies (ASEAN5, China, Hong Kong, ROK and Taiwan) accounted for a 9.8% share of world GDP (nominal GDP basis), or 22.3% when recalculated in terms of purchasing power parity. Japan remained the largest economy in the region defined as the above nine economies plus Japan and India, accounting for 47.0% of GDP. China accounted for 23.3% and India 7.9%. Regional demand comprised 52.9% personal consumption and 28.2% fixed capital formation. Japan accounted for 50% of personal consumption and almost 40% of fixed capital formation, forming a foundation for the rest of the regional economy.
GDP growth largely consisted of personal consumption (39.6%), capital investment (36.6%) and exports (18.6%), the latter two being relatively large. China contributed significantly to export and capital investment growth, but only modestly to personal consumption growth. Japan, India and the ASEAN5 made relatively strong contributions to personal consumption, while East Asian NIEs’ accounted for large shares of exports and capital investment. B. Increasing Ties with China, India and Beyond 1) Overall Developments
The ratio of intraregional trade (imports) by Japan, China, the Republic of Korea, Taiwan, Hong Kong and the ASEAN5 rose from 52.5% in 1999 to 56.5% in 2005. China’s share rose from 15.6% to 28.2%.
Growth in Chinese foreign trade has been accompanied by a shift in the regions contributing most to exports. Southern China (Fujian, Hunan, Guangdong and Hainan provinces) had been the leading region up to 2005, but then was overtaken by eastern China (Shandong, Zhejiang and Jiangsu provinces). Many Chinese regions export as much as major countries. Eastern China exported more than the ROK, while southern China’s exports were on a par with Singapore’s. Northern China (Hebei, Henan and Shanxi provinces and the Inner Mongolia Autonomous Region) exported more than Thailand. A division of labor continues to develop between Japan, the ROK and Taiwan. The ROK is building the Yellow Sea Economic Zone with northern China, just across the Yellow Sea. Taiwan is building the Straits Zone with southern and eastern China, just across the Straits of Taiwan.
2) Japanese Investment in China
Japanese investment in China, according to Japanese statistics, totaled ¥502.4 billion invested in manufacturing operations from 1990 to 1994. This grew to ¥891.9 billion between 1995 and 1999 and ¥1,101.3 billion between 2000 and 2004. Investment in production for sale within China (such as automobile production) has exceeded production for exports (such as

27
electronic goods) in recent years. Bilateral trade rose from $89.2 billion in 2001 to $189.4 billion in 2005, or more than
double in four years. China accounted for 17.0% of total Japanese foreign trade in 2005, almost equal to that with the United States (17.9%). As trade has grown, so has the Chinese-Japanese division of labor, with machinery accounting for the largest proportion.
Fig. 38 Japanese direct investment in China
0
500
1,000
1,500
2,000
2,500
3,000
19931995
19971999
20012003
2005
(¥ billion)
輸出型
内販型
Notes: Fiscal years to 2004, calendar thereafter. Export fields include electrical and electronic equipment,machinery (general and precision) and textiles. Domestic sales cover all other types.Sources: Ministry of Finance, Outward and Inward Direct Investment ; and Ministry of Finance, TradeStatistics .
For exportsFor domestic salesFor exports
For domestic sales
300
250
200
150
100
50
Fig. 39 Japan's trade with China (%)
Electrical equipment 27.5 Electrical equipment 25.9General machinery 19.5 General machinery 21.2Chemicals 13.1 Chemicals 13.0Metal & metal products 10.7 Metal & metal products 10.6Textiles & textile products 9.7 Precision instruments 5.3Transport equipment 3.9 Transport equipment 5.0Precision instruments 4.0 Textiles & textile products 4.4Non-metal/mineral products 2.0 Non-metal/mineral products 1.0Food 0.5 Food 0.4Other 9.0 Other 13.2Total 100.0 Total 100.0
Textile products 30.3 Machinery & equipment 40.8Machinery & equipment 26.1 Textile products 19.5Food 10.7 Food 7.3Metal & metal products 4.0 Metal & metal products 5.8Mineral fuel 3.9 Chemical products 3.9Chemical products 3.0 Mineral fuel 3.0Raw materials 2.7 Non-metal/mineral products 1.7Non-metal/mineral products 2.0 Raw materials 1.6Other 17.3 Other 16.6Total 100.0 Total 100.0
Source: Ministry of Finance, Trade Statistics.
Exports
Imports
2000 2005
2000 2005

28
3) India’s Growing Trade with East Asia
India has been working on FTA agreements and strengthening economic ties with East Asia, particularly the ASEAN countries since the 1990s, as part of its Look East Strategy.
When China and the ASEAN countries agreed in 2001 to conclude an FTA within the decade, it sparked a trend toward economic alliances and FTA negotiations throughout Asia. India and Thailand created an FTA Early Harvest Scheme, which accelerated tariff reductions on 82 items beginning in September 2004, spurring new exports. Thailand began exporting home electronics (TVs and air conditioners), electronic components (CRTs) and polycarbonates to India, while India began exporting car parts to Thailand.
The share of Indian exports accounted for by the ASEAN states, Japan, China and the ROK rose from 13.3% in 1999 to 20.9% in 2005. Exports to China and the ASEAN states alone rose to 6.6% and 10.3%, respectively. Exports to Japan were conspicuously low at 2.4%. India purchased only 1.3% of East Asia’s total exports in 2005, but this has been gradually rising. C. Major Issues Going Forward
As ties grow deeper within East Asia, several issues must be addressed in the changing environment. Japanese companies have been building up their processing and manufacturing capabilities in East Asia through investment. Revenues from these investments increased 34.5% to $9.6 billion in 2005, the highest ever since data was first gathered in 1996. Japan’s nominal gross national income (GNI), which also includes overseas income, grew faster than GDP for the third year running. But as the Japanese economy continues to use economic expansion in other East Asian economies to leverage its own growth, Japanese companies need to consider the following key points:
China’s tightening business environment and the attractiveness of ASEAN China is becoming less attractive as a manufacturing base for exports as wages rise, pressure for the yuan’s upward revaluation yuan grows and the “China risk” persists. Building factories in ASEAN countries that are concluding multilateral FTAs is becoming more advantageous. Value of alliances with East Asian corporations East Asian corporations have the corporate resources to respond quickly in fast-growing East Asian markets. Alliances with such companies are particularly valuable when doing business in China or India, where corporate resources are limited.
Need to globalize product development Japanese corporations need to shed their excessive focus on the Japanese market and their overemphasis on acting alone rather than working through business alliances. They must develop competitive products for international markets, particularly the fast-growing East Asian markets. Nokia, for example, having built a development center in China to introduce low-priced products, has not only reclaimed its top market share of the Chinese cell phone market, it is introducing these products in other markets of the world. The time has come to shed insistence on acting alone and to take advantage of technologies, know-how and human resources from around the world.

29
Fig. 40 Japanese exports in 2005
Value Share Value Share Value Share Value Share Value Share Value ShareTotal Value 598,215 - 282,968 - 80,340 - 145,467 - 53,622 - 3,539 -Foods and consumer products 2,664 0.4 1,734 0.6 354 0.4 1,163 0.8 215 0.4 2 0.1Industrial supplies 125,204 20.9 86,856 30.7 26,889 33.5 43,559 29.9 15,201 28.3 1,207 34.1 Crude materials 6,618 1.1 5,513 1.9 2,695 3.4 2,221 1.5 547 1.0 50 1.4 Mineral fuels 4,570 0.8 2,795 1.0 1,293 1.6 1,214 0.8 197 0.4 91 2.6 Industrial chemicals 52,122 8.7 35,191 12.4 10,324 12.9 19,658 13.5 4,739 8.8 470 13.3 Metals 35,064 5.9 27,018 9.5 7,180 8.9 12,523 8.6 6,958 13.0 357 10.1 Textiles 6,567 1.1 4,758 1.7 2,907 3.6 1,331 0.9 466 0.9 54 1.5Capital equipment 329,420 55.1 160,995 56.9 44,460 55.3 81,660 56.1 32,794 61.2 2,081 58.8 Non-electric machinery 121,711 20.3 55,695 19.7 17,089 21.3 25,205 17.3 12,294 22.9 1,107 31.3 Electrical equipment 123,173 20.6 73,687 26.0 19,646 24.5 39,745 27.3 13,822 25.8 474 13.4 Transport equipment 55,718 9.3 14,334 5.1 2,835 3.5 6,209 4.3 4,949 9.2 341 9.6Consumer non-durable goods 3,883 0.6 2,195 0.8 475 0.6 1,476 1.0 230 0.4 14 0.4 Textiles products 747 0.1 477 0.2 180 0.2 268 0.2 27 0.1 2 0.1Consumer durable goods 108,711 18.2 14,874 5.3 3,797 4.7 8,134 5.6 2,795 5.2 148 4.2 Household equipment 496 0.1 122 0.0 22 0.0 87 0.1 13 0.0 0 0.0 Domestic electric equipment 2,504 0.4 622 0.2 134 0.2 395 0.3 87 0.2 6 0.2 Passenger cars 79,989 13.4 4,223 1.5 1,172 1.5 1,955 1.3 1,045 1.9 51 1.4 Motorcycles and bicycles 7,817 1.3 625 0.2 58 0.1 335 0.2 204 0.4 28 0.8 Toys and musical instruments 10,538 1.8 4,157 1.5 1,077 1.3 2,350 1.6 707 1.3 23 0.6Other 28,332 4.7 16,315 5.8 4,364 5.4 9,477 6.5 2,388 4.5 86 2.4Note: Percentages indicate proportion of each item in total exports. Source: Ministry of Finance, Trade Statistics.
(US$ million, %)
World East Asia 9 & IndiaChina Asian NIEs ASEAN 4 India
Fig. 41 Income earned overseas
-10000
-5000
0
5000
10000
15000
20000
25000
30000
1996 1997 1998 1999 2000 2001 2002 2003 2004 2005
(US$ million)
その他東アジア10EU米国
Note: Data shows the sum of income from patents and other usage fees and direct investment.Sources: Ministry of Finance; and Bank of Japan, Balance of Payments.
OtherEast Asian 10EUU.S.A.
1) China’s Tightening Business Environment and the Attractiveness of ASEAN
China began to deregulate its markets after joining the WTO. Despite remaining
problems, wholesale/retail, finance/insurance, distribution and other industries have been opened to foreign investment, with geographical limitations removed and regulations on equity ratios eased. As one result, the services sector attracted more inward investment than manufacturing for the first time in Shanghai in 2005. Moreover, throughout China’s urban areas, there was a growing shift toward investments aimed at satisfying domestic demand. In a

30
survey by the Japan Bank for International Cooperation, corporations were asked why they regarded China as a promising target for operations. Those answering the “growth potential of the domestic market” greatly exceeded those who said “as a base for exporting (either to Japan or other countries).”
China’s external economic relations have also changed. Its positive trade balance has raised more calls for the yuan to be revaluated upwardly. As of June 2006, the yuan-dollar exchange rate had risen only 1.4% since the yuan’s last revaluation in July 2005. China’s growing trade surplus with the United States is giving rise to trade friction, and many feel that the risk of doing business with China could rise due to possible retaliatory action by the U.S.A., such as implementation of textile industry safeguards.
Another source of concern is China’s changing policies on foreign capital. It is highly probable that incentives put in place to attract foreign capital will be reversed, increasing the burden on foreign companies operating there. Until now, China has been offering tax rates reduced from 33% to 15% for foreign firms operating in special economic zones, as well as a two-year exemption from tax in the first two years of profitability and reduction of taxation in the third year, and zero duty on equipment imported for in-house use. Such incentives, however, are under review, partly because it likely contravenes the WTO principle of not discriminating between domestic and foreign companies, and partly because of a strong reaction against preferential treatment within China. A uniform tax rate for domestic and foreign firms may be adopted by the National People’s Congress as early as 2007, going into effect in 2008. Chinese news sources report the rate would be about 25%, with new incentives set up by industry and region. According to certified public accountants in China, the two-year tax exemption, third-year reduction is likely to be revised. At any rate, uniform tax rates would entail a de facto tax increase for foreign firms in China. Japanese companies investing in China would also lose the tax credit whereby taxes exempted or reduced in China qualify for Japan’s foreign tax exclusion.
Fig. 42 China's merits as an offshore business base (%)
2003 2004 2005Superior human resources 24.2 19.0 17.6Low-cost labor 74.9 66.1 62.8Low-cost materials and parts 34.2 21.4 23.7Base for supplying assembly plants 28.6 28.6 27.5Has industrial clusters 14.3 16.1 16.5Disperses country risk 4.5 2.7 3.1Base for exporting to Japan 22.4 19.4 18.6Base for exporting to other countries 21.9 20.8 24.2Both above reasons 44.3 40.2 42.8Large market 19.7 23.9 27.0Growth potential of market 82.3 83.3 80.2Base for developing local products 7.8 6.7 3.8Infrastructure in place 9.4 3.3 5.9Preferential taxation on investments 17.4 17.4 13.2Stable policies for foreign capital 4.5 4.2 1.3Stable political and social conditions 4.0 4.2 2.0Source: Japan Bank for International Cooperation, 16th and 17thSurvey Report on Overseas Business Operations by JapaneseManufacturing Companies .
a) Rising wages in China
A JETRO comparison of wage levels in East Asia in 2000 and 2005 revealed a rise in

31
Chinese wage levels to well above levels in the Philippines and Indonesia. In Guangdong Province, the minimum wage was increased in July 2005. In Dongguan, it was increased 30% to about $70 a month, over 60% higher than in 2000.
The minimum wage was also raised in Vietnam, for the first time in about seven years, going into effect on February 1, 2006. In the Hanoi and Ho Chi Minh City areas, the minimum wage surged by about 42% to about $50 a month. This was only about $20 lower than in Dongguan.
What matters to the employer, however, is the actual cost of labor, including benefits. When allowances, social security, overtime and other costs are figured in, the average cost per worker was between $160 and $190 a month in the Dongguan region of southern China, whereas in Vietnam it was in the $90 to $110 range. The difference is $70 to $80 per worker per month, a large gap indeed. If labor costs were the only factor, Vietnam would be significantly more attractive than China, although China outstrips Vietnam in the level of its suppliers and other supporting industries. b) ASEAN’s increasing superiority
A JETRO survey during January–February 2006 found that the investment climate in ASEAN countries was not necessarily inferior to China’s. In a survey of Japanese firms in the ASEAN region and India (also having affiliates in China), Thailand and Malaysia scored higher than China on points such as political and social stability and infrastructure level. They also were preferred for the transparency of their investment-related legal systems, implying consistency and predictability in policies and more trust in their governments.
Fig. 43 Investment environments in ASEAN countries and India, compared with China
Thailand Malaysia Singapore Indonesia Philip-pines Vietnam
Political and social stability 0.48 0.91 0.85 0.96 -0.23 -0.17 0.74 0.50Communicativeness of employees 0.42 0.35 0.53 0.88 -0.07 0.63 0.20 0.72Investment law transparency 0.39 0.69 0.66 0.93 -0.17 0.10 0.07 0.23Tax system 0.32 0.50 0.62 0.97 -0.35 0.10 0.07 -0.13Infrastructure 0.07 0.65 0.67 0.96 -0.60 -0.65 -0.75 -0.78Ease of managing labor 0.34 0.52 0.21 0.85 -0.04 0.17 0.48 0.00Research and engineering skills -0.14 -0.07 -0.10 0.75 -0.66 -0.35 -0.21 0.33Local suppliers -0.31 0.28 -0.07 0.22 -0.71 -0.86 -0.85 -0.32Foreign exchange risks -0.03 0.13 0.30 0.52 -0.68 -0.46 0.28 -0.13Customs procedures 0.35 0.42 0.64 0.96 -0.14 0.23 -0.07 -0.41Intellectual property protection 0.23 0.34 0.39 0.94 -0.12 -0.02 -0.07 0.04Average 0.19 0.43 0.43 0.81 -0.34 -0.12 -0.01 0.04
Source: JETRO, Japanese manufacturers in Asia--ASEAN and India (2005 survey, carried out January-February 2006).Note: Ratios obtained by subtracting "inferior" replies from "superior" replies, then dividing by total replies.
(China = 0; positive values = superior; negative values = inferior)
ASEAN India

32
c) ASEAN FTAs
ASEAN has concluded, or is negotiating, FTAs with India, Australia and New Zealand, and a multilateral FTA with Japan, China and the Republic of Korea. It has also completed joint research on trade relations with the EU and may announce the start of EU–ASEAN negotiations as early as 2006. Through these bilateral and multilateral FTAs, ASEAN is building a solid platform for the supply chain networks of its global corporations.
Production in any ASEAN country is expected to satisfy the local production regulations of the three ASEAN Plus One FTAs. These agreements, as well as AFTA, will call for 40% cumulative local content (value-added) as a condition for preferential duties. The 40% rule has inherent problems since local content fluctuates with exchange rates and raw material prices. Since costs must be examined for each model of a product to determine its local content, the system is not well suited to products with short lifecycles. Nonetheless, Japanese corporations experienced in investing in procurement and production systems in the ASEAN region have often been able to cope with such content regulations, and with good reason. The tariff reduction for products satisfying local content rules, for example, has been particularly advantageous for automakers, for which tariffs are relatively high.
The FTA between India and Thailand is a good example of how such agreements can result in increased trade. The agreement, an FTA Early Harvest Scheme designed to accelerate tariff reductions on designated items, went into effect in September 2004. In 2005, Thai exports to India of products under the agreement rose 130% to $337.78 million, a much larger gain than the 67.7% increase in exports of these products from all countries to India. Moreover, the 82 Early Harvest items accounted for over 20% of total Thai exports to India. The top exports were color TV picture tubes, polycarbonates and air conditioners, primarily produced by Japanese corporations in Thailand. Before Early Harvest, India had a 25% tariff on those items, but the rate was reduced to 12.5% when the agreement went into effect, and then further dropped to 6.25% in September 2005. As a result, what had previously been very modest exports increased rapidly thanks to Early Harvest.
Similarly, Thailand’s import of Indian products covered by Early Harvest increased 25.5% to $88.29 million. The main import item was gearboxes for automobile transmissions, which were being exported from India by a Japanese-affiliated automaker. Again, Early Harvest brought large tariff reductions: the Thai duty fell from 30% to 15% in 2004, and then to 7.5% in 2005.
As a result, Thailand recorded a trade surplus with India of $249.49 million on Early Harvest items, a striking change from continual trade deficits up to 2004. The balance of overall Thai–Indian trade was reversed, putting Thailand in the black.

33
Fig. 44 Trade expansion since Early Harvest Scheme between Thailand and India -- Thai product exports to India --
0
2
4
6
8
10
12
14
16
18
20
Jan. '03 Jul. '03 Jan. '04 Jul. '04 Jan. '05 Jul. '05 Jan. '06
Color TV CRTs (36.9%)Polycarbonates (25.3%)Air conditioners (6.6%)
Notes: Polycarbonates are HS390740, color TV CRTs are HS852812 and HS854011, and air conditioners are HS841510. Horizontal lines are import averages before scheme(Jan. '02 to Aug. '04) and after scheme (Sept. '04 to Jan. '06).Source: Customs Office statistics, compiled by JETRO.
(US$ million)
(share of all Early Harvest items, Sept. 2004 to June 2006)
Early Harvestscheme starts (Sept. '04)
Fig. 45 Trade expansion effects of Early Harvest Scheme between Thailand and India
-- Thailand's import of Indian products --
0
1
2
3
4
5
Jan. '03 Jul. '03 Jan. '04 Jul. '04 Jan. '05 Jul. '05 Jan. '06
Gearboxes (33.4%)
(US$ million)
Note: Gearboxes are HS870840. Dotted line is average of gearbox imports in periods before (Jan. '02 to Aug. '02) and after (Sept. '04 to Jan. '06) Early Harvest scheme wasimplemented.Source: Customs Office statistics, compiled by JETRO.
Figures in parentheses show ratio of EarlyHarvest items to all items (September 2004 toJune 2006)
EH開始(04年9月)Early Harvest scheme starts (Sept. '04)

34
2) Value of Alliances with Asian Corporations
Business alliances that leverage the strengths of Asian firms could help Japanese corporations to respond swiftly to rapidly changing markets, particularly in China and India. These alliances, which include both business tie-ups (technical/marketing cooperation, etc.) and capital tie-ups (joint ventures, M&A, etc.), commonly focus on the following objectives:
• Develop new markets (enter foreign markets or gain new corporate customers) • Combine complementary strengths (maximize existing strengths while making up for
specific insufficiencies) • Mass production (achieve economies of scale not possible alone) • Launch operations swiftly (accelerate learning curve in local markets).
Often, of course, the alliances reflect multiple objectives being pursued by the partners. Japanese corporations typically seek alliances with foreign firms due to three basic
factors: systemic, corporate resources or external environment. The main systemic factor is restrictions on foreign capital equity ratios in target countries.
Since many Asian countries prohibit foreign companies from being sole owners of domestic corporations, alliances with local partners circumvent this limitation and enable the building of market share.
In terms of corporate resources, the most common factor is Japanese firms’ lack of expertise in international operations. Marketing in another country and managing the local corporation require expertise and networks specific to that country. Many corporations fill in the gaps by forming alliances with local corporations. A shortage of necessary corporate resources, particularly human resources, can be another reason to build an international alliance. Japan is experiencing falling birthrates and an aging population, making it difficult for corporations to secure human resources. Since the 1990s, Japanese corporations have made substantial progress in shedding their excess debt, capacity and unemployment left after the bursting of the economic bubble, and are now shifting back to more aggressive management. Yet in many cases they are unable to secure enough young engineers and workers, leaving them no choice but to look overseas for people with manufacturing and product development expertise.
And finally, external environmental factors that are promoting business alliances include the rapid development of regional economic zones around East Asia, which makes strategic tie-ups with international partners an effective way to overcome specific corporate insufficiencies and respond swiftly to changes. Japanese firms have forged alliances in sales, production, development and other fields, especially with Taiwanese, ROK or Chinese firms in rapidly expanding Asian markets, particularly China. They have also been entering the Indian market through alliances with ASEAN firms to utilize their personnel, equity in Indian firms, distribution networks and other Indian-focused assets. 3) Need to Globalize Product Development
Japanese firms also need to overcome their excessive insistence on operating alone. Instead of relying only on internal resources, they must actively seek outside resources and acquire technologies, know-how and human resources from throughout the world, particularly as competition from local and Western firms in East Asian markets heats up. The rapid growth

35
of the middle class in Asia has created demand for products designed for Western markets, so products are increasingly being launched simultaneously in Asian and Western markets. As a result, success depends on upgrading a company’s capacity to develop products for markets worldwide.
The special characteristics of Asian markets, however, must also be kept in mind. In some markets, such as the ROK, Japanese mobile phones and washing machines with sophisticated features are popular, but in many other markets Japanese companies lag behind their Western or Asian competitors in developing products specifically oriented toward local preferences. Some believe that Japanese brand power has not penetrated to the popular level in emerging markets. Brand power exists only when a significant portion of the consumer population is aware of it. If Japanese corporations can popularize their brands by making products that ordinary people in developing countries can buy, they could become more competitive as living standards rise in these markets. That is why it is so important for Japanese firms to build product development bases in these markets and create products that suit local preferences.
Japanese corporations must address product development with the global market in mind while competing successfully in Asia’s growing markets. A good model is Nokia, which built a development center in China and introduced inexpensive products to regain the top market share of China’s mobile phone market. Nokia has also been successful in introducing products it developed in China to the rest of the world.
Western companies are pursuing three basic strategies to build global R&D systems focused on global-level innovation:
• Use external resources to overcome the “not invented locally” stigma, • Acquire global technologies, know-how and human resources, rather than focus
excessively on home markets, and • Adopt competitive know-how and technologies from developing nations, rather than
assume the unquestioned superiority of those from advanced nations. JETRO research has revealed a strong trend among Japanese companies to strengthen
both marketing and production functions, particularly for general-purpose products, as these firms expand into China, Thailand and other parts of Asia.

Printed in Japan
JAPAN EXTERNAL TRADE ORGANIZATION
Economic Research Department Ark Mori building, 1-12-32 Akasaka, Minato-ku, Tokyo, Japan, 107-6006
For Distribution in the US: This material is distributed by the US offices of JETRO (Atlanta, Chicago, Denver, Houston, Los Angeles, New York, and San Francisco) on behalf of the Japan External Trade Organization (JETRO), Tokyo, Japan. Additional information is available at the Department of Justice, Washington, D.C.