2005 Annual Report -...
48
7 2005 Annual Report
Transcript of 2005 Annual Report -...

777
2005 Annual Report
NAVTEQ
222 Merchandise Mart, Suite 900
Chicago, Illinois 60654
United States of America
Tel: 312 894 7000 Fax: 312 894 7050
navteq.com
©2006 NAVTEQ. All rights reserved. Printed in the U.S.A.
Cya
nM
agen
taYe
llow
Blac
k29
3
101798CVR_r3_NT_2005 AnnualRepor1-2 1-2101798CVR_r3_NT_2005 AnnualRepor1-2 1-2 3/21/06 6:18:28 PM3/21/06 6:18:28 PM

We are a leading provider of rich, robust, and highly accurate maps.
We are also the catalyst in a dynamic mix of new technologies that
are shaping our interconnected world. A world of vehicles talking to
roads and drivers seeing trouble before they reach it. Of more and
more portable devices going wherever drivers take them. Of business
unimpeded by traffi c. Of more-effi cient fl eets, more-intelligent homeland
security––easier, smarter, safer travel.
NAVTEQ. The Map Driving A Mobile World.
Financial Highlights………………………… 1
Letter to Stockholders ……………………… 2
Coverage …………………………………… 5
Content ……………………………………… 6
Customers …………………………………… 8
A Look Forward …………………………… 10
Board of Directors & Offi cers …………… 12
Financial Statements ……………………… 13
Stockholder Information …………………… 45
777Corporate Headquarters222 Merchandise Mart, Suite 900Chicago, Illinois 60654 U.S.A.312 894 7000www.navteq.com
NAVTEQ Stock InformationNAVTEQ common stock is listed on the New York Stock Exchange under the symbol “NVT.” NAVTEQ’s fi lings with the Securities and Exchange Commission (SEC) can be found on our website at www.navteq.com
The following table sets forth the high and low sales prices per share of our common stock for each quarter of 2005 and for the third and fourth quarters of 2004:
2004 2005 3rd Quarter(1) 4th Quarter 1st Quarter 2nd Quarter 3rd Quarter 4th Quarter
High $ 37.55 $ 48.37 $ 48.57 $ 45.23 $ 51.00 $ 53.70
Low $ 24.00 $ 34.70 $ 37.30 $ 34.30 $ 36.06 $ 38.40
(1) Since August 6, 2004, the fi rst day of trading of the Company’s common stock on the New York Stock Exchange.
HoldersAs of February 1, 2006, our common stock was held by 238 stockholders of record.
DividendsExcept for a special cash dividend that was paid to our common stockholders on June 18, 2004, we have never declared or paid any cash dividends on our common stock. We currently intend to retain future earnings, if any, to fi nance the expansion of our business and do not expect to pay any cash dividends in the foreseeable future. In addition, neither we nor our subsidiaries may pay any cash dividends with respect to any shares of any class of our capital stock in accordance with our existing revolving credit agreement. This restriction materially limits our ability to pay dividends on our common stock. Payment of future cash dividends, if any, will be at the discretion of our Board of Directors after taking into account various fac-tors, including our fi nancial condition, operating results, current and anticipated cash needs, and plans for expansion, and in accordance with the revolving credit agreement. Our ability to pay dividends also may be limited by fi nancing or other agreements that we may enter into in the future.
Certifications Copies of the CEO/CFO certifications required under Section 302 of the Sarbanes Oxley Act of 2002 have been filed as an exhibit to the Company’s Annual Report on Form 10-K for the year ended December 31, 2005. We have submitted last year’s Annual CEO Certification to the New York Stock Exchange pursuant to Section 303A.12(a) of the NYSE Listed Company Manual.
Availability of Annual Report on Form 10-KA copy of the Company’s Annual Report on Form 10-K for the year ended December 31, 2005 fi led with the Securities and Exchange Commission is available without charge upon written request to Investor Relations; NAVTEQ; 222 Merchandise Mart, Suite 900; Chicago, Illinois 60654; by calling (312) 894-7500; or by accessing the Company’s website at www.navteq.com under Investor Relations.
Annual Meeting of StockholdersNAVTEQ stockholders as of March 17, 2006 are invited to attend and vote at our annual meeting, which will be held in Chicago, Illinois, May 9, 2006, 9:00 a.m. local time at the following venue:
Holiday Inn Mart PlazaWolf Point Ballroom, 15th Floor350 North Orleans StreetChicago, Illinois 60654 U.S.A.
The doors will open at approximately 8:30 a.m. local time.
Transfer AgentComputershare Investor Services LLC2 North LaSalle StreetChicago, Illinois 60602 U.S.A.312 588 4993
Independent Registered Public Accounting FirmKPMG LLPChicago, Illinois U.S.A.
45
Cya
nM
agen
taYe
llow
Blac
k29
3
101798CVR_r3_NT_2005 AnnualRepor3-4 3-4101798CVR_r3_NT_2005 AnnualRepor3-4 3-4 3/21/06 6:19:14 PM3/21/06 6:19:14 PM
777
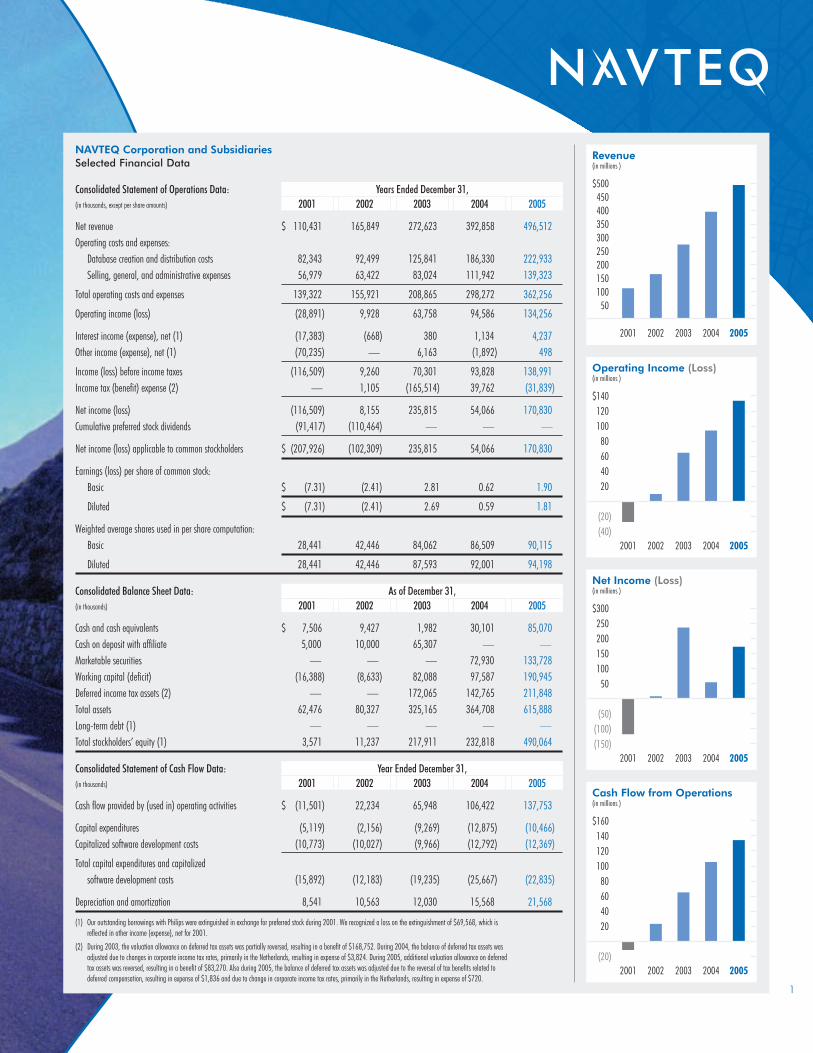
(1) Our outstanding borrowings with Philips were extinguished in exchange for preferred stock during 2001. We recognized a loss on the extinguishment of $69,568, which is refl ected in other income (expense), net for 2001.
(2) During 2003, the valuation allowance on deferred tax assets was partially reversed, resulting in a benefi t of $168,752. During 2004, the balance of deferred tax assets was adjusted due to changes in corporate income tax rates, primarily in the Netherlands, resulting in expense of $3,824. During 2005, additional valuation allowance on deferred tax assets was reversed, resulting in a benefi t of $83,270. Also during 2005, the balance of deferred tax assets was adjusted due to the reversal of tax benefi ts related to deferred compensation, resulting in expense of $1,836 and due to change in corporate income tax rates, primarily in the Netherlands, resulting in expense of $720.
NAVTEQ Corporation and SubsidiariesSelected Financial Data
Consolidated Statement of Operations Data: Years Ended December 31,(in thousands, except per share amounts) 2001 2002 2003 2004 2005
Net revenue $ 110,431 165,849 272,623 392,858 496,512Operating costs and expenses: Database creation and distribution costs 82,343 92,499 125,841 186,330 222,933 Selling, general, and administrative expenses 56,979 63,422 83,024 111,942 139,323
Total operating costs and expenses 139,322 155,921 208,865 298,272 362,256
Operating income (loss) (28,891) 9,928 63,758 94,586 134,256
Interest income (expense), net (1) (17,383) (668) 380 1,134 4,237Other income (expense), net (1) (70,235) — 6,163 (1,892) 498
Income (loss) before income taxes (116,509) 9,260 70,301 93,828 138,991Income tax (benefi t) expense (2) — 1,105 (165,514) 39,762 (31,839)
Net income (loss) (116,509) 8,155 235,815 54,066 170,830Cumulative preferred stock dividends (91,417) (110,464) — — —
Net income (loss) applicable to common stockholders $ (207,926) (102,309) 235,815 54,066 170,830
Earnings (loss) per share of common stock: Basic $ (7.31) (2.41) 2.81 0.62 1.90
Diluted $ (7.31) (2.41) 2.69 0.59 1.81
Weighted average shares used in per share computation: Basic 28,441 42,446 84,062 86,509 90,115
Diluted 28,441 42,446 87,593 92,001 94,198
Consolidated Balance Sheet Data: As of December 31,(in thousands) 2001 2002 2003 2004 2005
Cash and cash equivalents $ 7,506 9,427 1,982 30,101 85,070Cash on deposit with affi liate 5,000 10,000 65,307 — —Marketable securities — — — 72,930 133,728Working capital (defi cit) (16,388) (8,633) 82,088 97,587 190,945Deferred income tax assets (2) — — 172,065 142,765 211,848Total assets 62,476 80,327 325,165 364,708 615,888Long-term debt (1) — — — — —Total stockholders’ equity (1) 3,571 11,237 217,911 232,818 490,064
Consolidated Statement of Cash Flow Data: Year Ended December 31,(in thousands) 2001 2002 2003 2004 2005
Cash fl ow provided by (used in) operating activities $ (11,501) 22,234 65,948 106,422 137,753
Capital expenditures (5,119) (2,156) (9,269) (12,875) (10,466)Capitalized software development costs (10,773) (10,027) (9,966) (12,792) (12,369)
Total capital expenditures and capitalized software development costs (15,892) (12,183) (19,235) (25,667) (22,835)
Depreciation and amortization 8,541 10,563 12,030 15,568 21,568
1
$500450400350300250200150100
50
2001 2002 2003 2004 2005
Revenue(in millions )
$140 120 100 80 60 40 20
(20) (40)
2001 2002 2003 2004 2005
Operating Income (Loss)(in millions )
$300 250 200 150 100 50
(50) (100) (150)
2001 2002 2003 2004 2005
Net Income (Loss)(in millions )
$160 140 120 100 80 60 40 20
(20)2001 2002 2003 2004 2005
Cash Flow from Operations(in millions )
101798BDY_r5_NT_2005 AnnualRepor2 2101798BDY_r5_NT_2005 AnnualRepor2 2 3/23/06 12:16:02 PM3/23/06 12:16:02 PM

TO OUR STOCKHOLDERS
In 2005, NAVTEQ marked its 20th anniversary with another record performance. Driven by
the worldwide growth of consumer interest in Global Positioning System technologies and the
proliferation of new products and applications powered by NAVTEQ® maps, revenue grew by
more than 26 percent over 2004. Operating income rose almost 42 percent for the same period.
Continued investments to improve our products, processes, and overall quality—coupled with new
strategic relationships and acquisitions—further strengthened and solidifi ed our leadership position
worldwide.
To meet growing demand for global coverage from our increasingly diverse customer base,
NAVTEQ expanded its map coverage to 53 countries, up from 44 in 2004. In Europe, we saw
explosive growth in Personal Navigation Devices (PNDs), which accounted for approximately 50
percent of all mobile navigation devices shipped in 2005. We also released the fi rst NAVTEQ map
of Russia, doubled the number of Eastern European countries for which we provide coverage, and
helped guide and lead a consortium of European governments and companies launching the initial
satellite for Galileo—the world’s fi rst civilian-controlled GPS.
Elsewhere, we launched a strategic relationship with Zagat Survey, a leading publisher of dining
guides, linking its ratings and reviews of restaurants, hotels, and leisure establishments to our map
data.
We added more cities to NAVTEQ TRAFFIC,™ the fi rst real-time traffi c information service for vehicle
navigation systems. Cadillac joined Acura with vehicles providing this service, which is delivered
via one of two satellite radio companies. In 2006, we expect to add new customers and expand
coverage to additional cities.
For the fi rst time in a calendar year in North America, 2005 saw sales of vehicles with factory-
installed navigation systems top one million––an increase of nearly 40 percent over 2004. NAVTEQ
maps power more than 90 percent of the systems on board North American vehicles.
Also in the Americas: we launched the fi rst NAVTEQ map of Brazil. And we acquired the leading
mapping company in Mexico, MapIT, a division of gedas AG. The acquisition was fi nalized in
January 2006.
In the Asia-Pacifi c region, our NAV2 joint venture in China began providing maps of China to its
customers. We also acquired Picture Map International (PMI), a leading map company in South
Korea, and released our fi rst map of that country.
2
101798BDY_r5_NT_2005 AnnualRepor3 3101798BDY_r5_NT_2005 AnnualRepor3 3 3/23/06 12:15:15 PM3/23/06 12:15:15 PM

Even as we capitalize on these opportunities, we are working aggressively
to create new ones. The third annual NAVTEQ Global LBS Challenge™ contest
is making new wireless navigation and location-based services concepts realities.
Wireless carriers worldwide are taking notice and participation in the contest
continues to increase dramatically.
In November, at the 12th annual Intelligent Transportation Systems (ITS) World Congress
in San Francisco, more than 10,000 attendees (including public sector and private sector
transportation decision makers from 80 countries) saw North America’s largest-ever integrated
demonstration of ITS technologies. Presented by NAVTEQ and its partners, the demonstration
featured a range of technologies, including Vehicle Infrastructure Integration (VII) concepts that
wirelessly communicate information between vehicles and the transportation infrastructure. These
innovations could have a dramatic impact on traffi c congestion, accidents, and the ineffi ciency of travel.
In 2005, NAVTEQ’s commitment to high standards in global operations helped its North American
Distribution Services unit achieve ISO/TS 16949:2002 certifi cation. With the 2004 certifi cation
of our European operations, we now have third-party certifi cation of the Company’s global
standardized processes.
Last summer, NAVTEQ joined leading Personal Navigation Device suppliers and GIS data providers
to help the victims of Hurricane Katrina, shipping NAVTEQ-powered navigation devices to relief
organizations, the National Guard and other fi rst responders. The devices played a critical role in
the devastated regions of Louisiana, Alabama, and Mississippi, helping emergency workers (many
of whom were not native to the region) identify latitude and longitude coordinates, and fi nd their
way to and from streets and addresses.
Around the globe, we continue to be the preferred provider of maps to the top names in GPS
technology. NAVTEQ is the map of choice for a new generation of navigation devices, websites,
enterprise/fl eet/geographic information systems solutions providers, and LBS companies.
Thanks to our dedicated employees, who are united behind a clear vision of our role as leader in
this dynamic industry, customers and consumers have come to depend on NAVTEQ. You can rely
on us to continually improve the richness and accuracy of the world’s fi nest digital maps even as
we develop innovative new products and services that will help drive the mobile world toward a
bright future.
Judson C. GreenPresident and CEO NAVTEQ
3
101798BDY_r4_NT_2005 AnnualRepor4 4101798BDY_r4_NT_2005 AnnualRepor4 4 3/21/06 6:56:27 PM3/21/06 6:56:27 PM

Financial Highlights………………………… 1
Letter to Stockholders ……………………… 2
Coverage …………………………………… 4
Content ……………………………………… 6
Customers …………………………………… 8
A Look Forward …………………………… 10
Board of Directors & Offi cers …………… 11
Financial Statements ……………………… 12
Stockholder Information …………………… 41
6
4
101798BDY_r3_NT_2005 AnnualRepor5 5101798BDY_r3_NT_2005 AnnualRepor5 5 3/20/06 10:22:04 PM3/20/06 10:22:04 PM

DRIVING COVERAGE, CONNECTING PEOPLEAt NAVTEQ we continue to expand our coverage, through build-outs and strategic acquisitions, to meet the evolving needs of our customers and the consumer marketplace. By year’s end, these efforts gave us an even richer, more robust map that now spans five continents and 53 countries.
People working in the same direction, worldwide.Across the globe in over 130 offices, NAVTEQ field teams use the same proprietary equipment and protocols for collecting road characteristics. As a result, when a regional build-out calls for additional resources, we have the flexibility to move extra teams to that region. This enables us to respond to the needs of the market while maintaining our high standards for map accuracy and detail.
A key acquisition in South Korea. Important steps in Brazil.In July, we purchased Picture Map International, a leading South Korean digital map company. The acquisition immediately put NAVTEQ in a strong strategic position in an important geographic region by giving us the rich map content we needed to serve a growing list of global customers doing business in South Korea.
Also this year, we broadened our coverage into South America with the initial launch of coverage for Brazil.
In the United States, the preferred map gets even better.NAVTEQ has continued to update and enrich its already extensive coverage of the U.S. Our 2005 initiative included the addition of 15 U.S. metro areas and the expansion of coverage detail in 20 metro areas, giving us detailed coverage of the entire road network for 71 percent of the U.S. population.
In Europe, expansion opens the door to a new era.The year just completed was a significant one for our coverage in Europe. In Eastern Europe, we established coverage in six countries, bringing our total to 12. In response to our customers’ requests, we also completed our Western European build-out. With the 2005 additions of Spain, Portugal, Ireland, and Denmark, the NAVTEQ® map now offers full coverage of continental Western Europe.
These expansions enabled, for the first time, routing across the European continent and between metro areas, such as Athens and Paris or Barcelona and St. Petersburg.
A strong joint venture makes key inroads in China.NAV2, the year-old joint venture arrangement with leading digital mapmaker China NavInfo, produced important results during 2005. Customers including Nokia, DestinAtor Technologies, Hyundai, and Unistrong, the local distributor for Garmin, rolled out the first commercial applications using maps provided by NAV2.
5
101798BDY_r3_NT_2005 AnnualRepor6 6101798BDY_r3_NT_2005 AnnualRepor6 6 3/20/06 10:22:08 PM3/20/06 10:22:08 PM

DRIVING CONTENT DEVELOPMENTThroughout 2005, NAVTEQ continued to focus resources and expertise on creating fresher, richer content. Such content is the foundation for innovative and dynamic new products––products that enable us to maintain our leadership position in the rapidly evolving GPS navigation marketplace.
Opening new avenues in TRAFFIC.We continue to develop, expand, and improve NAVTEQ TRAFFIC.™ In 2005, NAVTEQ certified 12 new markets, bringing the total number of markets available for launch to 32. And the marketplace continued to respond. Four additional companies—Cadillac, Alpine, Pioneer, and Garmin—launched applications that put NAVTEQ TRAFFIC in vehicles, on board aftermarket navigation systems, and in Personal Navigation Devices.
Forging strong relationships for the next generation of POIs.A relationship with Zagat Survey, a leading U.S. consumer survey-based dining, travel, and leisure information provider, linked that company’s expansive database of restaurant reviews and travel guide information to our highly accurate maps. This led to the fourth-quarter 2005 introduction of the Zagat for NAVTEQ Restaurant Guide and the Zagat for NAVTEQ Travel and Leisure Guide. Together, they offer our customers and their consumers rich, detailed information about restaurants and hotels in over 40 North American cities.
Helping telecoms make connections. We successfully launched Telecom for NAVSTREETS™ in 2005. This new suite of data products was designed, in conjunction with premier providers of telecommunications content, to help telecommunications companies operate more efficiently. Telecom for NAVSTREETS enables telecom operators to map the locations of their assets, from fiber optic cables to wireless towers.
Rolling out a new product for transportation. In 2005, NAVTEQ became the first company to offer test data designed exclusively for the European fleet management industry. With attributes that include road restrictions and hazardous materials limitations, trucking specific points of interest (POIs), and other details, NAVTEQ TRANSPORT™ matches transportation routes to road network reality, enabling development of applications that support moreaccurate route calculations for the industry. These applications should allow fleet operators to increase efficiency, enhance productivity, and reduce costs.
6
101798BDY_r4_NT_2005 AnnualRepor7 7101798BDY_r4_NT_2005 AnnualRepor7 7 3/21/06 7:32:11 PM3/21/06 7:32:11 PM

7
7
101798BDY_r3_NT_2005 AnnualRepor8 8101798BDY_r3_NT_2005 AnnualRepor8 8 3/20/06 10:22:59 PM3/20/06 10:22:59 PM

8
The Most Trusted Names Trust NAVTEQ.
Companies Using NAVTEQ® Maps*
AAA • Aisin AW • ALK • Alpine • American Honda Motor Co.
AOL/MapQuest.com • ATX • Autodesk • BMW Group • Bosch
City of Boston • Clarion • Cobra • Commonwealth of Mass. GIS
DaimlerChrysler • Dell • Delphi • DENSO • Descartes
ESRI • Experian • Fiat • Ford Motor Company • Garmin
General Motors • GeoConcept • Harman Becker Automotive Systems
Hertz NeverLost • Hewlett Packard • Horizon Navigation • Intergraph
Illinois Dept. of Transportation • JVC • Kenwood • LG
Lowrance Electronics • Magneti Marelli • Maporama • Maptuit
Mazda • Melco • Mercedes-Benz • Microsoft • Mitsubishi • Motorola
MondialCom • National Geospatial-Intelligence Agency (NGA)
Navigation Solutions • NAVIGON • Navitrak • Networks in Motion
New York City Fire Department • Nissan Motor Company
NOKIA • OnStar • Oracle • Panasonic • Paragon • Peugeot
Pioneer • Porsche • PTV AG • Rand McNally • Renault
RouteSmart Technologies • Sanyo • Siemens VDO
SIRIUS Satellite Radio • Sony Corporation • Subaru • Telcontar
Thales Navigation • TomTom • Toyota Motor Corporation
UPS Logistics • V-Command • VAG • ViaMetro • Visteon
Webraska • Xanavi • XM Satellite Radio • Yahoo! • Zenrin
* Partial listing of companies using NAVTEQ® maps. NAVTEQ disclaims proprietary interest in the marks and names of others.
101798BDY_r4_NT_2005 AnnualRepor9 9101798BDY_r4_NT_2005 AnnualRepor9 9 3/21/06 7:10:46 PM3/21/06 7:10:46 PM

9
THE POWERFUL RELATIONSHIPS THAT INSPIRE INNOVATIONGeneral Motors drives industry forward with first ever update program.General Motors announced an innovative plan to provide free map updates to purchasers of in-vehicle navigation systems. The program, which is the first of its kind in North America, will give GM customers who purchase a GM in-vehicle navigation system two free map updates starting with model year 2006 vehicles.
“This program is about increasing driver satisfaction and building customer loyalty by offering a continually enriched product. As drivers rely more and more on their navigation systems, NAVTEQ plays an increasingly critical role by offering map updates that more closely refl ect the real world.” John Howell, Global Product Director, Cadillac, General Motors Corporation
The GM plan is an important step from an established industry leader. Research shows that an up-to-date map plays a signifi cant role in navigation system user satisfaction. As the road network is continually changing, NAVTEQ constantly collects new street attributes, addresses, and points of interest, and then revises the NAVTEQ® map to refl ect these changes in the road network. With this program, GM customers will have access to the latest map updates for the fi rst three years they own their vehicles.
With NAVTEQ’s ongoing database update process, and GM’s forward-thinking program, GM customers will now have access to the most-up-to-date maps, ensuring the highest quality vehicle navigation experience.
THE POWERFUL RELATIONSHIPS THAT INSPIRE INNOVATIONIndustry pioneer Garmin continues to lead with innovative products.From the earliest days of commercial GPS technology, Garmin has charted its own course to the top of the industry, continually responding to growing competition by aggressively satisfying the evolving needs of new markets.
In 2005 alone, Garmin introduced an impressive array of nearly 60 new products, energizing retailer support for merchandising portable navigation and laying the foundation for even greater market growth.
Since 2001, NAVTEQ and Garmin have been partners in developing the market for GPS navigation products and services. Garmin has relied on NAVTEQ to provide maps that meet the coverage and premium quality expectations of its customers.
“We have high expectations for our products, and NAVTEQ shares our vision by providing superior maps. Our relationship has been built on a mutual commitment to the highest quality products.” Cliff Pemble, Garmin’s Vice President of Engineering
Today, Garmin offers a broad array of GPS products enabled by NAVTEQ maps, including Personal Navigation Devices (PNDs), mobile phone navigation solutions, integrated navigation PDAs, and handheld GPS receivers.
From more-sophisticated, high-end applications to more-basic, value-priced alternatives, Garmin has a GPS navigation solution for virtually every mobile consumer––and NAVTEQ provides the map that powers them all.
101798BDY_r4_NT_2005 AnnualRepor10 10101798BDY_r4_NT_2005 AnnualRepor10 10 3/21/06 9:25:57 PM3/21/06 9:25:57 PM

KEEPING OUR FOCUS ON THE ROAD AHEAD
There is tremendous opportunity throughout our industry.
This year, we were a driving force in the largest-ever integrated demonstration of Intelligent
Transportation Systems (ITS) technologies, opening the door to a new generation of products
and services, particularly in the Vehicle Infrastructure Integration (VII) marketplace. Our
rapidly growing Global LBS Challenge™ continues to inspire exciting new applications as it
brings together the developers and service providers who will help drive the growth of the
wireless segment for years to come.
We are creating a new world. A world in which travelers connect to roadways, shoppers
to stores, dispatchers to fleets, and people to services and to each other. This is a world of
advanced driving systems and intelligent intersections. Of 3D graphics, voice recognition, and
personalized content.
We envision a dynamic marketplace of real-time content, a complex web of connections that
effortlessly brings together people, places, and ideas.
It all begins with a solid, accurate, reliable foundation. NAVTEQ. The company, the people,
the map driving a mobile world.
10
101798BDY_r4_NT_2005 AnnualRepor11 11101798BDY_r4_NT_2005 AnnualRepor11 11 3/21/06 7:11:46 PM3/21/06 7:11:46 PM

11
101798BDY_r3_NT_2005 AnnualRepor12 12101798BDY_r3_NT_2005 AnnualRepor12 12 3/20/06 10:24:02 PM3/20/06 10:24:02 PM

12
Board of Directors
Christopher B. GalvinChairman of the BoardNAVTEQ
ChairmanHarrison Street Capital
Judson C. GreenPresident and Chief Executive Offi cerNAVTEQ
Andrew J. GreenChief Executive Offi cerBT Global Services
William L. KimseyFormer Global Chief Executive Offi cerErnst & Young
Richard J.A. de Lange Former Chairman of the Board andChief Executive Offi cerPhilips Electronics Nederland B.V.
Scott D. MillerChief Executive Offi cerSix Sigma Academy and G100
Dirk-Jan van OmmerenChairman of the Board of Managing DirectorsOranje-Nassau Groep B.V.
Offi cers
Judson C. GreenPresident and Chief Executive Offi cer
Denis M. CohenExecutive Vice President
John K. MacLeodExecutive Vice President, NAVTEQ Connected Services
David B. MullenExecutive Vice President and Chief Financial Offi cer
Clifford I. FoxSenior Vice President, NAVTEQ Map
Winston V. GuillorySenior Vice President, NAVTEQ Consumer and Business Sales
Lawrence M. KaplanSenior Vice President and General Counsel
M. Salahuddin KhanSenior Vice President, Global Marketing and Strategy
Jeffrey L. MizeSenior Vice President, NAVTEQ Vehicle Sales
Richard E. ShumanSenior Vice President, NAVTEQ Asia Pacifi c Sales
Denise M. DoyleVice President, Business Affairs
Christine C. MooreVice President, Human Resources
101798BDY_r3_NT_2005 AnnualRepor13 13101798BDY_r3_NT_2005 AnnualRepor13 13 3/20/06 10:24:04 PM3/20/06 10:24:04 PM

13
NAVTEQ Corporation and SubsidiariesIndex to Financial StatementsManagement’s Discussion and Analysisof Financial Condition and Results of Operations ………………………………………………… 14
Management’s Report on Internal Control over Financial Reporting …………………………… 24
Reports of Independent Registered Public Accounting Firm ……………………………………25-26
Consolidated Balance Sheets(as of December 31, 2004 and 2005) ……………………………………………………………… 27
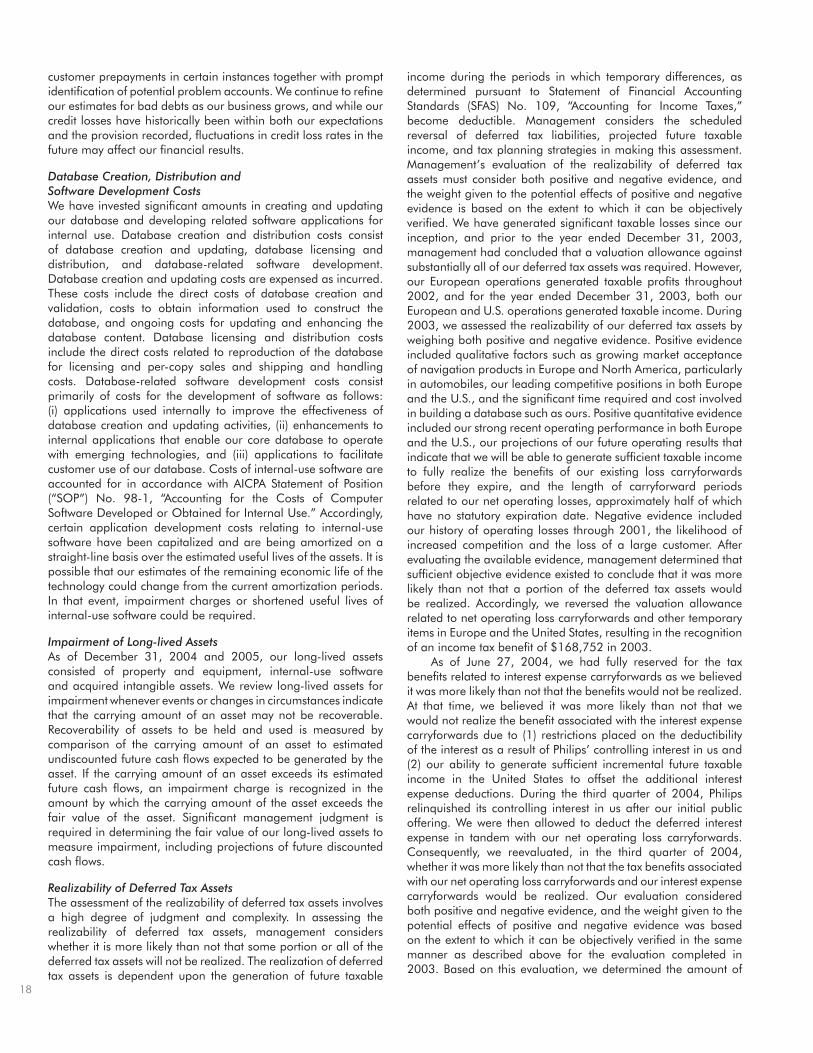
Consolidated Statements of Operations(for the years ended December 31, 2003, 2004, and 2005) ……………………………………… 28
Consolidated Statements of Stockholders’ Equity and Comprehensive Income(for the years ended December 31, 2003, 2004, and 2005) ……………………………………… 29
Consolidated Statements of Cash Flows(for the years ended December 31, 2003, 2004, and 2005) ……………………………………… 30
Notes to Consolidated Financial Statements ………………………………………………………… 31
101798FIN_r2_AnnRep05_Financials13 13101798FIN_r2_AnnRep05_Financials13 13 3/17/06 4:35:10 PM3/17/06 4:35:10 PM

14
Management’s Discussion and Analysis of Financial Condition and Results of Operations (Amounts in thousands, except per share amounts)
You should read the following discussion and analysis of our fi nancial condition and results of operations in conjunction with our consolidated fi nancial statements and the related notes thereto contained elsewhere in this document. Certain information contained in this discussion and analysis and presented elsewhere in this document, including information with respect to our plans and strategy for our business, includes forward-looking statements that involve risk and uncertainties. In evaluating these statements, you should specifi cally consider the various risk factors identifi ed in “Item 1A. Risk Factors” in our Annual Report on Form 10-K for the year ended December 31, 2005 that could cause results to differ materially from those expressed in such forward-looking statements.
OverviewGeneralWe are a leading provider of comprehensive digital map information for automotive navigation systems, mobile navigation devices and Internet-based mapping applications. Our map database enables providers of these products and services to offer dynamic navigation, route planning, location-based services and other geographic information-based products and services to consumer and commercial users.
In connection with a registration rights agreement between Philips Consumer Electronic Services B.V. (“Philips B.V.”) and us, Philips B.V. exercised its fi rst demand registration right on April 16, 2004. Pursuant to this request, we fi led a Registration Statement on Form S-1 (Reg. No. 333-114637) on April 20, 2004 with the Securities and Exchange Commission to register our common stock in an initial public offering, which became effective on August 5, 2004. The initial public offering was completed on August 11, 2004. At closing, Philips B.V. and NavPart I B.V., the other selling stockholder, received all of the proceeds from the sale of shares in the offering. Philips B.V. exercised its second demand registration right on March 11, 2005. Pursuant to this request, we fi led a Registration Statement on Form S-3 (Reg. No. 333-123628) on March 28, 2005 with the Securities and Exchange Commission to register our common stock held by Philips B.V. in a secondary public offering, which was consummated on May 10, 2005. Our selling stockholder, Philips B.V., received all of the proceeds from the sale of shares in the offering. In the offering, Philips B.V. sold 33,101 shares of common stock, which represented its entire remaining interest in the Company.
RevenueWe generate revenue primarily through the licensing of our database in North America and Europe. Revenue grew 44.1% and 26.4% in 2004 and 2005, respectively. The largest portion of our revenue comes from digital map data used in self-contained hardware and software systems installed in vehicles. We believe that there are two key factors that affect our performance with respect to this revenue: the number of automobiles sold for which navigation systems are either standard or an option (“adoption”) and the rate at which car buyers select navigation systems as an option (“take-rate”).
The adoption of navigation systems in automobiles and the take-rates have increased during recent years and we expect that these will continue to increase for at least the next few years as a result of market acceptance by our customers of products and services that use our database. As the adoption of navigation systems in automobiles and the take-rates increase, we believe each of these can have a positive effect on our revenue, subject to our ability to maintain our license fee structure and customer base.
In addition, the market for products and services that use our database is evolving, and we believe that much of our future success depends upon the development of a wider variety of products and services that use our database. This includes growth in location-enabled mobile devices, such as mobile phones, personal digital assistants (PDAs), personal navigation devices (PNDs) and other products and services that use digital map data. While use of our map database in mobile phones and in location-based products and services is still largely in development and just beginning to enter the marketplace, there are a number of personal digital assistants and personal navigation devices currently on the market in both Europe and North America that use our map database for turn-by-turn route guidance, including products offered by Garmin, Dell, and Thales. Our revenue growth is driven, in part, by the rate at which consumers and businesses purchase these products and services, which in turn is affected by the availability and functionality of such products and services. We believe that both of these factors have increased in recent years and will continue to increase for at least the next few years. However, even if these products and services continue to be developed and marketed by our customers and gain market acceptance, we may not be able to license the database at prices that will enable us to maintain profi table operations. Moreover, the market for map information is highly competitive, and competitive pressures in this area may result in price reductions for our database, which could materially adversely affect our business and prospects.
We have also experienced, and expect to continue to experience, diffi culty in maintaining the license fees we charge for our digital map database due to a number of factors, including automotive and mobile device customer expectations of continually lower license fees each year and a highly competitive environment. As a consequence of Tele Atlas’ acquisition of GDT in July 2004, there may be additional price pressure on our license fees in order for us to compete effectively with the combined company. In addition, governmental and quasi-governmental entities are increasingly making map data information with higher quality and greater coverage available free of charge or at lower prices. Customers may determine that the data offered by such entities is an adequate alternative to our map database for some of their applications. Additionally, the availability of this data may encourage new entrants into the market by decreasing
101798FIN_r2_AnnRep05_Financials14 14101798FIN_r2_AnnRep05_Financials14 14 3/17/06 4:35:14 PM3/17/06 4:35:14 PM

15
the cost to build a map database similar to ours. In response to these pressures, we are focused on:
• Offering a digital map database with superior quality, detail and coverage;
• Providing value-added services to our customers such as distribution services, and technical and marketing support; and
• Enhancing and extending our product offering by adding additional content to our map database such as integrated real-time traffi c data, enhancements to support advanced driver assistance systems applications that improve vehicle safety and performance, and enriched points of interest, such as restaurant reviews, hours of operation and parking availability.
We also believe that in the foreseeable future the effect on our revenue and profi tability as a result of any decreases in our license fees will be offset by volume increases as the market for products and services that use our database grows, although we cannot assure you that these increases will occur.
Operating ExpensesOur operating expenses are comprised of database creation and distribution costs, and selling, general and administrative expenses. Database creation and distribution costs primarily include the purchase and licensing of source maps and employee compensation related to the construction, maintenance and delivery of our database. Selling, general and administrative expenses primarily include employee compensation, marketing, facilities and other administrative expenses.
Our operating expenses have increased as we have made investments related to the development, improvement and commercialization of our database. Our operating expenses grew 42.8% and 21.5% in 2004 and 2005, respectively. Operating expenses as a percentage of revenue were 77%, 76% and 73% in 2003, 2004, and 2005, respectively. We anticipate that operating expenses will continue to increase as our growth and development activities continue, including further development and enhancement of our database and increasing our sales and marketing efforts.
During 2004 and 2005, we granted restricted stock units (RSUs) to certain of our directors and employees under our 2001 Stock Incentive Plan. The RSUs are securities that require us to deliver to the holder one share of our common stock for each vested unit. Compensation expense is recognized ratably over the vesting periods of each tranche of the RSUs using a fair value equal to the fair market value of our common stock on the date of the grant. We recognized compensation expense of $6,224 and $8,353 related to the grants of the restricted stock units during the years ended December 31, 2004 and 2005, respectively.
We have historically obtained software, software-related consulting services, treasury services, tax consulting services, insurance services and purchasing services on favorable terms through our participation in Koninklijke Philips Electronics N.V.’s (“Philips”) programs, which we believe have resulted in operating expense savings for us of approximately $2,000 to $2,500 per year. Pursuant to a separation agreement with Philips effective upon the closing of the initial public offering in August 2004, we can no longer obtain software, software-related consulting services, treasury services, tax consulting services and insurance from or through Philips. We ceased participating in Philips’ purchasing programs after March 31, 2005.
Income TaxesAs of December 31, 2005, we had U.S. net operating loss carryforwards for Federal and state income tax purposes of approximately $259,923 and $104,222, respectively. The difference between the Federal and state loss carryforwards relate to certain limitations applicable to us because our principal operations were previously located in California. These include a 50% limitation on California loss carryforwards, capitalized research and development costs for California income tax purposes and a fi ve-year limit on California net operating loss carryforwards. Net operating loss carryforwards are available to reduce future taxable income subject to expiration. Various amounts of our net operating loss carryforwards expire, if not utilized, each year until 2025. The following table details the timing of the expiration of our net operating loss carryforwards:
Federal net State net Federal operating loss operating loss tax creditYear of expiration carryforwards carryforwards carryforwards
2006 $ — $ 1,916 $ 752007 — 817 1522008 4,039 490 1142009 5,715 421 282010 25,772 5,069 102Thereafter through 2025 224,397 95,509 3,973
$ 259,923 $ 104,222 $ 4,444
As of December 31, 2005, we also had net operating loss carryforwards in Europe and Canada of approximately $55,372 and $1,911, respectively. The European loss carryforwards have no expiration date and the Canadian loss carryforwards generally have a seven-year carryforward period. In addition, as of December 31, 2005, we had U.S. interest expense carryforwards for both Federal and state income tax purposes of approximately $205,328.
Prior to 2003, we had fully provided a valuation allowance for the potential benefi ts of the net operating loss and interest expense carryforwards as we believed it was more likely than not that the benefi ts would not be realized. During the fourth quarter of 2003, we reversed the valuation allowance related to the net operating loss carryforwards and other temporary items as we believed it was more likely than not that we would be able to use the benefi t to reduce future tax liabilities. The reversal resulted in recognition of an income tax benefi t of $168,752 in 2003 and a corresponding increase in the deferred tax asset on the consolidated balance sheet.
As of June 27, 2004, we had fully reserved for the tax benefi ts related to the interest expense carryforwards as we believed it was more likely than not that the benefi ts would not be realized. At such time, we believed it was more likely than not that we would not realize the benefi t associated with the interest expense carryforwards due to (1) restrictions placed on the deductibility of the interest as a result of Philips’ controlling interest in us and (2) uncertainty about our ability to generate suffi cient incremental future taxable income in the United States to offset the additional interest expense deductions. During the third quarter of 2004, Philips relinquished its controlling interest in us after our initial public offering. We are now allowed to deduct the deferred interest expense in tandem with our net operating loss carryforwards. As a result, we reevaluated, in the third quarter of 2004, whether it was more likely than not that the tax benefi ts
101798FIN_r2_AnnRep05_Financials15 15101798FIN_r2_AnnRep05_Financials15 15 3/17/06 4:35:17 PM3/17/06 4:35:17 PM

16
associated with our net operating loss carryforwards together with our interest expense carryforwards would be realized. Based on that evaluation, we determined the amount of net deferred tax assets that we believed it was more likely than not that we would realize. Our estimate of the deferred tax assets that we expected was more likely than not to be realized did not require us to record an adjustment to the balance of the related valuation allowance prior to the third quarter of 2005.
During the third quarter of 2005, we recorded an income tax benefi t of $83,270 related to the reversal of the valuation allowance on a portion of our deferred tax assets. We also recorded the reversal of tax benefi ts of $1,836 related to deferred compensation. In addition, we reversed the valuation allowance on deferred tax assets associated with stock-based compensation, which resulted in an increase to additional paid-in capital of $34,552. We reassessed the realizability of the deferred tax assets and made the determination that it is more likely than not that we would be able to realize the benefi ts of the deferred tax assets related to net operating loss carryforwards and deferred interest credits in the United States. In reaching the determination, we considered both positive and negative evidence. Positive evidence included our strong recent revenue growth and operating performance, expectations regarding the generation of future taxable income, the length of available carryforward periods, our market position and the expected growth of the market. Negative evidence included our history of operating losses through 2001 and the likelihood of increased competition and loss of a signifi cant customer. From that analysis, we determined that suffi cient evidence existed to conclude that it was more likely than not that the benefi ts of certain of the deferred tax assets will be realized. Accordingly, we reversed the related valuation allowance. As of December 31, 2005, we had a valuation allowance for deferred tax assets of $2,728 related to Canadian net operating loss carryforwards and research and experimental tax credits.
During the fourth quarter of 2004, we revalued the deferred tax asset on our balance sheet due to changes in statutory corporate income tax rates, resulting in a decrease to deferred tax assets and additional income tax expense of $3,824. This revaluation was primarily due to legislation in the Netherlands enacted during the fourth quarter of 2004 that reduced statutory corporate income tax rates from 34.5% to 30% in stages over a four-year period starting in 2005. The 2006 statutory corporate income tax rate was subsequently reduced to 29.6% in the fourth quarter of 2005.
During the fourth quarter of 2005, we again revalued the deferred tax asset on our balance sheet due to changes in statutory income tax rates in the Netherlands and changes in the apportionment of income among states in the United States, resulting in a decrease to deferred tax assets and additional income tax expense of $720. Legislation was enacted in the Netherlands during the fourth quarter of 2005 that reduced the 2006 statutory corporate income tax rate to 29.6% from 30.5%.
Cash and LiquidityPrior to the year ended December 31, 2002, we had been unprofi table on an annual basis since our inception, and, as of December 31, 2005, we had an accumulated defi cit of $296,884. We had historically fi nanced our operations with borrowings from Philips and the sale of preferred stock to Philips. Philips has no obligation to provide us with any additional fi nancing in the future.
In April 2004, we declared a special cash dividend of $47,159, which was paid on June 18, 2004 to our common stockholders of record as of April 19, 2004.
As of December 31, 2005, our balance of cash and cash equivalents and marketable securities was $218,798, compared to $103,031 as of December 31, 2004, which represents an increase of $115,767. In addition, we have generated positive cash fl ow from operations for the past sixteen quarters.
Foreign Currency RiskMaterial portions of our revenue and expenses have been generated by our European operations, and we expect that our European operations will account for a material portion of our revenue and expenses in the future. Substantially all of our international expenses and revenue are denominated in foreign currencies, principally the euro. As a result, our fi nancial results could be affected by factors such as changes in foreign currency exchange rates or weak economic conditions in Europe and other foreign markets in which we have operations. Accordingly, fl uctuations in the value of those currencies in relation to the U.S. dollar have caused and will continue to cause dollar-translated amounts to vary from one period to another. In addition to currency translation risks, we incur currency transaction risk whenever one of our operating subsidiaries enters into either a purchase or a sales transaction using a currency other than the local currency in which it receives revenue and pays expenses.
Historically, we had not engaged in activities to hedge our foreign currency exposures. On April 22, 2003, we entered into a foreign currency derivative instrument to hedge certain foreign currency exposures related to intercompany transactions. See “Quantitative and Qualitative Disclosures About Market Risk.” For the year ended December 31, 2005, we generated approximately 65% of our net revenue and incurred approximately 48% of our total costs in foreign currencies. Our European operations reported revenue of $316,208 for the year ended December 31, 2005, with every one cent change in the exchange rate of the euro against the dollar resulting in approximately a $2,600 change in our revenue and approximately a $1,200 change in our operating income. Our analysis does not consider the implications that these fl uctuations could have on the overall economic activity that could exist in such an environment in the United States or Europe.
Customer ConcentrationMaterial portions of our revenue have been generated by a small number of customers, and we expect that a small number of customers will account for a material portion of our revenue in the future. Approximately 13% of our revenue for the year ended December 31, 2005 was from one customer. No other customer accounted for 10% or more of our revenue for the year ended December 31, 2005. Approximately 26% of our revenue for the year ended December 31, 2004 was from two customers, accounting for approximately 16% and 10%, respectively, of our revenue. Approximately 29% of our revenue for the year ended December 31, 2003 was from two customers, accounting for approximately 18% and 12%, respectively, of our revenue. Our top fi fteen customers accounted for approximately 75%, 77% and 76% of our revenue for the years ended December 31, 2003, 2004, and 2005, respectively.
The majority of our signifi cant customers are automobile manufacturers and suppliers to automobile manufacturers. Conditions in the market for new automobiles generally
101798FIN_r2_AnnRep05_Financials16 16101798FIN_r2_AnnRep05_Financials16 16 3/17/06 4:35:21 PM3/17/06 4:35:21 PM

17
and conditions affecting specifi c automobile manufacturers and suppliers may affect sales of vehicle navigation systems incorporating our database. Fluctuations in the automotive market have occurred in the past and are likely to occur in the future. To the extent that our future revenue depends materially on sales of new automobiles equipped with navigation systems enabled by digital maps, our business may be vulnerable to these fl uctuations.
Reverse Stock SplitOn April 27, 2004, our board of directors and stockholders approved a reverse stock split of our common stock. The ratio for the reverse stock split was 1-for-14, as determined by our board of directors. We amended our amended and restated certifi cate of incorporation on August 5, 2004 to effect the reverse split and to change the number of authorized shares of common stock to 400,000. All previously reported share amounts have been retroactively adjusted to give effect to the reverse split.
Critical Accounting EstimatesOur discussion and analysis of our fi nancial condition and results of operations are based upon our consolidated fi nancial statements, which have been prepared in accordance with U.S. generally accepted accounting principles. The preparation of these fi nancial statements requires that we make estimates and judgments that affect the reported amounts of assets, liabilities, revenue and expenses, and related disclosure of contingent assets and liabilities. On an ongoing basis, we evaluate our estimates based on historical experience and make various assumptions that we believe to be reasonable under the circumstances, the results of which form the basis for making judgments about the carrying values of assets and liabilities that are not readily apparent from other sources. Actual results may differ from these estimates under different assumptions or conditions. We believe that, of the signifi cant policies used in the preparation of our consolidated fi nancial statements (see Note 1 of Notes to Consolidated Financial Statements), the following are critical accounting estimates, which may involve a higher degree of judgment and complexity. Management has discussed the development and selection of these critical accounting estimates with our Audit Committee, and our Audit Committee has reviewed this disclosure.
Revenue RecognitionWe derive a substantial majority of our revenue from licensing our database. We provide our data to end-users through multiple distribution methods, primarily media or server-based. For example, our customers produce copies of our data on various media, such as CD-ROMs, DVDs and other storage media. Our customers then distribute those media to end-users directly and indirectly through retail establishments, automobile manufacturers and their dealers, and other redistributors. The media may be sold by our customer separately from its products, bundled with its products or otherwise incorporated into its products. We also produce copies of our data and distribute those copies to end-users both directly and indirectly through automobile manufacturers and their dealers. In those cases where we produce and distribute copies to end-users, the copies are either compiled into our customers’ proprietary format for use with the customers’ products or are in our common database physical storage format. Additionally, some of our customers store our data on servers and distribute information, such as map
images and driving directions, derived from our data over the Internet and through other communication networks.
Revenue is recognized net of provisions for estimated uncollectible amounts and anticipated returns. Our map database license agreements provide evidence of our arrangements with our customers, and identify key contract terms related to pricing, delivery and payment. We do not recognize revenue from licensing our database until delivery has occurred and collection is considered probable. We provide for estimated product returns at the time of revenue recognition based on our historical experience for such returns, which have not been material. As a result, we do not believe there is signifi cant risk of recognizing revenue prematurely.
For revenue distributed through the media-based method, license fees from usage (including license fees in excess of the nonrefundable minimum fees) are recognized in the period in which they are reported by the customer to us. Prepaid licensing fees are recognized in the period in which the distributor or customer reports that it has shipped our database to the end-user. Revenue for direct sales is recognized when the database is shipped to the end-user.
For revenue distributed through the server-based method, revenue includes amounts that are associated with nonrefundable minimum licensing fees, license fees from usage (including license fees in excess of nonrefundable minimum fees), recognition of prepaid licensing fees from our distributors and customers and direct sales to end-users. Nonrefundable minimum annual licensing fees are received upfront and represent a minimum guarantee of fees to be received from the licensee (for sales made by that party to end-users) during the period of the arrangement. We generally cannot determine the amount of up-front license fees that have been earned during a given period until we receive a report from the customer. Accordingly, we amortize the total up-front fee paid by the customer ratably over the term of the arrangement. When we determine that the actual amount of licensing fees earned exceeds the cumulative revenue recognized under the amortization method (because the customer reports licensing fees to us that exceed this amount), we recognize the additional licensing revenue.
Licensing arrangements that entitle the customer to unspecifi ed updates over a period of time are recognized as revenue ratably over the period of the arrangement.
Allowance for Doubtful AccountsWe record allowances for estimated losses from uncollectible accounts based upon specifi cally-identifi ed amounts that we believe to be uncollectible. In addition, we record additional allowances based on historical experience and our assessment of the general fi nancial condition of our customer base. If our actual collections experience changes, revisions to our allowances may be required. We have a number of customers with individually large amounts due at any given balance sheet date. Any unanticipated change in the creditworthiness of one of these customers or other matters affecting the collectibility of amounts due from these customers could have a material adverse affect on our results of operations in the period in which these changes or events occur.
The allowance for doubtful accounts as refl ected in our consolidated balance sheet refl ects our best estimate of the amount of our gross accounts receivable that will not be collected. Our actual level of bad debts has been relatively stable in recent years, which we believe is due to our practice of requiring
101798FIN_r2_AnnRep05_Financials17 17101798FIN_r2_AnnRep05_Financials17 17 3/17/06 4:35:24 PM3/17/06 4:35:24 PM
18
customer prepayments in certain instances together with prompt identifi cation of potential problem accounts. We continue to refi ne our estimates for bad debts as our business grows, and while our credit losses have historically been within both our expectations and the provision recorded, fl uctuations in credit loss rates in the future may affect our fi nancial results.
Database Creation, Distribution and Software Development CostsWe have invested signifi cant amounts in creating and updating our database and developing related software applications for internal use. Database creation and distribution costs consist of database creation and updating, database licensing and distribution, and database-related software development. Database creation and updating costs are expensed as incurred. These costs include the direct costs of database creation and validation, costs to obtain information used to construct the database, and ongoing costs for updating and enhancing the database content. Database licensing and distribution costs include the direct costs related to reproduction of the database for licensing and per-copy sales and shipping and handling costs. Database-related software development costs consist primarily of costs for the development of software as follows: (i) applications used internally to improve the effectiveness of database creation and updating activities, (ii) enhancements to internal applications that enable our core database to operate with emerging technologies, and (iii) applications to facilitate customer use of our database. Costs of internal-use software are accounted for in accordance with AICPA Statement of Position (“SOP”) No. 98-1, “Accounting for the Costs of Computer Software Developed or Obtained for Internal Use.” Accordingly, certain application development costs relating to internal-use software have been capitalized and are being amortized on a straight-line basis over the estimated useful lives of the assets. It is possible that our estimates of the remaining economic life of the technology could change from the current amortization periods. In that event, impairment charges or shortened useful lives of internal-use software could be required.
Impairment of Long-lived AssetsAs of December 31, 2004 and 2005, our long-lived assets consisted of property and equipment, internal-use software and acquired intangible assets. We review long-lived assets for impairment whenever events or changes in circumstances indicate that the carrying amount of an asset may not be recoverable. Recoverability of assets to be held and used is measured by comparison of the carrying amount of an asset to estimated undiscounted future cash fl ows expected to be generated by the asset. If the carrying amount of an asset exceeds its estimated future cash fl ows, an impairment charge is recognized in the amount by which the carrying amount of the asset exceeds the fair value of the asset. Signifi cant management judgment is required in determining the fair value of our long-lived assets to measure impairment, including projections of future discounted cash fl ows.
Realizability of Deferred Tax AssetsThe assessment of the realizability of deferred tax assets involves a high degree of judgment and complexity. In assessing the realizability of deferred tax assets, management considers whether it is more likely than not that some portion or all of the deferred tax assets will not be realized. The realization of deferred tax assets is dependent upon the generation of future taxable
income during the periods in which temporary differences, as determined pursuant to Statement of Financial Accounting Standards (SFAS) No. 109, “Accounting for Income Taxes,” become deductible. Management considers the scheduled reversal of deferred tax liabilities, projected future taxable income, and tax planning strategies in making this assessment. Management’s evaluation of the realizability of deferred tax assets must consider both positive and negative evidence, and the weight given to the potential effects of positive and negative evidence is based on the extent to which it can be objectively verifi ed. We have generated signifi cant taxable losses since our inception, and prior to the year ended December 31, 2003, management had concluded that a valuation allowance against substantially all of our deferred tax assets was required. However, our European operations generated taxable profi ts throughout 2002, and for the year ended December 31, 2003, both our European and U.S. operations generated taxable income. During 2003, we assessed the realizability of our deferred tax assets by weighing both positive and negative evidence. Positive evidence included qualitative factors such as growing market acceptance of navigation products in Europe and North America, particularly in automobiles, our leading competitive positions in both Europe and the U.S., and the signifi cant time required and cost involved in building a database such as ours. Positive quantitative evidence included our strong recent operating performance in both Europe and the U.S., our projections of our future operating results that indicate that we will be able to generate suffi cient taxable income to fully realize the benefi ts of our existing loss carryforwards before they expire, and the length of carryforward periods related to our net operating losses, approximately half of which have no statutory expiration date. Negative evidence included our history of operating losses through 2001, the likelihood of increased competition and the loss of a large customer. After evaluating the available evidence, management determined that suffi cient objective evidence existed to conclude that it was more likely than not that a portion of the deferred tax assets would be realized. Accordingly, we reversed the valuation allowance related to net operating loss carryforwards and other temporary items in Europe and the United States, resulting in the recognition of an income tax benefi t of $168,752 in 2003.
As of June 27, 2004, we had fully reserved for the tax benefi ts related to interest expense carryforwards as we believed it was more likely than not that the benefi ts would not be realized. At that time, we believed it was more likely than not that we would not realize the benefi t associated with the interest expense carryforwards due to (1) restrictions placed on the deductibility of the interest as a result of Philips’ controlling interest in us and (2) our ability to generate suffi cient incremental future taxable income in the United States to offset the additional interest expense deductions. During the third quarter of 2004, Philips relinquished its controlling interest in us after our initial public offering. We were then allowed to deduct the deferred interest expense in tandem with our net operating loss carryforwards. Consequently, we reevaluated, in the third quarter of 2004, whether it was more likely than not that the tax benefi ts associated with our net operating loss carryforwards and our interest expense carryforwards would be realized. Our evaluation considered both positive and negative evidence, and the weight given to the potential effects of positive and negative evidence was based on the extent to which it can be objectively verifi ed in the same manner as described above for the evaluation completed in 2003. Based on this evaluation, we determined the amount of
101798FIN_r2_AnnRep05_Financials18 18101798FIN_r2_AnnRep05_Financials18 18 3/17/06 4:35:28 PM3/17/06 4:35:28 PM

19
net deferred tax assets that we believed was more likely than not that we will realize. The amount that was determined did not require us to record an adjustment to the balance of the related valuation allowance.
During the third quarter of 2005, we reassessed the realizability of the deferred tax assets and made the determination that it is more likely than not that we would be able to realize the benefi ts of the deferred tax assets related to net operating loss carryforwards and deferred interest credits in the United States. In reaching the determination, we considered both positive and negative evidence. Positive evidence included our strong recent revenue growth and operating performance, expectations regarding the generation of future taxable income, the length of available carryforward periods, our market position and the expected growth of the market. Negative evidence included our history of operating losses through 2001 and the likelihood of increased competition and loss of a signifi cant customer. From that analysis, we determined that suffi cient evidence existed to conclude that it was more likely than not that the benefi ts of certain of the deferred tax assets will be realized. Accordingly, we reversed the related valuation allowance and recorded an income tax benefi t of $83,270. In addition, we reversed the valuation allowance on deferred tax assets associated with stock-based compensation, which resulted in an increase to additional paid-in capital of $34,552.
As of December 31, 2005, we had a valuation allowance for deferred tax assets of $2,728 related to Canadian net operating loss carryforwards, and research and experimental tax credits.
We cannot assure you that we will continue to experience taxable income at levels consistent with recent performance in some or all of the jurisdictions in which we do business. In the event that actual taxable income differs from our projections of taxable income by jurisdiction, changes in the valuation allowance, which could affect our fi nancial position and net income, may be required.
Results of OperationsComparison of Years Ended December 31, 2004 and 2005Operating Income, Net Income and Net Income Per Share of Common Stock. Our operating income increased from $94,586 in 2004 to $134,256 in 2005, due primarily to our revenue growth in 2005. Our net income increased from $54,066 in 2004 to $170,830 in 2005, due primarily to the $83,270 effect of the reversal of the valuation allowance on our deferred tax assets related to net operating loss carryforwards and deferred interest credits in 2005 and our higher operating income. Basic net income per share of common stock increased from $0.62 in 2004 to $1.90 in 2005. Diluted net income per share of common stock increased from $0.59 in 2004 to $1.81 in 2005.
The following table highlights changes in selected line items, which are material to our results of operations. An analysis of the factors affecting each line is provided in the paragraphs that appear after the table. In addition, the percentage changes for other income (expense) and income tax benefi t (expense) as compared to the prior year are not specifi ed below. We believe that these percentages are not meaningful since the changes are unusually large due to non-recurring items more fully described in the narrative section for each.
2004 2005 Change % Change
Net revenue $ 392,858 496,512 103,654 26.4%Database creation and distribution costs 186,330 222,933 36,603 19.6%Selling, general and administrative expenses 111,942 139,323 27,381 24.5%Other income (expense) (758) 4,735 5,493Income tax (benefi t) expense 39,762 (31,839) (71,601)
Net Revenue. The increase in total revenue was due to a signifi cant increase in database licensing, resulting primarily from increased unit sales to existing customers. Growth occurred in all geographic regions in 2005. European revenue increased 18.2% from $267,541 in 2004 to $316,208 in 2005. North American revenue increased 37.9% from $125,317 in 2004 to $172,789 in 2005. European and North American revenue both increased primarily due to the increase in unit sales to vehicle navigation systems vendors, automobile manufacturers and mobile device manufacturers. Foreign currency translation decreased revenue within the European operations by approximately $666 during 2005 due to the weakening of the euro. Revenue related to sales of our database used in vehicle navigation systems as a percentage of our revenue decreased to 72% of our revenue in 2005 from 82% of our revenue in 2004. Approximately 26% of our revenue for 2004 came from two customers (accounting for approximately 16% and 10% of total revenue, respectively), while only one customer accounted for more than 10% of our revenue in 2005 (accounting for 13%).
Database Creation and Distribution Costs. The increase in database creation and distribution costs was due primarily to increased production costs of approximately $20,700 in 2005 as compared to 2004, associated with higher sales where we provided distribution services, and our continued investment in updating, improving and maintaining the coverage of our database that resulted in an increase of approximately $20,500 in 2005 as compared to 2004. This was offset by lower expenses related to technological enhancements to our database in both North America and Europe that resulted in a decrease of approximately $4,200 in 2005 as compared to 2004. Reducing these expenses was the capitalization of $12,792 and $12,369 of development costs for internal-use software in 2004 and 2005, respectively.
Selling, General and Administrative Expenses. The increase in selling, general and administrative expenses was due primarily to our investments in growing the size of our worldwide sales force and expanding the breadth of our product offerings resulting in an increase of approximately $20,000 in 2005 as compared to 2004. Also contributing to the increase were expenses related to improving our infrastructure to support future growth that resulted in an increase of approximately $7,700 in 2005 as compared to 2004. Included in selling, general and administrative expenses during 2005 was approximately $2,400 of costs related to our obligation to match social taxes on employee stock option exercises.
101798FIN_r2_AnnRep05_Financials19 19101798FIN_r2_AnnRep05_Financials19 19 3/17/06 4:35:32 PM3/17/06 4:35:32 PM

20
Other Income (Expense). Interest income increased from $1,158 in 2004 to $4,262 in 2005 primarily due to higher average cash balances in 2005 as well as higher percentage returns on the invested cash. In addition, during 2004 we recorded a foreign currency loss of $1,686 as compared to a foreign currency gain of $502 in 2005. The gain in 2005 was primarily due to the strengthening of the US dollar as compared to the euro.
Income Tax (Benefi t) Expense. The decrease in income tax expense is primarily due to the income tax benefi t of $83,270 recorded in the third quarter of 2005, as a result of the reversal of the valuation allowance on a portion of our deferred tax asset. In addition, we recorded expense of $1,836 related to deferred compensation and expense of $720 related to the revaluation of our deferred tax asset due to changes in statutory income tax rates in the Netherlands and changes in the apportionment of income among states in the United States. Excluding the effects of the net income tax benefi t recorded in 2005, the effective tax rate in 2005 was 35.16% as compared to 38.3% in 2004. The decrease in the effective tax rate was primarily due to legislation in the Netherlands enacted during the fourth quarter of 2004 that reduced statutory corporate income tax rates from 34.5% to 30% in stages over a four-year period starting in 2005. The Dutch statutory corporate income tax rate for 2006 was subsequently reduced in the fourth quarter of 2005 from 30.5% to 29.6%.
Comparison of Years Ended December 31, 2003 and 2004Operating Income, Net Income and Net Income Per Share of Common Stock. Our operating income increased from $63,758 in 2003 to $94,586 in 2004, due primarily to our revenue growth in 2004. Our net income decreased from $235,815 in 2003 to $54,066 in 2004, due primarily to the $168,752 effect of the reversal of the valuation allowance on our deferred tax assets related to net operating loss carryforwards and other temporary items in 2003; the recording of a full income tax provision in 2004; and a tax adjustment recorded in 2004 related to changes in statutory corporate income tax rates. Basic net income per share of common stock decreased from $2.81 in 2003 to $0.62 in 2004. Diluted net income per share of common stock decreased from $2.69 in 2003 to $0.59 in 2004.
The following table highlights changes in selected line items, which are material to our results of operations. An analysis of the factors affecting each line is provided in the paragraphs that appear after the table. In addition, the percentage change for other income (expense) and income tax (benefi t) expense as compared to the prior year is not specifi ed below. We believe that these percentages are not meaningful since the changes are unusually large due to non-recurring items more fully described in the narrative section for each.
2003 2004 Change % Change
Net revenue $ 272,623 392,858 120,235 44.1%Database creation and distribution costs 125,841 186,330 60,489 48.1%Selling, general and administrative expenses 83,024 111,942 28,918 34.8%Other income (expense) 6,543 (758) (7,301)Income tax (benefi t) expense (165,514) 39,762 205,276
Net Revenue. The increase in total revenue was due to a signifi cant increase in database licensing, resulting primarily from increased unit sales to existing customers. Growth occurred in all geographic regions in 2004, as North American revenue increased 36.7% from $91,664 in 2003 to $125,317 in 2004, and European revenue increased 47.8% from $180,959 in 2003 to $267,541 in 2004. North American and European revenue both increased primarily due to the increase in unit sales to vehicle navigation systems vendors and automobile manufacturers during 2004. Foreign currency translation increased revenue within the European operations by approximately $17,649 during 2004 due to the strengthening of the euro. Excluding the effect of foreign currency translation, European revenue would have grown 38.1%. Revenue related to sales of our database used in vehicle navigation systems as a percentage of our revenue decreased to 82% of our revenue in 2004 from 83% of our revenue in 2003. Approximately 29% of our revenue for 2003 came from two customers (accounting for approximately 18% and 12% of total revenue, respectively), while approximately 26% of our revenue for 2004 came from two customers (accounting for approximately 16% and 10% of total revenue, respectively).
Database Creation and Distribution Costs. The increase in database creation and distribution costs was due primarily to increased production costs of approximately $29,400 in 2004 as compared to 2003, as a result of growth in database licensing activities, and our continued investment in updating, improving and maintaining the coverage of our database that resulted in an increase of approximately $16,600 in 2004 as compared to 2003, as well as increased efforts related to technological enhancements to our database in both North America and Europe that resulted in an increase of approximately $8,700 in 2004 as compared to 2003. In addition, there was an unfavorable foreign currency translation effect within European operations of approximately $5,800 due to the strengthening euro. Reducing these expenses was the capitalization of $9,966 and $12,792 of development costs for internal-use software in 2003 and 2004, respectively.
101798FIN_r2_AnnRep05_Financials20 20101798FIN_r2_AnnRep05_Financials20 20 3/17/06 4:35:35 PM3/17/06 4:35:35 PM

21
Selling, General and Administrative Expenses. The increase in selling, general and administrative expenses was due primarily to our investments in growing the size of our worldwide sales force and marketing initiatives to expand the breadth of our product offerings and to diversify our customer base that together resulted in an increase of approximately $13,700 in 2004 as compared to 2003. Also contributing to the increase were expenses related to improving our infrastructure to support future growth that resulted in an increase of approximately $12,500 in 2004 as compared to 2003 plus an unfavorable foreign currency translation effect within European operations of approximately $2,700 due to the strengthening euro.
Other Income (Expense). As of January 1, 2003, the U.S. dollar denominated intercompany loan obligation of one of our European subsidiaries to us and one of our North American subsidiaries was re-classifi ed from a permanent advance to an obligation that management intends to settle. This change in classifi cation was based on management’s intention that the loan be repaid in full and on the ability of the European subsidiary to repay the loan. In accordance with SFAS No. 52, “Foreign Currency Translation,” the foreign currency gains and losses resulting from the change in the U.S. dollar/euro exchange rate are refl ected as a component of other income (expense). For the year ended December 31, 2003, we recognized a net foreign currency gain of $6,174 compared to a net foreign currency loss of $(1,686) for the year ended December 31, 2004. The gain in 2003 primarily occurred before we entered into a foreign currency swap agreement to hedge the exchange rate effects on the aforementioned intercompany loan (See Note 11 of Notes to Consolidated Financial Statements).
In addition, interest income increased from $414 in 2003 to $1,158 in 2004 primarily due to higher average cash balances in 2004 as well as higher percentage returns on the invested cash.
Income Tax Benefi t (Expense). The income tax benefi t in 2003 was primarily due to the reversal of the valuation allowance on deferred tax assets related to net operating loss carryforwards. During 2003, we determined that it was more likely than not that we would be able to realize the benefi t of the net operating loss carryforwards in Europe and the United States. The reversal of the valuation allowance together with the recognition of changes in other temporary differences resulted in our recording of a deferred income tax benefi t of $168,752 and the recognition of a corresponding net deferred tax asset on our consolidated balance sheet. In 2004, we began recording an income tax provision based on our taxable income and applicable income tax rates in each jurisdiction, resulting in a tax provision of $35,938. During the fourth quarter of 2004, we revalued the deferred tax asset on our balance sheet due to changes in statutory corporate income tax rates, resulting in a decrease to the asset and additional income tax expense of $3,824, bringing the total income tax provision to $39,762. This revaluation was primarily due to legislation in the Netherlands enacted during the fourth quarter of 2004 that reduced statutory corporate income tax rates starting in 2005 from a rate of 34.5% in 2004 to 30.0% by 2007. The 2006 statutory corporate income tax rate was subsequently reduced to 29.6% in the fourth quarter of 2005. Current income tax expense of $3,238 in 2003 related to various foreign countries where we do not have tax loss carryforwards.
Liquidity and Capital ResourcesSince 2002, we have fi nanced our operations through cash generated from operating income. As of December 31, 2005, cash and cash equivalents and marketable securities totaled $218,798. In April 2004, we declared a special cash dividend of $47,159, which was paid on June 18, 2004 to our common stockholders of record as of April 19, 2004.
On November 30, 2005, we extended and increased, through our operating subsidiary for North America, our revolving line of credit that is now scheduled to mature on December 1, 2006. Pursuant to the terms of the line of credit, we may borrow up to $50,000 at an interest rate of either U.S. LIBOR plus 0.5% or the greater of the prime rate or the Federal funds rate plus 0.5%. We are required to pay to the bank a quarterly facility fee of 7.5 basis points per annum on the average daily unused commitment. We have guaranteed our operating subsidiary’s obligations under this facility. As of December 31, 2005, there were no outstanding borrowings against this line of credit.
Since the fi rst quarter of 2002, our operations have continued to produce positive cash fl ows. The cash fl ows have been driven by increased demand for our products and our ability to deliver these products profi tably and collect receivables from our customers effectively. These funds have allowed us to make investments required to grow the business and have provided us excess cash. We previously deposited cash in excess of our short-term operational needs with Philips pursuant to deposit agreements. The deposit agreements expired on August 11, 2004, at which time we invested cash balances in excess of our short-term operational needs in cash equivalents and marketable securities of high credit quality.
The following table presents our contractual cash obligations as of December 31, 2005:
Payments Due by Period
Contractual 1 Year 1-3 4-5 AfterCash Obligations Total or Less Years Years 5 Years
Operating leases $ 35,899 13,327 14,703 6,377 1,492
We do not have any off-balance sheet arrangements other than the operating leases identifi ed in the table above.
We believe that our current cash resources on hand, temporary excess cash deposited in cash equivalents and marketable securities, and cash fl ows from operations, together with funds available from the revolving line of credit, will be adequate to satisfy our anticipated working capital needs and capital expenditure requirements at our current level of operations for at least the next twelve months. We do, however, consider additional debt and equity fi nancing from time to time and may enter into these fi nancings in the future.
Cash and cash equivalents increased by $54,969 during the year ended December 31, 2005. The changes in cash and cash equivalents for the periods ended are as follows:
Year ended Dec. 31, 2003 2004 2005
Cash provided by operations $ 65,948 106,422 137,753Cash used in investing activities (74,542) (34,124) (94,530)Cash provided by (used in) fi nancing activities 288 (45,766) 14,190Effect of exchange rates on cash 861 1,587 (2,444)Increase (decrease) in cash and cash equivalents $ (7,445) 28,119 54,969
101798FIN_r2_AnnRep05_Financials21 21101798FIN_r2_AnnRep05_Financials21 21 3/17/06 4:35:39 PM3/17/06 4:35:39 PM

22
Operating ActivitiesFor each of the past three fi scal years, net cash provided by operating activities has improved signifi cantly, primarily as a result of improved operating results driven by increased demand for our products. In general, the growth in our operating assets and liabilities has coincided with the profi table growth in our business. Accounts receivable increased $12,061, $10,086 and $29,693 for the years ended December 31, 2003, 2004 and 2005, respectively, primarily due to the overall growth in our revenue. In 2004, our balance of deposits and other assets increased $8,711 primarily due to payments for third party content for our database. Accounts payable increased $9,876 and $6,057 during the years ended December 31, 2003 and 2005 primarily due to expenses incurred related to the growth of our operations and the timing of the related payments. Accrued payroll and related liabilities increased $6,536 during 2004 primarily due to the accrual of annual employee compensation programs that were paid in the fi rst quarter of 2005. Deferred revenue decreased $6,060 during the year ended December 31, 2003, as previous customer prepayments were recognized as revenue during the period. Deferred revenue increased $14,431 during 2004 primarily due to a $30,000 prepayment by a customer as described in the following paragraph, offset by revenue recognized.
The $30,000 payment was the result of an agreement that we entered into with a customer during the fi rst quarter of 2004 whereby the customer agreed to prepay $30,000. The customer may apply a portion of the prepayment for license fees due to us in any calendar year under the agreement. In the event the prepayment is not fully exhausted by the end of calendar year 2009, the customer may extend the term of the agreement to the end of calendar year 2010. The prepayment was initially recorded as deferred revenue and will be recognized according to our revenue recognition policy as we receive royalty reports from the customer evidencing their use of the prepaid licenses. The amount of recognition for prepaid licenses will be limited to $10,000 each fi scal year for 2004, 2005 and 2006. Accordingly, $10,000 of the prepayment will be reported in short-term deferred revenue. With respect to the prepayment, we have no obligation to refund any unused amounts nor are there any restrictions on the nature or timing of our use of the cash received.
Investing ActivitiesCash used in investing activities has primarily consisted of capitalized costs related to software developed for internal use, amounts placed on deposit with Philips, purchases of marketable securities, capital expenditures and acquisitions. We experienced temporary excess funds that were provided from operations for 2003, 2004, and 2005. We put those funds on deposit with Philips until August 11, 2004, since which we have invested such funds in cash equivalents and marketable securities. The net increases in our deposits were $55,307 for 2003. For the year ended December 31, 2004, net deposits decreased by $65,199 because the related deposit agreements with Philips expired upon completion of the initial public offering. Upon expiration of these deposit agreements, we invested cash balances in excess of our short-term operational needs in cash equivalents and marketable securities. During 2004 and 2005, we invested $73,166 and $62,260, respectively in marketable securities.
Costs for software developed for internal use have been capitalized in accordance with SOP 98-1 and are related to applications used internally to improve the effectiveness of database creation and updating activities, enhancements to internal applications that enable our core database to operate with emerging technologies and applications to facilitate usage of our map database by customers. Capitalized costs totaled $9,966, $12,792 and $12,369 for 2003, 2004, and 2005, respectively. We expect the capitalized costs related to software developed for internal use to be approximately $6,000 to $8,000 in 2006.
We have continued to invest in property and equipment to meet the demands of growing our business by expanding our facilities and providing the necessary infrastructure. Capital expenditures totaled $9,269, $12,875 and 10,466 during 2003, 2004, and 2005, respectively. We expect capital expenditures to total approximately $12,000 to $14,000 in 2006.
Financing ActivitiesIn April 2004, we declared a special cash dividend of $47,159, which was paid on June 18, 2004 to our common stockholders of record as of April 19, 2004. We currently intend to retain future earnings, if any, to fi nance the expansion of our business and do not expect to pay any cash dividends in the foreseeable future. See “Item 5. Market for Registrant’s Common Equity and Related Stockholder Matters.”
New Accounting Pronouncements
In December 2004, the FASB issued SFAS No. 123(R), “Share-Based Payment,” to be effective for interim or annual periods beginning after June 15, 2005. On April 14, 2005, the Securities and Exchange Commission amended the compliance dates to require SFAS No.123(R) to be effective for fi scal years beginning after June 15, 2005. SFAS No. 123(R) supersedes APB Opinion No. 25 and requires all share-based payments to employees, including grants of employee stock options, to be recognized as an operating expense in the income statement. The cost will be recognized over the requisite service period based on fair values measured on grant dates. We will adopt the new standard using the modifi ed prospective transition method, which permits recognition of expense on or after the effective date for the portion of outstanding awards for which the requisite service has not yet been rendered. We expect to record expense of approximately $15,000 in 2006 related to our share-based employee compensation programs.
Quantitative and Qualitative Disclosures About Market Risk We invest our cash in highly liquid cash equivalents and marketable securities. We do not believe that our exposure to interest rate risk is material to our results of operations.
Material portions of our revenue and expenses have been generated by our European operations, and we expect that our European operations will account for a material portion of our revenue and expenses in the future. In addition, substantially all of our expenses and revenue related to our international operations are denominated in foreign currencies, principally the euro.
101798FIN_r2_AnnRep05_Financials22 22101798FIN_r2_AnnRep05_Financials22 22 3/17/06 4:35:42 PM3/17/06 4:35:42 PM

23
We are also subject to foreign currency exposure between the U.S. dollar and the euro on the expected repayment of an intercompany obligation. The intercompany balance is payable by one of our European subsidiaries to us and one of our U.S. subsidiaries, and is due in U.S. dollars. Through December 31, 2002, this intercompany balance was considered permanent in nature, as repayment was not expected to occur in the foreseeable future. However, primarily as a result of improved operating performance in our European business, management concluded that cash fl ows would be suffi cient to support repayment over the next several years. Accordingly, effective January 1, 2003, we adopted a plan for repayment and the loan was no longer designated as permanent in nature.
Prior to April 22, 2003, we had not engaged in activities to hedge our foreign currency exposures. On that day, we entered into a U.S. dollar/euro currency swap agreement (the “Swap”) with Koninklijke Philips Electronics N.V. to minimize the exchange rate exposure between the U.S. dollar and the euro on the expected repayment of the intercompany obligation. The Swap was assigned to an unaffi liated third party in the third quarter of 2004. The Swap was not designated for hedge accounting. Under the terms of the Swap, one of the Company’s European subsidiaries makes payments to the other party to the Swap in euros in exchange for the U.S. dollar equivalent at a fi xed exchange rate of $1.0947 U.S. dollar/euro. The U.S. dollar proceeds obtained under the Swap are utilized to make payments of principal on the intercompany loan. The outstanding principal balance under the intercompany loan was $187.1 million at April 22, 2003. The Swap has a maturity date of December 22, 2006 and provides for settlement on a monthly basis in proportion to the repayment of the intercompany obligation. As of December 31, 2005, the outstanding intercompany obligation (net of payments) was $40.3 million.
For purposes of specifi c risk analysis, we use sensitivity analysis to determine the effects that market risk exposures may have on the fair value of our Swap. The foreign currency exchange risk is computed based on the market value of future cash fl ows as affected by the changes in the rates attributable to the market risk being measured. The sensitivity analysis represents the hypothetical changes in value of the hedge position and does not refl ect the opposite gain or loss on the underlying transaction. As of December 31, 2005, a 10% decrease in the value of the euro against the U.S. dollar with all other variables held constant would result in a decrease in the fair value of our Swap liability of $4.4 million, while a 10% increase in the value of the euro against the U.S. dollar would result in an increase in the fair value of our Swap liability of $4.4 million.
101798FIN_r2_AnnRep05_Financials23 23101798FIN_r2_AnnRep05_Financials23 23 3/17/06 4:35:46 PM3/17/06 4:35:46 PM

24
Management’s Report on Internal Control over Financial ReportingManagement of NAVTEQ Corporation and subsidiaries is responsible for establishing and maintaining adequate internal control over fi nancial reporting, as defi ned in Rule 13a-15(f) of the Exchange Act. Management has assessed the effectiveness of our internal control over fi nancial reporting as of December 31, 2005 based on criteria established in Internal Control—Integrated Framework issued by the Committee of Sponsoring Organizations of the Treadway Commission. As a result of this assessment, management concluded that, as of December 31, 2005, our internal control over fi nancial reporting was effective in providing reasonable assurance regarding the reliability of fi nancial reporting and the preparation of fi nancial statements for external purposes in accordance with generally accepted accounting principles. Management’s assessment of the effectiveness of our internal control over fi nancial reporting as of December 31, 2005 has been audited by KPMG LLP, an independent registered public accounting fi rm, as stated in their report appearing on page 26.
Limitations on ControlsManagement does not expect that our disclosure controls and procedures or our internal control over fi nancial reporting will prevent or detect all errors and fraud. Any control system, no matter how well designed and operated, is based upon certain assumptions and can provide only reasonable, not absolute, assurance that its objectives will be met. Further, no evaluation of controls can provide absolute assurance that misstatements due to error or fraud will not occur or that all control issues and instances of fraud, if any, within NAVTEQ Corporation have been detected.
101798FIN_r2_AnnRep05_Financials24 24101798FIN_r2_AnnRep05_Financials24 24 3/17/06 4:35:49 PM3/17/06 4:35:49 PM

25
Report of Independent Registered Public Accounting FirmThe Board of Directors and StockholdersNAVTEQ Corporation:
We have audited the accompanying consolidated balance sheets of NAVTEQ Corporation and subsidiaries (the Company) as of December 31, 2004 and 2005, and the related consolidated statements of operations, stockholders’ equity and comprehensive income, and cash fl ows for each of the years in the three-year period ended December 31, 2005. These consolidated fi nancial statements are the responsibility of the Company’s management. Our responsibility is to express an opinion on these consolidated fi nancial statements based on our audits.
We conducted our audits in accordance with the standards of the Public Company Accounting Oversight Board (United States). Those standards require that we plan and perform the audit to obtain reasonable assurance about whether the fi nancial statements are free of material misstatement. An audit includes examining, on a test basis, evidence supporting the amounts and disclosures in the fi nancial statements. An audit also includes assessing the accounting principles used and signifi cant estimates made by management, as well as evaluating the overall fi nancial statement presentation. We believe that our audits provide a reasonable basis for our opinion.
In our opinion, the consolidated fi nancial statements referred to above present fairly, in all material respects, the fi nancial position of NAVTEQ Corporation and subsidiaries as of December 31, 2004 and 2005, and the results of their operations and their cash fl ows for each of the years in the three-year period ended December 31, 2005, in conformity with U.S. generally accepted accounting principles. We also have audited, in accordance with the standards of the Public Company Accounting Oversight Board (United States), the effectiveness of NAVTEQ Corporation’s internal control over fi nancial reporting as of December 31, 2005, based on criteria established in Internal Control—Integrated Framework issued by the Committee of Sponsoring Organizations of the Treadway Commission (COSO), and our report dated February 28, 2006 expressed an unqualifi ed opinion on management’s assessment of, and the effective operation of, internal control over fi nancial reporting.
Chicago, IllinoisFebruary 28, 2006
101798FIN_r2_AnnRep05_Financials25 25101798FIN_r2_AnnRep05_Financials25 25 3/17/06 4:35:53 PM3/17/06 4:35:53 PM

26
Report of Independent Registered Public Accounting Firm The Board of Directors and Stockholders NAVTEQ Corporation:
We have audited management’s assessment, included in Management’s Report on Internal Control over Financial Reporting in this annual report, that NAVTEQ Corporation (the Company) maintained effective internal control over fi nancial reporting as of December 31, 2005, based on criteria established in Internal Control—Integrated Framework issued by the Committee of Sponsoring Organizations of the Treadway Commission (COSO). NAVTEQ Corporation’s management is responsible for maintaining effective internal control over fi nancial reporting and for its assessment of the effectiveness of internal control over fi nancial reporting. Our responsibility is to express an opinion on management’s assessment and an opinion on the effectiveness of the Company’s internal control over fi nancial reporting based on our audit.
We conducted our audit in accordance with the standards of the Public Company Accounting Oversight Board (United States). Those standards require that we plan and perform the audit to obtain reasonable assurance about whether effective internal control over fi nancial reporting was maintained in all material respects. Our audit included obtaining an understanding of internal control over fi nancial reporting, evaluating management’s assessment, testing and evaluating the design and operating effectiveness of internal control, and performing such other procedures as we considered necessary in the circumstances. We believe that our audit provides a reasonable basis for our opinion.
A company’s internal control over fi nancial reporting is a process designed to provide reasonable assurance regarding the reliability of fi nancial reporting and the preparation of fi nancial statements for external purposes in accordance with generally accepted accounting principles. A company’s internal control over fi nancial reporting includes those policies and procedures that (1) pertain to the maintenance of records that, in reasonable detail, accurately and fairly refl ect the transactions and dispositions of the assets of the company; (2) provide reasonable assurance that transactions are recorded as necessary to permit preparation of fi nancial statements in accordance with generally accepted accounting principles, and that receipts and expenditures of the company are being made only in accordance with authorizations of management and directors of the company; and (3) provide reasonable assurance regarding prevention or timely detection of unauthorized acquisition, use, or disposition of the company’s assets that could have a material effect on the fi nancial statements.
Because of its inherent limitations, internal control over fi nancial reporting may not prevent or detect misstatements. Also, projections of any evaluation of effectiveness to future periods are subject to the risk that controls may become inadequate because of changes in conditions, or that the degree of compliance with the policies or procedures may deteriorate.
In our opinion, management’s assessment that NAVTEQ Corporation maintained effective internal control over fi nancial reporting as of December 31, 2005, is fairly stated, in all material respects, based on criteria established in Internal Control—Integrated Framework issued by the Committee of Sponsoring Organizations of the Treadway Commission (COSO). Also, in our opinion, NAVTEQ Corporation maintained, in all material respects, effective internal control over fi nancial reporting as of December 31, 2005, based on criteria established in Internal Control—Integrated Framework issued by the Committee of Sponsoring Organizations of the Treadway Commission (COSO). We also have audited, in accordance with the standards of the Public Company Accounting Oversight Board (United States), the consolidated balance sheets of NAVTEQ Corporation and subsidiaries as of December 31, 2004 and 2005, and the related consolidated statements of operations, stockholders’ equity and comprehensive income, and cash fl ows for each of the years in the three-year period ended December 31, 2005, and our report dated February 28, 2006 expressed an unqualifi ed opinion on those consolidated fi nancial statements.
Chicago, IllinoisFebruary 28, 2006
101798FIN_r2_AnnRep05_Financials26 26101798FIN_r2_AnnRep05_Financials26 26 3/17/06 4:35:56 PM3/17/06 4:35:56 PM

27
NAVTEQ Corporation and SubsidiariesConsolidated Balance Sheets(In thousands, except per share amounts)
December 31, December 31, 2004 2005
AssetsCurrent assets: Cash and cash equivalents $ 30,101 85,070 Short-term marketable securities 45,650 84,299 Accounts receivable, net of allowance for doubtful accounts of $3,571 and $4,852 in 2004 and 2005, respectively 56,582 82,352 Deferred income taxes 50,696 42,584 Prepaid expenses and other current assets 8,348 15,203
Total current assets 191,377 309,508Property and equipment, net 18,220 20,828Capitalized software development costs, net 26,243 25,761Long-term deferred income taxes 92,069 169,264Long-term marketable securities 27,280 49,429Acquired intangible assets — 16,815Goodwill — 11,778Deposits and other assets 9,519 12,505
Total assets $ 364,708 615,888
Liabilities and Stockholders’ EquityCurrent liabilities: Accounts payable $ 13,962 19,572 Accrued payroll and related liabilities 28,054 28,365 Fair value of derivative — 3,265 Other accrued expenses 20,609 28,658 Deferred revenue 31,165 38,703
Total current liabilities 93,790 118,563Fair value of derivative 21,616 —Long-term deferred revenue 13,342 3,446Other long-term liabilities 3,142 3,815
Total liabilities 131,890 125,824Stockholders’ equity: Common stock, $0.001 par value; 400,000 shares authorized; 87,741 and 92,086 shares issued and outstanding in 2004 and 2005, respectively 88 92 Additional paid-in capital 741,448 822,356 Deferred compensation expense (12,403) (9,096) Accumulated other comprehensive loss: Cumulative translation adjustment (28,503) (25,890) Unrealized holding loss on available-for-sale marketable securities, net of tax (98) (514)
Total accumulated other comprehensive loss (28,601) (26,404) Accumulated defi cit (467,714) (296,884)
Total stockholders’ equity 232,818 490,064
Total liabilities and stockholders’ equity $ 364,708 615,888
See accompanying notes to consolidated fi nancial statements.
101798FIN_r2_AnnRep05_Financials27 27101798FIN_r2_AnnRep05_Financials27 27 3/17/06 4:36:00 PM3/17/06 4:36:00 PM
28
NAVTEQ Corporation and SubsidiariesConsolidated Statements of Operations (In thousands, except per share data)
Years Ended December 31, 2003 2004 2005
Net revenue $ 272,623 392,858 496,512Operating costs and expenses: Database creation and distribution costs 125,841 186,330 222,933 Selling, general and administrative expenses 83,024 111,942 139,323
Total operating costs and expenses 208,865 298,272 362,256
Operating income 63,758 94,586 134,256Other income (expense): Interest income 414 1,158 4,262 Interest expense (34) (24) (25) Foreign currency gain (loss) 6,174 (1,686) 502 Other expense (11) (206) (4)
Income before income taxes 70,301 93,828 138,991Income tax (benefi t) expense (165,514) 39,762 (31,839)
Net income $ 235,815 54,066 170,830
Earnings per share of common stock: Basic $ 2.81 0.62 1.90
Diluted $ 2.69 0.59 1.81
Weighted average shares of common stock outstanding: Basic 84,062 86,509 90,115
Diluted 87,593 92,001 94,198
See accompanying notes to consolidated fi nancial statements.
101798FIN_r2_AnnRep05_Financials28 28101798FIN_r2_AnnRep05_Financials28 28 3/17/06 4:36:04 PM3/17/06 4:36:04 PM

29
NAVTEQ Corporation and SubsidiariesConsolidated Statements of Stockholders’ Equity and Comprehensive Income(In thousands)
Accumulated Additional Note Deferred other Total Common stock paid-in receivable for compensation comprehensive Accumulated stockholders’ Shares Amount capital common stock expense income (loss) defi cit equity
Balances as of December 31, 2002 83,971 $ 1,176 764,275 (219) — 3,600 (757,595) 11,237Exercise of stock options 182 2 286 — — — — 288Grant of stock options at exercise prices below fair market value — — 3,148 — (3,148) — — —Stock compensation expense — — — — 816 — — 816Comprehensive income: Foreign currency translation adjustment — — — — — (30,245) — (30,245) Net income — — — — — — 235,815 235,815
Total comprehensive income 205,570
Balances as of December 31, 2003 84,153 1,178 767,709 (219) (2,332) (26,645) (521,780) 217,911Exercise of warrants 3,384 47 427 — — — — 474Reverse stock split — (1,140) 1,140 — — — — —Exercise of stock options 215 3 2,533 — — — — 2,536Dividends paid — — (47,159) — — — — (47,159)Stock compensation expense — — 17,087 — (10,071) — — 7,016Settlement of note receivable for common stock (11) — (289) 219 — — — (70)Comprehensive income: Foreign currency translation adjustment — — — — — (1,858) — (1,858) Unrealized holding loss on available- for-sale marketable securities (net of taxes of $61) — — — — — (98) — (98) Net income — — — — — — 54,066 54,066
Total comprehensive income 52,110
Balances as of December 31, 2004 87,741 88 741,448 — (12,403) (28,601) (467,714) 232,818Common stock issued for acquisition 545 1 19,976 — — — — 19,977Exercise of stock options and vesting of restricted stock units 3,800 3 55,122 — — — — 55,125Stock compensation expense — — 5,810 — 3,307 — — 9,117Comprehensive income: Foreign currency translation adjustment — — — — — 2,613 — 2,613 Unrealized holding loss on available- for-sale marketable securities (net of taxes of $256) — — — — — (416) — (416) Net income — — — — — — 170,830 170,830
Total comprehensive income 173,027
Balances as of December 31, 2005 92,086 $ 92 822,356 — (9,096) (26,404) (296,884) 490,064
See accompanying notes to consolidated fi nancial statements.
101798FIN_r2_AnnRep05_Financials29 29101798FIN_r2_AnnRep05_Financials29 29 3/17/06 4:36:07 PM3/17/06 4:36:07 PM

30
NAVTEQ Corporation and SubsidiariesConsolidated Statements of Cash Flows (In thousands)
Years Ended December 31, 2003 2004 2005
Cash fl ows from operating activities: Net income $ 235,815 54,066 170,830 Adjustments to reconcile net income to net cash provided by operating activities: Deferred income taxes (172,076) 31,841 (77,737) Depreciation and amortization 5,718 6,414 8,717 Amortization of software development costs 6,312 9,154 12,851 Amortization of acquired intangible assets — — 1,502 Foreign currency (gain) loss (6,174) 1,686 (502) Provision for (recovery of) bad debts 2,071 (461) 2,303 Stock compensation expense 816 7,016 9,117 Tax benefi t on non-qualifi ed stock options — 1,547 40,936 Noncash other 36 308 1,804 Changes in operating assets and liabilities: Accounts receivable (12,061) (10,086) (29,693) Prepaid expenses and other current assets (2,966) (1,705) (5,006) Deposits and other assets 401 (8,711) (1,483) Accounts payable 9,876 (2,198) 6,057 Accrued payroll and related liabilities 3,231 6,536 2,100 Other accrued expenses 873 (3,823) (3,734) Deferred revenue (6,060) 14,431 (823) Other long-term liabilities 136 407 514
Net cash provided by operating activities 65,948 106,422 137,753Cash fl ows from investing activities: Acquisition of property and equipment (9,269) (12,875) (10,466) Capitalized software development costs (9,966) (12,792) (12,369) Purchases of marketable securities — (118,100) (198,743) Sales of marketable securities — 44,934 136,483 Purchase of investments — — (1,201) Payment for acquisition, net of cash acquired — — (8,234) Investment in joint venture — (490) — Cash on deposit with affi liate, net (55,307) 65,199 —
Net cash used in investing activities (74,542) (34,124) (94,530)Cash fl ows from fi nancing activities: Issuance of common stock 288 1,393 14,190 Dividends paid — (47,159) —
Net cash provided by (used in) fi nancing activities 288 (45,766) 14,190Effect of exchange rate changes on cash 861 1,587 (2,444)
Net increase (decrease) in cash and cash equivalents (7,445) 28,119 54,969Cash and cash equivalents at beginning of year 9,427 1,982 30,101
Cash and cash equivalents at end of year $ 1,982 30,101 85,070
Supplemental disclosure of cash fl ow information: Cash paid during the year for interest $ 18 24 24
Cash paid during the year for income taxes $ 3,290 2,569 1,425
Non-cash transactions: Value of common stock issued in connection with acquisition $ — — 19,977
See accompanying notes to consolidated fi nancial statements.
101798FIN_r2_AnnRep05_Financials30 30101798FIN_r2_AnnRep05_Financials30 30 3/17/06 4:36:10 PM3/17/06 4:36:10 PM

31
(f) Accounts ReceivableAccounts receivable are recorded at the invoiced amounts and do not bear interest. The allowance for doubtful accounts is recorded to provide for estimated losses resulting from uncollectible accounts, and is based principally upon specifi cally identifi ed amounts where collection is deemed doubtful. Additional non-specifi c allowances are recorded based on historical experience and management’s assessment of a variety of factors related to the general fi nancial condition and business prospects of the Company’s customer base. The Company reviews the collectibility of individual accounts and assesses the adequacy of the allowance for doubtful accounts monthly. Account balances are charged off against the allowance after all means of collection have been exhausted and the potential for recovery is considered remote. The Company does not have any off-balance-sheet credit exposure related to its customers.
(g) Fair Value of Financial InstrumentsThe carrying values of cash equivalents, cash on deposit with affi liate, receivables, payables and accrued expenses approximate their fair values due to the short maturity of these instruments.
(h) Property and EquipmentProperty and equipment are stated at cost. Depreciation and amortization are computed using the straight-line method over the estimated useful lives of the assets. Computers and equipment and purchased software are amortized over three years. Furniture and fi xtures are amortized over fi ve years. Leasehold improvements are amortized over the lesser of their estimated useful lives or the remaining lease terms.
(i) DerivativesThe Company uses a derivative fi nancial instrument to manage foreign currency exchange rate risk. Derivative instruments are stated at fair value in the consolidated balance sheet. The Company did not designate the derivative as a hedge as defi ned by SFAS No. 133, “Accounting for Derivative Instruments and Hedging Activities.” Therefore, the changes in fair value of the derivative are recognized in the consolidated statements of operations.
(j) Revenue RecognitionRevenue is recognized when evidence of an arrangement exists, delivery has occurred, the fee is fi xed or determinable and collection is probable, following the guidance in Securities and Exchange Commission (SEC) Staff Accounting Bulletin (SAB) 104, “Revenue Recognition.” Where arrangements have multiple elements, the Company applies the guidance prescribed by Emerging Issues Task Force (EITF) Issue No. 00-21, “Revenue Arrangements with Multiple Deliverables.”
The Company derives a substantial majority of its revenue from licensing its database. Revenue is recognized net of provisions for estimated uncollectible amounts and anticipated returns. Database licensing revenue includes revenue associated with nonrefundable minimum licensing fees, license fees from usage (including license fees in excess of nonrefundable minimum fees), prepaid licensing fees from distributors and customers and direct sales to end users. License fees from usage (including license fees in excess of nonrefundable minimum fees) are recognized in the period in which the customer reports them to the Company. Nonrefundable minimum licensing fees are recognized as revenue ratably over the period of the arrangement, until such time that cumulative license fees from
Notes to Consolidated Financial Statements(amounts in thousands, except per share amounts)
(1)—Description of the Business and Summary of Signifi cant Accounting Policies
(a) The BusinessNAVTEQ Corporation (“the Company”) is a leading provider of digital map information and related software and services used in a wide range of navigation, mapping and geographic-related applications, including products and services that provide maps, driving directions, turn-by-turn route guidance, fl eet management and tracking and geographic information systems. These products and services are provided to end users by our customers on various platforms, including: self-contained hardware and software systems installed in vehicles; personal computing devices, such as personal digital assistants and cell phones; server-based systems, including Internet and wireless services; and paper media.
The Company is engaged primarily in the creation, updating, enhancing, licensing and distribution of its database for North America and Europe. The Company’s database is a digital representation of road transportation networks constructed to provide a high level of accuracy and the useful level of detail necessary to support route guidance products and similar applications. The Company’s database is licensed to leading automotive electronics manufacturers, automotive manufacturers, developers of advanced transportation applications, developers of geographic-based information products and services, location-based service providers and other product and service providers. The Company is currently realizing revenue primarily from license fees charged to customers who incorporate the Company’s database into their products or services.
(b) Principles of ConsolidationThe accompanying consolidated fi nancial statements include the accounts of the Company and its wholly-owned subsidiaries. All signifi cant intercompany accounts and transactions have been eliminated in consolidation.
(c) Use of EstimatesThe preparation of fi nancial statements in conformity with accounting principles generally accepted in the United States of America (GAAP) requires management to make estimates and assumptions that affect the reported amounts of assets and liabilities and disclosure of contingent assets and liabilities at the date of the fi nancial statements, and the reported amounts of revenue and expenses during the reporting period. Actual results could differ from those estimates.
(d) Cash EquivalentsThe Company considers all highly liquid debt instruments purchased with original maturities of three months or less to be cash equivalents.
(e) Marketable SecuritiesThe Company invests in marketable securities and classifi es the securities as available-for-sale under Statement of Financial Accounting Standard (SFAS) No. 115, “Accounting for Certain Investments in Debt and Equity Securities.” In accordance with SFAS 115, available-for-sale marketable securities are accounted for at market prices, with the unrealized gain or loss, less applicable deferred income taxes, shown as a separate component of stockholders’ equity.
101798FIN_r2_AnnRep05_Financials31 31101798FIN_r2_AnnRep05_Financials31 31 3/17/06 4:36:14 PM3/17/06 4:36:14 PM

32
expected to be recovered or settled. The effect on deferred tax assets and liabilities of a change in tax rates is recognized in operations in the period that includes the enactment date. A valuation allowance is recorded for deferred tax assets if it is more likely than not that some portion or all of the deferred tax assets will not be realized.
(m) Foreign Currency TranslationThe fi nancial statements of the Company’s foreign subsidiaries are measured using the local currency as the functional currency. Foreign assets and liabilities in the accompanying consolidated balance sheets have been translated at the rate of exchange as of the balance sheet date. Revenue and expenses are translated at the average exchange rate for the year. Translation adjustments are reported as a component of accumulated other comprehensive income (loss) in stockholders’ equity. Foreign currency transaction gains and losses are included in the consolidated statements of operations.
(n) Impairment of Long-lived AssetsThe Company accounts for long-lived assets in accordance with the provisions of SFAS No. 144, “Accounting for Impairment or Disposal of Long-lived Assets.” In accordance with SFAS No. 144, long-lived assets, such as property, plant, and equipment, capitalized software development costs and intangibles subject to amortization, are reviewed for impairment whenever events or changes in circumstances indicate that the carrying amount of an asset may not be recoverable. Recoverability of assets to be held and used is measured by a comparison of the carrying amount of an asset to estimated undiscounted future cash fl ows expected to be generated by the asset. If the carrying amount of an asset exceeds its estimated future cash fl ows, an impairment charge is recognized equal to the amount by which the carrying amount of the asset exceeds the fair value of the asset. Assets to be disposed of would be separately presented in the consolidated balance sheet and reported at the lower of the carrying amount or fair value less costs to sell, and are no longer depreciated.
(o) Stock-Based CompensationThe Company applies the intrinsic value-based method of accounting prescribed by Accounting Principles Board (APB) Opinion No. 25, “Accounting for Stock Issued to Employees,” and related interpretations, including Financial Accounting Standards Board (FASB) Interpretation No. 44, “Accounting for Certain Transactions involving Stock Compensation, an interpretation of APB Opinion No. 25,” to account for its fi xed plan stock options. Under this method, compensation expense is recorded on the date of grant only if the fair value of the underlying common stock exceeds the exercise price of the option. Prior to 2003, under the Company’s stock option plan, options were granted at exercise prices that were equal to the fair value of the underlying common stock on the date of grant. Therefore, no stock-based compensation expense was recorded in the consolidated statements of operations. During 2003, the Company granted options at exercise prices below the fair value of the underlying common stock on the date of grant. Accordingly, the Company recorded compensation expense related to these option grants of $816, $792 and $764 for the years ended December 31, 2003, 2004, and 2005, respectively. Prior to the completion of the Company’s initial public offering in August 2004, the fair value of the underlying common stock was determined by the Company’s Board of Directors based on an internally-prepared valuation analysis using comparable companies, comparable merger transactions and discounted cash fl ow methodologies.
usage exceeds the nonrefundable minimum licensing fee. At that time, the Company recognizes the additional licensing revenue. Prepaid licensing fees are recognized in the period in which the distributor or customer reports that they have shipped the database to the end user. Revenue for direct sales of licenses is recognized when the database is shipped to the end user. Licensing arrangements that entitle the customer to unspecifi ed updates over a period of time are recognized as revenue ratably over the period of the arrangement.
(k) Database Creation and Distribution CostsDatabase creation and distribution costs include the costs of database creation and updating, database licensing and distribution, and database-related software development. Database creation and updating costs of $69,609, $89,854 and $112,836 in 2003, 2004, and 2005, respectively, include the direct costs of database creation and validation, costs to obtain information used to construct the database and ongoing costs for updating and enhancing the database content. Database creation and updating costs are expensed as incurred, except costs of internal-use software, which are capitalized in accordance with American Institute of Certifi ed Public Accountants (AICPA) Statement of Position No. 98-1 (SOP 98-1), “Accounting for the Costs of Computer Software Developed or Obtained for Internal Use,” and are then amortized on a straight-line basis over their estimated useful life, generally three to four years.
Database licensing and distribution costs of $40,560, $72,073 and $89,666 in 2003, 2004, and 2005, respectively, include direct costs related to reproduction of the database for licensing, professional services, and per copy sales (including shipping and handling costs of $4,772, $5,351 and $5,932 in 2003, 2004, and 2005, respectively). Database licensing and distribution costs are expensed as incurred.
Database-related software development costs consist primarily of costs for the development of software as follows: (i) applications used internally to improve the effectiveness of database creation and updating activities, (ii) enhancements to internal applications that enable the Company’s core database to operate with emerging technologies, and (iii) applications to facilitate usage of the Company’s map database by customers. Costs of internal-use software are accounted for in accordance with SOP 98-1. Accordingly, certain application development costs relating to internal-use software have been capitalized and are being amortized on a straight-line basis over the estimated useful lives of the assets, generally three to four years. The Company capitalized $9,966, $12,792 and $12,369 of internal-use software development costs during 2003, 2004, and 2005, respectively. Included in database creation and updating costs is the amortization of internal-use software costs of $6,312, $9,154 and $12,851 for the years ended December 31, 2003, 2004, and 2005, respectively. Software development and maintenance costs of $15,672, $24,672 and $20,431 in 2003, 2004, and 2005, respectively, did not qualify for capitalization and were expensed as incurred.
(l) Income TaxesIncome taxes are accounted for under the asset and liability method. Deferred tax assets and liabilities are recognized for the future tax consequences attributable to differences between the fi nancial statement carrying amounts of existing assets and liabilities and their respective tax bases and operating loss and tax credit carryforwards. Deferred tax assets and liabilities are measured using enacted tax rates expected to apply to taxable income in the years in which those temporary differences are
101798FIN_r2_AnnRep05_Financials32 32101798FIN_r2_AnnRep05_Financials32 32 3/17/06 4:36:18 PM3/17/06 4:36:18 PM

33
2005—no dividends, 60% volatility, risk-free interest rate of 3.89%, and expected life of 4.9 years.
(p) Comprehensive Income (Loss)Accumulated other comprehensive loss is related to the Company’s foreign currency translation adjustments and unrealized holding losses on available-for-sale marketable securities.
(q) Earnings Per ShareBasic and diluted earnings per share is computed based on net income, divided by the weighted-average number of shares of common stock and dilutive common stock equivalents outstanding for the period, in accordance with SFAS No. 128, “Earnings Per Share.”
The following table sets forth the computation of earnings per share for the years ended December 31,:
2003 2004 2005
Numerator: Net income $ 235,815 54,066 170,830
Denominator: Denominator for basic earnings per share—weighted-average shares outstanding 84,062 86,509 90,115 Effect of dilutive securities: Employee stock options 478 4,238 3,722 Restricted stock units — 131 361 Warrants 3,053 1,123 —
Denominator for diluted earnings per share—weighted-average shares outstanding and assumed conversions 87,593 92,001 94,198
Earnings per share: Basic $ 2.81 0.62 1.90
Diluted $ 2.69 0.59 1.81
Options to purchase 1,073, 4 and 36 shares of common stock were outstanding at December 31, 2003, 2004, and 2005, respectively, but were not included in the computation of diluted earnings per share because the effect would be antidilutive.
(r) Reclassifi cationsCertain 2003 and 2004 amounts in the consolidated fi nancial statements have been reclassifi ed to conform to the 2005 presentation.
(2)—Recent Accounting Pronouncements
In December 2004, the FASB issued SFAS No. 123(R), “Share-Based Payment,” to be effective for interim or annual periods beginning after June 15, 2005. On April 14, 2005, the Securities and Exchange Commission amended the compliance dates to require SFAS No.123(R) to be effective for fi scal years beginning after June 15, 2005. SFAS No. 123(R) supersedes APB Opinion No. 25 and requires all share-based payments to employees, including grants of employee stock options, to be recognized as an operating expense in the income statement. The cost will be recognized over the requisite service period based on fair values measured on grant dates. The Company will adopt the new standard using the modifi ed prospective transition method, which permits recognition of expense on or after the effective date for the portion of outstanding awards for which the requisite service has not yet been rendered.
During 2004 and 2005, the Company granted 769 and 143 restricted stock units, respectively, to certain directors and employees under the Company’s 2001 Stock Incentive Plan. The restricted stock units are securities that require the Company to deliver one share of common stock to the holder for each vested unit. Compensation expense is recognized ratably over the vesting periods of each tranche of the restricted stock units using a fair value equal to the fair market value of the Company’s common stock on the date of grant. The weighted-average grant-date fair value of the restricted stock units was $22.19 and $42.77. The Company recognized $6,224 and $8,353 of compensation expense related to these restricted stock units during the years ended December 31, 2004 and 2005, respectively. The expense is reported in both Database Creation and Distribution Costs and Selling, General and Administrative Expenses in the consolidated statements of operations. There were 711 restricted stock units outstanding as of December 31, 2005.
SFAS No. 123, “Accounting for Stock-Based Compensation” established accounting and disclosure requirements using a fair value based method of accounting for stock-based employee compensation plans. As allowed by SFAS No. 123, the Company has elected to continue to apply the intrinsic value-based method of accounting described above and has furnished the pro forma disclosures required by SFAS No. 123, as amended by SFAS No. 148, “Accounting for Stock Based Compensation—Transition and Disclosure.” The compensation expense for stock options included in the pro forma disclosures is recognized ratably over the vesting periods of each tranche of the stock options. The following table illustrates the effect on net income and earnings per share if the fair value based method had been applied in each period.
Year Ended December 31, 2003 2004 2005
Net income, as reported $ 235,815 54,066 170,830Add: Stock-based employee compensation expense included in reported net income, net of tax 506 4,329 5,911Deduct: Total stock-based employee compensation expense determined under fair value based method for all awards, net of tax (2,341) (7,331) (11,468)
Pro forma net income 233,980 51,064 165,273
Earnings per share of common stock: Basic—as reported $ 2.81 0.62 1.90
Diluted—as reported $ 2.69 0.59 1.81
Basic—pro forma $ 2.78 0.59 1.83
Diluted—pro forma $ 2.67 0.55 1.75
The per share weighted-average fair value of stock options granted during 2003, 2004, and 2005 was $6.92, $13.38, and $23.15, respectively, for options granted with an exercise price that equals the fair value of the underlying common stock on the date of grant. The per share weighted-average fair value of stock options granted in 2003 for options granted with an exercise price less than the fair value of the underlying common stock on the date of grant was $8.19. The fair value of all options was computed as of the date of grant using the Black-Scholes method with the following weighted-average assumptions: 2003—no dividends, 67% volatility, risk-free interest rate of 3.19%, and expected life of 4.9 years; 2004—no dividends, 67% volatility, risk-free interest rate of 3.41%, and expected life of 4.9 years;
101798FIN_r2_AnnRep05_Financials33 33101798FIN_r2_AnnRep05_Financials33 33 3/17/06 4:36:21 PM3/17/06 4:36:21 PM
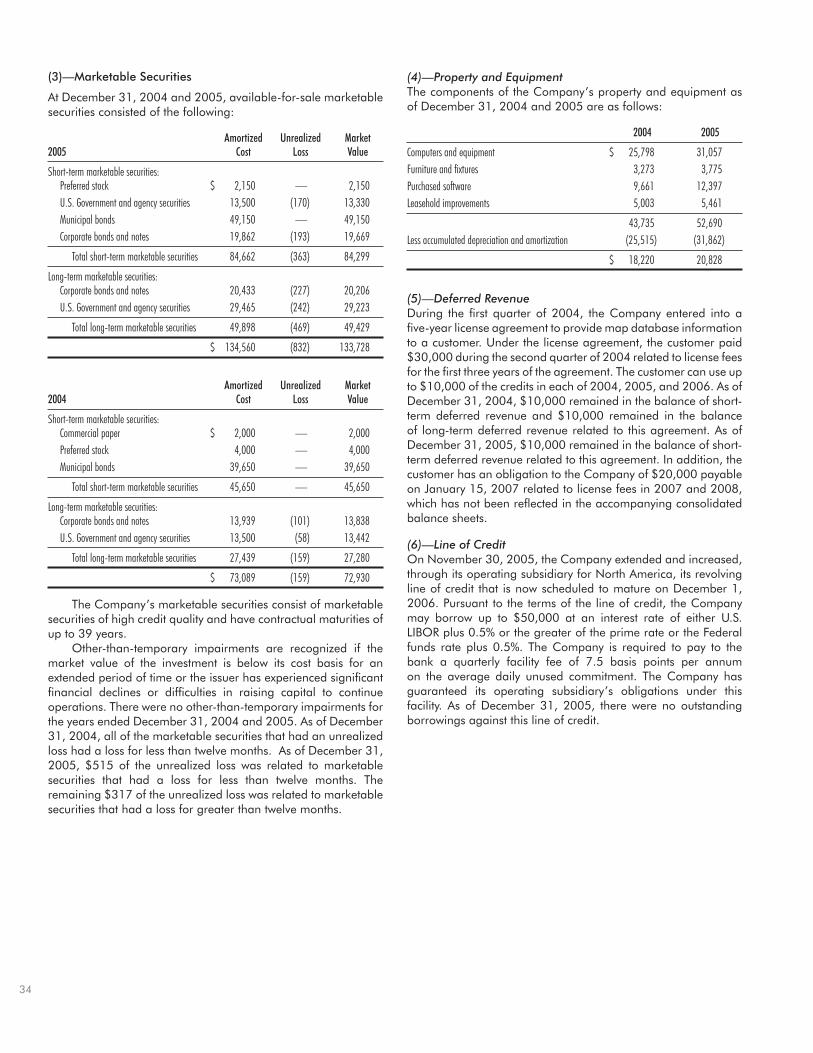
34
(4)—Property and EquipmentThe components of the Company’s property and equipment as of December 31, 2004 and 2005 are as follows:
2004 2005
Computers and equipment $ 25,798 31,057Furniture and fi xtures 3,273 3,775Purchased software 9,661 12,397Leasehold improvements 5,003 5,461
43,735 52,690Less accumulated depreciation and amortization (25,515) (31,862)
$ 18,220 20,828
(5)—Deferred RevenueDuring the fi rst quarter of 2004, the Company entered into a fi ve-year license agreement to provide map database information to a customer. Under the license agreement, the customer paid $30,000 during the second quarter of 2004 related to license fees for the fi rst three years of the agreement. The customer can use up to $10,000 of the credits in each of 2004, 2005, and 2006. As of December 31, 2004, $10,000 remained in the balance of short-term deferred revenue and $10,000 remained in the balance of long-term deferred revenue related to this agreement. As of December 31, 2005, $10,000 remained in the balance of short-term deferred revenue related to this agreement. In addition, the customer has an obligation to the Company of $20,000 payable on January 15, 2007 related to license fees in 2007 and 2008, which has not been refl ected in the accompanying consolidated balance sheets.
(6)—Line of CreditOn November 30, 2005, the Company extended and increased, through its operating subsidiary for North America, its revolving line of credit that is now scheduled to mature on December 1, 2006. Pursuant to the terms of the line of credit, the Company may borrow up to $50,000 at an interest rate of either U.S. LIBOR plus 0.5% or the greater of the prime rate or the Federal funds rate plus 0.5%. The Company is required to pay to the bank a quarterly facility fee of 7.5 basis points per annum on the average daily unused commitment. The Company has guaranteed its operating subsidiary’s obligations under this facility. As of December 31, 2005, there were no outstanding borrowings against this line of credit.
(3)—Marketable Securities
At December 31, 2004 and 2005, available-for-sale marketable securities consisted of the following:
Amortized Unrealized Market2005 Cost Loss Value
Short-term marketable securities: Preferred stock $ 2,150 — 2,150 U.S. Government and agency securities 13,500 (170) 13,330 Municipal bonds 49,150 — 49,150 Corporate bonds and notes 19,862 (193) 19,669
Total short-term marketable securities 84,662 (363) 84,299
Long-term marketable securities: Corporate bonds and notes 20,433 (227) 20,206 U.S. Government and agency securities 29,465 (242) 29,223
Total long-term marketable securities 49,898 (469) 49,429
$ 134,560 (832) 133,728
Amortized Unrealized Market2004 Cost Loss Value
Short-term marketable securities: Commercial paper $ 2,000 — 2,000 Preferred stock 4,000 — 4,000 Municipal bonds 39,650 — 39,650
Total short-term marketable securities 45,650 — 45,650
Long-term marketable securities: Corporate bonds and notes 13,939 (101) 13,838 U.S. Government and agency securities 13,500 (58) 13,442
Total long-term marketable securities 27,439 (159) 27,280
$ 73,089 (159) 72,930
The Company’s marketable securities consist of marketable securities of high credit quality and have contractual maturities of up to 39 years.
Other-than-temporary impairments are recognized if the market value of the investment is below its cost basis for an extended period of time or the issuer has experienced signifi cant fi nancial declines or diffi culties in raising capital to continue operations. There were no other-than-temporary impairments for the years ended December 31, 2004 and 2005. As of December 31, 2004, all of the marketable securities that had an unrealized loss had a loss for less than twelve months. As of December 31, 2005, $515 of the unrealized loss was related to marketable securities that had a loss for less than twelve months. The remaining $317 of the unrealized loss was related to marketable securities that had a loss for greater than twelve months.
101798FIN_r2_AnnRep05_Financials34 34101798FIN_r2_AnnRep05_Financials34 34 3/17/06 4:36:25 PM3/17/06 4:36:25 PM

35
Deferred tax assets and liabilities as of December 31, 2004 and 2005 are summarized as follows:
2004 2005
Deferred tax assets: Current: Net operating loss carryforwards $ 42,304 22,381 Deferred revenue 6,755 9,266 Interest not currently deductible — 5,991 Other deductible temporary differences 1,773 5,357
Total current deferred tax assets 50,832 42,995 Non-current: Research and development credit carryforwards 6,456 6,373 Interest not currently deductible 78,784 72,311 Net operating loss carryforwards 83,562 91,093 Deferred revenue 5,147 1,141 Other deductible temporary differences 8,501 9,904
Total non-current deferred tax assets 182,450 180,822
Gross deferred tax assets 233,282 223,817 Less valuation allowance (86,478) (2,728)
Net deferred tax assets 146,804 221,089
Deferred tax liabilities: Current: Other deductible temporary differences (136) (182)
Total current deferred tax liabilities (136) (182) Non-current: Acquired intangible assets — (5,194) Capitalized software development costs, net (3,903) (3,865)
Total non-current deferred tax liabilities (3,903) (9,059)
Gross deferred tax liabilities (4,039) (9,241)
Deferred income taxes $ 142,765 211,848
During 2005, the deferred tax asset valuation allowance decreased $83,750. During 2004 and 2005, the Company recorded $1,547 and $40,936, respectively, of deferred tax assets related to the tax benefi t on non-qualifi ed stock options, resulting in a corresponding increase in additional paid-in capital. The Company’s foreign operations currently have no undistributed earnings for which a tax liability would be provided in accordance with APB Opinion No. 23, “Accounting for Income Taxes Special Areas.”
In assessing the realizability of deferred tax assets, management considers whether it is more likely than not that some portion or all of the deferred tax assets will not be realized. The ultimate realization of deferred tax assets is dependent upon the generation of future taxable income during the periods in which those temporary differences become deductible. Management considers the scheduled reversal of deferred tax liabilities, projected future taxable income, and tax planning strategies in making this assessment.
Prior to 2003, the Company had provided a valuation allowance for the entire balance of deferred tax assets due to the uncertainty of generating future taxable income that would allow for the realization of such deferred tax assets. During 2003, the Company made the determination that it is more likely than not that it would be able to realize the benefi ts of the deferred tax assets related to net operating loss carryforwards and other
(7)—Income TaxesThe domestic and foreign components of pre-tax income for the years ended December 31, 2003, 2004, and 2005 are as follows:
2003 2004 2005
Domestic $ 9,915 2,716 32,939Foreign 60,386 91,112 106,052
Income before income taxes $ 70,301 93,828 138,991
The current and deferred components of income tax expense (benefi t) for the years ended December 31, 2003, 2004, and 2005 are as follows:
2003 2004 2005
Current: Federal $ — 123 — State 15 89 21 Foreign 3,223 1,877 1,871
Total current 3,238 2,089 1,892Deferred: Federal (73,089) (692) (63,699) State (8,513) (147) (6,455) Foreign (87,150) 38,512 36,423
Total deferred (168,752) 37,673 (33,731)
Income tax expense (benefi t) $ (165,514) 39,762 (31,839)
Total income tax expense (benefi t) differed from the amount computed by applying the U.S. Federal statutory tax rates of 34%, 35%, and 35% to the income before income taxes for the years ended December 31, 2003, 2004, and 2005, respectively, due to the following:
2003 2004 2005
Tax expense at U.S. Federal statutory rate $ 23,903 32,839 48,647State tax expense (benefi t), net of Federal tax effect 331 78 1,053Foreign withholding tax, net of Federal tax effect 1,288 444 —Deferred compensation — — 3,347Impact of foreign rates and other permanent items (7,573) 2,148 (2,971)Impact of adjustments to deferred taxes due to changes in statutory tax rates — 3,824 720Decrease in valuation allowance (183,463) (24) (83,290)Other — 453 655
Income tax expense (benefi t) $ (165,514) 39,762 (31,839)
101798FIN_r2_AnnRep05_Financials35 35101798FIN_r2_AnnRep05_Financials35 35 3/17/06 4:36:28 PM3/17/06 4:36:28 PM

36
As of December 31, 2005, the Company had net operating loss carryforwards for U.S. Federal and state income tax purposes of approximately $259,923 and $104,222, respectively. The difference between the U.S. Federal loss carryforwards and the state loss carryforwards results primarily from a 50% limitation on California loss carryforwards, capitalized research and development costs for California tax purposes, and a fi ve-year limit on California net operating loss carryforwards. As of December 31, 2005, the Company also had net operating loss carryforwards in Europe of approximately $55,372 with no expiration date and in Canada of approximately $1,911 with generally a seven-year carryforward period.
The Company also has available tax credit carryforwards of approximately $4,444 and $1,929 for U.S. Federal and state tax purposes, respectively.
If not utilized, Federal and state net operating loss carryforwards expire through 2025 and Federal tax credit carryforwards expire through 2022, as follows:
Federal net State net Federal operating loss operating loss tax creditYear of expiration carryforwards carryforwards carryforwards
2006 $ — 1,916 752007 — 817 1522008 4,039 490 1142009 5,715 421 282010 25,772 5,069 102Thereafter through 2025 224,397 95,509 3,973
$ 259,923 104,222 4,444
There is no expiration date for state tax credit carryforwards and U.S. Federal interest expense carryforwards.
(8)—Stockholders’ Equity In connection with a registration rights agreement between Philips Consumer Electronic Services B.V. (“Philips B.V.”) and the Company, Philips B.V. exercised its fi rst demand registration right on April 16, 2004. Pursuant to this request, the Company fi led a Registration Statement on Form S-1 (Reg. No. 333-114637) on April 20, 2004 with the Securities and Exchange Commission to register the Company’s common stock in an initial public offering, which became effective on August 5, 2004. The Company’s initial public offering was completed on August 11, 2004. At closing, the Company’s selling stockholders, Philips B.V. and NavPart I B.V., received all of the proceeds from the sale of shares in the offering. As of December 31, 2004, Philips B.V. owned 30,521 shares of common stock, or approximately 34.8%, of the Company. Philips B.V. had certain call rights with respect to 2,580 shares owned by NavPart II B.V (“NavPart II”), a wholly-owned subsidiary of NavPart I B.V (“NavPart I”). Philips B.V. delivered an exercise notice to NavPart I in August 2004 with respect to the aforementioned shares owned by NavPart II. The transfer of these shares was completed in March 2005. Philips B.V.’s ownership, after the transfer of these shares, was 33,101 shares of the Company’s common stock, or approximately 37.7% of the shares outstanding. Philips B.V. exercised its second demand registration right on March 11, 2005. Pursuant to this request, the Company fi led a Registration Statement on Form S-3 (Reg. No. 333-123628) on March 28, 2005 with the Securities and Exchange Commission to register the Company’s common stock held by Philips in a secondary public offering, which
temporary items in Europe and North America. In reaching the determination, the Company considered both positive and negative evidence. Positive evidence included the Company’s strong recent revenue growth and operating performance, expectations regarding the generation of future taxable income, the length of available carryforward periods, the Company’s market position and the expected growth of the market. Negative evidence included the Company’s history of operating losses through 2001 and the likelihood of increased competition and loss of a signifi cant customer. From that analysis, the Company determined that suffi cient evidence existed to conclude that it was more likely than not that the benefi ts of certain of the deferred tax assets will be realized. Accordingly, the Company reversed the related valuation allowance resulting in the recognition of a deferred income tax benefi t of $168,752.
As of December 31, 2005, the Company had U.S. interest expense carryforwards for both Federal and state income tax purposes of approximately $205,328. As of December 31, 2003, the Company had fully reserved for the tax benefi ts related to the interest expense carryforwards as management believed it was more likely than not that the benefi ts would not be realized. At such time, the Company believed it was more likely than not that the Company would not realize the benefi t associated with the interest expense carryforwards due to (1) restrictions placed on the deductibility of the interest as a result of Philips’ controlling interest in the Company and (2) uncertainty about the Company’s ability to generate suffi cient incremental future taxable income in the United States to offset the additional interest expense deductions. During the third quarter of 2004, Philips relinquished its controlling interest in the Company following the initial public offering. As a result, the Company is now allowed to deduct the deferred interest expense in tandem with the net operating loss carryforwards. Following the initial public offering, the Company reevaluated whether it is more likely than not that the tax benefi ts associated with the U.S. net operating loss carryforwards together with the interest expense carryforwards will be realized. Based on that evaluation, the Company concluded that the recorded valuation allowance for deferred tax assets refl ected the amount that management believes is more likely than not to expire before realization and, accordingly, that no adjustment to the balance of the related valuation allowance was required.
During the third quarter of 2005, the Company made the determination that it is more likely than not that it would be able to realize the benefi ts of the deferred tax assets related to the aforementioned net operating loss carryforwards and deferred interest credits in the United States. In reaching the determination, the Company considered both positive and negative evidence. Positive evidence included the Company’s strong recent revenue growth and operating performance, expectations regarding the generation of future taxable income, the length of available carryforward periods, the Company’s market position and the expected growth of the market. Negative evidence included the Company’s history of operating losses through 2001 and the likelihood of increased competition and loss of a signifi cant customer. From that analysis, the Company determined that suffi cient evidence existed to conclude that it was more likely than not that the benefi ts of certain of the deferred tax assets will be realized. Accordingly, the Company reversed the related valuation allowance and recorded an income tax benefi t of $83,270. As of December 31, 2005, the Company had a valuation allowance for deferred tax assets of $2,728 related to Canadian net operating loss carryforwards and research and experimental tax credits.
101798FIN_r2_AnnRep05_Financials36 36101798FIN_r2_AnnRep05_Financials36 36 3/17/06 4:36:32 PM3/17/06 4:36:32 PM

37
and Series B cumulative convertible preferred stock to convert this preferred stock into common stock pursuant to the terms of the preferred stock. A special committee of the Company’s board of directors was formed to address the Company’s defense to the complaint. On December 19, 2002, the special committee determined that the applicable per share conversion price of the Company’s common stock as of October 1, 2002 was $12.04 per share. Based on this determination, all of the Series A and Series B cumulative convertible preferred stock automatically converted pursuant to their terms as of October 1, 2002 into 55,477 shares of the Company’s common stock. Upon conversion, the aggregate liquidation preferences of Series A and Series B cumulative convertible preferred stock were $58,242 (including $18,182 of dividends in arrears) and $609,699 (including $183,699 of dividends in arrears), respectively.
Following unsuccessful settlement negotiations, in August 2003 Philips B.V. fi led an amended and restated complaint against the Company and additionally named as defendants Mr. van Ommeren, one of the Company’s directors, and T. Russell Shields, a former director, each of whom was a member of the special committee. Among other claims, the amended and restated complaint disputed the $12.04 per share conversion price of the preferred stock as of October 1, 2002, as determined by Mr. Shields and van Ommeren as the disinterested members of the board. Following further settlement negotiations, in December 2003, Philips B.V. accepted the per share conversion price of $12.04 per share as of October 1, 2002 and, in March 2004, the litigation was dismissed.
Deferred Compensation ExpenseDuring 2003, the Company granted stock options to its employees where the exercise price was less than the fair value of the Company’s common stock on the date of grant. The grant resulted in an aggregate measurement of compensation cost of $3,148, which will be recognized over the vesting period of the awards. The Company expensed $816, $792 and $764 of the total measured compensation cost during 2003, 2004, and 2005, respectively. During 2004 and 2005, the Company granted restricted stock units to certain directors and employees. The Company recorded $17,061 and $5,810 in net deferred compensation and amortized to expense $6,224 and $8,353 in compensation cost related to the grants in 2004 and 2005, respectively. As of December 31, 2005, deferred compensation totaling $9,096 remained and will be recognized over the vesting periods of the corresponding grants.
OtherDuring 2000, the Company loaned a former employee $219 to enable the individual to exercise options for the purchase of 18 shares of newly issued common stock. The loan was represented by a limited recourse promissory note with a November 20, 2004 maturity date. Interest accrued at 6.2% per annum and was payable at maturity. During 2004, the former employee tendered shares of the Company’s common stock to satisfy the obligation.
was consummated on May 10, 2005. The Company’s selling stockholder, Philips B.V., received all of the proceeds from the sale of shares in the offering. In the offering, Philips B.V. sold 33,101 shares of common stock, which represented its entire remaining interest in the Company.
In April 2004, the Company declared a special cash dividend to common stockholders of record as of April 19, 2004 in the amount of $47,159, which was paid on June 18, 2004.
On April 27, 2004, the Company’s board of directors and stockholders approved a reverse split of the Company’s common stock. The ratio for the reverse split was 1-for-14, as determined by the Company’s board of directors. The Company amended its amended and restated certifi cate of incorporation on August 5, 2004 to effect this reverse split and to change the number of authorized shares of common stock to 400,000. All previously reported share amounts have been retroactively adjusted to give effect to the reverse split.
On April 28, 2004, Philips B.V. exercised its warrants to acquire 3,384 shares of the Company’s common stock at a purchase price of $0.14 per share. The Company received $474 in proceeds related to the exercise of the warrants. The shares issued upon exercise of the warrants were not included in Philips’ outstanding common stock for purposes of the special cash dividend paid to the Company’s stockholders on June 18, 2004.
Preferred Stock Conversion and Related Litigation with PhilipsIn March 2001, the Company entered into a stock purchase agreement with Philips B.V. pursuant to which Philips B.V. acquired 172 shares of the Company’s Series A cumulative convertible preferred stock in exchange for promissory notes payable by the Company having an aggregate value of $17,000 and $7,100 in cash, and 3,043 shares of the Company’s Series B cumulative convertible preferred stock in exchange for promissory notes payable by the Company having an aggregate value of $426,000. Philips also agreed to purchase Series A shares in addition to the 172 shares, up to an aggregate of $50,000 of Series A preferred shares as requested by the Company in accordance with the procedures set forth in the stock purchase agreement. After entering into the stock purchase agreement, Philips B.V. acquired an additional 114 shares of the Company’s Series A cumulative convertible preferred stock for an aggregate purchase price of $16,000 under the stand-by equity line. The terms of the Series A and Series B cumulative convertible preferred stock provided that these shares were to automatically convert into shares of common stock upon the earliest to occur of (i) the closing of a qualifying initial public offering of the Company’s securities, (ii) the closing of a qualifying change of control transaction, or (iii) October 1, 2002. The conversion was to be made into the number of shares of common stock determined by dividing the liquidation preference, plus all cumulative but unpaid dividends per share, by the applicable per share conversion price. The terms of the stock purchase agreement were negotiated by a special committee of the Company’s board of directors, which consisted of board members who were not employees of Philips. The Company believes that the terms were comparable to those that could have been obtained from an unaffi liated third party.
On September 20, 2002, Philips B.V. fi led a complaint against the Company in the Chancery Court of the State of Delaware in and for New Castle County. The complaint alleged that the Company did not intend to comply with the Company’s obligations under the certifi cates of designations for the Series A
101798FIN_r2_AnnRep05_Financials37 37101798FIN_r2_AnnRep05_Financials37 37 3/17/06 4:36:35 PM3/17/06 4:36:35 PM

38
10-year terms and vest as follows: 25% of the options granted vest on the fi rst day of the month following the employee’s date of hire and the remaining options vest monthly over 48 months.
During 2000, the Company’s Board of Directors approved three separate Stock Option Agreements to three employees. The agreements provide for grants of stock options to these employees. Stock options granted under the fi rst Stock Option Agreement total 2,500 shares of common stock, which have been reserved for issuance under this agreement. One fourth of the options under this Stock Option Agreement vest on the employee’s date of hire. Thereafter, one fourth of the shares subject to this Stock Option Agreement vest on each of the fi rst, second and third anniversaries of the employee’s date of hire. Stock options granted under the remaining Stock Option Agreements total 750 shares of common stock, which have been reserved for issuance under these agreements. These options vest monthly over 48 months. All options issued under these Stock Option Agreements have 10-year terms and are adjusted pro rata for any stock dividends, stock splits and reverse stock splits. Upon termination of one of these employees, 536 shares of common stock reserved for issuance under one of the Stock Option Agreements were cancelled in 2001. The remaining two Stock Option Agreements were cancelled in October 2001, and replacement options were granted to these two employees in May 2002.
In August 2001, the Company’s Board of Directors approved the 2001 Stock Incentive Plan (2001 Plan). The 2001 Plan provides for grants of incentive stock options, nonstatutory stock options, and stock purchase rights to employees (including employees who are offi cers) of the Company and its subsidiaries. The 2001 Plan also provides for grants of nonstatutory stock options and stock purchase rights to consultants. Stock options granted under the 2001 Plan generally have 10-year terms and vest as follows: 25% of the options granted vest on the anniversary of the employee’s date of hire and the remaining options vest monthly over 36 months. The Company has reserved 10,931 shares of common stock for issuance under the 2001 Plan. All options issued under the 2001 Plan are adjusted pro rata for any stock dividends, stock splits and reverse stock splits.
As of December 31, 2005, there were 9,707 shares available for grant under the 2001 Plan, and there were no shares available for grant under the 1988, 1996, or 1998 Plans. The Company has reserved 88, 7,360 and 3,571 shares of common stock for issuance under the 1988, 1996, and 1998 Plans, respectively. All options issued under the 1988, 1996, and 1998 Plans are adjusted pro rata for any stock dividends, stock splits and reverse stock splits.
(9)—Stock Option Plans
In 1988, the Company adopted a stock option plan (1988 Plan). The total authorized shares under the 1988 Plan are 2,550. Options granted under the 1988 Plan are for periods not to exceed 10 years and may be either incentive stock options as that term is used in Section 422 of the Internal Revenue Code (Incentive Stock Options) or options which do not qualify as Incentive Stock Options (Supplemental Stock Options). All grants under the 1988 Plan must be at prices of not less than 100% of the fair value of the common stock as determined by the Company’s Board of Directors at the date of grant in the case of Incentive Stock Options, and 85% of fair value in the case of Supplemental Stock Options. Options granted after July 1995 generally vest monthly over 48 months from the employee’s date of hire, and options granted prior to July 1995 generally vest at 25% per year beginning with the anniversary of the employee’s date of hire. All stock options granted under the 1988 Plan have a 10-year term.
In April 1996, the Company’s Board of Directors approved the 1996 Stock Option Plan (1996 Plan). The 1996 Plan was amended and restated by the Company’s Board of Directors in June 1996, and amended in August 2000. The 1996 Plan, as amended, provides for grants of incentive stock options, nonstatutory stock options, and stock purchase rights to employees (including employees who are offi cers) of the Company and its subsidiaries; provided, however, that no employee may be granted an option for more than 1,429 shares in any one fi scal year. The 1996 Plan also provides for grants of nonstatutory stock options and stock purchase rights to consultants. Stock options granted under the 1996 Plan prior to August 2000 generally have 10-year terms and vest monthly over 48 months. Stock options granted under the 1996 Plan after the amendment in August 2000 generally have 10-year terms and vest as follows: 25% of the options granted vest on the fi rst day of the month following the employee’s date of hire and the remaining options vest monthly over 48 months.
In October 1998, the Company’s Board of Directors approved the 1998 California Stock Option Plan (1998 Plan). The 1998 Plan was amended in August 2000. The 1998 Plan provides for grants of incentive stock options, nonstatutory stock options, and stock purchase rights to employees (including employees who are offi cers) of the Company and its subsidiaries. The 1998 Plan also provides for grants of nonstatutory stock options and stock purchase rights to consultants. Stock options granted under the 1998 Plan prior to August 2000 generally have 10-year terms and vest monthly over 48 months. Stock options granted under the 1998 Plan after the August 2000 amendment generally have
101798FIN_r2_AnnRep05_Financials38 38101798FIN_r2_AnnRep05_Financials38 38 3/17/06 4:36:39 PM3/17/06 4:36:39 PM

39
Stock Option ActivityStock option activity during 2003, 2004, and 2005 is as follows:
Number Weighted-average Options Weighted-average of options exercise price exercisable exercise price
Balance as of December 31, 2002 7,783 $ 2.88 5,704 $ 3.36 Granted (with exercise price equal to fair value on the date of grant) 93 12.04 Granted (with exercise price less than fair value on the date of grant) 714 7.63 Exercised (182) 1.58 Forfeited (179) 7.00
Balance as of December 31, 2003 8,229 3.34 6,851 2.94 Granted 508 23.12 Exercised (215) 4.59 Forfeited (46) 7.68
Balance as of December 31, 2004 8,476 4.46 7,379 3.00 Granted 627 42.84 Exercised (3,677) 4.56 Forfeited (48) 23.16
Balance as of December 31, 2005 5,378 8.70 4,226 2.87
The following table summarizes information about stock options outstanding as of December 31, 2005:
Options outstanding Options exercisable
Weighted-average Number of remaining contractual Weighted-average Number of Weighted-averageExercise prices options outstanding life (years) exercise price options exercisable exercise price
$ 1.40 3,726 6.38 $ 1.40 3,691 $ 1.40 4.20 – 10.50 450 7.98 7.52 249 6.90 11.90 – 15.40 164 5.22 12.70 131 12.87 22.00 402 8.60 22.00 148 22.00 37.59 – 42.70 534 9.18 42.37 1 38.06 43.70 – 52.50 102 9.31 45.71 6 45.04
5,378 6.97 $ 8.70 4,226 $ 2.87
101798FIN_r2_AnnRep05_Financials39 39101798FIN_r2_AnnRep05_Financials39 39 3/17/06 4:36:42 PM3/17/06 4:36:42 PM

40
permanent in nature, as repayment was not expected to occur in the foreseeable future. However, primarily as a result of improved operating performance in the Company’s European business, management concluded that cash fl ows would be suffi cient to support repayment over the next several years. Accordingly, effective January 1, 2003, the Company adopted a plan for repayment and the loan is no longer designated as permanent in nature. The terms of the Swap are described in Note 11.
Software LicenseIn October 2004, the Company licensed certain software to Philips for development purposes and provided consulting services related to this software. The Company did not receive any license fees or consulting fees in 2004 or from January 1, 2005 through May 10, 2005.
OtherThe Company entered into transactions with affi liates of Philips N.V., under which the Company received software, software-related consulting services, tax consulting services, fl eet services, insurance services, and purchasing services. Total fees incurred for these services of $1,026, $1,336, and $137 are included in operating costs and expenses for the years ended December 31, 2003, 2004, and from January 1, 2005 throught May 10, 2005, respectively.
(11)—Foreign Currency Derivatives
On April 22, 2003, the Company entered into a U.S. dollar/euro currency swap agreement (the “Swap”) with Philips N.V. to minimize the exchange rate exposure between the U.S. dollar and the euro on the expected repayment of an intercompany obligation. The Swap was subsequently assigned to an unaffi liated third party in the third quarter of 2004. Under the terms of the Swap, the Company’s European subsidiary makes payments to the other party to the Swap in euros in exchange for the U.S. dollar equivalent at a fi xed exchange rate of $1.0947 U.S. dollar/euro. The U.S. dollar proceeds obtained under the Swap will be utilized to make payments of principal on the intercompany loan. The outstanding principal balance under the intercompany loan was $187,136 at April 22, 2003. The Swap has a maturity date of December 22, 2006 and provides for settlement on a monthly basis in proportion to the repayment of the intercompany obligation. As of December 31, 2005, the outstanding intercompany obligation was $40,280 and the fair value of the Swap was a liability of $3,265.
The intercompany loan bears interest at one-month U.S. LIBOR. The Swap also provides that the European subsidiary of the Company will pay interest due in euros on a monthly basis to the other party to the Swap in exchange for U.S. dollars at the one-month U.S. LIBOR rate.
The Swap was not designated for hedge accounting and therefore changes in the fair value of the Swap are recognized in current period earnings. A gain on the fair value of the Swap of $3,662 and $16,155 were recorded for the years ended December 31, 2004 and 2005, respectively. The Company recorded a gain of $6,194 and a loss of $11,676 as a result of the remeasurement of the outstanding intercompany obligation for the years ended December 31, 2004 and 2005, respectively. The Company recorded foreign currency transaction losses of $9,812 and $4,451 during the years ended December 31, 2004 and 2005, respectively, resulting from foreign currency exchange differences arising on the repayments of the intercompany obligation.
(10)—Related Party Transactions
Philips and Affi liatesImmediately prior to the secondary public offering described in Note 8, Philips B.V.’s ownership was 33,101 shares of the Company’s common stock, or approximately 37.7% of the total outstanding.
As of December 31, 2003, Philips B.V. held warrants to purchase 3,384 shares of the Company’s common stock. The per share exercise price of the warrants was $0.14. The warrants were granted on various dates between 1997 and 2000 pursuant to the loan agreement described below. The warrants were exercisable through and would have expired on April 1, 2007, were subject to adjustment for stock splits or dividends and had certain antidilution provisions for below market issuances. The warrants were exercised on April 28, 2004 as described in Note 8.
Letter of Credit GuaranteeThe Company obtained an irrevocable standby letter of credit with LaSalle Bank N.A. in conjunction with one of its facility leases. The original face amount of $2,000 declined annually until November 30, 2007, which is the end of the facility lease. Philips N.V. issued an unconditional and irrevocable guarantee to the bank as the primary obligor, in accordance with the Company’s obligations regarding this facility lease. The Company issued a counter guarantee to Philips N.V. in which it agreed to pay a fee of 1.5% per annum of the original $2,000 face value amount of the stand-by letter of credit as reduced from time to time in accordance with its terms. In 2003, the Company paid $60 related to the counter guarantee. The letter of credit, the Philips guarantee and the counter guarantee were cancelled in 2004.
Cash on Deposit with Affi liateThe Company entered into a deposit agreement dated as of May 21, 2002 with Koninklijke Philips Electronics N.V. (“Philips N.V.”), the parent company of the Company’s majority stockholder prior to the Company’s initial public offering, which was subsequently assigned to the Company’s U.S. operating subsidiary. The Company’s European operating subsidiary also entered into a deposit agreement with Philips N.V. dated as of September 26, 2003. These deposit agreements were for the purpose of optimizing the returns on temporary excess cash and earned interest at a rate of U.S. LIBOR minus 1/4% for a U.S. dollar deposit and EURIBOR/EONIA minus 1/4% for euro deposits.
The deposit agreements with Philips N.V. expired on August 11, 2004 upon completion of the Company’s initial public offering, at which time the Company invested cash balances in excess of short-term operational needs in cash equivalents and marketable securities.
During 2003 and 2004, the Company received $268 and $256, respectively, in interest income related to the deposit agreements.
Swap AgreementOn April 22, 2003, the Company entered into a U.S. dollar/euro currency swap agreement (the “Swap”) with Philips N.V., which was subsequently assigned to an unaffi liated third party in the third quarter of 2004. The purpose of the Swap was to minimize the exchange rate exposure between the U.S. dollar and the euro on the expected repayment of an intercompany obligation. The intercompany balance is payable by one of the Company’s European subsidiaries to the Company and one of its U.S. subsidiaries, and is due in U.S. dollars. Through December 31, 2002, this intercompany balance was considered
101798FIN_r2_AnnRep05_Financials40 40101798FIN_r2_AnnRep05_Financials40 40 3/17/06 4:36:46 PM3/17/06 4:36:46 PM

41
(14)—Concentrations of Risk
For the year ended December 31, 2005, one customer accounted for 13% of total revenue. No other customer accounted for 10% or more of total revenue. For the year ended December 31, 2004, two customers accounted for 16% and 10%, respectively, of total revenue. For the year ended December 31, 2003, two customers accounted for 18% and 12%, respectively, of total revenue.
(15)—Lease Obligations
The Company leases its facilities, automobiles, and certain equipment under operating leases expiring through 2013. Monthly payments under certain facility leases are subject to fi xed increases. For accounting purposes, rent expense is based on a straight-line amortization of the total payments required over the lease term. The leases require the Company to pay property taxes, insurance, maintenance, and repair costs.
The Company’s aggregate future minimum lease obligations as of December 31, 2005 are as follows:
Year Ending December 31:
2006 $ 13,3272007 9,9182008 4,7852009 3,5782010 2,799Thereafter 1,492
$ 35,899
Total rent expense under operating leases for facilities and equipment was $8,850, $10,795 and $11,449 for the years ended December 31, 2003, 2004, and 2005, respectively.
(16)—Business Combination
On July 8, 2005, the Company acquired Picture Map International Co., Ltd., a South Korean digital map company (“PMI”), through its wholly owned subsidiary, NAVTEQ B.V., pursuant to a Stock Purchase Agreement (the “Agreement”) dated the same date by and among NAVTEQ B.V., the Company, PMI and all of the shareholders of PMI (the “PMI Shareholders”). Under the Agreement, NAVTEQ B.V. acquired all of the outstanding shares of PMI for an aggregate purchase price of $28,500 (the “Purchase Price”), subject to post-closing adjustments based on working capital and net indebtedness. Each of the PMI Shareholders received the shareholder’s proportionate share of thirty percent of the Purchase Price in cash. The PMI Shareholders also received cash through a payment agent in Korea for the remaining seventy percent of the Purchase Price, but the PMI Shareholders were then required to use this cash to purchase an aggregate of 545 shares of the Company’s common stock (the “NVT Stock”). The number of shares of the Company’s common stock issued was based on a per share price of $36.60, the average price of the common stock as quoted on the New York Stock Exchange for the twenty consecutive trading days immediately prior to the closing date.
The Agreement contained customary representations, warranties and related indemnifi cation provisions. In addition, to secure the indemnifi cation obligations of the PMI Shareholders, fi fteen percent of the Purchase Price was deposited in escrow and $500 of the Purchase Price was deferred for payment until the second anniversary of the Closing Date. On August 18, 2005, the Company fi led a registration statement on Form S-3 with the
(12)—Employee Benefi t Plans
The Company sponsors a Savings and Investment Plan (the Plan) that qualifi es as a thrift plan under Section 401(k) of the Internal Revenue Code. All of the Company’s employees who have completed three months of service are eligible to participate in the Plan. The Plan allows participants to contribute up to 20% of eligible compensation, subject to the maximum amount allowable under Internal Revenue Service regulations. The Plan permits, but does not require, additional matching contributions by the Company. In addition, the Company has sponsored savings and investment plans in its European subsidiaries. The Company contributed $1,602, $2,347 and $2,688 to these defi ned contribution employee benefi t plans for the years ended December 31, 2003, 2004, and 2005, respectively.
(13)—Enterprise-wide Disclosures
The Company operates in one business segment and therefore does not report operating income, identifi able assets and/or other resources related to business segments. Revenues for geographic data of Europe, the United States/Canada and Korea are attributed to Europe (the Netherlands), North America (United States) and Asia Pacifi c (Korea) based on the entity that executed the related licensing agreement. Revenues for geographic data for Central and South America are attributed to North America. Revenues for geographic data for countries outside of Europe, the Americas and Korea are attributed to Europe, and are not material.
The following summarizes net revenue on a geographic basis for the years ended December 31, 2003, 2004, and 2005 (in thousands):
Years Ended December 31, 2003 2004 2005
Net revenue: Europe $ 180,959 267,541 316,208 North America 91,664 125,317 172,789 Asia Pacifi c — — 7,515
Total net revenue $ 272,623 392,858 496,512
The following summarizes long-lived assets on a geographic basis as of December 31, 2004 and 2005 (in thousands):
December 31, 2004 2005
Property and equipment, net: Europe $ 5,801 5,731 North America 12,367 14,396 Asia Pacifi c 52 701
Total property and equipment, net $ 18,220 20,828
Capitalized software development costs, net: Europe $ — — North America 26,243 25,761 Asia Pacifi c — —
Total capitalized software development costs, net $ 26,243 25,761
101798FIN_r2_AnnRep05_Financials41 41101798FIN_r2_AnnRep05_Financials41 41 3/17/06 4:36:49 PM3/17/06 4:36:49 PM

42
(18)—Litigation
On April 22, 2005, Tele Atlas N.V. and Tele Atlas North America (“Tele Atlas”) fi led a complaint against the Company in the United States District Court for the Northern District of California. The complaint alleges that the Company violated Sections 1 and 2 of the Sherman Act, Section 3 of the Clayton Act, and Sections 16720, 16727 and 17200 of the California Business and Professions Code, and that the Company intentionally interfered with Tele Atlas’s contractual relations and prospective economic advantage with third parties, by allegedly excluding Tele Atlas from the market for digital map data for use in navigation system applications in the United States through exclusionary and predatory practices. On August 16, 2005, Tele Atlas fi led an amended complaint based on these same causes of action. Specifi cally, in its amended complaint, Tele Atlas alleges that the Company controls a predominant share of variously defi ned markets for digital map data and has entered into exclusive contracts with digital map data customers for the purpose of acquiring or maintaining an illegal monopoly in these alleged markets. Tele Atlas also contends that these allegedly exclusive contracts have interfered with Tele Atlas’ current and prospective business relationships and amount to unfair competition under California state law. In addition, Tele Atlas alleges that the Company, through its license under U.S. Patent No. 5,161,886, control a predominant share of the alleged relevant technology market consisting of methods for displaying portions of a topographic map from an apparent perspective view outside and above a vehicle in the United States, and allegedly have entered into patent licenses and/or other arrangements in a manner that violates the aforesaid laws. On November 2, 2005, the Court dismissed some, but not all, of Tele Atlas’ claims for failure to state valid causes of action. On November 22, 2005, Tele Atlas fi led a second amended complaint based on the same causes of actions and essentially the same allegations as in its fi rst amended complaint and the Company fi led an answer denying Tele Atlas’ claims. Tele Atlas seeks preliminary and permanent injunctive relief, unspecifi ed monetary, exemplary and treble damages, and costs and attorneys’ fees of suit. Based on a review of the second amended complaint, the Company believes that the allegations are without merit. The Company intends to take all necessary steps to vigorously defend itself against this action; however, because this matter is in a very early stage, the Company cannot predict its outcome or potential effect, if any, on the Company’s business, fi nancial position or results of operations. A negative outcome could adversely affect the Company’s business, results of operations and fi nancial condition. Even if the Company prevails in this matter, the Company may incur signifi cant costs in connection with its defense, experience a diversion of management time and attention, realize a negative impact on the its reputation with its customers and face similar governmental and private actions based on these allegations.
SEC under the Securities Act of 1933, as amended, to register for resale the shares of NVT Stock held by the PMI Shareholders. The registration statement was declared effective on September 7, 2005.
In addition to the aforementioned consideration, the Company paid $598 in direct costs to acquire the shares of PMI to bring the total purchase price to $29,125. As part of the purchase price allocation, the Company recorded $35,129 in assets and $6,004 in liabilities. Included in the total assets were the following intangible assets:
EstimatedIntangible Asset Value Useful Life
Database $ 8,000 10 yearsCustomer relationships 5,600 7 years Software 4,000 3 years
The acquired intangible assets will be amortized on a straight-line basis over their estimated useful lives. In addition, the Company recorded $12,156 in goodwill as of the acquisition date. The goodwill is not tax-deductible. During the fourth quarter of 2005, the Company decreased goodwill by $872 due to the reallocation of the purchase price. The remainder of the change in the goodwill from the acquisition date to the balance at December 31, 2005 was related to changes in the exhange rate between the U.S. dollar and the Korean won. Pro forma results of the Company, assuming the acquisition occurred at the beginning of each period presented, would not be materially different from the results presented.
(17)—Intangible Assets
The gross carrying amount and accumulated amortization of intangible assets subject to amortization as of December 31, 2005 are:
Gross Accumulated Net Assets Amortization Assets
Database $ 8,338 (417) 7,921Customer relationships 5,837 (417) 5,420Software 4,169 (695) 3,474
Total $ 18,344 (1,529) 16,815
The estimated amortization expense for each of the next fi ve years is as follows:
2006 $ 3,0572007 3,0572008 2,3632009 1,6682010 1,668
101798FIN_r2_AnnRep05_Financials42 42101798FIN_r2_AnnRep05_Financials42 42 3/17/06 4:36:53 PM3/17/06 4:36:53 PM

43
(19)—Guarantees
In November 2002, the FASB issued Interpretation (FIN) 45, “Guarantor’s Accounting and Disclosure Requirements for Guarantees, Including Indirect Guarantees of Indebtedness of Others.” FIN 45 requires that the Company recognize the fair value for guarantee and indemnifi cation arrangements issue or modifi ed by the Company after December 22, 2002, if these arrangements are within the scope of the Interpretation. In addition, the Company must continue to monitor the conditions that are subject to the guarantees and indemnifi cations, as required under previously existing GAAP, in order to identify if a loss has occurred. If the Company determines it is probable that a loss has occurred then any such estimable loss would be recognized under those guarantees and indemnifi cations. Under its standard database and software licensing agreements, the Company agrees to indemnify, defend and hold harmless its licensees from and against certain losses, damages and costs arising from claims alleging the licensees’ use of Company data and software infringes the intellectual property rights of a third party. Historically, the Company has not been required to pay any amounts in connection with claims asserted under these provisions, and, accordingly, the Company has not recorded a liability relating to such provisions.
(20)—Quarterly Results (unaudited)
The following table presents the Company’s selected unaudited quarterly results:
First Second Third Fourth Quarter Quarter Quarter Quarter
For the year ended December 31, 2004 Net revenue $ 79,465 96,600 97,793 119,000 Operating income 15,934 24,845 22,099 31,708 Net income 9,719 15,323 13,596 15,428 Basic earnings per share of common stock* 0.12 0.18 0.16 0.18 Diluted earnings per share of common stock* 0.11 0.17 0.15 0.17
For the year ended December 31, 2005 Net revenue $ 104,697 122,832 123,005 145,978 Operating income 24,831 37,442 30,423 41,560 Net income 16,785 25,264 101,115 27,666 Basic earnings per share of common stock* 0.19 0.28 1.11 0.30 Diluted earnings per share of common stock* 0.18 0.27 1.07 0.29
* The earnings per share computation for the year is a separate, annual calculation. Accordingly, the sum of the quarterly earnings per share amounts does not necessarily equal the earnings per share for the year.
101798FIN_r2_AnnRep05_Financials43 43101798FIN_r2_AnnRep05_Financials43 43 3/17/06 4:36:57 PM3/17/06 4:36:57 PM

44
This page intentionally left blank.
101798FIN_r2_AnnRep05_Financials44 44101798FIN_r2_AnnRep05_Financials44 44 3/17/06 4:37:00 PM3/17/06 4:37:00 PM

We are a leading provider of rich, robust, and highly accurate maps.
We are also the catalyst in a dynamic mix of new technologies that
are shaping our interconnected world. A world of vehicles talking to
roads and drivers seeing trouble before they reach it. Of more and
more portable devices going wherever drivers take them. Of business
unimpeded by traffi c. Of more-effi cient fl eets, more-intelligent homeland
security––easier, smarter, safer travel.
NAVTEQ. The Map Driving A Mobile World.
Financial Highlights………………………… 1
Letter to Stockholders ……………………… 2
Coverage …………………………………… 5
Content ……………………………………… 6
Customers …………………………………… 8
A Look Forward …………………………… 10
Board of Directors & Offi cers …………… 12
Financial Statements ……………………… 13
Stockholder Information …………………… 45
777Corporate Headquarters222 Merchandise Mart, Suite 900Chicago, Illinois 60654 U.S.A.312 894 7000www.navteq.com
NAVTEQ Stock InformationNAVTEQ common stock is listed on the New York Stock Exchange under the symbol “NVT.” NAVTEQ’s fi lings with the Securities and Exchange Commission (SEC) can be found on our website at www.navteq.com
The following table sets forth the high and low sales prices per share of our common stock for each quarter of 2005 and for the third and fourth quarters of 2004:
2004 2005 3rd Quarter(1) 4th Quarter 1st Quarter 2nd Quarter 3rd Quarter 4th Quarter
High $ 37.55 $ 48.37 $ 48.57 $ 45.23 $ 51.00 $ 53.70
Low $ 24.00 $ 34.70 $ 37.30 $ 34.30 $ 36.06 $ 38.40
(1) Since August 6, 2004, the fi rst day of trading of the Company’s common stock on the New York Stock Exchange.
HoldersAs of February 1, 2006, our common stock was held by 238 stockholders of record.
DividendsExcept for a special cash dividend that was paid to our common stockholders on June 18, 2004, we have never declared or paid any cash dividends on our common stock. We currently intend to retain future earnings, if any, to fi nance the expansion of our business and do not expect to pay any cash dividends in the foreseeable future. In addition, neither we nor our subsidiaries may pay any cash dividends with respect to any shares of any class of our capital stock in accordance with our existing revolving credit agreement. This restriction materially limits our ability to pay dividends on our common stock. Payment of future cash dividends, if any, will be at the discretion of our Board of Directors after taking into account various fac-tors, including our fi nancial condition, operating results, current and anticipated cash needs, and plans for expansion, and in accordance with the revolving credit agreement. Our ability to pay dividends also may be limited by fi nancing or other agreements that we may enter into in the future.
Certifications Copies of the CEO/CFO certifications required under Section 302 of the Sarbanes Oxley Act of 2002 have been filed as an exhibit to the Company’s Annual Report on Form 10-K for the year ended December 31, 2005. We have submitted last year’s Annual CEO Certification to the New York Stock Exchange pursuant to Section 303A.12(a) of the NYSE Listed Company Manual.
Availability of Annual Report on Form 10-KA copy of the Company’s Annual Report on Form 10-K for the year ended December 31, 2005 fi led with the Securities and Exchange Commission is available without charge upon written request to Investor Relations; NAVTEQ; 222 Merchandise Mart, Suite 900; Chicago, Illinois 60654; by calling (312) 894-7500; or by accessing the Company’s website at www.navteq.com under Investor Relations.
Annual Meeting of StockholdersNAVTEQ stockholders as of March 17, 2006 are invited to attend and vote at our annual meeting, which will be held in Chicago, Illinois, May 9, 2006, 9:00 a.m. local time at the following venue:
Holiday Inn Mart PlazaWolf Point Ballroom, 15th Floor350 North Orleans StreetChicago, Illinois 60654 U.S.A.
The doors will open at approximately 8:30 a.m. local time.
Transfer AgentComputershare Investor Services LLC2 North LaSalle StreetChicago, Illinois 60602 U.S.A.312 588 4993
Independent Registered Public Accounting FirmKPMG LLPChicago, Illinois U.S.A.
45
Cya
nM
agen
taYe
llow
Blac
k29
3
101798CVR_r3_NT_2005 AnnualRepor3-4 3-4101798CVR_r3_NT_2005 AnnualRepor3-4 3-4 3/21/06 6:19:14 PM3/21/06 6:19:14 PM

777
2005 Annual Report
NAVTEQ
222 Merchandise Mart, Suite 900
Chicago, Illinois 60654
United States of America
Tel: 312 894 7000 Fax: 312 894 7050
navteq.com
©2006 NAVTEQ. All rights reserved. Printed in the U.S.A.
Cya
nM
agen
taYe
llow
Blac
k29
3
101798CVR_r3_NT_2005 AnnualRepor1-2 1-2101798CVR_r3_NT_2005 AnnualRepor1-2 1-2 3/21/06 6:18:28 PM3/21/06 6:18:28 PM