
2005-3.3 Simulation of Heat Treatment Distortion.pdf
32
Simulation of Heat Treatment Distortion R.A. Hardin 1 and C. Beckermann 2 1 Research Engineer, 2 Professor, Department of Mechanical and Industrial Engineering, The University of Iowa, Iowa City IA 52242 Abstract This paper gives an overview of the problem of heat treatment stress and distortion and a review of literature surrounding it. Software developed to predict heat treat distortion is also reviewed. Simulations are presented for a quenched cylinder to demonstrate the capabilities of software available for predicting heat treatment stress and distortion. The software package DANTE was identified as one of the most advanced tools for solving heat treat distortion problems. Example calculations using DANTE show it to have very advanced features, and its predictions were shown to agree in a relative sense (within about 15%) with measurements reported in the literature of heat treatment distortion on Navy-C rings made from 4140 and 8620 steel quenched in water and in oil. Unfortunately, due to the lack of documentation on the heat treatment process details more quantitative comparison could not be made. As part of future work, the authors are developing a test piece casting to be produced at a participating foundry to provide data on heat treatment distortions. The test casting is being designed through simulation and through consideration of past experiments reported in the literature. Experimental measurement of temperatures and distortions during heat treatment, and (possibly) residual stresses, will be made in the future as part of both experiments on test piece castings, and on production case study castings, to validate and improve the software predictions.
description
2005-3.3 Simulation of Heat Treatment Distortion.pdf
Transcript of 2005-3.3 Simulation of Heat Treatment Distortion.pdf
Simulation of Heat Treatment Distortion
R.A. Hardin1and C. Beckermann2
1Research Engineer, 2Professor, Department of Mechanical and Industrial Engineering,
The University of Iowa, Iowa City IA 52242
Abstract
This paper gives an overview of the problem of heat treatment stress and distortion and a review of literature surrounding it. Software developed to predict heat treat distortion is also reviewed. Simulations are presented for a quenched cylinder to demonstrate the capabilities of software available for predicting heat treatment stress and distortion. The software package DANTE was identified as one of the most advanced tools for solving heat treat distortion problems. Example calculations using DANTE show it to have very advanced features, and its predictions were shown to agree in a relative sense (within about 15%) with measurements reported in the literature of heat treatment distortion on Navy-C rings made from 4140 and 8620 steel quenched in water and in oil. Unfortunately, due to the lack of documentation on the heat treatment process details more quantitative comparison could not be made. As part of future work, the authors are developing a test piece casting to be produced at a participating foundry to provide data on heat treatment distortions. The test casting is being designed through simulation and through consideration of past experiments reported in the literature. Experimental measurement of temperatures and distortions during heat treatment, and (possibly) residual stresses, will be made in the future as part of both experiments on test piece castings, and on production case study castings, to validate and improve the software predictions.
becker
Text Box
Hardin, R.A., and Beckermann, C., “Simulation of Heat Treatment Distortion,” in Proceedings of the 59th SFSA Technical and Operating Conference, Paper No. 3.3, Steel Founders' Society of America, Chicago, IL, 2005.
2
Introduction
Heat treatment and processing associated with it, in particular quenching, are critical to the production of high strength steel castings. Numerous technical details and process parameters must be managed and carefully controlled to avoid damaged or scrapped castings. Thermal and residual stresses that develop during heat treatment and quenching can result in distortion, cracking (particularly troublesome after machining), and rework and weld repair. Furthermore, risk of casting distortion from quenching often limits the ability to quench aggressively, thus reducing the depth of quench-effect and the improvement in properties that might be possible. Distortions often require adjustments to the casting or pattern design, or the addition of tie bars. Many castings are straightened after heat treatment by pressing operations, which are time consuming and expensive. Finally, residual stresses can reduce the service performance of steel castings and result in catastrophic failure during service. Normalizing and stress relieving can be performed, but it results in additional energy use, or overuse. Because of these complexities, heat treatment processing is generally designed over time, based on experience and trial and error.
An accurate, user-friendly computer model for predicting the distortions and residual
stresses that develop during heat treatment of steel castings would be a powerful tool in the hands of foundry personnel. Having such predictive abilities, foundry engineers could reduce trial and error processing and use heat treatment resources more economically. Casting patterns could be designed with the heat treatment processing already considered. Foundries could take full advantage of improvements in furnace control, accurately predicting stress development and relief during austenitizing and tempering. This information could be very useful in efficiently managing the furnace, while achieving desired mechanical properties and an acceptable residual stress field. Unfortunately, the modeling of heat treatment and its effects on the stress state of a casting is not easy. It involves not just modeling the heat transfer and stresses in the casting, but also modeling the microstructural changes in the steel throughout processing. Changes in the steel microstructure are very important since they produce changes in mechanical properties (such as density and thermal expansion coefficient). Other technical obstacles to computer modeling include complex heat transfer (i.e. boiling regimes during quenching), quenchant properties, variable mechanical properties with temperature and microstructure, and non-uniform heat transfer conditions over the casting surface.
The casting simulation software currently used by steel foundries is limited in its
capabilities to predict distortions and stresses resulting from heat treatment. Consequently, heat treatment process design still involves a tedious trial-and-error process, often requiring corrective measures. In addition, the heat treatment computer models that are available to engineers are primarily targeted for forgings and machined parts, and they do not take the deformations that occur during the casting process into account. Ultimately, for steel foundry engineers, prediction of the final dimensions of and residual stresses in a steel casting after heat treatment requires consideration of the casting process itself, because distortions and stresses already develop during the solidification and initial cooling processes.
In addition to improved casting quality and streamlined heat treatment process design,
energy savings will result through the use of heat treatment models. Energy savings will result
3
from: dramatically reduced scrap, rework, and reduced trial and error processing, efficient management of the heat treatment process and improved control of heat treatment furnaces based on engineering and metallurgical principles. Improved casting performance and superior material properties will lead to additional energy savings, since superior mechanical properties provide significant weight savings and longer service life in properly design parts. These outcomes will result in an increase in casting yield and reduced energy consumed in the heat treatment process. These energy-savings are directly relevant to the goals of the United States Department of Energy (DoE) Metal Casting program through whose funding this research is being performed. A conservative estimate of the annual Net Melting Energy Reduction arising from this project is 1.43 trillion Btu/year within ten years of this technology’s implementation in SFSA member foundries. Review of Past Work
There has been considerable interest in this topic in the past, and substantial research
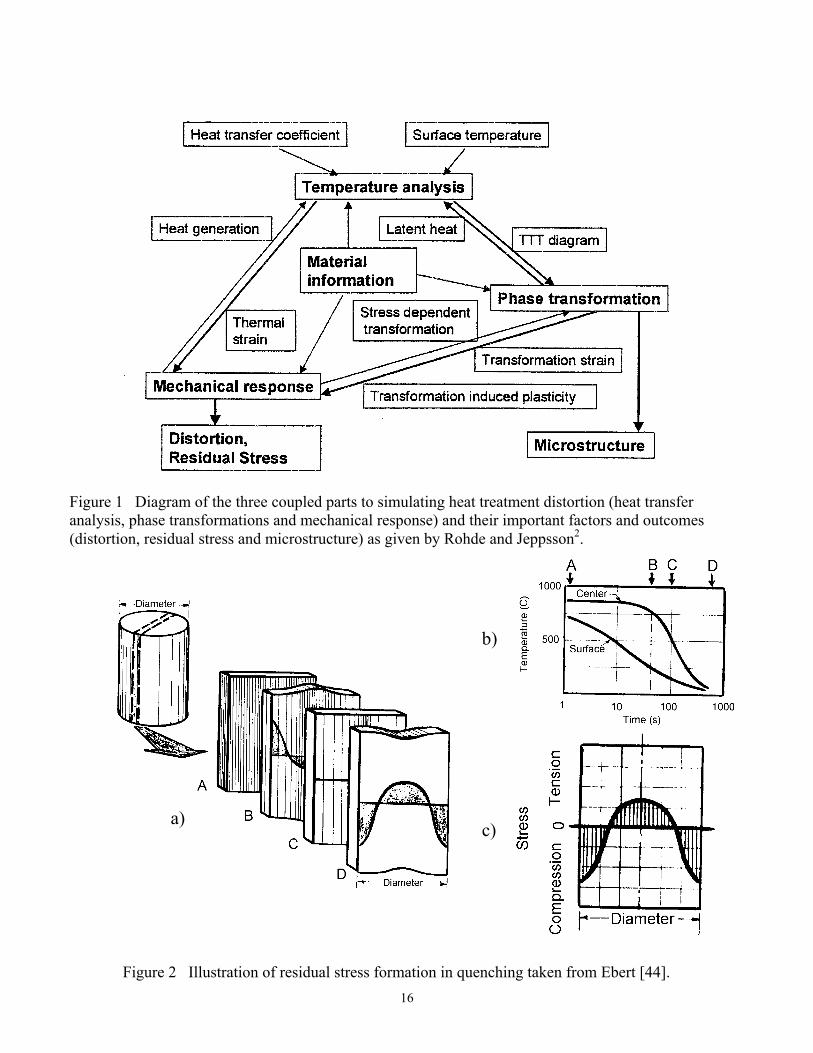
resources have been directed toward the prediction of residual stress and distortion arising during heat treatment. An excellent overview of the mathematical modeling of heat treatment distortion is presented by Fletcher [1]. Here the reader will find important background on the elastic-plastic and finite element modeling used to compute thermal stresses, as well as background on the relationship between microstructure and thermal stress. Fletcher [1] also provides an overview of thermo-mechanical material properties dependent on temperature and microstructural phase. Even though this reference reflects the state of capabilities in the 1980’s, and presents only two-dimensional modeling results for cylinders and plates, it presents the fundamentals of the models and issues that do not change. A recent literature review on the topic is given by Rohde and Jeppsson [2], where they present Figure 1. This figure is repeated here because it is an excellent graphical representation of the problem. Starting with the three main model components required to simulate heat treatment distortion (heat transfer analysis, phase transformations and mechanical response), Figure 1 gives their important factors, issues to be addressed, and the most critical results from heat treatment simulation: distortion, residual stress and microstructure. Using Figure 1 as a visual aid representing the complexity of the problem, it is easy to understand why the problem has been attacked in a piece by piece fashion over the years.
Predicting the phase transformations and microstructure is an important piece of this
puzzle. Rohde et al. [3] have presented an approach to determine the phase transformations using a database of time-temperature transformation (TTT) diagrams for available steels and the Avrami-type [4] equation for the diffusion transformations. Then, in the case of steels for which there is no TTT diagram, the program Thermo-Calc is used with the desired chemistry to calculate the thermodynamic temperatures (for example the austenite-ferrite transition A3, the eutectoid A1, the martensite start and finish, Ms and Mf , temperatures) along with a ”similar” TTT diagram to estimate the transformation data. The martensite transformation is time independent. Martensite transformation can be determined (as by Rohde et al. [3]) using the Koistinen-Marburger equation [5]. The effect of stress on the Ms is also considered [3]. A similar approach is taken by Hunkel et al. [6] to simulate the transformations in steel during quenching. Lusk and co-workers [7-17] have contributed substantially in this area, and have
4
produced a highly useful model [9,11] of phase transformations in steel. The Lusk et al. model [9,11] will be used in the model results presented in this paper.
The constitutive behavior of the steel thermo-mechanical material properties during heat
treatment is highly complex. The mechanical properties are dependent on temperature, phases present, deformation and deformation rate. Alberg et al. [18-20] have investigated and compared various constitutive material models. These material models are strain rate-independent plasticity, rate-dependent plasticity (where creep is considered as a special case), and unified plasticity models [18] that incorporate all effects. Substantial differences arise from using different constitutive models, and generally one would want to use the most sophisticated model possible. Unfortunately, more sophisticated models require more material parameters, which are determined by iterative or inverse solutions using the model to match experimental results. The best matching parameters are more easily determined for simpler models. Finding proper material model parameters can be challenging. Alberg demonstrates [19] that in some cases less sophisticated models (strain-rate independent, having fewer material parameters) can produce good enough results for use in heat treatment process design. A sophisticated internal state variable model has been developed to describe the mechanical behavior of single phase materials over a wide range of temperatures and strain rates, the Bammann, Chiesa and Johnson (BCJ) model [21]. This model has been extended to two-phase materials [22] and steel [11] having up to five-phases (austenite, pearlite, ferrite, bainite and martensite). A complete description of the BCJ model and its variants is beyond the scope of this paper. The interested reader is directed to references [11, and 21 to 23]. However, the complexity of the model is such that up 20 material constants must be determined for a material to describe its temperature and strain-rate dependence. These are determined by using nonlinear regression [24] on experimental data. The experiments necessary to determine the model parameters are uniaxial tension tests performed at different temperatures and strain rates on specimens of a given alloy [25]. Generally, the specimens are heated treated to isolate specific phases so that the phase dependence can be determined as well. Finally, reversed loading testing is also performed to determine constants related to the material’s hardening characteristics. Often times an exhaustive experimental test plan is not possible to determine all the model parameters with desired confidence. In such cases, data from a similar alloy must be used to fit a much more limited set of test data for the alloy of interest [25].
Returning to Figure 1, the phase transformation and material constitutive models must be
combined with a thermal stress computation. Commercial finite element software packages are readily capable of predicting un-coupled and coupled heat transfer with stress and displacement (ABAQUS, ANSYS, NASTRAN, ALGOR, and many others). These programs do not by themselves provide prediction of microstructure or advanced multiphase material models necessary to predict the complete problem of heat treatment distortion. Thermal stress prediction that includes prediction of the phase transformations, evolving microstructure and properties is reported using research-oriented computer models that do not appear to be offered commercially (as exemplified by [26-29]). Models offered commercially are SYSWELD [30, 31], HEAt tReaTment Simulation system (HEARTS) [32] and DEFORMTM-HT [33-35], TRAST [36, 37], and DANTETM [25, 38-41]. Of these the two that appear to have been researched and verified most in the literature appear to be DEFORMTM-HT [33, 34] and DANTETM [25, 38-40]. DEFORMTM-HT is a stand alone software package, incorporating a finite element solver, while
5
DANTETM is a set of user subroutines that requires the ABAQUS or Kiva finite element solvers. In addition to these software packages, MAGMA Giessereitechnologie GmbH has also investigated prediction of heat treatment distortion with their MAGMAsteel and MAGMAstress modules in the thesis by Weber [42].
DANTETM was chosen as the simulation software used in the present work. The primary
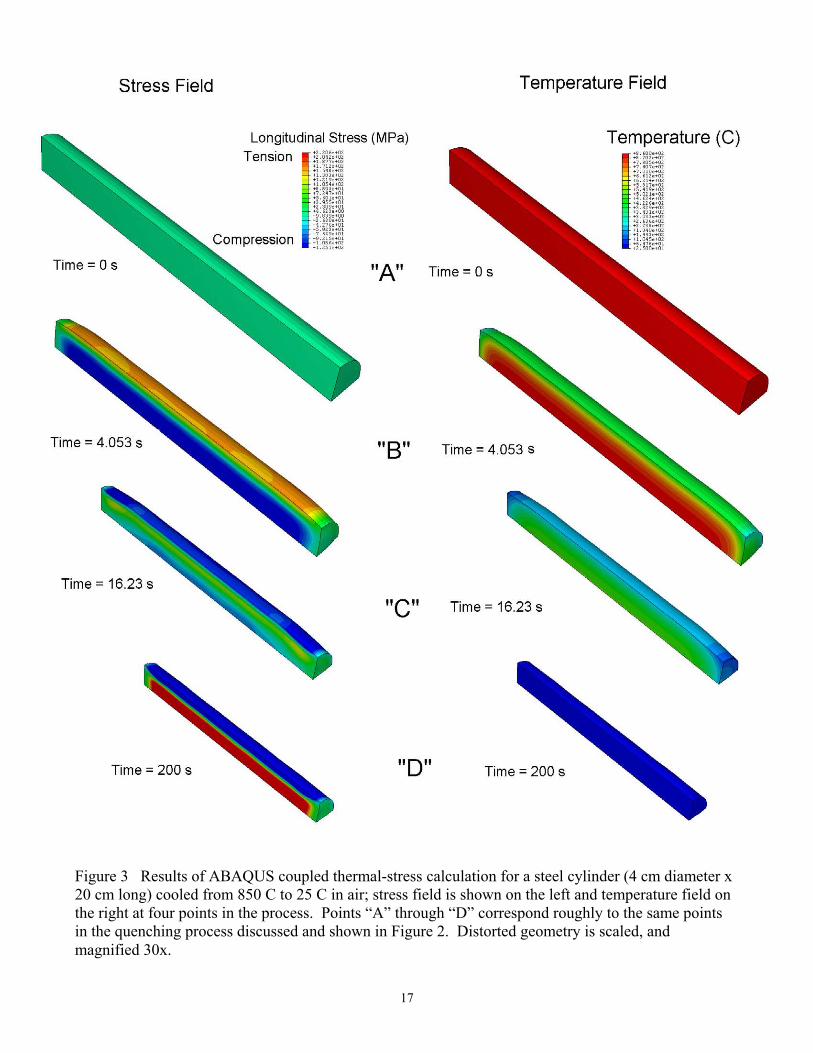
goal here is to investigate and demonstrate its abilities to predict heat treatment distortions and residual stresses in steel castings. We believe it to be the state of the art, being developed as part of a very large, ~$25 million project in heat treatment distortion simulation managed by the National Center for Manufacturing Sciences conducted at participating national labs (Lawrence Livermore, Los Alamos, Oak Ridge and Sandia), universities (Colorado School of Mines and IIT Research Institute) and industrial companies (Ford, GM, Eaton Corp. and Torrington Co.). DANTETM incorporates the phase transformation model of Lusk et al. [9,11,15 and 16] and the BCJ material model [11, 21-23]. In the remainder of the paper, the capabilities of DANTE will be demonstrated and discussed. A classic test problem, the heat treatment of a cylinder, will first be solved to demonstrate the fundamental issues arising during heat treatment, due to thermally induced plastic deformation and multiple phases present. Then some initial calculations using DANTETM will be made on a Navy C-ring test piece often used to evaluate cracking and distortion. Heat Treatment Residual Stress and Distortion with Software Demonstration A classic problem commonly used to visualize the formation of residual stresses is the cooling (or quenching) of a cylinder. Consider longitudinal stress and deformation in a section taken from a cylinder as cooling proceeds from steps “A” through “D” shown in Figure 2 a) and b), taken from [43, 44]. At step “B”, rapid cooling at the surface results in longitudinal tension near the surface, and compressive stress forms at the center. If plastic deformation occurs, the center contracts, and the surface expands relieving the stress – a final residual stress distribution shown at “D” results as shown in Figure 2 c). This process occurs simply due to thermal stresses forming as a result of temperature dependent material properties, without the consideration of phase changes. Commercial finite element software, such as ABAQUS used here, is readily capable of predicting these thermal stresses. Figure 3 shows the development of the thermal stress field simulated in a cylinder, assuming one-quarter symmetry. The cylinder is initially at 860 C, then air cooled to 25 C. The steel cylinder is 4 cm diameter x 20 cm long. In Figure 3 the stress field is shown on the left and temperature field on the right at the steps that correspond roughly to “A” through “D” in the quenching process shown in Figure 2. Note that the distorted geometry is scaled, and magnified 30 times, so the distortions are more apparent. The final longitudinal stress field is compressive at the surface and in tension at the center, and is due to the plastic deformation that occurred. Additional stress and deformation occurs in the presence of phase change due to differences in material properties (thermal expansion coefficient for example) of the phases present. The complexities associated with residual stress formation in the presence of phase changes are discussed in detail by Brooks [43]. Here we follow an example presented by Brooks to illustrate the nature of the stresses that form due to phase transformations and the final
6
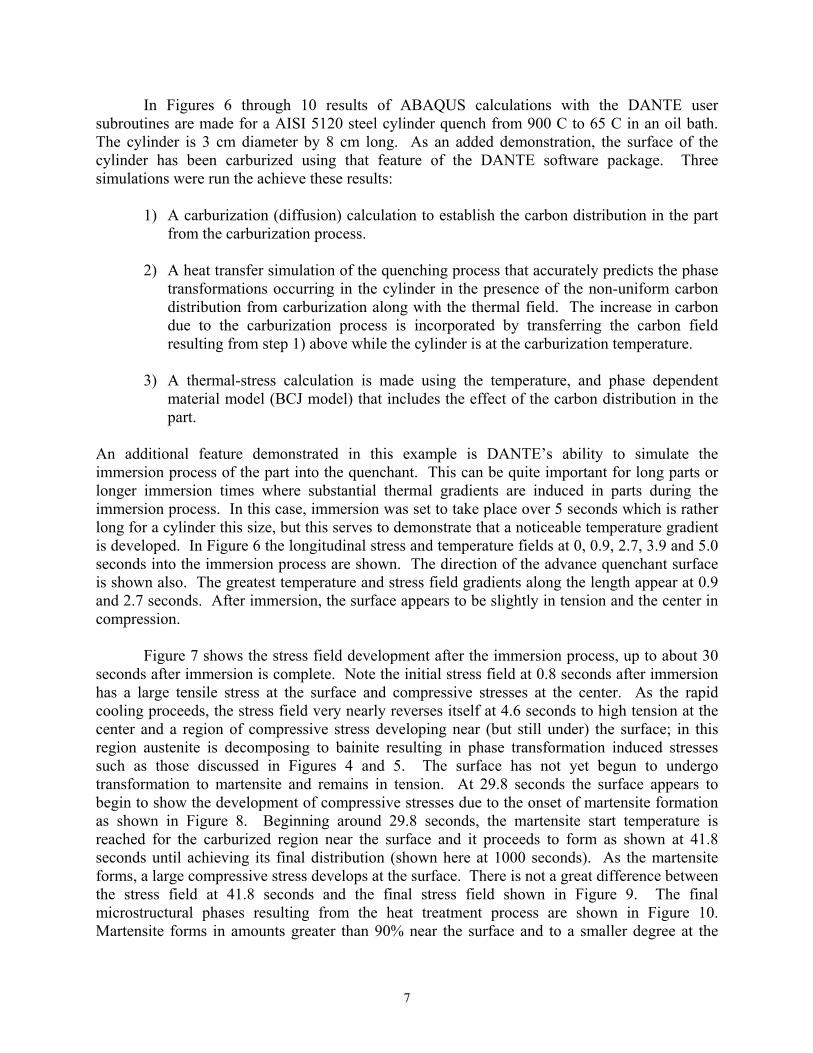
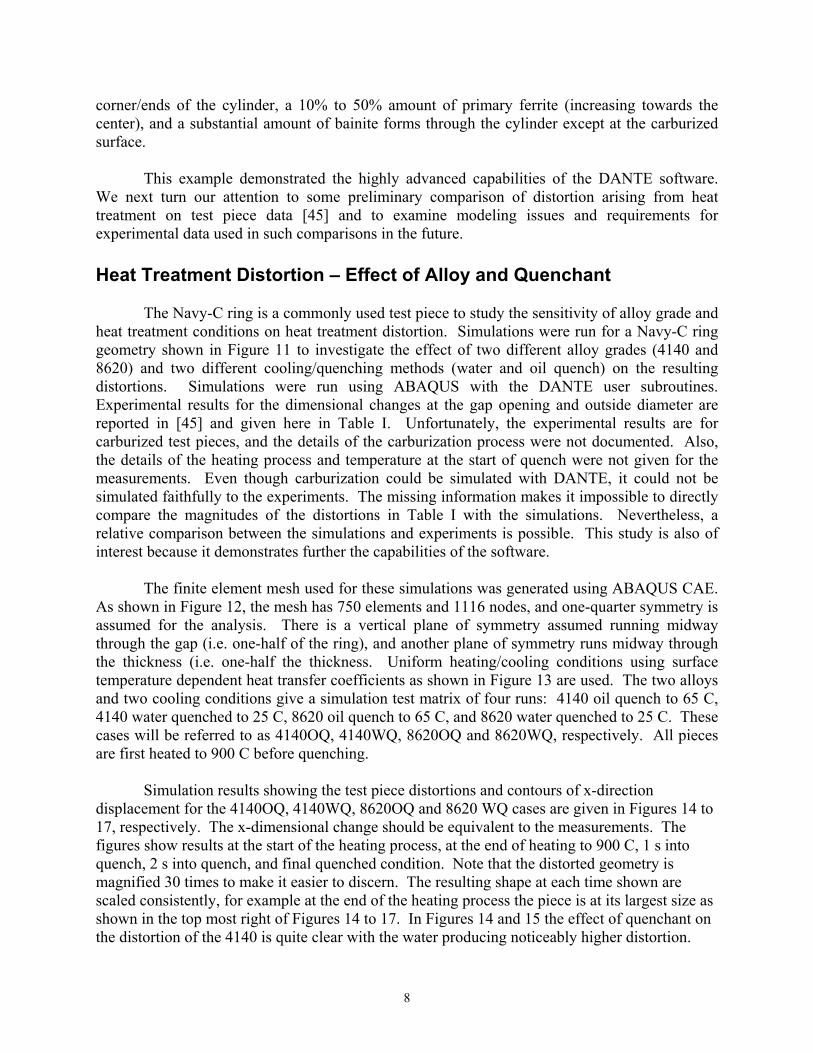
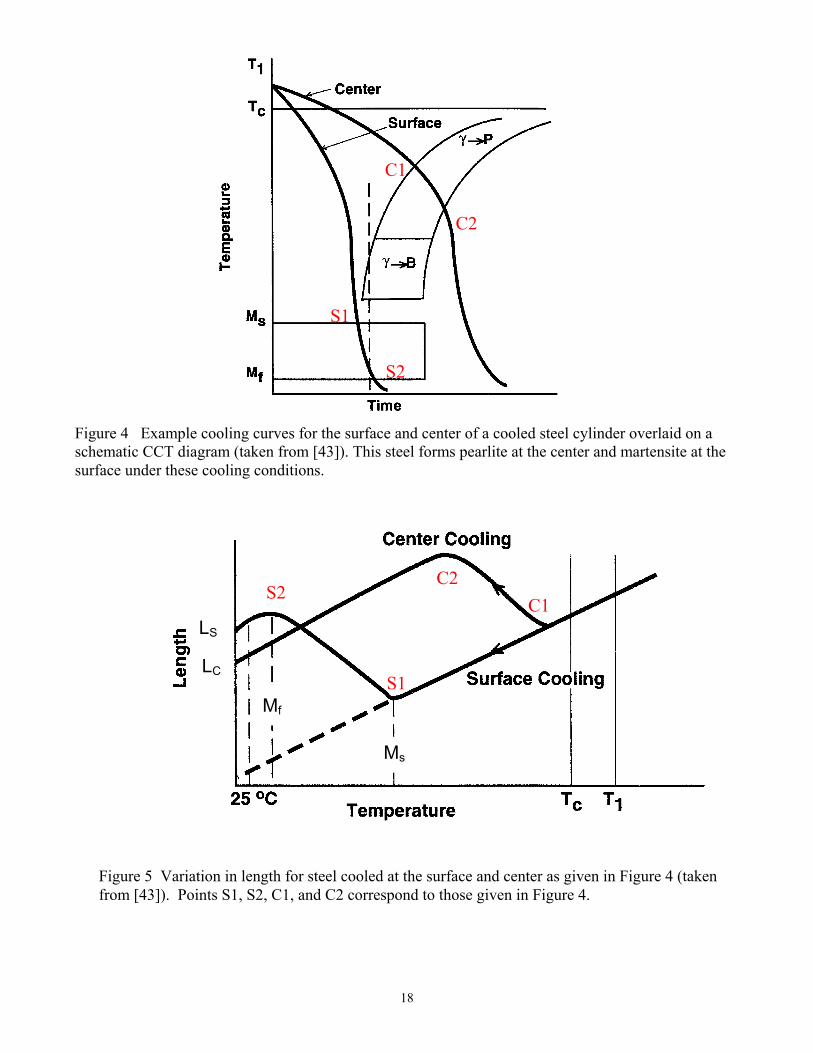
microstructural variations in a part. Consider again a cylinder cooling, but now overlay the cooling curves for the surface and center of the cylinder onto a continuous cooling transformation diagram as shown in Figure 4 (taken from [43]). For the steel under consideration, the rapid cooling at the surface forms martensite, beginning at the martensite start temperature Ms indicated by point S1 in Figure 4. The surface continues cooling until the end of the martensitic reaction at point S2. The center cooling curve indicates that the austenite will decompose into pearlite beginning at point C1 until C2 when all the austenite has decomposed into pearlite.
Consider now the volumetric changes that occur in the metal when it changes phase. Martensite has about 5% greater specific volume than the austenite from which it forms. Even though the austenite from which the martensite is forming continues to contract on cooling, the formation of the martensite results in a net expansion of the steel. This can be visualized by imagining an entire cylinder being cooled under the conditions of the surface shown in Figure 5 from point S1 to S2. Point S1 indicates the start of expansion due to the beginning of martensite formation. Eventually, at point S2, the martensite is finished forming, and there is no further expansion due to the phase transformation. At this point, our imaginary cylinder undergoing the “surface” cooling conditions will continue to contract according to the thermal expansion coefficient of martensite until it reaches a final length LS as indicated in Figure 5. Visualize another imaginary cylinder being cooled under the conditions at the center. For the center cooling curve, pearlite begins to form at C1 shown in Figure 5. Since the specific volume of pearlite is larger than austenite (like martensite), it expands until the completion of the austenite decomposition to pearlite at C2. After C2, the pearlite will contract according to its thermal expansion coefficient to a final length of LC. Next imagine that we can join the material in the two imaginary cylinders (cooled at surface and center conditions) into one cylinder. Without restriction, the length of the surface of this cylinder would be LS and the center would be LC. However, they are restricted now by being joined together and since LC < LS, the surface pulls on the center section placing it in tension, while the center also resists being pulled placing the surface in compression. The resulting length of the joined-cylinder (having a center made of pearlite and a surface of martensite) will be between LC and LS and the longitudinal stress state will be compressive at the surface and in tension at the center. In the preceding discussion, the “thought” experiment conducted is meant to serve only as an example of a fundamental mechanism of stress formation due to phase transformation alone. One can readily see how a residual stress field can result even without the material plastically deforming. The resulting stress state in a part (even a simple cylinder) during heat treatment operations is highly complex, and even for a cylinder the stress state can vary considerably throughout the process depending on when phases form, and which phases are forming throughout the part. For example, the surface will be in considerable tension during the initial cooling before martensite forms, and volumetric contraction of the austenite is the driving mechanism of the stress formation. Consider too that phases have variable elastic-plastic mechanical properties, and a harder phase (like martensite) will resist stresses more than softer phases, and if plastic deformations occur, they will serve to relieve the stresses. Consideration of all these effects is very difficult and requires a model like DANTETM.
7
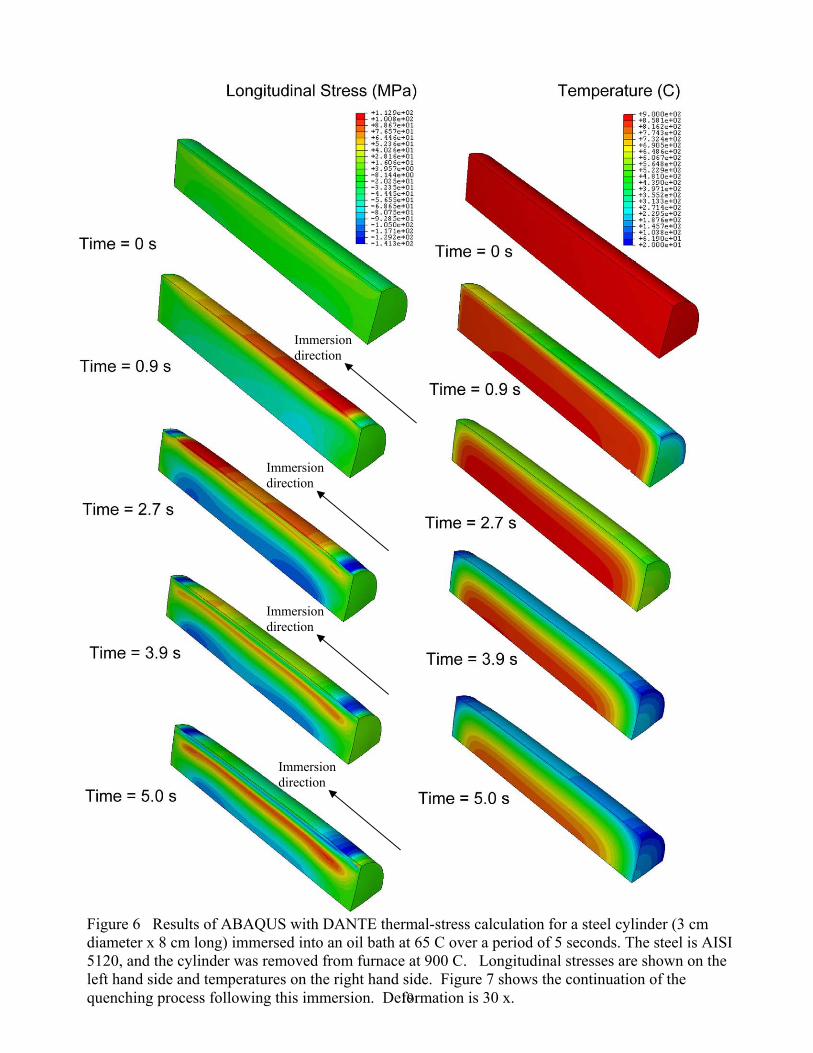
In Figures 6 through 10 results of ABAQUS calculations with the DANTE user subroutines are made for a AISI 5120 steel cylinder quench from 900 C to 65 C in an oil bath. The cylinder is 3 cm diameter by 8 cm long. As an added demonstration, the surface of the cylinder has been carburized using that feature of the DANTE software package. Three simulations were run the achieve these results:
1) A carburization (diffusion) calculation to establish the carbon distribution in the part from the carburization process.
2) A heat transfer simulation of the quenching process that accurately predicts the phase
transformations occurring in the cylinder in the presence of the non-uniform carbon distribution from carburization along with the thermal field. The increase in carbon due to the carburization process is incorporated by transferring the carbon field resulting from step 1) above while the cylinder is at the carburization temperature.
3) A thermal-stress calculation is made using the temperature, and phase dependent
material model (BCJ model) that includes the effect of the carbon distribution in the part.
An additional feature demonstrated in this example is DANTE’s ability to simulate the immersion process of the part into the quenchant. This can be quite important for long parts or longer immersion times where substantial thermal gradients are induced in parts during the immersion process. In this case, immersion was set to take place over 5 seconds which is rather long for a cylinder this size, but this serves to demonstrate that a noticeable temperature gradient is developed. In Figure 6 the longitudinal stress and temperature fields at 0, 0.9, 2.7, 3.9 and 5.0 seconds into the immersion process are shown. The direction of the advance quenchant surface is shown also. The greatest temperature and stress field gradients along the length appear at 0.9 and 2.7 seconds. After immersion, the surface appears to be slightly in tension and the center in compression.
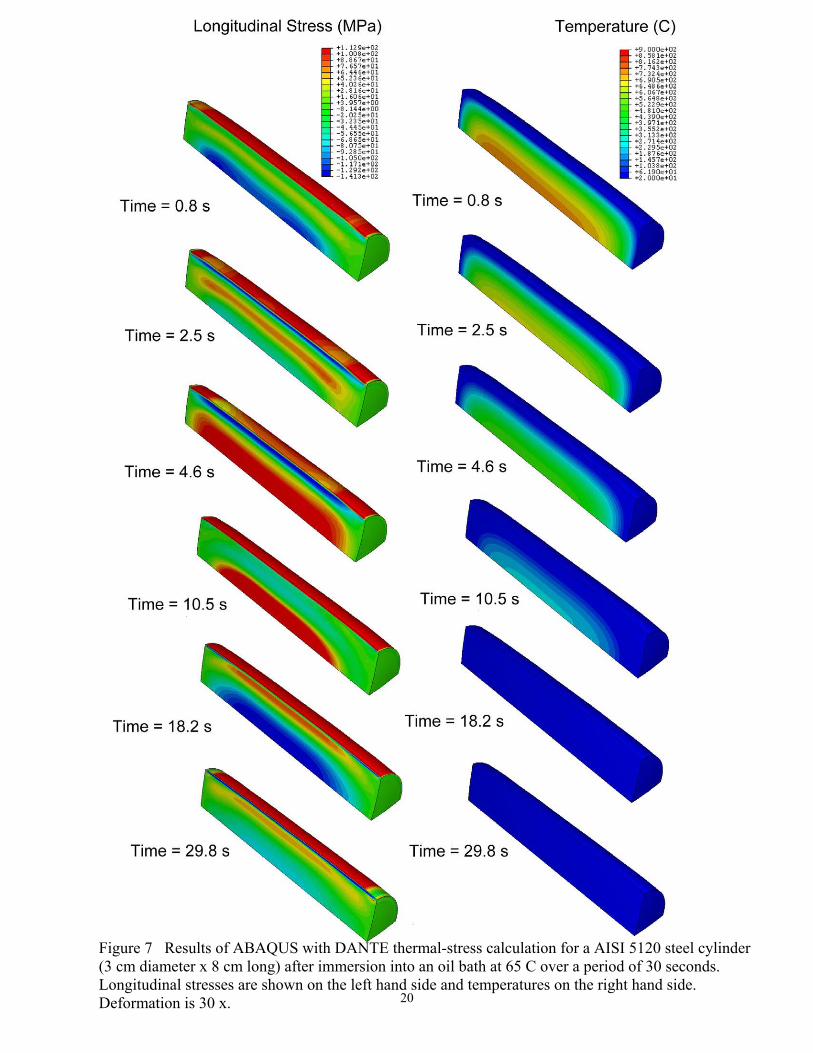
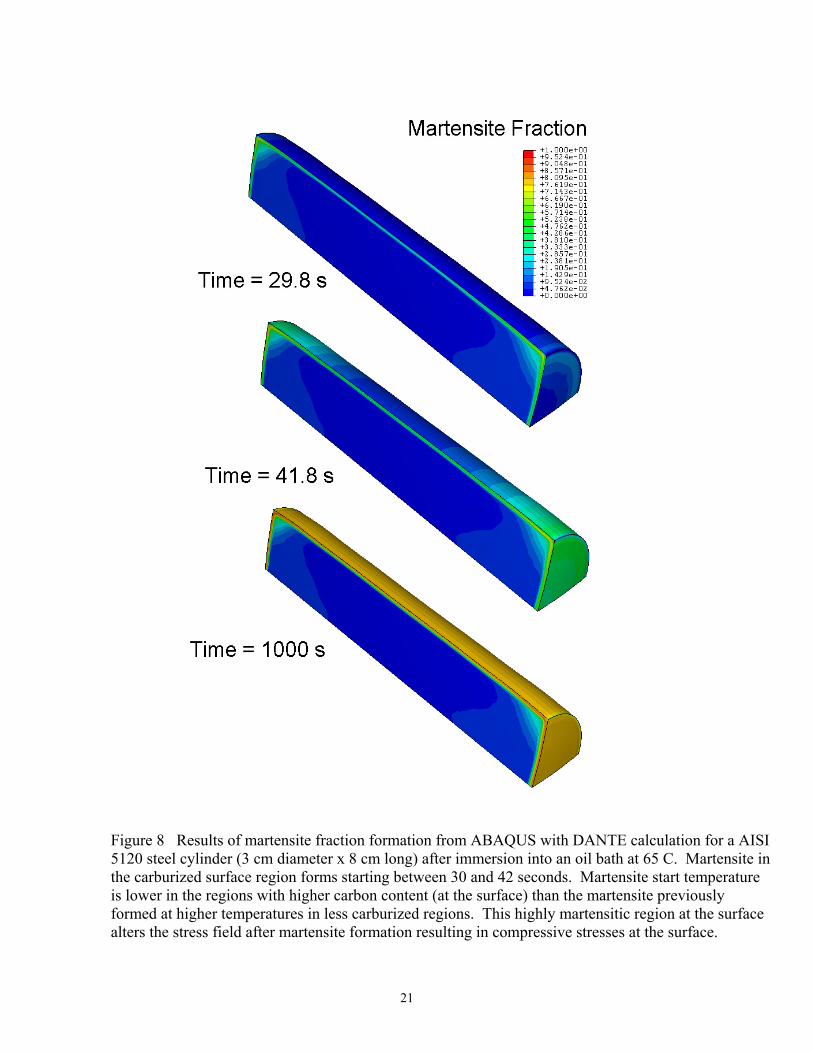
Figure 7 shows the stress field development after the immersion process, up to about 30 seconds after immersion is complete. Note the initial stress field at 0.8 seconds after immersion has a large tensile stress at the surface and compressive stresses at the center. As the rapid cooling proceeds, the stress field very nearly reverses itself at 4.6 seconds to high tension at the center and a region of compressive stress developing near (but still under) the surface; in this region austenite is decomposing to bainite resulting in phase transformation induced stresses such as those discussed in Figures 4 and 5. The surface has not yet begun to undergo transformation to martensite and remains in tension. At 29.8 seconds the surface appears to begin to show the development of compressive stresses due to the onset of martensite formation as shown in Figure 8. Beginning around 29.8 seconds, the martensite start temperature is reached for the carburized region near the surface and it proceeds to form as shown at 41.8 seconds until achieving its final distribution (shown here at 1000 seconds). As the martensite forms, a large compressive stress develops at the surface. There is not a great difference between the stress field at 41.8 seconds and the final stress field shown in Figure 9. The final microstructural phases resulting from the heat treatment process are shown in Figure 10. Martensite forms in amounts greater than 90% near the surface and to a smaller degree at the
8
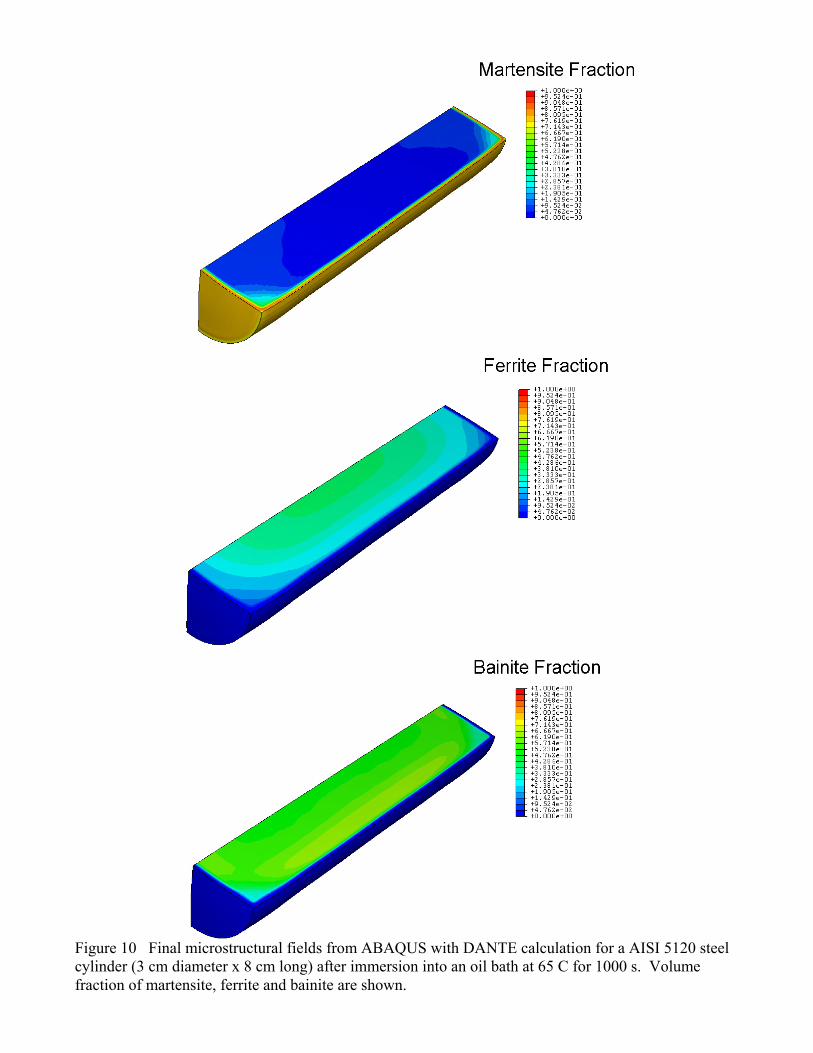
corner/ends of the cylinder, a 10% to 50% amount of primary ferrite (increasing towards the center), and a substantial amount of bainite forms through the cylinder except at the carburized surface.
This example demonstrated the highly advanced capabilities of the DANTE software.
We next turn our attention to some preliminary comparison of distortion arising from heat treatment on test piece data [45] and to examine modeling issues and requirements for experimental data used in such comparisons in the future. Heat Treatment Distortion – Effect of Alloy and Quenchant
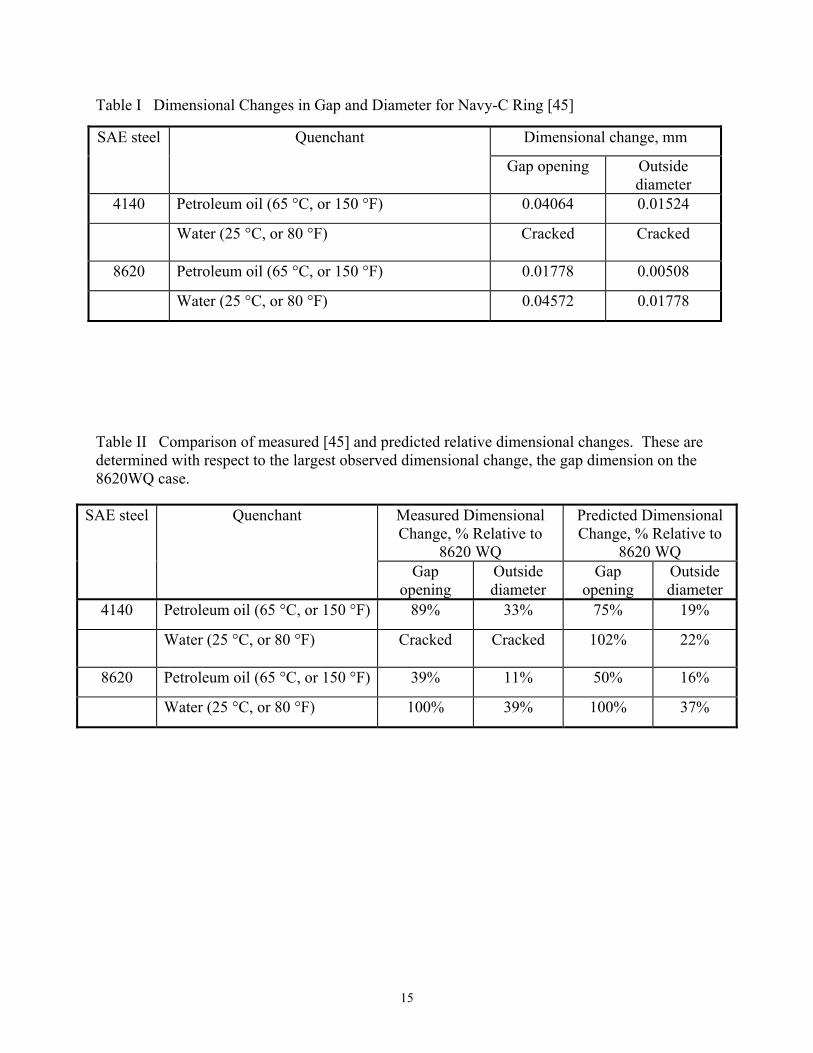
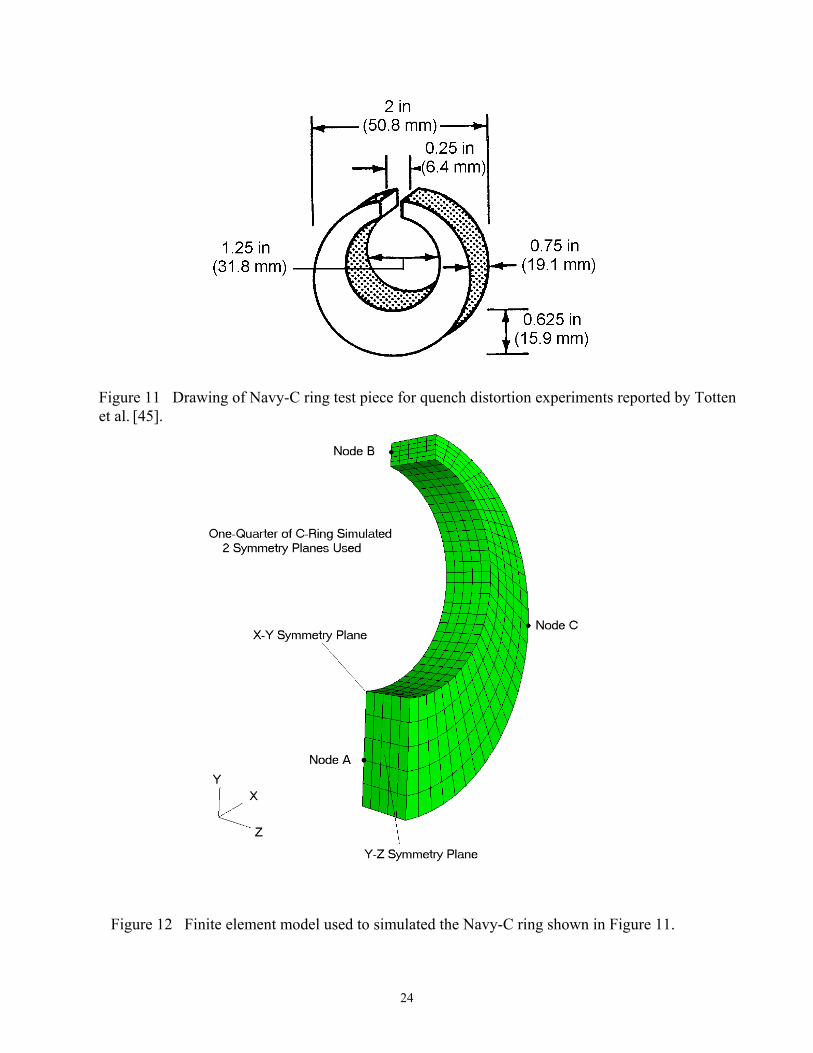
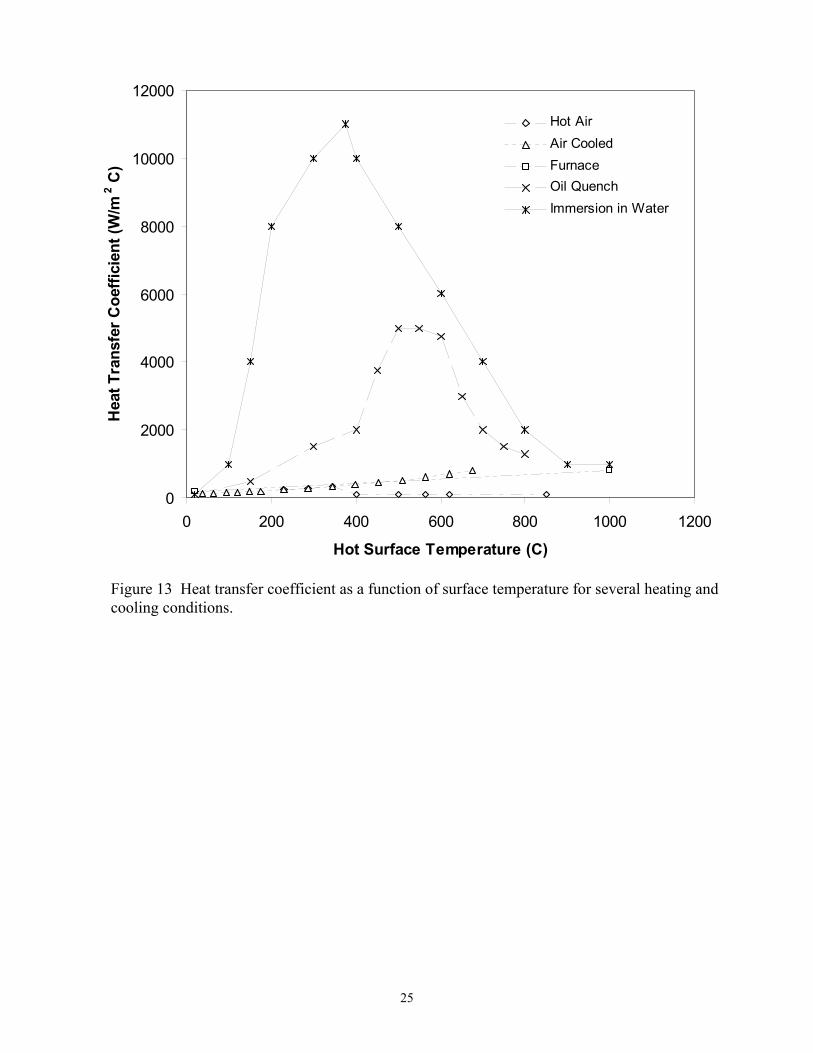
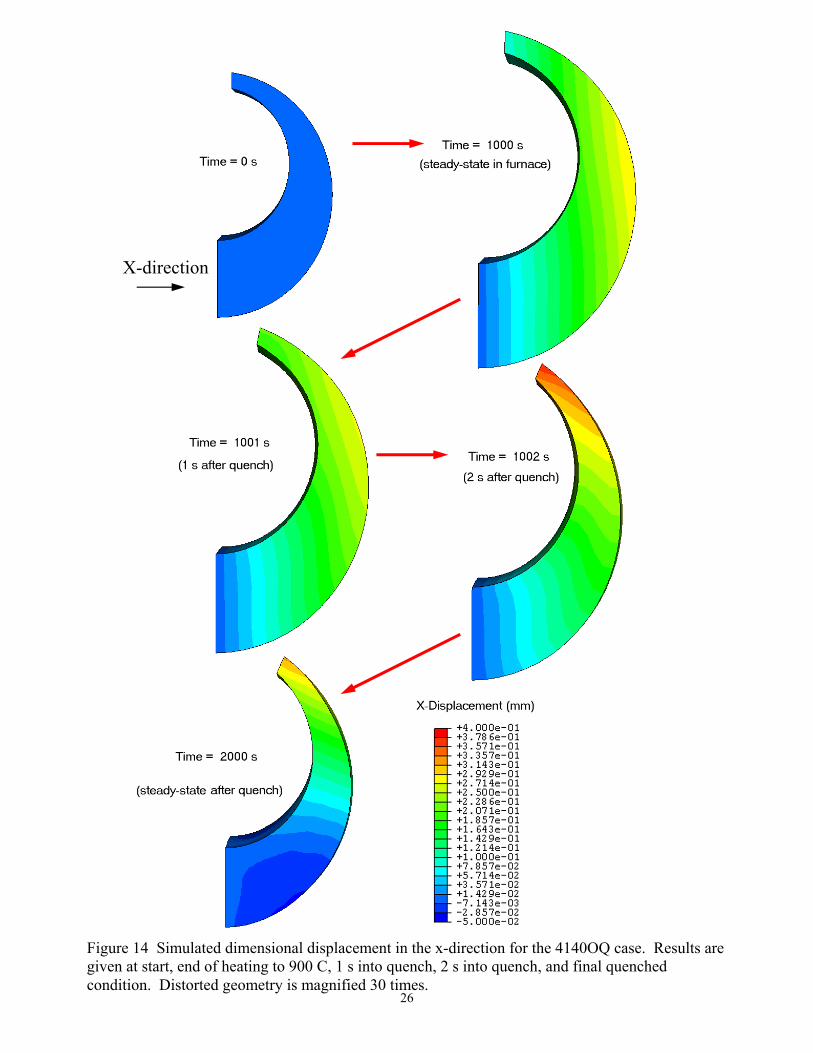
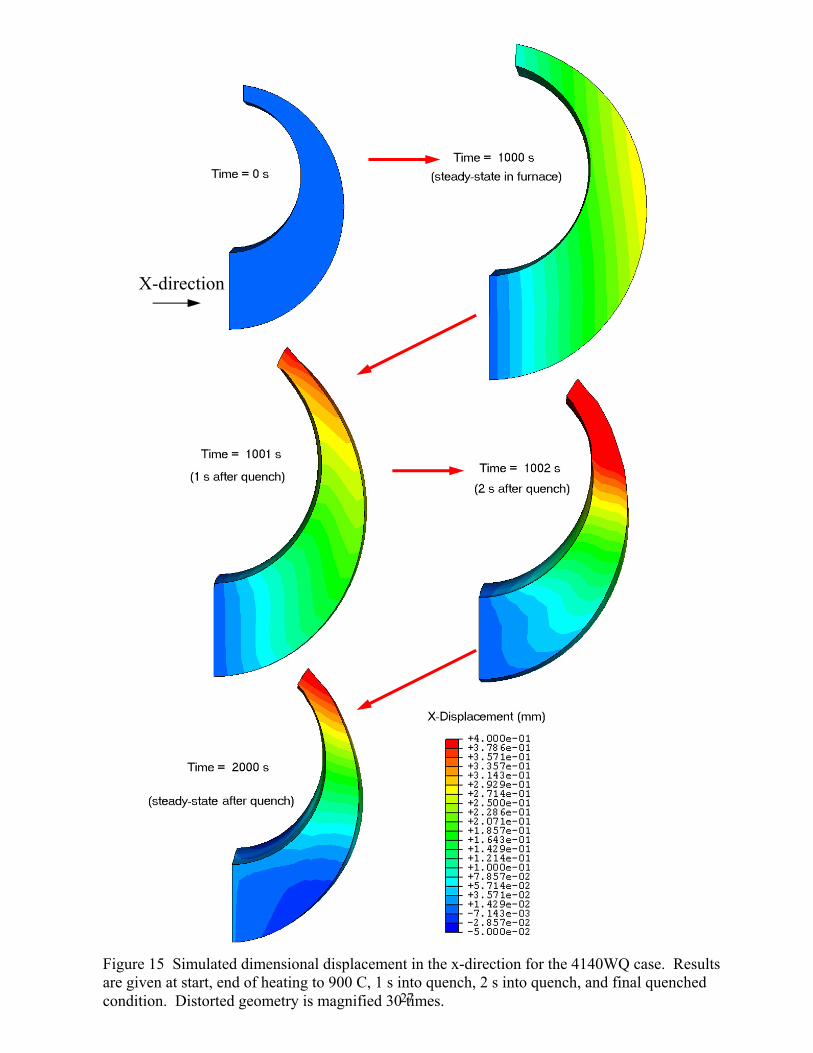
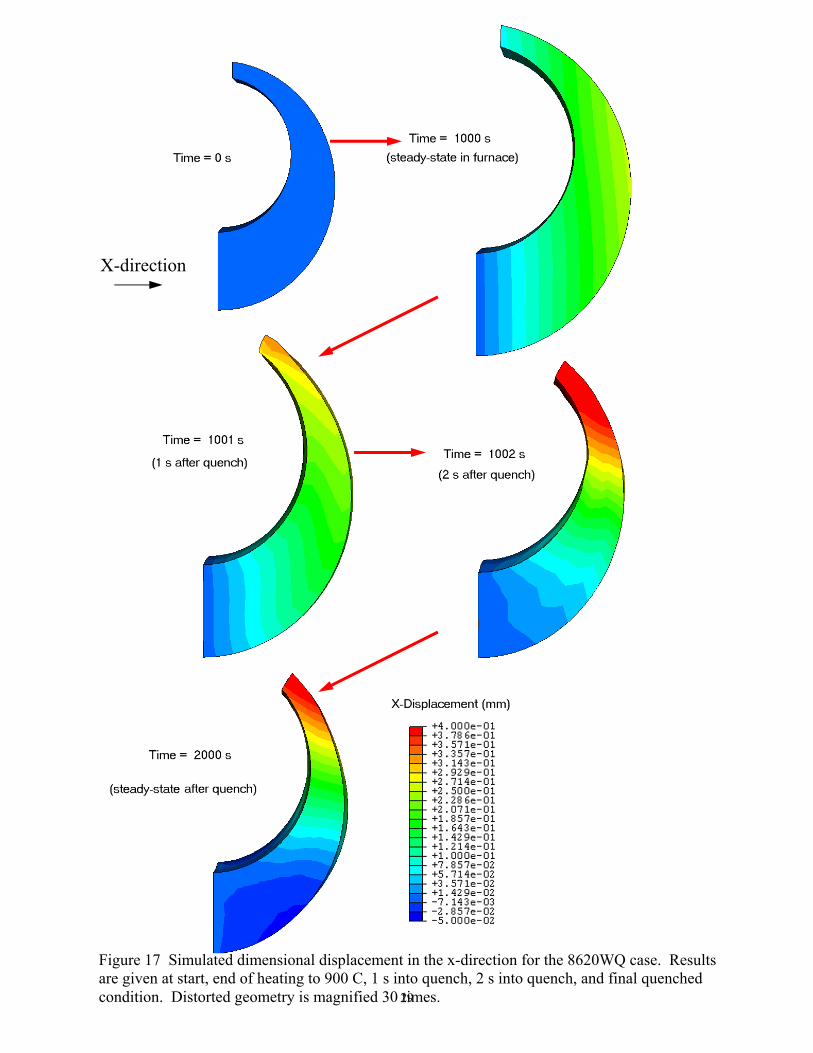
The Navy-C ring is a commonly used test piece to study the sensitivity of alloy grade and heat treatment conditions on heat treatment distortion. Simulations were run for a Navy-C ring geometry shown in Figure 11 to investigate the effect of two different alloy grades (4140 and 8620) and two different cooling/quenching methods (water and oil quench) on the resulting distortions. Simulations were run using ABAQUS with the DANTE user subroutines. Experimental results for the dimensional changes at the gap opening and outside diameter are reported in [45] and given here in Table I. Unfortunately, the experimental results are for carburized test pieces, and the details of the carburization process were not documented. Also, the details of the heating process and temperature at the start of quench were not given for the measurements. Even though carburization could be simulated with DANTE, it could not be simulated faithfully to the experiments. The missing information makes it impossible to directly compare the magnitudes of the distortions in Table I with the simulations. Nevertheless, a relative comparison between the simulations and experiments is possible. This study is also of interest because it demonstrates further the capabilities of the software. The finite element mesh used for these simulations was generated using ABAQUS CAE. As shown in Figure 12, the mesh has 750 elements and 1116 nodes, and one-quarter symmetry is assumed for the analysis. There is a vertical plane of symmetry assumed running midway through the gap (i.e. one-half of the ring), and another plane of symmetry runs midway through the thickness (i.e. one-half the thickness. Uniform heating/cooling conditions using surface temperature dependent heat transfer coefficients as shown in Figure 13 are used. The two alloys and two cooling conditions give a simulation test matrix of four runs: 4140 oil quench to 65 C, 4140 water quenched to 25 C, 8620 oil quench to 65 C, and 8620 water quenched to 25 C. These cases will be referred to as 4140OQ, 4140WQ, 8620OQ and 8620WQ, respectively. All pieces are first heated to 900 C before quenching. Simulation results showing the test piece distortions and contours of x-direction displacement for the 4140OQ, 4140WQ, 8620OQ and 8620 WQ cases are given in Figures 14 to 17, respectively. The x-dimensional change should be equivalent to the measurements. The figures show results at the start of the heating process, at the end of heating to 900 C, 1 s into quench, 2 s into quench, and final quenched condition. Note that the distorted geometry is magnified 30 times to make it easier to discern. The resulting shape at each time shown are scaled consistently, for example at the end of the heating process the piece is at its largest size as shown in the top most right of Figures 14 to 17. In Figures 14 and 15 the effect of quenchant on the distortion of the 4140 is quite clear with the water producing noticeably higher distortion.
9
Likewise in Figures 16 and 17, the 8620 water quenched piece shows the greatest distortion. The 4140 gave greater distortions than the 8260 when comparing alloys for the same cooling conditions. These results compare favorably in a qualitative sense with the measured results shown in Table I, where the 4140WQ cracked (and the distortion could not be measured), 8620WQ was next highest, followed by the 4140OQ case and the least distortions were seen in the 8620OQ case.
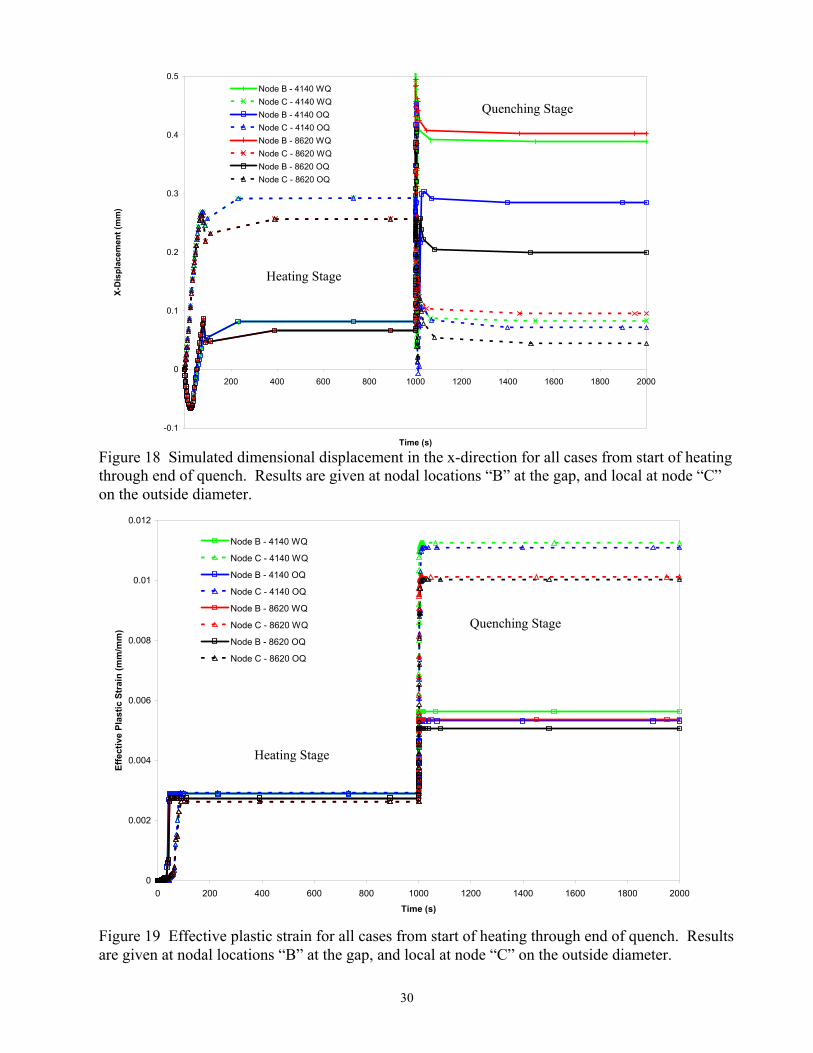
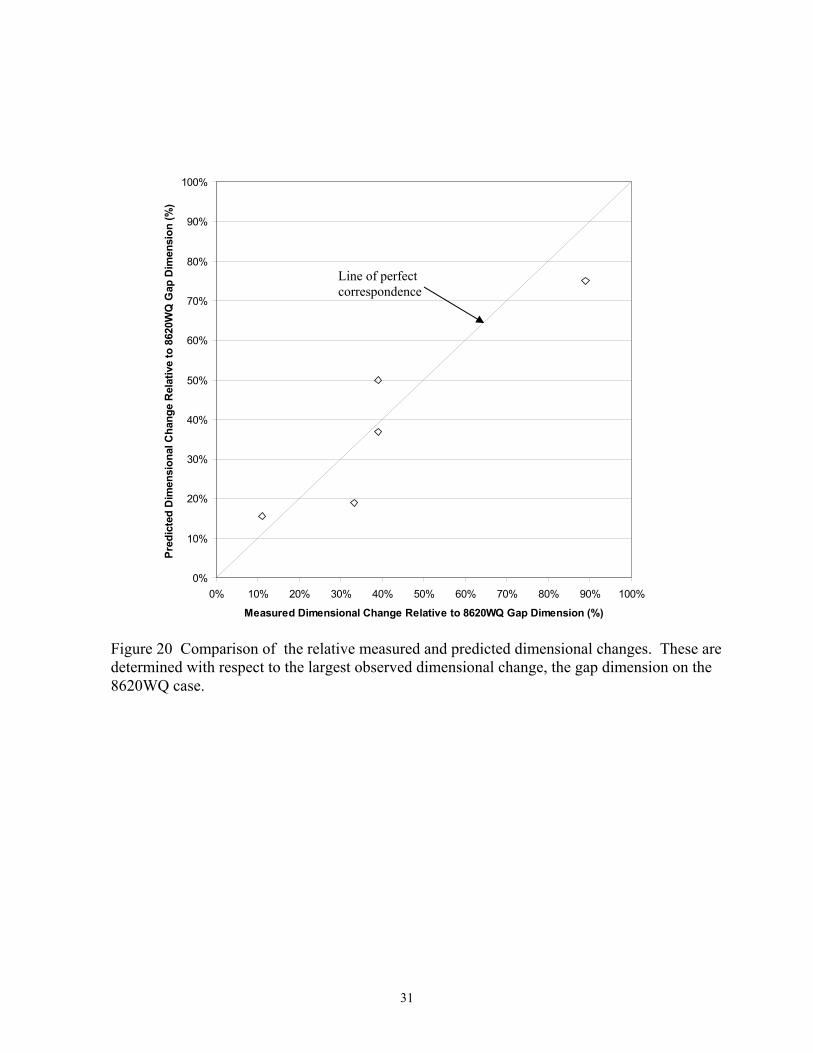
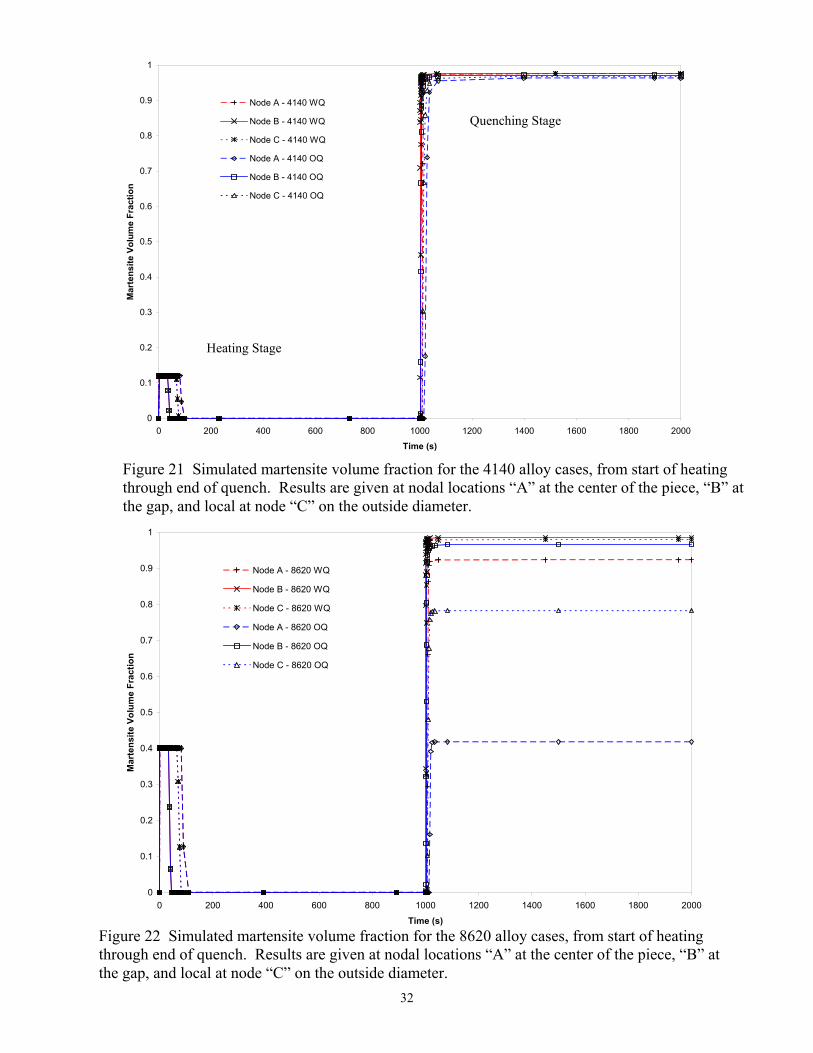
The x-displacements at nodes B and C (consult Figure 12) are given for the four cases in Figure 18 for the heating and cooling processes. Note that there is plastic strain occurring during the heating process, and differences between alloys. The effective plastic strain for the entire process is given in Figure 19 for all cases; note that there is plastic strain during the heating process and not a great deal of difference between the two alloys. This means that the details of the heating process are needed if one is to have an accurate simulation and better agreement between simulations and the measurements since some plastic deformation has occurred during heating. The measured [45] and predicted dimensional changes were compared in a relative sense. Direct comparison between the measured and predicted dimensional changes show the simulated distortions to be substantially larger than the measurements. This is due to the lack of carburization in the simulations, but it is also due to a lack of detailed information about heating process. A relative comparison between the measurements and experiments were made by normalizing the dimensional changes with the largest observed dimensional change in the measurements, the gap dimension on the 8620WQ case. For the measurements, all x-dimensional changes are divided by the measured gap dimension change for the 8620WQ case. For the simulation results, all simulated x-dimensional changes are divided by the simulated gap dimension change for the 8620WQ case. These results are presented in terms of percentages in Table II and are plotted in Figure 20. The relative comparison between the dimensional changes agrees well for both alloys and cooling conditions. Note that the predicted dimensional change for the 4140WQ case, which cracked in the experiment, was over 100% of the 8620WQ. The lack of precise information necessary to replicate the experiments using simulation is disappointing for this test case, and more completely documented experimental results will be compared to simulation in future work. This certainly points out the need to measure carefully and document thoroughly any experiments undertaken by this project. The predicted microstructure development at the nodal positions A, B and C (shown in Figure 12) are compared for the four cases. The nodal locations are: “A” at the center of the piece, “B” at the gap, and local at node “C” on the outside diameter. The predicted martensite volume fraction for the 4140 alloy cases, from start of heating through end of quench are given in Figure 21. Note that the martensite formation is very high for both the oil and water quenched 4140 cases. In Figure 22, the martensite formation for the 8620 steel is very high for the water quenched case, but the oil quenched case shows much less martensite developed especially at nodal position A which cools the slowest. For the 8620 steel, bainite is the predominant other phase formed.
10
Conclusions and Future Work
The work presented here gives an overview of the problem of heat treatment stress and distortion and a review of literature surrounding it and software that has been developed to model it. Simulations were performed and are presented here to demonstrate the software available for predicting heat treatment stress and distortion. The software package DANTE was identified as one of the most advanced tools for solving heat treat distortion problems. It was acquired for testing. Example calculations using DANTE show it to have very advanced features, and its predictions were shown to agree in a relative sense with some previously made measurements of heat treatment distortion. Unfortunately, the documentation of such experiments in the literature is often incomplete as was the case here.
In the immediate future, the authors are developing a test piece casting to be produced at
a participating foundry to provide data on heat treatment distortions. The test casting is being designed through simulation and through consideration of past experiments reported in the literature. The authors are also asking foundries to participate by identifying heat treated castings that can benefit from being studied and analyzed as test cases during the project. CAD models, heat treatment process details and other data would be necessary to pursue studying a casting. Experimental measurement of temperatures and distortions during heat treatment, and (possibly) residual stresses, will be made in the future as part of both experiments on test piece castings, and on production case study castings, to validate and improve the software predictions.
Acknowledgments
This research was funded by the United States Department of Energy as part of the
Energy-Saving Melting and Revert Reduction Technology (E-SMARRT) research program under award number DE-FC36-04GO14230. It is also conducted under the auspices of the Steel Founders' Society of America, and through substantial in-kind support, guidance and interest from SFSA member foundries. Further, we would also like to thank MAGMA GmbH for their generous support through donation of software, time and information sharing. Any findings, opinions, and conclusions or recommendations expressed in this report are those of the authors and do not necessarily reflect the views of the Department of Energy.
References 1. A.J. Fletcher, Thermal Stress and Strain Generation in Heat Treatment, (Elsevier Science,
London, 1989). 2. J. Rohde, and A. Jeppsson, “Literature Review of Heat Treatment Simulations with Respect
to Phase Transformation, Residual Stresses and Distortion,” Scandinavian Journal of Metallurgy, 2000, 29(2), pp. 47-62.
3. J. Rohde, A. Thuvander and A. Melander, “Using Thermodynamic Information in Numerical
Simulation of Distortion Due to Heat Treatment”, Progress in Heat Treatment and Surface
11
Engineering, Proc. Of the 5th ASM Heat Treatment and Surface Engineering Conf., ASM International, 2000, pp. 21-29.
4. M. Avrami, “Kinetics of Phase Change”, J. Chem. Physics, 9, 1941, pp. 177-184. 5. D. Koistinen and R. Marburger, “A General Equation Prescribing the Extent of the
Austenite-Martensite Transformation in Pure Iron-Carbon Alloys and Plain Carbon Steels”, Acta Met., 7, 1959, pp. 50-60.
6. M. Hunkel, T. Luebben, F. Hoffmann, and P. Mayr, “Simulation of Transformation Behavior
of Steels During Quenching”, Progress in Heat Treatment and Surface Engineering, Proc. Of the 5th ASM Heat Treatment and Surface Engineering Conf., ASM International, 2000, pp. 43-53.
7. M.T. Lusk, “Martensitic Phase Transitions with Surface Effects”, Journal of Elasticity, 34,
1994, pp. 191-227. 8. Lusk, M.T., “Martensitic Phase Nucleation with Surface Effects”, Journal of the Mechanics
and Physics of Solids, 42, 1994, pp. 241-282. 9. Lusk, M.T., Krauss G. and H. Jou, “A Balance Principle Approach for Modeling Phase
Transformation Kinetics”, Journal de Physique IV, 8, 1995, pp. 279-284. 10. Lusk, M.T., “A Geometrically Nonlinear Theory of Stress-Assisted Martensite Kinetics”,
Journal of Elasticity, 44, 1996, pp. 271-284. 11. D.J. Bammann, V.C. Prantil, A.A. Kumar, J.F. Lanthrop, D.A. Mosher, M. Lusk, H.J. Jou, G.
Krauss, W.H. Elliott, “A Material Model for Low Carbon Steels Undergoing Phase Transformations”, Proceedings of the 2nd International Conference on Quenching and the Control of Distortion (eds. G. Totten, M. Howes, S. Sjostrom, and K. Funatani), 1996, pp. 367-376.
12. M.T. Lusk, and H. Jou, “On The Rule of Additivity in Phase Transformation Kinetics”,
Metallurgical and Material Transactions, 28A(2), 1997, pp. 287-291. 13. H. Jou, and M.T. Lusk, “Comparison of JMAK Kinetics with a Phase-Field Model for
Microstructural Evolution Driven by Substructure Energy”, Physical Review B, 55, 1997, pp. 8114-8121.
14. Y.K Lee, and M.T. Lusk, “Thermodynamic Prediction of the Eutectoid Transformation
Temperatures of Low-Alloy Steels”, Metallurgical and Materials Transactions A, 30, 1999, pp. 2325-2329.
15. M.T. Lusk, and Y.-K. Lee, “A Global Material Model for Simulating the Transformation
Kinetics of Low Alloy Steels”, Proceedings of the 7th International Seminar of the International IFHT, 1999, pp. 273-282.
12
16. M.T. Lusk, Y.-K. Lee, H.-J. Jou, W.E. Elliott and G.M. Ludtka, “An Internal State Variable
Model for the Low Temperature Tempering of Low Alloy Steels”, Journal of Shanghai Jiaotong University: Proceedings of the 1st International Conference on Thermal Process Modeling and Computer Simulation, 2000.
17. M.T. Lusk, M.T., W. Wang, X. Sun and Y.-K. Lee, “On the Role of Kinematics in
Constructing Predictive Models of Austenite Decomposition”, Austenite Formation and Decomposition, (Eds. E.B. Damm and M.J. Merwin), Minerals, Metals and Materials Society, Warrendale, PA 2003, pp. 311-332.
18. H. Alberg, Material Modelling for Simulation of Heat Treatment, Licentiate Thesis Lulea
University of Technology. 19. H. Alberg and D. Berglund, “Comparison of Plastic, Viscoplastic, and Creep Models when
Modelling Welding and Stress Relief Heat Treatment”, Computer Methods in Applied Mechanics and Engineering, 192, 2003, pp. 5189-5208.
20. D. Berglund, H. Alberg and H. Runnemalm, “Simulation of Welding and Stress Relief Heat
Treatment of an Aero Engine Component”, Finite Elements in Analysis and Design, 39, 2003, pp. 865-881.
21. D.J. Bammann, M.L. Chiesa and G.C. Johnson, “Modeling Large Deformation and Failure in
manufacturing Processes”, Proc. of the 19th International Congress of Theoretical and Applied Mechanics, Tatsumi et al. eds, Kyoto, Japan, 1996, pp. 359-376.
22. D.J. Bammann, V.C. Prantil and J.F. Lanthrop, “A Plasticity Model for Materials
Undergoing Phase Transformations”, NUMIFORM’95: The 5th Int. Conf.on Numerical Methods in Industrial Forming Processes, Ithaca N.Y., 1995, pp. 219-223.
23. D.J. Bammann and A.R. Ortega, “The Influence of the Bauschinger Effect and Yield
Definition on the Modeling of Welding Processes”, Welding and Advanced Solidification Processes-VI, Piwonka, Voller and Katgerman, eds., The Minerals, Metals & Materials Society, Warrendale, PA, 1993, pp. 543-551.
24. J.F. Lathrop, B-FIT – A Program to Analyze and Fit the BCJ Model Parameters to
Experimental Data: Tutorial and User’s Guide, Sandia Report, SAND97-8218, Dec. 1996 25. V.C. Prantil, M.L. Callabresi, G.S. Ramaswamy, J. F. Lathrop, G.S. Ramaswamy, M.T.
Lusk, “Simulating Distortion and Residual Stresses in Carburized Thin Strips”, ASME Journal of Engineering Materials and Technology, 125(2), 2003, pp. 116-124.
26. C.H. Guer and A.E. Tekkaya, “Numerical Investigation of Non-homogeneous Plastic
Deformation in Quenching Process”,Materials Science and Engineering A319-321, 2001, pp. 164-169.
13
27. J.W. Jang, I.W. Park, K.H. Kim and S.S. Kang, “FE Program for Predicting Thermal Deformation in Heat Treatment”, Journal of Materials Processing Technology 130-131, 2002, pp. 546-550.
28. R. Kuebler, S. Zhang, H. Mueller and D. Loehe, “Simulation of Stresses, Residual Stresses
and Distortion in Specimens of AISI 52100 During Gas Quenching”, Progress in Heat Treatment and Surface Engineering, Proc. Of the 5th ASM Heat Treatment and Surface Engineering Conf., ASM International, 2000, pp. 31-41.
29. C. Lui, X. Xu and Z, Liu, “A FEM Modeling of Quenching and Tempering and Its
Application in Industrial Engineering” Finite Elements in Analysis and Design, 39, 2003, pp. 1053-1070.
30. SYSWELD – A Predictive Model for Heat Treat Distortion, Southwest Research Institute,
1992. 31. Homepage of SYSWELD software available from ESI-Group, http://www.esi-
group.com/SimulationSoftware/Welding_heat_treatment/heat_html. 32. T. Inoue, D.Y. Ju, and K. Arimoto, “Metallo-Thermo-Mechanical Simulation of Quenching
Process – Theory and Implementation of the Computer Code HEARTS”, 1st International Conference on Quenching and Distortion Control, G.E. Totten Ed., ASM International, 1992, pp. 205-212.
33. K. Arimoto, G. Li, A. Arvind and W.T. Wu, “Development of Heat Treatment Simulation
System DEFORMTM-HT”, Proceedings of the 18th Conference on Heat Treating, R.A. Wallis and H. Walton Eds., ASM International, 1998, pp. 639-654.
34. J. Cho, W. Kang, M. Kim, J. Lee, Y. Lee and W. Bae “Distortions Induced by Heat
Treatment of Automotive Bevel Gears”, Journal of Materials Processing Technology 153-154, 2004, pp. 476-481.
35. Homepage of Scientific Forming Technologies Corporation (SFTC), develops and supports
the DEFORM software, http://www.deform.com/. 36. N. Jarvstrat and S. Sjostrom, "Current Status of TRAST; a Material Model Subroutine
System for the Calculation of Quench Stresses in Steel", Proceedings of ABAQUS User's Meeting, 1993, pp.273-287.
37. Homepage of LiTeRaTi, vendors of TRAST, http://www.algonet.se/~literat/steel.htm. 38. C. Mgbokwere and M. Callabresi, “Numerical Simulation of a Heat-Treated Ring Gear
Blank”, ASME Journal of Engineering Materials and Technology, 122, 2000, pp. 305-314.
14
39. B.L. Ferguson, A. Freborg, G. Petrus and M. Callabresi, “Predicting the Heat-treat Response of a Carburized Helical Gear”, Gear Technology, November, 2002, pp. 20-25.
40. B.L. Ferguson, Z. Li and A.M. Freborg, “Modeling Heat Treatment of Steel Parts”,
Computational Materials Science, 2005, 34(3), pp. 274-281. 41. Homepage of DANTETM on Deformation Control Technology’s website,
http://www.deformationcontrol.com/dante_slide.htm. 42. M. Weber, Simulation der Waermebehandlung eines niedriglegierten Stahlgussteils mit dem
Simulationsprrogramm MAGMASOFTTM, Diplomarbeit, Institut fuer Werkstoffkunde I, Universitaet Karlsruhe, 2003.
43. C.R. Brooks, Principles of the Heat Treatment of Plain Carbon and Low Alloy Steels, ASM
International, Materials Park, OH, 1996, pp. 87-126. 44. As cited in reference [43], L.J. Ebert, Met. Trans., Vol. 9A, 1978, p. 1537. 45. G.E. Totten, C.E. Bates, and N.A. Clinton, Handbook of Quenchants and Quenching
Technology, ASM International, Materials Park, OH, 1993, p. 489.
15
Table I Dimensional Changes in Gap and Diameter for Navy-C Ring [45]
Table II Comparison of measured [45] and predicted relative dimensional changes. These are determined with respect to the largest observed dimensional change, the gap dimension on the 8620WQ case.
SAE steel Quenchant Dimensional change, mm
Gap opening Outside diameter
4140 Petroleum oil (65 °C, or 150 °F) 0.04064 0.01524
Water (25 °C, or 80 °F)
Cracked
Cracked
8620 Petroleum oil (65 °C, or 150 °F) 0.01778 0.00508
Water (25 °C, or 80 °F) 0.04572 0.01778
SAE steel Quenchant Measured Dimensional Change, % Relative to
8620 WQ
Predicted Dimensional Change, % Relative to
8620 WQ Gap
opening Outside diameter
Gap opening
Outside diameter
4140 Petroleum oil (65 °C, or 150 °F) 89% 33% 75% 19%
Water (25 °C, or 80 °F)
Cracked
Cracked
102% 22%
8620 Petroleum oil (65 °C, or 150 °F) 39% 11% 50% 16%
Water (25 °C, or 80 °F) 100% 39% 100% 37%
16
Figure 1 Diagram of the three coupled parts to simulating heat treatment distortion (heat transfer analysis, phase transformations and mechanical response) and their important factors and outcomes (distortion, residual stress and microstructure) as given by Rohde and Jeppsson2.
Figure 2 Illustration of residual stress formation in quenching taken from Ebert [44].
a)
b)
c)
17
Figure 3 Results of ABAQUS coupled thermal-stress calculation for a steel cylinder (4 cm diameter x 20 cm long) cooled from 850 C to 25 C in air; stress field is shown on the left and temperature field on the right at four points in the process. Points “A” through “D” correspond roughly to the same points in the quenching process discussed and shown in Figure 2. Distorted geometry is scaled, and magnified 30x.
18
Figure 5 Variation in length for steel cooled at the surface and center as given in Figure 4 (taken from [43]). Points S1, S2, C1, and C2 correspond to those given in Figure 4.
Figure 4 Example cooling curves for the surface and center of a cooled steel cylinder overlaid on a schematic CCT diagram (taken from [43]). This steel forms pearlite at the center and martensite at the surface under these cooling conditions.
S1
C1
C2
S2
S1
C1 C2
S2
Ms
Mf
LC
LS
19
Figure 6 Results of ABAQUS with DANTE thermal-stress calculation for a steel cylinder (3 cm diameter x 8 cm long) immersed into an oil bath at 65 C over a period of 5 seconds. The steel is AISI 5120, and the cylinder was removed from furnace at 900 C. Longitudinal stresses are shown on the left hand side and temperatures on the right hand side. Figure 7 shows the continuation of the quenching process following this immersion. Deformation is 30 x.
Immersion direction
Immersion direction
Immersion direction
Immersion direction
20
Figure 7 Results of ABAQUS with DANTE thermal-stress calculation for a AISI 5120 steel cylinder (3 cm diameter x 8 cm long) after immersion into an oil bath at 65 C over a period of 30 seconds. Longitudinal stresses are shown on the left hand side and temperatures on the right hand side. Deformation is 30 x.
21
Figure 8 Results of martensite fraction formation from ABAQUS with DANTE calculation for a AISI 5120 steel cylinder (3 cm diameter x 8 cm long) after immersion into an oil bath at 65 C. Martensite in the carburized surface region forms starting between 30 and 42 seconds. Martensite start temperature is lower in the regions with higher carbon content (at the surface) than the martensite previously formed at higher temperatures in less carburized regions. This highly martensitic region at the surface alters the stress field after martensite formation resulting in compressive stresses at the surface.
22
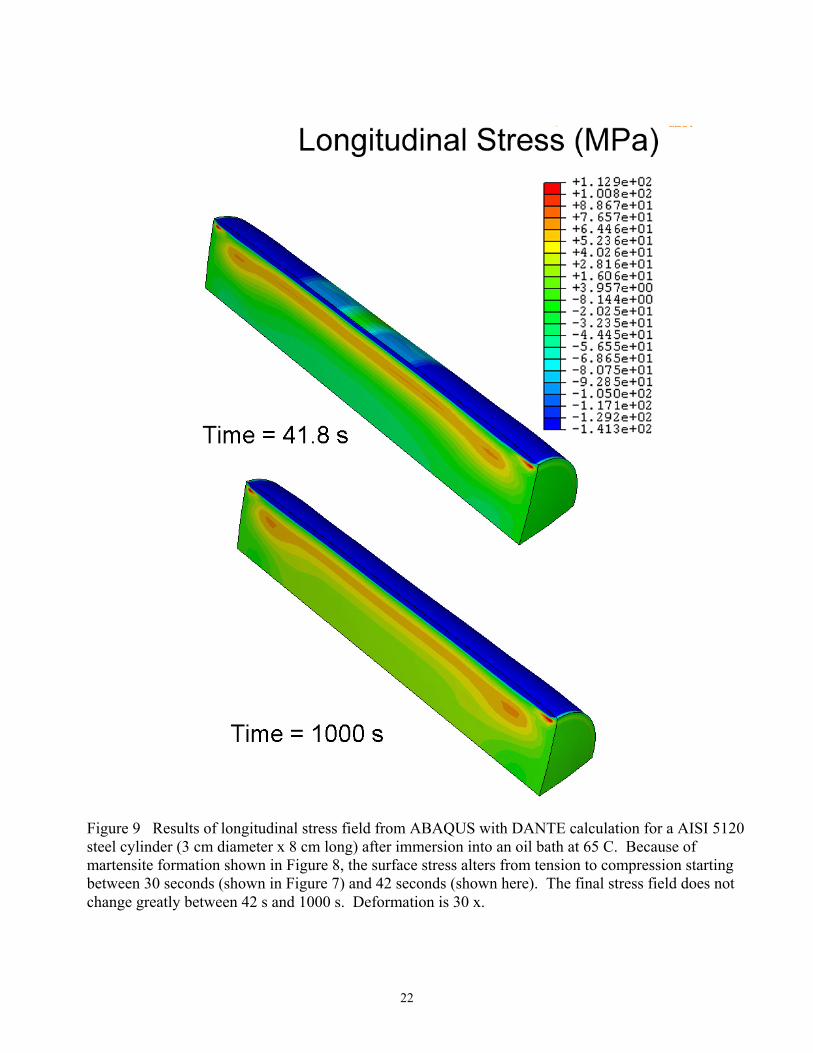
Figure 9 Results of longitudinal stress field from ABAQUS with DANTE calculation for a AISI 5120 steel cylinder (3 cm diameter x 8 cm long) after immersion into an oil bath at 65 C. Because of martensite formation shown in Figure 8, the surface stress alters from tension to compression starting between 30 seconds (shown in Figure 7) and 42 seconds (shown here). The final stress field does not change greatly between 42 s and 1000 s. Deformation is 30 x.
23
Figure 10 Final microstructural fields from ABAQUS with DANTE calculation for a AISI 5120 steel cylinder (3 cm diameter x 8 cm long) after immersion into an oil bath at 65 C for 1000 s. Volume fraction of martensite, ferrite and bainite are shown.
24
Figure 11 Drawing of Navy-C ring test piece for quench distortion experiments reported by Totten et al. [45].
Figure 12 Finite element model used to simulated the Navy-C ring shown in Figure 11.
25
0
2000
4000
6000
8000
10000
12000
0 200 400 600 800 1000 1200
Hot Surface Temperature (C)
Hea
t Tra
nsfe
r Coe
ffici
ent (
W/m
2 C)
Hot AirAir CooledFurnaceOil QuenchImmersion in Water
Figure 13 Heat transfer coefficient as a function of surface temperature for several heating and cooling conditions.
26
Figure 14 Simulated dimensional displacement in the x-direction for the 4140OQ case. Results are given at start, end of heating to 900 C, 1 s into quench, 2 s into quench, and final quenched condition. Distorted geometry is magnified 30 times.
X-direction
27
Figure 15 Simulated dimensional displacement in the x-direction for the 4140WQ case. Results are given at start, end of heating to 900 C, 1 s into quench, 2 s into quench, and final quenched condition. Distorted geometry is magnified 30 times.
X-direction
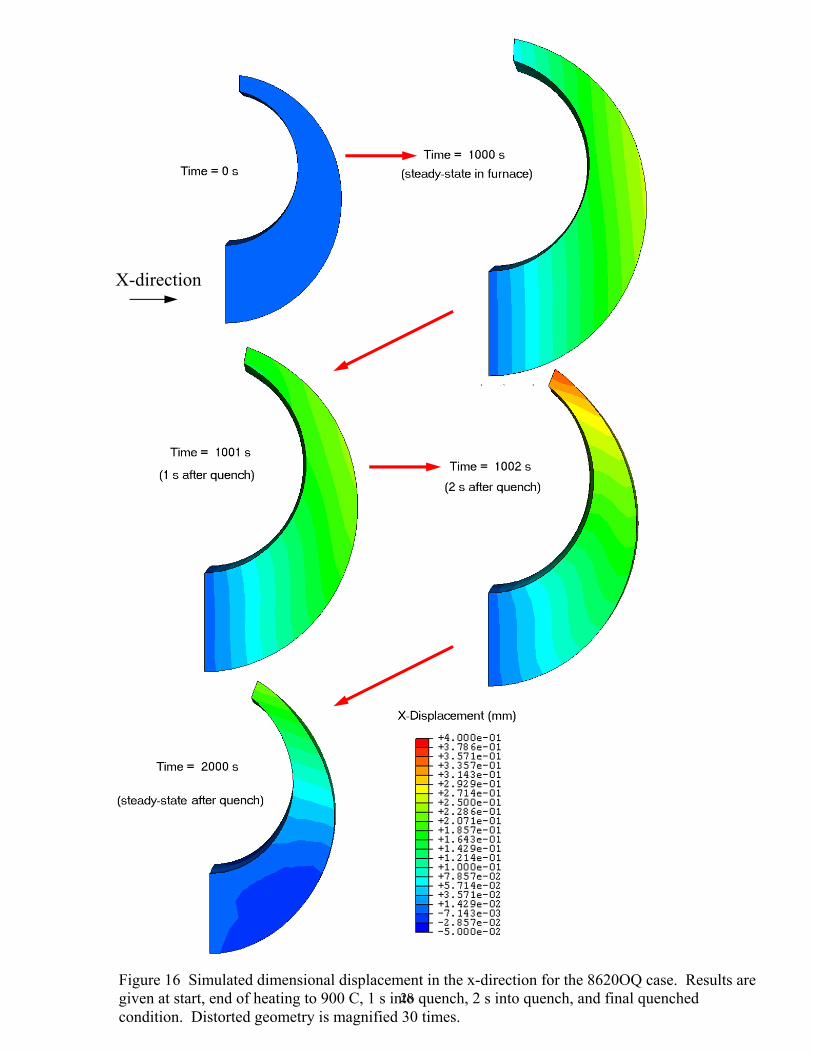
28Figure 16 Simulated dimensional displacement in the x-direction for the 8620OQ case. Results are given at start, end of heating to 900 C, 1 s into quench, 2 s into quench, and final quenched condition. Distorted geometry is magnified 30 times.
X-direction
29
Figure 17 Simulated dimensional displacement in the x-direction for the 8620WQ case. Results are given at start, end of heating to 900 C, 1 s into quench, 2 s into quench, and final quenched condition. Distorted geometry is magnified 30 times.
X-direction
30
-0.1
0
0.1
0.2
0.3
0.4
0.5
0 200 400 600 800 1000 1200 1400 1600 1800 2000
Time (s)
X-D
ispl
acem
ent (
mm
)
Node B - 4140 WQNode C - 4140 WQNode B - 4140 OQNode C - 4140 OQNode B - 8620 WQNode C - 8620 WQNode B - 8620 OQNode C - 8620 OQ
0
0.002
0.004
0.006
0.008
0.01
0.012
0 200 400 600 800 1000 1200 1400 1600 1800 2000
Time (s)
Effe
ctiv
e Pl
astic
Str
ain
(mm
/mm
)
Node B - 4140 WQ
Node C - 4140 WQ
Node B - 4140 OQ
Node C - 4140 OQ
Node B - 8620 WQ
Node C - 8620 WQ
Node B - 8620 OQ
Node C - 8620 OQ
Figure 18 Simulated dimensional displacement in the x-direction for all cases from start of heating through end of quench. Results are given at nodal locations “B” at the gap, and local at node “C” on the outside diameter.
Figure 19 Effective plastic strain for all cases from start of heating through end of quench. Results are given at nodal locations “B” at the gap, and local at node “C” on the outside diameter.
Heating Stage
Quenching Stage
Heating Stage
Quenching Stage
31
Figure 20 Comparison of the relative measured and predicted dimensional changes. These are determined with respect to the largest observed dimensional change, the gap dimension on the 8620WQ case.
0%
10%
20%
30%
40%
50%
60%
70%
80%
90%
100%
0% 10% 20% 30% 40% 50% 60% 70% 80% 90% 100%
Measured Dimensional Change Relative to 8620WQ Gap Dimension (%)
Pred
icte
d D
imen
sion
al C
hang
e R
elat
ive
to 8
620W
Q G
ap D
imen
sion
(%)
Line of perfect correspondence
32
0
0.1
0.2
0.3
0.4
0.5
0.6
0.7
0.8
0.9
1
0 200 400 600 800 1000 1200 1400 1600 1800 2000
Time (s)
Mar
tens
ite V
olum
e Fr
actio
n
Node A - 4140 WQ
Node B - 4140 WQ
Node C - 4140 WQ
Node A - 4140 OQ
Node B - 4140 OQ
Node C - 4140 OQ
0
0.1
0.2
0.3
0.4
0.5
0.6
0.7
0.8
0.9
1
0 200 400 600 800 1000 1200 1400 1600 1800 2000
Time (s)
Mar
tens
ite V
olum
e Fr
actio
n
Node A - 8620 WQ
Node B - 8620 WQ
Node C - 8620 WQ
Node A - 8620 OQ
Node B - 8620 OQ
Node C - 8620 OQ
Figure 21 Simulated martensite volume fraction for the 4140 alloy cases, from start of heating through end of quench. Results are given at nodal locations “A” at the center of the piece, “B” at the gap, and local at node “C” on the outside diameter.
Figure 22 Simulated martensite volume fraction for the 8620 alloy cases, from start of heating through end of quench. Results are given at nodal locations “A” at the center of the piece, “B” at the gap, and local at node “C” on the outside diameter.
Heating Stage
Quenching Stage


