![Benchmarks - June, 2013 | Benchmarks Onlineit.unt.edu/sites/default/files/benchmarks-06-2013.pdf · Benchmarks - June, 2013 | Benchmarks Online 4/26/16, 8:52:25 AM] Skip to content](https://static.fdocuments.us/doc/165x107/5f9d6dd4a6e586755376b37d/benchmarks-june-2013-benchmarks-benchmarks-june-2013-benchmarks-online.jpg)
2004-2006 PERFORMANCE BENCHMARKS FOR NATURAL GAS UTILITIES - aga · PDF fileEA 2008-1 March 7,...
49
Copyright © 2008 by the American Gas Association. All rights reserved. EA 2008-1 March 7, 2008 2004-2006 PERFORMANCE BENCHMARKS FOR NATURAL GAS UTILITIES I. INTRODUCTION Summary data of gas utility financial profiles and performance appear in this Energy Analysis. The intent is to provide industry participants and observers with relative measures of financial returns and operational efficiencies of natural gas distribution companies. For this study, the American Gas Association (AGA) collected data from its members. The data source for these benchmarking metrics is the Uniform Statistical Report (USR), which is administered annually by AGA on behalf of its member companies. Results are presented for the years 2004 through 2006. Additional information, some of which is company specific, is included in an attachment to this analysis and available only to AGA member companies. For study purposes, the gas utility industry is segmented into distinct groups: investor- owned gas-only utilities, investor-owned combination gas and electric utilities, and municipally- owned gas utilities. Summary results are segmented in this sample accordingly. Comprehensive details are provided in the appendices. II. BACKGROUND THE NATURAL GAS DISTRIBUTION INDUSTRY. Approximately 1,400 utilities distribute natural gas to end-use consumers in the United States For this analysis, a total of 65 utilities were examined for 2006, 73 companies were studied for 2005, and 77 firms were included in the 2004 sample. 1 They are located across the United States, and each company has a unique combination of scale, load profile, and climatic attributes. In aggregate, the firms included in this study accounted for 38 percent of the natural gas consumed in 2006, 37 percent in 2005, and 35 percent in 2004. 2 Given this sample size, any inferences about the sample’s depiction of the entire industry are accordingly limited. Many AGA member companies are gas-only, investor-owned utilities, as are most companies in this analysis. These companies earn returns that accrue to their investors. State- level public utility commissions regulate their operations, finance, and capital investment activities. 1 This set number was determined after eliminating member companies for whom data was either incomplete or not provided. Firms with zero net income are excluded from the analysis. This is not a scientific sample in that sample stratification by segment type does not reflect population stratification. See Appendix 9 for list of companies included. 2 Natural gas distributed for end-use consumption totaled 19.9 Tcf in 2006, 20.4 Tcf in 2005, and 20.6 Tcf in 2004. U.S. Department of Energy / Energy Information Administration, Natural Gas Monthly.
Transcript of 2004-2006 PERFORMANCE BENCHMARKS FOR NATURAL GAS UTILITIES - aga · PDF fileEA 2008-1 March 7,...

Copyright © 2008 by the American Gas Association. All rights reserved.
EA 2008-1 March 7, 2008
22000044--22000066 PPEERRFFOORRMMAANNCCEE BBEENNCCHHMMAARRKKSS
FFOORR NNAATTUURRAALL GGAASS UUTTIILLIITTIIEESS
I. INTRODUCTION
Summary data of gas utility financial profiles and performance appear in this Energy Analysis. The intent is to provide industry participants and observers with relative measures of financial returns and operational efficiencies of natural gas distribution companies. For this study, the American Gas Association (AGA) collected data from its members. The data source for these benchmarking metrics is the Uniform Statistical Report (USR), which is administered annually by AGA on behalf of its member companies. Results are presented for the years 2004 through 2006. Additional information, some of which is company specific, is included in an attachment to this analysis and available only to AGA member companies.
For study purposes, the gas utility industry is segmented into distinct groups: investor-owned gas-only utilities, investor-owned combination gas and electric utilities, and municipally-owned gas utilities. Summary results are segmented in this sample accordingly. Comprehensive details are provided in the appendices. II. BACKGROUND THE NATURAL GAS DISTRIBUTION INDUSTRY. Approximately 1,400 utilities distribute natural gas to end-use consumers in the United States For this analysis, a total of 65 utilities were examined for 2006, 73 companies were studied for 2005, and 77 firms were included in the 2004 sample.1 They are located across the United States, and each company has a unique combination of scale, load profile, and climatic attributes. In aggregate, the firms included in this study accounted for 38 percent of the natural gas consumed in 2006, 37 percent in 2005, and 35 percent in 2004.2 Given this sample size, any inferences about the sample’s depiction of the entire industry are accordingly limited.
Many AGA member companies are gas-only, investor-owned utilities, as are most companies in this analysis. These companies earn returns that accrue to their investors. State-level public utility commissions regulate their operations, finance, and capital investment activities. 1 This set number was determined after eliminating member companies for whom data was either incomplete or not provided. Firms with zero net income are excluded from the analysis. This is not a scientific sample in that sample stratification by segment type does not reflect population stratification. See Appendix 9 for list of companies included. 2 Natural gas distributed for end-use consumption totaled 19.9 Tcf in 2006, 20.4 Tcf in 2005, and 20.6 Tcf in 2004. U.S. Department of Energy / Energy Information Administration, Natural Gas Monthly.
2
Combination utilities have the franchise rights to transport and sell both gas and electric
power commodities. These are also investor-owned firms with financial obligations to shareholders. Like the gas-only investor-owned firms, these companies are subject to various state and federal regulations.
Municipal utilities are publicly owned by the citizens of the jurisdictions that the utilities serve. Local governments enjoy tax-free bond-issuing capabilities, usually at interest rates lower than can be obtained by investor-owned utilities. Ultimately, such debt is usually collateralized by these utilities’ abilities to secure tax revenue to back up debt commitments. What an investor-owned utility would pay out in dividends accrues instead to the municipal company’s citizen-shareholders in the form of lower rates. Municipal utility regulation is performed primarily by local governments as opposed to state-level commissions.3 DESCRIPTION OF DATA SOURCES. Financial data about AGA member companies are drawn from the Uniform Statistical Report (USR). Member company staff prepares these standardized forms annually for collection by AGA, but companies may choose to withhold any or all of the requested data. Some of the USR duplicates the information found in audited end-of-year financial statements, but the USR requests additional information, such as heating degree-day profiles, type of sales by customer class, number of customers served, and various employment profile statistics. Data for miles of mains came from the U.S. Department of Transportation, Office of Pipeline Safety. DATA LIMITATIONS. Since the data used for this analysis are annual figures only, a few inferential limitations should be noted. First, a single year’s data for gas distribution operations are influenced by weather patterns for that year. For the United States as a whole, 2006 was 11.6 percent warmer than normal, 2005 was 4.9 percent warmer than normal, and 2004 was 6.3 percent warmer than normal.4 The deviation between actual heating degree days (HDDs) versus historic normals will vary by location. This in turn suggests that utility benchmarks may slightly overstate or understate overall utility financial performance or efficiency of operations when impacted by weather. Another limitation is that the ability to perform trend analysis is somewhat limited. While three years’ worth of data are presented here, comparison of actual values (total revenues for example) from year to year can be distorted by changes in sample size. Also, variances in weather can affect these trends. Finally, the data set covers only three years and this limits the ability to compare longer-term trends. Sample size and composition must also be considered as a potential limitation. The industry segment sample sizes used in this study are not consistently proportional to their respective populations. Additionally, the sample size—measured both in number of companies, and more importantly as percentage of total gas deliveries—has varied over time. Finally, specific company participation in the data collection changes from year to year. This makes annual comparisons of absolute values, such as total number of therms sold, difficult and any resulting conclusions suspect. However, the purpose of ratio analysis is to address this problem and facilitate annual comparisons.
One final consideration is the increased prevalence of transportation services to gas utilities. Transportation customers represent about five percent of total customers, yet these
3 Note that relatively few financial profiles were available for the municipal segment. The operations data used here considers only gas activities. The financial profiles of gas-only and combination municipal utilities are blended together for summary purposes. 4 Source: AGA Gas Facts, Table 6-16.

3
customers account for more than one-third of total gas delivered. A growing percentage of transportation volumes impacts metrics based on total gas revenue. III. BENCHMARKING METRICS
Benchmarking metrics created for this study take several forms. Typical accounting ratios, based on income statements and balance sheets, serve as financial performance indicators. Financial statements are also recast in same-size formats, which present line items in percentage terms. Other benchmarks describe numbers of employees, meters, and volumes of gas throughput. All AGA data are summarized so that no individual company statistics are revealed. Additionally, summaries are created which divide the industry into type-of-company segments. These include gas utilities, combination gas and electric utilities, and municipally owned gas utilities.5 Appendix 2 is a series of charts that display the range of observations for selected benchmarking metrics. Appendix 9 shows the list of companies that were included in this analysis.
Utility Operating Profiles - Absolute Values (Section IV-A and Appendix 3a). System
profiles are summarized here by type of company. This data includes information on gas volumes delivered as well as the number of customers by class.
Financial Statements - Absolute Values (Section IV-B and Appendix 3b). Income statement and balance sheet data are summarized here by type of company.6 Income statement amounts are expressed in absolute dollars in Appendix 3b. Note that these items represent gas operations only.
Financial Statements - Same-Size Analysis (Appendix 3c). The financial statement data
shown in absolute values are re-cast in percentage terms for a same-size analysis. Income statement line items are in percentages relative to operating revenue while balance sheet items are expressed as a percentage of total assets. This shows the disposition of a firm’s revenue and composition of its asset base without respect to the size of an individual firm.
Financial Statements - Per Cost Driver (Section IV-B and Appendix 3d). Income
statements are shown in several formats: per therm delivered, per customer served, per dollar value of gas plant in service, and per mile of main in operation.
Financial Ratios (Section IV-D and Appendix 3e). These are conventional financial
analysis tools, and they compare a company’s financial status to other firms or types of firms. Ratios are calculated from group totals or weighted averages (explanations are provided in the Glossary, Appendix 1).
O&M Detail Analysis (Section IV-C and Appendix 4). These cost elements represent
major gas delivery activities, starting with purchase or production and continuing sequentially through transmission, distribution, customer service, sales activities, and administrative and general (A&G) accounting. These results are also arrayed by type of company. Benchmarks for these data are created by expressing each line item on a basis of annual costs per therm delivered. See Table 3 for more detail.
5 See Glossary in Appendix 1 for a definition of these categories. 6 Appendix 3a financial statements are in thousands of dollars.

4
Debt Analysis - Ratios (Section IV-E). Data are presented to highlight various measures of debt. These include debt as a percent of capitalization and interest coverage ratios. The data in this section necessarily include both gas and electric operations.
Wages and benefits: Ratios and Same-Size Analysis (Section IV-G and Appendix 5). Data about utility employment and benefits profiles are included. These measures are intended to illustrate the norms for staffing levels and expenses as they vary by type of firm. Benchmark measures include:
Total salaries and wages per employee Total benefits and pensions per employee Ratio of total benefits to total compensation Annual therm throughput per employee Average annual customers served per employee
Profitability (Section IV-F and Appendix 6). Profitability is expressed here in terms of
return on assets (ROA) as well as return on common equity. Since ROA measures the returns attributable to operations (prior to finance costs), ROA in used to describe the relative economic efficiency of natural gas distribution by industry segment. This section will examine selected cost drivers-- numbers of therms sold, of customers served, dollars of gas plant utilized, and miles of pipe in service-- to evaluate each in terms of its impact on ROA. Additionally, return on equity indicates the rate of return that a firm earns on its equity base. See Table 6 for more detail.
IV. BENCHMARK DISCUSSION IV-A. OVERVIEW
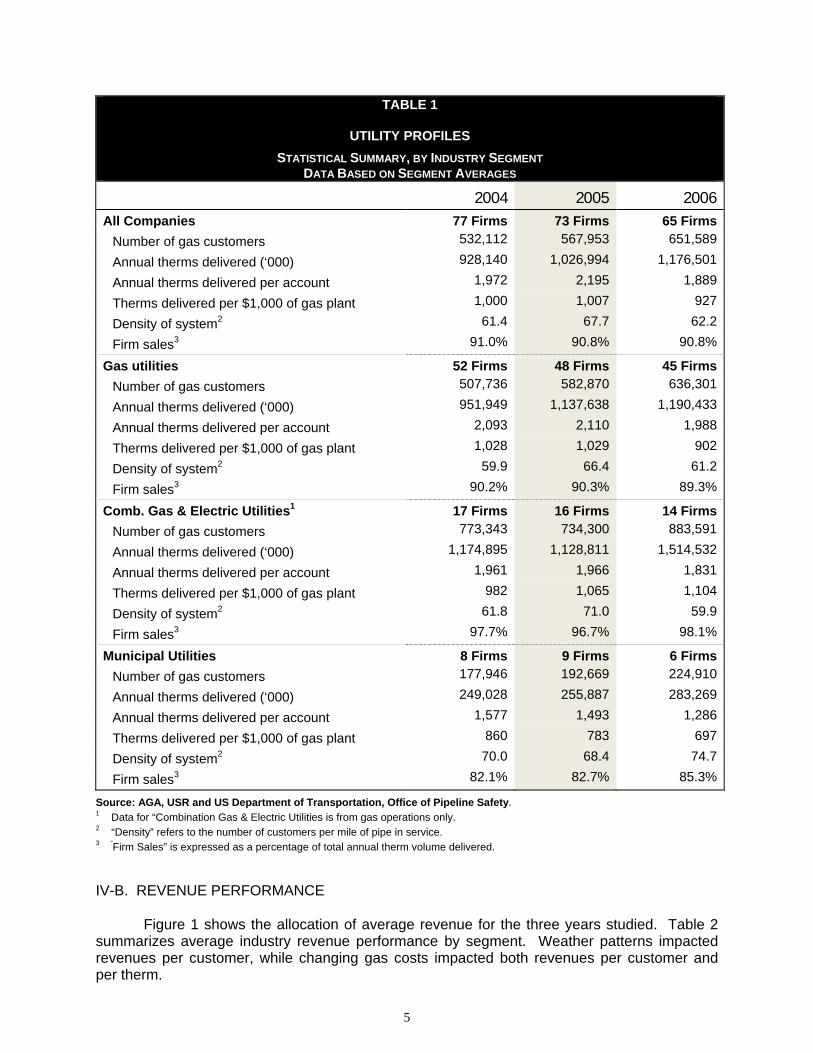
Benchmark summaries are presented here in order of accounting process: revenues are discussed first, followed by O&M costs, operating income, debt management, capitalized income values, and profitability. Finally, wage and benefit profiles are discussed. Table 1 summarizes the scope and scale of the companies studied. It is important to emphasize that the following data are meant to illustrate the typical company studied in this sample and absolute values should not be extrapolated to the industry as a whole. This is especially true of the average number of customers.
5
TABLE 1
UTILITY PROFILES
STATISTICAL SUMMARY, BY INDUSTRY SEGMENT DATA BASED ON SEGMENT AVERAGES
2004 2005 2006 All Companies 77 Firms 73 Firms 65 Firms
Number of gas customers 532,112 567,953 651,589
Annual therms delivered (‘000) 928,140 1,026,994 1,176,501
Annual therms delivered per account 1,972 2,195 1,889
Therms delivered per $1,000 of gas plant 1,000 1,007 927
Density of system2 61.4 67.7 62.2
Firm sales3 91.0% 90.8% 90.8%
Gas utilities 52 Firms 48 Firms 45 FirmsNumber of gas customers 507,736 582,870 636,301
Annual therms delivered (‘000) 951,949 1,137,638 1,190,433
Annual therms delivered per account 2,093 2,110 1,988
Therms delivered per $1,000 of gas plant 1,028 1,029 902
Density of system2 59.9 66.4 61.2
Firm sales3 90.2% 90.3% 89.3%
Comb. Gas & Electric Utilities1 17 Firms 16 Firms 14 FirmsNumber of gas customers 773,343 734,300 883,591
Annual therms delivered (‘000) 1,174,895 1,128,811 1,514,532
Annual therms delivered per account 1,961 1,966 1,831
Therms delivered per $1,000 of gas plant 982 1,065 1,104
Density of system2 61.8 71.0 59.9
Firm sales3 97.7% 96.7% 98.1%
Municipal Utilities 8 Firms 9 Firms 6 FirmsNumber of gas customers 177,946 192,669 224,910
Annual therms delivered (‘000) 249,028 255,887 283,269
Annual therms delivered per account 1,577 1,493 1,286
Therms delivered per $1,000 of gas plant 860 783 697
Density of system2 70.0 68.4 74.7
Firm sales3 82.1% 82.7% 85.3%
Source: AGA, USR and US Department of Transportation, Office of Pipeline Safety. 1 Data for “Combination Gas & Electric Utilities is from gas operations only. 2 “Density” refers to the number of customers per mile of pipe in service. 3 “Firm Sales” is expressed as a percentage of total annual therm volume delivered. IV-B. REVENUE PERFORMANCE
Figure 1 shows the allocation of average revenue for the three years studied. Table 2 summarizes average industry revenue performance by segment. Weather patterns impacted revenues per customer, while changing gas costs impacted both revenues per customer and per therm.

6
TABLE 2
UTILITY REVENUE PERFORMANCE
Annual Average Values per Group Data Based on Segment Averages
2004 2005 2006
All Companies Operating revenue (‘000) $638,983 $783,387 $875,061
Per customer $1,359 $1,552 $1,535
Per therm $0.7773 $0.8835 $0.9203
Gross sales margin (Rev. less Pur. Gas, ‘000) $227,205 $256,376 $295,334
Per customer $471 $498 $493
Per therm $0.285 $0.284 $0.312
Collection period (days) 35.5 42.9 34.2
Gas Utilities
Operating revenue (‘000) $621,463 $812,184 $861,251
Per customer $1,394 $1,569 $1,560
Per therm $0.7709 $0.8479 $0.8925
Gross sales margin (Rev. less Pur. Gas, ‘000) $221,664 $266,512 $292,027
Per customer $498 $512 $515
Per therm $0.295 $0.271 $0.319
Collection period (days) 37.1 47.2 36.3
Comb. Gas & Electric Utilities1
Operating revenue (‘000) $876,997 $973,261 $1,149,842
Per customer $1,218 $1,441 $1,492
Per therm $0.7254 $0.8560 $0.9173
Gross sales margin (Rev. less Pur. Gas, ‘000) $311,107 $320,644 $388,364
Per customer $418 $465 $470
Per therm $0.259 $0.294 $0.290
Collection period (days) 28.6 31.8 27.8
Municipal Utilities
Operating revenue (‘000) $247,085 $292,250 $337,475
Per customer $1,430 $1,661 $1,453
Per therm $0.9290 $1.1216 $1.1365
Gross sales margin (Rev. less Pur. Gas, ‘000) $84,926 $88,059 $103,063
Per customer $411 $473 $381
Per therm $0.276 $0.333 $0.303
Collection period (days) 40.4 39.7 33.5
Source: AGA 1 Figures for gas operations only.

7
FIGURE 1
IV-C. O&M ANALYSIS Operations and maintenance (O&M) expenses are those costs specifically attributable to current-year gas distribution activity. These are cost items that are incurred within an annual time period (as opposed to costs amortized over a period of years as is the case with finance costs and depreciation). A presentation of O&M costs on a per-therm basis will facilitate a comparison of cost efficiencies attained by the various industry segments. Table 3 shows average O&M expense detail for the years studied for the combination and gas utility segments.
Other Operating Expense
23%
Maintenance Expense
2%
Depreciation5%
Taxes5%
Operating income7%
Purchased Gas Expense
58%
DISPOSITION OF REVENUES
All Utilities (Three Year Average)

8
FIGURE 2
Source: AGA, USR.
0.00
0.20
0.40
0.60
0.80
1.00
1.20
1.40
2004
2005
2006
2004
2005
2006
2004
2005
2006
2004
2005
2006
$/The
rm
Average Utility Revenues Per ThermGross Sales Margin Gas Acquisition Cost
Gas UtilitiesAll FirmsCombination
UtilitiesMunicipalUtilities

9
TABLE 3
UTILITY O&M DETAIL ANALYSIS GAS UTILITIES COMBO UTILITIES1 2004 2005 2006 2004 2005 2006
VALUES PER THERM Gas-only revenues $0.7709 $0.8479 $0.8925 $0.7254 $0.8560 $0.9173Purchased-gas expense $0.4032 $0.4567 $0.4771 $0.4636 $0.6176 $0.5576 Gross sales margin $0.2953 $0.2710 $0.3194 $0.2587 $0.2941 $0.2903 Total production costs2 $0.4755 $0.5465 $0.5730 $0.4667 $0.6061 $0.6271Storage & LNG 0.0044 0.0060 0.0059 0.0014 0.0019 0.0016Transmission 0.0054 0.0083 0.0089 0.0077 0.0105 0.0054Distribution 0.0417 0.0352 0.0437 0.0341 0.0409 0.0374Customer accounts 0.0271 0.0263 0.0309 0.0248 0.0270 0.0271Customer svc. & info. 0.0017 0.0022 0.0039 0.0074 0.0070 0.0092Sales 0.0030 0.0024 0.0030 0.0025 0.0031 0.0031Admin. & general 0.0582 0.0536 0.0624 0.0435 0.0541 0.0458Total O&M $0.6005 $0.6913 $0.7316 $0.5879 $0.7507 $0.7567
SAME-SIZE ANALYSIS Gas-only revenues 100.0% 100.0% 100.0% 100.0% 100.0% 100.0%Purchased-gas expense 52.3% 53.9% 53.5% 63.9% 72.2% 60.8%Gross sales margin 38.3% 32.0% 35.8% 35.7% 34.4% 31.6% Total production costs2 61.7% 64.4% 64.2% 64.3% 70.8% 68.4%Storage & LNG 0.6% 0.7% 0.7% 0.2% 0.2% 0.2%Transmission 0.7% 1.0% 1.0% 1.1% 1.2% 0.6%Distribution 5.4% 4.2% 4.9% 4.7% 4.8% 4.1%Customer accounts 3.5% 3.1% 3.5% 3.4% 3.2% 3.0%Customer svc. & info. 0.2% 0.3% 0.4% 1.0% 0.8% 1.0%Sales 0.4% 0.3% 0.3% 0.3% 0.4% 0.3%Admin. & general 7.5% 6.3% 7.0% 6.0% 6.3% 5.0%Total O&M 77.9% 81.5% 82.0% 81.1% 87.7% 82.5%
Source: AGA, USR. 1 Figures for gas operations only. 2 Purchased-gas expense is subsumed within total production costs. NOTE: Figures do not sum precisely due to independent rounding.

10
IV-D. INCOME ANALYSIS Operating income, by accounting definition, represents revenues net of operations expenses. Operating income does not net out capital cost-related expenses such as interest and amortization. A summary of operating income, then, allows a comparison of efficiency in gas distribution. Figure 3 shows the dispersion of individual companies’ operating income per-therm. Table 4 shows average operating income results by type of firm.
FIGURE 3
Source: AGA, USR.
0.0%
5.0%
10.0%
15.0%
20.0%
25.0%
30.0%
35.0%
40.0%
Under $0.02
From $0.02 to $0.04
From $0.04 to $0.06
From $0.06 to $0.08
From $0.08 to $0.10
Over $0.10
Perc
ent o
f Firm
s
OPERATING INCOME PER THERM, All Firms
2004 2005 2006

11
TABLE 4
UTILITY INCOME STATEMENT HIGHLIGHTS
AVERAGE VALUES PER GROUP, GAS OPERATIONS ONLY GAS UTILITIES COMBO UTILITIES1 2004 2005 2006 2004 2005 2006
Operating revenue, $000 $621,463 $812,184 $861,251 $876,997 $973,261 $1,149,842 Total O&M, $000 $500,199 $667,524 $707,894 $712,188 $823,708 $953,324Operating income, $000 $44,728 $53,953 $57,926 $77,443 $54,804 $73,445
Percent of Revenue Total O&M 80.4% 81.5% 82.6% 81.2% 83.2% 82.5%Operating income 7.2% 7.4% 6.9% 8.8% 6.8% 7.0%
Per Therm Revenue $0.771 $0.848 $0.893 $0.725 $0.856 $0.917Total O&M 0.617 0.691 0.732 0.588 0.712 0.757Operating income 0.062 0.063 0.065 0.058 0.058 0.064
Per Customer Revenue $1,394 $1,569 $1,560 $1,218 $1,441 $1,492Total O&M 1,135 1,305 1,299 995 1,198 1,232Operating income 102 105 106 112 104 106
Per Dollar of Gas Plant Revenue $0.665 $0.722 $0.683 $0.635 $0.732 $0.754Total O&M 0.550 0.607 0.575 0.524 0.611 0.623Operating income 0.043 0.044 0.042 0.043 0.051 0.053
Per Mile of Main2 Revenue $85,099 $109,015 $100,146 $76,882 $104,098 $88,404Total O&M 68,051 89,727 82,735 62,464 87,393 73,110Operating income 6,590 7,596 6,918 6,084 7,121 6,324
Source: AGA, USR. 1 Figures for gas operations only. 2 Miles of main only. IV-E. DEBT ANALYSIS Historically, utilities have operated in a regulated environment. Therefore, debt instruments and their management have been prominent items on the utilities’ financial agendas. Debt has traditionally represented a large share of utility capitalization. This is due to the historically regulated environment in which utilities have operated. The presence of regulatory oversight, from an investor’s perspective, suggests less risk, more stable cash flow, and generally better debt ratings and interest coverage from cash flow. Historically, this made the utility industries attractive to bond investors. As for utilities, the containment of interest and other debt-related carrying costs can have a decisive impact on the overall profitability of operations.
12
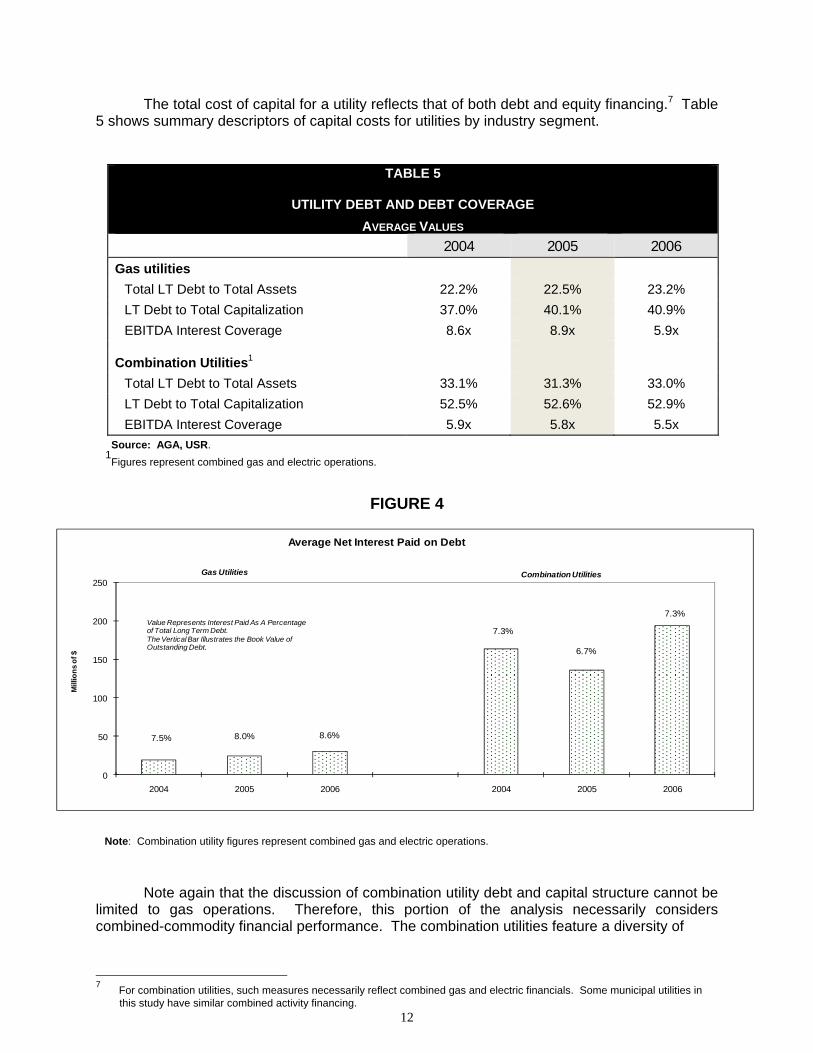
The total cost of capital for a utility reflects that of both debt and equity financing.7 Table 5 shows summary descriptors of capital costs for utilities by industry segment.
TABLE 5
UTILITY DEBT AND DEBT COVERAGE
AVERAGE VALUES 2004 2005 2006
Gas utilities Total LT Debt to Total Assets 22.2% 22.5% 23.2% LT Debt to Total Capitalization 37.0% 40.1% 40.9% EBITDA Interest Coverage 8.6x 8.9x 5.9x
Combination Utilities1 Total LT Debt to Total Assets 33.1% 31.3% 33.0% LT Debt to Total Capitalization 52.5% 52.6% 52.9% EBITDA Interest Coverage 5.9x 5.8x 5.5x
Source: AGA, USR. 1
Figures represent combined gas and electric operations.
FIGURE 4
Note: Combination utility figures represent combined gas and electric operations.
Note again that the discussion of combination utility debt and capital structure cannot be limited to gas operations. Therefore, this portion of the analysis necessarily considers combined-commodity financial performance. The combination utilities feature a diversity of
7 For combination utilities, such measures necessarily reflect combined gas and electric financials. Some municipal utilities in this study have similar combined activity financing.
7.5% 8.0% 8.6%
7.3%
6.7%
7.3%
0
50
100
150
200
250
2004 2005 2006 2004 2005 2006
Mill
ions
of $
Average Net Interest Paid on Debt
Gas Utilities Combination Utilities
Value Represents Interest Paid As A Percentage of Total Long Term Debt.The Vertical Bar Illustrates the Book Value of Outstanding Debt.
13
commodity sales and stabilized electric base-load operations attributable to base-load (i.e., not weather-driven) sales. IV-F. PROFITABILITY ANALYSIS
For this study, profitability is expressed in terms of return on assets (ROA), which relates
net income to the value of the asset base that generated that income. Stated differently, ROA measures how well a company’s assets “work” to generate income from operations. As such, ROA is convenient for comparing the operating results across companies within an industry. Figure 5 shows the dispersion of individual company ROA results. Table 6 shows profitability measures for both gas and combination utilities for the years studied.
FIGURE 5
1 When referring to combined gas and electric operations, the balance sheet items (i.e., total end-of-year assets) refer to the total firm, which could include non-utility assets, gas transmission assets and "other" utility assets (e.g., water), while income statement items (i.e., total revenues) refer to only gas and electric utility distribution operations combined. As a result, these ratios may differ from other reports that consolidate income statement items for the total firm.
0.0%
5.0%
10.0%
15.0%
20.0%
25.0%
30.0%
35.0%
40.0%
Under 2% From 2% to 3%
From 3%to 4%
From 4% to 5%
From 5% to 6% Over 6%
Perc
en
t o
f F
irm
s
Return on Assets
RETURN ON ASSETS, All Firms1
2004 2005 2006

14
While ROA is typically measured as the ratio of net income to assets, it can also be expressed as asset turnover multiplied by profit margin. Asset turnover measures a firm’s ability to generate sales from its fixed asset base. The second component of ROA is profit margin, or return on sales. This measures the operating profit per dollar of sales.
TABLE 6
UTILITY PROFITABILITY INDICATORS
AVERAGE VALUES
2004 2005 2006 Gas Utilities
Asset Turnover 0.71X 0.71X 0.73X Financial Leverage 61.5% 67.6% 65.1% Equity Multiplier 3.01x 3.50x 3.21x Profit Margin 6.2% 4.9% 4.6% ROA2 3.1% 2.4% 2.2% ROE2 8.3% 7.0% 5.9% Current Ratio 1.06 1.02 0.93 Current Assets/Total Assets 23.2% 26.6% 20.4%
Combination Utilities1 Asset Turnover 0.42X 0.46X 0.44X Financial Leverage 69.1% 70.3% 69.4% Equity Multiplier 3.71x 3.93x 3.51x Profit Margin 8.3% 5.1% 5.8% ROA2 3.3% 2.5% 2.4% ROE2 9.0% 9.1% 8.1% Current Ratio 1.34 1.22 1.11 Current Assets/Total Assets 12.9% 16.3% 11.8%
Source: AGA, USR. 1 Figures represent combined gas and electric operations. 2 When referring to combined gas and electric operations, the balance sheet items (i.e., total end-of-year assets) refer to the total firm, which could include non-utility assets, gas transmission assets and "other" utility assets (e.g., water), while income statement items (i.e., total revenues) refer to only gas and electric utility distribution operations combined. As a result, these ratios may differ from other reports that consolidate income statement items for the total firm.
Another measure of profitability is return on common equity (ROE). This differs from
ROA in that it takes into account the impact of a firm’s capital structure on its profitability. The capital structure of a firm can be examined in many different ways. ROE can be expressed as ROA multiplied by the equity multiplier. The equity multiplier (shown in Table 6) measures a firm’s assets relative to its common stock equity. An increase in a firm's level debt financing (an increase in liabilities) will cause a reduction in stockholders equity. This will cause the equity multiplier to rise and thereby increase total ROE. The rise in ROE compensates equity holders for the increased risk they must bear as the firm increases its level of debt.
15
IV-G. LABOR PRODUCTIVITY AND WAGE ANALYSIS
Current industry interest in restructuring, efficiency, and cost effectiveness often calls attention to staffing and wage profiles. Figure 6 and Table 7 summarize wage and benefit values by industry segment.
FIGURE 6
Source: AGA, USR.
0
100
200
300
400
500
600
700
800
900
2004 2005 2006 2004 2005 2006 2004 2005 2006 2004 2005 2006
Cus
tom
ers/
Empl
oyee
Average Customers per Gas Employee
Gas Utilities All FirmsCombination Utilities
MunicipalUtilities
16
TABLE 7
UTILITY WAGES AND BENEFITS
AVERAGE VALUES PER EMPLOYEE AT YEAR-END
2004
2005
2006 3-Year
Average All Firms
Number of employees at year-end 797 848 676 774Total salaries and wages $60,892 $62,854 $69,479 $64,408 Total benefits and pensions $15,969 $17,793 $19,481 $17,748 Total salaries, benefits, and pensions $76,861 $79,749 $88,960 $81,857 Ratio of total benefits to total compensation 21.1% 23.8% 23.2% 22.7%Therms sold per employee 1,222,241 1,254,449 1,246,786 1,241,159Customers per employee 622 627 676 642
Gas Utilities
Number of employees at year-end 785 843 903 844Total salaries and wages $60,774 $64,565 $68,764 $64,701 Total benefits and pensions $15,560 $16,830 $17,883 $16,758 Total salaries, benefits, and pensions $76,334 $80,022 $86,647 $81,001 Ratio of total benefits to total compensation 20.0% 23.2% 21.6% 21.6%Therms sold per employee 1,215,866 1,314,237 1,276,154 1,268,752Customers per employee 587 639 664 630
Combination Utilities1
Number of employees at year-end 995 1,099 1,241 1,112Total salaries and wages $64,524 $64,099 $66,324 $64,982 Total benefits and pensions $17,849 $22,642 $24,092 $21,528 Total salaries, benefits, and pensions $82,372 $86,742 $97,358 $88,824 Ratio of total benefits to total compensation 22.5% 24.5% 25.7% 24.2%Therms sold per employee 1,463,508 1,403,786 1,454,451 1,440,582Customers per employee 799 650 818 756
Municipal Utilities
Number of employees at year-end 459 457 481 466Total salaries and wages $54,362 $52,170 $66,681 $57,738 Total benefits and pensions $14,767 $15,281 $22,475 $17,508 Total salaries, benefits, and pensions $69,129 $67,450 $89,156 $75,245 Ratio of total benefits to total compensation 25.8% 26.5% 31.4% 27.9%Therms sold per employee 779,549 726,518 616,088 707,385Customers per employee 492 526 481 500
Source: AGA, USR. 1 Figures for gas operations only.
DISCLAIMER In issuing and making this publication available, AGA is not undertaking to render professional or other services for or on behalf of any person or entity. Nor is AGA undertaking to perform any duty owed by any person or entity to someone else. Anyone using this document should rely on his or her own independent judgment or, as appropriate, seek the advice of a competent professional in determining the exercise of reasonable care in any given circumstances. The statements in this publication are for general information and represent an unaudited compilation of statistical information that could contain coding or processing errors. AGA makes no warranties, express or implied, nor representations about the accuracy of the information in the publication or its appropriateness for any given purpose or situation.
Information on the topics covered by this publication may be available from other sources, which the user may wish to consult for additional views or information not covered by this publication.
AAPPPPEENNDDIIXX11:: GGLLOOSSSSAARRYY NNOOTTEE:: Immediately below some glossary items are references to the USR data field(s) which are the source for that item. The
specific field reference is in the format (x,y) where x is the schedule and y is the line item on that schedule. For example, [(6, 21) divided by (2,1 / 365)] refers to Schedule VI, 21 divided by the result of Schedule II, line 1 divided by 365.
Absolute values; absolute dollars These numbers show the sum of the actual reported data of those companies responding to the survey. Admin. and gen. expense (4,12) The overhead cost associated with office activities. Examples of such expenses include stationery, telephone service, office cleaning, heat and power, etc. Asset turnover (2,1)/(6,36) A ratio which expresses sales revenue as a percentage of assets on-hand over corresponding accounting periods (usually one year). This ratio can be interpreted as the relative degree to which a company's assets "work" to generate sales revenue. Assets (6,36) The total accounting value of a company's productive resources at a point in time (as on a balance sheet). Average salaries, benefits, & pensions per employee [(13,6)+(13,10)]/(13,2) Total compensation to employees (wages, benefits, etc.) divided by number of employees. Capitalization (6,51) The structure of a firm's long-term financing. "Capitalization" refers to the combination of debt and equity, which (in addition to retained earnings) is the monetary equivalent of the firm's assets. Collection period (days) (6,21)/ [(2,1)/365] An accounting measure that indicates the efficiency of revenue collections. This measure expresses an accounts receivable total in terms of the number of days of normal revenue collections that would be accumulated to make a sum equivalent to the accounts receivable balance. Combination gas and electric company A business entity that distributes both gas and electricity to customers within a franchise territory. Common equity (6,42) The total value of wealth given by investors to a company in return for ownership of shares (common stock) of that company's assets and retained earnings. Current ratio (6,29)/(6,61) Current assets divided by current liabilities. An indication of a company's ability to meet short-term debt obligations; the higher the ratio, the more liquid the company is. Customer An entity which enters into an account with a utility in order to receive natural gas for heating, power, feedstock, and other uses. For current purposes, an individual gas meter functionally represents each customer account. As such the terms "customer," "meter," and "account" are used interchangeably in this study. Customers per employee [20,15)+(20,18)]/(8,2) Total customers (including both sales and transportation) divided by total employees.
Customer accounts expense (4,9) The expense attributable to serving a customer. For utility operations, this includes metering, billing, and fixed charges incurred by customer hook-ups. Includes FERC System of Accounts 901 (Supervision), 902 (Meter reading expenses), 903 (Customer records and collection expenses), 904 (Uncollectable accounts), and 905 (Misc. customer accounts expenses). Customer accounts expense per therm (4,9)/[(20,15+20,18)] Customer accounts expense divided by total therms (including both sales and transportation volumes). Customer service and information (4,10) The expense attributable to all customer assistance and information operations. Bill remediation, bill inserts, and other communication with existing customers is included in this category. Includes FERC System of Accounts 907 (Supervision), 908 (Customer assistance expenses), 909 (Informational and instructional advertising expenses), and 910 (Misc. customer and informational expense). Customer service and information expense per therm (4,10)/[(20,15+20,18)] Customer service and information expense divided by total therms (including both sales and transportation volumes) Debt (6,50) + (6,54) + (6,61) The summed monetary value of a company's short- and long-term obligations to repay money that it has borrowed from lenders. Depreciation (2,4) The operating expense that, as an accounting mechanism, represents the predetermined annual write-down of a durable capital asset. Depreciation, as an accounting item, impacts net income and taxes. It is not a cash expenditure, but is an annual recognition of long-lived asset costs which are spread over the years that these assets are expected to be in operation. Distribution expense (4,8) The operating expense that represents the cost of moving natural gas from a utility's city gate to all the meters along the franchise's system of gas mains. Includes FERC System of Accounts 871 (Distribution load dispatching), 872 Compressor station labor and expenses), 873 (Compressor station fuel and power (Major only), 874 (Mains and service expenses), 875 (Measuring and regulating station expenses 0 General), 876 (Measuring and regulating station expenses – Industrial), 877 (Measuring and regulating station expenses – City Gate Check Stations), 878 (Meter and house regulator expenses), 879 (Customer Installation expenses), 880 (Other expenses), 881 ((Rents), 885 (Maintenance supervision and engineering), 886 (Maintenance of structure and improvements), 887 (Maintenance of mains), 888 (Maintenance of mains), 888 (Maintenance of compressor station equipment), 889 (Maintenance of measuring and regulating stations equipment – General 890 (Maintenance of measuring and regulating station equipment – Industrial), 891 (Maintenance of measuring and regulating station equipment – City Gate Check Stations), 892 (Maintenance of services), 893 (Maintenance of meters and house regulators), and 894 (Maintenance of other equipment). EBIT (2,18)+(2,8) A measure which describes, for an accounting period, the total company income net of operations expense, but not yet net of interest and tax expenses. This measure facilitates comparisons of companies' economic output after operations, capital depletion, and depreciation conventions. EBITDA (2,18)+(2,6)+(2,8) A measure which describes, for an accounting period, the total company income net of operations expense, but not yet net of interest, tax, depreciation, and amortization expenses. This measure facilitates comparisons of companies' economic output from operations. Equity multiplier (4,36)/(4,42) Total assets divided by total common stock equity. Used as a measure of corporate profitability.

Fuel (4,1) Includes FERC System of Accounts 501, 518 and 547. Field An element of database structure that holds the recorded values for a specific attribute of interest common to all observations. See also Uniform Statistical Report (USR). Financial leverage [(6,50)+(6,54) )+(6,61) )+(6,67)]/(6,36) Total debt divided by total assets. Measures the employment of funds obtained at a fixed cost. Firm, percent ((20,1+20,2+20,3+20,5+20,7+20,9)/20,15) Total sales volumes of gas sold under the firm tariff divided by total sales volumes. Gas plant (6,2) The undepreciated capital facilities directly related to gas distribution. See also "total plant in service." Gas plant per customer (6,2)/[(20,15)+(20,18)] Gas plant divided by total customers (including both sales and transportation). Gas plant per mile of main (6,2)/(26,10) Gas plant divided by total miles of mains (from U.S. Dept. of Transportation). Gas utility A franchised gas distribution company, the equity value of which is held by shareholders in the form of stock. The earnings of such a company are distributed wholly or in part to shareholders in the form of dividends. Any earnings not distributed are retained by the company on its balance sheet. General & administrative costs per therm (4,12)/[(20,15)+(20,18)] Expenses incurred by the utility not specifically assignable to operations or sales, such as overhead, general office, personnel, etc., divided by total customers (both sales and transportation). General & administrative costs per therm (4,12)/[(20,15)+(20,18)] Expenses incurred by the utility not specifically assignable to operations or sales, such as overhead, general office, personnel, etc., divided by total therms (both sales and transportation volumes). Gross sales margin per customer or Gross margin per customer [(2,1) - (4,2)]/[(20,15)+(20,18)] Defined as revenue, less purchased gas costs, divided by total customers, both sales and transportation. An accounting measure that describes the per-unit dollar value that remains after the acquisition cost of the unit is subtracted from the retail revenue received for that unit. Gross sales margin per therm or Gross margin per therm [(2,1) - (4,2)]/[(20,15)+(20.18)] Defined as revenue, less purchased gas costs, divided by total delivered therms. An accounting measure that describes the per-unit dollar value that remains after the acquisition cost of the unit is subtracted from the retail revenue received for that unit. Includes both sales and transportation volumes. Heating Degree Days (HDD) A measure of the coldness of the weather experienced, based on the extent to which the daily mean temperature falls below a reference temperature, usually 65 degrees F. Implied long-term (LT) debt cost (2,24 )/(6,50) A proxy measure of the interest rate paid by utilities for long-term borrowing (obligations over one year). Data as collected on the USR did not request a breakout of short- versus long-term interest obligations. Therefore, a strict calculation of cost of long term debt (annual interest paid on long-term obligations divided by total long-term debt) was not possible. The implied cost relates net interest costs (interest of all types) to long-term debt. The result permits some distortion of true long-term debt costs.

Interest coverage [(2,18 + 2,4 + 2,6 + 2,8) divided by (2,24)] The comparison of a company's financial returns to its interest payment obligations, for a specific accounting period. "EBITDA" is an income statement result; specifically, it means "earnings before interest, taxes, depreciation, and amortization." This ratio indicates the company's relative ability to generate the cash flow necessary to meet its interest payment obligations. Long-term debt (6,50) Financial instruments that become due on a date at least one year beyond the current accounting period. These include the mortgages and bonds, which represents a company's capital borrowings. By issuing debt, the company has an obligation to repay its lenders the amount borrowed plus regular increments of interest. Lower quartile (LQ) A statistical measure that describes a data value that is halfway between the median and the lowest value in the data set. Technically defined as the "first quartile." See "quartile" and "median." Mean (Arithmetic – See Weighted Average.) An average value; i.e., a single calculated value which is representative of a set of values. The mean is calculated by summing a set of observation values, then dividing that total by the number of observations that were used. Median (MED) A statistical measure describing the "middle position" for a sequence of observations, or the 50-percent position in a sequence of ordered observations (2nd quartile). See "quartile." Meter (See "customer") Miles of Main Length of utility system’s distribution mains (excludes transmission and service lines) as reported by utilities to the US Department of Transportation, Office of Pipeline Safety. Municipal utility A type of gas distribution company that is owned by a local government entity and run on behalf of that entity's citizenry. Whereas investor-owned utilities usually pay out dividends to shareholders, the municipal utility's dividends accrue to the citizens in the form of a lower cost for energy. Net margin per customer [(2,1)-(4,13)]/[(20,15)+(20,18)] Operating revenues less total O&M, with the result divided by total customers (includes both sales and transportation). Net margin per therm [(2,1)-(4,13)]/[(20,15)+(20,18)] Operating revenues less total O&M, with the result divided by total therms (includes both sales and transportation volumes). Net worth The residual value of a company's assets after deducting liabilities. Operations and maintenance (O&M) (20,13) These are accounting summaries of expenditures attributable to company operations. Most importantly, these are expenses over which management has direction. These are distinct from (i.e., do not include) expenses imposed from outside of operations such as interest payments and amortization. Observation A single event for which an activity is recorded or measured. For a measurable event the unique record for any observation is that observation's value. For example, if the variable of interest is annual therms sold," then "1,000,000" may be the value of this variable for the single observation "ABC Company."

Operating income (2,11) The financial outcome of a company that represents revenues earned less the expenses attributable to operations, including depreciation, amortization, and taxes (but not expenses such as interest payments, amortization, etc.). Operating revenue See revenue. Other production expenses (4,4) Includes FERC System of Accounts 805 (Other gas purchases and purchase gas adjustments), 806 (Exchange gas), 812 (Gas used for the utility operations), and 813 (Other gas supply expense). Profit margin (2,29)/(2,1) Net income available for common stockholders divided by total operating revenues (including electric for combination companies, since net income is not segmented by operational division). Purchased gas expense (4,3) The utility expenditure for the gas it buys on the market from producers, transmission companies, marketers, and other sources. Includes FERC System of Accounts 800 (wellhead purchases), 801 (field line purchases), 802 (plant outlet purchases), 803 (transmission line purchases), 804 (city gate purchases) LESS 804.1 (LNG), and 807 (Purchased or expense). Purchased gas cost per therm (4,3)/(20,15) Purchased gas expense divided by total sales volumes Quartile A statistical tool that analyzes a set of values that are sequenced by order of magnitude. Any set of ordered values can be divided into four quartiles. The first quartile is the observation reached after counting off the first 25 percent of the sequenced values (counting from the lowest value). The second quartile is the observation at the 50 percent position in the sequence; the third quartile is at the 75 percent position; and the fourth quartile is at the 100 percent position, which is also the highest value for the entire data set. Return on Assets (ROA) (2,29)/(6,36) A financial ratio that expresses net income as a percentage of assets. This ratio measures how well a company uses its assets to generate operating income. Return on Equity (ROE) (2,29)/(6,42) A financial ratio that expresses net income as a percentage of total common stock equity. This ratio measures how well investors in a firm are doing relative to other investments. Revenue (2,1) The receipts from utility operations and sales of gas, excluding non-utility and other income, before expenses are considered. Revenue per customer (2,1)/[(20,15)+(20,18)] Operating revenues divided by total meters, including transportation customers. Revenue per therm (2,1)/[(20,15)+(20,18)] Operating revenues divided by total therms, including transportation volumes. Sales expense (4,11) The cost of sales administration, including commissions overhead, materials, etc. Includes FERC System of Accounts 911 (Supervision), 912 (Demonstrating and selling expenses), 913 (Advertising expenses), and 916 (Misc. sales expenses).
Same-size financial statement This is an alternative method of displaying income statement and balance sheet summaries. It is intended to facilitate comparisons across company types. As opposed to displaying absolute dollar values, the same-size statement presents each line item is a percentage of its aggregate total. The same-size income statement sets revenues at 100.0 and all other items are a percent of that total. The same-size balance sheet similarly sets total assets (as well as total liabilities and owners' equity) to 100.0. System density [(20,15)+(20,18)]/Miles of Main Total customers (both sales and transportation) divided by total miles of mains (from the U.S. Dept. of Transportation). A ratio that describes the degree to which meters are "packed" onto a distribution system. Tax expense (2,8) The amount representing the utility's obligation to pay taxes, including sale, gross receipts, income, and property taxes. This total includes pass-through taxes collected by the utility on behalf of local government jurisdictions. Therm A unit of measurement for energy, equivalent to 100,000 British thermal units. Therms per customer [(20,15)+(20,18)]/[(20,15)+(20,18)] Total therms (both sales and transportation) divided by total customers (both sales and transportation). Therms delivered per employee [(20,15)+(20,18)]/(8,2) Total therms (both sales and transportation) divided by total employees. Total benefits (13,10) The annual compensation accruing to utility employees in the form of pensions, health care, insurance, and other non-payroll items. Total compensation (13,6 + 13,10) The total annual compensation accruing to utility employees, both as payroll and non-payroll compensation, as well as benefits. Total production expense (4,5) Combination of fuel (4,1), purchased gas (4,3), and other production expenses (4,4). Total O&M per customer (4,13)/[(20,15)+(20,18)] All operations and maintenance expenses divided by total customers (includes both sales and transportation). Total O&M per therm (4,13)/[(20,15)+(20,18)] All operations and maintenance expenses divided by total therms (includes both sales and transportation volumes). Total plant in service (6,5) The total value of utility plant as shown on the balance sheet. In the case of combination utilities, this will include gas and electric plant used for the purpose of power distribution.
Transmission (4,7) The cost to a utility for moving natural gas purchases from its source to its city gate. Includes FERC System of Accounts 850 (Operations, supervision and engineering), 851 (System control and load dispatching), 852 (Communication system expenses), 853 (Compressor station labor and expenses), 854 (Gas for compressor station fuel), 855 (Other fuel and power for compressor stations), 856 (Main expenses), 857 (Measuring and regulating station expenses), 858 (Transmission and compression of gas by others), 859 (Other expenses), 860 (Rents), 861 (Maintenance supervision and engineering), 862 (Maintenance of structures and improvements), 863 (Maintenance of mains), 864 (Maintenance of compressor station equipment), 865 (Maintenance of measuring and regulating station equipment), 866 (Maintenance of communication equipment), 867 (Maintenance of other equipment), and 870 (Operation supervision and engineering). Transmission and distribution costs per customer [(4,7)+(4,8)]/[ (20,15)+(20,18)] Cost of transporting gas to the customer, divided by total customers (both sales and transportation). Transmission and distribution costs per therm [(4,7+4,8)/(20,15+20,18)] Cost of transporting gas to the customer, divided by total therms (both sales and transportation). Uniform Statistical Report (USR) The standardized reporting form used by the American Gas Association to collect financial and operating information from its individual member companies. The USR data is the source for information presented in this study. Upper quartile (UQ) A statistical measure, which describes a data value that, is halfway between the median and the highest value in the data set. Technically defined as the "third quartile." See "Quartile" and "Median." Value In statistics, a "value" is the recorded measurement for an individual observation. For example, if the variable of interest is "annual therms sold," then "1,000,000" may be the value of this variable for the single observation "ABC Company." Variable An attribute, more or less common to a set of observations, which is subject to measurement. For example, if the variable of interest is "annual therms sold," then "1,000,000" may be the value of this variable for the single observation "ABC Company." Weighted average A statistical measure for describing the mean or "central tendency" of a set of numeric observations. Weighted averages are used in this study to provide benchmark ratios per group or per industry segment. For these benchmark ratios and arithmetic (simple) average would be the mean value of the ratios calculated individually for each company. Instead, the weighted average ratio has as its numerator the sum of observations for that variable divided by the sum of observations for the denominator variable. For example, the density of distribution system metric for gas utilities relates the sum of all gas utility meters divided by the sum of all gas utility miles of pipe.

APPENDIX 2: MULTI-YEAR CHARTS FOR ALL COMPANIES Explanation of factors influencing results: REVENUE: Impacted by weather, rate design, customer growth, the economy, allowed rates of return, taxes, depreciation expense, total O&M expense, and subsidiary operations. REVENUE PER CUSTOMER: Determined by revenue and customer base (predominantly higher-consuming customer population yields larger results). REVENUE PER THERM: Determined by revenue and customer base (predominantly smaller-consuming customer base yields larger results). THERMS DELIVERED PER CUSTOMER: Influenced by weather and customer base (predominantly higher-consuming customer population yields larger results). PERCENT FIRM SALES: Determined by customer base. Utilities with predominantly residential and small commercial customers tend to have higher values here. Large customers switching from sales to transportation tariffs also influence results. PURCHASED GAS COST PER SALES THERM: Impacted by proximity to supplies (closer leads to lower transportation costs), interstate pipeline access (more competition leads to lower costs), volumes purchased (economies of scale), and purchasing strategies (spot versus contracts, storage refill, hedging, etc.). GROSS SALES MARGIN: Influenced by revenue, O&M, and company size (economies of scale). TRANSMISSION AND DISTRIBUTION COST PER THERM/CUSTOMER: Determined by age of system, throughput, customer base, system density, and size of company (economies of scale). CUSTOMER ACCOUNT EXPENSE PER THERM: Impacted by customer base (concentration of smaller customers leads to higher costs per therm), types of administrative (e.g., billing) systems, and throughput. CUSTOMER SERVICE AND INFORMATION EXPENSE PER THERM: Influenced by types of administrative systems (e.g., database software and hardware), customer base, and throughput. SALES EXPENSE PER THERM: Determined by level of marketing effort put forth by company and throughput. GENERAL AND ADMINSTRATIVE EXPENSE PER THERM/CUSTOMER: Impacted by employee base/compensation, overhead expenses, customer base, and throughput. TOTAL OPERATION AND MAINTENANCE EXPENSE PER THERM/CUSTOMER: Combination of purchased gas expense, other production costs, T&D, customer accounts, service, & information expenses, sales, and G&A. See those factors for explanation. NET MARGIN PER THERM/CUSTOMER: Influenced by allowed rates of return, taxes, depreciation, weather, customer base, and throughput. AVERAGE SALARIES, BENEFITS, AND PENSIONS PER EMPLOYEE: Impacted by union contracts, experience/tenure of average employee, age of employees and retirees, local economic competition for employees, proportion of upper management relative to employee base (higher for companies outsourcing significant workload), and special offers to employees (early retirement, severance packages due to downsizing, etc.). CUSTOMERS PER EMPLOYEE: Determined by the customer base (companies with predominately small-use customers tend to have a higher value) as well as the employee base (more efficient companies and those outsourcing significant workload tend to have a higher value).

THERMS DELIVERED PER EMPLOYEE: Primarily determined by the customer base (companies with predominately large-use customers tend to have a higher value). GAS PLANT PER CUSTOMER: Influenced by the customer base (companies with predominately large-use customers tend to have a higher value). RETURN ON ASSETS: Impacted by allowed rate of return, weather, sales growth, subsidiary performance, and one-time charges (e.g., asset reevaluation, merger expense, etc.). RETURN ON EQUITY: Impacted by allowed rate of return, weather, sales growth, subsidiary performance, and one-time charges (e.g., asset reevaluation, merger expense, etc.). ASSET TURNOVER: Influenced by revenue and composition/age of gas plant. PROFIT MARGIN: Impacted by allowed rate of return, income taxes, interest expense, and weather. FINANCIAL LEVERAGE: Influenced by the proportion of debt and the amount of gas plant for a company. NOTE: Recent results of metrics involving miles of main are not comparable for years prior to 2004 because of changes in the definition of miles of main changed (no longer includes services) and in the data source (now derived from the US Department of Transportation, Office of Pipeline Safety database).
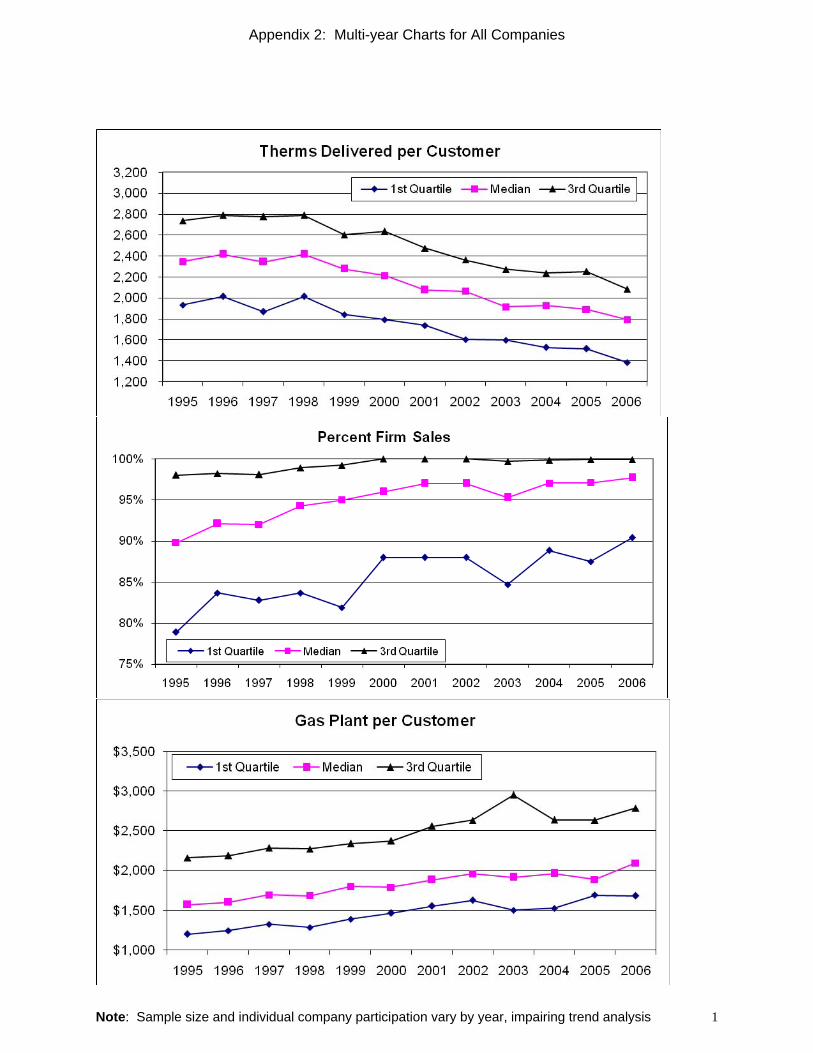
Appendix 2: Multi-year Charts for All Companies
Note: Sample size and individual company participation vary by year, impairing trend analysis 1

Appendix 2: Multi-year Charts for All Companies
Note: Sample size and individual company participation vary by year, impairing trend analysis 2

Appendix 2: Multi-year Charts for All Companies
Note: Sample size and individual company participation vary by year, impairing trend analysis 3

Appendix 2: Multi-year Charts for All Companies
Note: Sample size and individual company participation vary by year, impairing trend analysis 4

Appendix 2: Multi-year Charts for All Companies
Note: Sample size and individual company participation vary by year, impairing trend analysis 5
Appendix 2: Multi-year Charts for All Companies
Note: Sample size and individual company participation vary by year, impairing trend analysis 6

Appendix 2: Multi-year Charts for All Companies
Note: Sample size and individual company participation vary by year, impairing trend analysis 7
Appendix 2: Multi-year Charts for All Companies
Note: Sample size and individual company participation vary by year, impairing trend analysis 8
Appendix 2: Multi-year Charts for All Companies
Note: Sample size and individual company participation vary by year, impairing trend analysis 9

APPENDIX 3a: GAS UTILITY SYSTEM PROFILES AND DELIVERY VOLUMES 2006 Data, 65 Utilities Reporting Gas Utilities Combination Utilities Municipal Utilities All Companies Stratified by Type of Company LQ MED UQ AVG LQ MED UQ AVG LQ MED UQ AVG LQ MED UQ AVG SYSTEM PROFILE 1/
Total Therms delivered (000)
309,800
885,533
1,499,896
1,190,433
295,039
860,645
1,959,294
1,514,532
134,125
252,505
390,763
283,269
220,370
810,930
1,499,896
1,176,501
Total Sales Volume (000)
135,070
507,073
854,980
608,143
154,240
478,729
1,186,070
840,157
130,690
245,634
306,400
242,252
110,230
448,551
876,324 624,341
Transportation Volume (000)
65,360
274,813
703,830
582,290
72,516
371,046
652,343
674,376
19
6,909
87,799
41,017
30,310
206,367
652,300 552,160
Gas customers
124,339
468,174
836,194
636,301
158,177
557,155
1,016,412
883,591
107,525
193,106
291,679
224,910
115,520
455,014
836,194 651,589
Miles of main in use
2,978
7,496
14,838
12,611
4,009
7,305
18,929
12,221
2,350
2,792
3,170
3,011
2,958
6,614
14,838
11,610
Density (meters/mile of main)
44.1
50.3
66.1
61.2
43.4
55.5
70.2
59.9
44.8
73.5
79.8
74.7
43.6
52.5
68.6
62.2
THERM VOLUME BY CUSTOMER CLASS (000) 2/
Residential heating
74,230
321,600 580,157
370,340
92,860
316,666
688,290
547,187
68,092
132,149
171,500
140,260
73,040
230,190
580,157 387,192
Residential non-heating
-
- 2,490
4,001
-
-
10,277
5,905
-
-
218
2,355
-
-
2,770 4,259
Commercial, firm
31,880
105,096 213,750
153,395
52,793
158,985
334,562
222,229
44,936
77,872
94,956
70,623
34,030
109,080
229,055
160,581
Commercial, interruptible
-
- 1,320
9,257
-
-
1,923
4,540
-
3,717
7,511
5,263
-
-
2,453 7,872
Industrial, firm
620
7,220 22,930
25,173
2,275
10,003
49,467
38,748
240
2,940
7,385
4,709
620
7,040
22,930 26,208
Industrial, interruptible
-
- 2,600
9,029
-
-
1,964
2,508
2,211
13,586
18,933
12,605
-
-
3,320 7,955
Electric utility generation, firm
-
- -
977
-
-
457
14,541
-
-
630
581
-
-
- 3,862 Electric utility generation, interup.
-
- -
13,042
-
-
-
-
-
-
-
2,503
-
-
- 9,260
Non-utility generation, firm
-
- -
2,224
-
-
-
-
-
-
-
-
-
-
-
1,539
Non-utility generation, interup.
-
- -
68
-
-
-
-
-
-
-
0
-
-
-
0
NGV
-
- -
127
-
-
-
50
-
-
-
-
-
-
-
14
Municipal & public
-
-
1
5,190
-
-
-
3
-
-
-
806
-
-
-
329
Interdepartmental
-
-
-
-
-
-
1
10
-
-
2
12
-
-
-
3
Other
-
-
-
15,320
-
-
-
-
-
-
-
-
-
-
-
2
1/ Includes transportation only customers 2/ Quartile figures for each column do not sum. The quartile arrangements do not yield the same sequence of firms for each variable. Key: LQ = Lower Quartile, MED = Median, UQ = Upper Quartile, AVG = Average

APPENDIX 3a: GAS UTILITY SYSTEM PROFILES AND DELIVERY VOLUMES (Cont’d) NUMBER OF CUSTOMERS BY CUSTOMER CLASS (000) 2006 Data, 65 Utilities Reporting Gas Utilities Combination Utilities Municipal Utilities All Companies Stratified by Type of Company LQ MED UQ AVG LQ MED UQ AVG LQ MED UQ AVG LQ MED UQ AVG
Residential heating
110,687
404,621
616,275
495,750
135,245
456,727
894,422
793,185
97,045
176,404
268,778
198,633
106,001
360,486
616,275
532,387
Residential non-heating
-
-
10,621
29,185
-
-
33,914
20,125
-
-
1,328
9,200
-
-
21,346
25,389
Commercial, firm
9,000
30,377
58,734
40,419
14,958
36,907
84,728
59,130
10,382
15,721
22,358
16,121
9,000
29,424
58,734
42,206
Commercial, interruptible
-
-
4
158
-
-
11
37
-
-
8
5
-
-
11
117
Industrial, firm
19
187
851
987
215
949
2,616
2,815
18
72
77
92
19
235
1,229
1,298
Industrial, interruptible
-
-
30
62
-
-
13
8
-
7
19
13
-
-
21
46
Electric utility generation, firm
-
-
-
0
-
-
-
8
-
-
1
1
-
-
-
2 Electric utility generation, interup.
-
-
-
2
-
-
-
-
-
-
-
0
-
-
-
1
Non-utility generation, firm
-
-
-
0
-
-
-
-
-
-
-
-
-
-
-
0
Non-utility generation, interup.
-
-
-
0
-
-
-
-
-
-
-
0
-
-
-
0
NGV
-
-
-
4
-
-
-
50
-
-
-
-
-
-
-
14
Municipal & public
-
-
-
367
-
-
-
3
-
-
-
806
-
-
-
329
Interdepartmental
-
-
-
-
-
-
1
10
-
-
2
12
-
-
-
3
Other
-
-
-
3
-
-
-
-
-
-
-
-
-
-
-
2

APPENDIX 3b: GAS UTILITY FINANCIAL STATEMENTS (000$) 2006 Data, 65 Utilities Reporting Gas Utilities Combination Utilities Municipal Utilities All Companies Stratified by Type of Company LQ MED UQ AVG LQ MED UQ AVG LQ MED UQ AVG LQ MED UQ AVG GAS-ONLY INCOME STATEMENT Operating revenue 192,703 663,444 1,325,111 861,251 247,270 847,733 1,388,582 1,149,842 148,037 242,323 395,006 337,475 172,207 593,785 1,319,434 875,061 Operating expense 159,182 520,198 1,140,111 692,491 201,934 688,611 1,163,227 931,640 127,870 214,027 367,332 289,016 155,130 484,440 1,085,236 706,756 Maintenance expense 2,341 10,069 25,342 15,403 5,188 15,725 21,679 21,685 2,379 4,951 10,019 7,052 2,341 10,262 22,190 15,985 Total O&M 163,456 526,917 1,171,345 707,894 207,121 706,942 1,182,888 953,324 130,249 218,978 377,351 296,068 158,477 500,045 1,108,484 722,741 Depreciation 6,422 31,976 48,664 40,426 9,002 34,775 69,880 57,985 5,442 7,188 13,294 12,362 6,422 28,231 49,493 41,617 Depletion - - - 314 - - 609 1,514 - - - - - - - 543 Amortization - - 3,965 3,205 - 570 2,315 2,452 - - - - - - 3,605 2,747 Prop. loss charged to operations - - - 42 - - - 1,171 - - - - - - - 282 Total taxes 9,164 32,147 81,786 51,445 10,547 44,825 95,725 59,950 1,158 5,185 6,091 5,475 6,209 24,034 80,625 49,033 Other operating income - - - 117 (1) - - (6,251) - - 2,062 1,870 - - - (1,093) Total operating income 9,619 43,276 93,464 57,926 18,329 48,617 83,935 73,445 2,984 8,287 17,218 23,570 9,351 33,113 87,981 58,097 BALANCE SHEET Gas plant 241,295 1,008,769 1,929,221 1,375,768 320,226 1,254,755 2,050,637 1,805,767 218,053 271,764 423,164 486,280 235,195 887,419 1,920,314 1,386,277 Common plant - - - 2,233 45,670 139,321 468,240 440,940 - - 85,299 64,924 - - - 102,511 Other plant - - - 177 - - 38 18,653 - 198,330 478,576 448,058 - - 5 45,499 Total plant in service 1/2/ 241,295 1,008,769 1,929,221 1,378,178 1,325,099 6,241,350 10,548,581 8,659,800 374,657 1,190,235 1,978,294 1,390,469 391,268 1,185,296 2,873,094 2,947,662 Accumulated depreciation 1/ 117,201 385,277 733,682 536,527 510,998 2,114,938 4,088,964 3,795,512 101,365 432,524 778,517 491,849 149,832 424,938 946,559 1,234,338 Construction work-in-progress 1/ 1,547 10,000 29,160 25,633 48,123 76,357 168,310 205,378 10,023 39,785 78,894 66,354 1,754 16,555 67,407 68,106 Net utility plant 1/ 148,581 615,637 1,189,133 867,603 872,894 4,200,991 6,579,015 5,108,277 336,386 911,295 1,282,880 967,611 191,447 770,936 1,892,581 1,790,210 Gas storage (non-current) 1/ - - 858 4,286 - - - 3,388 - - - - - - - 3,697 Customer accts. Receivable 1/ 7,185 44,339 103,591 89,789 47,590 180,146 374,098 256,551 14,671 56,053 101,185 58,835 9,244 64,949 148,578 122,850 Total current & accrued assets 1/ 43,507 202,214 459,036 288,609 144,961 780,397 1,244,894 966,857 144,817 331,692 461,857 318,157 64,728 233,937 562,022 437,421 Total deferred debits 1/ 8,351 103,122 384,563 224,092 374,122 933,797 2,532,863 1,992,003 3,119 29,683 104,112 225,845 18,308 126,936 531,010 605,035 Total assets 1/ 250,580 1,038,469 2,568,101 1,492,695 1,481,296 6,289,198 12,097,583 8,568,428 496,534 1,374,053 2,550,865 1,555,632 364,749 1,212,414 3,157,153 3,022,509 Common stock 1/ 1 3,268 71,425 87,141 66,272 527,471 901,580 620,971 - - - - - 9,250 219,242 194,076 Retained earnings 1/ 27,385 113,345 254,534 195,389 160,971 274,708 985,137 880,332 159,644 498,686 1,081,053 673,904 40,603 173,433 348,765 387,086 Total common stock equity 1/ 67,814 312,831 661,417 463,795 563,597 1,688,228 2,971,908 2,324,779 159,644 498,686 1,081,053 673,904 128,398 455,020 921,807 884,017 Total long-term (LT) debt 1/ 58,000 181,125 502,000 351,183 532,079 1,803,102 4,073,013 2,651,035 122,206 635,620 1,129,766 665,406 69,250 314,072 825,000 875,541 Total capitalization 1/2/ 152,566 493,820 1,163,879 822,314 1,035,543 4,147,822 6,776,521 5,020,097 404,503 1,134,306 2,314,119 1,344,507 224,468 775,929 1,951,892 1,774,654 Total non-current other liabilities 1/ - - 25,381 26,980 984 21,300 450,853 397,504 - 967 4,560 11,674 - 282 39,239 105,372 Current & accrued liabilities 1/ 41,166 266,991 490,431 378,420 180,254 873,980 1,109,540 1,040,792 54,940 128,432 257,379 167,544 64,627 289,363 540,061 501,619 Total deferred credits 1/ 29,834 162,624 371,746 250,051 283,291 1,126,433 3,658,774 2,051,945 2,266 10,110 12,371 10,672 27,201 172,042 554,429 616,054 Total capitalization & liabilities 1/2/ 250,580 1,038,469 2,568,101 1,492,695 1,481,296 6,289,198 12,097,583 8,568,428 496,534 1,374,053 2,550,865 1,555,632 364,749 1,212,414 3,157,153 3,022,509
1/ Figures for combination utilities are necessarily based on combined gas and electric operations. Some municipal utilities are also combined utilities. 2/ Reflects gas and non-gas assets, also includes regulatory assets. 3/ Total capitalization figure in this display includes preferred stock. Key: LQ = Lower Quartile, MED = Median, UQ = Upper Quartile, AVG = Average

APPENDIX 3c: GAS UTILITY SAME-SIZE FINANCIAL STATEMENTS 2006 Data, 65 Utilities Reporting
Stratified by Type of Company Gas Utilities Combination
Utilities Municipal Utilities All Companies
45 firms 14 firms 6 firms 65 firms GAS-ONLY INCOME STATEMENT - Based on average values
Operating revenue 100.0 100.0 100.0 100.0 Operating expense 80.0 80.7 86.8 80.9 Maintenance expense 2.0 1.8 1.8 1.9 Total O&M 82.0 82.5 88.6 82.8 Depreciation 4.8 4.2 4.0 4.6 Depletion 0.0 0.1 - 0.0 Amortization 0.3 0.5 - 0.3 Prop. loss charged to operations 0.0 0.0 - 0.0 Total taxes 5.5 5.6 1.7 5.1 Other operating income (0.0) (0.1) 0.3 (0.0) Total operating income 7.3 7.0 5.7 7.0 BALANCE SHEET - Based on average values Gas plant 92.2 21.1 31.3 45.9
Common plant
0.1 5.1 4.2 3.4 Other plant 0.0 0.2 28.8 1.5 Total plant in service 1/2/ 92.3 101.1 89.4 97.5 Accumulated depreciation 1/ 35.9 44.3 31.6 40.8
Construction work-in-progress 1/
1.7 2.4 4.3 2.3 Net utility plant 1/ 58.1 59.6 62.2 59.2 Gas storage (non-current) 1/ 0.3 0.0 - 0.1 Customer accts. receivable 1/ 6.0 3.0 3.8 4.1 Total current & accrued assets 1/ 19.3 11.3 20.5 14.5 Total deferred debits 1/ 15.0 23.2 14.5 20.0 Total assets 1/ 100.0 100.0 100.0 100.0 Common stock 1/ 5.8 7.2 - 6.4
Retained earnings 1/
13.1 10.3 43.3 12.8
Total common stock equity 1/
31.1 27.1 43.3 29.2 Total long-term (LT) debt 1/ 23.5 30.9 42.8 29.0 Total capitalization 1/3/ 55.1 58.6 86.4 58.7
Total non-current other liabilities 1/
1.8 4.6 0.8 3.5 Current & accrued liabilities 1/ 25.4 12.1 10.8 16.6 Total deferred credits 1/ 16.8 23.9 0.7 20.4 Total capitalization & liabilities 1/3/ 100.0 100.0 100.0 100.0 1/ Figures for combination utilities are necessarily based on combined gas and electric operations. Some municipal utilities are also combined utilities. 2/ Reflects gas and non-gas assets, also includes regulatory assets. 3/ Total capitalization figure in this display includes preferred stock.

APPENDIX 3d: GAS UTILITY INCOME STATEMENTS – Per Cost Driver
GAS-ONLY INCOME STATEMENT - Per Annual Therm Delivered 2006 Data, 65 Utilities Reporting Gas Utilities Combination Utilities Municipal Utilities All Companies LQ MED UQ AVG LQ MED UQ AVG LQ MED UQ AVG LQ MED UQ AVG Operating revenue $0.6938 $0.8578 $1.0606 $0.8925 $0.7039 $0.8782 $1.0281 $0.9173 $0.9909 $1.0852 $1.2055 $1.1365 $0.7039 $0.9195 $1.1150 $0.9203 Operating expense $0.5484 $0.7076 $0.8362 $0.7139 $0.5809 $0.7422 $0.8380 $0.7404 $0.8978 $0.9833 $1.0441 $0.9861 $0.5747 $0.7467 $0.8750 $0.7447 Maintenance expense $0.0070 $0.0148 $0.0226 $0.0177 $0.0099 $0.0138 $0.0197 $0.0164 $0.0150 $0.0229 $0.0256 $0.0204 $0.0079 $0.0148 $0.0226 $0.0177 Total O&M $0.5669 $0.7233 $0.8437 $0.7316 $0.5927 $0.7556 $0.8587 $0.7567 $0.9228 $0.9995 $1.0615 $1.0066 $0.5918 $0.7688 $0.8866 $0.7624 Depreciation $0.0287 $0.0329 $0.0456 $0.0433 $0.0342 $0.0378 $0.0435 $0.0390 $0.0263 $0.0462 $0.0593 $0.0453 $0.0287 $0.0350 $0.0459 $0.0425 Depletion $0.0000 $0.0000 $0.0000 $0.0002 $0.0000 $0.0000 $0.0012 $0.0008 $0.0000 $0.0000 $0.0000 $0.0000 $0.0000 $0.0000 $0.0000 $0.0003 Amortization $0.0000 $0.0000 $0.0041 $0.0029 $0.0000 $0.0006 $0.0047 $0.0048 $0.0000 $0.0000 $0.0000 $0.0000 $0.0000 $0.0000 $0.0037 $0.0030 Prop. loss charged to operations $0.0000 $0.0000 $0.0000 $0.0001 $0.0000 $0.0000 $0.0000 $0.0004 $0.0000 $0.0000 $0.0000 $0.0000 $0.0000 $0.0000 $0.0000 $0.0001 Total taxes $0.0243 $0.0421 $0.0663 $0.0494 $0.0271 $0.0323 $0.0691 $0.0517 $0.0026 $0.0133 $0.0327 $0.0198 $0.0243 $0.0382 $0.0657 $0.0471 Other operating income $0.0000 $0.0000 $0.0000 -$0.0002 $0.0000 $0.0000 $0.0000 -$0.0011 $0.0000 $0.0000 $0.0048 $0.0033 $0.0000 $0.0000 $0.0000 -$0.0001 Total operating income $0.0298 $0.0451 $0.0682 $0.0650 $0.0364 $0.0579 $0.0746 $0.0640 $0.0250 $0.0578 $0.0853 $0.0648 $0.0299 $0.0470 $0.0768 $0.0648 GAS-ONLY INCOME STATEMENT - Per Average Annual Customer Served 2006 Data, 65 Utilities Reporting Gas Utilities Combination Utilities Municipal Utilities All Companies LQ MED UQ AVG LQ MED UQ AVG LQ MED UQ AVG LQ MED UQ AVG Operating revenue $1,207 $1,567 $1,828 $1,560 $1,349 $1,398 $1,666 $1,492 $1,356 $1,457 $1,559 $1,453 $1,267 $1,470 $1,769 $1,535 Operating expense $1,049 $1,201 $1,540 $1,271 $1,063 $1,157 $1,417 $1,207 $1,240 $1,308 $1,351 $1,264 $1,054 $1,203 $1,461 $1,257 Maintenance expense $15 $24 $35 $27 $19 $24 $29 $26 $18 $31 $35 $26 $16 $24 $34 $27 Total O&M $1,071 $1,223 $1,555 $1,299 $1,085 $1,176 $1,449 $1,232 $1,275 $1,330 $1,373 $1,290 $1,074 $1,227 $1,504 $1,284 Depreciation $50 $61 $86 $69 $56 $63 $67 $62 $36 $59 $74 $58 $50 $62 $81 $66 Depletion $0 $0 $0 $0 $0 $0 $2 $1 $0 $0 $0 $0 $0 $0 $0 $1 Amortization $0 $0 $5 $5 $0 $1 $8 $9 $0 $0 $0 $0 $0 $0 $5 $6 Prop. loss charged to operations $0 $0 $0 $0 $0 $0 $0 $1 $0 $0 $0 $0 $0 $0 $0 $0 Total taxes $47 $70 $130 $80 $53 $69 $107 $80 $3 $17 $44 $26 $44 $63 $113 $75 Other operating income $0 $0 $0 -$1 $0 $0 $0 $0 $0 $0 $6 $4 $0 $0 $0 -$1 Total operating income $56 $93 $132 $106 $79 $92 $119 $106 $33 $78 $105 $79 $56 $93 $129 $104
APPENDIX 3d: GAS UTILITY INCOME STATEMENTS – Per Cost Driver (cont’d)
GAS-ONLY INCOME STATEMENT - Per Dollar of Gas Plant 2006 Data, 65 Utilities Reporting Gas Utilities Combination Utilities Municipal Utilities All Companies LQ MED UQ AVG LQ MED UQ AVG LQ MED UQ AVG LQ MED UQ AVG Operating revenue $0.5661 $0.6546 $0.8032 $0.6834 $0.6513 $0.7117 $0.7819 $0.7544 $0.5761 $0.7294 $0.9272 $0.7481 $0.5703 $0.6929 $0.8101 $0.7047 Operating expense $0.4449 $0.5413 $0.6991 $0.5627 $0.5133 $0.5660 $0.6610 $0.6115 $0.4973 $0.6434 $0.8099 $0.6579 $0.4500 $0.5549 $0.7128 $0.5820 Maintenance expense $0.0069 $0.0113 $0.0149 $0.0122 $0.0099 $0.0116 $0.0149 $0.0114 $0.0105 $0.0126 $0.0199 $0.0141 $0.0074 $0.0117 $0.0151 $0.0122 Total O&M $0.4575 $0.5500 $0.7076 $0.5749 $0.5302 $0.5744 $0.6734 $0.6229 $0.5022 $0.6595 $0.8252 $0.6720 $0.4660 $0.5684 $0.7256 $0.5942 Depreciation $0.0247 $0.0285 $0.0341 $0.0294 $0.0276 $0.0288 $0.0341 $0.0287 $0.0230 $0.0256 $0.0318 $0.0271 $0.0245 $0.0285 $0.0341 $0.0290 Depletion $0.0000 $0.0000 $0.0000 $0.0002 $0.0000 $0.0000 $0.0009 $0.0006 $0.0000 $0.0000 $0.0000 $0.0000 $0.0000 $0.0000 $0.0000 $0.0002 Amortization $0.0000 $0.0000 $0.0028 $0.0021 $0.0000 $0.0006 $0.0032 $0.0084 $0.0000 $0.0000 $0.0000 $0.0000 $0.0000 $0.0000 $0.0027 $0.0033 Prop. loss charged to operations $0.0000 $0.0000 $0.0000 $0.0000 $0.0000 $0.0000 $0.0000 $0.0003 $0.0000 $0.0000 $0.0000 $0.0000 $0.0000 $0.0000 $0.0000 $0.0001 Total taxes $0.0200 $0.0328 $0.0522 $0.0351 $0.0253 $0.0331 $0.0559 $0.0402 $0.0010 $0.0093 $0.0228 $0.0133 $0.0200 $0.0318 $0.0522 $0.0342 Other operating income $0.0000 $0.0000 $0.0000 -$0.0007 $0.0000 $0.0000 $0.0000 $0.0031 $0.0000 $0.0000 $0.0043 $0.0017 $0.0000 $0.0000 $0.0000 $0.0003 Total operating income $0.0305 $0.0435 $0.0498 $0.0417 $0.0400 $0.0443 $0.0581 $0.0533 $0.0159 $0.0363 $0.0667 $0.0357 $0.0305 $0.0435 $0.0499 $0.0436 GAS-ONLY INCOME STATEMENT - Per Mile of Distribution Pipe 2006 Data, 65 Utilities Reporting Gas Utilities Combination Utilities Municipal Utilities All Companies LQ MED UQ AVG LQ MED UQ AVG LQ MED UQ AVG LQ MED UQ AVG Operating revenue $52,593 $75,061 $121,890 $100,146 $67,919 $84,295 $114,563 $88,404 $66,080 $90,094 $104,988 $111,728 $54,180 $76,659 $120,893 $98,640 Operating expense $41,608 $60,770 $100,024 $80,938 $56,919 $67,029 $96,969 $71,538 $57,077 $81,299 $94,946 $95,129 $44,322 $61,888 $100,502 $80,201 Maintenance expense $672 $939 $2,120 $1,797 $974 $1,242 $2,433 $1,573 $1,063 $1,776 $2,647 $2,276 $694 $1,102 $2,415 $1,793 Total O&M $42,136 $61,541 $103,490 $82,735 $58,048 $68,132 $99,402 $73,110 $58,140 $83,074 $97,593 $97,405 $44,822 $63,155 $103,242 $81,993 Depreciation $2,341 $3,416 $4,928 $4,065 $2,425 $3,972 $5,852 $3,857 $2,307 $2,887 $3,404 $4,083 $2,303 $3,416 $5,081 $4,021 Depletion $0 $0 $0 $68 $0 $0 $91 $96 $0 $0 $0 $0 $0 $0 $0 $68 Amortization $0 $0 $346 $391 $0 $62 $480 $411 $0 $0 $0 $0 $0 $0 $346 $359 Prop. loss charged to operations $0 $0 $0 $14 $0 $0 $0 $67 $0 $0 $0 $0 $0 $0 $0 $25 Total taxes $2,083 $3,360 $6,387 $5,953 $2,928 $3,909 $5,390 $4,540 $452 $1,932 $2,451 $1,644 $2,083 $3,173 $5,829 $5,229 Other operating income $0 $0 $0 -$66 $0 $0 $0 -$212 $0 $0 $433 $559 $0 $0 $0 -$39 Total operating income $2,611 $4,796 $7,171 $6,918 $3,186 $5,983 $8,008 $6,324 $1,153 $3,015 $7,422 $8,596 $2,611 $4,796 $7,938 $6,946
APPENDIX 3e: GAS UTILITY FINANCIAL RATIOS 2006 Data, 65 Utilities Reporting Gas Utilities Combination Utilities Municipal Utilities All Companies Stratified by Type of Company 45firms 14 firms 6 firms 65 firms LQ MED UQ AVG LQ MED UQ AVG LQ MED UQ AVG LQ MED UQ AVG
Therms delivered (avg.) per acct.
1,530
1,853
2,151
1,988
1,451
1,666
1,926
1,831
1,222
1,304
1,332
1,286
1,382
1,793
2,083
1,889
Therms per $1,000 of gas plant
635
823
1,056
902
593
838
1,035
1,104
477
694
921
697
620
823
1,013
927 Value of gas plant per customer $1,683 $2,177 $2,788 $2,417 $1,791 $1,883 $2,707 $2,146 $1,461 $2,137 $2,717 $2,113 $1,683 $2,099 $2,788 $2,330 %Sales firm (not interruptible) 85.9% 97.7% 99.9% 89.3% 97.0% 99.2% 99.9% 98.1% 82.9% 87.7% 95.3% 85.3% 90.4% 97.7% 99.9% 90.8%
Collection period (days) 1/
18.8
32.0
45.2
36.3
22.6
25.3
32.6
27.8
27.0
29.7
40.7
33.5
20.8
28.7
41.1
34.2 Gas O&M expense as pct. of revenue 78.4% 84.2% 88.0% 82.6% 79.6% 83.2% 85.5% 82.5% 88.0% 88.2% 91.1% 89.1% 79.5% 84.4% 88.0% 83.2% Gas operating income as pct. of revenue 3.9% 6.8% 8.6% 6.9% 5.5% 6.8% 8.5% 7.0% 2.2% 5.3% 8.8% 5.2% 4.0% 6.7% 8.6% 6.8% Gas operating revenue per customer $1,207 $1,567 $1,828 $1,560 $1,349 $1,398 $1,666 $1,492 $1,356 $1,457 $1,559 $1,453 $1,267 $1,470 $1,769 $1,535 Gas O&M expense per customer $1,071 $1,223 $1,555 $1,299 $1,085 $1,176 $1,449 $1,232 $1,275 $1,330 $1,373 $1,290 $1,074 $1,227 $1,504 $1,284 Gas operating income per customer $56 $93 $132 $106 $79 $92 $119 $106 $33 $78 $105 $79 $56 $93 $129 $104 Gas revenue per dollar of gas plant $0.566 $0.655 $0.803 $0.683 $0.651 $0.712 $0.782 $0.754 $0.576 $0.729 $0.927 $0.748 $0.570 $0.693 $0.810 $0.705 Gas O&M expense per dollar of gas plant $0.457 $0.550 $0.708 $0.575 $0.530 $0.574 $0.673 $0.623 $0.502 $0.659 $0.825 $0.672 $0.466 $0.568 $0.726 $0.594 Gas operating income per $ of gas plant $0.031 $0.043 $0.050 $0.042 $0.040 $0.044 $0.058 $0.053 $0.016 $0.036 $0.067 $0.036 $0.031 $0.043 $0.050 $0.044 Gas revenue per mile of pipe 2/ $52,593 $75,061 $121,890 $100,146 $67,919 $84,295 $114,563 $88,404 $66,080 $90,094 $104,988 $111,728 $54,180 $76,659 $120,893 $98,640 Gas O&M expense per mile of pipe 2/ $42,136 $61,541 $103,490 $82,735 $58,048 $68,132 $99,402 $73,110 $58,140 $83,074 $97,593 $97,405 $44,822 $63,155 $103,242 $81,993 Gas operating income per mile of pipe 2/ $2,611 $4,796 $7,171 $6,918 $3,186 $5,983 $8,008 $6,324 $1,153 $3,015 $7,422 $8,596 $2,611 $4,796 $7,938 $6,946 Long-term debt - total assets ratio 1/ 18.8% 22.8% 29.6% 23.2% 29.4% 31.3% 36.9% 33.0% 21.9% 33.5% 46.9% 36.3% 19.6% 26.4% 31.9% 26.5% Long-term debt - total capitalization ratio 1/3/ 33.7% 44.1% 49.1% 40.9% 47.9% 52.0% 57.4% 52.9% 26.2% 42.0% 51.8% 43.2% 37.8% 45.3% 51.3% 43.7% Net interest - long-term debt ratio 1/ 7.0% 8.4% 10.3% 9.7% 5.9% 6.3% 7.0% 6.6% 4.1% 4.7% 4.9% 4.3% 6.0% 7.7% 9.3% 8.5% EBITDA interest coverage 1/ 4.1x 5.5x 7.2x 5.9x 4.3x 5.0x 6.9x 5.5x 3.0x 4.3x 7.5x 6.1x 4.1x 5.2x 7.1x 5.8x Return on assets 1.4% 2.5% 3.5% 2.2% 2.3% 2.7% 2.9% 2.4% 0.0% 1.9% 3.2% 1.4% 1.6% 2.5% 3.3% 2.2% Gross sales margin per therm 4/ $0.183 $0.283 $0.356 $0.319 $0.205 $0.258 $0.363 $0.290 $0.222 $0.259 $0.274 $0.303 $0.202 $0.268 $0.356 $0.312 Gross sales margin per customer 4/ $363 $533 $619 $515 $370 $430 $548 $470 $286 $329 $354 $381 $354 $480 $590 $493
Key: LQ = Lower Quartile, MED = Median, UQ = Upper Quartile, AVG = Average 1/ Figures for combination utilities are necessarily based on combined gas and electric operations. Four municipal utilities are also combined gas-electric utilities. 2/ Miles of distribution pipes from US Department of Transportation. 3/ Total capitalization figure in this display includes preferred stock. 4/ Gross sales margin = operating revenues less total production costs NOTE: Some ratios are not always normally distributed. Therefore, average ratio values may be subject to distortion by a few observations that are outliers.
APPENDIX 4: GAS UTILITY O&M Detail Based on Segment Averages Gas Utilities Combination Utilities Municipal Utilities All Companies VALUES PER THERM 2004 2005 2006 2004 2005 2006 2004 2005 2006 2004 2005 2006 Gas-only revenues $0.7709 $0.8479 $0.8925 $0.7254 $0.8560 $0.9173 $0.9290 $1.1216 $1.1365 $0.7773 $0.8835 $0.9203 Purchased-gas expense $0.4032 $0.4567 $0.4771 $0.4636 $0.6176 $0.5576 $0.6559 $0.7141 $0.8325 $0.4428 $0.5224 $0.5272 Gross sales margin $0.2953 $0.2710 $0.3194 $0.2587 $0.2941 $0.2903 $0.2762 $0.3325 $0.3031 $0.2853 $0.2837 $0.3116 Total production costs1 $0.4755 $0.5465 $0.5730 $0.4667 $0.6061 $0.6271 $0.6527 $0.7891 $0.8334 $0.4920 $0.5892 $0.6087 Storage & LNG 0.0044 0.0060 0.0059 0.0014 0.0019 0.0016 0.0123 0.0162 0.0023 0.0045 0.0064 0.0046 Transmission 0.0054 0.0083 0.0089 0.0077 0.0105 0.0054 0.0041 0.0010 0.0018 0.0058 0.0079 0.0075 Distribution 0.0417 0.0352 0.0437 0.0341 0.0409 0.0374 0.0482 0.0495 0.0552 0.0407 0.0382 0.0434 Customer accounts 0.0271 0.0263 0.0309 0.0248 0.0270 0.0271 0.0364 0.0327 0.0348 0.0276 0.0273 0.0304 Customer svc. & info. 0.0017 0.0022 0.0039 0.0074 0.0070 0.0092 0.0133 0.0116 0.0088 0.0042 0.0044 0.0055 Sales 0.0030 0.0024 0.0030 0.0025 0.0031 0.0031 0.0009 0.0012 0.0010 0.0026 0.0024 0.0028 Admin. & general 0.0582 0.0536 0.0624 0.0435 0.0541 0.0458 0.0613 0.0426 0.0694 0.0553 0.0523 0.0595 Total O&M 0.6005 0.6913 0.7316 0.5879 0.7507 0.7567 0.8292 0.9440 1.0066 0.6217 0.7353 0.7624 PERCENT OF REVENUE Gas-only revenues 100.0% 100.0% 100.0% 100.0% 100.0% 100.0% 100.0% 100.0% 100.0% 100.0% 100.0% 100.0% Purchased-gas expense 52.3% 53.9% 53.5% 63.9% 72.2% 60.8% 70.6% 63.7% 73.3% 57.0% 59.1% 57.3% Gross sales margin 38.3% 32.0% 35.8% 35.7% 34.4% 31.6% 29.7% 29.6% 26.7% 36.7% 32.1% 33.9% Total production costs1 61.7% 64.4% 64.2% 64.3% 70.8% 68.4% 70.3% 70.4% 73.3% 63.3% 66.7% 66.1% Storage & LNG 0.6% 0.7% 0.7% 0.2% 0.2% 0.2% 1.3% 1.4% 0.2% 0.6% 0.7% 0.5% Transmission 0.7% 1.0% 1.0% 1.1% 1.2% 0.6% 0.4% 0.1% 0.2% 0.7% 0.9% 0.8% Distribution 5.4% 4.2% 4.9% 4.7% 4.8% 4.1% 5.2% 4.4% 4.9% 5.2% 4.3% 4.7% Customer accounts 3.5% 3.1% 3.5% 3.4% 3.2% 3.0% 3.9% 2.9% 3.1% 3.6% 3.1% 3.3% Customer svc. & info. 0.2% 0.3% 0.4% 1.0% 0.8% 1.0% 1.4% 1.0% 0.8% 0.5% 0.5% 0.6% Sales 0.4% 0.3% 0.3% 0.3% 0.4% 0.3% 0.1% 0.1% 0.1% 0.3% 0.3% 0.3% Admin. & general 7.5% 6.3% 7.0% 6.0% 6.3% 5.0% 6.6% 3.8% 6.1% 7.1% 5.9% 6.5% Total O&M 77.9% 81.5% 82.0% 81.1% 87.7% 82.5% 89.3% 84.2% 88.6% 80.0% 83.2% 82.8% VALUES PER CUSTOMER Gas-only revenues $ 1,394 $ 1,569 $ 1,560 $ 1,218 $ 1,480 $ 1,492 $ 1,430 $ 1,661 $ 1,453 $ 1,359 $ 1,562 $ 1,535 Purchased-gas expense $ 742 $ 863 $ 819 $ 794 $ 1,037 $ 891 $ 1,021 $ 1,051 $ 1,071 $ 783 $ 923 $ 858 Gross sales margin $ 498 $ 512 $ 515 $ 418 $ 465 $ 470 $ 411 $ 473 $ 381 $ 471 $ 498 $ 493 Total production costs1 $ 896 $ 1,057 $ 1,044 $ 800 $ 1,015 $ 1,022 $ 1,019 $ 1,188 $ 1,072 $ 888 $ 1,064 $ 1,042 Storage & LNG $ 9 $ 10 $ 9 $ 2 $ 3 $ 3 $ 21 $ 29 $ 3 $ 9 $ 11 $ 7 Transmission $ 9 $ 12 $ 13 $ 7 $ 10 $ 9 $ 5 $ 1 $ 2 $ 8 $ 10 $ 11 Distribution $ 67 $ 64 $ 67 $ 56 $ 67 $ 58 $ 76 $ 72 $ 70 $ 66 $ 66 $ 65 Customer accounts $ 46 $ 50 $ 48 $ 41 $ 44 $ 47 $ 50 $ 45 $ 43 $ 45 $ 48 $ 47 Customer svc. & info. $ 4 $ 5 $ 6 $ 11 $ 9 $ 14 $ 21 $ 18 $ 11 $ 7 $ 8 $ 8 Sales $ 5 $ 5 $ 5 $ 3 $ 4 $ 4 $ 1 $ 1 $ 1 $ 4 $ 4 $ 5 Admin. & general $ 100 $ 102 $ 106 $ 73 $ 87 $ 76 $ 86 $ 61 $ 86 $ 93 $ 94 $ 98 Total O&M $ 1,135 $ 1,305 $ 1,299 $ 995 $ 1,239 $ 1,232 $ 1,279 $ 1,416 $ 1,290 $ 1,119 $ 1,305 $ 1,284
1/ Purchased cost expense is subsumed within total production costs. NOTE: Figures may not add precisely due to independent rounding.

APPENDIX 5: WAGES & BENEFITS 2006 Data, 65 Utilities Reporting
Gas Utilities Combination Utilities Municipal Utilities All Companies 45firms 14 firms 6 firms 65 firms
LQ MED UQ AVG. LQ MED UQ AVG. LQ MED UQ AVG. LQ MED UQ AVG.
Average number of employees
215
545
1,380
900
214
692
1,465
1,268
192
332
656
578
211
560
1,370
940
Number of Employees at year-end
236
599
1,362
903
234
660
1,427
1,241
191
330
649
572
221
599
1,344
937 O&M wages ('000) $9,641 $36,364 $73,311 $46,370 $9,714 $35,147 $75,040 $66,324 $22,137 $23,714 $31,626 $36,641 $9,893 $35,147 $73,188 $49,448 Construction wages ('000) $1,058 $5,662 $14,172 $10,701 $4,779 $18,052 $25,599 $21,392 $0 $2,745 $3,802 $2,492 $1,277 $5,861 $17,460 $12,108 Total pensions ('000) $523 $9,063 $26,895 $17,220 $7,166 $16,573 $24,704 $26,009 $6,836 $9,402 $17,793 $13,552 $2,262 $10,581 $26,865 $18,626 PER YEAR END EMPLOYEE: Total salary & wages $53,272 $63,130 $73,993 $68,764 $58,899 $76,076 $83,644 $73,266 $56,041 $57,364 $59,743 $66,681 $53,333 $63,312 $79,567 $69,479 Tot. benefits & pension $11,080 $19,407 $26,575 $17,883 $15,059 $24,998 $31,264 $24,092 $18,115 $21,176 $24,816 $22,475 $14,013 $20,199 $27,053 $19,481 Total salary, benefits, and pension $67,085 $83,897 $101,505 $86,647 $82,602 $99,753 $112,532 $97,358 $77,216 $77,858 $82,180 $89,156 $68,698 $84,468 $105,245 $88,960 Ratio: avg. benefits to avg. compensation 15% 23% 27% 22% 20% 25% 27% 26% 23% 27% 32% 31% 18% 24% 28% 23% Therms delivered per year-end employee
923,115
1,141,601
1,589,292
1,276,154
1,119,353
1,381,732
1,569,954
1,454,451
539,368
586,256
632,115
616,088
713,703
1,141,601
1,579,409
1,246,786
Customers per year-end employee
489
628
829
664
551
804
1,038
818
408
450
458
481
449
628
840
676
NOTE: Some ratios are not always normally distributed. Therefore, average ratio values may be subject to distortion by a few observations that are outliers. Key: LQ = Lower Quartile, MED = Median, UQ = Upper Quartile, AVG = Average

APPENDIX 6: GAS UTILITY FINANCIAL PERFORMANCE Based on Segment Medians Gas Utilities Combination Utilities Municipal Utilities All Companies 2004 2005 2006 2004 2005 2006 2004 2005 2006 2004 2005 2006Asset Turnover 0.69X 0.71X 0.75X 0.39X 0.41X 0.41X 0.43X 0.47X 0.46X 0.57X 0.62X 0.57XFinancial Leverage 65.8% 69.9% 67.1% 70.1% 70.8% 69.8% 51.7% 46.1% 45.3% 66.1% 68.8% 67.7%Debt/Equity Ratio 68.2% 70.7% 78.9% 102.3% 106.9% 110.4% 76.4% 79.6% 73.1% 79.7% 81.9% 84.0%Equity Multiplier 2.97 3.22 3.12 3.37 3.66 3.33 2.13 2.24 2.19 2.99 3.19 3.15 Profit Margin 4.1% 3.5% 3.4% 5.9% 5.7% 6.1% 3.9% 5.4% 5.0% 4.3% 4.7% 4.0% ROA 2.8% 2.5% 2.5% 2.9% 2.9% 2.7% 1.3% 2.9% 1.9% 2.7% 2.8% 2.5%ROE 8.8% 8.2% 7.8% 8.7% 9.5% 8.4% 3.2% 5.1% 3.4% 8.2% 8.2% 8.1% Current Ratio 0.94 0.96 0.82 1.06 1.16 1.00 2.01 2.99 2.75 1.00 1.02 0.92 Current Assets/Total Assets 20.7% 24.3% 19.0% 11.7% 13.7% 11.6% 25.0% 25.5% 23.7% 18.7% 23.5% 18.0% Based on Segment Averages Gas Utilities Combination Utilities Municipal Utilities All Companies 2004 2005 2006 2004 2005 2006 2004 2005 2006 2004 2005 2006Asset Turnover 0.71X 0.71X 0.73X 0.42X 0.46X 0.44X 0.43X 0.45X 0.43X 0.62X 0.62X 0.64XFinancial Leverage 61.5% 67.6% 65.1% 69.1% 70.3% 69.4% 47.1% 46.4% 48.1% 61.5% 67.6% 65.1%Debt/Equity Ratio 74.3% 85.4% 82.6% 126.2% 127.8% 114.5% 119.1% 121.0% 123.2% 90.4% 99.3% 92.9%Equity Multiplier 3.01 3.50 3.21 3.71 3.93 3.51 2.60 2.71 2.68 3.12 3.50 3.22 Profit Margin 6.2% 4.9% 4.6% 8.3% 5.1% 5.8% 3.7% 7.6% 2.1% 6.4% 5.3% 4.6% ROA 3.1% 2.4% 2.2% 3.3% 2.5% 2.4% 1.7% 2.7% 1.4% 3.0% 2.5% 2.2%ROE 8.3% 7.0% 5.9% 9.0% 9.1% 8.1% 3.0% 4.6% 4.8% 7.9% 7.2% 6.2% Current Ratio 1.06 1.02 0.93 1.34 1.22 1.11 2.57 2.60 2.73 1.28 1.26 1.14 Current Assets/Total Assets 23.2% 26.6% 20.4% 12.9% 16.3% 11.8% 24.4% 25.3% 25.2% 21.0% 24.2% 19.1%

APPENDIX 7a: GAS UTILITY INCOME STATEMENTS Based on Segment Averages
GAS-ONLY INCOME STATEMENT - Per Annual Therm Delivered Gas Utilities Combination Utilities Municipal Utilities All Companies 2004 2005 2006 2004 2005 2006 2004 2005 2006 2004 2005 2006 Operating revenue $ 0.7709 $ 0.8479 $ 0.8925 $ 0.7254 $ 0.8560 $ 0.9173 $ 0.9290 $ 1.1216 $ 1.1365 $ 0.7773 $ 0.8835 $ 0.9203 Operating expense $ 0.6005 $ 0.6747 $ 0.7139 $ 0.5745 $ 0.6969 $ 0.7404 $ 0.8031 $ 0.9188 $ 0.9861 $ 0.6158 $ 0.7096 $ 0.7447 Maintenance expense $ 0.0164 $ 0.0167 $ 0.0177 $ 0.0134 $ 0.0151 $ 0.0164 $ 0.0261 $ 0.0252 $ 0.0204 $ 0.0168 $ 0.0174 $ 0.0177 Total O&M $ 0.6170 $ 0.6913 $ 0.7316 $ 0.5879 $ 0.7120 $ 0.7567 $ 0.8292 $ 0.9440 $ 1.0066 $ 0.6326 $ 0.7270 $ 0.7624 Depreciation $ 0.0393 $ 0.0388 $ 0.0433 $ 0.0372 $ 0.0397 $ 0.0390 $ 0.0375 $ 0.0418 $ 0.0453 $ 0.0386 $ 0.0394 $ 0.0425 Depletion $ 0.0002 $ 0.0002 $ 0.0002 $ 0.0007 $ 0.0005 $ 0.0008 $ - $ - $ - $ 0.0003 $ 0.0003 $ 0.0003 Amortization $ 0.0013 $ 0.0024 $ 0.0029 $ 0.0022 $ 0.0033 $ 0.0048 $ 0.0009 $ 0.0000 $ - $ 0.0015 $ 0.0023 $ 0.0030 Prop. loss charged to operations
$ 0.0000 $ 0.0001 $ 0.0001 $ 0.0003 $ - $ 0.0004 $ - $ - $ - $ 0.0001 $ 0.0001 $ 0.0001
Total taxes $ 0.0514 $ 0.0522 $ 0.0494 $ 0.0387 $ 0.0423 $ 0.0517 $ 0.0168 $ 0.0171 $ 0.0198 $ 0.0450 $ 0.0457 $ 0.0471 Other operating income $ 0.0001 $ (0.0017) $ (0.0002) $ 0.0007 $ (0.0000) $ (0.0011) $ 0.0022 $ 0.0005 $ 0.0033 $ 0.0005 $ (0.0010) $ (0.0001) Total operating income $ 0.0616 $ 0.0629 $ 0.0650 $ 0.0584 $ 0.0582 $ 0.0640 $ 0.0446 $ 0.1188 $ 0.0648 $ 0.0592 $ 0.0687 $ 0.0648 NOTE: "$0.0000" indicates a value which, on a per-therm basis, is too small to be expressed within four significant digits. GAS-ONLY INCOME STATEMENT - Per Average Customer Served Gas Utilities Combination Utilities Municipal Utilities All Companies 2004 2005 2006 2004 2005 2006 2004 2005 2006 2004 2005 2006 Operating revenue $ 1,394 $ 1,569 $ 1,560 $ 1,218 $ 1,441 $ 1,492 $ 1,430 $ 1,661 $ 1,453 $ 1,359 $ 1,552 $ 1,535 Operating expense $ 1,109 $ 1,277 $ 1,271 $ 973 $ 1,173 $ 1,207 $ 1,239 $ 1,378 $ 1,264 $ 1,092 $ 1,267 $ 1,257 Maintenance expense $ 27 $ 28 $ 27 $ 22 $ 25 $ 26 $ 41 $ 38 $ 26 $ 27 $ 28 $ 27 Total O&M $ 1,135 $ 1,305 $ 1,299 $ 995 $ 1,198 $ 1,232 $ 1,279 $ 1,416 $ 1,290 $ 1,119 $ 1,295 $ 1,284 Depreciation $ 67 $ 66 $ 69 $ 62 $ 66 $ 62 $ 56 $ 59 $ 58 $ 65 $ 65 $ 66 Depletion $ 0 $ 0 $ 0 $ 1 $ 0 $ 1 $ - $ - $ - $ 0 $ 0 $ 1 Amortization $ 4 $ 4 $ 5 $ 4 $ 5 $ 9 $ 1 $ 0 $ - $ 3 $ 4 $ 6 Prop. loss charged to operations
$ 0 $ 0 $ 0 $ 1 $ - $ 1 $ - $ - $ - $ 0 $ 0 $ 0
Total taxes $ 86 $ 88 $ 80 $ 66 $ 68 $ 80 $ 27 $ 27 $ 26 $ 75 $ 76 $ 75 Other operating income $ 0 $ (3) $ (1) $ 1 $ (0) $ (0) $ 3 $ 1 $ 4 $ 1 $ (2) $ (1) Total operating income $ 102 $ 105 $ 106 $ 91 $ 104 $ 106 $ 66 $ 159 $ 79 $ 96 $ 112 $ 104

APPENDIX 7a: GAS UTILITY INCOME STATEMENTS – Per Cost Driver (cont’d) Based on Segment Averages
GAS-ONLY INCOME STATEMENT - Per Dollar of Gas Plant Gas Utilities Combination Utilities Municipal Utilities All Companies 2004 2005 2006 2004 2005 2006 2004 2005 2006 2004 2005 2006 Operating revenue $ 0.6645 $ 0.7222 $ 0.6834 $ 0.6352 $ 0.7318 $ 0.7544 $ 0.7371 $ 0.8398 $ 0.7481 $ 0.6656 $ 0.7391 $ 0.7047 Operating expense $ 0.5373 $ 0.5942 $ 0.5627 $ 0.5134 $ 0.5990 $ 0.6115 $ 0.6518 $ 0.6765 $ 0.6579 $ 0.5440 $ 0.6055 $ 0.5820 Maintenance expense $ 0.0124 $ 0.0124 $ 0.0122 $ 0.0109 $ 0.0120 $ 0.0114 $ 0.0196 $ 0.0186 $ 0.0141 $ 0.0128 $ 0.0131 $ 0.0122 Total O&M $ 0.5497 $ 0.6065 $ 0.5749 $ 0.5243 $ 0.6110 $ 0.6229 $ 0.6714 $ 0.6951 $ 0.6720 $ 0.5567 $ 0.6186 $ 0.5942 Depreciation $ 0.0303 $ 0.0296 $ 0.0294 $ 0.0324 $ 0.0337 $ 0.0287 $ 0.0266 $ 0.0271 $ 0.0271 $ 0.0304 $ 0.0302 $ 0.0290 Depletion $ 0.0002 $ 0.0002 $ 0.0002 $ 0.0005 $ 0.0003 $ 0.0006 $ - $ - $ - $ 0.0002 $ 0.0002 $ 0.0002 Amortization $ 0.0015 $ 0.0016 $ 0.0021 $ 0.0017 $ 0.0024 $ 0.0084 $ 0.0003 $ 0.0000 $ - $ 0.0014 $ 0.0016 $ 0.0033 Prop. loss charged to operations
$ 0.0000 $ 0.0000 $ 0.0000 $ 0.0003 $ - $ 0.0003 $ - $ - $ - $ 0.0001 $ 0.0000 $ 0.0001
Total taxes $ 0.0398 $ 0.0401 $ 0.0351 $ 0.0328 $ 0.0335 $ 0.0402 $ 0.0125 $ 0.0124 $ 0.0133 $ 0.0354 $ 0.0352 $ 0.0342 Other operating income $ 0.0002 $ (0.0008) $ (0.0007) $ 0.0008 $ (0.0000) $ 0.0031 $ 0.0018 $ 0.0005 $ 0.0017 $ 0.0005 $ (0.0005) $ 0.0003 Total operating income $ 0.0430 $ 0.0441 $ 0.0417 $ 0.0433 $ 0.0509 $ 0.0533 $ 0.0263 $ 0.1051 $ 0.0357 $ 0.0413 $ 0.0533 $ 0.0436 NOTE: "$0.0000" indicates a value which, on a per $gas plant basis, is too small to be expressed within four significant digits. GAS-ONLY INCOME STATEMENT - Per Mile of Distribution Pipe Gas Utilities Combination Utilities Municipal Utilities All Companies 2004 2005 2006 2004 2005 2006 2004 2005 2006 2004 2005 2006 Operating revenue $ 85,099 $ 109,015 $100,146 $ 76,882 $ 104,098 $ 88,404 $100,343 $ 112,192 $ 111,728 $ 84,866 $ 108,379 $ 98,640 Operating expense $ 66,365 $ 87,738 $ 80,938 $ 61,070 $ 85,589 $ 71,538 $ 86,733 $ 92,569 $ 95,129 $ 67,325 $ 87,896 $ 80,201 Maintenance expense $ 1,686 $ 1,989 $ 1,797 $ 1,395 $ 1,804 $ 1,573 $ 3,326 $ 2,730 $ 2,276 $ 1,793 $ 2,044 $ 1,793 Total O&M $ 68,051 $ 89,727 $ 82,735 $ 62,464 $ 87,393 $ 73,110 $ 90,059 $ 95,298 $ 97,405 $ 69,118 $ 89,940 $ 81,993 Depreciation $ 4,054 $ 4,493 $ 4,065 $ 3,845 $ 4,555 $ 3,857 $ 3,825 $ 3,878 $ 4,083 $ 3,983 $ 4,428 $ 4,021 Depletion $ 73 $ 74 $ 68 $ 75 $ 65 $ 96 $ - $ - $ - $ 66 $ 63 $ 68 Amortization $ 258 $ 270 $ 391 $ 229 $ 195 $ 411 $ 171 $ 0 $ - $ 242 $ 220 $ 359 Prop. loss charged to operations
$ 5 $ 13 $ 14 $ 58 $ - $ 67 $ - $ - $ - $ 16 $ 9 $ 25
Total taxes $ 6,069 $ 6,841 $ 5,953 $ 4,125 $ 4,768 $ 4,540 $ 1,666 $ 1,659 $ 1,644 $ 5,171 $ 5,746 $ 5,229 Other operating income $ 12 $ (235) $ (66) $ 60 $ (1) $ (212) $ 300 $ 53 $ 559 $ 53 $ (149) $ (39) Total operating income $ 6,590 $ 7,596 $ 6,918 $ 6,084 $ 7,121 $ 6,324 $ 4,622 $ 11,356 $ 8,596 $ 6,270 $ 7,972 $ 6,946

APPENDIX 7b: GAS UTILITY FINANCIAL RATIOS Based on Segment Averages
Stratified by Type of Company Gas Utilities Combination Utilities Municipal Utilities All Companies 2004 2005 2006 2004 2005 2006 2004 2005 2006 2004 2005 2006 Therms delivered (avg.) per acct. 2,093 2,110 1,988 1,791 1,966 1,831 1,577 1,493 1,286 1,972 2,003 1,889 Therms per $1,000 of gas plant 1,028 1,029 902 982 1,065 1,104 860 783 697 1,000 1,007 927 Value of gas plant per customer $ 2,241 $ 2,258 $ 2,417 $ 1,971 $ 2,041 $ 2,146 $ 2,093 $ 2,128 $ 2,113 $ 2,166 $ 2,195 $ 2,330 %Sales firm (not interruptible) 90% 90% 89% 98% 97% 98% 82% 83% 85% 91% 91% 91% Collection period (days) 1/ 37.1 47.2 36.3 28.6 31.8 27.8 40.4 39.7 33.5 35.5 42.9 34.2 Gas O&M expense as pct. of revenue 81% 82% 83% 82% 83% 82% 90% 83% 89% 82% 83% 83% Gas oper. income as pct. of revenue 7% 7% 7% 7% 7% 7% 4% 12% 5% 7% 8% 7% Gas operating revenue per customer $ 1,394 $ 1,569 $ 1,560 $ 1,218 $ 1,441 $ 1,492 $ 1,430 $ 1,661 $ 1,453 $ 1,359 $ 1,552 $ 1,535 Gas O&M expense per customer $ 1,135 $ 1,305 $ 1,299 $ 995 $ 1,198 $ 1,232 $ 1,279 $ 1,416 $ 1,290 $ 1,119 $ 1,295 $ 1,284 Gas operating income per customer $ 102 $ 105 $ 106 $ 91 $ 104 $ 106 $ 66 $ 159 $ 79 $ 96 $ 112 $ 104 Gas revenue per dollar of gas plant $ 0.6645 $ 0.7222 $ 0.6834 $ 0.6352 $ 0.7318 $ 0.7544 $ 0.7371 $ 0.8398 $ 0.7481 $ 0.6656 $ 0.7391 $ 0.7047 Gas O&M expense per $ of gas plant $ 0.5497 $ 0.6065 $ 0.5749 $ 0.5243 $ 0.6110 $ 0.6229 $ 0.6714 $ 0.6951 $ 0.6720 $ 0.5567 $ 0.6186 $ 0.5942 Gas oper. income per $ of gas plant $ 0.0430 $ 0.0441 $ 0.0417 $ 0.0433 $ 0.0509 $ 0.0533 $ 0.0263 $ 0.1051 $ 0.0357 $ 0.0413 $ 0.0533 $ 0.0436 Gas revenue per mile of pipe 2/ $ 85,099 $ 109,015 $100,146 $ 76,882 $ 104,098 $ 88,404 $100,343 $ 112,192 $ 111,728 $ 84,866 $ 108,379 $ 98,640 Gas O&M expense per mile of pipe 2/ $ 68,051 $ 89,727 $ 82,735 $ 62,464 $ 87,393 $ 73,110 $ 90,059 $ 95,298 $ 97,405 $ 69,118 $ 89,940 $ 81,993 Gas oper. income per mile of pipe 2/ $ 6,590 $ 7,596 $ 6,918 $ 6,084 $ 7,121 $ 6,324 $ 4,622 $ 11,356 $ 8,596 $ 6,270 $ 7,972 $ 6,946 LT debt - total assets ratio 1/ 22.2% 22.5% 23.2% 33.1% 31.3% 33.0% 33.2% 33.2% 36.3% 25.8% 25.8% 26.5% LT debt - total capitalization ratio 1/3/ 37.0% 40.1% 40.9% 52.5% 52.6% 52.9% 39.1% 40.2% 43.2% 40.7% 42.9% 43.7% Net interest - long-term debt ratio 1/ 8.1% 8.6% 9.7% 6.9% 6.9% 6.6% 5.3% 4.4% 4.3% 7.5% 7.7% 8.5% EBITDA interest coverage 1/ 8.6x 8.9x 5.9x 5.9x 5.8x 5.5x 5.0x 5.8x 6.1x 7.6x 7.9x 5.8x Return on assets 3.1% 2.4% 2.2% 3.3% 3.1% 2.4% 1.7% 2.7% 1.4% 3.0% 2.6% 2.2% 1/ Figures for combination utilities are necessarily based on combined gas and electric operations. 2/ Miles of distribution pipes and services combined. Starting in 2004, services are excluded from the pipe calculation 3/ Total capitalization figure in this display includes preferred stock. NOTE: Some ratios are not always normally distributed. Therefore, average ratio values may be subject to distortion by a few observations that are outliers.

APPENDIX 8: GAS UTILITY WAGES AND BENEFITS Based on Segment Averages
Stratified by Type of Company Gas Utilities Combination Utilities Municipal Utilities All Companies
2004 2005 2006 2004 2005 2006 2004 2005 2006 2004 2005 2006 Average number of employees 759 826 900 973 1,084 1,268 435 425 578 773 829 940 Number of Employees at year-end 785 843 903 995 1,099 1,241 459 457 572 797 848 937 O&M wages ('000) $36,226 $41,633 $46,370 $48,164 $58,656 $66,324 $23,262 $21,756 $36,641 $37,515 $42,695 $49,448 Construction wages ('000) $8,478 $9,716 $10,701 $15,815 $16,177 $21,392 $1,303 $2,159 $2,492 $9,352 $10,117 $12,108 Total pensions ('000) $12,053 $14,095 $17,220 $14,759 $19,543 $26,009 $8,185 $8,024 $13,552 $12,249 $14,471 $18,626 PER EMPLOYEE(1/): Total salary & wages $60,774 $64,565 $68,764 $64,524 $64,099 $73,266 $54,362 $52,170 $66,681 $60,892 $62,854 $69,479 Tot. benefits & pension $15,560 $16,830 $17,883 $17,849 $22,642 $24,092 $14,767 $15,281 $22,475 $15,969 $17,793 $19,481 Total salary, benefits, and pension $76,334 $80,022 $86,647 $82,372 $86,742 $97,358 $69,129 $67,450 $89,156 $76,861 $79,749 $88,960 Ratio: avg. benefits to avg. compensation 20.0% 23.2% 21.6% 22.5% 24.5% 25.7% 25.8% 26.5% 31.4% 21.1% 23.8% 23.2%
Therms sold per year-end employee
1,215,866
1,314,237
1,276,154
1,463,508
1,403,786
1,454,451
779,549
726,518
616,088
1,222,241
1,254,449
1,246,786
Customers per year-end employee
587
639
664
799
650
818
492
526
481
622
627
676
1/ year-end employees

APPENDIX 9: Companies Studied Years Reported Years Reported GAS IOUs 2004 2005 2006 GAS IOUs (cont.) 2004 2005 2006 AGL Resources X X X Southwest Gas Corporation X X X Aquila Networks X X Southwestern Virginia Gas Co. X X X Arkansas Oklahoma Gas Corp X X X Union Oil & Gas Co. X X X Arkansas Western Gas Company X X X Vermont Gas X X X Atmos Energy Corporation X X X Washington Gas Light Company X X X Berkshire Gas Company X X X Yankee Gas Services Company X X X Centerpointe Energy - Minnesota Gas Co X X X Centerpointe Energy - Southern Gas - Arkla X X X Centerpointe Energy - Southern Gas - Entex X X X COMBINATION IOUs 2004 2005 2006 Citizens Gas & Coke Utility X X Ameren Corp. X X X Citizens Gas Fuel Company X Avista Corp X X X City Gas Company - WI X Baltimore Gas & Electric Co. X X X Corning Natural Gas Corp X X X Central Hudson Gas & Electric Corp. X X X Delta Natural Gas Company X X X Consumers Energy X X X Dominion Peoples X X X DTE Energy X Dominion East Ohio Gas Company X X X Florida Public Utilities Company X X X Enstar Natural Gas Company X X X Gainesville Regional Utilities X X X Equitable Resources, Inc. X X X Missouri Public Service X X Gasco, Inc (BHP Gas Co) X Pacific Gas & Electric X X X
Hope Gas, Inc. X X X PECO Energy Company (consolidated) X X X
Illinois Gas Company X X X Public Service Company of Colorado X Indiana Gas Company, Inc. X X X Public Service Enterprises X X Intermountain Gas Company X X X Puget Sound Energy X X X KeySpan Energy Delivery - NYC X X X Southern Indiana Gas & Elec Co X X X KeySpan Energy Delivery New England X X X St. Joseph Light & Power X X KeySpan Gas East - LILCO X X X UGI Utilities, Inc. X X X Laclede Gas Company X X X WE Energies X X X Michigan Consolidated Gas Co X X Michigan Gas Utilities X X Mobile Gas Service Corporation X X X Mountaineer Gas X National Fuel Gas Company X X X MUNICIPALS 2004 2005 2006 New Jersey Natural Gas Company X X X Colorado Springs Utilities X X X Nicor Gas And Sub Companies X X X Knoxville Utilities Board X X X North Shore Gas Company X X X Memphis Light, Gas & Water Div X X X Northern Indiana Fuel And Light X X Metropolitan Util Dist-Omaha X X X Northwest Natural Gas Company X X X Middle Tenn Nat Gas Util Dist X X X NSTAR Gas X X X Owatonna Public Utilities X X Ohio Gas Company X X X Philadelphia Gas Works X X X Ohio Valley Gas Corporation X Richmond Dept. of Pub. Util., City of X X Ohio Valley Gas Inc. X San Antonio Public Service Board X Oklahoma Natural Gas X X X Peoples Gas Light & Coke Company X X X Peoples Gas System, Inc. X X X Peoples Natural Gas Company (Omaha) X Piedmont Natural Gas Company X X X Questar Gas Company X X X Semco Energy (S.E. Michigan) X X X


![arXiv:2005.12873v3 [cs.DC] 7 Jun 2020processing benchmarks [12]. They studied about distributed and parallel benchmarks for graph analyzers, graph database benchmarks, benchmarks for](https://static.fdocuments.us/doc/165x107/60c4e778df2cd14e603091d9/arxiv200512873v3-csdc-7-jun-2020-processing-benchmarks-12-they-studied-about.jpg)