Lecture 4: Benchmarks and Performance...
21
RHK.S96 1 Lecture 4: Benchmarks and Performance Metrics Prof. Randy H. Katz Computer Science 252 Spring 1996
Transcript of Lecture 4: Benchmarks and Performance...
RHK.S96 1
Lecture 4: Benchmarks and Performance Metrics
Prof. Randy H. KatzComputer Science 252
Spring 1996
RHK.S96 2
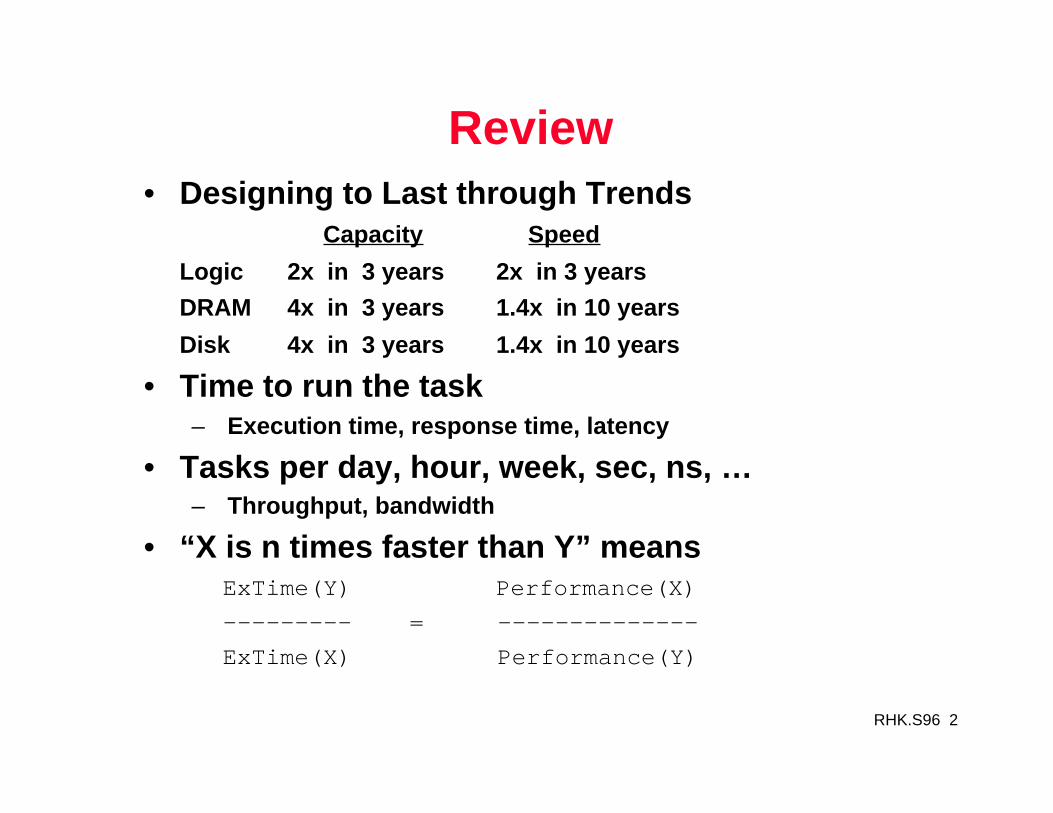
Review• Designing to Last through Trends
Capacity Speed
Logic 2x in 3 years 2x in 3 years
DRAM 4x in 3 years 1.4x in 10 years
Disk 4x in 3 years 1.4x in 10 years
• Time to run the task– Execution time, response time, latency
• Tasks per day, hour, week, sec, ns, …– Throughput, bandwidth
• “X is n times faster than Y” means ExTime(Y) Performance(X)
--------- = --------------
ExTime(X) Performance(Y)

RHK.S96 3
The Danger of Extrapolation
• Process today: 0.5 µm• Limit of optical litho:
0.18 µm
• Power dissipation?• Cost of new fabs?• Alternative
technologies?– GaAs– Optical

RHK.S96 4
Doing Poorly by Doing Well
• Windows 95 drives huge demand for DRAM
• 16 Mbit chips not conveniently packaged for PCs (4 MByte SIMMs vs. 16 MByte SIMMs)
• 4 Mbit-by-4 vs. 1 Mbit-by-16
RHK.S96 5
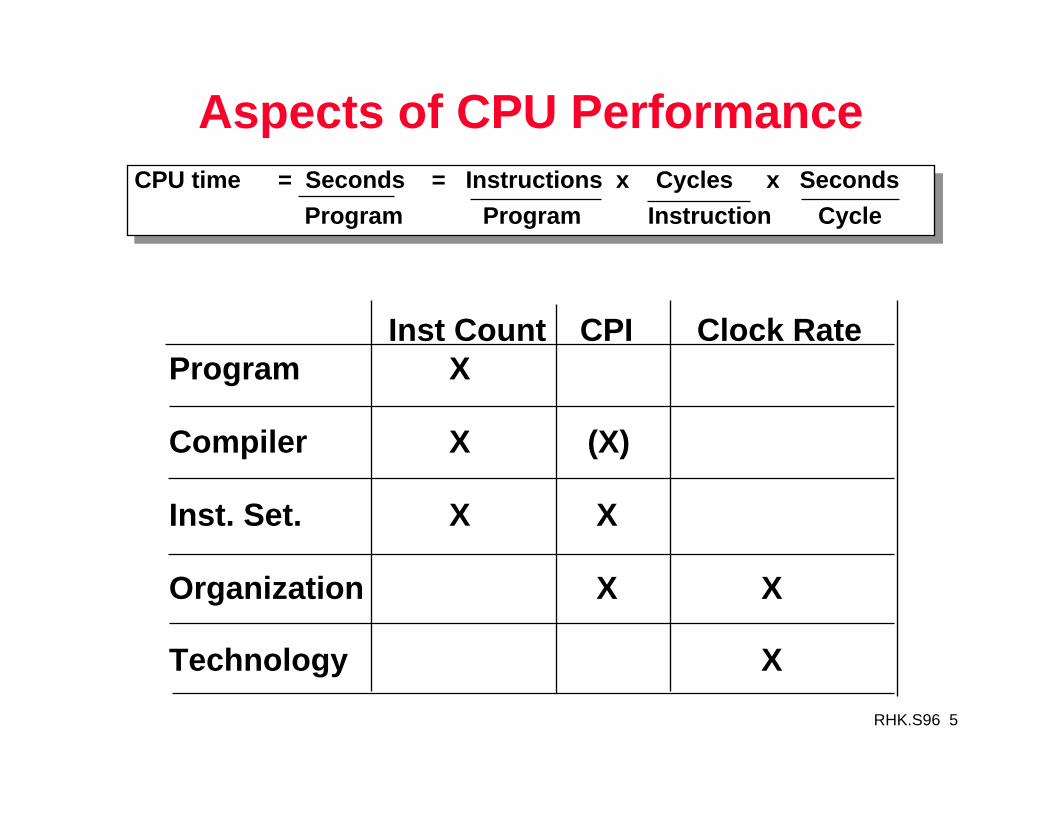
Aspects of CPU PerformanceCPU time = Seconds = Instructions x Cycles x Seconds
Program Program Instruction Cycle
Inst Count CPI Clock RateProgram X
Compiler X (X)
Inst. Set. X X
Organization X X
Technology X

RHK.S96 6
Marketing Metrics
MIPS = Instruction Count / Time * 10^6 = Clock Rate / CPI * 10^6
• Machines with different instruction sets ?
• Programs with different instruction mixes ?
– Dynamic frequency of instructions
• Uncorrelated with performance
MFLOP/s = FP Operations / Time * 10^6
• Machine dependent
• Often not where time is spentNormalized:
add,sub,compare,mult 1
divide, sqrt 4
exp, sin, . . . 8
RHK.S96 7
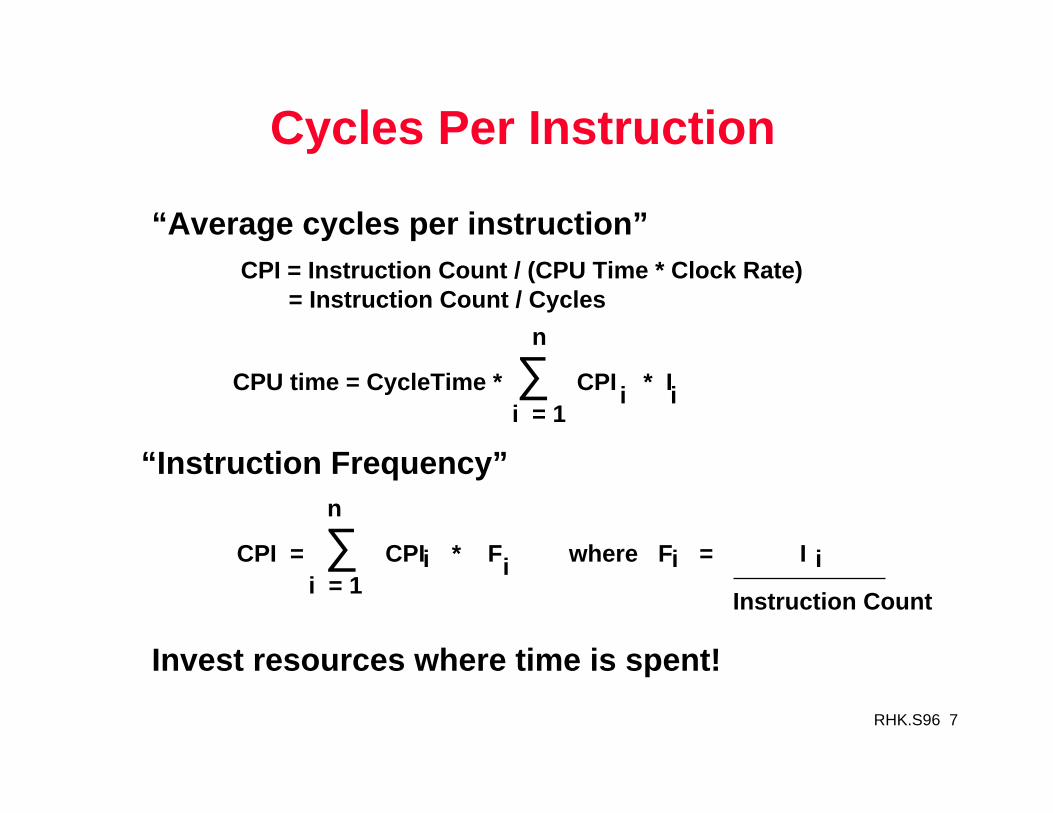
Cycles Per Instruction
CPU time = CycleTime * ∑ CPI * Ii = 1
n
i i
CPI = ∑ CPI * F where F = I i = 1
n
i i i i
Instruction Count
“Instruction Frequency”
Invest resources where time is spent!
CPI = Instruction Count / (CPU Time * Clock Rate)= Instruction Count / Cycles
“Average cycles per instruction”

RHK.S96 8
Example: Calculating CPI
Typical Mix
Base Machine (Reg / Reg)Op Freq Cycles CPI(i) (% Time)ALU 50% 1 .5 (33%)Load 20% 2 .4 (27%)Store 10% 2 .2 (13%)Branch 20% 2 .4 (27%) 1.5

RHK.S96 9
Base Machine (Reg / Reg)Op Freq CyclesALU 50% 1Load 20% 2Store 10% 2Branch 20% 2
Typical Mix
ExampleAdd register / memory operations:
– One source operand in memory– One source operand in register– Cycle count of 2
Branch cycle count to increase to 3.
What fraction of the loads must be eliminated for this to pay off?

RHK.S96 10
Example SolutionExec Time = Instr Cnt x CPI x Clock
Op Freq CyclesALU .50 1 .5Load .20 2 .4Store .10 2 .2Branch .20 2 .3Reg/Mem
1.00 1.5

RHK.S96 11
Example SolutionExec Time = Instr Cnt x CPI x Clock
Op Freq Cycles Freq CyclesALU .50 1 .5 .5 – X 1 .5 – XLoad .20 2 .4 .2 – X 2 .4 – 2XStore .10 2 .2 .1 2 .2Branch .20 2 .3 .2 3 .6Reg/Mem X 2 2X
1.00 1.5 1 – X (1.7 – X)/(1 – X)
CPINew must be normalized to new instruction frequency
CyclesNew
InstructionsNew

RHK.S96 12
Example SolutionExec Time = Instr Cnt x CPI x Clock
Op Freq Cycles Freq CyclesALU .50 1 .5 .5 – X 1 .5 – XLoad .20 2 .4 .2 – X 2 .4 – 2XStore .10 2 .2 .1 2 .2Branch .20 2 .3 .2 3 .6Reg/Mem X 2 2X
1.00 1.5 1 – X (1.7 – X)/(1 – X)
Instr CntOld x CPIOld x ClockOld = Instr CntNew x CPINew x ClockNew
1.00 x 1.5 = (1 – X) x (1.7 – X)/(1 – X)

RHK.S96 13
Example SolutionExec Time = Instr Cnt x CPI x Clock
Op Freq Cycles Freq CyclesALU .50 1 .5 .5 – X 1 .5 – XLoad .20 2 .4 .2 – X 2 .4 – 2XStore .10 2 .2 .1 2 .2Branch .20 2 .3 .2 3 .6Reg/Mem X 2 2X
1.00 1.5 1 – X (1.7 – X)/(1 – X)
Instr CntOld x CPIOld x ClockOld = Instr CntNew x CPINew x ClockNew
1.00 x 1.5 = (1 – X) x (1.7 – X)/(1 – X) 1.5 = 1.7 – X 0.2 = X
ALL loads must be eliminated for this to be a win!
RHK.S96 14
Programs to Evaluate Processor Performance
• (Toy) Benchmarks– 10-100 line program– e.g.: sieve, puzzle, quicksort
• Synthetic Benchmarks– Attempt to match average frequencies of real workloads– e.g., Whetstone, dhrystone
• Kernels– Time critical excerpts of real programs– e.g., Livermore loops
• Real programs– e.g., gcc, spice

RHK.S96 15
Benchmarking Games
• Differing configurations used to run the same workload on two systems
• Compiler wired to optimize the workload• Test specification written to be biased towards one
machine• Synchronized CPU/IO intensive job sequence used• Workload arbitrarily picked• Very small benchmarks used• Benchmarks manually translated to optimize
performance

RHK.S96 16
Common Benchmarking Mistakes
• Only average behavior represented in test workload• Skewness of device demands ignored• Loading level controlled inappropriately• Caching effects ignored• Buffer sizes not appropriate• Inaccuracies due to sampling ignored

RHK.S96 17
Common Benchmarking Mistakes
• Ignoring monitoring overhead• Not validating measurements• Not ensuring same initial conditions• Not measuring transient (cold start) performance• Using device utilizations for performance comparisons• Collecting too much data but doing too little analysis

RHK.S96 18
SPEC: System Performance Evaluation Cooperative
• First Round 1989– 10 programs yielding a single number
• Second Round 1992– SpecInt92 (6 integer programs) and SpecFP92 (14 floating point
programs)» Compiler Flags unlimited. March 93 of DEC 4000 Model 610:spice: unix.c:/def=(sysv,has_bcopy,”bcopy(a,b,c)=
memcpy(b,a,c)”
wave5: /ali=(all,dcom=nat)/ag=a/ur=4/ur=200
nasa7: /norecu/ag=a/ur=4/ur2=200/lc=blas
• Third Round 1995– Single flag setting for all programs; new set of programs
“benchmarks useful for 3 years”

RHK.S96 19
SPEC First Round• One program: 99% of time in single line of code• New front-end compiler could improve dramatically
Benchmark
SPEC P
erf
0
100
200
300
400
500
600
700
800
gcc
epre
sso
spic
e
dodu
c
nasa
7 li
eqnt
ott
matr
ix3
00
fpppp
tom
catv

RHK.S96 20
How to Summarize Performance• Arithmetic mean (weighted arithmetic mean)
tracks execution time: ∑(Ti)/n or ∑(Wi*Ti)• Harmonic mean (weighted harmonic mean) of
rates (e.g., MFLOPS) tracks execution time: n/∑(1/Ri) or n/∑(Wi/Ri)
• Normalized execution time is handy for scaling performance
• But do not take the arithmetic mean of normalized execution time, use the geometric mean (∏(Ri)^1/n)

RHK.S96 21
Performance Evaluation• Given sales is a function of performance relative to
the competition, big investment in improving product as reported by performance summary
• Good products created when have:– Good benchmarks– Good ways to summarize performance
• If benchmarks/summary inadequate, then choose between improving product for real programs vs. improving product to get more sales;Sales almost always wins!
• Ex. time is the measure of computer performance!• What about cost?