2 Test design and test development - OECD.org · 2. test design and test development ...
27
2 PISA 2015 TECHNICAL REPORT © OECD 2017 29 Test design and test development Introduction ............................................................................................................. 30 PISA 2015 integrated design ..................................................................................... 30 Overview of the field trial assessment design......................................................... 35 Overview of the main survey assessment design.................................................... 36 The 2015 assessment frameworks ............................................................................ 43 Role of the subject matter expert groups in item development ............................. 44 PISA 2015 test development ..................................................................................... 44 Field trial ................................................................................................................... 49 Main survey............................................................................................................... 51
Transcript of 2 Test design and test development - OECD.org · 2. test design and test development ...

2
PISA 2015 TECHNICAL REPORT © OECD 2017 29
Test design and test development
Introduction ............................................................................................................. 30
PISA 2015 integrated design ..................................................................................... 30
Overview of the field trial assessment design ......................................................... 35
Overview of the main survey assessment design .................................................... 36
The 2015 assessment frameworks ............................................................................ 43
Role of the subject matter expert groups in item development ............................. 44
PISA 2015 test development ..................................................................................... 44
Field trial ................................................................................................................... 49
Main survey............................................................................................................... 51

2TEST DESIGN AND TEST DEVELOPMENT
30 © OECD 2017 PISA 2015 TECHNICAL REPORT
INTRODUCTIONThis chapter describes the assessment design for PISA 2015 as well as the processes used by the PISA Core 3 contractor, Educational Testing Service (ETS), and the international test development team to develop the tests for the 2015 cycle. Those tests included:
• science, the major domain in 2015
• reading and mathematics, the two minor domains
• collaborative problem solving (CPS), the innovative domain for this cycle
• financial literacy, an international option.
For the 2015 cycle, under the guidance of the PISA Governing Board (PGB), it was decided to move from a primarily paper-based delivery survey that included optional computer-based modules to a fully computer-delivered survey. A paper-based version of the assessment that included only trend units was developed for the small number of countries that did not implement the computer-based survey. The computer-based delivery mode allows PISA to measure new and expanded aspects of the domain constructs. In science, the addition of interactive tasks allowed students to manipulate variables in simulated scientific enquiries. Interactive chat-based tasks with branching based on student responses were used to assess collaborative problem solving.
Equally critical in 2015 was the introduction of an innovative assessment design that emphasised improved trend measurement and enhanced coverage of minor domains. The ability to establish and maintain trends over time is a goal for PISA that has been clearly and repeatedly articulated by the PGB and participating countries. For the first time in 2015, the integrated design for the assessment increased the number of items for the minor domains to previous major domain levels, reducing the potential for introducing systematic measurement error because of reduced domain coverage from one cycle to the next. Due to these changes, the design for PISA 2015 strengthened the measurement of trends, by helping to strengthen construct coverage for the minor domain cycles in PISA. It also reflected an innovative conceptual approach that looked at PISA from a broad perspective and focused on a nine-year survey cycle during which scientific, reading and mathematical literacy would each be assessed as a major domain.
PISA 2015 INTEGRATED DESIGNThe goals for the integrated assessment design in PISA 2015 included:
• improving the measurement of trends over time across the three core PISA domains
• minimising respondent burden while maximising the range of information obtained for each domain assessed
• accurately describing the proficiencies of nationally representative samples of 15-year-olds in each country, including relevant subpopulations
• associating these proficiencies with a range of indicators in policy-relevant areas.
To meet these goals, the design for the assessment included a re-conceptualisation of the assessment of the minor domains that would diminish differences in domain coverage across cycles, a linking study to evaluate and control for potential mode effects when moving from a paper-based to a computer-based assessment, and computer administration as the primary mode of delivery for all core domains.
Among other things, this design increased the number of items, improving construct coverage for the minor domains, which then allowed for a new methodological approach to be employed. More importantly, the methodology implemented in 2015 incorporated all available data from previous cycles, up to the last major domain cycle, for scaling and analysis, providing a solid base for linking across cycles and between paper-based and computer-based administrations for all cognitive scales. This is in contrast to previous cycles where scaling was conducted for each cycle and then equated to previous results through a single transformation. Taken together, these design and methodological innovations served to improve comparability across countries, stabilise parameter estimations and the measurement of trends, and improve the reliability of inferences formed from the data.
Minimising the distinction between major and minor domain coverageAny assessment must contend with two types of errors – random and systematic. Random errors do not result in bias but do increase uncertainty and, therefore, affect only the precision of results. Systematic errors, on the other hand, introduce bias, especially in the measurement of trends, and are less desirable because their direction is unknown and not easily
2TEST DESIGN AND TEST DEVELOPMENT
PISA 2015 TECHNICAL REPORT © OECD 2017 31
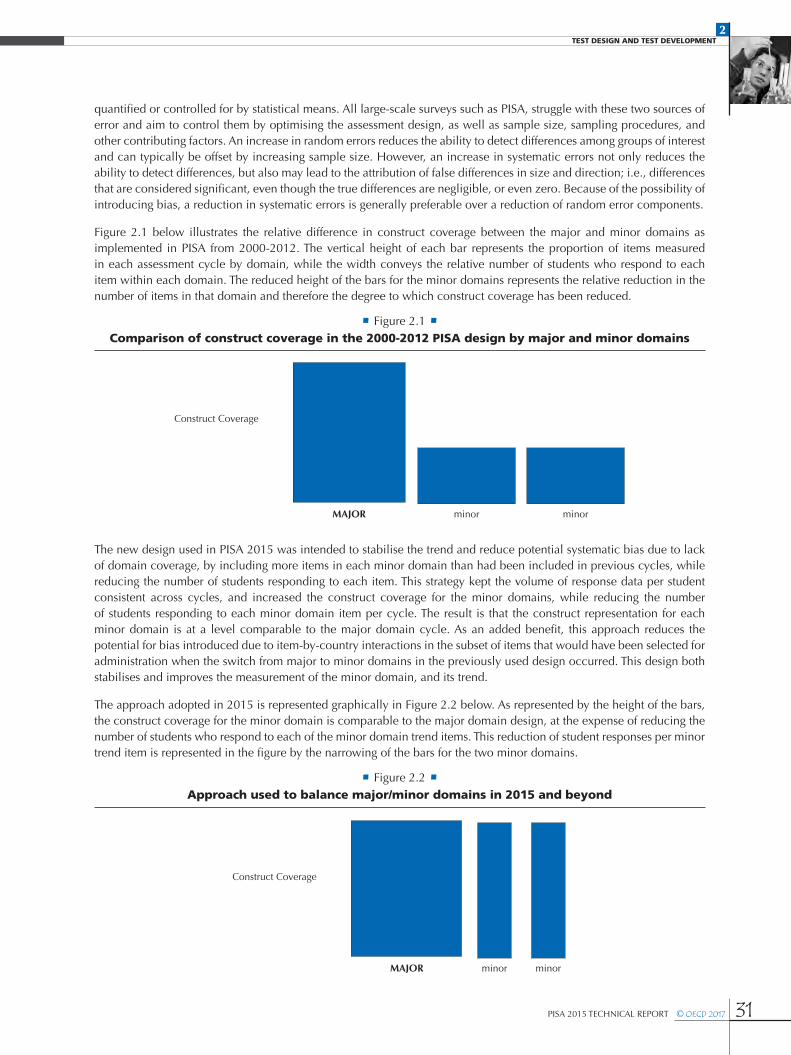
quantified or controlled for by statistical means. All large-scale surveys such as PISA, struggle with these two sources of error and aim to control them by optimising the assessment design, as well as sample size, sampling procedures, and other contributing factors. An increase in random errors reduces the ability to detect differences among groups of interest and can typically be offset by increasing sample size. However, an increase in systematic errors not only reduces the ability to detect differences, but also may lead to the attribution of false differences in size and direction; i.e., differences that are considered significant, even though the true differences are negligible, or even zero. Because of the possibility of introducing bias, a reduction in systematic errors is generally preferable over a reduction of random error components.
Figure 2.1 below illustrates the relative difference in construct coverage between the major and minor domains as implemented in PISA from 2000-2012. The vertical height of each bar represents the proportion of items measured in each assessment cycle by domain, while the width conveys the relative number of students who respond to each item within each domain. The reduced height of the bars for the minor domains represents the relative reduction in the number of items in that domain and therefore the degree to which construct coverage has been reduced.
• Figure 2.1 •Comparison of construct coverage in the 2000-2012 PISA design by major and minor domains
Construct Coverage
MAJOR minor minor
The new design used in PISA 2015 was intended to stabilise the trend and reduce potential systematic bias due to lack of domain coverage, by including more items in each minor domain than had been included in previous cycles, while reducing the number of students responding to each item. This strategy kept the volume of response data per student consistent across cycles, and increased the construct coverage for the minor domains, while reducing the number of students responding to each minor domain item per cycle. The result is that the construct representation for each minor domain is at a level comparable to the major domain cycle. As an added benefit, this approach reduces the potential for bias introduced due to item-by-country interactions in the subset of items that would have been selected for administration when the switch from major to minor domains in the previously used design occurred. This design both stabilises and improves the measurement of the minor domain, and its trend.
The approach adopted in 2015 is represented graphically in Figure 2.2 below. As represented by the height of the bars, the construct coverage for the minor domain is comparable to the major domain design, at the expense of reducing the number of students who respond to each of the minor domain trend items. This reduction of student responses per minor trend item is represented in the figure by the narrowing of the bars for the two minor domains.
• Figure 2.2 •Approach used to balance major/minor domains in 2015 and beyond
Construct Coverage
MAJOR minor minor

2TEST DESIGN AND TEST DEVELOPMENT
32 © OECD 2017 PISA 2015 TECHNICAL REPORT
Under this approach for measuring trends, each domain goes through a “domain rotation”, or a nine-year period that begins with a new or revised framework and continues with the two subsequent cycles in which it is a minor domain and then concludes with becoming a major domain once again. The end of the cycle involves another revision of the framework to reflect the current best thinking about assessment for the new major domain data collection. For example, as the major domain in 2015, the domain rotation for scientific literacy includes the 2015, 2018 and 2021 cycles with the next rotation beginning in 2024 when science will again be the major domain, with a newly revised framework. Thinking about designing the assessment in terms of this domain rotation clarifies the specific function of each cycle within that nine-year period, and the importance of maintaining the construct coverage in the minor cycles between two major domain cycles. Over a domain rotation, each major and minor cycle serves a specific function in terms of its contribution to the measurement of trends. Information about item functioning is carried across each domain rotation, with the choice of which items to carry forward being based on the most accurate item parameter estimation (occurring when a construct is measured as a major domain). The set of items that are carried forward in the rotation represents the full construct as covered in the initial major cycle, rather than a subset as in the prior minor domain design. In this way, the notion of a trend is defined both by the full coverage of the construct and by the statistical methodology employed.
To ensure trends are measured over longer periods of time, every time the framework for a major domain is revised – i.e. with the beginning of each domain rotation – a new set of items is developed to reflect the evolution of the construct. For PISA 2015, the revised framework for scientific literacy and the introduction of computer-based items broadened the construct beyond what was measured in 2006, the last time that scientific literacy was a major domain. This means that the PISA 2015 science scale must represent the revised framework while being linked to the existing scale represented by the previous framework through the set of existing trend items.
Linking proficiency scales in this way reduces the risk of introducing systematic errors in trend measures introduced by the new framework and item pool by establishing a point of connection between the backward-looking trend and forward-looking trend. Each updated construct is reflected by items that cover different aspects of the domain. Some items may reflect aspects unique to the old construct, most items will likely reflect aspects that are covered in both the old and revised construct, and there may be newly added items that reflect aspects introduced in the revised framework. This leads to the need to re-evaluate the combined set of items with respect to their relationship to the updated construct. Items that reflect both the old and revised framework will form the core of the combined scale, and items that are unique to either the old or revised framework will strengthen the link of this combined scale, looking backward to the old construct or forward to the new items added based on the revised framework. The generalised modelling framework allows the assignment of optimal weights to the items by re-estimating item parameters in each introductory cycle for the revised major domain. These optimal item weights facilitate the transition of the reported proficiency scale to the revised framework and the combined set of items, hence maintaining a link to prior assessments while transitioning to the new construct. Conceptualising the assessment design in this manner provides regular opportunities to introduce important and innovative ideas into (revised) major assessment domains. It also allows the opportunity to disentangle any changes in proficiency that result from differences in the construct and the way it is being measured.
Improving comparability and stabilising trendsEstablishing comparable and psychometrically sound scales requires design considerations as well as analytical choices that appropriately support this goal. The previous section explained several design innovations implemented to strengthen the comparability of results across countries and over assessment cycles. This section summarises a significant methodological shift that was introduced in 2015. In contrast to previous cycles, where scaling was conducted for each cycle and then equated to previous results through a single transformation, the methodology implemented in 2015 incorporated all available data for scaling and analysis, reaching back to the last introduction of the same domain as major domain, thus providing a solid base for linking across cycles and between paper- and computer-based administrations on all scales.
Equating scales refers to the process of transforming the scale scores of a more recent test onto the scale of a previous test form. Equating methods differ in terms of how they perform this transformation. In the most basic form of equating, a linear transformation is performed so that the main statistical properties of the transformed new test scores match those of the old test form. While there are equating methods for tests scored using classical test theory as well as for modern item response theory (IRT)-based tests, we focus on the latter here. In the context of IRT equating, the item parameters are typically estimated separately for both test forms and subsequently put on the same scale by means of a linear transformation. This approach can be mathematically shown to be inferior to so-called IRT linking that estimates item
2TEST DESIGN AND TEST DEVELOPMENT
PISA 2015 TECHNICAL REPORT © OECD 2017 33
parameters on the combined set of old and new data from the two or more test forms. The IRT linking approach provides a stronger equality constraint across parameters of the cycles to be linked through the items that are common to both test forms, while the linear IRT equating approach does not constrain the IRT model at all, but rather transforms indeterminate scales to match certain distributional moments. The assumptions made about the equality of item parameters can be tested statistically in this approach (e.g. Glas and Jehangir, 2013; Glas and Verhelst, 1995; Oliveri and von Davier, 2014, 2011). The IRT equating approach that only aligns average difficulty may implicitly assume parameter equality but typically does not involve this type of item level evaluation of parameter equality.
From 2000 to 2012, PISA relied on the IRT equating approach in which the anchor items common to the new and previous PISA cycles were used to find the transformation of the new data. This was carried out for each PISA cycle separately, so that over the first five cycles, four different transformations had to be used. This, in effect, produced five different sets of item parameters for those items that were used throughout the 2000-2012 cycles. In contrast, PISA 2015 introduced a comprehensive approach to scale linking in which all available data were combined to anchor the item parameters from the most recent PISA cycle together with data from past cycles. This was achieved by an IRT item calibration that ran across all PISA cycles and found common item parameters that maximised the fit of the IRT model to this comprehensive database. This linking approach utilised a common scale across all available data and represents the most rigorous and stable method of joining scales from different cycles. It preserved the inference structure of the proficiency scale by finding optimal item parameters for all items in the item pool, both for the common items that anchored the scale across cycles as well as items unique to a cycle. This approach generalised the methodologies utilised in other large-scale assessments (Mazzeo and von Davier, 2013) including, for example, the Programme for the International Assessment of Adult Competencies (PIAAC) that was jointly analysed and linked to the Adult Literacy and Life Skills Survey (ALL) and the International Adult Literacy Survey (IALS). The resulting item parameters can be transformed for all scales across all cycles in a way that maximally matches prior statistics for the assessment cycles that have been previously reported.
For illustration purposes, consider the PISA 2015 science domain. All data from 2015, when science was a major domain, were utilised to establish the forward-looking trend for 2018 and 2021. This included both the set of new items developed to represent the revised framework for science as well as the six clusters of trend items that were included in the main survey and for which additional data from 2006, 2009, and 2012 were used to link 2015 back to past cycles. This allowed the linking to have a positive impact on the comparability of results across countries, as one single set of parameters, instead of multiple sets, were used in the approach, and item parameter estimates based on multiple cycles have (after the appropriateness of parameter equality was tested) a smaller standard error. This also has a positive impact on the stability of trend measurements, since the best possible set of common parameters is found using this approach.
Let us for a moment assume that this was not true, that is a separate calibration in each cycle would provide the best possible link. In this case, the same argument would hold across countries within a cycle, so item parameters should be estimated by country, and each set of country-specific item parameters equated by aligning the average difficulty. Such an approach could lead to completely independent item estimates in each country and therefore would be neither appropriate nor acceptable because, for example, it would allow cases in which hard items in one country could be easy items in another. This would make comparisons across countries impossible.
The underlying assumption of linking and aligning scales is that (the vast majority of) items are comparable, and function the same in the sense of measurement invariance assumption (Meredith, 1993; Reise, Widaman and Pugh, 1993). This assumption is the basis for comparisons both across and within cycles across participating countries. If this were not the case, the PISA assessment would potentially measure something different in each country and in each cycle. It is for this reason that a multi-cycle scaling approach is used today by major large-scale assessments, including NAEP, TIMSS, PIRLS and now PISA.1 Statistical modelling that combines multiple databases has a tradition also in other domains such as the analyses of psychological scales or data from patient reported outcomes. As noted by Curran et al. (2008) this type of integrative data analysis (IDA) has various advantages over separate statistical analyses that use post-hoc combination of estimates.
The approach used in PISA 2015 has several advantages. First, it produces more stable item parameter estimates since the item calibration takes place on a much larger database using IDA approaches. This is true both in terms of the item pool that is covering all previously used items in the nine-year cycle, as well as in terms of the sheer number of test takers within countries that contribute to the estimation of the parameters. In addition, the approach produces, with the addition of each cycle, a joint set of parameters that can be used moving forward. The set of parameters established in

2TEST DESIGN AND TEST DEVELOPMENT
34 © OECD 2017 PISA 2015 TECHNICAL REPORT
2015 would be updated by the addition of the new major cycle in 2018 for reading (since new items are added through the renewal of a framework and major assessment domain) and could be kept fixed for the two minor cycles following a major cycle (as no new items are added), for example in science in 2018 and 2021. However, in other large-scale assessments it is common practice to adjust item parameter estimates by the addition of new data, but to keep the data from one or more previous cycles in the re-estimation. This is a basic principle behind statistical learning, either by keeping previously collected data and combining it with new data in the estimation, or by applying prior distribution in Bayesian estimation, which in effect does the same thing. The consistency of the estimated parameters across cycles is much higher under this approach than if item parameters are re-estimated each cycle independently.
Again, the comparison to country-specific scaling may make the point clearer. No consistency across countries would be assumed if item parameters were estimated separately by country and aligned post hoc by matching the means of difficulties. This approach of separate country specific estimation would not produce a link across participating countries; it merely aligns country-level parameters to a common average difficulty. This is an approach that would not be methodologically appropriate as parameters across countries and cycles are highly correlated (Oliveri and von Davier, 2014). Significantly different sets of parameters across countries would indicate a violation of measurement invariance (Meredith, 1993; Meredith and Teresi, 2006; Reise, Widaman and Pugh, 1993), so one central prerequisite of cross-country comparability would be violated. The same reasoning applies directly to the linking across PISA cycles. Therefore, the linking approach chosen for PISA 2015 follows an approach that utilises best practices to ensure measurement invariance through the invariance of item parameters across cycles and across participating countries.
Goals and domain coverageThe design for the PISA 2015 core assessment was developed to provide participating countries with the following information:
• population distributions in science that reflect the new 2015 framework as well as links to the framework and scale developed in 2006
• population distributions in mathematics linked to the 2012 framework and mathematical literacy scale
• population distributions in reading linked to the 2009 framework and reading literacy scale
• population distributions in collaborative problem solving
• pairwise covariance estimates among each of the four domains
• three-way covariance information among the four cognitive domains including the three core PISA domains (reading, mathematics, and science)
• data to link the two modes of delivery: paper-and-pencil and computer-based.
In addition to the four core domains of science, mathematics, reading and collaborative problem solving, the PISA assessment included an optional assessment of financial literacy.
Figure 2.3 shows the number of clusters included in the PISA 2015 field trial and main study to meet the goals and coverage of the core domains assumed in this approach. As shown, all new items for science were developed as computer-based items. The design also included six clusters of trend items in science. There was no new item development for reading and mathematics in 2015, but the existing trend items in these domains were re-authored for the computer and delivered both in paper-and-pencil, and computer modes. Finally, collaborative problem-solving items were designed for administration only on the computer.
• Figure 2.3 •Domain coverage for PISA 2015
DomainNEW (CBA only) TREND (CBA and PBA)
Field trial Main survey Field trial Main survey
Science 12 30-min clusters
6 30-min clusters
6 30-min clusters
6 30-min clusters
Reading 6 30-min clusters
6 30-min clusters
Mathematics 6 30-min clusters
6 30-min clusters
Collaborative problem solving 4 30-min clusters
3 30-min clusters
Note: CBA stands for computer-based assessment and PBA, paper-based assessment.

2TEST DESIGN AND TEST DEVELOPMENT
PISA 2015 TECHNICAL REPORT © OECD 2017 35
Studying mode effects in PISA 2015One of the major goals for PISA 2015 was to ensure that trends could be maintained across paper- and computer-based modes of assessment. To that end, the PISA 2015 field trial included a mode effects study utilising methodologies that were adapted from experience with the OECD PIAAC study. Countries planning to use computer-based delivery in the main survey were required to include a within-school random sample of students taking paper-and-pencil forms in the field trial to test for mode effects and ensure trend measurement relative to performance in previous paper-based cycles.
OVERVIEW OF THE FIELD TRIAL ASSESSMENT DESIGNThe field trial design needed to support several key goals including the evaluation of invariance of item parameters across previous PISA cycles and across the two modes for the 2015 cycle. In addition, initial item parameters needed to be estimated for the new science and collaborative problem-solving items. The computer-based assessment (CBA) included six intact trend clusters from science, reading and mathematics based on the assessment cycle when each was the major domain: 2006 for science, 2009 for reading and 2012 for mathematics. In order to test for mode effects, the design included a set of 18 paper-and-pencil forms covering the domains of reading, mathematics and science.2 These were identical to the set of 18 computer-based test forms that consisted of items adapted and re-authored for computer administration. In addition, there were 12 test forms consisting of the new 2015 science tasks (forms 49-60 as shown below) and 12 new test forms combining those 2015 science items with the new collaborative problem solving tasks (forms 61-72). The schematic design illustrating the set of paper-and-pencil forms along with the set of CBA forms – including the CBA trend, CBA new science and CBA new science plus collaborative problem solving – is shown in Figure 2.4.
Note that, as shown in Figure 2.4, the field trial sample was 78 students in each of the 25 schools within each country. Of these students, 23% were assigned to Group 1 and took the trend test items on paper, 35% were assigned to Group 2 and took the trend test items on computer, and 42% were assigned to Group 3 and took the new science and CPS items on computer. Further sampling requirements for this design are discussed in Chapter 4.
Where:
• PR01-PR06 represent reading clusters in paper (trend)
• PM01-PM06 represent mathematics clusters in paper (trend)
• PS01-PS06 represent science clusters in paper (trend)
• R01-R06 represent reading clusters in computer (trend)
• M01-M06 represent mathematics clusters in computer (trend)
• S01-S06 represent science clusters in computer (trend)
• S07-S18 represent science clusters in computer (new)
• C01-C04 represent collaborative problem-solving clusters in computer (new)
• Subscripts a and b are used to indicate standard (a) and easier (b) clusters, respectively.
Countries opting to deliver the paper-based version of the assessment in the main survey measured student performance with only paper-and-pencil forms in the field trial. Students were randomly assigned one of the 18 paper-and-pencil forms containing the trend items from two of the three core domains for PISA – reading (forms PR01-PR06), mathematics (forms PM01-PM06) and science (forms PS01-PS06).
The findings of the field trial analyses on new and trend material in science, on the innovative domain of collaborative problem solving, and on the mode effect study are reported in Chapter 9.

2TEST DESIGN AND TEST DEVELOPMENT
36 © OECD 2017 PISA 2015 TECHNICAL REPORT
• Figure 2.4 •Field trial computer-based assessment design, with collaborative problem solving
OVERVIEW OF THE MAIN SURVEY ASSESSMENT DESIGNThe assessment design for PISA 2015 was planned so that the total testing time for measuring the four core domains of reading, mathematics, science and collaborative problem solving was two hours for each student. An overview of the flow of the integrated design for the PISA 2015 main survey is provided in Figure 2.5.
• Figure 2.5 •Overview of the PISA 2015 main survey integrated design*
CBA Countries
Cognitive Assessment(120 Min)
Student Questionnaire(Approximately 35 Min)
Financial Literacy(60 Min)
Optional Questionnaires
ICT Familiarity(10 Min)
EducationalCareer
(10 Min)
PBA Countries
Cognitive Assessment(120 Min)
Student Questionnaire(Approximately 30 Min)
Financial Literacy(60 Min)
* Note that while the optional assessment of financial literacy was offered for PBA countries and shown in Figure 2.5, none of the PBA countries in PISA 2015 opted to participate in this component.
2TEST DESIGN AND TEST DEVELOPMENT
PISA 2015 TECHNICAL REPORT © OECD 2017 37
Paper-based integrated design
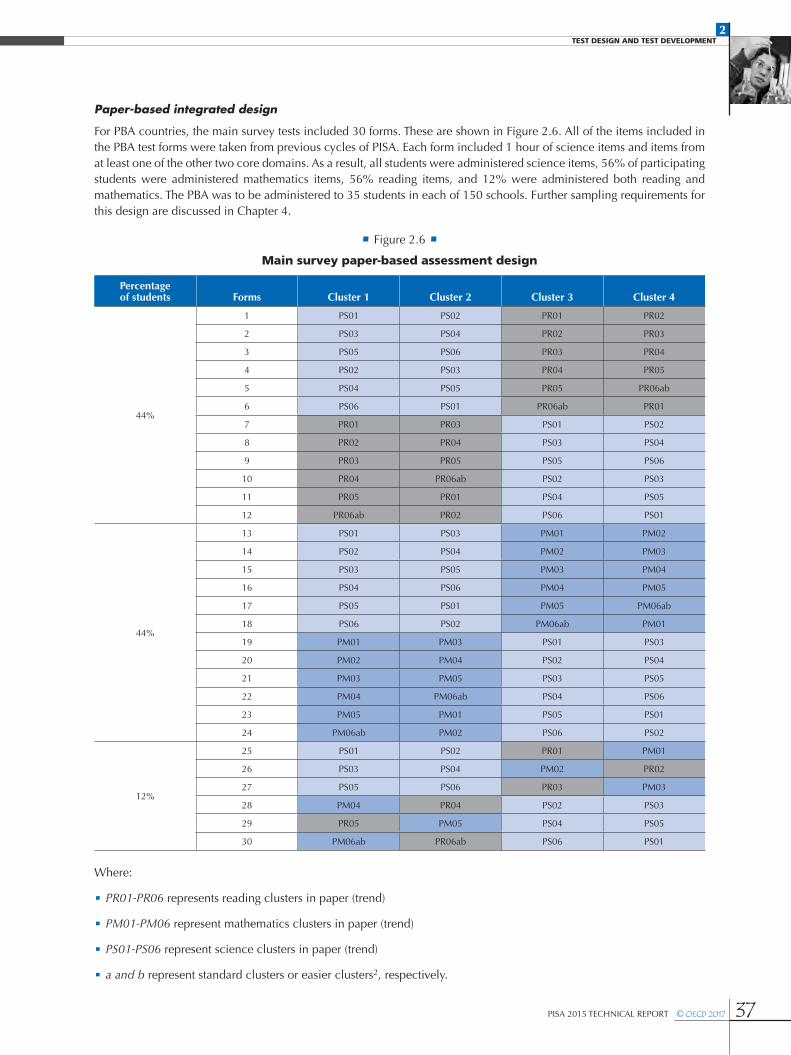
For PBA countries, the main survey tests included 30 forms. These are shown in Figure 2.6. All of the items included in the PBA test forms were taken from previous cycles of PISA. Each form included 1 hour of science items and items from at least one of the other two core domains. As a result, all students were administered science items, 56% of participating students were administered mathematics items, 56% reading items, and 12% were administered both reading and mathematics. The PBA was to be administered to 35 students in each of 150 schools. Further sampling requirements for this design are discussed in Chapter 4.
• Figure 2.6 •
Main survey paper-based assessment design
Percentage of students Forms Cluster 1 Cluster 2 Cluster 3 Cluster 4
44%
1 PS01 PS02 PR01 PR02
2 PS03 PS04 PR02 PR03
3 PS05 PS06 PR03 PR04
4 PS02 PS03 PR04 PR05
5 PS04 PS05 PR05 PR06ab
6 PS06 PS01 PR06ab PR01
7 PR01 PR03 PS01 PS02
8 PR02 PR04 PS03 PS04
9 PR03 PR05 PS05 PS06
10 PR04 PR06ab PS02 PS03
11 PR05 PR01 PS04 PS05
12 PR06ab PR02 PS06 PS01
44%
13 PS01 PS03 PM01 PM02
14 PS02 PS04 PM02 PM03
15 PS03 PS05 PM03 PM04
16 PS04 PS06 PM04 PM05
17 PS05 PS01 PM05 PM06ab
18 PS06 PS02 PM06ab PM01
19 PM01 PM03 PS01 PS03
20 PM02 PM04 PS02 PS04
21 PM03 PM05 PS03 PS05
22 PM04 PM06ab PS04 PS06
23 PM05 PM01 PS05 PS01
24 PM06ab PM02 PS06 PS02
12%
25 PS01 PS02 PR01 PM01
26 PS03 PS04 PM02 PR02
27 PS05 PS06 PR03 PM03
28 PM04 PR04 PS02 PS03
29 PR05 PM05 PS04 PS05
30 PM06ab PR06ab PS06 PS01
Where:
• PR01-PR06 represents reading clusters in paper (trend)
• PM01-PM06 represent mathematics clusters in paper (trend)
• PS01-PS06 represent science clusters in paper (trend)
• a and b represent standard clusters or easier clusters2, respectively.

2TEST DESIGN AND TEST DEVELOPMENT
38 © OECD 2017 PISA 2015 TECHNICAL REPORT
Figure 2.7 presents a summary of the main survey PBA design. In the PBA design, 44% of students were assigned to one of 12 science and reading forms and another 44% were assigned to one of 12 science and mathematics forms. The remaining 12% of students were assigned to one of six science, reading and mathematics forms. This design included:
• 24 different test forms that combined two of the three domains, with 88% of students receiving one of these forms. In these forms, students took one hour of science plus one hour of another domain. These 24 forms provided strong pairwise covariance information between science and each of the two other domains.
• 6 additional forms that provided covariance information about the three domains. Twelve percent of students received one of these forms, which included one hour of science plus two 30-minute clusters from the minor domains.
• Figure 2.7• Main survey paper-based assessment design
PBA Countries
Scientific and Reading Literacy(Forms 1-12)
Sample = 5 250(150 schools, 35 students)
44%
44%
12%
Scientific and Mathematical Literacy(Forms 13-24)
Scientific, Reading and Mathematical Literacy(Forms 25-30)
Computer-based integrated designFor CBA countries including the collaborative problem-solving (CPS) assessment, the main survey included 66 forms (forms 31-96). These are shown in Figure 2.8. Under the full design, all sampled students responded to science items, 41% responded to mathematics items, 41% responded to reading items and 30% to CPS items. In addition, 4% responded to each possible combination of 2 of the minor domains.
For the five countries not participating in the collaborative problem-solving assessment, only 36 forms were included in the design (forms 31-66) and the percentages for this alternative design are also represented in Figure 2.8.
• Figure 2.8 [Part 1/2] •Main Study Computer-Based Assessment Design
Percentage of students Forms Cluster 1 Cluster 2 Cluster 3 Cluster 4
33% (No CPS: 46%)
31 S S R01 R02 32 S S R02 R03 33 S S R03 R04 34 S S R04 R05 35 S S R05 R06ab 36 S S R06ab R01 37 R01 R03 S S 38 R02 R04 S S 39 R03 R05 S S 40 R04 R06ab S S 41 R05 R01 S S 42 R06ab R02 S S
33% (No CPS: 46%)
43 S S M01 M02 44 S S M02 M03 45 S S M03 M04 46 S S M04 M05 47 S S M05 M06ab 48 S S M06ab M01 49 M01 M03 S S 50 M02 M04 S S 51 M03 M05 S S 52 M04 M06ab S S 53 M05 M01 S S 54 M06ab M02 S S

2TEST DESIGN AND TEST DEVELOPMENT
PISA 2015 TECHNICAL REPORT © OECD 2017 39
• Figure 2.8 [Part 2/2] •Main Study Computer-Based Assessment Design
Percentage of students Forms Cluster 1 Cluster 2 Cluster 3 Cluster 4
4% (No CPS: 8%)
55 S S M01 R01 56 S S R02 M02 57 S S M03 R03 58 S S R04 M04 59 S S M05 R05 60 S S R06ab M06ab 61 R01 M01 S S 62 M02 R02 S S 63 R03 M03 S S 64 M04 R04 S S 65 R05 M05 S S 66 M06ab R06ab S S
4% (No CPS: NA)
67 S S C01 M01 68 S S M02 C0269 S S C03 M03 70 S S M04 C0371 S S C02 M05 72 S S M06ab C0173 M01 C02 S S 74 C03 M02 S S 75 M03 C01 S S 76 C01 M04 S S 77 M05 C03 S S 78 C02 M06ab S S
4% (No CPS: NA)
79 S S R01 C0180 S S C02 R02 81 S S R03 C0382 S S C03 R04 83 S S R05 C0284 S S C01 R06ab 85 C02 R01 S S 86 R02 C03 S S 87 C01 R03 S S 88 R04 C01 S S 89 C03 R05 S S 90 R06ab C02 S S
22% (No CPS: NA)
91 S S C01 C0292 S S C02 C0393 S S C03 C0194 C02 C01 S S 95 C03 C02 S S 96 C01 C03 S S
Where:
• R01-R06 represent reading clusters in computer (trend)
• M01-M06 represent mathematics clusters in computer (trend)
• S represents science clusters in computer (trend and new)
• C01-C03 represent CPS clusters in computer (new)
• a represents standard clusters and b represents easier clusters.
Figure 2.9 presents a summary of the main survey computer-based assessment design which was to be administered to 42 students in each of the 150 schools within each country. The design included:
• 30 different test forms that combined two of the four domains, with 88% of students receiving one of these forms. In these forms, students took one hour of science plus one hour of another domain. These 30 forms provided strong pairwise covariance information between science and each of the three other domains.
• 36 additional forms provided covariance information among the three minor domains. Twelve percent of students received one of these forms, which included one hour of science plus two 30-minute clusters from two of the other three domains.
Further sampling requirements for this design are discussed in Chapter 4.

2TEST DESIGN AND TEST DEVELOPMENT
40 © OECD 2017 PISA 2015 TECHNICAL REPORT
• Figure 2.9 •Main survey computer-based assessment design
CBA Countries
Scientific and Reading Literacy(Forms 31-42)
Sample = 6 300(150 schools, 42 students)
33%
33% Scientific and Mathematical Literacy(Forms 43-54)
Scientific, Reading and Mathematical Literacy(Forms 55-66)
Scientific and Mathematical Literacy, and CPS(Forms 67-78)
4%
4% Scientific Literacy, Reading Literacy and CPS(Forms 79-90)
Scientific Literacy and CPS(Forms 91-96)
22%
4%
The rotation of clusters identified the form assigned to each student. This cluster rotation was determined by a multi-step random process that occurred at the time students were sampled. This process, described in more detail in the following section, was only possible because of the computer-delivered testing environment used in PISA 2015.
Main study form assignment for the computer-based assessmentThe rotation of clusters – which identified the form to be received by each student – occurred in a multistep process when students were sampled. KeyQuest, the sampling software used in PISA 2015, assigned two random numbers to each sampled student.
• CC was a two-digit random number that represented the base form for the test (i.e., 31-96 for regular students or 99 for UH students – see “UH Form” section for more information). This number met the probability constraints described for the CBA forms.
• S was a one-digit random number that was used as a lookup number to select the two science clusters that would be inserted into the base form of the test. This number was between 1 and 6, inclusive, and was uniformly distributed.
These random numbers were encoded into the login information for the computer platform that was assigned by KeyQuest.
STEP 1: Assignment of the base test formThe first step was assigning base test forms. This assignment was based on the two-digit random number identified as “CC”. This number ranged from 31-96 and was directly linked to a specific base test form as shown in Figure 2.8. These base test forms identified the actual location and clusters for mathematics, reading and CPS, but only identified the location of science, not the specific clusters – the specific science clusters were not assigned until Step 2 and therefore were only identified as “S” at this point. The probability of assignment of each form type varied from 33% to 4% as shown in Figure 2.8.
For countries not participating in the assessment of CPS, the two-digit random number ranged from 31-66, representing the forms without CPS. The probability of assignment of form also changed. For non-CPS countries, 46% of students were assigned forms 31-42 and 46% were assigned forms 43-54, while 8% were assigned forms 55-66. In other words, 92% of students received a form that consisted of four 30-minute clusters assembled from two domains. These percentages are shown in brackets in the first column of Figure 2.8.
STEP 2: Assignment of science ClustersThe second step was the assignment of science clusters. There were 36 possible science cluster combinations, with clusters S1 – S12 rotating as shown in Figure 2.10. Combinations 1-18 included both trend and new clusters; 19-33 included only new clusters; and 34-36 included only trend clusters.

2TEST DESIGN AND TEST DEVELOPMENT
PISA 2015 TECHNICAL REPORT © OECD 2017 41
• Figure 2.10 •
Main study computer-based assessment combinations of science clusters
Science cluster combination Science cluster combinationN S S N S S1 S01 S07 19 S07 S08
2 S01 S10 20 S07 S09
3 S02 S08 21 S07 S11
4 S03 S09 22 S08 S10
5 S03 S12 23 S08 S12
6 S04 S07 24 S09 S08
7 S04 S10 25 S09 S11
8 S05 S11 26 S10 S07
9 S06 S12 27 S10 S09
10 S07 S06 28 S10 S12
11 S08 S01 29 S11 S08
12 S08 S05 30 S11 S10
13 S09 S02 31 S12 S07
14 S09 S06 32 S12 S09
15 S10 S03 33 S12 S11
16 S11 S02 34 S02 S04
17 S11 S04 35 S05 S01
18 S12 S05 36 S06 S03
• Figure 2.11 •
Lookup table for random number “S”: Assignment of science cluster combinations
Base form (CC)
Random number (S) Base form (CC)
Random number (S)
1 2 3 4 5 6 1 2 3 4 5 6
31 1 13 6 9 22 25 64 1 13 6 9 22 25
32 2 16 12 10 31 32 65 2 16 12 10 31 32
33 11 5 17 14 26 29 66 11 5 17 14 26 29
34 35 4 7 19 23 30 67 1 13 6 9 22 25
35 34 15 8 20 24 28 68 2 16 12 10 31 32
36 3 36 18 21 27 33 69 11 5 17 14 26 29
37 35 4 7 19 23 30 70 35 4 7 19 23 30
38 34 15 8 20 24 28 71 34 15 8 20 24 28
39 3 36 18 21 27 33 72 3 36 18 21 27 33
40 1 13 6 9 22 25 73 35 4 7 19 23 30
41 2 16 12 10 31 32 74 34 15 8 20 24 28
42 11 5 17 14 26 29 75 3 36 18 21 27 33
43 1 13 6 9 22 25 76 1 13 6 9 22 25
44 2 16 12 10 31 32 77 2 16 12 10 31 32
45 11 5 17 14 26 29 78 11 5 17 14 26 29
46 35 4 7 19 23 30 79 1 13 6 9 22 25
47 34 15 8 20 24 28 80 2 16 12 10 31 32
48 3 36 18 21 27 33 81 11 5 17 14 26 29
49 35 4 7 19 23 30 82 35 4 7 19 23 30
50 34 15 8 20 24 28 83 34 15 8 20 24 28
51 3 36 18 21 27 33 84 3 36 18 21 27 33
52 1 13 6 9 22 25 85 35 4 7 19 23 30
53 2 16 12 10 31 32 86 34 15 8 20 24 28
54 11 5 17 14 26 29 87 3 36 18 21 27 33
55 1 13 6 9 22 25 88 1 13 6 9 22 25
56 2 16 12 10 31 32 89 2 16 12 10 31 32
57 11 5 17 14 26 29 90 11 5 17 14 26 29
58 35 4 7 19 23 30 91 1 13 6 9 22 25
59 34 15 8 20 24 28 92 2 16 12 10 31 32
60 3 36 18 21 27 33 93 11 5 17 14 26 29
61 35 4 7 19 23 30 94 35 4 7 19 23 30
62 34 15 8 20 24 28 95 34 15 8 20 24 28
63 3 36 18 21 27 33 96 3 36 18 21 27 33

2TEST DESIGN AND TEST DEVELOPMENT
42 © OECD 2017 PISA 2015 TECHNICAL REPORT
The assignment of these combinations of science clusters was based on the one-digit random number “S”. This number ranged from 1-63, was uniformly distributed, and was used in combination with the base form (e.g., selected by the first two-digit random number) to identify which combination of science clusters a student received. Figure 2.11 shows the lookup table where the 31-96 base forms were identified by the rows and the 1-6 lookup numbers are identified by the columns. The combination of these two numbers was used to identify which of the 36 possible combinations of science clusters was used with the assigned base test form.
As an example of how this assignment process worked, suppose a student was assigned random numbers of CC = 37 and S = 4. Based on this information, the assignment of cognitive clusters was: i) base test form 37 which included two reading clusters (R01 and R03) and two science clusters; and ii) lookup number 4 that identified science cluster combination 19, which included science clusters S07 and S08. As a result, this student received a test composed of the following clusters:
Cluster 1 Cluster 2 Cluster 3 Cluster 4
R01 R03 S07 S08
Une heure (UH) formConsistent with previous cycles, a special one-hour test, referred to as the “Une Heure” (UH) form, was prepared for students with special needs. The selected items were among the easier items in each domain and had a more limited reading load. The UH form contained about half as many items as the other instruments, with each cluster including from seven to nine items. The UH form was comprised of about 50% science, 25% mathematics and 25% reading items.
The UH form included two clusters of science (SU1 and SU2), one cluster of reading (RU1), and one cluster of mathematics (MU1). The assignment of this booklet followed the approach described previously for the assignment of the base test form. The UH form was assigned base form 99 (as shown in Figure 2.12) and the two-digit random number, was not considered for selection of this form.
• Figure 2.12 •Main survey UH form design
Form Cluster 1 Cluster 2 Cluster 3 Cluster 4
99(UH) SU1 SU2 RU1 MU1
The UH form was accompanied by a UH student questionnaire that included a subset of items from the regular questionnaire (primarily trend items) in a single form design that was administered in CBA only, as no PBA countries chose to administer the UH Form.
Assessment of financial literacyThe assessment of financial literacy was offered as an international option in PISA 2015. It was based on a slightly re-ordered version of the items from PISA 2012 and included all but the one released item from 2012 with four new items added. In the main survey, financial literacy was available only as a computer-based assessment because countries participating in this option were all CBA countries. It was administered to a subsample of the PISA sample that took combinations of mathematics, reading and science items.
Countries opting for the financial literacy assessment were required to participate in the mode effect study and administer paper and computer versions of instruments in the field trial. The approach for the field trial included administration of financial literacy forms to a subsample of the PISA sample that took combinations of mathematics and reading items.
For the field trial design the following two groups also took financial literacy:
• Group 1 (PBA trend) included students taking Booklets 07-12 (reading and mathematics). Within each school there were approximately six students taking these booklets, all of whom also took financial literacy. This group took financial literacy as a paper instrument.
• Group 2 (CBA trend) included forms 37-42 (reading and mathematics). Within each school there were approximately nine students taking these forms, with all students also taking financial literacy. This group took financial literacy as a computer instrument.
This design provided a field trial sample size of approximately 375 students per country, with about 150 students taking the paper version, and 225 students taking the computer version.
For the main survey, the assessment instruments included 43 items, of which 39 were trend items and 4 were new items. These items were organized into two 30-min clusters that were rotated into two forms with each student taking both

2TEST DESIGN AND TEST DEVELOPMENT
PISA 2015 TECHNICAL REPORT © OECD 2017 43
clusters. The approach for the main study included the administration of financial literacy forms to a subsample of the PISA sample that took the core domains.
Students selected to take financial literacy were a subgroup of the students sampled based on the form they were assigned for the assessment of the core domains. The following forms were selected:
• forms 31, 33, 39 and 42 (science and reading): about 693 students per country
• forms 43, 45, 51 and 54 (science and mathematics): about 693 students per country
• forms 55-66 (science, mathematics and reading): about 252 students per country.
In total about 11 students in each school were subsampled for financial literacy, resulting in a total sample of approximately 1,650 students per country. This was the case for all CBA countries, including those few who took financial literacy but not CPS.
THE 2015 ASSESSMENT FRAMEWORKSFor each PISA domain, an assessment framework is produced to guide instrument development and interpretation in accordance with the policy requirements of the PISA Governing Board. The frameworks define the domains, describe the scope of the assessment, specify the structure of the test – including item format and the preferred distribution of items according to important framework variables – and outline the possibilities for reporting results. For PISA 2015, subject matter expert groups (SMEGs) were convened by the Core 1 contractor to develop frameworks for science and collaborative problem solving.4 The reading and mathematics frameworks were based on those developed for the 2009 and 2012 assessment cycles, respectively, when these domains were treated as major domains.
ScienceThe 2015 framework for science emphasises the importance of educating all young people to become informed, critical users of scientific knowledge. To understand and engage in critical discussion about issues that involve science and technology requires three domain-specific competences: knowledge of the fundamental ideas of science and the questions that frame the practice and goals of science, knowledge and understanding of scientific enquiry, and the ability to interpret data and evidence scientifically. Thus, the 2015 framework defines science as follows:
Science is the ability to engage with science-related issues, and with the ideas of science, as a reflective citizen.
A scientifically literate person, therefore, is willing to engage in reasoned discourse about science and technology which requires the competencies to:
• Explain phenomena scientifically – recognise, offer and evaluate explanations for a range of natural and technological phenomena.
• Evaluate and design scientific enquiry – describe and appraise scientific investigations and propose ways of addressing questions scientifically.
• Interpret data and evidence scientifically – analyse and evaluate data, claims and arguments in a variety of representations and draw appropriate scientific conclusions.
The assessment tasks focused on three dimensions of science:
• competencies, including explaining phenomena scientifically, evaluating and designing scientific enquiry, and interpreting data and evidence scientifically, as described above
• knowledge, including knowledge of both the natural world and technological artefacts (content knowledge), knowledge of how such ideas are produced (procedural knowledge), and an understanding of the underlying rationale for these procedures and the justification for their use (epistemic knowledge)
• contexts, including personal, local/national and global issues.
Collaborative problem solvingAs the innovative domain in the 2015 cycle, the collaborative problem solving assessment focuses on skills that have become increasingly important both across educational settings and in the workforce. The domain is defined as follows:
Collaborative problem solving is the capacity of an individual to effectively engage in a process whereby two or more agents attempt to solve a problem by sharing the understanding and effort required to come to a solution and pooling their knowledge, skills and efforts to reach that solution.

2TEST DESIGN AND TEST DEVELOPMENT
44 © OECD 2017 PISA 2015 TECHNICAL REPORT
This definition incorporates three core collaborative problem solving competencies: establishing and maintaining shared understanding; taking appropriate action to solve the problem; and establishing and maintaining team organisation. Additionally, the collaborative problem solving framework incorporated the four problem solving processes included in the PISA 2012 problem solving framework: exploring and understanding; representing and formulating; planning and executing; monitoring and reflecting. The three major CPS competencies were crossed with the four major individual problem solving processes forming a matrix of specific skills to be assessed in PISA 2015. As shown in Figure 2.13, this identified the dimensions of the tasks developed for the collaborative problem solving domain.
• Figure 2.13 •Matrix of collaborative problem solving skills for PISA 2015
(1) Establishing and maintaining shared understanding
(2) Taking appropriate action to solve the problem
(3) Establishing and maintaining team organisation
(A) Exploring and Understanding
(A1) Discovering perspectives and abilities of team members
(A2) Discovering the type of collaborative interaction to solve the problem, along with goals
(A3) Understanding roles to solve problem
(B) Representing and Formulating
(B1) Building a shared representation and negotiating the meaning of the problem (common ground)
(B2) Identifying and describing tasks to be completed
(B3) Describe roles and team organisation (communication protocol/rules of engagement)
(C) Planning and Executing
(C1) Communicating with team members about the actions to be/ being performed
(C2) Enacting plans (C3) Following rules of engagement, (e.g., prompting other team members to perform their tasks)
(D) Monitoring and Reflecting
(D1) Monitoring and repairing the shared understanding
(D2) Monitoring results of actions and evaluating success in solving the problem
(D3) Monitoring, providing feedback and adapting the team organisation and roles
ROLE OF THE SUBJECT MATTER EXPERT GROUPS IN ITEM DEVELOPMENT
As the contractor for instrument development, Core 3 was responsible for working with the subject matter experts in all domains. The proposed selection of trend items in the 2015 minor domains of reading and mathematics was shared with the subject matter expert groups (SMEGs) in September 2012. Proposals for adaptations to enable the display of longer texts in the computer-based reading units, along with a limited number of response mode adaptations in both domains, were shared with the subject matter experts for their input.
Core 3 worked with the expert groups for science and collaborative problem solving to understand their vision for the range and types of items to be developed for PISA 2015. To facilitate the transition from the work of Core 1 (framework development) to the instrument development activities, Core 3 retained the SMEG members who began work on the frameworks in early 2012. Core 3’s work with the SMEGs began in June 2012 and focused on the following tasks:
• describing the kinds of items needed to assess the skills and abilities in each domain as those were defined in the framework
• reviewing and understanding the proposed assessment design in order to define the number and types of items that were needed for each of the domains
• defining the behaviours of interest for the computer-based tasks
• defining the intersection between the kinds of functionality that might be desirable for measuring the constructs and the functionality that was practicable to implement in the assessment.
Work with the subject matter experts continued beyond the initial meetings through instrument development and data analysis. For science and collaborative problem solving, SMEG members played an important role in reviewing assessment tasks as they were developed, providing input into the analysis of the field trial data, approving the set of items for the main survey, and working with development and analysis staff to develop the described scales used for reporting the PISA 2015 results.
PISA 2015 TEST DEVELOPMENT
Test development for the PISA 2015 cycle began in mid-2012. The transition to a computer-delivered assessment, along with the new assessment design for this cycle that required many more trend items than had been used in past cycles, resulted in a number of development challenges that were unique to this cycle. In addition, the number of science items developed and field tested was much larger than usual for a major domain to allow for the possibility of an adaptive design in the main survey − an option which, in the end, was not implemented in this cycle.

2TEST DESIGN AND TEST DEVELOPMENT
PISA 2015 TECHNICAL REPORT © OECD 2017 45
Computer-based assessment: Screen design and interfaceA critical step in the item development process for PISA 2015 was creating a screen design that would be forward looking while still ensuring that PISA could continue to provide reliable trend data. This meant the design needed to support the range of display options and interaction modes required by new, innovative items while also facilitating the display of paper-and-pencil trend items being moved to the computer for reading, mathematics, science and financial literacy. An equally important consideration was the impact of the screen design across the range of languages in participating countries.
Given these considerations, Core 3 proposed a vertically split screen design in which the stimulus would be displayed in a pane on the left and the question or task in a pane on the right.5 The panes were adjustable in width to accommodate varying content and, where appropriate, a single-pane design was also used. The vertically split design achieved a number of important goals in that it:
• facilitated the display of paper-and-pencil trend items that were moved to computer delivery
• allowed text to be formatted with shorter line lengths, improving readability
• accommodated displays across a variety of languages
• allowed PISA to take advantage of wider computer screens that are likely to become more prevalent in the future.
A paper outlining the proposed screen design for the PISA 2015 cognitive instruments was submitted to the OECD Secretariat on 26 July 2012. In addition, an overview of the design was presented for discussion at the September 2012 Subject Matter Expert Group meetings for science, reading, mathematics and collaborative problem solving and at the meeting of the National Project Managers (NPMs) that same month. In cooperation with the OECD Secretariat, a revised version of the paper was submitted on 1 October 2012 as a background document for the October 2012 PGB meeting, where the design was formally approved.
Multi-page stimulus materialsA number of stimulus materials, particularly in reading, were presented on more than a single page in the paper-based format and, similarly, occupied more than a single screen on the computer. After consultation with members of the Reading Expert Group, the decision was made to present longer texts on static screens with a paging interface that allowed students to move from page to page throughout the text. Of the 29 units included in the 2015 assessment, 66% were presented on a single screen, 31% required two screens and just one unit required three screens. Decisions about where to split the text across pages were driven by the need to keep the presentation as similar as possible to the paper-based display and to ensure that all languages would have the same information displayed on each page. Figure 2.14 shows the paging display used in PISA 2015.
• Figure 2.14 •Paging navigation used in PISA 2015

2TEST DESIGN AND TEST DEVELOPMENT
46 © OECD 2017 PISA 2015 TECHNICAL REPORT
A number of safeguards were included to ensure that students saw all the pages in each unit and understood how to navigate among them.
• Students were introduced to the paging interface in the orientation.
• Prior to encountering the first question for any stimulus that spanned more than a single screen, students were instructed to click on each page of the stimulus, as shown in the directions on the left pane in Figure 2.14.
• The “NEXT” button did not become active until students had clicked on each page. Thus students could not proceed to the first question in the unit until they had viewed each page in the stimulus.
• Each turned down page corner was animated so it moved when students hovered the cursor over it. This animation was included to further draw students’ attention to the paging display.
NavigationDecisions about how students would be allowed to navigate through the items also needed to be built into the interface design for PISA 2015. For the majority of units, students were able to move back and forth among items within a unit. They were not, however, able to move back and forth among units. Once students clicked on the “NEXT” button on the final item in a unit, a dialog box displayed a warning that the student was about to move on to the next unit and it would not be possible to return to previous items. At this point, students could either confirm that they wanted to go on or cancel the action and continue with the unit on which they had been working.
Navigation for the interactive science and collaborative problem solving items followed a somewhat different model in that students were not able to go back to a previous item within a unit. The branching within the chat-based interface for collaborative problem solving meant that students could not change their chat choices once they clicked on the “Send” button. Similarly, students were not able to rerun the simulated experiments associated with each item in a unit because this would make the log files for these items unduly complex. Both the CPS and science orientations introduced this navigation to students. In addition, a dialogue box following each item required that students confirm they were ready to continue to the next question.
Response modesAcross all domains, PISA 2015 included items requiring one of five different response modes:
• click on a choice
– single-selection multiple choice (includes chat format)
– multiple-selection multiple choice (click on one or more responses)
– complex multiple choice (table with statements and a number of yes/no or true/false options)
– click on an image
• numeric entry (only numbers, comma, period, dash and backslash could be entered)
• text entry (within a scrolling text box that did not constrain the length of a student response – consistent with what was possible for paper-and-pencil items)
• select from a drop-down menu
• drag and drop (including use of a slider).
OrientationsA general orientation introduced students to the screen design and those response modes that were common across most domains. Students received this orientation before beginning the test. Prior to beginning each section of the test, students received a very short domain-specific orientation with instructions specific to the domain in that section. For example, before beginning the reading section of the assessment, students were introduced to the paging interface for the longer stimulus materials.
Trend itemsThe assessment design for PISA 2015 required that six 30-minute clusters of trend items be taken from previous cycles for reading, mathematics and science. The number of items required to meet this design meant that all available existing items (e.g., items that had not been released in previous cycles) needed to be adapted for the computer and included in the field trial. All 83 of the unreleased 2012 mathematics items were included in the PISA 2015 field trial.6 In reading,

2TEST DESIGN AND TEST DEVELOPMENT
PISA 2015 TECHNICAL REPORT © OECD 2017 47
44 of the items used in the 2012 cycle were used, along with 59 additional items taken from the 2009 cycle. For the science trend, 53 of the items included in the 2012 cycle were used, along with 30 items from the 2006 cycle and eight items from the 2003 cycle.7 In total, the PISA 2015 field trial included 83 mathematics items, 104 reading items and 91 trend science items.
In general, the goal in adapting the trend items from a paper-based to computer-based assessment was to maintain the presentation of information and cognitive demands, in order to maintain trend measurement. The computer version of each trend item was mocked up in several languages to determine where adaptations might be required to ensure a consistent display. For example, with longer stimuli, it would not be acceptable to have information required to answer a question on the first screen in some languages but on the second screen in others, as that would be likely to affect item difficulty. The specific considerations for re-authoring and adaptations differed somewhat across domains.
For the trend reading items, the primary challenge was the presentation of longer and more complex stimuli. Of the 29 unique stimuli, 14 fit on screen with no adaptations, 10 were presented on two pages in the paper booklets and could be similarly presented on two screens using the paging interface previously described, and 6 required adaptations including a minor reduction in the size of images or displaying text on two screens where it had been on a single page in paper.
Display of the stimulus materials was not an issue for mathematics as these tended to be brief and fit well on the screen across languages. To allow students to show how they found an answer or, in a few cases, enter a formula where one was required as a response, the mathematics test included a tool called the equation editor which included a set of mathematical symbols unavailable on the standard keyboard. Students were taught how to use the tool in the orientation presented just prior to beginning the mathematics section of the assessment.
Several of the science trend units included multiple stimuli that were associated with different items. For example, the first item in the paper-based version would require students to read a short text, the second item would include a graph related to the same topic and the third would be associated with a table. In the computer-based version of such units, it was important to ensure that students noticed the new information that was displayed with each item. This was accomplished by changing the headings or titles displayed on the right side of the screen with each stimulus as well as changing the user instructions for each item to direct students to refer to that information.
Finally, the financial literacy trend items were moved quite seamlessly from paper to computer, requiring no stimulus adaptations or changes in response modes.
New ItemsTo meet the expanded design for PISA 2015, six 30-minute clusters of new items were developed for science and four 30-minute clusters for collaborative problem solving. In total, 213 science items were developed and included in the field trial.8 This set included 158 standard items embedded within 40 units and 55 interactive items associated with 10 units. The collaborative problem solving domain included seven units in the field trial with 187 associated score points. Finally, ten new items were developed for financial literacy, four of which were taken forward to the field trial.
International test development teamTest development efforts were coordinated by Core 3 at ETS. As is the case with any large-scale international survey, it is important that the pool of tasks used in PISA reflect the range of contexts and experiences of students across participating countries. One way to meet this goal is by convening an international team of item developers. For PISA 2015, the international test development team included individuals from the Centre for Educational Technology in Tel-Aviv, Israel, the University of Luxembourg, and the GESIS-Leibniz Institute for the Social Sciences in Mannheim, Germany. These groups worked with submissions from 23 countries in science and seven in collaborative problem solving to develop the pool of items included in the PISA 2015 field trial.
National submissions and reviewsA second method for ensuring that the item pool reflects the international context of an assessment such as PISA is to solicit item submissions from participating countries. Given the extremely tight development timeline for PISA 2015, Core 3 submitted a request for early submissions of stimuli and context ideas to the OECD Secretariat in July 2012. Those were shared by the OECD Secretariat with countries in August and resulted in a number of submissions prior to the first meeting of National Project Managers (NPMs) in September 2012. More detailed item submission guidelines were prepared for countries and distributed as documents for that meeting in September.

2TEST DESIGN AND TEST DEVELOPMENT
48 © OECD 2017 PISA 2015 TECHNICAL REPORT
For science, submissions were organised in two rounds.
• In Round 1, which ended on November 1, 2012, countries were asked to submit sample contexts and ideas for interactive units. These materials were needed early in the development cycle as the interactive units required more time to design, program and test. Submissions for the non-interactive, or “standard” units, were encouraged in this round as well. Four countries submitted ideas for 13 interactive science units. In addition, 6 countries submitted 7 standard science units along with contexts for an additional 4.
• In Round 2, countries were asked to submit standard units only. These units could be accepted later in the process as they could be prepared for review more quickly. National Centres were asked to submit Round 2 items by mid-December 2012 so those items could be integrated into the country review cycle, allowing all participating countries to review the materials proposed for the field trial. In total, 23 countries submitted science units during this round.
Given the innovative nature of the collaborative problem solving domain, countries were asked to contribute to the item development process by submitting sample contexts and problem situations, or “abstracts”, to better ensure that the pool of CPS tasks reflected the cultural diversity across participating countries. An abstract submission form was developed to guide this process. Submissions were requested by November 1, 2012. Seven countries submitted CPS materials for consideration.
Countries had the opportunity to review and provide feedback on units developed by the international test development consortium and participating countries at three points during the assessment development process. Reviews were organised into two-week periods scheduled from late October 2012 to mid-January 2013, with each period focusing on different batches of items. Twenty-nine countries submitted reviews of the science items during the first review period, 40 during the second and 44 during the third. Content for collaborative problem solving was released in the form of abstracts for the first review. Feedback was provided by 27 countries. Detailed unit overviews with screen captures and descriptions of possible student actions were released for the second and third review periods, with 33 countries participating in the former and 38 in the latter.
Countries were also able to review the trend materials as computer-based units. Screen images of the reading and mathematics trend items were released during the first review period in October 2012 and the science trend units were released in Round 2.
Additional item reviewsNewly developed units were submitted for translatability review at the same time they were released for country review.9 Linguists representing different language groups provided feedback on potential translation, adaptation and cultural issues arising from the initial wording of items. Experts at cApStAn and the translation referee for the 2015 cycle were able to alert item developers to both general wording patterns and specific item wording that would be problematic for some translations and to provide suggested alternatives. This allowed item developers to make wording revisions at an early stage, in some cases simply using the alternatives provided and in others working with cApStAn to explore other possibilities.
Preparation of the French source version for all the tests’ units provided another opportunity to identify issues with the English source version related to content and expression that needed to be addressed. Development of the two source versions helped ensure that items were as culturally neutral as possible, identified instances where wording could be modified to simplify translation into other languages, and specified where translation notes would be needed to ensure the required accuracy in translating items to other languages.
In addition, user testing was conducted with students in both the United States and Luxembourg to identify where instructions might be improved or the interface reconsidered. The testing in Luxembourg was conducted with ten students and included seven units: two reading units that employed the paging interface, three mathematics units, each of which required students to use the equation editor tool and/or show their work, and two standard science units, which included the single-selection multiple choice, multiple-selection multiple choice, drag and drop, and type item types. The testing at ETS involved eight participants who were asked to work on one collaborative problem solving unit, one interactive science unit, a mathematics unit that included the equation editor and one reading unit that required the paging interface.
Information from these sessions was used to make revisions to one interface element in mathematics and correct several identified bugs. Equally important, the questions raised by study participants informed the development of the domain orientations, identifying areas where students needed instruction and practice before working on the assessment items.

2TEST DESIGN AND TEST DEVELOPMENT
PISA 2015 TECHNICAL REPORT © OECD 2017 49
Selection of new items for the field trial
The 2015 item development process resulted in a total of 289 new science items: 231 standard items across 55 units and 58 interactive units across 11 units. Ten collaborative problem solving units were developed. Items were selected for inclusion in the field trial based on country reviews, feedback from the expert group and the distribution of items across the key categories as defined in the framework. Of the 213 selected science items, 65 percent, or a total of 140 items, originated from the national submissions received from 15 countries.
FIELD TRIAL
The PISA 2015 field trial data collection timeline began in March 2014 and extended through August 2014 with 74 participating countries or economies across some 100 language versions. Countries moving to the computer-based assessment used both the computer-based and paper-based tests in the field trial in order to support the mode study for the trend items. The field trial tests for those countries testing solely in paper consisted of paper-based tests including only trend items from previous cycles. Assessment materials were prepared and released based on the field trial testing dates for each country.
Preparation of field trial instrumentsAs part of the quality control procedures for PISA 2015, the Core 3 contractors assumed responsibility for migrating existing paper-based versions of the selected trend items to the computer for all computer-based countries. Core 3 also prepared all paper booklets used in the field trial for both paper- and computer-based countries. Countries were responsible for translating all new material and performing both linguistic and layout quality control checks for trend and new items in both modes. Where countries identified errors as a result of those checks, they were shared with the contractors who made any agreed-upon corrections.
Computer-based trend items
For countries with existing translations of trend items, the Core 3 contractors copied those into the computer-readable XLIFF format used for the computer-based instruments. This was done both as a quality control process and to reduce the tasks assigned to countries given the short development timeframe for the project.
Once the XLIFF files were created, countries were asked to perform a review by comparing the new computer versions with PDF files of their paper-based items that were supplied by the contractors. These PDF files had been assembled for countries by retrieving their existing paper-based materials and organising them into the 2015 clusters. Countries were asked to document any content errors, which included typographical mistakes or text errors introduced in the process of copying and pasting across formats. Any content issues identified by countries were reviewed by verifiers on the linguistic quality control team and, if approved, the verifiers made the needed change in the computer files. If countries identified any serious layout issues, those were reviewed and, where appropriate, corrected by the Core 2 technical team. As an additional quality control check, the Core 3 contractor also performed layout checks of all items in all languages to identify errors that may have been missed.
Because trend items were selected from previous PISA administrations going back as far as 2003, countries that had not participated in all previous cycles did not have translations for some items. Where this occurred, National Centres were responsible for translating that content in a subsequent step in the development process and these materials were treated as new translations. An additional task for all countries was to provide translations for the recurring directions and prompts. Instructions from the paper booklets, such as “Circle either YES or NO” were revised to “Click on either YES or NO”, and some new directions, such as “Click on the NEXT arrow”, had been specifically developed for the computer-based items. All such recurring directions were identified by the contractors and provided to national teams. National translations of these revised or new directions went through the translation verification process and, once verified, were copied into the computer files by Core 3.
Computer-based new items
All new science, collaborative problem solving and, where applicable, financial literacy items needed to be translated by national teams following the translation and reconciliation processes defined in the PISA standards (see Chapter 5 for detailed information about this process). Following verification of national translations and the corrections of any remaining errors, countries were asked to sign off on their cognitive materials and those files were then considered locked.

2TEST DESIGN AND TEST DEVELOPMENT
50 © OECD 2017 PISA 2015 TECHNICAL REPORT
Preparing the Field Trial National Student Delivery Systems (SDS)The Student Delivery System (or SDS) was a self-contained set of applications for delivery of the PISA 2015 CBA assessments and computer-based student questionnaires. A master version was assembled first for countries to test within their national IT structure. This allowed countries to become familiar with the operation of the SDS and to check the compatibility of the software with computers being used to administer the assessment.10
Once all components of national materials were approved and locked, including both the questionnaires and the tests, the national SDS was assembled and tested first by Core 2 (responsible for computer platform development). The SDS was then released to countries for national testing. Countries were asked to check their SDS following a specific testing plan provided by Core 2 and to identify any residual content or layout issues. Where issues were identified those were corrected and a second SDS was released. Once countries signed off on their national SDS, their instruments were released for the field trial.
Paper-based trend itemsAs previously noted, the mode effects study for the PISA 2015 field trial required all countries to administer the 18 paper-and-pencil forms that included the trend items for reading, mathematics and science. National versions of the paper-based trend clusters were prepared by extracting clusters from existing booklets in the PISA archives and formatting them for the 2015 cycle. To better ensure comparability of the paper-based assessment materials across countries and languages, booklets were centrally created by Core 3 and then reviewed and approved by countries. Those countries who were new to PISA 2015 or who were missing some items from previous cycles needed to translate those materials following the standard translation and verification process. All countries needed to update and translate the common booklet parts, which included the cover, general instructions, formula sheet for mathematics and the acknowledgements page.
For computer-based countries, it was important to ensure comparability across the paper-based and computer-based trend items. Thus, clusters for the paper-based booklets were finalised by the contractors once all computer-based materials were locked. Where errors had been identified in any computer-based versions of trend items, those were also corrected by the contractor in the paper-based files. Once paper-based versions were assembled, they were provided for national review. Any remaining errors identified by countries were corrected and countries were asked to sign off on their materials.
The approved clusters were then assembled into the 18 field trial paper booklets by the contractors in a centralised fashion that ensured comparability of layout. Additionally, two financial literacy booklets were assembled. As a final step, booklets were released to countries so that the sequence of clusters within forms could be confirmed and, once approved, print-ready versions were provided to National Centres.
Paper-based countries followed essentially this same process. They were asked to first check their assembled clusters for errors. Once those had been corrected and their paper booklets assembled, they were asked to check and sign off on the final instruments.
Field trial codingCoding guides for trend items were compiled by Core 3 based on previous national versions. For computer countries, the coding guides were designed so that a single version could be used for coding both the paper and computer instruments. This meant that both paper and computer item IDs were included and, where question wording differed between the paper and computer formats, both versions were shown. Any items where the paper version was human coded but the computer version was automatically scored were also identified.
The development of the coding guide for new science items was informed by cognitive labs conducted by the University of Luxembourg. The English master version of the new science coding guide was released in draft form prior to the coder training meeting in January 2014. Based on discussions at that meeting, the coding guide was finalised and the updated English version, along with the French source version, was released to countries in March 2014, prior to the beginning of the field trial data collection period.
Field trial coder trainingThe international field trial coder training was held in January 2014 and focused on all domains and all items. The goals of the training included both having attendees develop an in-depth understanding of the coding process for each item, so they would be prepared to train coders in their countries, and reaching consensus about the coding rules to

2TEST DESIGN AND TEST DEVELOPMENT
PISA 2015 TECHNICAL REPORT © OECD 2017 51
better ensure consistency of coding within and between countries and across cycles. Trainers reviewed the layout of the coding guides, general coding principles, common problems and guidelines for applying special codes. Sample student responses were provided and attendees were required to code them. Where there were disagreements about coding for a particular item, those were discussed so that all attendees understood, and would be able to follow, the intent of the coding guides. The feedback provided by the National Centres in the Field Trial Review Questionnaire reflected a high level of satisfaction with the coding training.
Field trial coder queriesAs was the case during previous cycles, Core 3 set up a coder query service for the 2015 field trial. Countries were encouraged to send queries to the service so that a common adjudication process was consistently applied to all coder questions about constructed-response items. Queries were reviewed and responses provided by domain-specific teams including item developers and, for trend items, by members of the response team from previous cycles.
In addition to responses to new queries, the queries report included the accumulated responses from previous cycles of PISA. This helped foster consistent coding of trend items across cycles. The report was regularly updated and posted for National Centres on the PISA portal as new queries were received and processed.
Field trial outcomesThe PISA 2015 field trial was designed to yield information about the quantity and quality of data collected. More specifically, the goals of the field trial included collecting and analysing information regarding:
• the quantity of data and the impact, if any, that survey operations had on that data
• the operational characteristics of the computer-delivery platform
• the quality of the items including both those items that were newly developed for computer-based delivery and those that were adapted from earlier cycles
• the use of the data to establish reliable, valid, and comparable scales based on item-response theory (IRT) models both in paper- and computer-based versions.
Overall, the field trial achieved all the stated goals. This information was crucial for the selection and assembly of the main survey instruments and for refining survey procedures where necessary.
The field trial analyses were conducted in batches based on data submission dates. Most of the analyses implemented to evaluate the goals noted above were based on data received from countries by 31 July 2014. That included 53 datasets, with eight from countries implementing only the paper-based assessment and 45 from countries using the computer-based assessment, including trend items administered both in paper and computer. The field trial analyses were amended after receiving additional data, which increased the number of countries to 68 by the end of 2014. Details of the field trial analysis are discussed in Chapter 9.
MAIN SURVEY
The PISA 2015 main survey began in March 2015 with early testing countries and ended by mid-December 2015 with the late testing countries. The majority of countries completed the main survey data collection by May. In preparation for the main survey, countries reviewed items based on their performance in the field trial and were asked to identify any serious errors still in need of correction. The Core 3 contractors worked with countries to resolve any remaining issues and prepare the national instruments for the main survey.
National item review following the field trialThe item feedback process began in July 2014 and concluded in October 2014 and was conducted in two phases. The first phase occurred before countries received their field trial data and the second after receipt of their data. This two-phase process was implemented to allow for the most efficient correction of any remaining errors in item content or layout given the extremely short turn around period between the field trial and main survey.
Phase 1 allowed countries to report any linguistic or layout issues that were noted during the field trial, including errors to the coding guides. All requests were reviewed by Core 3 and assigned to one of two categories: serious errors that would be expected to impact item functioning and therefore were corrected immediately; and comments that would be re-evaluated based on the field trial data. Errors in category one were corrected centrally by the contractors.

2TEST DESIGN AND TEST DEVELOPMENT
52 © OECD 2017 PISA 2015 TECHNICAL REPORT
Following release of the field trial data, countries received their Phase 2 updated item feedback forms that included flags for any items that had been identified as not fitting the international trend parameters. Flagged items were reviewed by national teams. As was the case in Phase 1, countries were asked to provide comments about these specific items where they could identify serious errors. Requests for corrections were reviewed by Core 3 and, where approved, implemented.
Item selectionThe initial selection of items recommended for the main survey was made by the test development team based on item statistics from the field trial, country comments, coverage of the domain as specified in the framework, item format and the assessment design. In addition, as response timing information was available for the computer-based items, it was possible to use that information to develop proposed main survey clusters with balanced average testing times.
The main survey item selection process for new science was also informed by an independent item review. In March 2014, Pearson, the company responsible for overseeing the development of the PISA 2015 frameworks as the Core 1 contractor, was commissioned by the OECD secretariat to manage an independent review of the 2015 scientific literacy item pool. The purpose of this review was to gather validity evidence of the alignment and accuracy of new and trend science items in relation to the PISA 2015 framework and to ensure that the main survey pool would be a good representation of the construct. The agreement rate between the reviewers and item developers for the metadata coding of the items was 97%. The review concluded that the science items developed for PISA 2015 covered the framework for scientific literacy as it was intended by its developers and approved by the PGB. In addition, the reviewers found that the items were of high quality. Where there were concerns expressed about individual items, those were reviewed by the item development team and expert group.
National Centres were asked to provide feedback about the proposed main survey item pool during Phase 1 of the national item review process. Comments were due prior to the meeting of the science expert group so they could be considered as part of the SEG’s review of the item pool.
In October 2014, the SEG met to review and finalise the proposed item pool for the main study. The experts reviewed the tentative selection, along with a pool of potential alternate items. As a result of their discussions, a small number of items were dropped from the recommended pool and replaced by alternate items.
As part of this process, the SEG also approved the recommended set of released items. All items released following the field trial were taken from the pool of potential alternate items. These items performed well enough in the field trial to be considered for inclusion in the main survey but were not used simply because there were many more items available than were needed to meet the various goals for the main survey item pool.
The item counts for science, mathematics, reading, collaborative problem solving, and financial literacy in both the field trial and main survey are presented in Figure 2.15.
• Figure 2.15 •Item counts (field trial and main survey) by domain and delivery mode
DomainField trial Main survey
Paper-based Computer-based Paper-based Computer-based
Science 91 304 (213 New, 91 Trend)
85 184 (99 New, 85 Trend)
Mathematics 83 82 83 81
Reading 103 103 103 103
CPS NA 153 NA 117
Financial literacy NA 43 NA 43
As Figure 2.15 shows, a number of trend items were dropped between the field trial and main survey or not included in the main survey analysis.
• Two mathematics items were not included in the main study data analysis for computer-based countries. One item could only be administered in paper and so was not used on the computer in either the field trial or main survey. One additional item was dropped due to problems with the computer-based scoring.11
• Six trend science items were dropped from the computer-based test and not included in the analysis in both modes. Item parameters for two of those items were not available for 2006 when they were last used, so they could not be

2TEST DESIGN AND TEST DEVELOPMENT
PISA 2015 TECHNICAL REPORT © OECD 2017 53
used as trend items.12 One item had been dropped at the international level in 2003 and so should not have been included in 2015.13 Finally three items, last used in 2003, did not work well in the field trial and so were not moved forward to the main survey.14
• Four CPS items were dropped during main survey data analysis.15 Additionally, a number of items in each unit were combined, based on the main survey analysis and/or to reflect the branching logic within units. That branching meant that, based on the path students took, they might not see all items in a unit and therefore items needed to be clustered in order to function psychometrically.
Construct coverageThe set of items for the main survey was balanced in terms of construct representation, based on the overall distributions recommended in the frameworks.
A total of 184 items was selected for science, with the distribution as shown in Figure 2.16 below.
• Figure 2.16 •Science item counts by framework category16
Competency Items Percent Framework goal
Evaluate and design scientific enquiry 39 21% 20-30%
Explain phenomena scientifically 89 48% 40-50%
Interpret data and evidence scientifically 56 31% 30-40%
Knowledge
Content 98 53% 54-66%
Epistemic 26 14% 10-22%
Procedural 60 33% 19-31%
System
Earth and Space 49 27% 28%
Living 74 40% 36%
Physical 61 33% 36%
The 117 items selected in the collaborative problem solving domain were distributed among the framework categories as shown below in Figure 2.17.
• Figure 2.17 •Collaborative problem solving item counts by framework category
CPS Competency Items Percent Framework goal
Establishing and maintaining shared understanding 61 52% 40-50%
Taking appropriate action to solve the problem 26 22% 20-30%
Establishing and maintaining team organisation 30 26% 30-35%
Problem solving process
Exploring and understanding 2250% Approx. 40% (combined)
Representing and formulating 37
Planning and executing 35 30% Approx. 30%
Monitoring and reflecting 23 20% Approx. 30%
Preparing the main survey national student delivery systems (SDS)The process for creating the main survey national student delivery system (SDS) followed that used during the field trial, beginning with assembly and testing of the master SDS followed by the process for assembling national versions of the main survey SDS.
After all components of national materials were locked, including the questionnaires and cognitive instruments, the student delivery system was assembled and tested by Core 2. Countries were then asked to check their SDS and identify any remaining content or layout issues. Once countries signed off on their national SDS, their instruments were released for the field trial.

2TEST DESIGN AND TEST DEVELOPMENT
54 © OECD 2017 PISA 2015 TECHNICAL REPORT
Main survey codingThe process used for the main survey coding training was slightly different from that employed prior to the field trial. Full training was provided for all science items, as the major domain. Based on the reliability results from the field trial, a decision was made to conduct a tailored coding training for a selected set of reading items and not to repeat training for trend mathematics and financial literacy items.
The coder query service was again used in the main survey as it had been in the field trial to assist countries in clarifying any uncertainty around the coding process or responses. Queries were reviewed and responses provided by domain-specific teams including item developers and members of the response team from previous cycles.
Review of main survey item analysesThe main survey data went through extensive analyses implemented through multistep procedures to ensure the quality of the results. The first steps were implemented to evaluate the overall quality of the data submitted by countries looking at how well the assessment design and booklet assignment were reflected in the data as well as looking for the effects of any possible threats to data quality such as technical problems, scoring inconsistencies, issues related to time limits, and other administration problems. These were followed by more specific analyses including item analysis, coding and treatment of missing data, item response theory scaling including international item fit and item-by-country interactions, conditioning models and generation of plausible values. These procedures are described in more detail in Chapters 9, 10 and 12. Finally, the outcomes of these analyses guided decisions around data products and treatment of items as described in detail in Chapter 19.
Released itemsAs has been the case in previous PISA cycles, a number of items were released into the public domain at the time of publication of the PISA 2015 results to illustrate the kinds of items included in the assessment. This was particularly important for this cycle due to the shift from paper to computer as the primary mode of assessment. The OECD decided to release four science units from the main survey in their interactive mode: i) Sustainable Fish Farming (3 items), ii) Bird Migration (3 items), iii) Slope-Face Investigation (2 items), and iv) Meteoroids and Craters (4 items). In addition, it decided to release one of the field trial units, Running in Hot Weather (6 items), to illustrate the interactive simulation units developed for science. These units are available at www.oecd.org/pisa.
Notes
1. Consistent with previous cycles, easier and harder forms were developed. Clusters R06a and M06a were used to assemble forms for countries selecting the standard forms while clusters R06b and M06b were used to assemble forms for countries selecting the easier forms.
2. Countries chose at the national level whether they wanted to use the easier or standard mathematics and reading clusters.
3. This range was selected to circumvent a requirement of the software used for this selection, and to ensure equal distribution of the different combinations across the sample.
4. For a more detailed description of the science framework, as well as the adaptations made to the frameworks for the 2015 minor domains, please see OECD (2017), PISA 2015 Assessment and Analytical Framework: Science, Reading, Mathematic, Financial Literacy and Collaborative Problem Solving, OECD Publishing, Paris, http://dx.doi.org/10.1787/9789264281820-en.
5. The orientation of these panes was reversed for right-to-left languages.
6. Note that one item was used only in the paper-based assessment as it required students to draw a line on a graph – something that could not easily be replicated in the computer-based mode. Thus there were 83 trend items in PBA and 82 in CBA for mathematics.
7. A total of six science trend items, four items last used in 2003 items and the two last used in 2006, were dropped following the field trial.

2TEST DESIGN AND TEST DEVELOPMENT
PISA 2015 TECHNICAL REPORT © OECD 2017 55
8. The number of field trialed items was particularly large in science to allow for the possibility of an adaptive assessment in the main survey.
9. See Chapter 5 for additional detail about the translatability assessment.
10. More information about the Student Delivery System is provided in Chapter 18.
11. Item DM155Q01C was the paper-based only item and DM192Q01C was dropped from the main survey analysis on computer.
12. Items DS456Q01C and DS456Q02C.
13. Item DS327Q02C.
14. Items DS133Q01C, DS133Q03C and DS133Q04C.
15. The dropped CPS items include: CC104104 and CC104303 in Meeting in the Park, CC102208 in The Field Trip and CC105405 in The Garden.
16. As noted in Chapter 9, the classification of one item (DS648Q05C) was corrected from “Interpret data and evidence scientifically” to “Explain phenomena scientifically” after scaling. The numbers shown here reflect that correction.
References
Curran, P. J. et al. (2008), ”Pooling data from multiple longitudinal studies: The role of item response theory in integrative data analysis”, Developmental Psychology, Vol. 44/2, pp.365-380, http://doi.org/10.1037/0012-1649.44.2.365.
Glas, C. and K. Jehangir (2013), “Modeling country-specific differential item functioning”, in L. Rutkowski, M. von Davier and D. Rutkowske (eds.), Handbook of International Large-Scale Assessment: Background, Technical Issues, and Methods of Data Analysis, CRC Press, Taylor and Francis Group, Boca Raton, FL.
Glas, C. A. W. and N.D. Verhelst (1995), “Testing the Rasch Model”, in G. H. Fisher and I. W. Molenaar (eds.), Rasch models: Foundation, recent developments, and applications, pp. 69-96, Springer-Verlag, New York.
Mazzeo, J., and M. von Davier (2013), “Linking scales in international large-scale assessments”, in L. Rutkowski, M. von Davier and D. Rutkowski (eds.), Handbook of International Large-Scale Assessment: Background, Technical Issues, and Methods of Data Analysis, CRC Press, Taylor and Francis Group, Boca Raton, FL.
Meredith, W. and J.A. Teresi (2006), “An essay on measurement and factorial invariance”, Medical Care, Vol. 44/11, pp. 69-77.
Meredith, W. (1993), Measurement invariance, factor analysis, and factorial invariance, Psychometrika, Vol. 58/4, pp. 525-543.
Oliveri, M. E., and M. von Davier (2014), “Toward increasing fairness in score scale calibrations employed in international large-scale assessments”, International Journal of Testing, Vol. 14/1, pp. 1-21.
Oliveri, M. E., and M. von Davier (2011), “Investigation of model fit and score scale comparability in international assessments”, Psychological Test and Assessment Modeling, Vol. 53/3, pp. 315-333.
Reise, S. P., K. F. Widaman and R. H. Pugh (1993), “Confirmatory factor analysis and item response theory: Two approaches for exploring measurement invariance”, Psychological Bulletin, Vol. 114/3, pp. 552-566.