2 Software Metrics
15
Soſtware Metrics 2 C HAPTER 2.1 INTRODUCTION I am reminded of a very interesting story when we talk of software metrics. Once there was a meeting going on in USA. In that meeting, one of the ladies was asked to tell the length of the software that her team members had developed. She took out a 30 cm scale from her bag and started measuring the length of her program. All those who were present in the meeting started laughing. The point is: do we measure our software like this? Is it possible to find the length and the volume of our software? Was this lady right in her measurement procedure? No, certainly not, she is incorrect. It is possible to measure the length and the volume of the software. But certainly, not with a scale. This chapter focuses on the issues related to software measurement and the techniques used for software measurement. 2.2 PROJECT MANAGEMENT PROCESS ACTIVITIES Software Project Management (SPM) is the means by which an orderly control process can be imposed on the software development process in order to ensure software quality. To meet the cost, quality and schedules objectives, resources have to be properly allocated to each activity. SPM is the way of achieving all these objectives. Note that SPM focuses on the issues like planning a project, estimating resources, scheduling, monitoring and controlling the project. During SPM, the project manager breaks down the development process into a number of smaller, manageable tasks that are called phases. Also note that all such tasks have a single objective and will produce a well-defined deliverable. Each task has a clear beginning and an end. The following activities occur during SPM: 1. Proposal writing. 2. Project planning and scheduling. 3. Project cost estimation. 4. Project monitoring and reviews. 5. Personnel selection and evaluation.
Transcript of 2 Software Metrics

Software Metrics2C h a p t e r
2.1 INTRODUCTION
I am reminded of a very interesting story when we talk of software metrics. Once there was a meeting going on in USA. In that meeting, one of the ladies was asked to tell the length of the software that her team members had developed. She took out a 30 cm scale from her bag and started measuring the length of her program. All those who were present in the meeting started laughing. The point is: do we measure our software like this? Is it possible to find the length and the volume of our software? Was this lady right in her measurement procedure? No, certainly not, she is incorrect. It is possible to measure the length and the volume of the software. But certainly, not with a scale. This chapter focuses on the issues related to software measurement and the techniques used for software measurement.
2.2 PROJECT MANAGEMENT PROCESS ACTIVITIES
Software Project Management (SPM) is the means by which an orderly control process can be imposed on the software development process in order to ensure software quality. To meet the cost, quality and schedules objectives, resources have to be properly allocated to each activity. SPM is the way of achieving all these objectives. Note that SPM focuses on the issues like planning a project, estimating resources, scheduling, monitoring and controlling the project. During SPM, the project manager breaks down the development process into a number of smaller, manageable tasks that are called phases. Also note that all such tasks have a single objective and will produce a well-defined deliverable. Each task has a clear beginning and an end. The following activities occur during SPM: 1. Proposal writing. 2. Project planning and scheduling. 3. Project cost estimation. 4. Project monitoring and reviews. 5. Personnel selection and evaluation.

Software Metrics 31
4. Project Monitoring and Reviews The project manager must check the progress of the project from time to time and compare
the actual and planned progress and costs. Here, either formal or informal methods may be used.
5. Personnel Selection and Evaluation It is difficult to get skilled, experienced and trained engineers. The project manager must
appoint them.
6. Report Writing The project manager is responsible for reporting of the project to both client and contractor
organizations. A brief document may be prepared.
7. Quality Management It includes activities like quality assurance, quality planning and quality control during
SDLC.
8. Configuration Management (CM) CM is a set of activities designed to control change by identifying the work products
that are likely to change, establishing relationships among them, defining mechanisms for managing different versions of these products, controlling the changes imposed and auditing and reporting on the changes made.
We usually talk of 4 Ps that are very important from SPM point of view. These 4 Ps form the management’s spectrum and are shown in Figure 2.2.
ThePeople
TheProject
TheProcess
TheProduct
Figure 2.2 The 4 Ps of Management

Software Metrics 33
(a) Measure: It provides a quantitative indication of the extent, dimension, size and the capacity of a product.
(b) Measurement: It is defined as the act of evaluating a measure. Actual measurements must be performed on a given software system in order to use metrics for quantifying characteristics of a given software. In software projects, if we want to calculate the length, in terms of size metric of software then we use Lines of Code (LOC) measure.
(c) Metric: It is a quantitative measure of the degree to which a system or its component possesses a given attribute. A number of metrics have been proposed to quantify the software like the size, complexity and reliability of the software.
For example, say, we have collected 10 errors in some program, then it is a measure. On the other hand, if we have collected the error data of say, 8 programs instead of one program, i.e., say 2, 6, 4, 9, 1, 3, 8, 2 errors, then it becomes its measurement. On the other hand, the relation between these measures is a metric. This relation might be the average number of errors found per review.
But note that for estimation, models are needed. These models are built to estimate the metric value based on the value of some other metrics that we can measure. A model is a relationship of the predicted variable and the other variables that can be measured. The models may be based on empirical data or it may be analytic. It should be clear that measures, measurement, metrics and models go together. Also note that metrics provide a quantification of some property, measurements provide the actual value for the metrics and models are needed to get the value for the metric that can’t be measured directly.
NOTE: All metrics must have a purpose.Software metrics should be collected to ensure about the process and project indicators. Process indicators enable a software engineering organization to gain insight into the efficiency of an existing process. So, by using it the management will be able to know the existing processes. This is the reason as why process metrics are collected across all the projects and over long periods of time. Such metrics will provide process indicators which will lead to the software process improvements.
Project indicators are used to check the progress of software development. So, a project manager will be able to estimate the total work done on the project, mitigate the risk, and minimize errors and to do quality control.
Note that in some cases, same software metrics may be used for both project and process metrics. Also understand that software process and product metrics are quantitative measures. Initially, basic quality and productivity data are collected. Then these data are analyzed, compared against past averages and now estimate whether quality and productivity improvements have occurred.
NOTE: Measures obtained by a project team will be converted into metrics for use during the project. These metrics will be evaluated to provide the indicators.
Software metrics can be classified into three types as follows:
(a) Product Metrics: These are the measures of different characteristics of the software product. The two important software characteristics are:
34 Modern Software Engineering
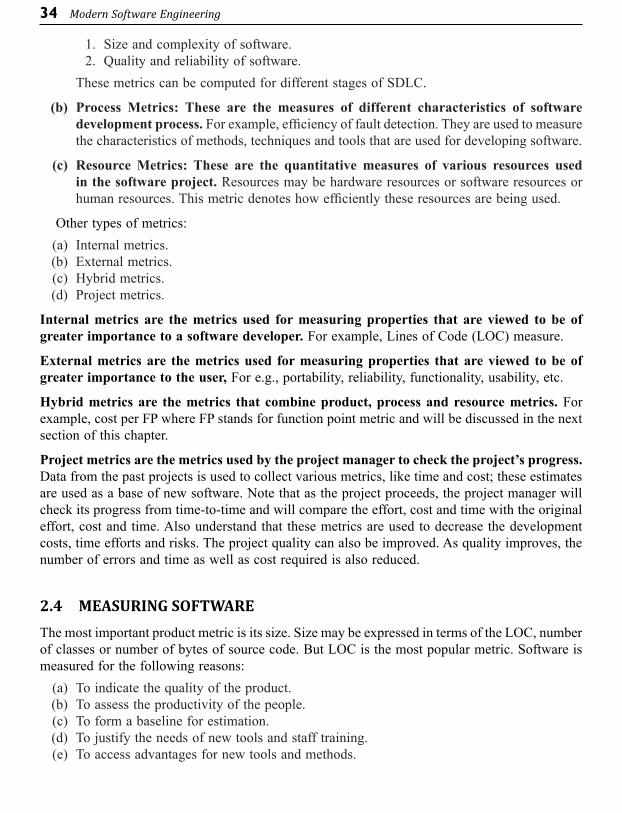
1. Size and complexity of software. 2. Quality and reliability of software. These metrics can be computed for different stages of SDLC.
(b) Process Metrics: These are the measures of different characteristics of software development process. For example, efficiency of fault detection. They are used to measure the characteristics of methods, techniques and tools that are used for developing software.
(c) Resource Metrics: These are the quantitative measures of various resources used in the software project. Resources may be hardware resources or software resources or human resources. This metric denotes how efficiently these resources are being used.
Other types of metrics: (a) Internal metrics. (b) External metrics. (c) Hybrid metrics. (d) Project metrics.
Internal metrics are the metrics used for measuring properties that are viewed to be of greater importance to a software developer. For example, Lines of Code (LOC) measure.
External metrics are the metrics used for measuring properties that are viewed to be of greater importance to the user, For e.g., portability, reliability, functionality, usability, etc.
Hybrid metrics are the metrics that combine product, process and resource metrics. For example, cost per FP where FP stands for function point metric and will be discussed in the next section of this chapter.
Project metrics are the metrics used by the project manager to check the project’s progress. Data from the past projects is used to collect various metrics, like time and cost; these estimates are used as a base of new software. Note that as the project proceeds, the project manager will check its progress from time-to-time and will compare the effort, cost and time with the original effort, cost and time. Also understand that these metrics are used to decrease the development costs, time efforts and risks. The project quality can also be improved. As quality improves, the number of errors and time as well as cost required is also reduced.
2.4 MEASURING SOFTWARE
The most important product metric is its size. Size may be expressed in terms of the LOC, number of classes or number of bytes of source code. But LOC is the most popular metric. Software is measured for the following reasons: (a) To indicate the quality of the product. (b) To assess the productivity of the people. (c) To form a baseline for estimation. (d) To justify the needs of new tools and staff training. (e) To access advantages for new tools and methods.

Software Metrics 35
2.4.1 Size-Oriented Metrics/LOC Metrics/Direct Measures
LOC or thousands of LOC (KLOC) has been a very traditional and direct method of metrics of software. These metrics are derived by normalizing the quality and productivity measures by considering the size of the product as a metric. Please remember the following points regarding LOC measures: 1. In size-oriented metrics, LOC is considered to be the normalization value. 2. It is an older method that was developed when FORTRAN and COBOL programming
were very popular. 3. Productivity is defined as KLOC / EFFORT where effort is measured in person-months. 4. Size-oriented metrics depend on the programming language used. 5. As productivity depends on KLOC, so assembly language code will have more
productivity. 6. LOC measure requires a level of detail which may not be practically achievable. 7. The more expressive is the programming language, the lower is the productivity. 8. LOC method of measurement is not applicable to projects that deal with visual (GUI-
based) programming. As already explained, Graphical User Interfaces (GUIs) use forms basically. LOC metric is not applicable there.
9. It requires that all organizations must use the same method for counting LOC. This is so because some organizations use only executable statements, some use comments and some do not. So, a standard needs to be established.
10. These metrics are not universally accepted.Based on the LOC/KLOC count of software, many other metrics can be computed:
(a) Errors/KLOC. (b) $/ KLOC. (c) Defects/KLOC. (d) Pages of documentation/KLOC. (e) Errors/PM. (f) Productivity = KLOC/PM (effort is measured in person-months). (g) $/ Page of documentation.Advantages and disadvantages of LOC measure:
Proponents (in favor) of LOC measure claim that LOC is an artifact of all software development projects that can be easily counted.
Opponents (against), however, argue that LOC measures are programming language dependent. That is, a C program will take lesser LOC as compared to a COBOL/assembly language program for a given task. For example, a bubble sort program in C will take lesser number of LOC as compared to a COBOL program of bubble sort.
2.4.2 Text-Based Metrics
Another metrics that may be used is the size of the text of SRS. The size could be the number of pages, number of paragraphs, number of functional requirements, etc.

36 Modern Software Engineering
Advantages and disadvantages of text-based measure:Proponents (in favor) of text-based metric say that it is used mostly to convey a general
sense about the size of the product or project.Opponents (against) say that such metrics are dependent on the authors of the document
and are not the accurate indicators of the size of the project.
2.4.3 Function Oriented Metrics
In 1977, A. J. Albrecht of IBM developed a method of software metrics based on the functionality of the software delivered by an application as a normalization value. He called it the Function Points (FPs). They are derived using an empirical relationship based on direct measures of software’s information domain and assessments of software complexity. Note that FPs try to quantify the functionality of the system, i.e., what the system performs. This is taken as the method of measurement as FPs cannot be measured directly. Also note that FP is not a single characteristic but is a combination of several software features/characteristics. A non-profit organization called International Function Point User Group (IFPUG) was formed in 1986 that took the responsibility of developing the counting rules and FP definitions. Today, IFPUG has more than 3000 members and has affiliates in 24 countries. FP also has many variants like backfired FPs, COSMIC FPs, Feature Points, The Netherlands FPs, etc. Remember the following points regarding FPs: 1. FPs of an application is found out by counting the number and types of functions used in
the applications. Various functions used in an application can be put under five types as shown in Table 2.1:
Table 2.1 Types of FP Attributes
Measurement Parameter Examples
1. Number of external inputs (EI) Input screen and tables.2. Number of external outputs (EO) Output screens and reports.3. Number of external inquiries (EQ) Prompts and interrupts.4. Number of internal files (ILF) Databases and directories.5. Number of external interfaces (EIF) Shared databases and shared routines.
All these parameters are then individually assessed for complexity. 2. FP characterizes the complexity of the software system and hence can be used to depict
the project time and the manpower requirement. 3. The effort required to develop the project depends on what the software does. 4. FP is programming language independent. 5. FP method is used for data processing systems, business systems like information systems. 6. The 5 parameters mentioned above are also known as information domain characteristics. 7. All the above-mentioned parameters are assigned some weights that have been
experimentally determined and are shown in Table 2.2.

Software Metrics 37
Table 2.2 Weights of 5-FP Attributes
Measurement Parameter Low Average High
1. Number of external inputs (EI) 7 10 152. Number of external outputs (EO) 5 7 103. Number of external inquiries (EQ) 3 4 64. Number of internal files (ILF) 4 5 75. Number of external interfaces (EIF) 3 4 6
The functional complexities are multiplied with the corresponding weights against each function and the values are added up to determine the UFP (Unadjusted Function Point) of the subsystem. So we draw another Table 2.3 now.
Table 2.3 Computing FPs
Measurement Parameter CountWeighing factor
Simple Average Complex
1. Number of external inputs (EI) — * 3 4 6 = —2. Number of external outputs (EO) — * 4 5 7 = —3. Number of external inquiries (EQ) — * 3 4 6 = —4. Number of internal files (ILF) — * 7 10 15 = —5. Number of external interfaces (EIF) — * 5 7 10 = —
Count-total Æ —
Note here that weighing factor will be simple, average or complex for a measurement parameter type.
The Function Point (FP) is thus calculated with the following formula FP = Count-total * [0.65 + 0.01 * S (Fi ) ] = Count-total * CAF where Count-total is obtained from the above Table.
CAF = [0.65 + 0.01 * S (Fi )]
and S (Fi) is the sum of all 14 questionnaires and show the complexity adjustment value/factor-CAF (where i ranges from 1 to 14). Usually, a student is provided with the value of S (Fi). Also note that S (Fi) ranges from 0 to 70, i.e.,
0 <= S (Fi ) <=70
and CAF ranges from 0.65 to 1.35 because (a) When S (Fi) = 0 then CAF = 0.65 (b) When S (Fi) = 70 then CAF = 0.65 + (0.01 * 70) = 0.65 + 0.7 = 1.35

38 Modern Software Engineering
Based on the FP measure of software many other metrics can be computed: (a) Errors/FP (b) $/FP. (c) Defects/FP (d) Pages of documentation/FP (e) Errors/PM. (f) Productivity = FP/PM (effort is measured in person-months). (g) $/Page of Documentation. 8. LOCs of an application can be estimated from FPs. That is, they are interconvertible. This
process is known as backfiring. For example, 1 FP is equal to about 100 lines of COBOL code.
9. FP metrics is used mostly for measuring the size of Management Information System (MIS) software.
10. But the function points obtained above are unadjusted function points (UFPs). These (UFPs) of a subsystem are further adjusted by considering some more General System Characteristics (GSCs). It is a set of 14 GSCs that need to be considered. The procedure for adjusting UFPs is as follows:
(a) Degree of Influence (DI) for each of these 14 GSCs is assessed on a scale of 0 to 5. (b) If a particular GSC has no influence, then its weight is taken as 0 and if it has a strong
influence then its weight is 5. (c) The score of all 14 GSCs is totaled to determine Total Degree of Influence (TDI). (d) Then Value Adjustment Factor (VAF) is computed from TDI by using the formula:
VAF = (TDI * 0.01) + 0.65
Remember that the value of VAF lies within 0.65 to 1.35 because (a) When TDI = 0, VAF = 0.65 (b) When TDI = 70, VAF = 1.35 (e) VAF is then multiplied with the UFP to get the final FP count:
FP = VAF * UFP
Before we discuss the extended-FP metrics further, we solve some problems now.
Example 1 Compute the function point value for a project with the following information domain characteristics: (1) No. of user inputs = 32 (2) No. of user outputs = 60 (3) No. of user inquiries = 24 (4) No. of files = 8 (5) No. of external interfaces = 2
Assume all complexity adjustment values are average. Assume that 14 algorithms have been counted. [RGTU June 2003, 2005, Dec. 2006, June 2008]

40 Modern Software Engineering
4. Number of internal files (ILF) 4 * 7 10 15 = 405. Number of external interfaces (EIF) 2 * 5 7 10 = 14
Count-total Æ 578
Now Fi for average case = 3. So sum of all Fi (i ¨ 1 to 14) = 14 * 3 = 42
FP = Count-total * [0.65 + 0.01 * S (Fi ) ] = 578 * [0.65 + 0.01 * 42] = 578 * [0.65 + 0.42] = 578 * 1.07 = 618.46
Example 3 Compute the function point, productivity, documentation, cost per function for the following data: (1) Number of user inputs = 24 (2) Number of user outputs = 46 (3) Number of inquiries = 8 (4) Number of files = 4 (5) Number of external interfaces = 2 (6) Effort = 36.9 p-m (7) Technical documents = 265 pages (8) User documents = 122 pages (9) Cost = $7744/ monthVarious processing complexity factors are: 4, 1, 0, 3, 3, 5, 4, 4, 3, 3, 2, 2, 4, 5.
Solution: We draw the Table 3 firstly, using Table 2.3:
Measurement Parameter Count Weighing factor
1. Number of external inputs (EI) 24 * 4 = 962. Number of external outputs (EO) 46 * 4 = 1843. Number of external inquiries (EQ) 8 * 6 = 484. Number of internal files (ILF) 4 * 10 = 405. Number of external interfaces (EIF) 2 * 5 = 10
Count-total Æ 378
So sum of all Fi (i ¨ 1 to 14) = 4 + 1 + 0 + 3 + 5 + 4 + 4 + 3 + 3 + 2 + 2 + 4 + 5 = 43 FP = Count-total * [0.65 + 0.01 * S (Fi )] = 378 * [0.65 + 0.01 * 43]

Software Metrics 41
= 378 * [0.65 + 0.43] = 378 * 1.08 = 408 Productivity = FP/ Effort = 408 / 36.9 = 11.1 Total pages of documentation = technical document + user document = 265 + 122 = 387 pages Documentation = Pages of documentation/FP = 387/408 = 0.94 Cost per function = cost/ productivity = 7744/ 11.1 = $700
Example 4 Compute the function point value for a project with the following information domain characteristics: (1) No. of user inputs = 24 (2) No. of user outputs = 65 (3) No. of user inquiries = 12 (4) No. of files = 12 (5) No. of external interfaces = 4Assume all complexity adjustment values are moderate and 14 algorithms have been counted. (GGSIPU, B.Tech (CSE/IT)-4th Sem. May 2010)
Solution: We draw the Table 4 firstly, using Table 2.3:
Table 3 Computing FPs
Measurement Parameter Count Weighing factorSimple Average Complex
1. Number of external inputs (EI) 24 * 4 = 962. Number of external outputs (EO) 65 * 5 = 3253. Number of external inquiries (EQ) 12 * 4 = 484. Number of internal files (ILF) 12 * 10 = 1205. Number of external interfaces (EIF) 4 * 7 = 28
Count-total Æ 617
Now Fi for moderate case = 2. So sum of all Fi (i ¨ 1 to 14) = 14 * 2 = 28
FP = Count-total * [0.65 + 0.01 * S (Fi )] = 617 * [0.65 + 0.01 * 28] = 617 * [0.65 + 0.28] = 617 * 1.23 = 758.91 = 759

42 Modern Software Engineering
Example 5 Compute the function point value for a project with the following information domain characteristics: (1) No. of user inputs = 30 (2) No. of user outputs = 20 (3) No. of user inquiries = 08 (4) No. of files = 7 (5) No. of external interfaces = 6
Assume all complexity adjustment values are moderate and 14 algorithms have been counted.
Solution: We draw the Table 4 firstly, using Table 2.3:
Table 4 Computing FPs
Measurement Parameter Count Weighing factorSimple Average Complex
1. Number of external inputs (EI) 30 * 4 = 1202. Number of external outputs (EO) 20 * 5 = 1003. Number of external inquiries (EQ) 8 * 4 = 324. Number of internal files (ILF) 7 * 10 = 705. Number of external interfaces (EIF) 6 * 7 = 42
Count-total Æ 364
Now Fi for moderate case = 2. So sum of all Fi (i ¨ 1 to 14) = 14 * 2 = 28
FP = Count-total * [0.65 + 0.01 * S (Fi ) ] = 364 * [0.65 + 0.01 * 28] = 364 * [0.65 + 0.28] = 364 * 1.23 = 447.72 = 448
2.4.4 Extended Function Point (EFP) Metrics
FP metric has been further extended to compute: (a) Feature points. (b) 3D function points.Feature Points:According to Jones, 1. Feature point is the superset of function point measure that can be applied to systems and
engineering software applications.

Software Metrics 43
2. The feature points are used in those applications in which the algorithmic complexity is high like real-time systems where time constraints are there, embedded systems, etc.
3. Feature points are computed by counting the information domain values and are weighed by only single weight.
4. Feature point includes another measurement parameter—ALGORITHM. 5. The table for the computation of feature point is as follows:
Table 2.4 Feature Point Calculations
Measurement Parameter Count Weighing factor
1. Number of external inputs (EI) – * 4 —2. Number of external outputs (EO) – * 5 —3. Number of external inquiries (EQ) – * 4 —4. Number of internal files (ILF) – * 7 —5. Number of external interfaces (EIF) – * 7 —6. Algorithms used – * 3 —Count-total Æ —
The feature point is thus calculated with the following formula:
FP = Count-total * [0.65 + 0.01 * S (Fi ) ] = Count-total * CAFwhere count-total is obtained from the above table.
CAF = [0.65 + 0.01 * S (Fi ) ]
and S (Fi) is the sum of all 14 questionnaires and show the complexity adjustment value/factor-CAF (where i ranges from 1 to 14). Usually a student is provided with the value of S (Fi). 6. Function point and feature point both represent systems functionality only. 7. For real-time applications that are very complex, the feature point is between 20 and 35%
higher than the count determined using function point above.3D-Function PointsAccording to Boeing, 1. Three dimensions may be used to represent 3D function points–data dimension, functional
dimension and control dimension. 2. The data dimension is evaluated as FPs are calculated. Herein, counts are made for inputs,
outputs, inquiries, external interfaces and files. 3. The functional dimension adds another feature—Transformation, that is, the sequence
of steps which transforms input to output. 4. The control dimension that adds another feature—Transition that is defined as the total
number of transitions between states. A state represents some externally observable mode

Software Metrics 45
Table 5 Computing FPs
Measurement Parameter Count Weighing factor Simple Average Complex
1. Number of external inputs (EI) 32 * 3 4 6 = 1282. Number of external outputs (EO) 60 * 4 5 7 = 3003. Number of external inquiries (EQ) 24 * 3 4 6 = 964. Number of internal files (ILF) 8 * 7 10 15 = 805. Number of external interfaces (EIF) 2 * 5 7 10 = 14
Count-total Æ 618
Now Fi for average case = 3. So sum of all Fi (i ¨ 1 to 14) = 14 * 3 = 42
FP = Count-total * [0.65 + 0.01 * ∑ (Fi ) ] = 618 * [0.65 + 0.01 * 42] = 618 * [0.65 + 0.42] = 618 * 1.07 = 661.26
and feature point = (32 *4 + 60 * 5 + 24 * 4 + 80 +14) * 1.07 + {12 * 15 *1.07} = 853.86
Example 2 Compute the 3D-function point value for an embedded system with the following characteristics:
(1) Internal data structures = 6 (2) External data structures = 3 (3) No. of user inputs = 12 (4) No. of user outputs = 60 (5) No. of user inquiries = 9 (6) No. of external interfaces = 3 (7) Transformations = 36 (8) Transitions = 24
Assume complexity of the above counts is high. [RGTU June 2004]
Solution: We draw the Table 6 first. For embedded systems, the weighting factor is complex and complexity is high. So,

46 Modern Software Engineering
Table 6 Computing FPs
Measurement Parameter Count Weighing factor Simple Average Complex
1. Number of external inputs (EI) 12 * 3 4 6 = 722. Number of external outputs (EO) 60 * 4 5 7 = 4203. Number of external inquiries (EQ) 9 * 3 4 6 = 544. Number of internal data structure 6 * 7 10 15 = 905. Number of external data structure 3 * 5 7 10 = 306. Number of external interfaces 3 * 5 7 10 = 307. Number of transformations 36 * —— 368. Number of transitions 24 * —— 24
Count-total Æ 756
So, for 3D function points, the required index is 756.
2.5 CASE TOOLS FOR SOFTWARE METRICS
Many CASE tools (Computer Aided Software Engineering tools) exist for measuring software. They are either open source or are paid tools. Some of them are listed below: 1. Analyst4j tool is based on the Eclipse platform and available as a stand-alone Rich Client
Application or as an Eclipse IDE plug-in. It features search, metrics, analyzing quality, and report generation for Java programs.
2. CCCC is an open source command-line tool. It analyzes C++ and Java lines and generates reports on various metrics, including Lines of Code and metrics proposed by Chidamber & Kemerer and Henry & Kafura.
3. Chidamber & Kemerer Java Metrics is an open source command-line tool. It calculates the C&K object-oriented metrics by processing the byte-code of compiled Java.
4. Dependency Finder is an open source. It is a suite of tools for analyzing compiled Java code. Its core is a dependency analysis application that extracts dependency graphs and mines them for useful information. This application comes as a command-line tool, a Swing-based application and a web application.
5. Eclipse Metrics Plug-in 1.3.6 by Frank Sauer is an open source metrics calculation and dependency analyzer plugin for the Eclipse IDE. It measures various metrics and detects cycles in package and type dependencies.
6. Eclipse Metrics Plug-in 3.4 by Lance Walton is open source. It calculates various metrics during build cycles and warns, via the problems view, of metrics ‘range violations’.
7. OOMeter is an experimental software metrics tool developed by Alghamdi. It accepts Java/C# source code and UML models in XMI and calculates various metrics.
8. Semmle is an Eclipse plug-in. It provides an SQL like querying language for object-oriented code, which allows searching for bugs, measure code metrics, etc.

48 Modern Software Engineering
9. 3D Function Point method was proposed by: (a) Boeing (b) Jacobson (c) Albrecht (d) None of the above 10. Total number of General System Characteristics (GSCs) are: (a) 12 (b) 13 (c) 14 (d) 15
Answers
1. (b) 2. (a) 3. (c) 4. (b) 5. (a) 6. (b) 7. (c) 8. (a) 9. (a) 10. (c)
SHORT QUESTIONS WITH ANSWERS
1. Distinguish between FP and LOC measures. Ans. 1: Let us tabulate the differences between the two:
FP LOC1. FP is specification based. 1. LOC is analogy based.2. FP is language independent. 2. LOC is language dependent.3. FP is user-oriented. 3. LOC is design-oriented.4. It is extendible to LOC. 4. It is convertible to FP (backfiring).
2. What is Bang Metrics? Ans. 2: Bang metrics is a function metric indicating the size of the system. It measures the
total functionality of the software system delivered to the user. It was defined by DeMarco. He suggests that the goal of a good project is to maximize ‘BANG PER BUCK’ that is, bang divided by the total project cost.
3. How can we compute the estimated value of the software size? Ans. 3: The expected value for the estimation variable (size, S) can be calculated as the
weighted average of Optimistic value-good over bad (a), most likely (m) and pessimistic value-not sure value (b) estimates as follows:
S = (a + 4m + b)/6 where S is the FP estimate and the condition a < m < b also holds. 4. Say, for a language, Size = 100FP and LOC/FP is 128. Compute corresponding
LOC? [GGSIPU, B. Tech (CSE)-7TH sem., 2009] Ans. 4: LOC = (100) * (128) = 12,800 = 12.8KLOC. 5. Is it possible for different engineers to arrive at different FP measures for the same
problem? Ans. 5: Yes, it is possible. Let us take an example of this. Say, if a data employee details
consists of the employees name, his address, then one person may consider it to be a single