2 generalized osteoporosis
16
2 Generalized Osteoporosis
-
Upload
muhammad-bin-zulfiqar -
Category
Education
-
view
60 -
download
5
Transcript of 2 generalized osteoporosis
2 Generalized Osteoporosis

CLINICAL IMAGAGINGAN ATLAS OF DIFFERENTIAL DAIGNOSIS
EISENBERG
DR. Muhammad Bin Zulfiqar PGR-FCPS III SIMS/SHL

• Fig B 2-1 Osteoporosis of aging. Generalized demineralization of the spine in a postmenopausal woman. The cortex appears as a thin line that is relatively dense and prominent (picture-frame pattern).

• Fig B 2-2 Steroid therapy. Lateral view of the thoracic spine in a patient on high-dose steroid therapy for dermatomyositis demonstrates severe osteoporosis with thinning of cortical margins and biconcave deformities of vertebral bodies.

• Fig B 2-3 Scurvy. (A and B) Frontal views of both knees demonstrate widening and increased density of the zone of provisional calcification, producing the characteristic white line of scurvy. Note also the submetaphyseal zone of lucency and the characteristic marginal spur formation (Pelken's spur). The epiphyseal ossification centers are surrounded by a dense, sharply demarcated ring of calcification (Wimberger's sign).

• Fig B 2-4 Cushing's syndrome due to adrenal hyperplasia. Marked demineralization and an almost complete loss of trabeculae in the lumbar spine. The vertebral end plates are mildly concave, and the intervertebral disk spaces are slightly widened. Note the compression of the superior end plate of L4.3

• Fig B 2-5 Multiple myeloma. (A) Diffuse skeletal deossification involving the pelvis and proximal femurs. (B) Generalized demineralization of the humerus with thinning of the cortices.

• Fig B 2-6 Leukemia. Patchy areas of deossification throughout the metacarpals and phalanges.

• Fig B 2-7 Thalassemia. Lateral view of the ankle demonstrates pronounced widening of the medullary spaces with thinning of the cortices. Note the absence of normal modeling due to the pressure of the expanding marrow space. Localized radiolucencies simulating multiple osteolytic lesions represent tumorous collections of hyperplastic marrow.

• Fig B 2-8 Juvenile rheumatoid arthritis. Lateral view of the ankle demonstrates severe demineralization of bone. Note the pronounced narrowing of the joints involving the talus and other tarsal bones.

• Fig B 2-9 Osteogenesis imperfecta. Pronounced osteoporosis and cortical thinning of all bones with evidence of previous fractures and resultant deformities.

• Fig B 2-10 Muscular dystrophy. Thin, demineralized bones of the lower leg. The increased lucency, representing fatty infiltration in muscle bundles, makes the fascial sheaths appear as thin shadows of increased density (arrows) surrounded by fat.
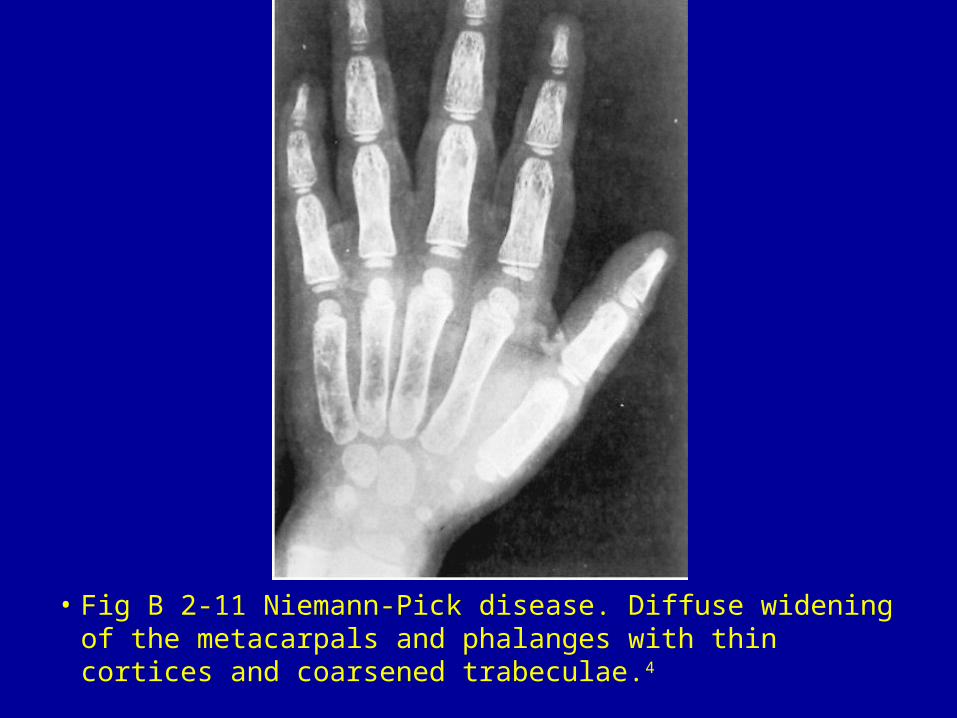
• Fig B 2-11 Niemann-Pick disease. Diffuse widening of the metacarpals and phalanges with thin cortices and coarsened trabeculae.4