Determination of Serological Markers (Blood group markers ...

Intra-population comparison of vegetative and floral trait heritabilities estimated
from molecular markers in wild Aquilegia populations
1
2
3
4
5
6
7
8
9
10
11
MARIA CLARA CASTELLANOS, 1 JULIO M. ALCÁNTARA,2 PEDRO J. REY 2
and JESUS M. BASTIDA2
1 Consejo Superior de Investigaciones Científicas, Centro de Investigaciones sobre
Desertificación (CSIC-UV-GV), 46470 Albal, Valencia, Spain
2Departamento de Biología Animal, Biología Vegetal y Ecología, Universidad de Jaén, 23071
Jaén, Spain.
12
13
14
15
16
Correspondence: M. C. Castellanos, Fax: +34 96 127 0967; E-mail: [email protected]
Keywords: columbine, evolvability, heritability, microsatellites, relatedness, pollinators.
Running title: h2 of floral versus vegetative traits
1

Abstract 17
18
19
20
21
22
23
24
25
26
27
28
29
30
31
32
33
34
35
Measuring heritable genetic variation is important for understanding patterns of trait
evolution in wild populations, and yet studies of quantitative genetic parameters
estimated directly in the field are limited by logistic constraints, such as the difficulties
of inferring relatedness among individuals in the wild. Marker-based approaches have
received attention because they can potentially be applied directly to wild populations.
For long-lived, self-compatible plant species where pedigrees are inadequate, the
regression-based method proposed by Ritland has the appeal of estimating heritabilities
from marker-based estimates of relatedness. The method has been difficult to implement
in some plant populations, however, because it requires significant variance in
relatedness across the population. Here we show that the method can be readily applied
to compare the ability of different traits to respond to selection, within populations. For
several taxa of the perennial herb genus Aquilegia, we estimated heritabilities of floral
and vegetative traits and, combined with estimates of natural selection, compared the
ability to respond to selection of both types of traits under current conditions. The intra-
population comparisons showed that vegetative traits have a higher potential for
evolution, because although they are as heritable as floral traits, selection on them is
stronger. These patterns of potential evolution are consistent with macroevolutionary
trends in the European lineage of the genus.
2

Introduction 36
37
38
39
40
41
42
43
44
45
46
47
48
49
50
51
52
53
54
55
56
57
58
59
60
The presence of genetic variation is a precondition for the evolution of any trait, but
in spite of its importance in predicting a character’s ability to respond to selection,
measuring heritability and other quantitative genetic parameters in wild plant
populations under natural conditions is still rarely done. This is mostly the consequence
of the inherent difficulty in assigning genealogical relationships among wild
individuals. Traditionally, plant quantitative genetic studies are performed with
individuals of known pedigree grown under controlled conditions or transplanted to the
field (Riska et al. 1989; Shaw 1986). These studies are the basis of what we know today
of trait inheritance and genetic correlations, and yet they do not necessarily reflect how
traits are expressed in natural conditions (Campbell 1996; Conner et al. 2003; Winn
2004). Marker-based methods that can be applied directly to wild populations to
estimate relationship and quantitative genetic parameters have therefore received much
attention recently, particularly for animal populations, and to a smaller extent, to plants
as well (Ritland 2000; Garant & Kruuk 2005).
Marker-based field measurements of heritability (h2) and other quantitative genetic
parameters have several advantages over controlled experimental studies. The first is
that they incorporate the effects of environmental variation and natural mating patterns
on the phenotypes that actually face natural selection. Studies under controlled
conditions have been shown to underestimate environmental effects, and therefore to
inflate h2 values compared to those estimated in the field (Montalvo & Shaw 1994;
Schoen et al. 1994; Conner et al. 2003; but see Ritland & Ritland 1996). Second,
marker-based methods can be the only alternative for the studying the vast number of
long-lived plant species where controlled experiments are impractical or unfeasible,
particularly if individuals are large or take years to reproduce ( Ritland & Travis 2004;
3

Andrew et al. 2005). In addition, controlled conditions are also inappropriate for plants
with mixed mating systems that are difficult to emulate with manual pollinations. A
third advantage of field methods is that they can be applied in studies that require large
spatial or temporal scales that cannot be addressed with controlled crosses, such as to
detect whether trait heritabilities change across years in a population, or to estimate
genetic parameters in multiple populations as required by studies of character
divergence. It is therefore important to test marker-based methods and their
applicability to different plant populations.
61
62
63
64
65
66
67
68
69
70
71
72
73
74
75
76
77
78
79
80
81
82
83
84
85
Analytical tools have been developed for inference of quantitative genetic parameters
for field data sets both with partial or complete pedigrees, and for the estimation of
relatedness with no previous knowledge or assumptions about a population’s
genealogical structure (reviewed by Garant & Kruuk 2005). In principle, the
reconstruction of a pedigree is best for the estimation of quantitative genetic parameters
in a natural population (e.g. the "animal model"; Thomas et al. 2002; Garant & Kruuk
2005). Pedigree reconstruction methods require at least some previous information,
such as discriminating adults from offspring, or behavioural observations of possible
matings. Even with such information, marker-based pedigree reconstruction methods
for wild populations are not perfect (Butler et al. 2004), as they are sensitive to data
errors and mutations. Furthermore, under some circumstances pedigrees might not even
be desirable. For many long-lived plant species where individuals can self-pollinate and
generations are indistinguishable in the field, the reconstruction of a pedigree is not only
troublesome, but it is likely that a continuous measure of relatedness is even a better
representation of relationships.
For such plant populations, one pedigree-free alternative for estimating heritabilities
is Ritland (2006)’s regression-based method, which relies on pairwise relatedness
4
86
87
88
89
90
91
92
93
94
95
96
97
98
99
100
101
102
103
104
105
106
107
108
109
110
estimates and phenotypic similarity to estimate heritability of the traits of interest
through linear regression. Several marker-based estimators of relatedness have been
developed (reviewed by Blouin 2003), and although they are not error-free, they can be
used in Ritland’s regression approach in combination with an estimation of the actual
variance in relatedness (Var(r)) in the population. The method requires that populations
harbour significant Var(r) (i.e that there is a mixture pairs of individuals related to
various degrees), which is one of the major obstacles for its application to wild
populations ( Ritland 1996; Csilléry et al. 2006; Shikano 2008).
In tests involving populations of obligate outbreeders where authors have compared
h2 values estimated by Ritland’s method and other pedigree-based methods, Ritland’s
estimates are often found to be inaccurate (Thomas et al. 2002; Coltman 2005; Frentiu
et al. 2008; Van Horn et al. 2008; but see DiBattista et al. 2008). However, outbred
vertebrates often present low variance in relatedness (Csilléry et al. 2006). In other
organisms, evidence that Ritland-based estimations can be reasonably accurate is slowly
accumulating (Andrew et al. 2005; DiBattista et al. 2008; Herrera & Bazaga 2009;
Anderson et al. 2010). Andrew et al. (2005), for instance, successfully estimated
heritabilities of defence chemicals in a population of a long-lived tree species and
argued that, provided that there is enough variance in relatedness, it can be a useful
approach. Yet even if this requirement is met, estimation of heritabilities using
molecular markers can suffer from low statistical power (Ritland 1996; Rodríguez-
Ramilo et al. 2007), as is the case for the estimation of quantitative parameters with
other methods (Mitchell-Olds & Rutledge 1986). Large sample sizes and highly
polymorphic markers might be required, and this might have helped prevent the use of
this method more extensively. However, small population sizes is the rule for many
plant species. Here, we test the regression approach for small wild populations, aiming
5

111
112
113
114
115
116
117
118
119
120
121
122
123
124
125
126
127
128
129
130
131
132
133
134
135
to make intrapopulation comparisons of trait heritabilities, rather than trying to compare
estimates across-taxa. Even if estimates are not accurate, and even outside of the
theoretical range, we show that this approach can be useful when within-population
comparisons are needed.
We estimated heritabilities of floral and vegetative traits in Iberian populations of the
herb genus Aquilegia (Ranunculaceae) in order to compare the ability to respond to
selection of both types of traits within each population. In Aquilegia, two contrasting,
recent radiations have occurred simultaneously in North America and Europe, after the
colonization by an Asian ancestor, and both have given rise to about the same number
of species (Bastida et al. 2010). In the New World, the diversification of the group has
been associated with floral adaptation to different pollinators (Grant 1952; Hodges &
Arnold 1995). Specialized floral morphological features, mainly the elongated petals
that form a nectariferous spur, help determine the identity of the pollinators that can
reach the nectar, and lead to rapid floral specialization on bees, hummingbirds or moths,
and ultimately to reproductive isolation (Whittall & Hodges 2007). Even though habitat
characteristics also differ between North American Aquilegia species (Chase & Raven
1975; Hodges & Arnold 1994), the major role of pollinators is evident because shifts to
different pollinators are common in the phylogeny (Whittall & Hodges 2007) and recent
speciation events may have occurred in sympatry (Bastida et al. 2010). In contrast,
pollinator shifts are absent from the European lineage (all species are pollinated by
bumblebees and other bees), while habitat shifts have been common (Bastida et al.
2010). In addition, at least in some groups, vegetative traits are more important than
floral traits in differentiating species (Medrano et al. 2006). A recent study further
shows that vegetative traits in Iberian columbines have diverged in response to
adaptation to different habitats (Alcántara et al. 2010). Still, floral characteristics do
6
136
137
138
139
140
141
142
143
144
145
146
147
148
149
150
151
152
153
154
155
156
157
158
159
160
161
vary among species and even among populations of the same species (Gafta et al. 2006;
Medrano et al. 2006).
In this study we compare the current ability to respond to selection of floral versus
vegetative traits in European Aquilegia populations in two widely distributed subspecies
(Aquilegia vulgaris vulgaris and A. pyrenaica pyrenaica) and their endemic sister taxa
(A. v. nevadensis and A. p. cazorlensis). We test Ritland’s methods in these small, but
substructured populations. Although current response to selection does not necessarily
directly inform us about macroevolutionary patterns, we also aimed to find out if
current microevolutionary patterns in populations of different taxa agree with the
macroevolutionary patterns in the European lineage of the genus.
Materials and methods
Study species
Columbines are perennial rhizomatous herbs with one or a few basal rosettes that can
bear erect, paniculate inflorescences with one to several flowers. This study included 15
Aquilegia populations belonging to two subspecies of each of the two most common
species in the Iberian Peninsula, A. vulgaris and A. pyrenaica (Table 1). Aquilegia
vulgaris is widely distributed throughout Eurasian mountain forests, open woodlands
and meadows. A. vulgaris subsp. vulgaris is the most common subspecies; populations
in this study grow along stream margins or poorly drained open meadows around
springs from 1100 to 1700 m of elevation, but this subspecies can be found at lower
elevations including sea level. In contrast, A. vulgaris subsp. nevadensis is restricted to
the Sierras Béticas of Southern Spain, where populations grow on moist forest soils but
also in wet alpine meadows and scrublands, between 1500 and 2100 m of altitude.
Aquilegia pyrenaica subsp. pyrenaica has a wide distribution through the Pyrenees and
7
162
163
164
165
166
167
168
169
170
171
172
173
174
175
176
177
178
179
180
181
182
183
184
185
186
Cantabrian Mountains in Northern Spain, with high altitude populations growing in
alpine meadows, rocky outcrops and rocky grasslands between 1200 and 2250 m of
altitude. Its congeneric A. pyrenaica subsp. cazorlensis is in contrast a narrow endemic
to the Sierras of Cazorla and El Pozo, in Southeastern Spain. The few known
populations grow between 1400 and 2000 m of altitude in rifts of limestone outcrops
and on sandy soils in shady, damp sites at cliff bases. Details on the populations in this
study can be found in Table 1.
An average of 45 (21-60) mature individuals in each population were selected for
this study in the blooming season of 2007. Sample sizes were constrained by the sizes
of the populations, which are very small in some cases (Table 1), as well as the number
of blooming individuals. From each individual we collected fresh leaves, a single petal
and sepal, and a ripe fruit capsule. The leaves were silica gel-dried for DNA extraction.
Phenotypic characterization and seed production
Digital images of dried petals and sepals were used to measure six floral traits for
each individual plant. Aquilegia sepals tend to be large and colourful, and function as
advertisement along with the petals. The petals present elongated spurs that form a tube
and get narrower towards the nectariferous tip. We measured three traits potentially
related to floral advertisement: sepal width, sepal length, and petal blade length; and
three traits related to the mechanical interaction of the flower with the floral visitor: spur
length, spur width at its aperture and spur width above the nectary. Measurements were
taken on calibrated digital images using SigmaScan Pro (version 5.0). Additionally, six
vegetative traits, measured for the same individuals by Alcántara et al. (2010) are also
used here for estimations of heritability in comparison with floral traits: height of the
tallest inflorescence, total number of leaves, length of the longest leaf, number of
8

187
188
189
190
191
192
193
194
195
196
197
198
199
200
201
202
203
204
205
206
207
208
209
210
211
flowers per inflorescence, specific leaf area, and density of non-glandular pubescence in
leaves. Specific leaf area was determined in the laboratory from a sample of the longest
leaf, and the density of pubescence in the leaves was estimated under dissection
binoculars from fresh epidermal tissue (details in Alcántara et al. 2010). In addition,
seed production of each individual plant was estimated as the product of a) the number
of healthy seeds produced in a single fruit collected in the field and b) the total number
of ripe carpels produced by the plant.
DNA extraction and microsatellite analysis
DNA of each individual plant was extracted from dried leaf material using the
Speedtools Plant DNA Extraction Kit (Biotools, Madrid, Spain). We amplified 10
microsatellite loci, chosen among those developed for North American Aquilegia by
(Yang et al. 2005), with some modifications on the PCR protocol. For 20 μL PCRs, we
added template DNA, 0.25 μM of each primer (forward primers were labelled with
flourophores), 0.1mM of each dNTP, 1 unit of Taq polymerase, 3.5 mM of MgCl2, and
1x reaction buffer. PCR reactions started with a 4-min denaturation phase at 94 ºC,
flowed by 38 cycles of 94 ºC, 45 s; 56-62 ºC, 45 s; 72 ºC, 45 s, and a final extension
step of 72 ºC for 10 minutes. Fragment analysis was carried out on an ABI 3730 DNA
Analyzer (Applied Biosystems). We visualized peaks with Genemapper Software v.4.0
(Applied Biosystems, Foster City, CA) and used MstatAlelle in R (Alberto 2009)
combined with manual checking for allele scoring. One locus (10-15) failed to amplify
in two Aquilegia p. cazorlensis populations (Table S1, Supporting information).
For each genotyped population, we checked for linkage disequilibrium (LD) and
deviations from Hardy-Weinberg equilibrium in Genepop 4.0 (Rousset 2008). There
was no evidence of LD, as no pair of loci showed a consistent correlation across
9

212
213
214
215
216
217
218
219
220
221
222
223
224
225
226
227
228
229
230
231
232
233
234
235
populations within each species. Homozygote excess compared to HW expectations
suggested potential null alleles for several loci in some populations. In most cases,
several loci showed deviations within a population. Except for one locus (50-21) in one
population (Cabañas), however, there was no evidence of homozygotes for the potential
null alleles, as calculated from their frequencies estimated in ML-RELATE (Kalinowski
et al. 2006). Because populations show deviations from equilibrium in several loci, a
more likely explanation is population substructure, as expected if the populations are
divided into a series of closely related or inbred family groups. This is likely the case
for our small, poorly-dispersed, self-compatible columbines. Population substructure is
actually useful for the relatedness estimations intended in this work (see below).
Exclusion of the locus with evidence of null alleles in Cabañas had no qualitative effect
on the analyses.
Estimates of relatedness
Molecular marker data allow for the estimation of relatedness among individuals in a
population, provided enough polymorphism exists. Several estimators of relatedness
have been developed and their effectiveness depends on the populations of study (Van
de Casteele et al. 2001; Blouin 2003). The later authors suggested using simulations
based on the allele frequencies of the study populations to decide on the best estimator
for relatedness. We used Monte-Carlo simulations implemented in the software Mark
(Ritland 1996) to determine the best estimator of relatedness for each one of our
Aquilegia populations. Ritland’s R estimator provided the most reliable estimation
(lowest error) of relatedness (r) and actual variance of relatedness (Var(r)) for all
populations, when compared to Queller and Goodnight (1989), Lynch and Ritland
10
(1999), and Wang (2002) methods. We estimated relatedness r for all pairs of
individuals of each population using Mark, as well as the population’s Var(r).
236
237
238
239
240
241
242
243
244
245
246
247
248
249
250
251
252
253
254
255
256
257
258
259
260
Estimates of heritability
The relatedness values inferred from microsatellite markers can next be correlated
with phenotypic similarity to estimate heritability of individual traits. We used Ritland’s
regression method to estimate heritabilities, as implemented in the program Mark (v.
3.1). Ritland’s (1996) method relies on pairwise relatedness estimates and pairwise
phenotypic similarity to estimate heritability of the traits of interest through linear
regression. Pairwise similarity for individuals i and j and trait Y is calculated as
Zij= (Yi – U)(Yj –U)/V
where U and V are the mean and variance of the phenotypic trait in the sample. The
average Zij among all pairs is the phenotypic correlation and can be estimated as a
combination of shared alleles and environments:
Zij = 2rij h2 + re + eij
where rij is the relatedness, re is a correlation due to shared environment, and eij is the
error. Incorporating a correlation due to shared environments is important, because in
natural populations relatives might be clustered in space and phenotypic variance
caused by environmental factors could confound the phenotypic correlation between
them. Over all pairs of individuals in the sample, the estimated heritability is then
11

h2= cov(Zij, rij)/2 Var(rij) 261
262
263
264
265
266
267
268
269
270
271
272
273
274
275
276
277
278
279
280
281
282
283
284
285
where Var(rij) is the actual variance in relatedness, a population parameter that needs
to be high for this method to work. Var(rij) is estimated with a weighted ANOVA of
estimates of relatedness of independent loci (see details in Ritland 1996). The
significance of all estimates was calculated with the percentile method, based on 1000
bootstrap replications where individuals are resampled. An estimate was considered
significantly different from zero if the 95% confidence interval was higher than zero.
We compared values of estimated h2 for floral and vegetative traits within
populations. The accuracy of estimates of h2 decreases as the square of Var(rij). Since
our estimates of actual variance in relatedness span one order of magnitude among
populations (from 0.002 to 0.03; see results), the differences in accuracy span two
orders of magnitude. This strongly prevents against comparisons of the estimated values
of heritability among populations or taxa. However, this would not affect comparisons
of heritability estimates for different traits within populations as long as Var(rij) is kept
constant within population (i.e. the same set of individuals is used to estimate h2 in all
traits). On the other hand, we did not attempt to calculate genetic correlations among
traits for our populations, as the error of Ritland’s method for this parameter is even
larger than that of heritability. Instead, we rely on phenotypic correlations as an
indication of potential correlated evolution of floral and vegetative traits.
Estimates of selection
We estimated directional selection in each Aquilegia population for the study year,
using total seed production as a proxy for female reproductive success. Our sample
sizes per population were insufficient for a joint analysis of directional selection on 12
12

286
287
288
289
290
291
292
293
294
295
296
297
298
299
300
301
302
303
304
305
306
307
308
309
310
311
traits; alternatively, we used principal components analysis (PCA) to generate new,
uncorrelated floral and vegetative variables. We ran PCAs separately on the six floral
and the six vegetative traits, log- or square root-transformed as necessary. The resulting
two main principal components (PCs) of the floral ordination account together for 78%
of the across-population variance, while the two main vegetative factors account for
69% of the variance. In both cases, all traits correlate strongly with the first or the
second factor of its respective ordination (Table S2, Supporting information). Discarded
PCs had eigenvalues <1 (Kaiser-Guttman criterion for exclusion; Jackson 1993).
We then used these four PCs as composite variables to obtain estimates of
phenotypic selection using the approach by Lande and Arnold (1983). PCs were
standardized to zero mean and unit variance and used to estimate directional selection
gradients (β) for each Aquilegia population using multiple regression analysis on
relative seed production. These gradients measure the strength of direct selection on
each PC independent from the others. Individual plants with missing trait values were
excluded from the PCAs, and two populations with low resulting sample sizes were
excluded altogether (B. Jabalises and Garrotegordo). To simplify our assessment of
ability to respond to selection of the PC variables, we calculated heritabilities of PCs as
well, using the scores of each PC as individual values. Estimating genetic parameters on
PC factors is common practice on sets of traits that are potentially genetically correlated
(see e.g. Keller et al. 2001).
Results
Phenotypic correlations
In total, we characterized 689 individuals from 15 Aquilegia populations belonging
to different subspecies of the most common Iberian species, A. vulgaris and A.
pyrenaica (Table 1; see Table S3, Supporting information for mean values). All
13

312
313
314
315
316
317
318
319
320
321
322
323
324
325
326
327
328
329
330
331
332
333
334
335
336
subspecies and also all populations within subspecies differ from each other in all six
floral traits measured (Table 2), as they do for six vegetative traits (Alcántara et al.
2010).
We estimated phenotypic correlations among ln-transformed traits for each
population. The actual pairs of traits that are significantly correlated vary from one
population to another, but two general patterns hold for all 15 populations (see Table
S4, Supporting information, for the correlation matrix of one A. v. vulgaris population,
Jabalises, as an example): floral traits are more likely to be correlated among themselves
than vegetative traits, and floral and vegetative traits are only occasionally correlated.
For all populations, on average, 10 (± 2.9) of the 12 possible correlations among floral
traits are significant (and positive), while 4.2 (± 1.5) out of 12 of vegetative traits are.
Finally, 7.6 (± 5.1) of the 36 possible correlations between floral and vegetative traits
are significant and can be either positive or negative.
Relatedness
Two A. v. vulgaris populations (Garrotegordo and F. Reina) with very low allelic
variation were excluded from the molecular analyses, because error estimation of
relatedness increases highly in such cases. In general, we found high values of mean
pairwise relatedness, r, for the remaining 13 populations, which varied from 0.137 and
0.388 and were uncorrelated with population size (Fig. 1; Pearson rp=-0.14, p= 0.65).
Relatedness was particularly high for A. v. nevadensis populations. The variance in
relatedness, Var(r), was significantly greater than zero in all populations and ranged
between 0.002-0.03.
Heritability
14

The significant values of Var(r) allowed us to test for statistical significance of
heritability estimates for all traits in 13 populations. Most traits in most populations
showed h
337
338
339
340
341
342
343
344
345
346
347
348
349
350
351
352
353
354
355
356
357
358
359
360
361
2 values that were not significantly different from zero, with some exceptions
(Table 3). Estimates of h2 outside of the theoretical range (0<h2<1) are a consequence of
Ritland’s method and would represent a problem if we were interested in accurate h2
values, but in this case we focus on intra-population comparisons. Due to space
limitations, table 3 does not include the values for re, the correlation due to shared
environment included in the model. This correlation was not significantly higher than
zero in any of the traits or populations, indicating that there were no local environmental
effects (i.e. patchiness) that differentially affected related individuals growing close to
each other.
In general, vegetative and floral traits show similar h2 values: in a comparison of six
floral versus six vegetative traits for all populations using paired t-tests (which restrict
comparisons to within-population), only 1 of the 36 contrasts was significant (sepal
length versus SLA). When comparing mean values of floral versus vegetative traits
within each population we found that in only two populations, each of a different
species, floral traits were more heritable when compared to vegetative traits of the same
population (t=2.306, p=0.028 for B. Canal and t=3.27, p=0.008 for Cortijuela). When
focusing on the significance of heritability values only, a notable trend is that for the
two widespread taxa, A. v. vulgaris and A.p. pyrenaica, there is essentially no trait with
detectable heritability in any population. All but one of the heritable traits we could
detect are in the more restricted, endemic subspecies.
15

Phenotypic selection and ability to respond to selection 362
363
364
365
366
367
368
369
370
371
372
373
374
375
376
377
378
379
380
381
382
383
384
385
386
Condensing the variation in floral and vegetative traits in separate composite PC
variables seems appropriate, because floral traits are highly correlated among each other
and only occasionally with vegetative traits. Directional selection gradients on PC
factors were more often significant for vegetative than for floral traits. Out of the 26
gradients in each analysis (13 populations and 2 factors), only one was significant for
floral factors, while 13 were significant for vegetative factors (Table 4). In other words,
during the study year, floral traits were under selection only in Cabañas, while
vegetative traits showed directional selection in nine populations, including Cabañas.
Moreover, the mean strength of selection, estimated as the mean absolute value of
selection gradients across populations, was higher for the two vegetative factors (0.32
and 0.32) than for the floral factors (0.20 and 0.09).
Analysis of heritability in floral and vegetative PCs showed similar patterns as for
individual traits (Table 5; compare to Table 3). Within-population paired comparisons
between floral and vegetative heritability values found no significant differences, and
only a few of the h2 estimates are significantly different from zero. Table 5 includes also
the values of re, the average correlation between individuals caused by shared
environment. Again, this correlation was not significant for any population. The
potential for evolution of current traits is a function of the heritability values and the
strength of natural selection on each trait. A qualitative assessment of both h2 estimates
and selection gradients suggest that vegetative traits had higher potential for evolution
than floral traits in the same populations under the current selection regimes, even if
both types of traits are heritable, because selection is weaker and infrequent on floral
characteristics.
16
Discussion 387
388
389
390
391
392
393
394
395
396
397
398
399
400
401
402
403
404
405
406
407
408
409
410
411
412
The inherent logistic difficulties of direct field estimations of trait heritability have
prevented their extended use in plant evolutionary studies. In this study we were able to
estimate heritabilities of floral and vegetative traits directly in 13 Aquilegia populations
without any previous information on population structure. Although our estimated h2
values are not directly comparable to other species or between populations, the within-
population approach that we intended showed that there is no overall difference in
heritabilities between floral and vegetative traits. Estimates tend to be low and non-
significant, except in the more endemic taxa, and combined with measures of natural
selection, suggest a higher potential for evolution in vegetative traits. Below we discuss
the potential technical drawbacks of the analyses, and the implications of these results
for trait evolution in Aquilegia populations.
Field-based estimation of heritabilities
Our Aquilegia study populations have the appropriate genetic structure, i.e. a
significant variance in relatedness, crucial to apply Ritland’s regression-based method
to estimate heritability (Ritland 1996; Csilléry et al. 2006; Shikano 2008). This genetic
structure is likely the consequence of the limited seed dispersal and some level of self-
fertilization characteristic of Aquilegia, which lead to subpopulation structure even in
small populations.
Even though the requirement of significant Var (r) is met, heritability estimates are
noisy and often fall outside of the theoretical range (0 < h2 < 1), making across-
population comparisons unviable. Alternatives to Ritland’s method, however, are not
necessarily more appropriate for unpedigreed populations. A recent “pedigree-free
animal model” approach requires a positive definite relatedness matrix (Frentiu et al.
2008), which is difficult to build from pairwise r estimates and no previous generation
17

information. Maximum likelihood-based alternatives rely on a priori assumptions of the
distribution of relatedness in the study populations (Mousseau et al. 1998), i.e. at least
some previous information on the population genealogical structure is necessary.
413
414
415
416
417
418
419
420
421
422
423
424
425
426
427
428
429
430
431
432
433
434
435
436
437
The accuracy of heritability estimates based on Ritland’s method has been
questioned by several authors (Garant & Kruuk 2005; van Kleunen & Ritland 2005;
Rodríguez-Ramilo et al. 2007; Bouvet et al. 2008). For particular populations with
complete pedigrees and behavioural information, pairwise relatedness methods are
outperformed by pedigree-based methods (Thomas et al. 2002; Coltman 2005; Frentiu
et al. 2008; Van Horn et al. 2008). This can be caused, at least in part, by the lack of
variance in relatedness in many populations, particularly in obligate outbreeders
(Csilléry et al. 2006). In any case, relatedness estimates tend to have large variances
(Lynch & Ritland 1999; Ritland 2000) and a very high number of microsatellite loci or
genotyped individuals might be needed for precise heritability estimates. Even if
regression-based h2 estimates were not accurate, they still can be used for within-
population comparison of traits, as we do here (Klaper et al. 2001; Garant & Kruuk
2005; Bessega et al. 2009).
Evolutionary potential of floral and vegetative traits
In a review study considering more than 900 estimates of genetic correlations
Ashman and Majetic (2006) found that floral traits tend to be correlated to each other
and not to vegetative traits. Although we were not able to estimate genetic correlations
between traits for Aquilegia, phenotypic correlations show the same pattern and suggest
that variation in floral and vegetative traits in our study populations is decoupled and
can be analyzed separately. For both types of traits we detected low h2 values, which is
often the case in natural conditions (Schoen et al. 1994; Conner et al. 2003; Winn 2004
18

Blows & Hoffmann 2005), and appears to be also common for floral traits in self-
compatible species (Ashman & Majetic 2006). This later trend could be explained by
low genetic variation caused by inbreeding, but the low h
438
439
440
441
442
443
444
445
446
447
448
449
450
451
452
453
454
455
456
457
458
459
460
461
2 values in natural settings can
be in turn the consequence of high environmental variance rather than low additive
genetic variance. The estimation of h2 directly from uncontrolled environments can
confound the two sources of variance. In our analysis, however, we found no evidence
of local environmental differences that were associated with relatedness (re correlations
were non-significant) within populations, and by avoiding across-population
comparisons there is a smaller chance that our estimates are overwhelmed by
environmentally-related variance.
Our results suggest that floral and vegetative traits do not differ in their heritabilities,
and that therefore, their current differential ability to respond to selection depends on
the nature of selective pressures. Of course, contemporary evolvability does not
necessarily reflect past response to selection, because heritabilities can change (for
example, after strong events of selection or in variable environments, as in Wilson et al.
(2006) and selection regimes are well-known to vary in time (Clegg et al. 2008;
Siepielski et al. 2009). Our present analysis only considered selection gradients for one
reproductive season and on one fitness trait (seed production), which gives us only a
snapshot of how selection is acting in these populations. In addition, we were not able to
detect selection on specific traits, because we ran the analysis on composite floral and
vegetative variables. However, our global finding that vegetative traits currently have a
higher evolutionary potential than floral traits in Aquilegia is consistent with previous
evidence and strengthens the higher relative importance of vegetative adaptation over
floral adaptation in the radiation of the Iberian lineage.
19
First, even though floral characteristics do vary across Aquilegia species and even
among populations within species (Table 1), only vegetative traits differentiate taxa
significantly (Medrano et al. 2006). Compared to the North American lineage of the
genus, flowers of European species are much more uniform in form (pendent and short-
spurred) and color (blue or purple). The six floral traits in our analyses included both
traits potentially involved in pollinator attraction (sepal and petal dimensions) and
nectar spur characteristics, which have been shown to affect pollinator behaviour and
pollen transfer in North American Aquilegia (Fulton & Hodges 1999). We found no
consistent selection on these traits in this study, which is in accordance with what we
know about pollinators. European columbines have not been in contact with
hummingbirds (Bastida et al. 2010), and even though we have occasionally observed
hawkmoths visiting their flowers, lepidopteran pollinators are not important as they are
in North American species. Bumblebees and other bees are the main pollinators of all
Iberian species (unpublished results), and even though the specific taxa and relative
importance of floral visitors can vary among populations (Medrano et al. 2006), it
seems unlikely that their behavioural and morphological differences could promote
floral differentiation. In fact, a preliminary analysis of divergent selection on floral traits
in our 15 study populations did not find evidence of pollinator-mediated selection
(results not shown).
462
463
464
465
466
467
468
469
470
471
472
473
474
475
476
477
478
479
480
481
482
483
484
485
486
Second, Alcántara et al. (2010) found strong evidence of divergent selection on
inflorescence height, number of leaves and number of flowers per inflorescence in our
study populations, most likely as the result of adaptation to different elevations and the
amount of soil rockiness. Inflorescence height and number of flowers could also be
considered as attraction traits for pollinators, and the former is actually consistently
correlated with floral traits (see Table S4, Supporting information). However, along
20

with the number of leaves, both traits also reflect plant size and its associated
physiological costs. Alcántara et al. (2010) found that they are negatively correlated
with the amount of rocks in the soil, and therefore with water availability, and in
consequence smaller plant sizes are found in rocky habitats. This association could be
explained by phenotypic plasticity, but a common garden study with the same four taxa
found low plasticity in vegetative traits in response to soil depth (Bastida 2009). The
differentiation between taxa might be better explained by genetic differentiation, and the
low h
487
488
489
490
491
492
493
494
495
496
497
498
499
500
501
502
503
504
505
506
507
508
509
510
511
2 values we found for the same traits in this study are expected if selection has
been sustained through time.
Finally, our heritability results from two widespread subspecies and their endemic
sister subspecies are interesting, because differentiation among them is presumably
occurring at present. We found significant heritabilities much more often in populations
of the narrowly-restricted subspecies (A. v. nevadensis and A. p. cazorlensis), than in
their widespread relatives (A. v. vulgaris and A. p. pyrenaica). One possible explanation
is that within-population variance due to environment is higher in the later populations.
However, the low environmental correlations in our analyses do not support this
possibility. The low heritabilities instead suggest that genetic variation has been purged
of the widespread species in their more stable environments, while the narrowly-
distributed species still harbour genetic variance. Yet local differentiation of floral traits
in response to selection at the different populations of the endemic taxa is hardly
expected, because significant selection on floral traits was detected only in one of the
eight populations.
21

Concluding remarks 512
513
514
515
516
517
518
519
520
521
522
523
524
525
526
527
528
529
530
531
532
533
534
535
536
Columbine populations in our study are restricted to humid or shady environments,
and during the hot and dry summers, these habitats can be seen as islands surrounded by
inhospitable land. Under these conditions, selective pressures associated with different
habitats are strong on vegetative traits and can lead to diversification aided by the
isolation of individual populations (Bastida et al. 2010). It is likely that pollinator-
mediated selection has likely changed little since the arrival of the first Aquilegia
ancestors from Asia and, as a consequence, floral traits have had a minor role in the
radiation of this part of the genus. The examination of current ability to respond to
selection of floral and vegetative traits in multiple populations of columbines is
consistent with this model, even if current estimates of heritability are not quantitatively
accurate.
This study has exemplified a valuable use of Ritland´s marker-based method of
inferring heritabilities directly in wild populations, for cases where the within-
population comparison of genetic parameters is the focus of interest. While we wait for
more powerful statistical computations and highly informative markers to estimate
population genetics in wild populations (e.g. whole-genome assessment of relatedness,
see Herrera and Bazaga 2009), Ritland and related methods remain a good option for
long-lived plants (Andrew et al. 2005), and as we show here, for small populations with
genetic substructure, which is common for many species.
Acknowledgements
We thank Santiago Donat-Caerols and Rafael Jaime for essential help in the
laboratory. We are also grateful to Carlos M. Herrera for initial advice and ideas on
relatedness analyses. Anonymous reviewers provided comments that substantially
22

537
538
539
540
541
542
543
544
545
546
547
548
549
550
551
552
553
554
555
556
557
558
559
560
improved the original manuscript. This work was funded by a Generalitat Valenciana
research grant for young researchers (GVPRE/2008/076) and project CGL2006-02848
of the Ministerio de Educación y Ciencia and FEDER.
References
Alberto F (2009) MsatAllele_1.0: an R package to visualize the binning of
microsatellite alleles. Journal of Heredity 100, 394-397.
Alcántara JM, Bastida JM, Rey PJ (2010) Linking divergent selection on vegetative
traits to environmental variation and phenotypic diversification in the Iberian
columbines (Aquilegia). Journal of Evolutionary Biology 23, 1218-1233.
Anderson TJC, Williams JT, Nair S, et al. (2010) Inferred relatedness and heritability in
malaria parasites. Proceedings of the Royal Society of London, Series B: Biological
Sciences 277, 2531-2540.
Andrew RL, Peakall R, Wallis IR, et al. (2005) Marker-based quantitative genetics in
the wild?: The heritability and genetic correlation of chemical defenses in
Eucalyptus. Genetics 171, 1989-1998.
Ashman T, Majetic C (2006) Genetic constraints on floral evolution: a review and
evaluation of patterns. Heredity 96, 343-352.
Bastida J, Alcántara J, Rey P, Vargas P, Herrera C (2010) Extended phylogeny of
Aquilegia: the biogeographical and ecological patterns of two simultaneous but
contrasting radiations. Plant Systematics and Evolution 284, 171-185.
Bessega C, Saidman BO, Darquier MR, et al. (2009) Consistency between marker- and
genealogy-based heritability estimates in an experimental stand of Prosopis alba
(Leguminosae). American Journal of Botany 96, 458-465.
23

561
562
563
564
565
566
567
568
569
570
571
572
573
574
575
576
577
578
579
580
581
582
583
584
Blouin MS (2003) DNA-based methods for pedigree reconstruction and kinship
analysis in natural populations. Trends in Ecology & Evolution 18, 503-511.
Blows MW, Hoffmann AA (2005) A reassessment of genetic limits to evolutionary
change. Ecology 86, 1371-1384.
Bouvet J, Kelly B, Sanou H, Allal F (2008) Comparison of marker- and pedigree-based
methods for estimating heritability in an agroforestry population of Vitellaria
paradoxa C.F. Gaertn. (shea tree) Genetic Resources and Crop Evolution 55, 1291-
1301.
Butler K, Field C, Herbinger CM, Smith BR (2004) Accuracy, efficiency and
robustness of four algorithms allowing full sibship reconstruction from DNA marker
data. Molecular Ecology 13, 1589-1600.
Campbell DR (1996) Evolution of floral traits in a hermaphroditic plant: field
measurements of heritabilitles and genetic correlations. Evolution 50, 1442-1453.
Chase VC, Raven PH (1975) Evolutionary and ecological relationships between
Aquilegia formosa and A. pubescens (Ranunculaceae), two perennial plants.
Evolution 29, 474- 486.
Clegg SM, Frentiu FD, Kikkawa J, Tavecchia G, Owens IP (2008) 4000 years of
phenotypic change in an island bird: heterogeneity of selection over three
microevolutionary timescales. Evolution 62, 2393-2410.
Coltman D (2005) Testing marker-based estimates of heritability in the wild. Molecular
Ecology 14, 2593-2599.
Conner JK, Franks R, Stewart C (2003) Expression of additive genetic variances and
covariances for wild radish floral traits: comparison between field and greenhouse
environments. Evolution 57, 487-495.
24

Csilléry K, Johnson T, Beraldi D, et al. (2006) Performance of marker-based
relatedness estimators in natural populations of outbred vertebrates. Genetics 173,
2091-2101.
585
586
587
588
589
590
591
592
593
594
595
596
597
598
599
600
601
602
603
604
605
606
607
608
DiBattista J, Feldheim K, Garant D, Gruber S, Hendry A (2008) Evolutionary potential
of a large marine vertebrate: quantitative genetic parameters in a wild population.
Evolution 63, 1051-1067.
Frentiu FD, Clegg SM, Chittock J, et al. (2008) Pedigree-free animal models: the
relatedness matrix reloaded. Proceedings of the Royal Society of London, Series B:
Biological Sciences 275, 639-647.
Fulton M, Hodges SA (1999) Floral isolation between Aquilegia formosa and Aquilegia
pubescens. Proceedings of the Royal Society of London, Series B: Biological
Sciences 266, 2247-2252.
Gafta D, Muncaciu S, Csergő AM (2006) Morphometric variation in a rare endemic
Aquilegia (Ranunculaceae) in the Carpathians. Plant Biosystems 140, 297 - 306.
Garant D, Kruuk LEB (2005) How to use molecular marker data to measure
evolutionary parameters in wild populations. Molecular Ecology 14, 1843-1859.
Grant V (1952) Isolation and hybridization between Aquilegia formosa and A.
pubescens. Aliso 2, 341- 360.
Herrera CM, Bazaga P (2009) Quantifying the genetic component of phenotypic
variation in unpedigreed wild plants: tailoring genomic scan for within-population
use. Molecular Ecology 18, 2602-2614.
Hodges SA, Arnold ML (1994) Floral and ecological isolation between Aquilegia
formosa and Aquilegia pubescens. Proceedings of the National Academy of Sciences,
USA 91, 2493-2496.
25

609
610
611
612
613
614
615
616
617
618
619
620
621
622
623
624
625
626
627
628
629
630
631
632
Hodges SA, Arnold ML (1995) Spurring plant diversification: are floral nectar spurs a
key innovation? Proceedings of the Royal Society of London, Series B: Biological
Sciences 262, 343-348.
Jackson DA (1993) Stopping rules in Principal Components Analysis: a comparison of
heuristical and statistical approaches. Ecology 74, 2204-2214.
Kalinowski S, Wagner A, Taper M (2006) ML-RELATE: a computer program for
maximum likelihood estimation of relatedness and relationship. Molecular Ecology
Notes 6, 576-579.
Keller LF, Grant PR, Grant BR, Petren K (2001) Heritability of morphological traits in
Darwin's Finches: misidentified paternity and maternal effects. Heredity 87, 325-336.
Klaper R, Ritland K, Mousseau TA, Hunter MD (2001) Heritability of phenolics in
Quercus laevis inferred using molecular markers. Journal of Heredity 92, 421-426.
Lande R, Arnold SJ (1983) The measurement of selection on correlated characters.
Evolution 37, 1210-1226.
Lynch M, Ritland K (1999) Estimation of pairwise relatedness with molecular markers.
Genetics 152, 1753-1766.
Medrano M, Castellanos MC, Herrera CM (2006) Comparative floral and vegetative
differentiation between two European Aquilegia taxa along a narrow contact zone.
Plant Systematics and Evolution 262, 209-224.
Mitchell-Olds T, Rutledge J (1986) Quantitative genetics in natural plant populations: a
review of the theory. American Naturalist 127, 379-402.
Montalvo AM, Shaw RG (1994) Quantitative genetics of sequential life-history and
juvenile traits in the partially selfing perennial, Aquilegia caerulea. Evolution 48,
828-841.
26
633
634
635
636
637
638
639
640
641
642
643
644
645
646
647
648
649
650
651
652
653
654
655
656
Mousseau T, Ritland K, Heath D (1998) A novel method for estimating heritability
using molecular markers. Heredity 80, 218-224.
Queller D, Goodnight K (1989) Estimating relatedness using genetic markers. Evolution
43, 258-275.
Riska B, Prout T, Turelli M (1989) Laboratory estimates of heritabilities and genetic
correlations in nature. Genetics 123, 865-871.
Ritland K (1996) Marker-based method for inferences about quantitative inheritance in
natural populations. Evolution 50, 1062-1073.
Ritland K (2000) Marker-inferred relatedness as a tool for detesting heritability in
nature. Molecular Ecology 9, 1195-1204.
Ritland K, Ritland C (1996) Inferences about quantitative inheritance based on natural
population structure in the yellow monkeyflower, Mimulus guttatus. Evolution 50,
1074-1082.
Ritland K, Travis S (2004) Inferences involving individual coefficients of relatedness
and inbreeding in natural populations of Abies. Forest Ecology and Management
197, 171-180.
Rodríguez-Ramilo S, Toro M, Caballero A, Fernandez J (2007) The accuracy of a
heritability estimator using molecular information. Conservation Genetics 8, 1189-
1198.
Rousset F (2008) Genepop'007: a complete re-implementation of the genepop software
for Windows and Linux. Molecular Ecology Resources 8, 103-106.
Schoen D, Bell G, Lechowicz M (1994) The ecology and genetics of fitness in forest
plants. IV. Quantitative genetics of fitness components in Impatiens pallida
(Balsaminaceae). American Journal of Botany 81, 232-239.
27

Shaw R (1986) Response to density in a wild population of the perennial herb Salvia
lyrata: variation among families. Evolution 40, 492-505.
657
658
659
660
661
662
663
664
665
666
667
668
669
670
671
672
673
674
675
676
677
678
679
Shikano T (2008) Estimation of quantitative genetic parameters using marker-inferred
relatedness in Japanese flounder: a case study of upward bias. Journal of Heredity
99, 94-104.
Siepielski AM, DiBattista JD, Carlson SM (2009) It's about time: the temporal
dynamics of phenotypic selection in the wild. Ecology Letters 12, 1261-1276.
Thomas SC, Coltman DW, Pemberton JM (2002) The use of marker-based relationship
information to estimate the heritability of body weight in a natural population: a
cautionary tale. Journal of Evolutionary Biology 15, 92-99.
Van de Casteele T, Galbusera P, Matthysen E (2001) A comparison of microsatellite-
based pairwise relatedness estimators. Molecular Ecology 10, 1539-1549.
Van Horn RC, Altmann J, Alberts SC (2008) Can't get there from here: inferring
kinship from pairwise genetic relatedness. Animal Behaviour 75, 1173-1180.
van Kleunen M, Ritland K (2005) Estimating heritabilities and genetic correlations with
marker-based methods: An experimental test in Mimulus guttatus. Journal of
Heredity 96, 368-375.
Wang J (2002) An estimator for pairwise relatedness using molecular markers. Genetics
160, 1203.
Whittall JB, Hodges SA (2007) Pollinator shifts drive increasingly long nectar spurs in
columbine flowers. Nature 447, 706-709.
Wilson AJ, Pemberton JM, Pilkington JG, et al. (2006) Environmental coupling of
selection and heritability limits evolution. PLoS Biology 4, 1270-1275.
28

680
681
682
683
684
685
686
687
688
689
Winn AA (2004) Natural selection, evolvability and bias due to environmental
covariance in the field in an annual plant. Journal of Evolutionary Biology 17, 1073-
1083.
Yang JY, Counterman BA, Eckert CG, Hodges SA (2005) Cross-species amplification
of microsatellite loci in Aquilegia and Semiaquilegia (Ranunculaceae). Molecular
Ecology Notes 5, 317-320.
Figure legends
Fig. 1. Estimates of mean relatedness for 13 Aquilegia populations and its relation to
approximate population size.
29
690 691
692
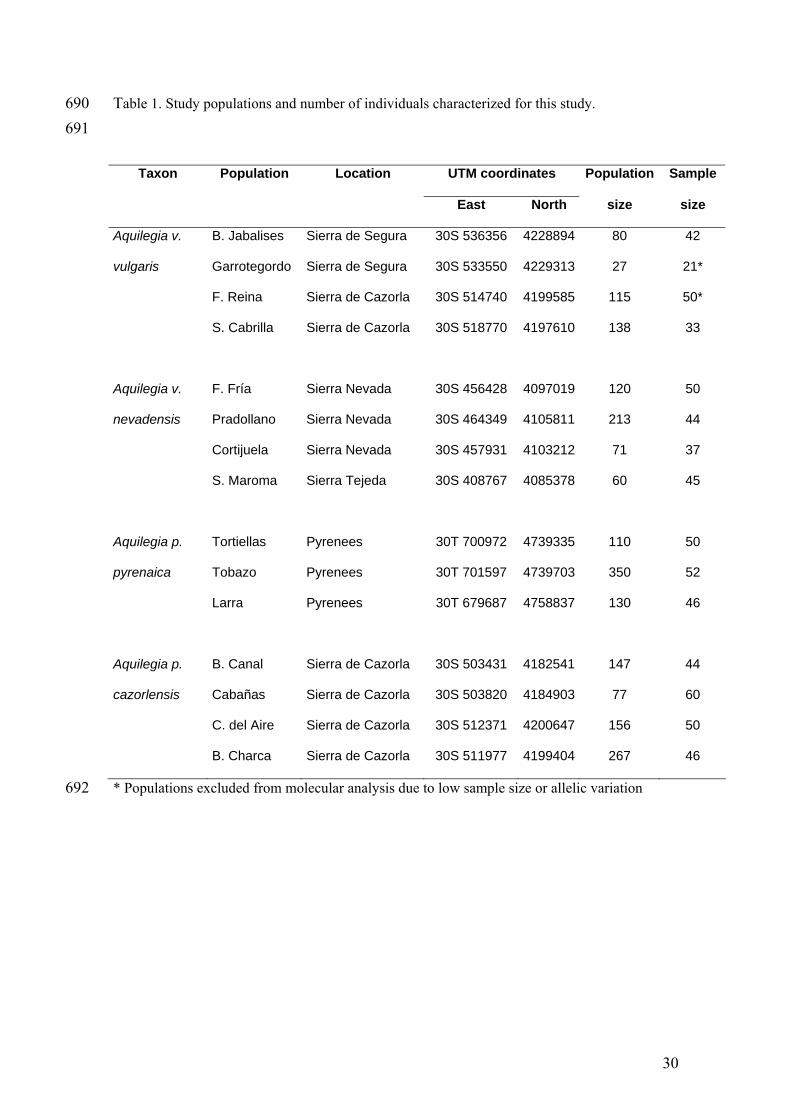
Table 1. Study populations and number of individuals characterized for this study.
* Populations excluded from molecular analysis due to low sample size or allelic variation
Taxon Population Location UTM coordinates Population Sample
East North size size
Aquilegia v. B. Jabalises Sierra de Segura 30S 536356 4228894 80 42
vulgaris Garrotegordo Sierra de Segura 30S 533550 4229313 27 21*
F. Reina Sierra de Cazorla 30S 514740 4199585 115 50*
S. Cabrilla Sierra de Cazorla 30S 518770 4197610 138 33
Aquilegia v. F. Fría Sierra Nevada 30S 456428 4097019 120 50
nevadensis Pradollano Sierra Nevada 30S 464349 4105811 213 44
Cortijuela Sierra Nevada 30S 457931 4103212 71 37
S. Maroma Sierra Tejeda 30S 408767 4085378 60 45
Aquilegia p. Tortiellas Pyrenees 30T 700972 4739335 110 50
pyrenaica Tobazo Pyrenees 30T 701597 4739703 350 52
Larra Pyrenees 30T 679687 4758837 130 46
Aquilegia p. B. Canal Sierra de Cazorla 30S 503431 4182541 147 44
cazorlensis Cabañas Sierra de Cazorla 30S 503820 4184903 77 60
C. del Aire Sierra de Cazorla 30S 512371 4200647 156 50
B. Charca Sierra de Cazorla 30S 511977 4199404 267 46
30

31
693
694
695
696
697
Table 2. Phenotypic differences among Aquilegia taxa and populations in the six
measured floral traits. Differences were tested using univariate linear models for taxa,
and mixed model tests for population as a nested factor. All tests are significant after
Bonferroni correction.
Taxon Population (Taxon)
F d.f P LL ratio P
Sepal length 147.73 3, 671 <0.001 13.099 0.004
Sepal width 504.18 3, 663 <0.001 29.090 <0.001
Spur width above nectary 147.76 3, 678 <0.001 26.182 <0.001
Spur aperture 93.53 3, 667 <0.001 12.260 0.007
Spur length 310.84 3, 669 <0.001 24.825 <0.001
Petal blade length 383.91 3, 678 <0.001 28.039 <0.001
698

Table 3. Estimated within-population variance in relatedness (Var r) and heritability values (h2) for six floral and six vegetative traits in 13 wild
populations of Aquilegia. Estimates in bold are significantly positive with * P < 0.1, ** P < 0.05, *** P < 0.01, except Var r estimates which are
all significant at P < 0.001.
699
700
701
Floral traits Vegetative traits
Taxon Population Var r
Sepal
length
Sepal
width
Spur
width a.
nectary
Spur
aperture
Spur
length
Petal
blade
length
Inflo.
Height
Num.
Leaves
Leaf
Length
Num.
Flowers SLA
Nongland.
Pub.
A. v. B. Jabalises 0.002 0.302 -0.054 -0.664 -0.226 -0.22 -0.12 0.945 0.217 0.725 0.105 -0.779 1.176
vulgaris S. Cabrilla 0.005 0.311 -0.182 1.106 0.038 0.101 -0.137 -0.078 0.895 -0.234 1.231 -0.379 0.158
A. v. F. Fría 0.014 0.326* -0.024 0.074 -0.016 0.153 -0.047 -0.047 -0.127 0.025 0.167 -0.04 0.25
nevadensis Pradollano 0.009 0.243 0.245 0.274 0.011 -0.036 0.835** -0.101 0.014 -0.176 0.01 0.253 0.249
Cortijuela 0.03 0.435* 0.772** 0.214 0.108 0.352* 0.510** 0.049 -0.119 -0.149 0.018 0.338* -0.144
S. Maroma 0.018 0.362* 0.039 0.098 -0.005 0.357* -0.107 0.028 0.099 0.013 0.063 -0.035 -0.039
A. p. Tortiellas 0.019 0 -0.054 -0.133 0.086 -0.027 0.061 0.045 -0.065 0.043 0.05 0.07 0.109
pyrenaica Tobazo 0.016 -0.071 -0.141 0.049 -0.051 -0.12 -0.027 -0.007 0.067 -0.074 0.001 0.093 -0.096
Larra 0.004 1.003** 0.37 0.398 0.692 0.407 0.335 0.657 0.906 0.175 -0.165 0.12 -0.027
A. p. B. Canal 0.009 0.25 0.523 0.893** -0.039 0.588* 0.046 -0.222 0.114 -0.171 0.268 -0.194 -0.261
32

33
cazorlensis Cabañas 0.006 1.561*** 0.707** -0.154 0.303 0.967* -0.077 4.032*** 0.709* 4.081*** 1.817*** -0.154 0.851*
C. del Aire 0.004 0.43 0.157 0.464 0.003 -0.138 0.43 1.08** 0.161 0.908** -0.157 0.302 0.862*
B. Charca 0.004 0.335 0.392 0.51 0.27 0.576 0.347 0.237 0.102 0.251 -0.081 0.704* 0.128

702
703
704
Table 4. Selection gradients on composite floral and vegetative variables for each
population. The variables are the main factors (PCs) of separate principal components
analyses on floral and vegetative traits. Values in bold are significant with P<0.05.
Floral factors Vegetative factors
Taxon Population PC1 PC2 PC1 PC2
A. v. vulgaris Fte. Reina -0.064 0.046 -0.179 0.231
S. Cabrilla 0.117 -0.013 -0.342 0.009
A. v. nevadensis F. Fría 0.099 -0.063 -0.514 0.153
Pradollano -0.002 0.004 -0.101 0.755
Cortijuela -0.160 0.030 -0.088 0.577
S. Maroma 0.186 -0.069 -0.510 0.168
A. p. pyrenaica Tortiellas -0.273 -0.043 -0.099 -0.005
Tobazo -0.187 0.247 -0.349 0.453
Larra -0.165 0.203 -0.091 0.885
A. p. cazorlensis B. Canal -0.133 0.012 -0.569 0.315
Cabañas 0.681 -0.213 -0.701 0.208
C. del Aire -0.244 0.132 -0.307 0.155
B. Charca -0.261 -0.110 -0.335 0.293
34

Table 5. Estimated within-population heritability values (h2) and the average environmental
correlation (r
705
706
707
708
709
e) for two floral and two vegetative principal components factors (PCs) in
Aquilegia populations. Estimates in bold are significantly positive with * P < 0.1, ** P < 0.05,
*** P < 0.01.
floral vegetative
PC-1 PC-2 PC-1 PC-2
Taxon Population h2 re h2 re h2 re h2 re
A. v. vulgaris S. Cabrilla -0.80 0.10 -0.34 0.01 -0.53 0.05 0.11 -0.07
A. v. F. Fría -0.01 -0.02 -0.07 -0.01 -0.04 -0.02 0.22 -0.09
nevadensis Pradollano 0.53 -0.15 0.00 -0.02 0.08 -0.05 -0.33 0.06
Cortijuela 0.46** -0.17 0.31* -0.12 -0.07 -0.01 -0.16 0.02
S. Maroma 0.23 -0.11 0.08 -0.06 -0.04 -0.01 -0.17 0.04
A. p. Tortiellas 0.04 -0.04 0.02 -0.03 -0.05 -0.01 -0.03 -0.02
pyrenaica Tobazo -0.07 0.00 -0.04 -0.01 -0.02 -0.02 0.05 -0.04
Larra 0.96* -0.18 1.18** -0.21 -0.04 -0.02 1.20 -0.21
A. p. B. Canal -0.22 0.02 0.11 -0.05 -0.49 0.08 0.41* -0.12
cazorlensis Cabañas 1.39** -0.24 0.23 -0.06 4.41*** -0.72 0.55 -0.11
C. del Aire 0.11 -0.04 0.09 -0.03 0.87** -0.15 0.06 -0.031
B. Charca 0.37 -0.08 0.42 -0.08 0.66 -0.12 0.09 -0.04
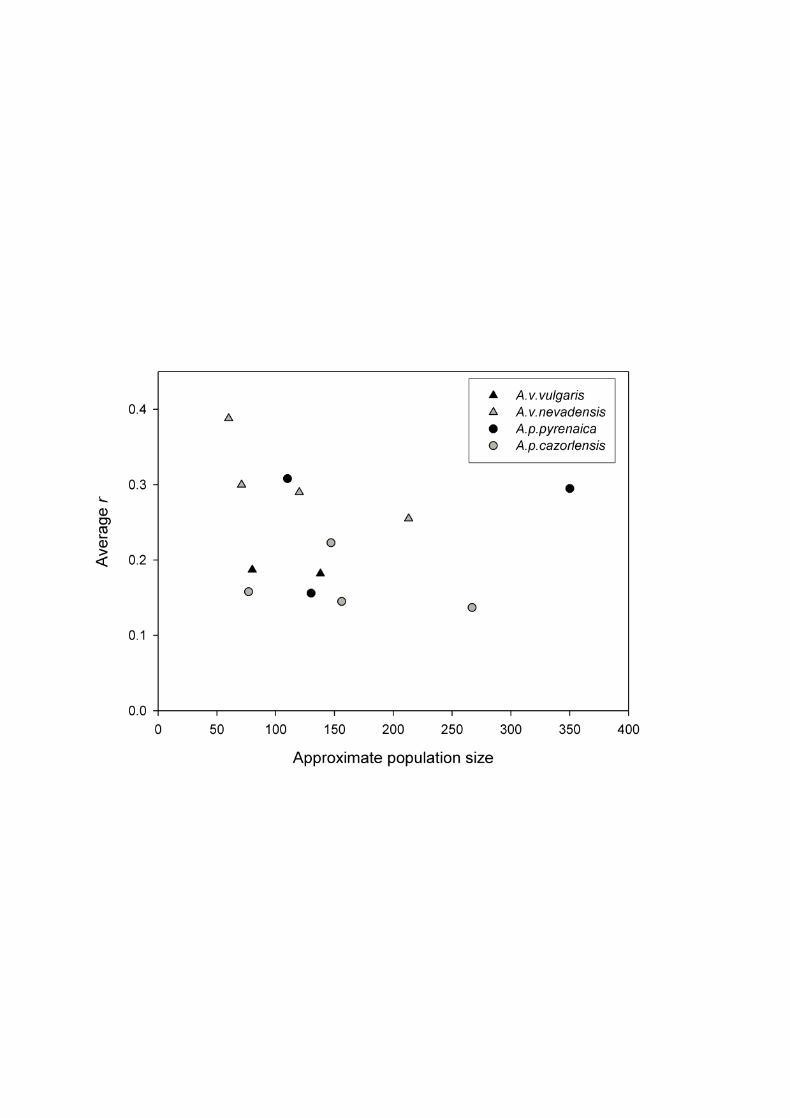

Table S1. Allele richness in 13 Aquilegia populations for 10 microsatellite loci taken from Yang et al. (2005), where primer sequences can be
obtained.
Population A. v. vulgaris A. v. nevadensis A. p. pyrenaica A. p. cazorlensis Locus JAB CLL D PLL COR MAR TOR CTT LAR CAN Cab COV CHA 7-27.1 10 11 2 5 4 6 3 2 5 6 8 5 6 25.3-33 4 3 5 4 6 4 6 7 5 1 1 5 4 50-21 6 2 2 2 2 2 2 1 1 5 7 3 5 10-15 6 3 2 4 3 3 1 1 1 NA NA 3 3 1-40 4 3 4 2 3 1 2 2 3 2 1 4 2 13-39 1 1 2 1 1 2 2 1 6 2 2 1 1 50-9 1 1 6 2 4 2 2 2 3 1 1 1 1 50-7 2 4 2 4 4 2 2 2 3 1 2 3 3 7-27.2 3 9 8 7 2 1 9 7 16 8 8 15 19 25.6-16 3 3 2 4 2 2 2 2 3 2 6 8 7 Total number of alleles 40 40 35 35 31 25 31 27 46 28 36 48 51 Mean number of alleles 4 4 3.5 3.5 3.1 2.5 3.1 2.7 4.6 3.111 4 4.8 5.1
Populations: JAB=B. Jabalises, CLL= S. Cabrilla, D= F. Fría, PLL=Pradollano, COR=Cortijuela, MAR=S. Maroma, TOR=Tortiellas,
CTT=Tobazo, LAR=Larra, CAN=B. Canal, Cab=Cabañas, COV=C. del Aire, CHA=B. Charca.

Table S2. Correlations of phenotypic traits with the factors of principal component
(PC) analysis based on all populations in this study. Traits were log-transformed, except
for number of leaves and number of flowers per inflorescence, which were square root-
transformed. A. Floral traits. B. Vegetative traits.
A.
PC1 PC2 PC3 PC4 PC5 PC6
Sepal length -0.919 -0.124 0.066 0.241 0.099 -0.259
Sepal width -0.780 0.426 0.334 0.223 0.051 0.215
Spur width a. nectary -0.093 -0.847 0.497 -0.070 -0.144 0.017
Spur aperture -0.601 -0.671 -0.330 -0.061 0.241 0.134
Spur length -0.872 -0.027 -0.336 0.012 -0.353 0.034
Petal blade length -0.794 0.361 0.157 -0.457 0.058 -0.051
Eigenvalue 3.213 1.496 0.610 0.326 0.219 0.136
% of total variance 53.55 24.94 10.17 5.43 3.66 2.26
B.
PC1 PC2 PC3 PC4 PC5 PC6
Inflo. Height -0.954 -0.050 -0.051 -0.137 0.127 0.223
Num. Leaves -0.136 0.831 0.502 0.194 0.009 0.027
Leaf Length -0.879 -0.013 0.250 -0.280 0.243 -0.163
Num. Flowers -0.830 0.226 -0.250 -0.156 -0.415 -0.044
SLA -0.414 -0.556 0.661 0.229 -0.175 0.007
Nongland. Pub. -0.723 -0.017 -0.423 0.531 0.111 -0.054
Eigenvalue 3.085 1.054 0.995 0.494 0.290 0.082
% of total variance 51.42 17.57 16.58 8.23 4.84 1.37

Table S3. Mean population values for the six floral traits measured. See Table 1 for sample sizes. See Alcántara et al. for an equivalent table of
vegetative traits.
Floral traits
Taxon Population
Sepal
length
Sepal
width
Spur width
above nectary
Spur
aperture
Spur
length
Petal blade
length
A. v. B. Jabalises 21.78 ± 2.995 8.04 ± 1.282 1.51 ± 0.267 8.22 ± 1.337 12.01 ± 2.115 8.50 ± 1.429
vulgaris Garrotegordo 25.78 ± 2.484 8.84 ± 1.479 1.41 ± 0.283 9.23 ± 1.114 14.18 ± 1.801 8.73 ± 1.104
F. Reina 22.51 ± 2.205 10.56 ± 1.338 1.62 ± 0.284 7.51 ± 0.953 12.15 ± 1.486 9.71 ± 1.442
S. Cabrilla 22.56 ± 2.622 9.91 ± 1.058 1.33 ± 0.212 7.64 ± 1.029 10.49 ± 1.824 11.51 ± 1.207
A. v. F. Fría 20.20 ± 2.182 6.28 ± 0.984 1.30 ± 0.231 8.09 ± 0.892 14.45 ± 1.917 10.60 ± 0.989
nevadensis Pradollano 26.21 ± 3.663 8.80 ± 1.208 1.61 ± 0.356 8.87 ± 1.054 15.21 ± 1.790 11.82 ± 1.928
Cortijuela 32.15 ± 3.456 10.61 ± 1.646 1.49 ± 0.247 9.69 ± 0.937 17.61 ± 1.872 11.80 ± 1.137
S. Maroma 27.52 ± 3.502 9.42 ± 1.207 1.33 ± 0.324 9.31 ± 0.829 15.49 ± 2.190 9.62 ± 1.261
A. p. Tortiellas 26.15 ± 3.563 13.97 ± 2.079 0.96 ± 0.128 6.80 ± 0.929 16.66 ± 1.586 13.73 ± 1.725

pyrenaica Tobazo 29.42 ± 3.511 16.35 ± 2.062 0.98 ± 0.166 7.81 ± 0.699 18.37 ± 1.403 15.75 ± 1.850
Larra 28.37 ± 4.591 16.02 ± 2.860 0.97 ± 0.167 7.38 ± 1.216 17.78 ± 2.387 15.53 ± 1.630
A. p. B. Canal 20.16 ± 2.757 8.98 ± 1.482 1.13 ± 0.207 6.16 ± 0.858 10.89 ± 1.208 9.10 ± 1.168
cazorlensis Cabañas 16.45 ± 2.540 7.76 ± 1.253 1.06 ± 0.243 6.52 ± 0.854 10.46 ± 1.487 9.70 ± 1.127
C. del Aire 22.77 ± 2.628 7.29 ± 0.902 1.21 ± 0.196 8.36 ± 1.038 12.69 ± 1.267 9.91 ± 1.250
B. Charca 19.26 ± 2.360 6.77 ± 1.076 1.18 ± 0.188 7.42 ± 0.872 13.31 ± 1.695 9.00 ± 1.054

Table S4. Phenotypic correlations among all floral and vegetative traits for one population of Aquilegia vulgaris vulgaris (B. Jabalises). The box
highlights the correlations among floral and vegetative traits. All traits were ln-transformed for the tests. Asterisks indicate significant
correlations: * P < 0.05, ** P < 0.01, *** P < 0.001
Sepal
length
Sepal
width
Spur width
a. nectary
Spur
aperture
Spur
length
Petal
blade
length
Inflo.
Height
Num.
Leaves
Leaf
Length
Num.
Flowers SLA
Sepal width 0.63 ***
Spur width a. nectary 0.45 ** 0.21
Spur aperture 0.82 *** 0.31 * 0.34 *
Spur length 0.76 *** 0.37 * 0.51 *** 0.76 ***
Petal blade length 0.71 *** 0.28 0.15 0.74 *** 0.37 *
Inflo. Height 0.49 ** 0.30 0.23 0.48 ** 0.4 ** 0.37 *
Num. Leaves -0.09 0.09 -0.08 -0.05 -0.16 0.13 0.12
Leaf Length 0.16 0.29 0.17 0.11 -0.01 0.13 0.30 0.68 ***
Num. Flowers 0.32 * 0.24 0.11 0.22 0.20 0.21 0.52 *** 0.26 0.06
SLA -0.14 0.02 0.11 -0.01 0.02 0.07 0.07 0.04 0.18 -0.48 **
Nongland. Pub. 0.19 0.16 0.05 0.11 0.22 0.18 0.16 0.14 0.11 0.16 0.37 ***