2 BLOM BANK...Analysis 2015 33 Consolidated Financial Statements 92 BLOM BANK Group Management &...
214
Transcript of 2 BLOM BANK...Analysis 2015 33 Consolidated Financial Statements 92 BLOM BANK Group Management &...

BLOM BANK s.A.L. 2
Chairman’s Letter06
Key Figures08
Organizational Chart11
Group Chart12
Corporate Governance16
Code of Corporate GovernanceBLOM BANK S.A.L. Major Common ShareholdersBoard of Directors
List of Board Members Information about Board of Directors Board Meetings held in 2015Information on Key Members of BLOM BANK S.A.L. Management
BLOM BANK S.A.L. Commercial ArrangementsGeneral Management of BLOM BANK S.A.L.
Operating EnvironmentOverviewTotal AssetsSources of FundsUses of FundsLiquidityPerformanceDividend Distribution and Preferred Shares RevenueRisk Management and Basel PreparationsCorporate GovernanceUniversal Banking ServicesInformation Systems and TechnologyPeople DevelopmentBank’s Operational Efficiency
Consolidated Financial StatementsAuditors’ ReportConsolidated Income Statement for the year ended 31 December 2015Consolidated Statement of Comprehensive Income for the year ended 31 December 2015Consolidated Statement of Financial Position at 31 December 2015Consolidated Statement of Changes in Equity for the year ended 31 December 2015Consolidated Statement of Cash Flows at 31 December 2015Notes to the Consolidated Financial Statements
9293
94
95
96
100
101
3346474952585866
677375818487
Banks & Financial SubsidiariesBLOM BANK S.A.L. BLOMINVEST BANK S.A.L. BLOM DEVELOPMENT BANK S.A.L. BLOM BANK FRANCEBLOM BANK (SWITZERLAND) S.A.BANK OF SYRIA AND OVERSEAS S.A.SYRIA AND OVERSEAS FOR FINANCIAL SERVICES LtdBLOM BANK EGYPTBLOM EGYPT SECURITIESBLOMINVEST SAUDI ARABIABLOM BANK QATAR LLCBLOM SECURITIES
Insurance SubsidiariesAROPE INSURANCEAROPE SYRIA - SYRIA INTERNATIONAL INSURANCEAROPE INSURANCE EGYPT
192
206
Management Discussion & Analysis 201533
Consolidated Financial Statements92
BLOM BANK Group Management & Network191
Worldwide Correspondent Banks190

Annual Report 2015 3
Dr. Naaman AZHARI Chairman of BLOM BANK Group
Mr. Saad AZHARIChairman and General Manager of
BLOM BANK S.A.L.

Annual Report 2015 5
BLOM BANK s.A.L. 6
BLOM BANK has been able to maintain a remarkably stable performance despite operating in an unstable neighborhood since at least 2011. This is first and foremost a testimony to its conservative yet flexible business model that allows it to remain resilient in the face of frequent headwinds, and to deliver solid performances and deal successfully with emerging opportunities and challenges.
It is no surprise then that 2015 ended for BLOM BANK at a high note. Net profit increased to $404.26 million, higher by 10.82% from 2014, and representing the highest net profit in the Lebanese banking system. Relative profitability also performed impressively, with the rate of return on average common equity and on average assets reaching 16.00% and 1.42% respectively, the highest recorded among listed Lebanese banks. As impressive was the fact that our consolidated net profit was driven by higher profits across most of our geographical units: in Lebanon net profit reached $298.33 million, up by 4.13%; in Egypt $43.3 million, up by 30.78%; in Jordan $17.79 million, up 8.08%; in Europe $12.94 million, up by 38.84%; and in UAE $7.41 million, higher by 10.93%. Net profit from our foreign units constituted then close to 26% of the total -- a share that we intend to keep on increasing to reach an objective of 50% in the medium term.
And in a region where weak economic growth translated to modest growth in balance sheet aggregates, BLOM BANK managed to score notable increases in each: assets rose to $29.09 billion, higher by 4.02%; deposits to $25.09 billion, higher by 4.52%; loans to $7.20 billion,
higher by 4.14%; and shareholders’ equity to $2.71 billion, up by a decent 7.92%. Among the sub-balance sheet aggregates, particularly noteworthy was the increase in retail lending, which rose to $2.9 billion, up by 7.96%, and grabbing in Lebanon the highest shares in car loans at 27.63%, in housing loans at 14.68%, and in credit cards at 30.8%; besides, the Bank remains a growth leader in retail lending in Jordan and Egypt.
The performance in profitability and growth was underpinned by our trademark policy that gives top priority to risk management, cost control, and asset quality. Pro-active risk management and vigilant monitoring of our asset quality meant a low ratio of non-performing loans at 4.40% and a coverage ratio for these loans (including specific and collective provisions and real guarantees) in excess of 150%, in addition to a capital adequacy ratio of 18% against a stipulated one by the Central Bank of Lebanon (BdL) of 12%. And our managerial efficiency combined with judicious cost spending, aligned to business needs without any compromise in the delivery of clients’ services, implied a cost to income ratio of 36.80% only, the lowest among listed Lebanese banks.
BLOM BANK Group’s strategy remains as on-going and as effective as ever. It is centered on transforming the Bank to a full-service, pan-regional Bank, and proceeding with this transformation in a calibrated way. It thus entails achieving measured and diversified growth across all our business lines, and taking prudent advantage of cross-border business opportunities and intra-group synergies. To this effect, the Bank will continue strengthening its corporate activities in the
Net profit increased to $404.26 million, higher by 10.82% from 2014, and representing the highest net profit in the Lebanese banking system. Relative profitability also performed impressively, with the rate of return on average common equity and on average assets reaching 16.00% and 1.42% respectively, the highest recorded among listed Lebanese banks. As impressive was the fact that our consolidated net profit was driven by higher profits across most of our geographical units.
Chairman’s Letter
Annual Report 2015 7
Mr. Saad AZHARIChairman and General Manager
Chairman’s Letter
Levant, Egypt, UAE, and Qatar, which stood at 40% of total lending in 2015; its private banking activities in Lebanon, Europe, and KSA, with a total assets under management close to $7 billon; and its leading asset management funds in Lebanon, KSA, Egypt, and Jordan, that amounted to about $700 million. In fact, given the leading position of our asset management services, we have spun off its activities into a separate company which will start to function independently in 2016. And parallel to this process of business diversification, the Bank will continue expanding its branch network in Lebanon, Jordan, and especially Egypt.
BLOM BANK has always been an indirect contributor through its intermediation function to the development of the economies in which it is present. But in 2015, it has become a direct contributor, and specifically to Lebanon’s “knowledge economy”. This it has accomplished by participating in BdL’s 331 directive, whereby the Central Bank guarantees 75% of banks’ investments of up to 4% of their own equity in IT firms and start-ups. As a result, BLOM BANK has acted as a lead arranger and investor in eight IT funds that are (or in the process of being) active, with a contribution of $46 million out of a total of about $340 million in committed investments.
Of course, digital technology is nowadays very essential to the operations of the banking industry itself. We value this notion highly seriously at BLOM, and that is why we have continuously invested in innovative technology to offer our clients state-of the-art banking solutions as well as an enhanced customer experience. So in addition to our exclusive 8am to 5pm opening hours at all BLOM branches, we have become the leader in digital banking and electronic delivery. BLOM’s internet and mobile banking platforms offer the richest features, and in 2015 some of these features included: the “instant check cashing” service, which enables customers to obtain immediate credit to their accounts of any BLOM BANK check of up to $10,000 deposited through our smart ATMs; the eRewards program, which transforms BLOM Golden Points into quasi-virtual currency by making our clients settle their purchases through the internet with Golden Points rather than cash; and the touch-Visa card for pre-paid line holders, which allows our card members to instantly recharge their mobile phone lines by effecting unrelated purchases anywhere in the world. Also, we introduced an interactive Mobile Banking App that is currently ranked the highest among Lebanese banks at 4.5 out of 5 by Apple App Store, and it covers all the features in eBLOM including a unique GPS-based ATM locator. Last but not least, in September 2015, we became the first bank in the world to launch a co-branded card with Uber. And the card was the winner
of the “Innovation of the Year” for the Middle East and Africa at the Cards International Prepaid Summit 2016.
At BLOM, we also seriously believe that honest banking is largely about trust and transparency. As a result, the Bank continued in 2015 to promote good governance practices so as to mitigate financial risks and protect its shareholders’ rights. And this policy has paid off, for BLOM BANK was ranked highest at “B+” by Capital Concept’s Shareholders’ Rights -- an independent Lebanese provider of research and ratings on corporate governance (CG). It came first among the ten Lebanese listed companies in terms of CG standards, disclosure requirements, and voluntary codes of ethics. In addition, keen on safeguarding the interests of its customers and minimizing conduct risk, the Bank established in 2015 a Group Customer Advocacy unit specifically for that purpose. Of course, good CG is always a work in progress, and the Bank will keep on working to improve its score in all aspects of CG. It will also reinforce that position by enriching its world-class activities in corporate social responsibility, among which the re-sponsoring of Lebanon’s flagship sports event, the BLOM-Beirut Marathon.
At BLOM, the concern for shareholders’ rights extends also to good shareholders’ returns. This was reflected in the Bank attaining in 2015 an earnings per share of $1.86, $0.26 higher than 2014 and representing the highest increase among its listed peers. And given its desire to balance dividend growth against capital growth, the Bank’s Board of Directors approved for 2015 the distribution of LBP 1,250 per common share and GDR, up from LBP 1,000 in 2014, and amounting to a payout ratio of 45% and a reputable dividend yield of 8.1% (as valued by the market price of BLOM shares at last trading date).
Going forward, the Bank will continue to roll out excellent services so as to enhance its market position and increase its customer penetration. It will also stay with its successful strategy, leaning on its strong franchise and solid balance sheet to pursue growth opportunities in its expanded markets. And in all of this, the Bank will be relying primarily on its talented, dedicated workforce to create sustainable value to all of our stakeholders.
BLOM BANK s.A.L. 8
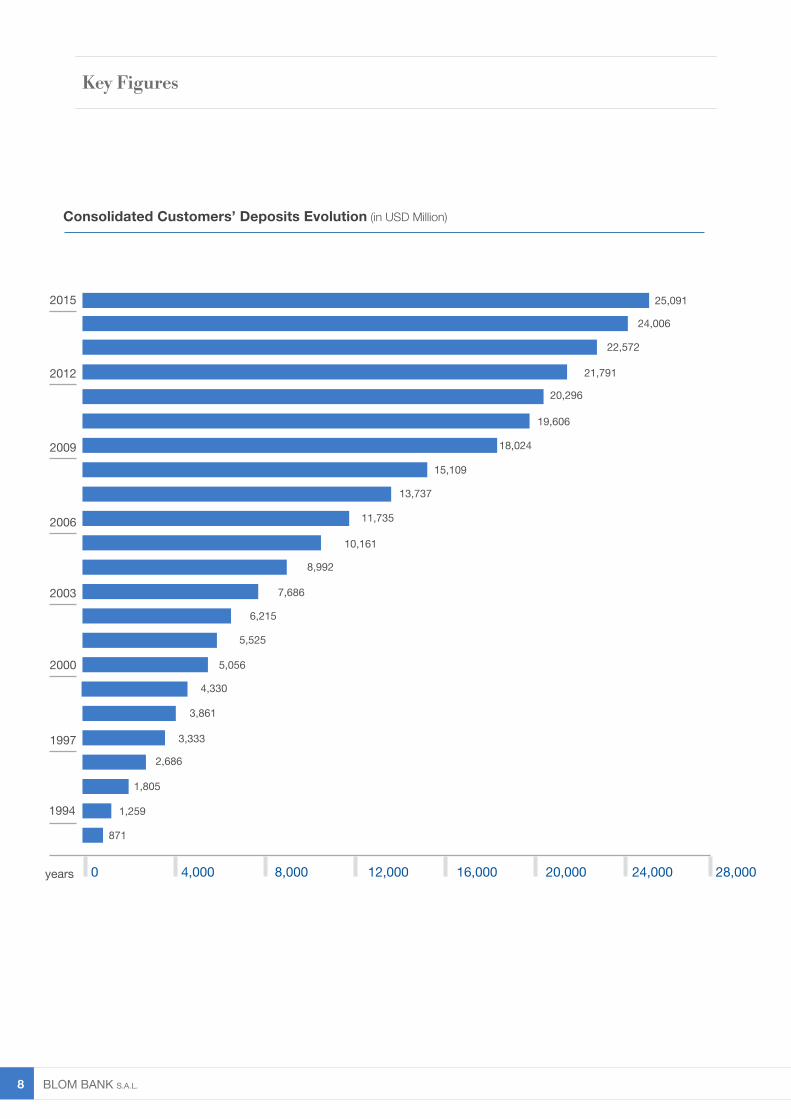
Consolidated Customers’ Deposits Evolution (in USD Million)
20,000 24,000 28,00016,00012,0008,0004,000
871
2,686
4,330
15,109
18,024
19,606
20,296
21,791
22,572
24,006
25,091
1994
1997
2000
2003
2006
2009
2012
2015
years 0
1,805
1,259
3,333
3,861
5,056
5,525
6,215
7,686
8,992
11,735
13,737
10,161
Key Figures
Annual Report 2015 9
years
years
years
24,000 30,00018,00012,0006,000
2,000 2,400 2,8001,6001,200800400
400 500300200100
0
0
0
2011
2013
2015
2015
2013
2007
2007
2007
2009
2009
2011
2009
2011
2013
2015
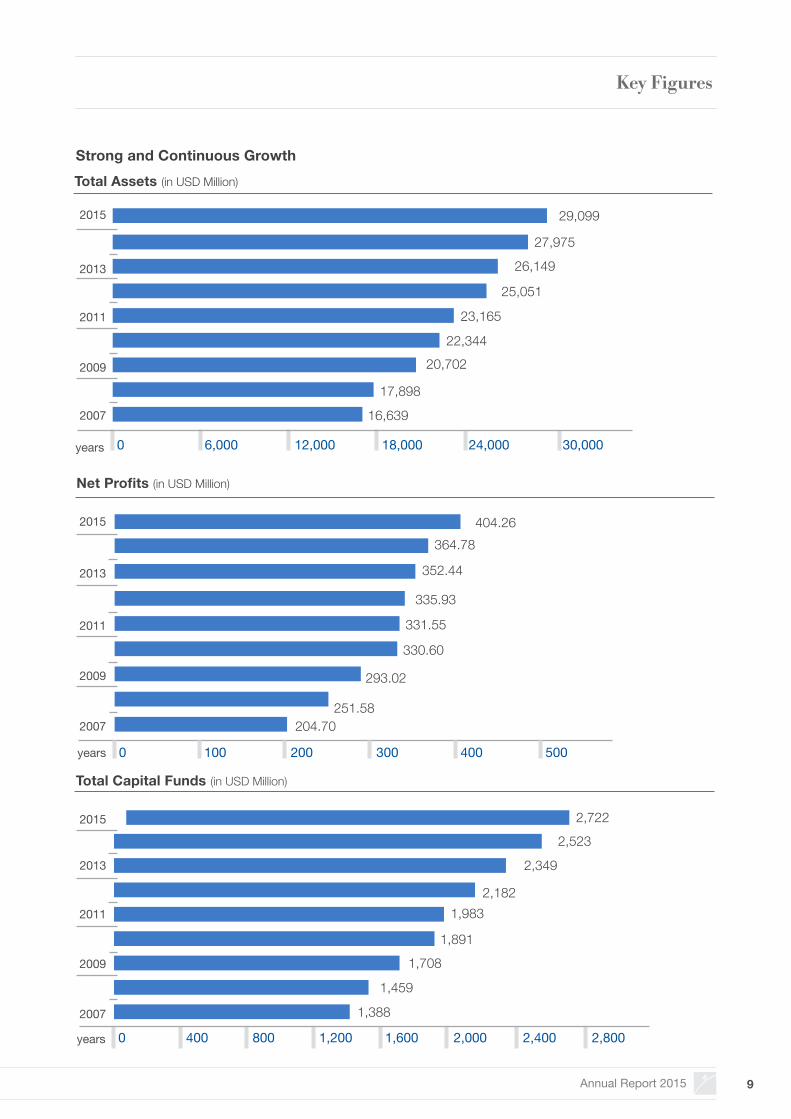
16,639
17,898
22,344
23,165
25,051
26,149
27,975
29,099
20,702
2,5232,722
364.78404.26
Total Assets (in USD Million)
Total Capital Funds (in USD Million)
Net Profits (in USD Million)
Strong and Continuous Growth
204.70251.58
330.60
331.55
335.93
352.44
293.02
1,388
1,459
1,891
1,9832,182
2,349
1,708
Key Figures
BLOM BANK s.A.L. 10
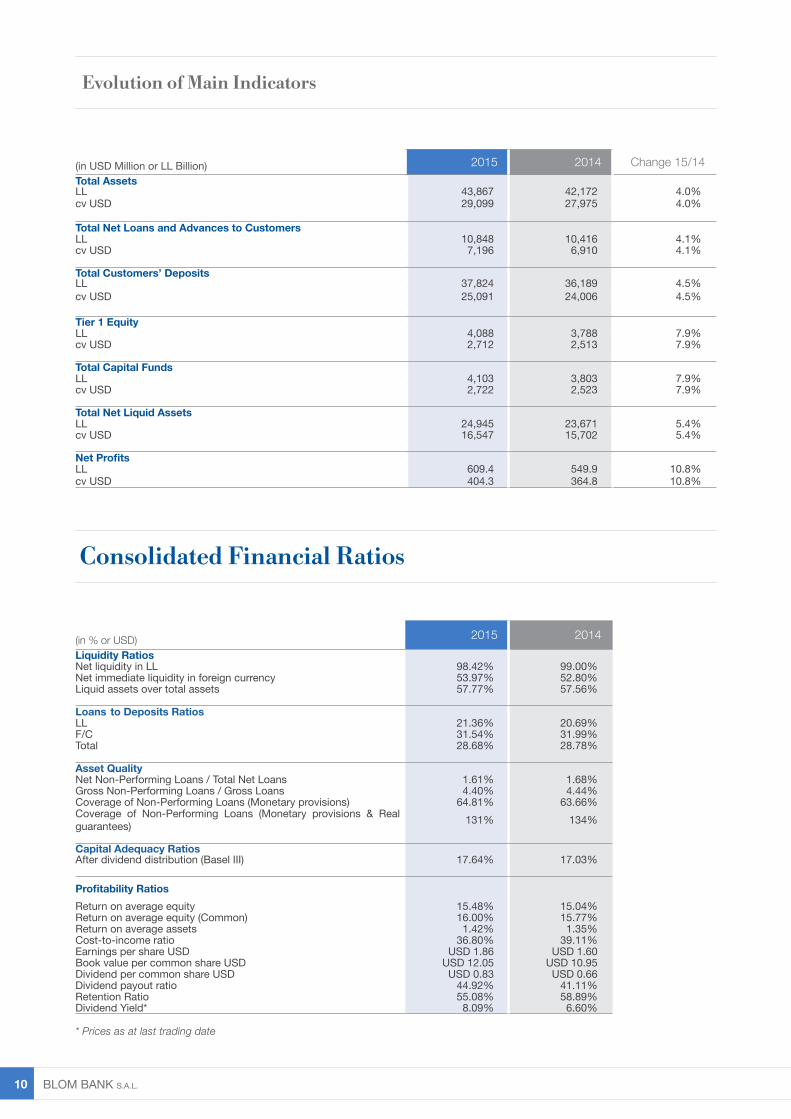
(in USD Million or LL Billion) 2015 2014 Change 15/14Total AssetsLL 43,867 42,172 4.0%cv USD 29,099 27,975 4.0%
Total Net Loans and Advances to CustomersLL 10,848 10,416 4.1%cv USD 7,196 6,910 4.1%
Total Customers’ DepositsLL 37,824 36,189 4.5%cv USD 25,091 24,006 4.5% Tier 1 EquityLL 4,088 3,788 7.9%cv USD 2,712 2,513 7.9%
Total Capital FundsLL 4,103 3,803 7.9%cv USD 2,722 2,523 7.9%
Total Net Liquid AssetsLL 24,945 23,671 5.4%cv USD 16,547 15,702 5.4%
Net ProfitsLL 609.4 549.9 10.8%cv USD 404.3 364.8 10.8%
(in % or USD) 2015 2014Liquidity RatiosNet liquidity in LL 98.42% 99.00%Net immediate liquidity in foreign currency 53.97% 52.80%Liquid assets over total assets 57.77% 57.56%
Loans to Deposits RatiosLL 21.36% 20.69%F/C 31.54% 31.99%Total 28.68% 28.78%
Asset QualityNet Non-Performing Loans / Total Net Loans 1.61% 1.68%Gross Non-Performing Loans / Gross Loans 4.40% 4.44%Coverage of Non-Performing Loans (Monetary provisions) 64.81% 63.66%Coverage of Non-Performing Loans (Monetary provisions & Real guarantees) 131% 134%
Capital Adequacy RatiosAfter dividend distribution (Basel III) 17.64% 17.03%
Profitability RatiosReturn on average equity 15.48% 15.04%Return on average equity (Common) 16.00% 15.77%Return on average assets 1.42% 1.35%Cost-to-income ratio 36.80% 39.11%Earnings per share USD USD 1.86 USD 1.60Book value per common share USD USD 12.05 USD 10.95Dividend per common share USD USD 0.83 USD 0.66Dividend payout ratio 44.92% 41.11%Retention Ratio 55.08% 58.89%Dividend Yield* 8.09% 6.60%
* Prices as at last trading date
Consolidated Financial Ratios
Evolution of Main Indicators
Annual Report 2015 11
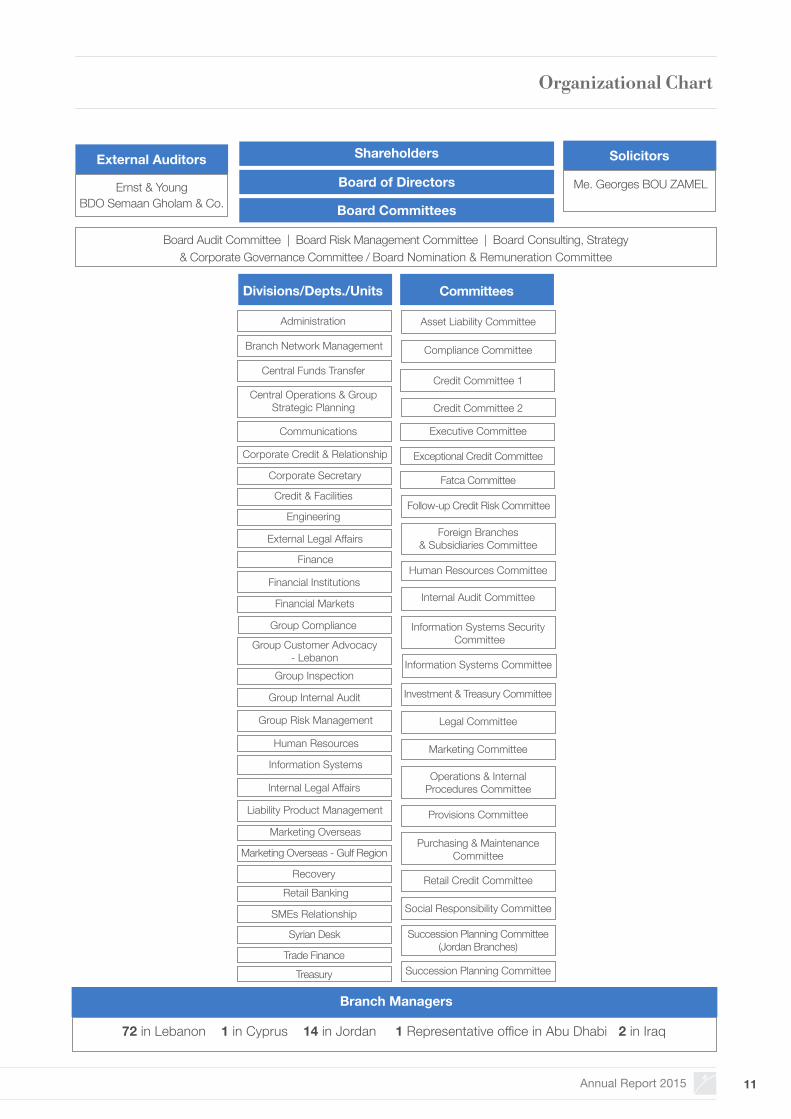
Organizational Chart
72 in Lebanon 1 in Cyprus 14 in Jordan 1 Representative office in Abu Dhabi 2 in Iraq
Branch Managers
Board Audit Committee | Board Risk Management Committee | Board Consulting, Strategy & Corporate Governance Committee / Board Nomination & Remuneration Committee
Shareholders
Board CommitteesErnst & Young
BDO Semaan Gholam & Co.
External Auditors
Me. Georges BOU ZAMEL
Solicitors
Branch Network Management
Administration
Credit & Facilities
Engineering
Communications
Central Funds Transfer
Central Operations & Group Strategic Planning
Finance
Group Internal Audit
Financial Markets
Group Compliance
Marketing Overseas
Recovery
Marketing Overseas - Gulf Region
Retail Banking
Group Inspection
Group Risk Management
SMEs Relationship
Corporate Credit & Relationship
Corporate Secretary
Liability Product Management
Information Systems
Internal Legal Affairs
External Legal Affairs
Financial Institutions
Trade Finance
Syrian Desk
Committees
Credit Committee 1
Credit Committee 2
Follow-up Credit Risk Committee
Human Resources Committee
Information Systems Committee
Investment & Treasury Committee
Foreign Branches& Subsidiaries Committee
Operations & Internal Procedures Committee
Social Responsibility Committee
Succession Planning Committee(Jordan Branches)
Purchasing & MaintenanceCommittee
Provisions Committee
Information Systems Security Committee
Retail Credit Committee
Succession Planning Committee
Marketing Committee
Internal Audit Committee
Legal Committee
Asset Liability Committee
Executive Committee
Compliance Committee
Exceptional Credit Committee
Fatca Committee
Human Resources
Treasury
Group Customer Advocacy- Lebanon
Board of Directors
Divisions/Depts./Units
BLOM BANK s.A.L. 12
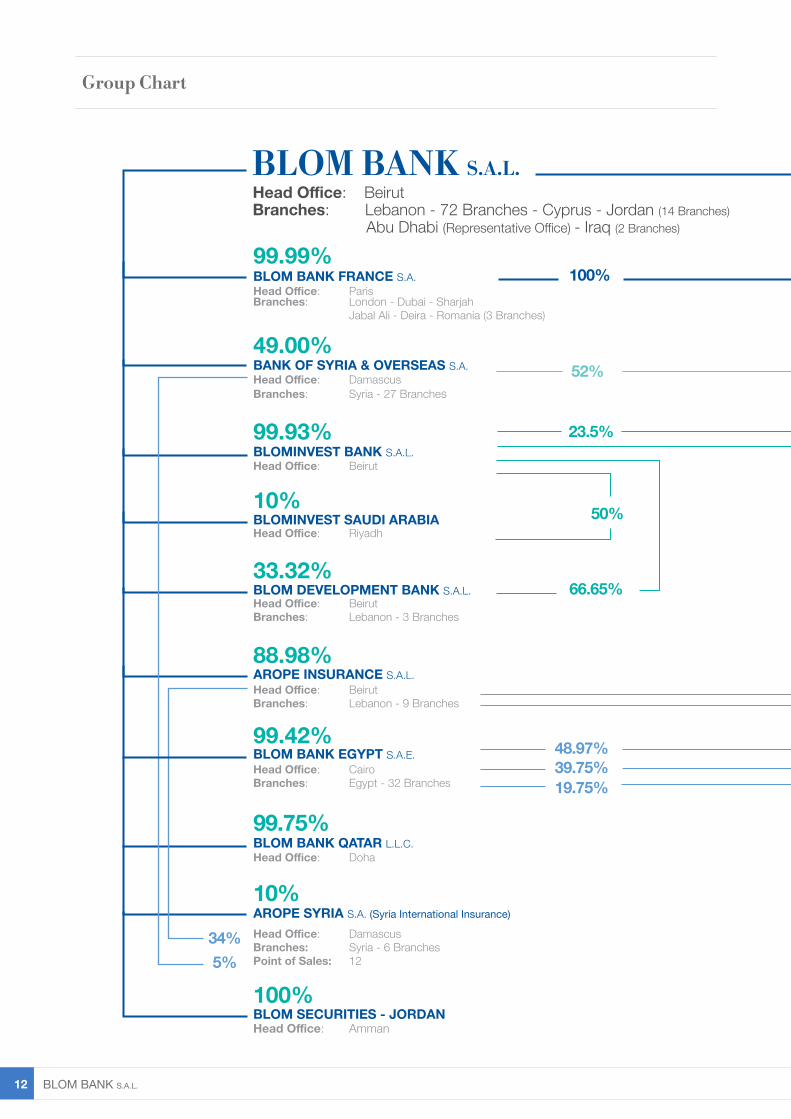
Group Chart
Head Office: Beirut Branches: Lebanon - 72 Branches - Cyprus - Jordan (14 Branches) Abu Dhabi (Representative Office) - Iraq (2 Branches)
BLOM BANK S.A.L.
Head Office: Paris Branches: London - Dubai - Sharjah Jabal Ali - Deira - Romania (3 Branches)
BLOM BANK FRANCE S.A.
Head Office: Cairo Branches: Egypt - 32 Branches
BLOM BANK EGYPT S.A.E.
Head Office: Damascus Branches: Syria - 27 Branches
BANK OF SYRIA & OVERSEAS S.A.
Head Office: DamascusBranches: Syria - 6 BranchesPoint of Sales: 12
AROPE SYRIA S.A. (Syria International Insurance)
Head Office: Beirut BLOMINVEST BANK S.A.L.
Head Office: Amman BLOM SECURITIES - JORDAN
Head Office: Riyadh BLOMINVEST SAUDI ARABIA
Head Office: Beirut Branches: Lebanon - 3 Branches
BLOM DEVELOPMENT BANK S.A.L.
Head Office: Beirut Branches: Lebanon - 9 Branches
AROPE INSURANCE S.A.L.
100%
52%
23.5%
34%5%
19.75%39.75%48.97%
50%
66.65%
Head Office: Doha BLOM BANK QATAR L.L.C.
99.99%
99.42%
49.00%
10%
99.93%
100%
10%
33.32%
88.98%
99.75%

Annual Report 2015 13
Group Chart
Head Office: Beirut Branches: Lebanon - 72 Branches - Cyprus - Jordan (14 Branches) Abu Dhabi (Representative Office) - Iraq (2 Branches)
Head Office: CairoBranches: Egypt - 4 BranchesPoint of Sales: 28
Head Office: Cairo
Head Office: Geneva BLOM BANK (SWITZERLAND) S.A.
Head Office: Damascus SYRIA & OVERSEAS FOR FINANCIAL SERVICES
AROPE INSURANCE OF PROPERTIES & RESPONSIBILITIES - Egypt S.A.E.
Head Office: CairoBranches: Egypt - 4 BranchesPoint of Sales: 28
AROPE LIFE INSURANCE - EGYPT S.A.E.
BLOM EGYPT SECURITIES S.A.E.
51%
0.25%
0.25%
80%
60%
* As at March 31, 2016

BLOM BANK s.A.L. 14

Annual Report 2015 15
BLOM BANK s.A.L. 16
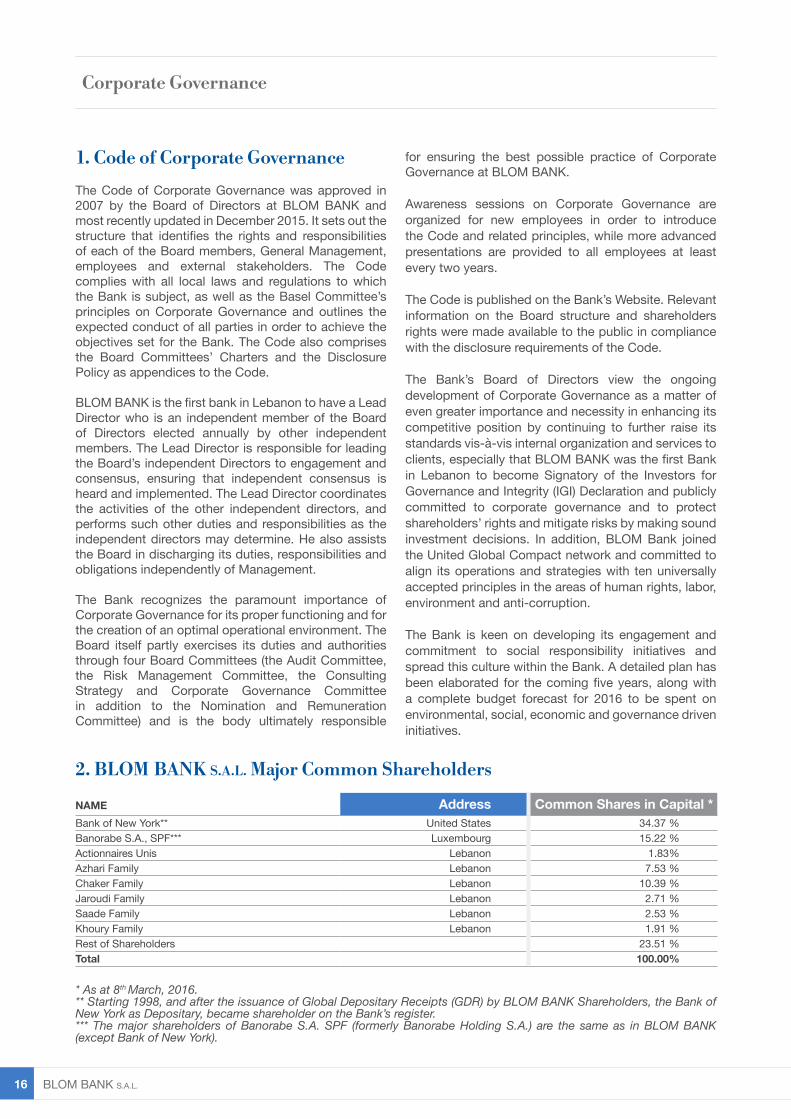
2. BLOM BANK S.A.L. Major Common Shareholders
* As at 8th March, 2016.** Starting 1998, and after the issuance of Global Depositary Receipts (GDR) by BLOM BANK Shareholders, the Bank of New York as Depositary, became shareholder on the Bank’s register.*** The major shareholders of Banorabe S.A. SPF (formerly Banorabe Holding S.A.) are the same as in BLOM BANK (except Bank of New York).
NAME Address Common Shares in Capital *Bank of New York** United States 34.37 %Banorabe S.A., SPF*** Luxembourg 15.22 %Actionnaires Unis Lebanon 1.83%Azhari Family Lebanon 7.53 %Chaker Family Lebanon 10.39 %Jaroudi Family Lebanon 2.71 %Saade Family Lebanon 2.53 %Khoury Family Lebanon 1.91 %Rest of Shareholders 23.51 %Total 100.00%
Corporate Governance
1. Code of Corporate Governance
The Code of Corporate Governance was approved in 2007 by the Board of Directors at BLOM BANK and most recently updated in December 2015. It sets out the structure that identifies the rights and responsibilities of each of the Board members, General Management, employees and external stakeholders. The Code complies with all local laws and regulations to which the Bank is subject, as well as the Basel Committee’s principles on Corporate Governance and outlines the expected conduct of all parties in order to achieve the objectives set for the Bank. The Code also comprises the Board Committees’ Charters and the Disclosure Policy as appendices to the Code.
BLOM BANK is the first bank in Lebanon to have a Lead Director who is an independent member of the Board of Directors elected annually by other independent members. The Lead Director is responsible for leading the Board’s independent Directors to engagement and consensus, ensuring that independent consensus is heard and implemented. The Lead Director coordinates the activities of the other independent directors, and performs such other duties and responsibilities as the independent directors may determine. He also assists the Board in discharging its duties, responsibilities and obligations independently of Management.
The Bank recognizes the paramount importance of Corporate Governance for its proper functioning and for the creation of an optimal operational environment. The Board itself partly exercises its duties and authorities through four Board Committees (the Audit Committee, the Risk Management Committee, the Consulting Strategy and Corporate Governance Committee in addition to the Nomination and Remuneration Committee) and is the body ultimately responsible
for ensuring the best possible practice of Corporate Governance at BLOM BANK.
Awareness sessions on Corporate Governance are organized for new employees in order to introduce the Code and related principles, while more advanced presentations are provided to all employees at least every two years.
The Code is published on the Bank’s Website. Relevant information on the Board structure and shareholders rights were made available to the public in compliance with the disclosure requirements of the Code.
The Bank’s Board of Directors view the ongoing development of Corporate Governance as a matter of even greater importance and necessity in enhancing its competitive position by continuing to further raise its standards vis-à-vis internal organization and services to clients, especially that BLOM BANK was the first Bank in Lebanon to become Signatory of the Investors for Governance and Integrity (IGI) Declaration and publicly committed to corporate governance and to protect shareholders’ rights and mitigate risks by making sound investment decisions. In addition, BLOM Bank joined the United Global Compact network and committed to align its operations and strategies with ten universally accepted principles in the areas of human rights, labor, environment and anti-corruption.
The Bank is keen on developing its engagement and commitment to social responsibility initiatives and spread this culture within the Bank. A detailed plan has been elaborated for the coming five years, along with a complete budget forecast for 2016 to be spent on environmental, social, economic and governance driven initiatives.
Annual Report 2015 17
Dr. Naaman W. AZHARI
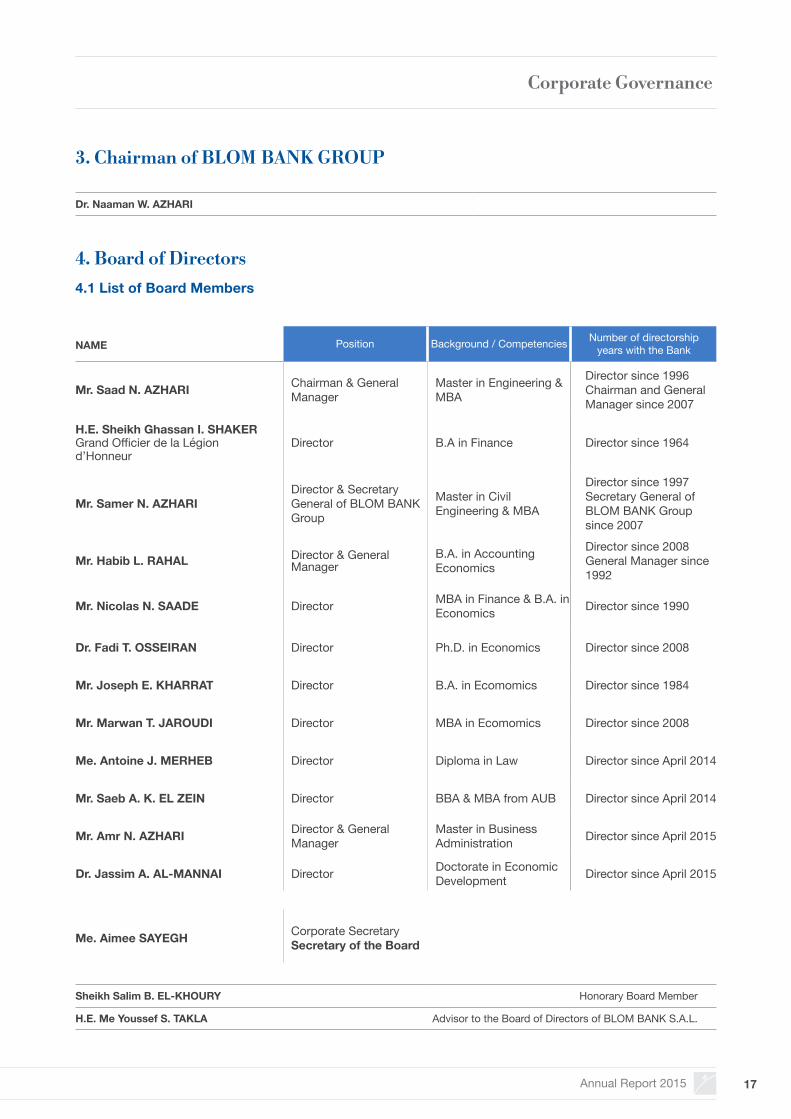
NAME Position Background / Competencies Number of directorship years with the Bank
Mr. Saad N. AZHARI Chairman & General Manager
Master in Engineering & MBA
Director since 1996 Chairman and General Manager since 2007
H.E. Sheikh Ghassan I. SHAKERGrand Officier de la Légion d’Honneur
Director B.A in Finance Director since 1964
Mr. Samer N. AZHARIDirector & Secretary General of BLOM BANK Group
Master in Civil Engineering & MBA
Director since 1997Secretary General ofBLOM BANK Group since 2007
Mr. Habib L. RAHAL Director & General Manager
B.A. in Accounting Economics
Director since 2008General Manager since 1992
Mr. Nicolas N. SAADE Director MBA in Finance & B.A. in Economics Director since 1990
Dr. Fadi T. OSSEIRAN Director Ph.D. in Economics Director since 2008
Mr. Joseph E. KHARRAT Director B.A. in Ecomomics Director since 1984
Mr. Marwan T. JAROUDI Director MBA in Ecomomics Director since 2008
Me. Antoine J. MERHEB Director Diploma in Law Director since April 2014
Mr. Saeb A. K. EL ZEIN Director BBA & MBA from AUB Director since April 2014
Mr. Amr N. AZHARI Director & General Manager
Master in Business Administration Director since April 2015
Dr. Jassim A. AL-MANNAI Director Doctorate in Economic Development Director since April 2015
Me. Aimee SAYEGH Corporate Secretary Secretary of the Board
4.1 List of Board Members
4. Board of Directors
3. Chairman of BLOM BANK GROUP
Sheikh Salim B. EL-KHOURY Honorary Board Member
H.E. Me Youssef S. TAKLA Advisor to the Board of Directors of BLOM BANK S.A.L.
Corporate Governance
BLOM BANK s.A.L. 18
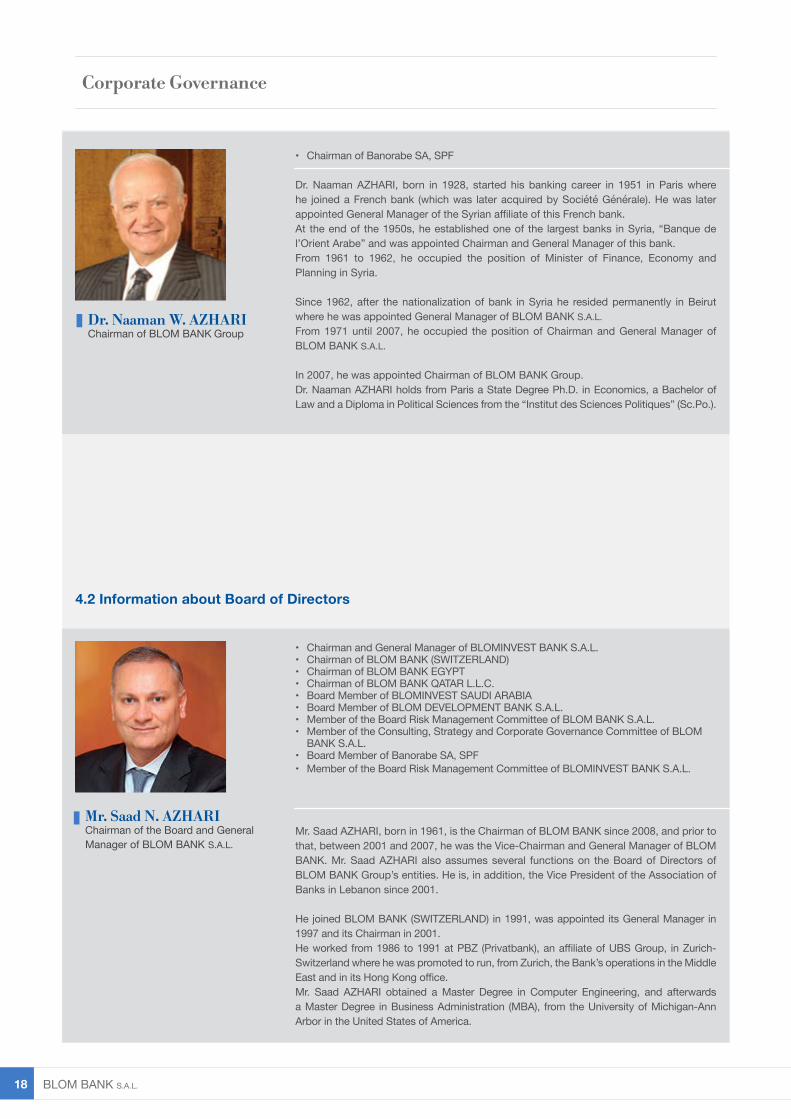
4.2 Information about Board of Directors
Mr. Saad N. AZHARIChairman of the Board and General Manager of BLOM BANK S.A.L.
Dr. Naaman W. AZHARIChairman of BLOM BANK Group
• Chairman of Banorabe SA, SPF
Dr. Naaman AZHARI, born in 1928, started his banking career in 1951 in Paris where he joined a French bank (which was later acquired by Société Générale). He was later appointed General Manager of the Syrian affiliate of this French bank. At the end of the 1950s, he established one of the largest banks in Syria, “Banque de l’Orient Arabe” and was appointed Chairman and General Manager of this bank.From 1961 to 1962, he occupied the position of Minister of Finance, Economy and Planning in Syria.
Since 1962, after the nationalization of bank in Syria he resided permanently in Beirut where he was appointed General Manager of BLOM BANK S.A.L.From 1971 until 2007, he occupied the position of Chairman and General Manager of BLOM BANK S.A.L.
In 2007, he was appointed Chairman of BLOM BANK Group.Dr. Naaman AZHARI holds from Paris a State Degree Ph.D. in Economics, a Bachelor of Law and a Diploma in Political Sciences from the “Institut des Sciences Politiques” (Sc.Po.).
Mr. Saad AZHARI, born in 1961, is the Chairman of BLOM BANK since 2008, and prior to that, between 2001 and 2007, he was the Vice-Chairman and General Manager of BLOM BANK. Mr. Saad AZHARI also assumes several functions on the Board of Directors of BLOM BANK Group’s entities. He is, in addition, the Vice President of the Association of Banks in Lebanon since 2001.
He joined BLOM BANK (SWITZERLAND) in 1991, was appointed its General Manager in 1997 and its Chairman in 2001.He worked from 1986 to 1991 at PBZ (Privatbank), an affiliate of UBS Group, in Zurich-Switzerland where he was promoted to run, from Zurich, the Bank’s operations in the Middle East and in its Hong Kong office.Mr. Saad AZHARI obtained a Master Degree in Computer Engineering, and afterwards a Master Degree in Business Administration (MBA), from the University of Michigan-Ann Arbor in the United States of America.
• Chairman and General Manager of BLOMINVEST BANK S.A.L.• Chairman of BLOM BANK (SWITZERLAND)• Chairman of BLOM BANK EGYPT• Chairman of BLOM BANK QATAR L.L.C.• Board Member of BLOMINVEST SAUDI ARABIA• Board Member of BLOM DEVELOPMENT BANK S.A.L.• Member of the Board Risk Management Committee of BLOM BANK S.A.L.• Member of the Consulting, Strategy and Corporate Governance Committee of BLOM BANK S.A.L.• Board Member of Banorabe SA, SPF• Member of the Board Risk Management Committee of BLOMINVEST BANK S.A.L.
Corporate Governance
Annual Report 2015 19
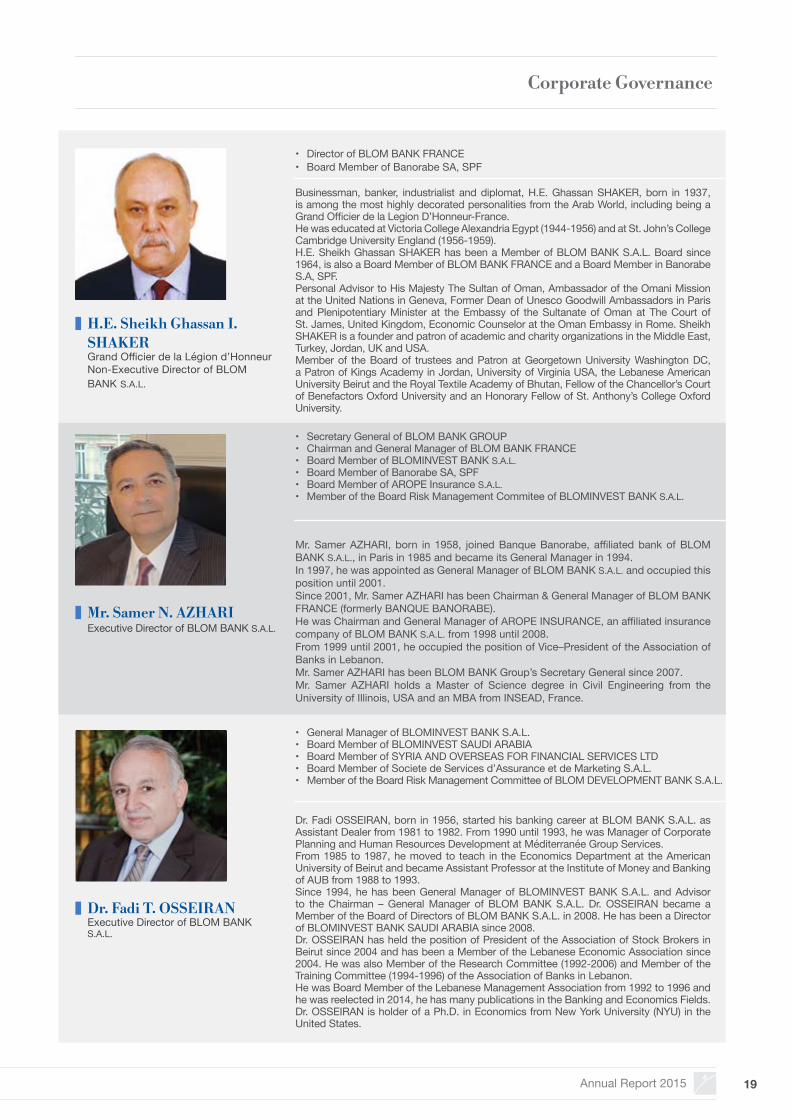
H.E. Sheikh Ghassan I. SHAKERGrand Officier de la Légion d’HonneurNon-Executive Director of BLOM BANK S.A.L.
Mr. Samer N. AZHARIExecutive Director of BLOM BANK S.A.L.
Dr. Fadi T. OSSEIRANExecutive Director of BLOM BANK S.A.L.
• Director of BLOM BANK FRANCE• Board Member of Banorabe SA, SPF
Businessman, banker, industrialist and diplomat, H.E. Ghassan SHAKER, born in 1937, is among the most highly decorated personalities from the Arab World, including being a Grand Officier de la Legion D’Honneur-France.He was educated at Victoria College Alexandria Egypt (1944-1956) and at St. John’s College Cambridge University England (1956-1959).H.E. Sheikh Ghassan SHAKER has been a Member of BLOM BANK S.A.L. Board since 1964, is also a Board Member of BLOM BANK FRANCE and a Board Member in Banorabe S.A, SPF.Personal Advisor to His Majesty The Sultan of Oman, Ambassador of the Omani Mission at the United Nations in Geneva, Former Dean of Unesco Goodwill Ambassadors in Paris and Plenipotentiary Minister at the Embassy of the Sultanate of Oman at The Court of St. James, United Kingdom, Economic Counselor at the Oman Embassy in Rome. Sheikh SHAKER is a founder and patron of academic and charity organizations in the Middle East, Turkey, Jordan, UK and USA.Member of the Board of trustees and Patron at Georgetown University Washington DC, a Patron of Kings Academy in Jordan, University of Virginia USA, the Lebanese American University Beirut and the Royal Textile Academy of Bhutan, Fellow of the Chancellor’s Court of Benefactors Oxford University and an Honorary Fellow of St. Anthony’s College Oxford University.
• Secretary General of BLOM BANK GROUP• Chairman and General Manager of BLOM BANK FRANCE • Board Member of BLOMINVEST BANK S.A.L.• Board Member of Banorabe SA, SPF• Board Member of AROPE Insurance S.A.L.• Member of the Board Risk Management Commitee of BLOMINVEST BANK S.A.L.
• General Manager of BLOMINVEST BANK S.A.L.• Board Member of BLOMINVEST SAUDI ARABIA• Board Member of SYRIA AND OVERSEAS FOR FINANCIAL SERVICES LTD• Board Member of Societe de Services d’Assurance et de Marketing S.A.L.• Member of the Board Risk Management Committee of BLOM DEVELOPMENT BANK S.A.L.
Mr. Samer AZHARI, born in 1958, joined Banque Banorabe, affiliated bank of BLOM BANK S.A.L., in Paris in 1985 and became its General Manager in 1994. In 1997, he was appointed as General Manager of BLOM BANK S.A.L. and occupied this position until 2001. Since 2001, Mr. Samer AZHARI has been Chairman & General Manager of BLOM BANK FRANCE (formerly BANQUE BANORABE).He was Chairman and General Manager of AROPE INSURANCE, an affiliated insurance company of BLOM BANK S.A.L. from 1998 until 2008.From 1999 until 2001, he occupied the position of Vice–President of the Association of Banks in Lebanon.Mr. Samer AZHARI has been BLOM BANK Group’s Secretary General since 2007.Mr. Samer AZHARI holds a Master of Science degree in Civil Engineering from the University of Illinois, USA and an MBA from INSEAD, France.
Dr. Fadi OSSEIRAN, born in 1956, started his banking career at BLOM BANK S.A.L. as Assistant Dealer from 1981 to 1982. From 1990 until 1993, he was Manager of Corporate Planning and Human Resources Development at Méditerranée Group Services.From 1985 to 1987, he moved to teach in the Economics Department at the American University of Beirut and became Assistant Professor at the Institute of Money and Banking of AUB from 1988 to 1993.Since 1994, he has been General Manager of BLOMINVEST BANK S.A.L. and Advisor to the Chairman – General Manager of BLOM BANK S.A.L. Dr. OSSEIRAN became a Member of the Board of Directors of BLOM BANK S.A.L. in 2008. He has been a Director of BLOMINVEST BANK SAUDI ARABIA since 2008.Dr. OSSEIRAN has held the position of President of the Association of Stock Brokers in Beirut since 2004 and has been a Member of the Lebanese Economic Association since 2004. He was also Member of the Research Committee (1992-2006) and Member of the Training Committee (1994-1996) of the Association of Banks in Lebanon.He was Board Member of the Lebanese Management Association from 1992 to 1996 and he was reelected in 2014, he has many publications in the Banking and Economics Fields.Dr. OSSEIRAN is holder of a Ph.D. in Economics from New York University (NYU) in the United States.
Corporate Governance
BLOM BANK s.A.L. 20
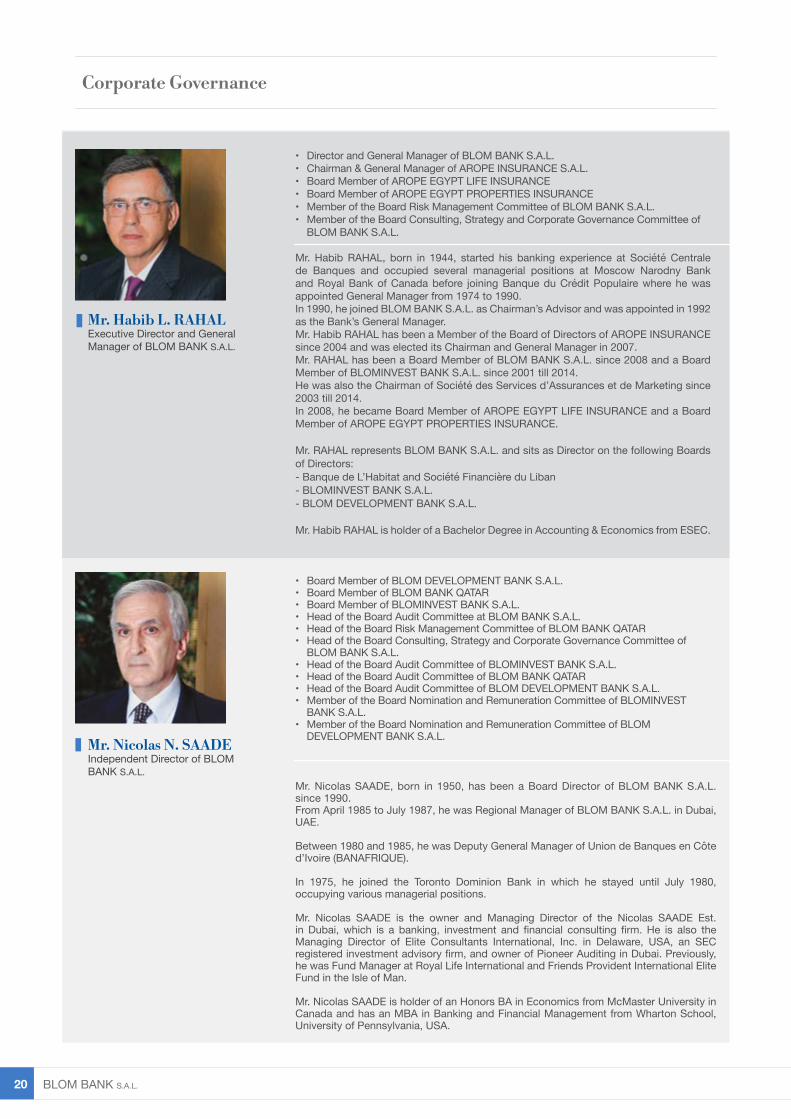
Mr. Habib L. RAHALExecutive Director and General Manager of BLOM BANK S.A.L.
• Director and General Manager of BLOM BANK S.A.L.• Chairman & General Manager of AROPE INSURANCE S.A.L.• Board Member of AROPE EGYPT LIFE INSURANCE• Board Member of AROPE EGYPT PROPERTIES INSURANCE• Member of the Board Risk Management Committee of BLOM BANK S.A.L.• Member of the Board Consulting, Strategy and Corporate Governance Committee of
BLOM BANK S.A.L.
Mr. Habib RAHAL, born in 1944, started his banking experience at Société Centrale de Banques and occupied several managerial positions at Moscow Narodny Bank and Royal Bank of Canada before joining Banque du Crédit Populaire where he was appointed General Manager from 1974 to 1990.In 1990, he joined BLOM BANK S.A.L. as Chairman’s Advisor and was appointed in 1992 as the Bank’s General Manager.Mr. Habib RAHAL has been a Member of the Board of Directors of AROPE INSURANCE since 2004 and was elected its Chairman and General Manager in 2007.Mr. RAHAL has been a Board Member of BLOM BANK S.A.L. since 2008 and a Board Member of BLOMINVEST BANK S.A.L. since 2001 till 2014. He was also the Chairman of Société des Services d’Assurances et de Marketing since 2003 till 2014.In 2008, he became Board Member of AROPE EGYPT LIFE INSURANCE and a Board Member of AROPE EGYPT PROPERTIES INSURANCE.
Mr. RAHAL represents BLOM BANK S.A.L. and sits as Director on the following Boards of Directors: - Banque de L’Habitat and Société Financière du Liban- BLOMINVEST BANK S.A.L.- BLOM DEVELOPMENT BANK S.A.L.
Mr. Habib RAHAL is holder of a Bachelor Degree in Accounting & Economics from ESEC.
Mr. Nicolas N. SAADEIndependent Director of BLOM BANK S.A.L.
• Board Member of BLOM DEVELOPMENT BANK S.A.L.• Board Member of BLOM BANK QATAR• Board Member of BLOMINVEST BANK S.A.L.• Head of the Board Audit Committee at BLOM BANK S.A.L.• Head of the Board Risk Management Committee of BLOM BANK QATAR• Head of the Board Consulting, Strategy and Corporate Governance Committee of
BLOM BANK S.A.L.• Head of the Board Audit Committee of BLOMINVEST BANK S.A.L.• Head of the Board Audit Committee of BLOM BANK QATAR• Head of the Board Audit Committee of BLOM DEVELOPMENT BANK S.A.L.• Member of the Board Nomination and Remuneration Committee of BLOMINVEST
BANK S.A.L. • Member of the Board Nomination and Remuneration Committee of BLOM
DEVELOPMENT BANK S.A.L.
Mr. Nicolas SAADE, born in 1950, has been a Board Director of BLOM BANK S.A.L. since 1990.From April 1985 to July 1987, he was Regional Manager of BLOM BANK S.A.L. in Dubai, UAE.
Between 1980 and 1985, he was Deputy General Manager of Union de Banques en Côte d’Ivoire (BANAFRIQUE).
In 1975, he joined the Toronto Dominion Bank in which he stayed until July 1980, occupying various managerial positions.
Mr. Nicolas SAADE is the owner and Managing Director of the Nicolas SAADE Est. in Dubai, which is a banking, investment and financial consulting firm. He is also the Managing Director of Elite Consultants International, Inc. in Delaware, USA, an SEC registered investment advisory firm, and owner of Pioneer Auditing in Dubai. Previously, he was Fund Manager at Royal Life International and Friends Provident International Elite Fund in the Isle of Man.
Mr. Nicolas SAADE is holder of an Honors BA in Economics from McMaster University in Canada and has an MBA in Banking and Financial Management from Wharton School, University of Pennsylvania, USA.
Corporate Governance
Annual Report 2015 21
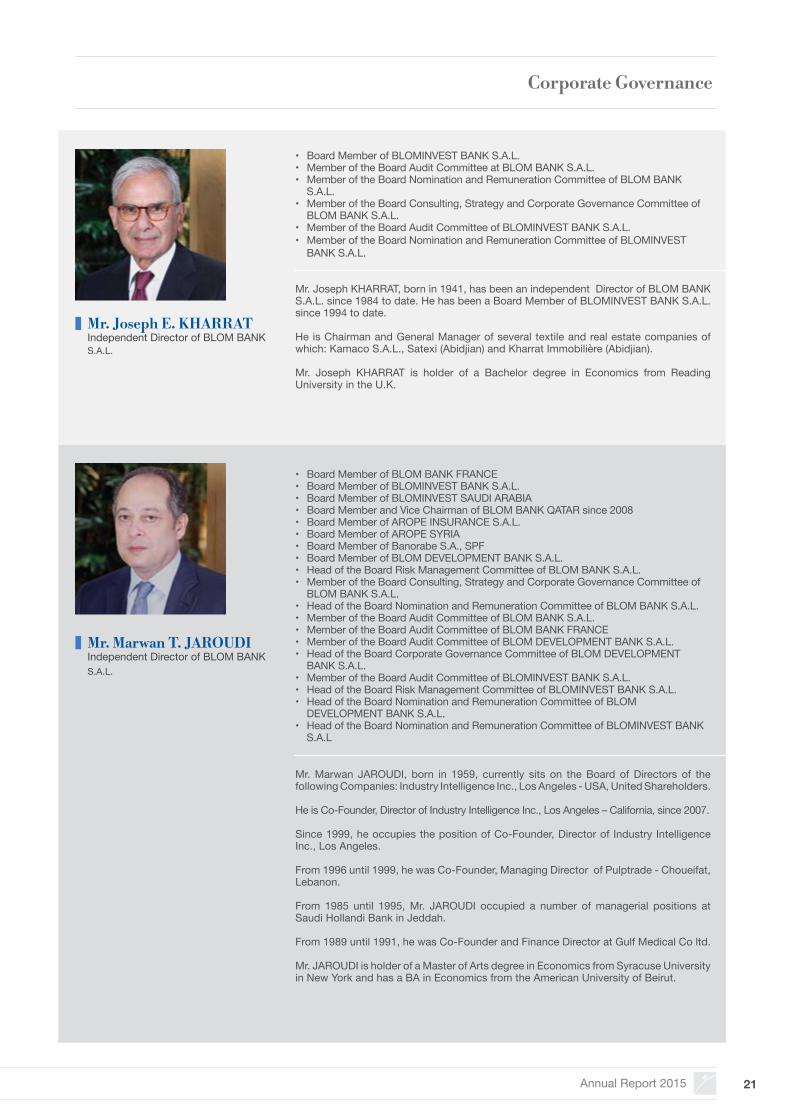
Mr. Joseph E. KHARRATIndependent Director of BLOM BANK S.A.L.
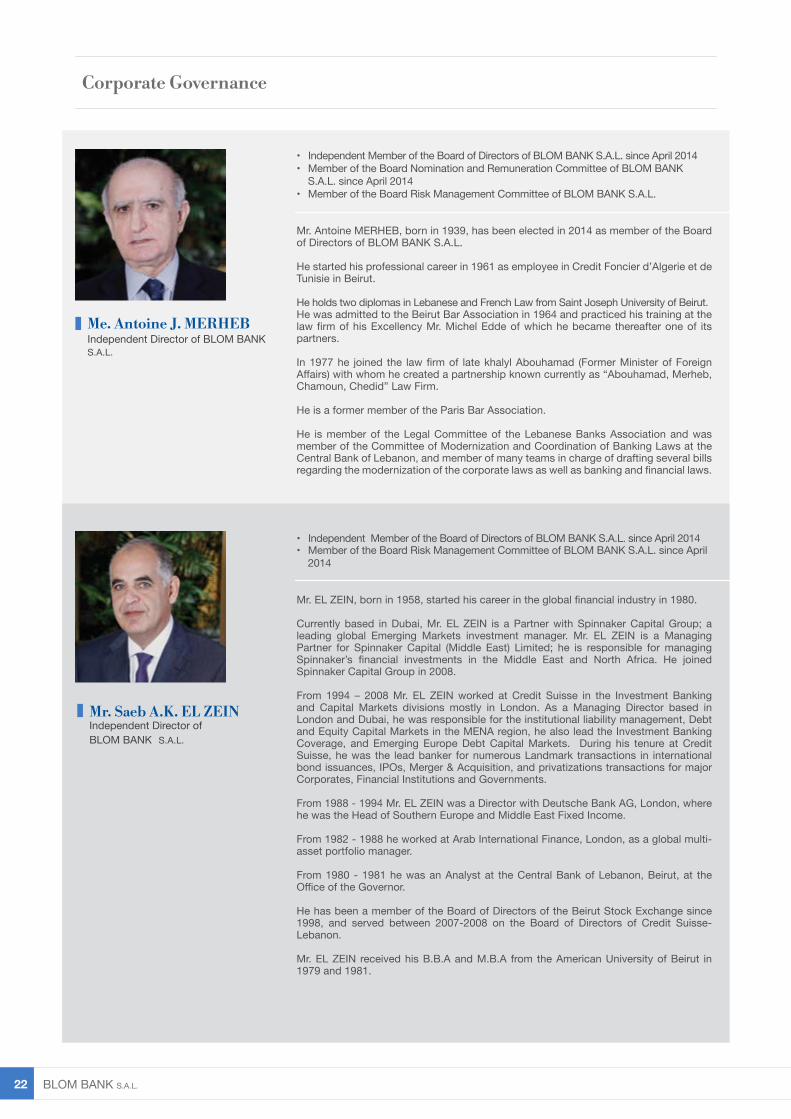
Mr. Marwan T. JAROUDIIndependent Director of BLOM BANK S.A.L.
• Board Member of BLOMINVEST BANK S.A.L.• Member of the Board Audit Committee at BLOM BANK S.A.L.• Member of the Board Nomination and Remuneration Committee of BLOM BANK
S.A.L.• Member of the Board Consulting, Strategy and Corporate Governance Committee of
BLOM BANK S.A.L.• Member of the Board Audit Committee of BLOMINVEST BANK S.A.L.• Member of the Board Nomination and Remuneration Committee of BLOMINVEST
BANK S.A.L.
Mr. Joseph KHARRAT, born in 1941, has been an independent Director of BLOM BANK S.A.L. since 1984 to date. He has been a Board Member of BLOMINVEST BANK S.A.L. since 1994 to date.
He is Chairman and General Manager of several textile and real estate companies of which: Kamaco S.A.L., Satexi (Abidjian) and Kharrat Immobilière (Abidjian).
Mr. Joseph KHARRAT is holder of a Bachelor degree in Economics from Reading University in the U.K.
• Board Member of BLOM BANK FRANCE• Board Member of BLOMINVEST BANK S.A.L.• Board Member of BLOMINVEST SAUDI ARABIA• Board Member and Vice Chairman of BLOM BANK QATAR since 2008• Board Member of AROPE INSURANCE S.A.L.• Board Member of AROPE SYRIA • Board Member of Banorabe S.A., SPF• Board Member of BLOM DEVELOPMENT BANK S.A.L.• Head of the Board Risk Management Committee of BLOM BANK S.A.L.• Member of the Board Consulting, Strategy and Corporate Governance Committee of
BLOM BANK S.A.L.• Head of the Board Nomination and Remuneration Committee of BLOM BANK S.A.L.• Member of the Board Audit Committee of BLOM BANK S.A.L.• Member of the Board Audit Committee of BLOM BANK FRANCE• Member of the Board Audit Committee of BLOM DEVELOPMENT BANK S.A.L.• Head of the Board Corporate Governance Committee of BLOM DEVELOPMENT
BANK S.A.L.• Member of the Board Audit Committee of BLOMINVEST BANK S.A.L.• Head of the Board Risk Management Committee of BLOMINVEST BANK S.A.L.• Head of the Board Nomination and Remuneration Committee of BLOM
DEVELOPMENT BANK S.A.L.• Head of the Board Nomination and Remuneration Committee of BLOMINVEST BANK
S.A.L
Mr. Marwan JAROUDI, born in 1959, currently sits on the Board of Directors of the following Companies: Industry Intelligence Inc., Los Angeles - USA, United Shareholders.
He is Co-Founder, Director of Industry Intelligence Inc., Los Angeles – California, since 2007.
Since 1999, he occupies the position of Co-Founder, Director of Industry Intelligence Inc., Los Angeles.
From 1996 until 1999, he was Co-Founder, Managing Director of Pulptrade - Choueifat, Lebanon.
From 1985 until 1995, Mr. JAROUDI occupied a number of managerial positions at Saudi Hollandi Bank in Jeddah.
From 1989 until 1991, he was Co-Founder and Finance Director at Gulf Medical Co ltd.
Mr. JAROUDI is holder of a Master of Arts degree in Economics from Syracuse University in New York and has a BA in Economics from the American University of Beirut.
Corporate Governance
BLOM BANK s.A.L. 22
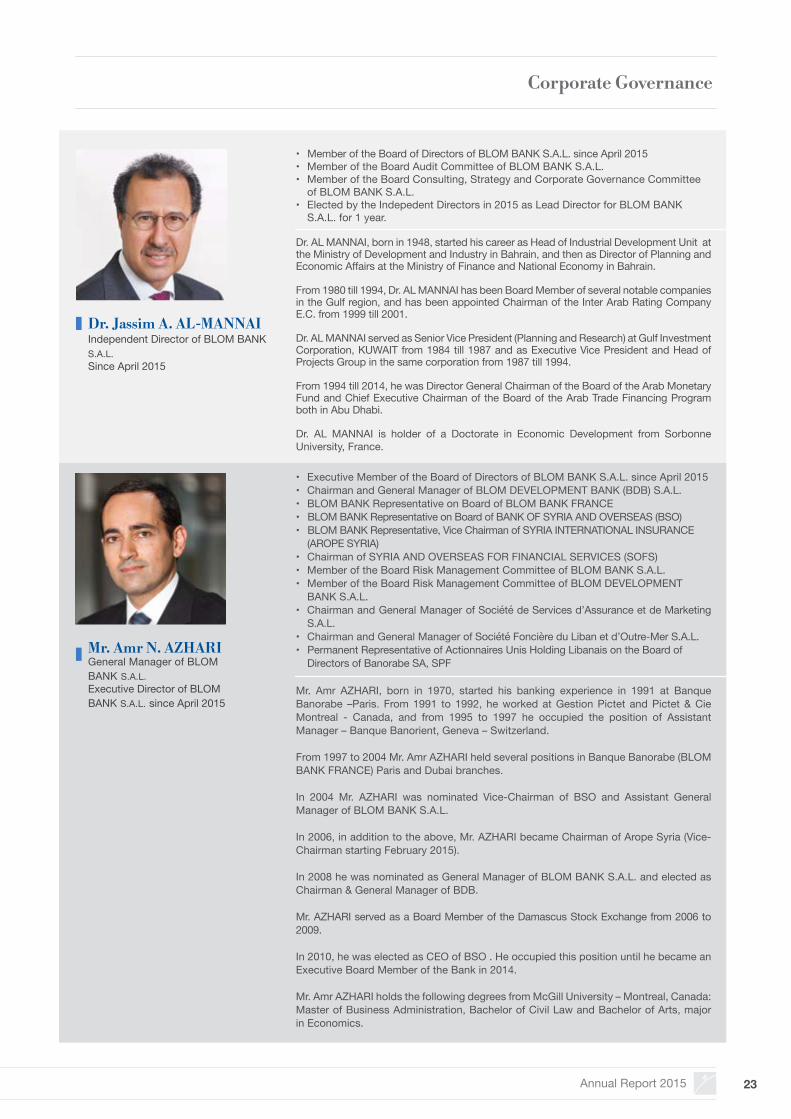
Me. Antoine J. MERHEBIndependent Director of BLOM BANK S.A.L.
Mr. Saeb A.K. EL ZEINIndependent Director of BLOM BANK S.A.L.
• Independent Member of the Board of Directors of BLOM BANK S.A.L. since April 2014• Member of the Board Nomination and Remuneration Committee of BLOM BANK
S.A.L. since April 2014• Member of the Board Risk Management Committee of BLOM BANK S.A.L.
Mr. Antoine MERHEB, born in 1939, has been elected in 2014 as member of the Board of Directors of BLOM BANK S.A.L.
He started his professional career in 1961 as employee in Credit Foncier d’Algerie et de Tunisie in Beirut.
He holds two diplomas in Lebanese and French Law from Saint Joseph University of Beirut.He was admitted to the Beirut Bar Association in 1964 and practiced his training at the law firm of his Excellency Mr. Michel Edde of which he became thereafter one of its partners.
In 1977 he joined the law firm of late khalyl Abouhamad (Former Minister of Foreign Affairs) with whom he created a partnership known currently as “Abouhamad, Merheb, Chamoun, Chedid” Law Firm.
He is a former member of the Paris Bar Association.
He is member of the Legal Committee of the Lebanese Banks Association and was member of the Committee of Modernization and Coordination of Banking Laws at the Central Bank of Lebanon, and member of many teams in charge of drafting several bills regarding the modernization of the corporate laws as well as banking and financial laws.
• Independent Member of the Board of Directors of BLOM BANK S.A.L. since April 2014 • Member of the Board Risk Management Committee of BLOM BANK S.A.L. since April
2014
Mr. EL ZEIN, born in 1958, started his career in the global financial industry in 1980.
Currently based in Dubai, Mr. EL ZEIN is a Partner with Spinnaker Capital Group; a leading global Emerging Markets investment manager. Mr. EL ZEIN is a Managing Partner for Spinnaker Capital (Middle East) Limited; he is responsible for managing Spinnaker’s financial investments in the Middle East and North Africa. He joined Spinnaker Capital Group in 2008.
From 1994 – 2008 Mr. EL ZEIN worked at Credit Suisse in the Investment Banking and Capital Markets divisions mostly in London. As a Managing Director based in London and Dubai, he was responsible for the institutional liability management, Debt and Equity Capital Markets in the MENA region, he also lead the Investment Banking Coverage, and Emerging Europe Debt Capital Markets. During his tenure at Credit Suisse, he was the lead banker for numerous Landmark transactions in international bond issuances, IPOs, Merger & Acquisition, and privatizations transactions for major Corporates, Financial Institutions and Governments.
From 1988 - 1994 Mr. EL ZEIN was a Director with Deutsche Bank AG, London, where he was the Head of Southern Europe and Middle East Fixed Income.
From 1982 - 1988 he worked at Arab International Finance, London, as a global multi-asset portfolio manager.
From 1980 - 1981 he was an Analyst at the Central Bank of Lebanon, Beirut, at the Office of the Governor.
He has been a member of the Board of Directors of the Beirut Stock Exchange since 1998, and served between 2007-2008 on the Board of Directors of Credit Suisse-Lebanon.
Mr. EL ZEIN received his B.B.A and M.B.A from the American University of Beirut in 1979 and 1981.
Corporate Governance
Annual Report 2015 23
Dr. Jassim A. AL-MANNAIIndependent Director of BLOM BANK S.A.L. Since April 2015
Mr. Amr N. AZHARIGeneral Manager of BLOMBANK S.A.L. Executive Director of BLOM BANK S.A.L. since April 2015
• Member of the Board of Directors of BLOM BANK S.A.L. since April 2015• Member of the Board Audit Committee of BLOM BANK S.A.L.• Member of the Board Consulting, Strategy and Corporate Governance Committee
of BLOM BANK S.A.L.• Elected by the Indepedent Directors in 2015 as Lead Director for BLOM BANK
S.A.L. for 1 year.
Dr. AL MANNAI, born in 1948, started his career as Head of Industrial Development Unit at the Ministry of Development and Industry in Bahrain, and then as Director of Planning and Economic Affairs at the Ministry of Finance and National Economy in Bahrain.
From 1980 till 1994, Dr. AL MANNAI has been Board Member of several notable companies in the Gulf region, and has been appointed Chairman of the Inter Arab Rating Company E.C. from 1999 till 2001.
Dr. AL MANNAI served as Senior Vice President (Planning and Research) at Gulf Investment Corporation, KUWAIT from 1984 till 1987 and as Executive Vice President and Head of Projects Group in the same corporation from 1987 till 1994.
From 1994 till 2014, he was Director General Chairman of the Board of the Arab Monetary Fund and Chief Executive Chairman of the Board of the Arab Trade Financing Program both in Abu Dhabi.
Dr. AL MANNAI is holder of a Doctorate in Economic Development from Sorbonne University, France.
• Executive Member of the Board of Directors of BLOM BANK S.A.L. since April 2015• Chairman and General Manager of BLOM DEVELOPMENT BANK (BDB) S.A.L.• BLOM BANK Representative on Board of BLOM BANK FRANCE• BLOM BANK Representative on Board of BANK OF SYRIA AND OVERSEAS (BSO)• BLOM BANK Representative, Vice Chairman of SYRIA INTERNATIONAL INSURANCE
(AROPE SYRIA)• Chairman of SYRIA AND OVERSEAS FOR FINANCIAL SERVICES (SOFS)• Member of the Board Risk Management Committee of BLOM BANK S.A.L.• Member of the Board Risk Management Committee of BLOM DEVELOPMENT
BANK S.A.L.• Chairman and General Manager of Société de Services d’Assurance et de Marketing
S.A.L.• Chairman and General Manager of Société Foncière du Liban et d’Outre-Mer S.A.L.• Permanent Representative of Actionnaires Unis Holding Libanais on the Board of
Directors of Banorabe SA, SPF
Mr. Amr AZHARI, born in 1970, started his banking experience in 1991 at Banque Banorabe –Paris. From 1991 to 1992, he worked at Gestion Pictet and Pictet & Cie Montreal - Canada, and from 1995 to 1997 he occupied the position of Assistant Manager – Banque Banorient, Geneva – Switzerland.
From 1997 to 2004 Mr. Amr AZHARI held several positions in Banque Banorabe (BLOM BANK FRANCE) Paris and Dubai branches.
In 2004 Mr. AZHARI was nominated Vice-Chairman of BSO and Assistant General Manager of BLOM BANK S.A.L. In 2006, in addition to the above, Mr. AZHARI became Chairman of Arope Syria (Vice-Chairman starting February 2015).
In 2008 he was nominated as General Manager of BLOM BANK S.A.L. and elected as Chairman & General Manager of BDB.
Mr. AZHARI served as a Board Member of the Damascus Stock Exchange from 2006 to 2009.
In 2010, he was elected as CEO of BSO . He occupied this position until he became an Executive Board Member of the Bank in 2014.
Mr. Amr AZHARI holds the following degrees from McGill University – Montreal, Canada: Master of Business Administration, Bachelor of Civil Law and Bachelor of Arts, major in Economics.
Corporate Governance
BLOM BANK s.A.L. 24
5. Information on Key Members of BLOM BANK S.A.L. Management
• Member of the Board of BLOM BANK EGYPT • Member of the Corporate Governance and Compensation Committee of BLOM
BANK EGYPT • Member of the Board of Société Foncière du Liban et d’Outre-Mer S.A.L.• Member of the Board of Société de Services d’Assurance et de Marketing S.A.L.
Mr. Elias ARACTINGI, born in 1959, started his banking career in 1983 at Bank Audi USA in New York where he was promoted several times until he reached the title of Vice President and Head of Operations. He joined BSI (Banca della Svizzera Italiana)’s New York branch in 1988 as Vice President in the International Private Banking Group.
In 1990, Mr. ARACTINGI joined Booz Allen and Hamilton based in Singapore as an Associate and was promoted to Senior Associate in 1993, then to manager of the Bangkok office in 1994 and finally to Principal in 1995.
At the end of 1995, he joined BLOM BANK S.A.L. in Beirut as Advisor to the Chairman, focusing on branch and head office reengineering. In 1997, he initiated BLOM BANK’s Retail Banking activities.
In addition to his duties at BLOM BANK S.A.L., Mr. ARACTINGI held twice the position of Managing Director/CEO of BLOM BANK Egypt, in 2006 and 2009.
He was promoted to Deputy General Manager of BLOM BANK S.A.L. in 2009 and to General Manager in 2013.
Mr. Elias ARACTINGI holds a Bachelor Degree in Business Administration with distinction from the American University of Beirut and an MBA in Finance from Columbia University’s Graduate School of Business.
Mr. Elias E. ARACTINGIGeneral Manager of BLOM BANK S.A.L.
4.3 Board Meetings Held in 2015
9/1/2015 20/3/2015 15/4/2015 11/6/2015 11/9/20154/12/2015
The following BLOM BANK S.A.L. board meetings were held during 2015
Corporate Governance
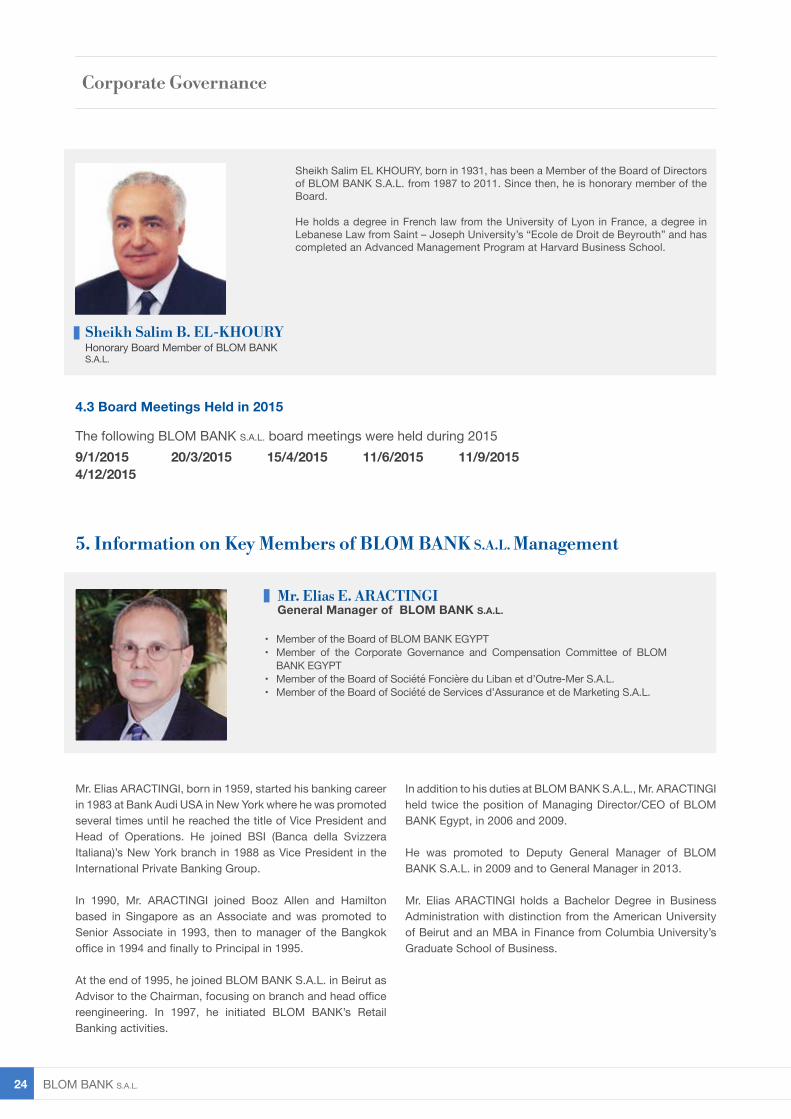
Sheikh Salim B. EL-KHOURY Honorary Board Member of BLOM BANK S.A.L.
Sheikh Salim EL KHOURY, born in 1931, has been a Member of the Board of Directors of BLOM BANK S.A.L. from 1987 to 2011. Since then, he is honorary member of the Board.
He holds a degree in French law from the University of Lyon in France, a degree in Lebanese Law from Saint – Joseph University’s “Ecole de Droit de Beyrouth” and has completed an Advanced Management Program at Harvard Business School.
Annual Report 2015 25
• Member of the Board of Société Foncière du Liban et d’Outre-Mer S.A.L.
Dr. Pierre ABOU-EZZE, born in 1955, Assistant General Manager at BLOM BANK S.A.L., has over 20 years of hands-on experience in Human Resources. He has been the Head of HR at BLOM BANK S.A.L. since 1998, and he served as Advisor to the Chairman on training issues from 1995 to 1998.
Prior to joining BLOM BANK S.A.L., DR. ABOU-EZZE was in academia. He served as the Director of the Graduate School of Business and Management at the American University of Beirut from 1993 to 1996, and he was Assistant Professor at the same school from 1991 to 1997.
Before moving back to Lebanon, Dr. ABOU-EZZE started his career as an Assistant Professor of Economics at the University of Ottawa, Canada, and at the University of Kuwait.
Dr. ABOU-EZZE continues to lecture at various Universities in Lebanon, and to lead seminars and workshops in the field of Human Resources. He served as the Chairman of the Human Resources & Social Affairs Committee at the Association of Banks in Lebanon for 2 consecutive terms from 2005 to 2009. Dr. ABOU-EZZE holds a Ph.D in Economics from McMaster University, Hamilton, Canada.
Mr. Talal Baba, born in 1967, is the Chief Financial Officer. He was appointed as Assistant General Manager on July 2008.
Mr. Baba is committed to maintaining the high level of integrity and transparency that BLOM BANK S.A.L. is known for.
He joined BLOM BANK S.A.L. in 1991 where he started to excel and climb his career ladder. He has now over 24 years
of banking experience acquired with major banking players on the Lebanese market. He also attended various training programs and workshops in Lebanon and abroad.
Mr. Baba earned his Bachelor’s degree in Accounting and his Master in Business Administration from the Lebanese American University – Beirut.
Dr. Pierre G. ABOU-EZZEAssistant General Manager Head of Human Resources at BLOM BANK S.A.L.
Mr. Talal A. BABAAssistant General ManagerChief Financial Officer at BLOM BANK S.A.L.
Corporate Governance
BLOM BANK s.A.L. 26
• Member of the VISA CEMEA Business Council
• Represents BLOM BANK S.A.L. on the board of Interbank Payment Network (IPN)• Represents BLOM BANK S.A.L. at the ABL Committee for Organization,
Standardization and Information Technology
Mrs. Jocelyne CHAHWAN, born in 1965, started her banking career in 1990 at the Bank of Montreal in Montreal where she was promoted several times until she reached the title of Manager/Investment Services.
In March 1996, she joined BLOM BANK S.A.L. in Beirut and became the Head of the Training & Development Department. In 1999, she moved to Retail Banking as Head of the Marketing Division.
In 2009, she was promoted to the position of Deputy Head of Retail Banking.
In October 2011, she became the first Lebanese Banker on VISA’s advisory council for the Levant, and is now part of the VISA CEMEA Business Council.
In December 2011, she was promoted to Assistant General Manager and in July 2013, she was appointed as Head of Retail Banking.
Mrs. Jocelyne CHAHWAN holds a Master of Business Administration from Ecole Supérieure des Affaires (ESA).
Mrs. Jocelyne Y. CHAHWANAssistant General Manager Head of Retail Banking at BLOM BANK S.A.L.
Mr. Antoine N. LAWANDOSAssistant General ManagerChief Information Officer at BLOM BANK S.A.L.
Corporate Governance
Mr. Antoine LAWANDOS, born in 1963, started his career in 1986 by joining Istisharat, a leading software house, where he was quickly promoted to Head of Production Unit of Banking Software and where he acquired extensive experience in managing the development, implementation and integration of complex and mission-critical universal banking systems. Also, he was one of the main contributors in building and exporting a well-known locally-developed core banking system (ICBS) to renowned banks in Europe and KSA, a pioneering step at that time.
Before joining BLOM BANK S.A.L., Mr. LAWANDOS had mainly serviced the banking sector since he held the position of the Systems Engineering Department Manager at IBM’s representative bureau in Lebanon and that of a Project Manager at MDSL - a core banking solutions integrator – for the implementation of a then renowned Irish core banking application (BankMaster).
In 1993, Mr. LAWANDOS joined BLOM BANK S.A.L. as the Project Director for leading the bank’s core banking application change and soon after, he became the Senior Manager of the Information Technology and Systems Development Department in 1995. In 2006, Mr. LAWANDOS became BLOM BANK’s Chief Information Officer and in 2008, he was appointed Assistant General Manager of BLOM BANK S.A.L. in addition to being the bank’s Chief Information Officer where he has been accompanying the digitization of BLOM BANK S.A.L. products and services and the adoption of the omnichannel banking trend.
Mr. LAWANDOS holds a Master of Engineering degree in Electronics and Information Systems from Université Saint-Jospeh’s School of Engineering – ESIB and has an extensive experience in leading mission-critical core systems transformation and implementation initiatives, in particular those related to core banking applications; has a multi-national exposure to diverse banking markets and practices; and has a proven expertise in aligning IT Strategies with business goals as well as in devising technology-driven innovative products and services.
Annual Report 2015 27
6. BLOM BANK S.A.L. Commercial Arrangements
Any commercial arrangement between the Bank and any of its affiliates is pre-approved by the General Assembly of Shareholders of the Bank and of the concerned affiliate according to art. 158 of the Lebanese commerce law, when applicable.
No change of control has occurred during 2015.
7. General Management of BLOM BANK S.A.L.
Chairman & General Manager
Mr. Saad AZHARI
Secretary General / BLOM Group
Mr. Samer AZHARI
General Managers
Mr. Habib RAHAL
Mr. Amr AZHARI
Mr. Elias ARACTINGI
Assistant General Managers (*)
Dr. Pierre ABOU EZZE Human Resources
Mr. Talal BABA Finance & Treasury
Mrs. Jocelyne CHAHWAN Retail Banking
Mr. Antoine LAWANDOS Information Systems
Advisors (*)
Mr. Michel AZZAM Advisor to the General Management
Sheikh Fahim MO’DAD Chairman Advisor
Mr. Georges SAYEGH Advisor to the General Management
Corporate Secretary
Me. Aimée SAYEGH
Group Trade Finance Advisor
Mr. Jacques SABOUNJI
Security Advisor
Mr. Mohamad Ibrahim FEHMI
(*) By Alphabetical Order
Corporate Governance
BLOM BANK s.A.L. 28
DIVISIONS, DEPARTMENTS & UNITS*
Administration Mr. Mohammad MARRACH
Branch Network Management Mrs. Nathalie GHARIOS
Central Funds Transfer Mrs. Rima HAJJAR (EL)
Central Operations & Group Strategic Planning Mr. Talal IBRAHIM
Communications Mrs. Isabelle NAOUM
Corporate Credit & Relationship Mr. Samir KASSIS
Corporate Secretary Me. Aimée SAYEGH
Credit & Facilities Mr. Mounir TOUKAN
Engineering Eng. Abdo KANAAN
External Legal Affairs Me. Grace ASMAR
Finance Mr. Talal BABA
Financial Institutions Mrs. Rana BEYDOUN
Financial Markets Mr. Marwan ABOU KHALIL
Group Compliance Mr. Malek COSTA
Group Customer Advocacy - Lebanon Mrs. Ayla DAME
Group Inspection Mr. Naoum RAPHAEL
Group Internal Audit Mrs. Rania KAISSI
Group Risk Management Mr. Roy RUBEIZ
Corporate Governance
Annual Report 2015 29
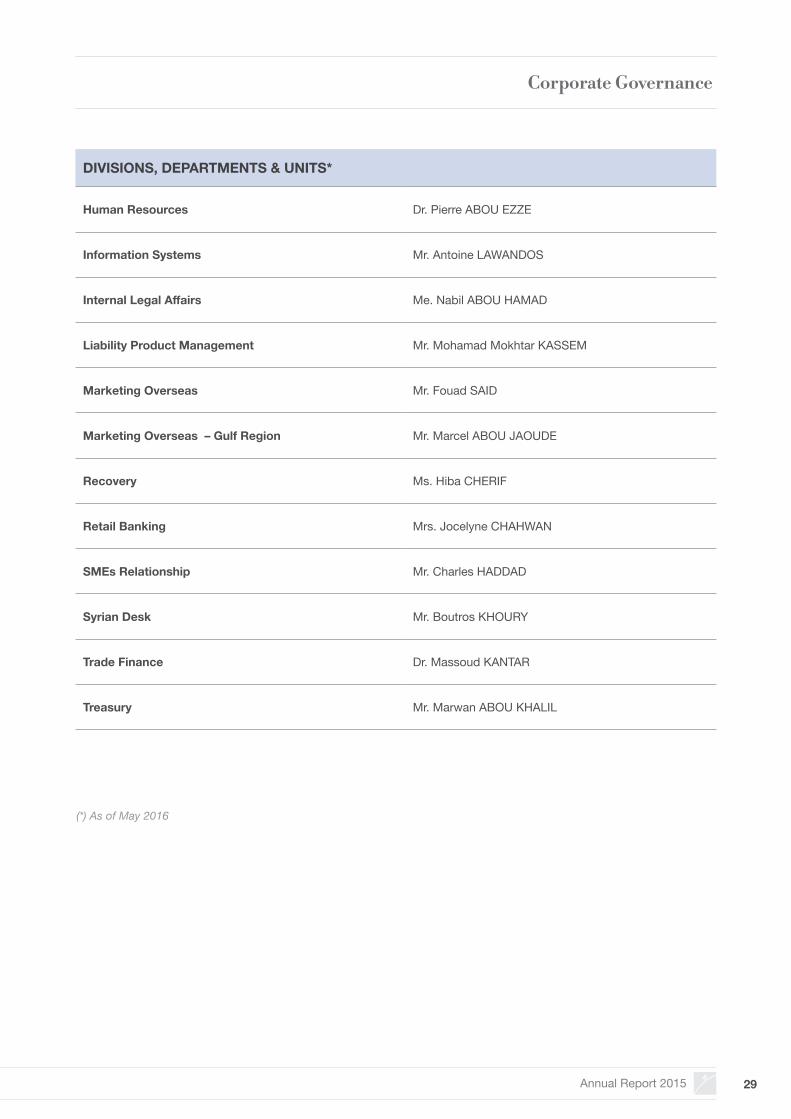
DIVISIONS, DEPARTMENTS & UNITS*
Human Resources Dr. Pierre ABOU EZZE
Information Systems Mr. Antoine LAWANDOS
Internal Legal Affairs Me. Nabil ABOU HAMAD
Liability Product Management Mr. Mohamad Mokhtar KASSEM
Marketing Overseas Mr. Fouad SAID
Marketing Overseas – Gulf Region Mr. Marcel ABOU JAOUDE
Recovery Ms. Hiba CHERIF
Retail Banking Mrs. Jocelyne CHAHWAN
SMEs Relationship Mr. Charles HADDAD
Syrian Desk Mr. Boutros KHOURY
Trade Finance Dr. Massoud KANTAR
Treasury Mr. Marwan ABOU KHALIL
Corporate Governance
(*) As of May 2016

BLOM BANK s.A.L. 30

Annual Report 2015 31
1. Operating Environment2. Overview3. Total Assets4. Sources of Funds
4.1 Customers’ Deposits4.2 Capitalization (Tier I & Tier II Capital)
5. Uses of Funds5.1 Investment Securities Portfolio5.2 Loans & Advances to Customers
6. Liquidity7. Performance
7.1 Net Interest Income7.2 Non Interest Income7.3 Operating Expenses
8. Dividend Distribution and Preferred Shares Revenue9. Risk Management and Basel Preparations
9.1 Risk Management Process9.2 Capital Adequacy Ratio9.3 Credit Risk Management9.4 Market Risk 9.5 Operational Risk9.6 Liquidity Risk9.7 Interest Rate Risk in the Banking Book9.8 Internal Capital Adequacy Assessment Process (ICAAP)
10. Corporate Governance11. Universal Banking Services
11.1 BLOMINVEST BANK Services11.2 Commercial & Corporate Banking11.3 Retail Banking11.4 Islamic Banking11.5 Insurance Products & Services
12. Information Systems and Technology13. People Development
13.1 General Overview13.2 Recruitment13.3 Training13.4 Career Development & Promotion13.5 Employee Benefits
14. Bank’s Operational Efficiency
33464749
52
5858
6667
7375
8184
87
Management Discussion & Analysis 2015
Annual Report 2015 33
1. Operating Environment
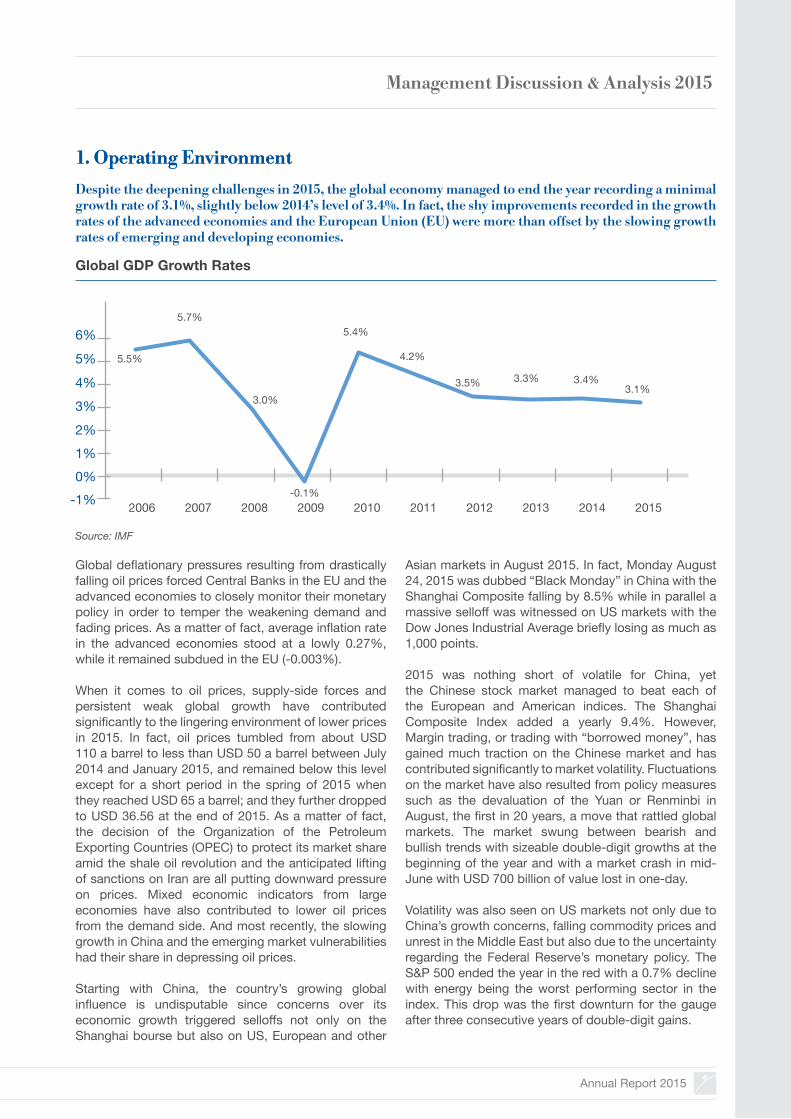
Despite the deepening challenges in 2015, the global economy managed to end the year recording a minimal growth rate of 3.1%, slightly below 2014’s level of 3.4%. In fact, the shy improvements recorded in the growth rates of the advanced economies and the European Union (EU) were more than offset by the slowing growth rates of emerging and developing economies.
1. Operating Environment
Management Discussion & Analysis 2015
Global deflationary pressures resulting from drastically falling oil prices forced Central Banks in the EU and the advanced economies to closely monitor their monetary policy in order to temper the weakening demand and fading prices. As a matter of fact, average inflation rate in the advanced economies stood at a lowly 0.27%, while it remained subdued in the EU (-0.003%).
When it comes to oil prices, supply-side forces and persistent weak global growth have contributed significantly to the lingering environment of lower prices in 2015. In fact, oil prices tumbled from about USD 110 a barrel to less than USD 50 a barrel between July 2014 and January 2015, and remained below this level except for a short period in the spring of 2015 when they reached USD 65 a barrel; and they further dropped to USD 36.56 at the end of 2015. As a matter of fact, the decision of the Organization of the Petroleum Exporting Countries (OPEC) to protect its market share amid the shale oil revolution and the anticipated lifting of sanctions on Iran are all putting downward pressure on prices. Mixed economic indicators from large economies have also contributed to lower oil prices from the demand side. And most recently, the slowing growth in China and the emerging market vulnerabilities had their share in depressing oil prices.
Starting with China, the country’s growing global influence is undisputable since concerns over its economic growth triggered selloffs not only on the Shanghai bourse but also on US, European and other
Asian markets in August 2015. In fact, Monday August 24, 2015 was dubbed “Black Monday” in China with the Shanghai Composite falling by 8.5% while in parallel a massive selloff was witnessed on US markets with the Dow Jones Industrial Average briefly losing as much as 1,000 points.
2015 was nothing short of volatile for China, yet the Chinese stock market managed to beat each of the European and American indices. The Shanghai Composite Index added a yearly 9.4%. However, Margin trading, or trading with “borrowed money”, has gained much traction on the Chinese market and has contributed significantly to market volatility. Fluctuations on the market have also resulted from policy measures such as the devaluation of the Yuan or Renminbi in August, the first in 20 years, a move that rattled global markets. The market swung between bearish and bullish trends with sizeable double-digit growths at the beginning of the year and with a market crash in mid-June with USD 700 billion of value lost in one-day.
Volatility was also seen on US markets not only due to China’s growth concerns, falling commodity prices and unrest in the Middle East but also due to the uncertainty regarding the Federal Reserve’s monetary policy. The S&P 500 ended the year in the red with a 0.7% decline with energy being the worst performing sector in the index. This drop was the first downturn for the gauge after three consecutive years of double-digit gains.
Source: IMF
Global GDP Growth Rates
2006 2007 2008 2009 2010 2011 2012 2013 20152014
5.5%
5.7%
3.0%
4.2%
5.4%
3.3%3.5% 3.4%3.1%
-0.1%0%
-1%
1%2%
3%4%
5%
6%
BLOM BANK s.A.L. 34
Management Discussion & Analysis 2015
Europe seems to have gathered pace in 2015 with the Euro Stoxx 50 gaining a yearly 3.8% in 2015. It is reassuring for European markets to see that the European Central Bank is committed to spurring growth through an accommodative monetary policy. European equities also benefitted from the weak euro which boosted European companies’ earnings.
The fall in oil prices and the ongoing political tensions were the main themes determining the economic outlook of MENA countries. While the tensions between regional powers and the persisting wars and conflicts were weighing on the performance of non GCC countries; the decline in oil prices remained the major determinant of GCC countries’ economic growth. The International Monetary Fund (IMF) projected real economic growth in the MENA region to drop from 2.6% in 2014 to 2.3% in 2015.
In GCC countries, the deceleration of economic growth is taking place at a slow pace, but it is expected to continue in 2016 as countries initiated fiscal consolidation to accommodate for lower oil prices. In fact, growth in GCC countries was estimated at 3.25% in 2015 and is projected to slide to 2.75% this year. The large amounts of reserves accumulated during years of high oil prices are acting as buffers during years of low oil prices.
For instance, Saudi Arabia, the world’s largest oil exporter, announced it would cut public spending by 14% from USD 260 billion in 2015 to USD 224 billion in 2016, it also revealed that revenues, around 70% of which stemmed from oil, are forecast to drop from USD 162 billion in 2015 to USD 137 billion in 2016. To curb its fiscal deficit, Saudi Arabia is counting on its Central Bank’s substantial reserve assets which stood at around USD 616.43 billion in 2015, but is also looking to tap international bond markets in order to avoid any liquidity pressures in its banking system. Against this same backdrop, the government of Oman recently borrowed USD 1 billion through a syndicated loan, Qatar sealed a USD 5.5 billion loan and Sharjah priced a USD 500 million five-year Islamic bond issue.
For MENA’s oil importing countries, recovery is gathering pace and can go faster with the help of lower oil prices. The real economic growth of MENA’s oil importers is expected to recover from 2.4% in 2014 to 3.8% in 2015 and 4% in 2016. In 2015, Morocco and Egypt boosted the region’s overall growth whereas Jordan, Lebanon and Tunisia registered either stagnation or a decline in real GDP growth.
As for Arab Bourses, lower oil prices triggered double-digit downturns across the board with the exception of
Abu Dhabi. Saudi Arabia’s main benchmark index the Tadawul All Shares Index (TASI) lost 17% and so did Dubai’s stock market index. Kuwait and Bahrain’s stock markets lost 15% and 12%, respectively. Abu Dhabi’s bourse was the herd’s black sheep registering a gain of 8% for the year 2015. The Egyptian stock Exchange was a major loser amongst its Arab peers with the EGX 30 sinking by a yearly 22%. The Egyptian bourse not only suffered the strains of the global turmoil but also of its own precarious political and security situations.
The Lebanese Economy in 2015: Subdued Performance Under Tough Circumstances
The prevailing political environment and the recurrence of security incidents, on both the domestic and regional levels, heavily weighed on the Lebanese economy during 2015. Besides the spillovers of the lingering war in Syria and the heightening tensions in the entire region, the Lebanese parliament failed to reach a consensus regarding the election of a new president. The security scene was quite shaken by several incidents throughout the year, topped by suicide bombings in Tripoli and the northern suburb of Beirut. The garbage crisis set off a social outcry, which in turn evolved into protests of which several degenerated into clashes between activists and anti-riot police. However, 2015 sealed the last month of the year with optimistic hopes after the liberation of the abducted Lebanese soldiers by Al Nusra Front and the positive political talks regarding a potential breakthrough in the 19-month presidential vacuum.
Following five years of outstanding performance, the Lebanese economy entered a new era of distress starting 2011. In particular, 2015 was one of the years to materialize the negative repercussions of regional and domestic political developments and instabilities on the economic performance of the country. This mainly resulted from the negative impacts of the worsening regional and domestic conditions on the core drivers of growth such as real estate and tourism. Accordingly, GDP growth is estimated to have reached a negligible level of 0.5% during 2015 and could have turned negative if not for the initiatives of the Lebanese Central Bank.
Similarly, the private sector was dealt a tough-hand as shown by the BLOM BANK Lebanon Purchasing Managers’ Index (PMI) that remained below the 50-mark, separating economic contraction from economic growth for the entire survey period. In fact, the index averaged 48.4 during 2015 compared to an average of 47.6 in 2014, signaling a slower deterioration in the operating conditions of the private sector.
Annual Report 2015 35
Management Discussion & Analysis 2015
Overview of Real Estate and Construction Performance in 2015
Source: Business Monitor International
Total Number and Value of Real Estate Transactions
Source: Lebanese Cadastre Registry
Value of Real Estate Transaction (In USD Billion, LA) Volume of Real Estate Transactions (RA)
2011 2012 2013 2014 2015
50,000
100,000
150,000
7.5
8.0
8.5
9.0
9.5
10.0
9.36115,237
100,057 93,328 94,50382,790
9.599.49
9.72
8.41
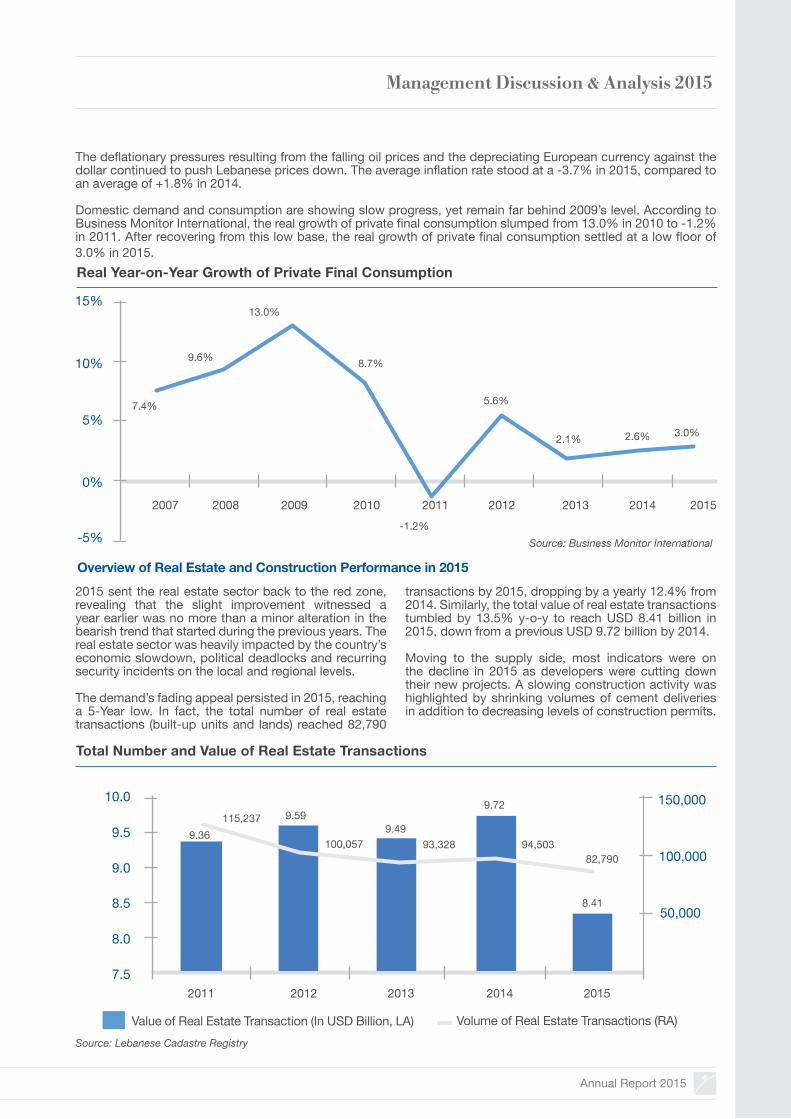
The deflationary pressures resulting from the falling oil prices and the depreciating European currency against the dollar continued to push Lebanese prices down. The average inflation rate stood at a -3.7% in 2015, compared to an average of +1.8% in 2014.
Domestic demand and consumption are showing slow progress, yet remain far behind 2009’s level. According to Business Monitor International, the real growth of private final consumption slumped from 13.0% in 2010 to -1.2% in 2011. After recovering from this low base, the real growth of private final consumption settled at a low floor of 3.0% in 2015.
2015 sent the real estate sector back to the red zone, revealing that the slight improvement witnessed a year earlier was no more than a minor alteration in the bearish trend that started during the previous years. The real estate sector was heavily impacted by the country’s economic slowdown, political deadlocks and recurring security incidents on the local and regional levels.
The demand’s fading appeal persisted in 2015, reaching a 5-Year low. In fact, the total number of real estate transactions (built-up units and lands) reached 82,790
transactions by 2015, dropping by a yearly 12.4% from 2014. Similarly, the total value of real estate transactions tumbled by 13.5% y-o-y to reach USD 8.41 billion in 2015, down from a previous USD 9.72 billion by 2014.
Moving to the supply side, most indicators were on the decline in 2015 as developers were cutting down their new projects. A slowing construction activity was highlighted by shrinking volumes of cement deliveries in addition to decreasing levels of construction permits.
Real Year-on-Year Growth of Private Final Consumption
2007 2008 2009 2010 2011 2012 2013 2014 2015
7.4%
13.0%
9.6% 8.7%
5.6%
2.1% 2.6% 3.0%
-1.2%
0%
-5%
5%
10%
15%
BLOM BANK s.A.L. 36
Management Discussion & Analysis 2015
Source: Orders of Engineers in Beirut and the North
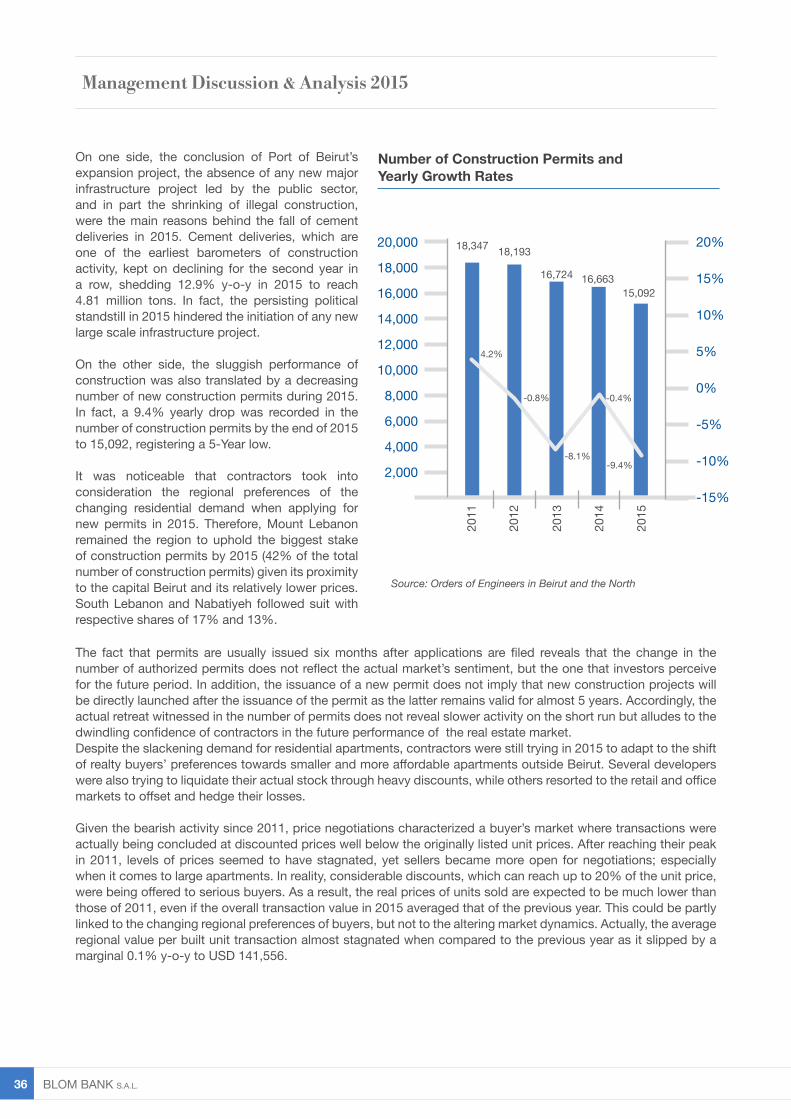
On one side, the conclusion of Port of Beirut’s expansion project, the absence of any new major infrastructure project led by the public sector, and in part the shrinking of illegal construction, were the main reasons behind the fall of cement deliveries in 2015. Cement deliveries, which are one of the earliest barometers of construction activity, kept on declining for the second year in a row, shedding 12.9% y-o-y in 2015 to reach 4.81 million tons. In fact, the persisting political standstill in 2015 hindered the initiation of any new large scale infrastructure project.
On the other side, the sluggish performance of construction was also translated by a decreasing number of new construction permits during 2015. In fact, a 9.4% yearly drop was recorded in the number of construction permits by the end of 2015 to 15,092, registering a 5-Year low.
It was noticeable that contractors took into consideration the regional preferences of the changing residential demand when applying for new permits in 2015. Therefore, Mount Lebanon remained the region to uphold the biggest stake of construction permits by 2015 (42% of the total number of construction permits) given its proximity to the capital Beirut and its relatively lower prices. South Lebanon and Nabatiyeh followed suit with respective shares of 17% and 13%.
The fact that permits are usually issued six months after applications are filed reveals that the change in the number of authorized permits does not reflect the actual market’s sentiment, but the one that investors perceive for the future period. In addition, the issuance of a new permit does not imply that new construction projects will be directly launched after the issuance of the permit as the latter remains valid for almost 5 years. Accordingly, the actual retreat witnessed in the number of permits does not reveal slower activity on the short run but alludes to the dwindling confidence of contractors in the future performance of the real estate market. Despite the slackening demand for residential apartments, contractors were still trying in 2015 to adapt to the shift of realty buyers’ preferences towards smaller and more affordable apartments outside Beirut. Several developers were also trying to liquidate their actual stock through heavy discounts, while others resorted to the retail and office markets to offset and hedge their losses.
Given the bearish activity since 2011, price negotiations characterized a buyer’s market where transactions were actually being concluded at discounted prices well below the originally listed unit prices. After reaching their peak in 2011, levels of prices seemed to have stagnated, yet sellers became more open for negotiations; especially when it comes to large apartments. In reality, considerable discounts, which can reach up to 20% of the unit price, were being offered to serious buyers. As a result, the real prices of units sold are expected to be much lower than those of 2011, even if the overall transaction value in 2015 averaged that of the previous year. This could be partly linked to the changing regional preferences of buyers, but not to the altering market dynamics. Actually, the average regional value per built unit transaction almost stagnated when compared to the previous year as it slipped by a marginal 0.1% y-o-y to USD 141,556.
Number of Construction Permits and Yearly Growth Rates
12,000
14,000
16,000
-10%
-5%
0%
5%
10%
15%
20%
-15%
10,000
8,000
18,000
20,000
4,000
6,000
2,000
2013
2014
2015
2012
2011
18,347
4.2%
-0.8% -0.4%
-9.4%-8.1%
18,193
16,724 16,66315,092
Annual Report 2015 37
Management Discussion & Analysis 2015
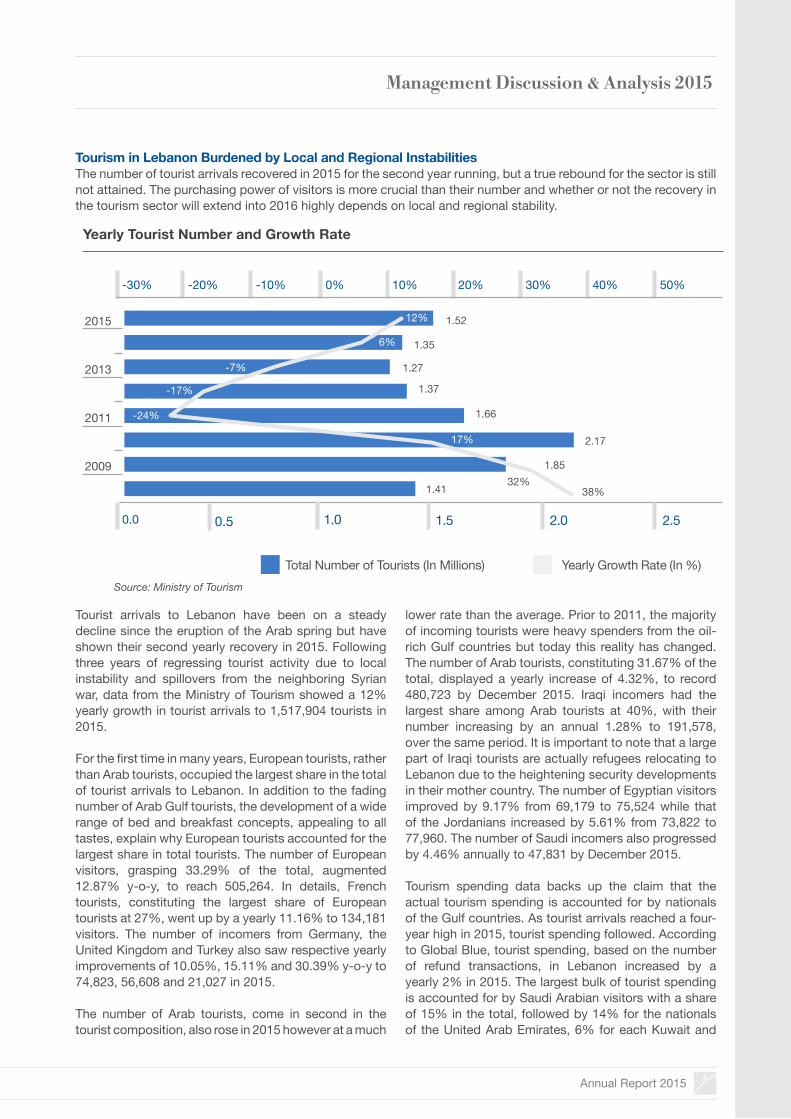
Tourism in Lebanon Burdened by Local and Regional Instabilities The number of tourist arrivals recovered in 2015 for the second year running, but a true rebound for the sector is still not attained. The purchasing power of visitors is more crucial than their number and whether or not the recovery in the tourism sector will extend into 2016 highly depends on local and regional stability.
Tourist arrivals to Lebanon have been on a steady decline since the eruption of the Arab spring but have shown their second yearly recovery in 2015. Following three years of regressing tourist activity due to local instability and spillovers from the neighboring Syrian war, data from the Ministry of Tourism showed a 12% yearly growth in tourist arrivals to 1,517,904 tourists in 2015.
For the first time in many years, European tourists, rather than Arab tourists, occupied the largest share in the total of tourist arrivals to Lebanon. In addition to the fading number of Arab Gulf tourists, the development of a wide range of bed and breakfast concepts, appealing to all tastes, explain why European tourists accounted for the largest share in total tourists. The number of European visitors, grasping 33.29% of the total, augmented 12.87% y-o-y, to reach 505,264. In details, French tourists, constituting the largest share of European tourists at 27%, went up by a yearly 11.16% to 134,181 visitors. The number of incomers from Germany, the United Kingdom and Turkey also saw respective yearly improvements of 10.05%, 15.11% and 30.39% y-o-y to 74,823, 56,608 and 21,027 in 2015.
The number of Arab tourists, come in second in the tourist composition, also rose in 2015 however at a much
lower rate than the average. Prior to 2011, the majority of incoming tourists were heavy spenders from the oil-rich Gulf countries but today this reality has changed. The number of Arab tourists, constituting 31.67% of the total, displayed a yearly increase of 4.32%, to record 480,723 by December 2015. Iraqi incomers had the largest share among Arab tourists at 40%, with their number increasing by an annual 1.28% to 191,578, over the same period. It is important to note that a large part of Iraqi tourists are actually refugees relocating to Lebanon due to the heightening security developments in their mother country. The number of Egyptian visitors improved by 9.17% from 69,179 to 75,524 while that of the Jordanians increased by 5.61% from 73,822 to 77,960. The number of Saudi incomers also progressed by 4.46% annually to 47,831 by December 2015.
Tourism spending data backs up the claim that the actual tourism spending is accounted for by nationals of the Gulf countries. As tourist arrivals reached a four-year high in 2015, tourist spending followed. According to Global Blue, tourist spending, based on the number of refund transactions, in Lebanon increased by a yearly 2% in 2015. The largest bulk of tourist spending is accounted for by Saudi Arabian visitors with a share of 15% in the total, followed by 14% for the nationals of the United Arab Emirates, 6% for each Kuwait and
Yearly Tourist Number and Growth Rate
-30% -20% -10% 0% 10% 20% 30% 40% 50%
12% 1.52
Source: Ministry of Tourism
2011
2013
2015
2009
0.5 1.0 1.5 2.0 2.50.0
1.8532%
38%
1.66-24%
17%
6%
-7%
-17% 1.37
1.27
1.35
Total Number of Tourists (In Millions) Yearly Growth Rate (In %)
1.41
2.17
BLOM BANK s.A.L. 38
Management Discussion & Analysis 2015
Egypt tourists and 4% for Syria. Tourist spending by Saudi Arabian visitors increased by 5% compared to last year while spending by UAE tourists recorded a double-digit growth of 12%. Tourist spending from Jordan, Qatar and the United States rose by a yearly 14%, 21% and 18%, respectively. However, spending from Kuwait, Egypt and Syrian nationals dropped 16%, 4% and 23%, respectively.
In 2015, fashion and clothing was the category that captured most of the tourist spending with a share of 71% in the total followed by 16% for watches and jewelry. Spending on fashion and clothing edged up by a mere 1% while spending on watches and jewelry grew by 15%. The capital Beirut is where 81% of tourist expenditures took place while 12% were disbursed in Mount Lebanon. In Beirut, tourist spending rose by 2% while it decreased by 6% in Mount Lebanon.
According to Ernst and Young’s Middle East Hotel Benchmark Survey, the occupancy rate of Beirut Hotels surpassed the 52% mark it had stabilized on since 2012 but has yet to regain the 64% rate recorded back in 2011. Lebanese 4- and 5- star hotels located in Beirut saw an average occupancy rate of 56% in 2015, up from a 51% recorded in 2014. In fact, occupancy at Beirut hotels regained some vigor in the summer month of August with a rate of 61% also seen in May 2015. The average room rate increased from USD 174 in 2014 to USD 175 in 2015 and the Revenue per Available Room from USD 91 in 2014 to USD 99 in 2015.
The recovery in the number of tourist arrivals is still not enough to spur investment in new tourism projects. According to Kafalat, the number of issued guarantees for the tourism sector dropped from 98 guarantees in
2014 to 75 guarantees in 2015.
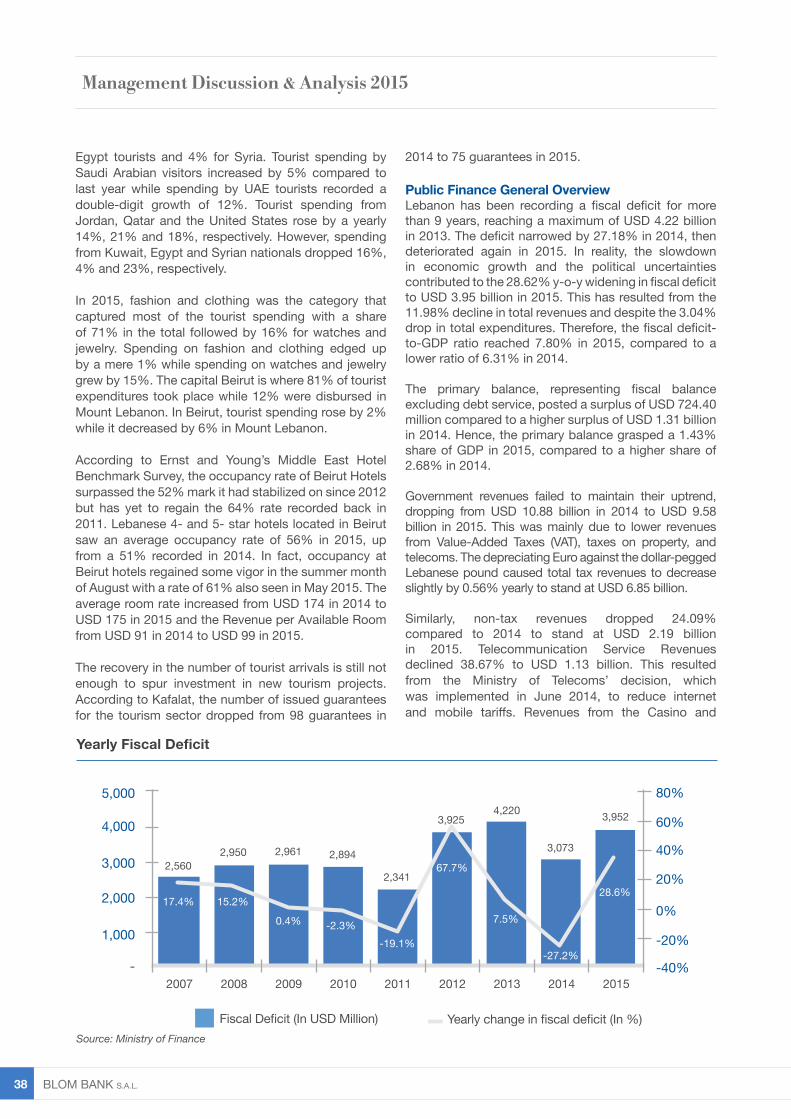
Public Finance General OverviewLebanon has been recording a fiscal deficit for more than 9 years, reaching a maximum of USD 4.22 billion in 2013. The deficit narrowed by 27.18% in 2014, then deteriorated again in 2015. In reality, the slowdown in economic growth and the political uncertainties contributed to the 28.62% y-o-y widening in fiscal deficit to USD 3.95 billion in 2015. This has resulted from the 11.98% decline in total revenues and despite the 3.04% drop in total expenditures. Therefore, the fiscal deficit-to-GDP ratio reached 7.80% in 2015, compared to a lower ratio of 6.31% in 2014.
The primary balance, representing fiscal balance excluding debt service, posted a surplus of USD 724.40 million compared to a higher surplus of USD 1.31 billion in 2014. Hence, the primary balance grasped a 1.43% share of GDP in 2015, compared to a higher share of 2.68% in 2014.
Government revenues failed to maintain their uptrend, dropping from USD 10.88 billion in 2014 to USD 9.58 billion in 2015. This was mainly due to lower revenues from Value-Added Taxes (VAT), taxes on property, and telecoms. The depreciating Euro against the dollar-pegged Lebanese pound caused total tax revenues to decrease slightly by 0.56% yearly to stand at USD 6.85 billion.
Similarly, non-tax revenues dropped 24.09% compared to 2014 to stand at USD 2.19 billion in 2015. Telecommunication Service Revenues declined 38.67% to USD 1.13 billion. This resulted from the Ministry of Telecoms’ decision, which was implemented in June 2014, to reduce internet and mobile tariffs. Revenues from the Casino and
2015201320112009 20142012201020082007
Yearly Fiscal Deficit
Source: Ministry of Finance
1,000
-
2,000
3,000
4,000
5,000
-40%
-20%
0%
20%
40%
60%
80%
Fiscal Deficit (In USD Million) Yearly change in fiscal deficit (In %)
2,5602,950
2%
2,961 2,894
2,341
3,9254,220
3,073
3,952
17.4% 15.2%
0.4% -2.3%-19.1%
67.7%
28.6%
7.5%
-27.2%
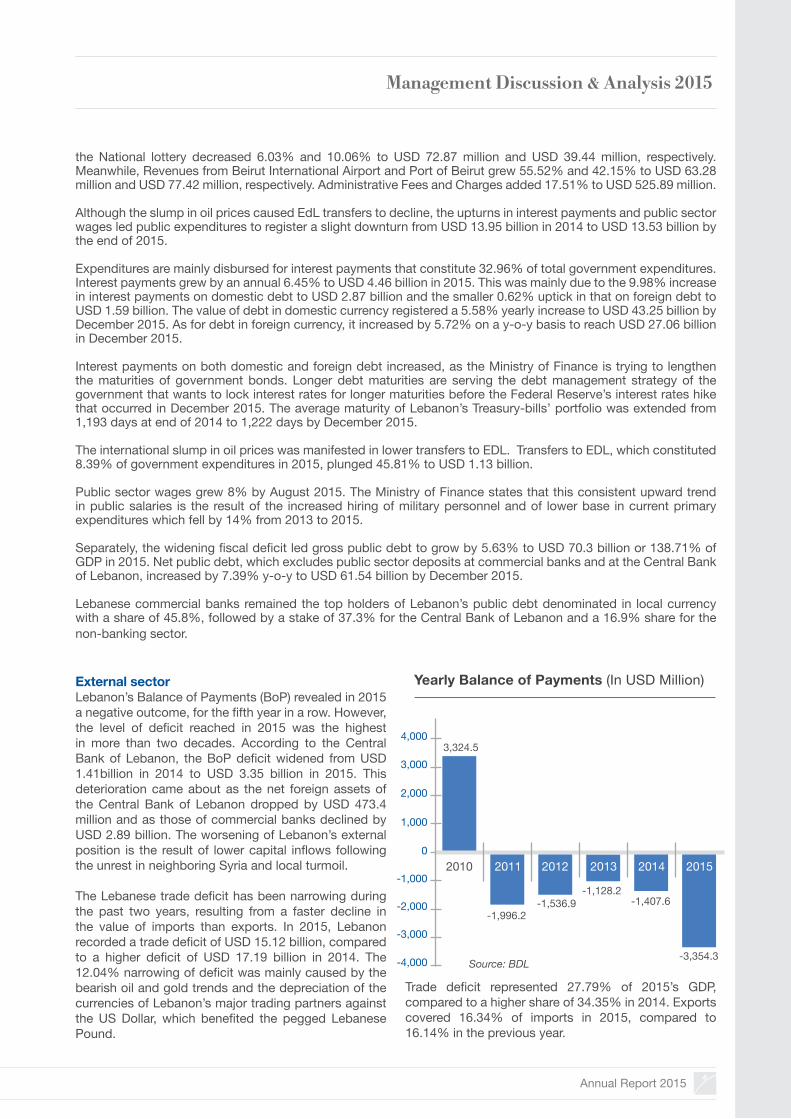
Annual Report 2015 39
Management Discussion & Analysis 2015
the National lottery decreased 6.03% and 10.06% to USD 72.87 million and USD 39.44 million, respectively. Meanwhile, Revenues from Beirut International Airport and Port of Beirut grew 55.52% and 42.15% to USD 63.28 million and USD 77.42 million, respectively. Administrative Fees and Charges added 17.51% to USD 525.89 million.
Although the slump in oil prices caused EdL transfers to decline, the upturns in interest payments and public sector wages led public expenditures to register a slight downturn from USD 13.95 billion in 2014 to USD 13.53 billion by the end of 2015.
Expenditures are mainly disbursed for interest payments that constitute 32.96% of total government expenditures. Interest payments grew by an annual 6.45% to USD 4.46 billion in 2015. This was mainly due to the 9.98% increase in interest payments on domestic debt to USD 2.87 billion and the smaller 0.62% uptick in that on foreign debt to USD 1.59 billion. The value of debt in domestic currency registered a 5.58% yearly increase to USD 43.25 billion by December 2015. As for debt in foreign currency, it increased by 5.72% on a y-o-y basis to reach USD 27.06 billion in December 2015.
Interest payments on both domestic and foreign debt increased, as the Ministry of Finance is trying to lengthen the maturities of government bonds. Longer debt maturities are serving the debt management strategy of the government that wants to lock interest rates for longer maturities before the Federal Reserve’s interest rates hike that occurred in December 2015. The average maturity of Lebanon’s Treasury-bills’ portfolio was extended from 1,193 days at end of 2014 to 1,222 days by December 2015.
The international slump in oil prices was manifested in lower transfers to EDL. Transfers to EDL, which constituted 8.39% of government expenditures in 2015, plunged 45.81% to USD 1.13 billion.
Public sector wages grew 8% by August 2015. The Ministry of Finance states that this consistent upward trend in public salaries is the result of the increased hiring of military personnel and of lower base in current primary expenditures which fell by 14% from 2013 to 2015.
Separately, the widening fiscal deficit led gross public debt to grow by 5.63% to USD 70.3 billion or 138.71% of GDP in 2015. Net public debt, which excludes public sector deposits at commercial banks and at the Central Bank of Lebanon, increased by 7.39% y-o-y to USD 61.54 billion by December 2015.
Lebanese commercial banks remained the top holders of Lebanon’s public debt denominated in local currency with a share of 45.8%, followed by a stake of 37.3% for the Central Bank of Lebanon and a 16.9% share for the non-banking sector.
External sectorLebanon’s Balance of Payments (BoP) revealed in 2015 a negative outcome, for the fifth year in a row. However, the level of deficit reached in 2015 was the highest in more than two decades. According to the Central Bank of Lebanon, the BoP deficit widened from USD 1.41billion in 2014 to USD 3.35 billion in 2015. This deterioration came about as the net foreign assets of the Central Bank of Lebanon dropped by USD 473.4 million and as those of commercial banks declined by USD 2.89 billion. The worsening of Lebanon’s external position is the result of lower capital inflows following the unrest in neighboring Syria and local turmoil.
The Lebanese trade deficit has been narrowing during the past two years, resulting from a faster decline in the value of imports than exports. In 2015, Lebanon recorded a trade deficit of USD 15.12 billion, compared to a higher deficit of USD 17.19 billion in 2014. The 12.04% narrowing of deficit was mainly caused by the bearish oil and gold trends and the depreciation of the currencies of Lebanon’s major trading partners against the US Dollar, which benefited the pegged Lebanese Pound.
Trade deficit represented 27.79% of 2015’s GDP, compared to a higher share of 34.35% in 2014. Exports covered 16.34% of imports in 2015, compared to 16.14% in the previous year.
Source: BDL
0
1,000
-4,000
2,000
-3,000
3,000
-2,000
4,000
-1,000
Yearly Balance of Payments (In USD Million)
2010
3,324.5
-1,996.2-1,536.9
-1,128.2-1,407.6
2011 2013 2014 20152012
-3,354.3
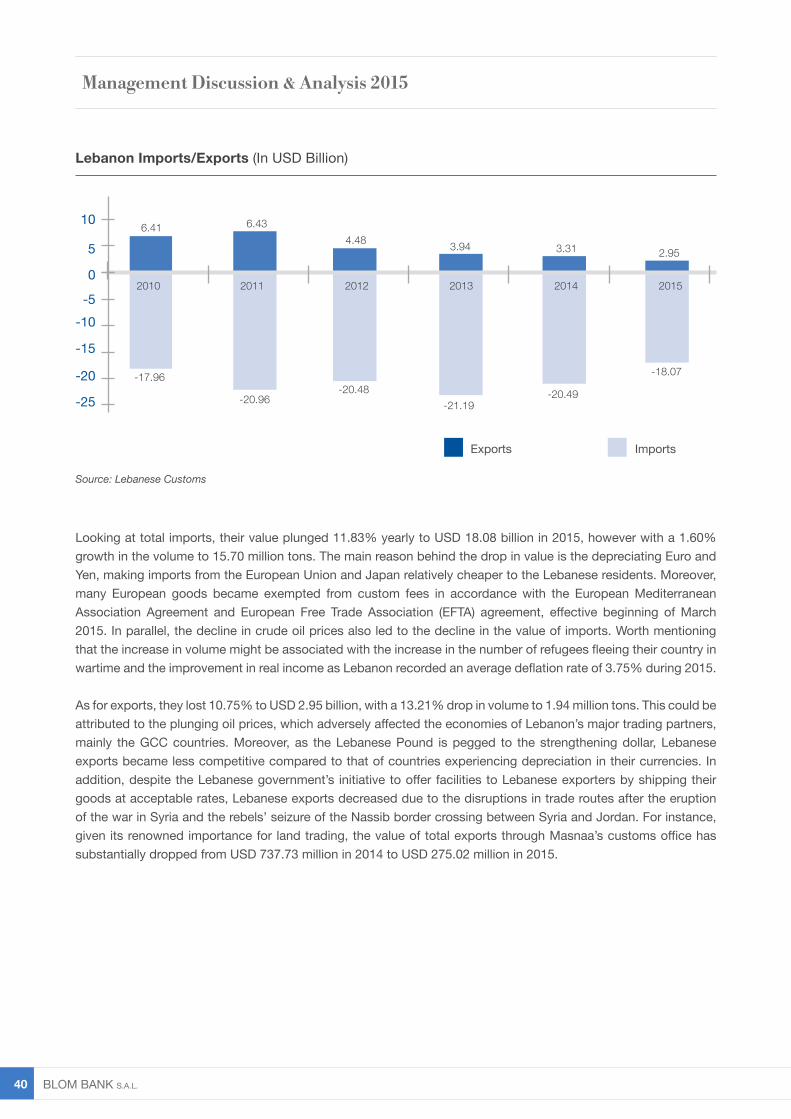
BLOM BANK s.A.L. 40
Management Discussion & Analysis 2015
Looking at total imports, their value plunged 11.83% yearly to USD 18.08 billion in 2015, however with a 1.60% growth in the volume to 15.70 million tons. The main reason behind the drop in value is the depreciating Euro and Yen, making imports from the European Union and Japan relatively cheaper to the Lebanese residents. Moreover, many European goods became exempted from custom fees in accordance with the European Mediterranean Association Agreement and European Free Trade Association (EFTA) agreement, effective beginning of March 2015. In parallel, the decline in crude oil prices also led to the decline in the value of imports. Worth mentioning that the increase in volume might be associated with the increase in the number of refugees fleeing their country in wartime and the improvement in real income as Lebanon recorded an average deflation rate of 3.75% during 2015.
As for exports, they lost 10.75% to USD 2.95 billion, with a 13.21% drop in volume to 1.94 million tons. This could be attributed to the plunging oil prices, which adversely affected the economies of Lebanon’s major trading partners, mainly the GCC countries. Moreover, as the Lebanese Pound is pegged to the strengthening dollar, Lebanese exports became less competitive compared to that of countries experiencing depreciation in their currencies. In addition, despite the Lebanese government’s initiative to offer facilities to Lebanese exporters by shipping their goods at acceptable rates, Lebanese exports decreased due to the disruptions in trade routes after the eruption of the war in Syria and the rebels’ seizure of the Nassib border crossing between Syria and Jordan. For instance, given its renowned importance for land trading, the value of total exports through Masnaa’s customs office has substantially dropped from USD 737.73 million in 2014 to USD 275.02 million in 2015.
Lebanon Imports/Exports (In USD Billion)
Source: Lebanese Customs
-17.96
2010 2011 2012 2013 2014 2015
-18.07
-20.49-21.19
-20.48-20.96
6.41 6.434.48 3.94 3.31 2.95
ImportsExports
-10
-20
-25
-5
-15
0
5
10
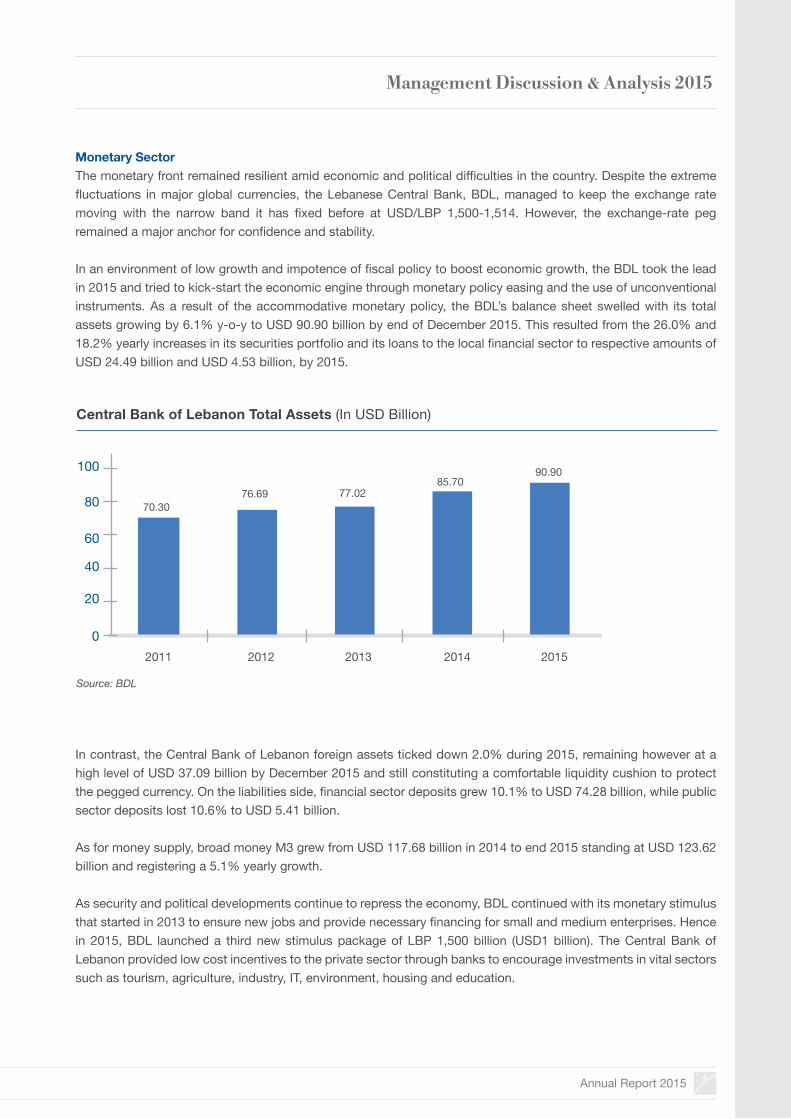
Annual Report 2015 41
Management Discussion & Analysis 2015
Monetary SectorThe monetary front remained resilient amid economic and political difficulties in the country. Despite the extreme fluctuations in major global currencies, the Lebanese Central Bank, BDL, managed to keep the exchange rate moving with the narrow band it has fixed before at USD/LBP 1,500-1,514. However, the exchange-rate peg remained a major anchor for confidence and stability.
In an environment of low growth and impotence of fiscal policy to boost economic growth, the BDL took the lead in 2015 and tried to kick-start the economic engine through monetary policy easing and the use of unconventional instruments. As a result of the accommodative monetary policy, the BDL’s balance sheet swelled with its total assets growing by 6.1% y-o-y to USD 90.90 billion by end of December 2015. This resulted from the 26.0% and 18.2% yearly increases in its securities portfolio and its loans to the local financial sector to respective amounts of USD 24.49 billion and USD 4.53 billion, by 2015.
In contrast, the Central Bank of Lebanon foreign assets ticked down 2.0% during 2015, remaining however at a high level of USD 37.09 billion by December 2015 and still constituting a comfortable liquidity cushion to protect the pegged currency. On the liabilities side, financial sector deposits grew 10.1% to USD 74.28 billion, while public sector deposits lost 10.6% to USD 5.41 billion.
As for money supply, broad money M3 grew from USD 117.68 billion in 2014 to end 2015 standing at USD 123.62 billion and registering a 5.1% yearly growth.
As security and political developments continue to repress the economy, BDL continued with its monetary stimulus that started in 2013 to ensure new jobs and provide necessary financing for small and medium enterprises. Hence in 2015, BDL launched a third new stimulus package of LBP 1,500 billion (USD1 billion). The Central Bank of Lebanon provided low cost incentives to the private sector through banks to encourage investments in vital sectors such as tourism, agriculture, industry, IT, environment, housing and education.
2011 2012 2013 2014 2015
Central Bank of Lebanon Total Assets (In USD Billion)
Source: BDL
70.3076.69 77.02
85.7090.90
20
0
40
60
80
100
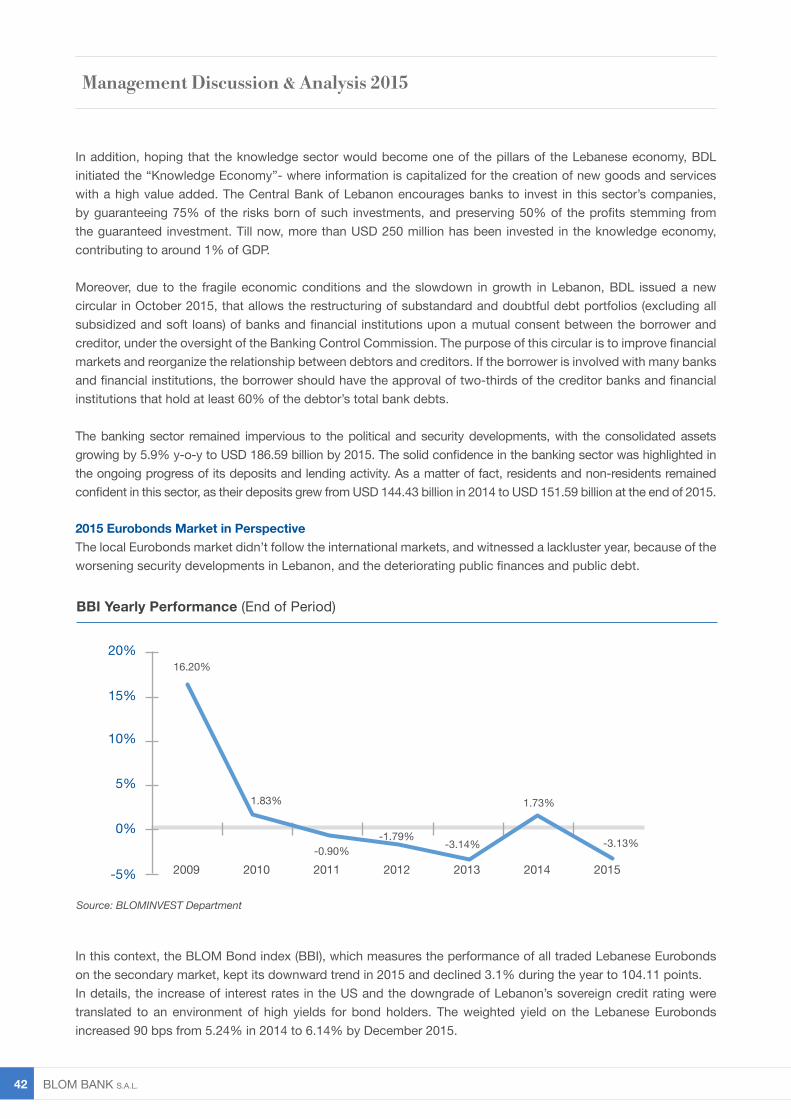
BLOM BANK s.A.L. 42
Management Discussion & Analysis 2015
In this context, the BLOM Bond index (BBI), which measures the performance of all traded Lebanese Eurobonds on the secondary market, kept its downward trend in 2015 and declined 3.1% during the year to 104.11 points.In details, the increase of interest rates in the US and the downgrade of Lebanon’s sovereign credit rating were translated to an environment of high yields for bond holders. The weighted yield on the Lebanese Eurobonds increased 90 bps from 5.24% in 2014 to 6.14% by December 2015.
2015 Eurobonds Market in PerspectiveThe local Eurobonds market didn’t follow the international markets, and witnessed a lackluster year, because of the worsening security developments in Lebanon, and the deteriorating public finances and public debt.
5%
-5%
10%
0%
15%
20%
In addition, hoping that the knowledge sector would become one of the pillars of the Lebanese economy, BDL initiated the “Knowledge Economy”- where information is capitalized for the creation of new goods and services with a high value added. The Central Bank of Lebanon encourages banks to invest in this sector’s companies, by guaranteeing 75% of the risks born of such investments, and preserving 50% of the profits stemming from the guaranteed investment. Till now, more than USD 250 million has been invested in the knowledge economy, contributing to around 1% of GDP.
Moreover, due to the fragile economic conditions and the slowdown in growth in Lebanon, BDL issued a new circular in October 2015, that allows the restructuring of substandard and doubtful debt portfolios (excluding all subsidized and soft loans) of banks and financial institutions upon a mutual consent between the borrower and creditor, under the oversight of the Banking Control Commission. The purpose of this circular is to improve financial markets and reorganize the relationship between debtors and creditors. If the borrower is involved with many banks and financial institutions, the borrower should have the approval of two-thirds of the creditor banks and financial institutions that hold at least 60% of the debtor’s total bank debts.
The banking sector remained impervious to the political and security developments, with the consolidated assets growing by 5.9% y-o-y to USD 186.59 billion by 2015. The solid confidence in the banking sector was highlighted in the ongoing progress of its deposits and lending activity. As a matter of fact, residents and non-residents remained confident in this sector, as their deposits grew from USD 144.43 billion in 2014 to USD 151.59 billion at the end of 2015.
2015201320112009 201420122010
BBI Yearly Performance (End of Period)
Source: BLOMINVEST Department
16.20%
1.83%
-0.90% -3.14%
1.73%
-1.79% -3.13%

Annual Report 2015 43
Management Discussion & Analysis 2015
Performance of the BLOM Stock Index in 2015
1,1001,1201,1401,1601,1801,2001,2201,240
The Lebanese Stock MarketIn 2015, the Lebanese Bourse reflected the setbacks the country went through on the political, economic and security fronts. The BLOM Stock Index (BSI), tracking the performance of the Beirut Stock Exchange, ended the year at 1,170.26 points, a mere 0.06% decline from its value a year ago. The BSI’s monthly movements were negative for 7 out of 12 months and the index’s upturns were either too dismal or were the result of short-lived positive sentiment amongst investors. The volume and value of traded shares dropped from 93.92 million shares worth USD 576.26 million in 2014 to 55.22 million shares worth USD 496.85 million in 2015. As for the market capitalization, it narrowed by USD 61.85 million to USD 9.72 million, end of 2015.
We also witnessed a flattening of the yield curve for longer maturities. Looking at the 5Y and 10Y yields, they surged by 80 bps and 51 bps to 6.10% and 6.67%, respectively.
The notion of confidence and resilience in the Lebanese Eurobonds market was shaken during the year and was aggravated at the beginning of 2016 due to political and economic developments including the downgrade of the outlook in September 2015. This was reflected by the widening 5 Year Credit Default Swaps (CDS) quotes from 379 bps at the end of 2014 to 426 bps at the end of 2015. Moreover, the spread between the 5Y yield on the Lebanese Eurobonds and their US comparable broadened from 362 bps at end 2014 to 430 bps by end 2015 and 503 bps at end of February 2016.
Nevertheless, in 2015 the Lebanese government allotted 2 Eurobond issuances worth USD 3.8 billion: an issuance of USD 2.2 billion in February that was extremely successful and largely oversubscribed, and another one for USD 1.6 billion in November that was not very well received by investors. Still, the government managed to extend the portfolio’s duration from 4.07 years in 2014 to 5.19 in 2015.
Source: BLOMINVEST Department
Jan 15 Feb 15 Mar 15 Apr 15 May 15 Jun 15 Jul 15 Aug 15 Sep 15 Oct 15 Nov 15 Dec 15
BLOM BANK s.A.L. 44
Management Discussion & Analysis 2015
Despite a tumultuous start of the year, the BSI managed to register monthly upturns in the first quarter. The security scene was quite shaken in the month of January by a suicide bombing in Tripoli which was adopted by the Nusra Front, by tension between Hezbollah and Israel in the Golan Heights and by the killing of a Lebanese soldier held captive by the Nusra Front. However, the 0.06% monthly increase registered by the Lebanese gauge may well be due to what is dubbed “The January Effect”: an increase in stock prices that follows a usual sell-off that takes place at the end of the year. Indeed, the BSI lost a monthly 1% at the end of the year 2014. The relative security stability that followed in the months of February and March allowed the BSI to further January’s gains and to rise by 3.63% in February and by 1.04% in March.
Market sentiment and the overall situation soured for seven consecutive months from April to October. The market was in constant anticipation for positive developments on the political front. However, these anticipations were not realized and politicians failed to elect a new President and pass important laws for an extended period of time.
The garbage crisis did nothing to alleviate the pressures stemming from the local political deadlock. In July, the garbage started piling up on the streets and social outcry erupted as a result of this sanitary crisis. The dampened mood was mirrored by the Lebanese Bourse where the BSI registered its largest monthly loss of the year of 2.36% in August.
It wasn’t until the month of November that the BSI recorded a monthly gain on account of positive political developments. During the month of November, the political scene saw the meeting of Frangieh and Hariri over a potential presidential settlement. The large support Frangieh received from rival political factions inspired hope that the Presidential vacancy would come to an end. However, this issue remains pending at the time of writing.
The month of December held good news for investors on the political front and in regards to the garbage crisis which allowed the BSI to register a minor monthly upturn of 0.17% to reach 1,169.52 points. On the 14th of December, after long protests and negotiations, 16 kidnapped Lebanese soldiers were released by the Nusra Front as part of an exchange deal and on the 21st of December the government agreed to exporting garbage, a closure to this issue that remains however widely disputed and criticized by those who claim that the cost of this solution is too high.
At the end of 2015, the Lebanese Bourse counted 29 listed stocks, a number unchanged from 2014. However, there were activities of listing and de-listing conducted by Lebanese commercial banks. The Beirut Stock Exchange decided to De-list the 1,500,000 Preferred Shares Class “E” of Bank Audi SAL from the official market of the stock exchange and to take note of the Bank’s capital increase from LBP/667,836,186,600/ to LBP/668,194,681,824/; thus the distribution of the Bank’s capital becomes as follows:
• Common shares /399,749,204/ with a nominal value of LBP/1,656/ per share • Preferred shares Class F /1,500,000/ with a nominal value of LBP/1,656/ per share• Preferred shares Class G /1,500,000/ with a nominal value of LBP/1,656/ per share • Preferred shares Class H /750,000/ with a nominal value of LBP/1,656/ per share.
Annual Report 2015 45
Management Discussion & Analysis 2015
The Beirut Stock Exchange also decided to accept the listing, trading and pricing of the 3,000,000 Non-Cumulative, Perpetual, Redeemable Preferred Shares Class (J), issued by Bank of Beirut SAL. The newly listed preferred stocks started trading on February 11th 2015.
The Lebanese bourse also approved the increase in the number of listed Global Depositary Receipts related to Bank Audi. 722,264 additional Audi GDR shares were listed as of February 11th making the total number of Audi GDRs listed on the Lebanese stock market 116,238,117.
On the last working day of 2015, the Beirut Stock Exchange announced the cancellation of Bank of Beirut’s preferred E shares. Since this de-listing was decided in 2015 but only went into effect on the first day of 2016, it was not reflected in the total number of stocks. Amongst the listed stocks the top performers were BLOM BANK’s listed shares, Ciments Blancs’ Bearer and Nominal shares and Bank BEMO’s listed shares. BLOM BANK’s listed shares added a yearly 6.8% to USD 9.40. BLOM BANK’s net profit for the first three quarters of the year increased to USD 290 million, up by 7.59% from the same period in 2014 and the bank’s Return on Average Equity was robust at 15.2%. BEMO’s listed shares gained 8.6% to USD 1.90 with the bank also posting robust results up to September as net profit surged by a yearly 15.4% to USD 10.32 million. Ciments Blancs’ Bearer and Nominal shares grew by 4% and 12.7% to USD 3.90 and USD 3.10, respectively.
In the real estate sector, Solidere shares were negatively impacted by the political deadlock in the country. Solidere A and B shares ended the year at the respective prices of USD 11.06 and USD 11.07 which were 2.3% and 2.4% lower than last year’s close. 2015 marked Solidere’s first dividend distribution in three years. The company announced the distribution of cash-dividends and stock-dividends, which, combined, are equivalent to a distribution of USD 0.33/share.
The worst performers were Bank Audi’s GDR shares, BLC’s preferred A shares and HOLCIM’s listed shares. The GDRs of Bank Audi lost 9% to end the year at USD 6, BLC’s preferred A shares shed 2.9% to USD 100 while HOLCIM’s listed shares declined by a yearly 4.8% to settle at the price of USD 14.52.
BLOM BANK s.A.L. 46
In 2015, BLOM BANK witnessed another successful year marked by a solid financial position, a more diversified menu of products and services, and a wider regional presence.
BLOM BANK’s strong position as the leading banking group in Lebanon was reflected by maintaining its status as the most awarded bank for awards received in 2015 and 2016:
2. Overview
BLOM BANK also continued to maintain the highest financial ratings in Lebanon. As such, the Bank has been repeatedly rated by Capital Intelligence, a Middle East-specialized rating agency, at “B”, which is the highest financial strength rating in Lebanon. Moreover, Moody’s maintained its foreign currency rating of “B2”, and S&P of “B-”.
In 2015, as one of the largest and most profitable banks in the country, BLOM BANK’s net profit reached USD 404.26 million after accounting for provisions amounting to USD 16.80 million, while total assets attained USD 29.10 million and total customers’ deposits attained USD 25.09 million as at 2015.
In terms of strategy, BLOM BANK continued to build on its geographic expansion and business services diversification. Foreign expansion not only spreads the risk of operating in Lebanon, but also diversifies the income base by taking advantage of the economic and business opportunities present in regional economies. In 2015, BLOM BANK was present in 13 countries: Lebanon, Syria, Egypt, Jordan, Qatar, UAE, Iraq, France, Switzerland, England, Cyprus, Kingdom of Saudi Arabia and Romania. In addition, the Bank has developed further its branch network by opening one new branch in Lebanon, namely in Bechara El Khoury, and established one new electronic branch in UAE located in Deira and one new branch in Egypt.
Euromoney• Best Bank in Lebanon for 2016
Global Finance• Best Treasury & Cash Management Provider in
Lebanon 2016• Best Foreign Exchange Bank Providers in
Lebanon for 2015• Best Consumer Internet Bank in Lebanon for
2015• Best Islamic Financial Institution Lebanon for
2015 (BLOM Development BANK)
Banker Middle East• Best Bank in Lebanon for 2016
The Asian Banker• Best Retail Bank for 2016• Best Managed Bank for 2016
EMEA Finance• Best Bank in Lebanon for 2015• Best Asset Manager in Lebanon for 2015
(BLOMINVEST BANK)• Best Investment Bank in Lebanon for 2015
GTR magazine• Best Trade Finance Bank in Lebanon for 2015
MENA Fund Manager• Best Levant Asset Manager for 2016
(BLOMINVEST BANK)
Global Investor / ISF Euromoney• Best Asset Manager for 2015 (BLOMINVEST BANK)
The European• Bank of the year 2016 MENA• Bank of the year Lebanon 2016
Management Discussion & Analysis 2015
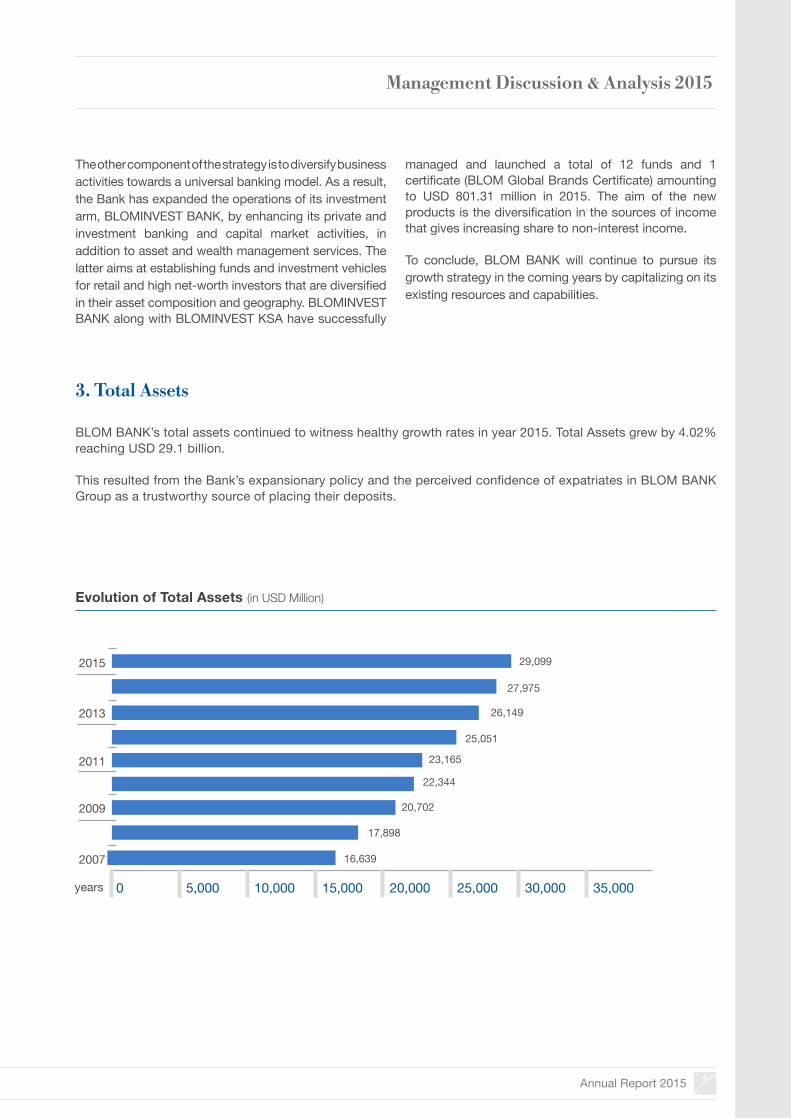
Annual Report 2015 47
BLOM BANK’s total assets continued to witness healthy growth rates in year 2015. Total Assets grew by 4.02% reaching USD 29.1 billion.
This resulted from the Bank’s expansionary policy and the perceived confidence of expatriates in BLOM BANK Group as a trustworthy source of placing their deposits.
3. Total Assets
Evolution of Total Assets (in USD Million)
2013
2015
2011
2009
2007
years 5,000 10,000 15,000 20,000 25,000 30,000 35,0000
16,639
20,702
22,344
25,051
27,975
29,099
26,149
23,165
17,898
The other component of the strategy is to diversify business activities towards a universal banking model. As a result, the Bank has expanded the operations of its investment arm, BLOMINVEST BANK, by enhancing its private and investment banking and capital market activities, in addition to asset and wealth management services. The latter aims at establishing funds and investment vehicles for retail and high net-worth investors that are diversified in their asset composition and geography. BLOMINVEST BANK along with BLOMINVEST KSA have successfully
managed and launched a total of 12 funds and 1 certificate (BLOM Global Brands Certificate) amounting to USD 801.31 million in 2015. The aim of the new products is the diversification in the sources of income that gives increasing share to non-interest income.
To conclude, BLOM BANK will continue to pursue its growth strategy in the coming years by capitalizing on its existing resources and capabilities.
Management Discussion & Analysis 2015
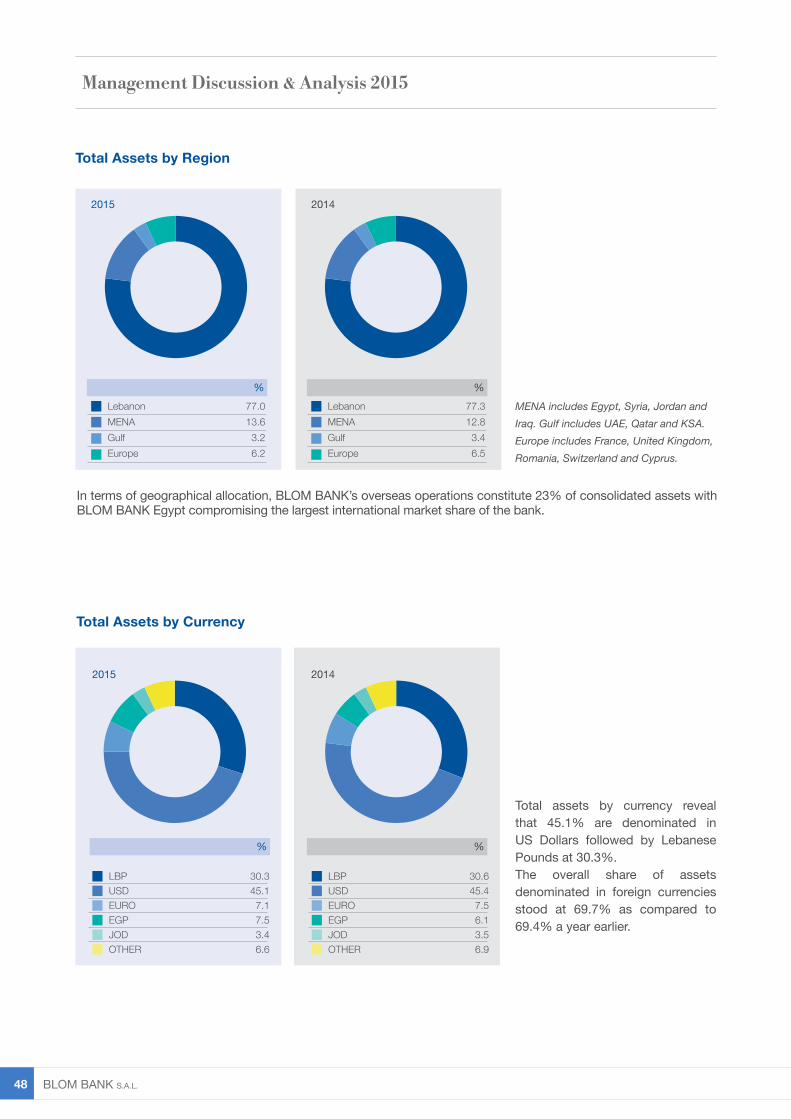
BLOM BANK s.A.L. 48
Total Assets by Region
Total Assets by Currency
Total assets by currency reveal that 45.1% are denominated in US Dollars followed by Lebanese Pounds at 30.3%.The overall share of assets denominated in foreign currencies stood at 69.7% as compared to 69.4% a year earlier.
MENA includes Egypt, Syria, Jordan and Iraq. Gulf includes UAE, Qatar and KSA. Europe includes France, United Kingdom, Romania, Switzerland and Cyprus.
In terms of geographical allocation, BLOM BANK’s overseas operations constitute 23% of consolidated assets with BLOM BANK Egypt compromising the largest international market share of the bank.
%
2015
LebanonMENAGulfEurope
77.013.63.26.2
77+13+3+7G%
2014
LebanonMENAGulfEurope
77.312.8
3.46.5
77+13+3+7G
LBPUSDEUROEGPJOD OTHER
20142015
30.345.17.17.53.46.6
30+45+7+8+3+7G 31+46+7+6+3+7GLBPUSDEUROEGPJOD OTHER
30.645.4
7.56.13.56.9
Management Discussion & Analysis 2015
%%
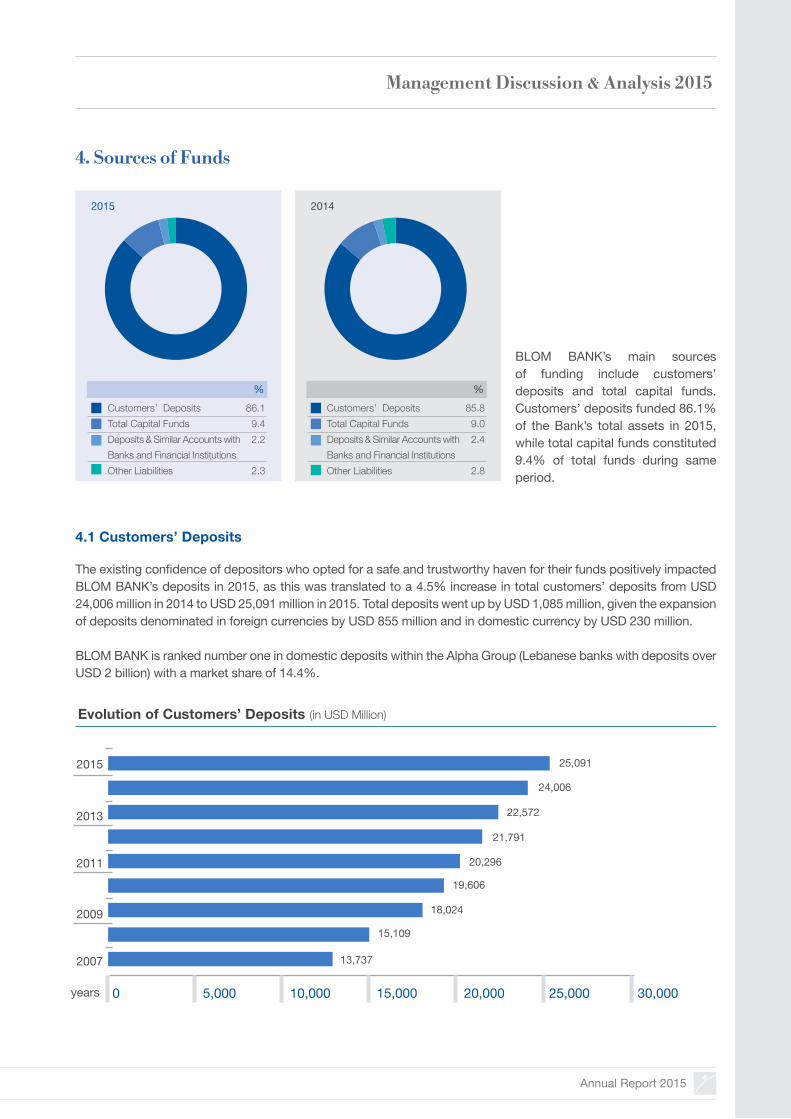
Annual Report 2015 49
4. Sources of Funds
BLOM BANK’s main sources of funding include customers’ deposits and total capital funds. Customers’ deposits funded 86.1% of the Bank’s total assets in 2015, while total capital funds constituted 9.4% of total funds during same period.
4.1 Customers’ Deposits
The existing confidence of depositors who opted for a safe and trustworthy haven for their funds positively impacted BLOM BANK’s deposits in 2015, as this was translated to a 4.5% increase in total customers’ deposits from USD 24,006 million in 2014 to USD 25,091 million in 2015. Total deposits went up by USD 1,085 million, given the expansion of deposits denominated in foreign currencies by USD 855 million and in domestic currency by USD 230 million.
BLOM BANK is ranked number one in domestic deposits within the Alpha Group (Lebanese banks with deposits over USD 2 billion) with a market share of 14.4%.
Evolution of Customers’ Deposits (in USD Million)
2007
2009
2011
2013
2015
years 25,000 30,0005,000 10,000 15,000 20,0000
15,109
18,024
20,296
21,791
24,006
22,572
25,091
19,606
13,737
%
2015
87+9+2+2GCustomers’ DepositsTotal Capital FundsDeposits & Similar Accounts with Banks and Financial InstitutionsOther Liabilities
86.19.42.2
2.3
%
2014
86+9+2+3G85.8
9.02.4
2.8
Customers’ DepositsTotal Capital FundsDeposits & Similar Accounts with Banks and Financial InstitutionsOther Liabilities
Management Discussion & Analysis 2015
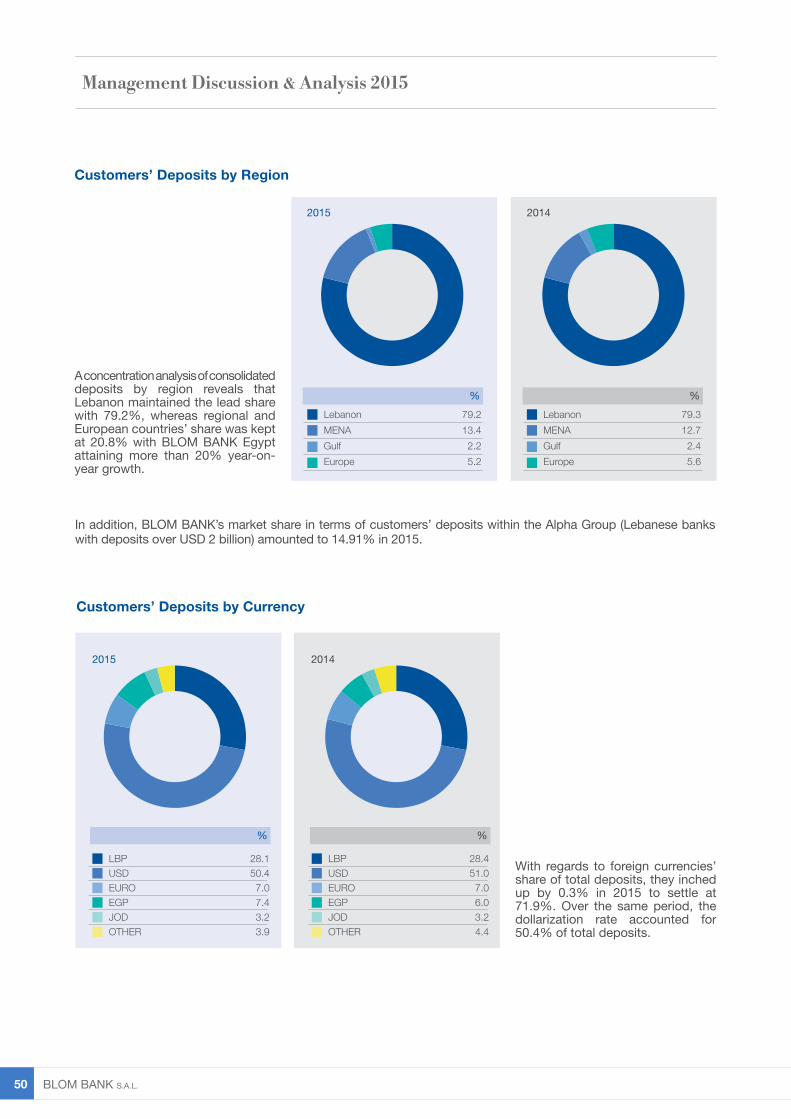
BLOM BANK s.A.L. 50
Customers’ Deposits by Currency
With regards to foreign currencies’ share of total deposits, they inched up by 0.3% in 2015 to settle at 71.9%. Over the same period, the dollarization rate accounted for 50.4% of total deposits.
LBPUSDEUROEGPJOD OTHER
20142015
28.150.47.07.43.23.9
28+50+7+8+3+4G 28+51+7+6+3+5GLBPUSDEUROEGPJOD OTHER
28.451.0
7.06.03.24.4
Customers’ Deposits by Region
A concentration analysis of consolidated deposits by region reveals that Lebanon maintained the lead share with 79.2%, whereas regional and European countries’ share was kept at 20.8% with BLOM BANK Egypt attaining more than 20% year-on- year growth.
In addition, BLOM BANK’s market share in terms of customers’ deposits within the Alpha Group (Lebanese banks with deposits over USD 2 billion) amounted to 14.91% in 2015.
% %
%%
LebanonMENAGulfEurope
79.312.72.45.6
2015 2014
79+15+1+5GLebanonMENAGulfEurope
79.213.4
2.25.2
79+13+2+6GManagement Discussion & Analysis 2015

Annual Report 2015 51
A concentration analysis of consolidated deposits by type of client reveals that “Individual” and “Corporate” deposits maintained the same shares for years 2015 and 2014 at 83.0% and 17.0% respectively.
4.2 Capitalization (Tier I & Tier II Capital)
Total capital funds increased by 7.9% year-on-year to USD 2,722 million at the end of 2015, keeping its contribution of total funds at 9.4% in 2015.
In line with the Bank’s strategy of growing organically at a steady pace, the increase in capital was attributed to retained profits of the year 2014 amounting to USD 222.8 million after dividend distribution.
A detailed analysis of the Bank’s regulatory capital is presented in the Risk Management section of the MD&A.
years
2,000
2,500
3,000
1,500
1,000
500
0
Tier I & Tier II Capital (in USD Million)
Customers’ Deposits by Type of Client
Tier 1 Tier II
%CorporateIndividualsHigh Net Worth Individuals
17.0 47.535.5
%CorporateIndividualsHigh Net Worth Individuals
17.0 47.735.3
2015 2014
16+50+34G17+47+36G
1,459
1,7081,891
1,9832,182
2,349
2,523
2,722
1,388
2013
2015
2011
2009
2007
Management Discussion & Analysis 2015
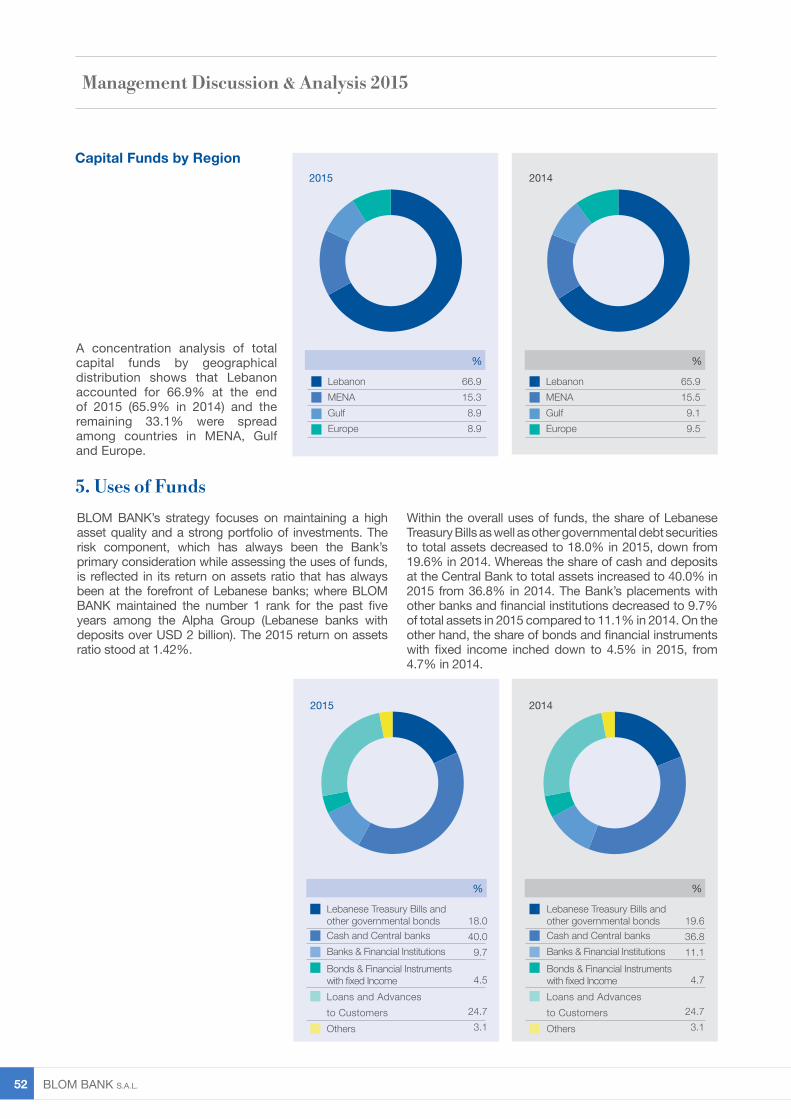
BLOM BANK s.A.L. 52
A concentration analysis of total capital funds by geographical distribution shows that Lebanon accounted for 66.9% at the end of 2015 (65.9% in 2014) and the remaining 33.1% were spread among countries in MENA, Gulf and Europe.
%
LebanonMENAGulfEurope
65.915.59.19.5
%%
Lebanese Treasury Bills and other governmental bondsCash and Central banksBanks & Financial InstitutionsBonds & Financial Instruments with fixed IncomeLoans and Advances to CustomersOthers
19.636.811.1
4.7
24.73.1
%
LebanonMENAGulfEurope
66.915.3
8.98.9
5. Uses of Funds
Capital Funds by Region20142015
20142015
18.040.0
9.7
4.5
24.73.1
67+15+9+9+G
18+40+10+4+25+3G
66+15+9+10+GBLOM BANK’s strategy focuses on maintaining a high asset quality and a strong portfolio of investments. The risk component, which has always been the Bank’s primary consideration while assessing the uses of funds, is reflected in its return on assets ratio that has always been at the forefront of Lebanese banks; where BLOM BANK maintained the number 1 rank for the past five years among the Alpha Group (Lebanese banks with deposits over USD 2 billion). The 2015 return on assets ratio stood at 1.42%.
Within the overall uses of funds, the share of Lebanese Treasury Bills as well as other governmental debt securities to total assets decreased to 18.0% in 2015, down from 19.6% in 2014. Whereas the share of cash and deposits at the Central Bank to total assets increased to 40.0% in 2015 from 36.8% in 2014. The Bank’s placements with other banks and financial institutions decreased to 9.7% of total assets in 2015 compared to 11.1% in 2014. On the other hand, the share of bonds and financial instruments with fixed income inched down to 4.5% in 2015, from 4.7% in 2014.
19+37+11+5+25+3G
Management Discussion & Analysis 2015
Lebanese Treasury Bills and other governmental bondsCash and Central banksBanks & Financial InstitutionsBonds & Financial Instruments with fixed IncomeLoans and Advances to CustomersOthers
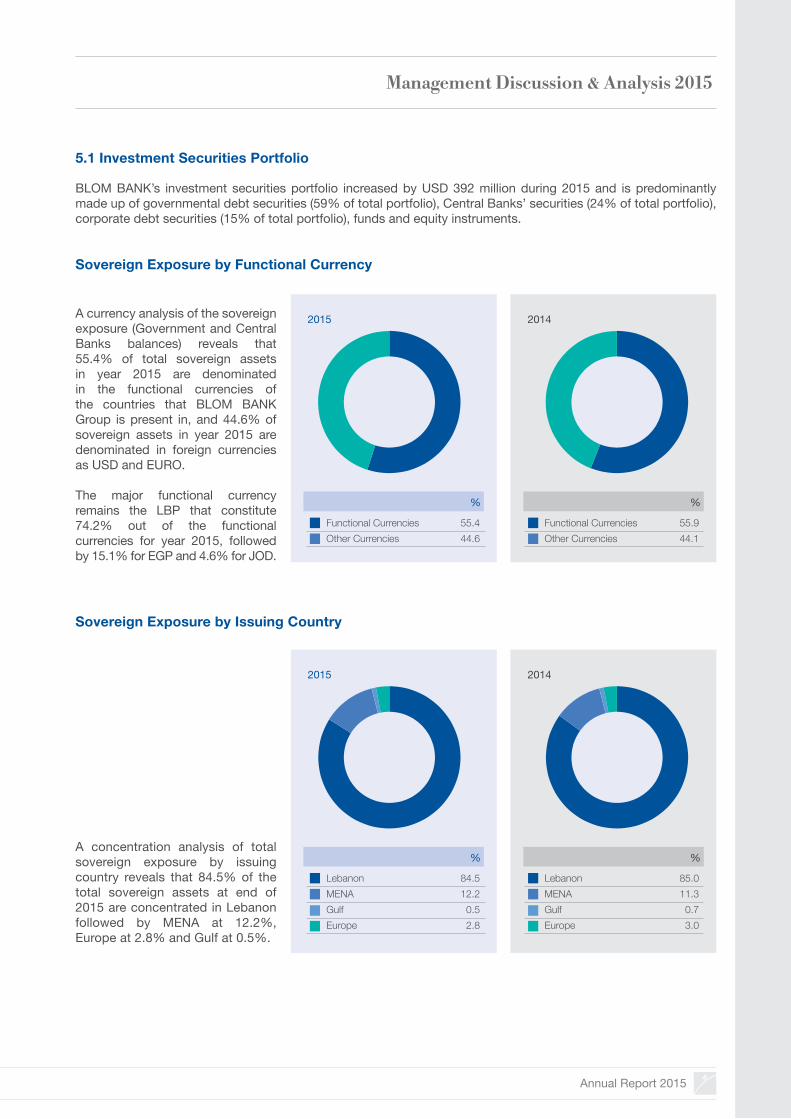
Annual Report 2015 53
5.1 Investment Securities Portfolio
BLOM BANK’s investment securities portfolio increased by USD 392 million during 2015 and is predominantly made up of governmental debt securities (59% of total portfolio), Central Banks’ securities (24% of total portfolio), corporate debt securities (15% of total portfolio), funds and equity instruments.
Sovereign Exposure by Functional Currency
Sovereign Exposure by Issuing Country
A currency analysis of the sovereign exposure (Government and Central Banks balances) reveals that 55.4% of total sovereign assets in year 2015 are denominated in the functional currencies of the countries that BLOM BANK Group is present in, and 44.6% of sovereign assets in year 2015 are denominated in foreign currencies as USD and EURO.
The major functional currency remains the LBP that constitute 74.2% out of the functional currencies for year 2015, followed by 15.1% for EGP and 4.6% for JOD.
A concentration analysis of total sovereign exposure by issuing country reveals that 84.5% of the total sovereign assets at end of 2015 are concentrated in Lebanon followed by MENA at 12.2%, Europe at 2.8% and Gulf at 0.5%.
%
Functional CurrenciesOther Currencies
55.944.1
%
Functional CurrenciesOther Currencies
55.444.6
20142015
55+45G 56+44+G
%
LebanonMENAGulfEurope
85.011.30.73.0
%
LebanonMENAGulfEurope
84.512.2
0.52.8
20142015
84+12+1+3+G 85+11+1+3+G
Management Discussion & Analysis 2015
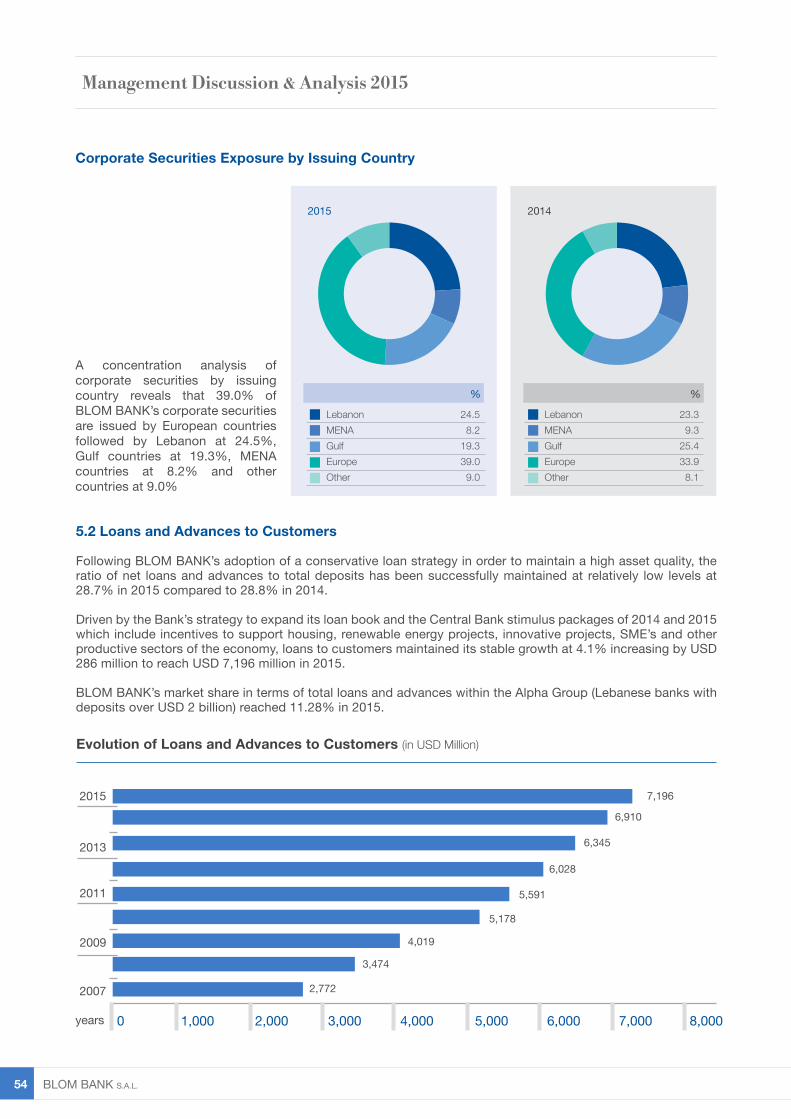
BLOM BANK s.A.L. 54
5.2 Loans and Advances to Customers
Following BLOM BANK’s adoption of a conservative loan strategy in order to maintain a high asset quality, the ratio of net loans and advances to total deposits has been successfully maintained at relatively low levels at 28.7% in 2015 compared to 28.8% in 2014.
Driven by the Bank’s strategy to expand its loan book and the Central Bank stimulus packages of 2014 and 2015which include incentives to support housing, renewable energy projects, innovative projects, SME’s and other productive sectors of the economy, loans to customers maintained its stable growth at 4.1% increasing by USD 286 million to reach USD 7,196 million in 2015.
BLOM BANK’s market share in terms of total loans and advances within the Alpha Group (Lebanese banks with deposits over USD 2 billion) reached 11.28% in 2015.
Evolution of Loans and Advances to Customers (in USD Million)
2007
2009
2011
2013
2015
years 6,000 7,000 8,0004,000 5,0003,0002,0001,0000
2,772
3,474
5,178
5,591
6,028
6,345
6,910
7,196
4,019
Corporate Securities Exposure by Issuing Country
A concentration analysis of corporate securities by issuing country reveals that 39.0% of BLOM BANK’s corporate securities are issued by European countries followed by Lebanon at 24.5%, Gulf countries at 19.3%, MENA countries at 8.2% and other countries at 9.0%
%
LebanonMENAGulfEuropeOther
23.39.3
25.433.9
8.1
%
LebanonMENAGulfEuropeOther
24.58.2
19.339.0
9.0
20142015
24+8+19+39+10G 23+9+26+34+8GManagement Discussion & Analysis 2015
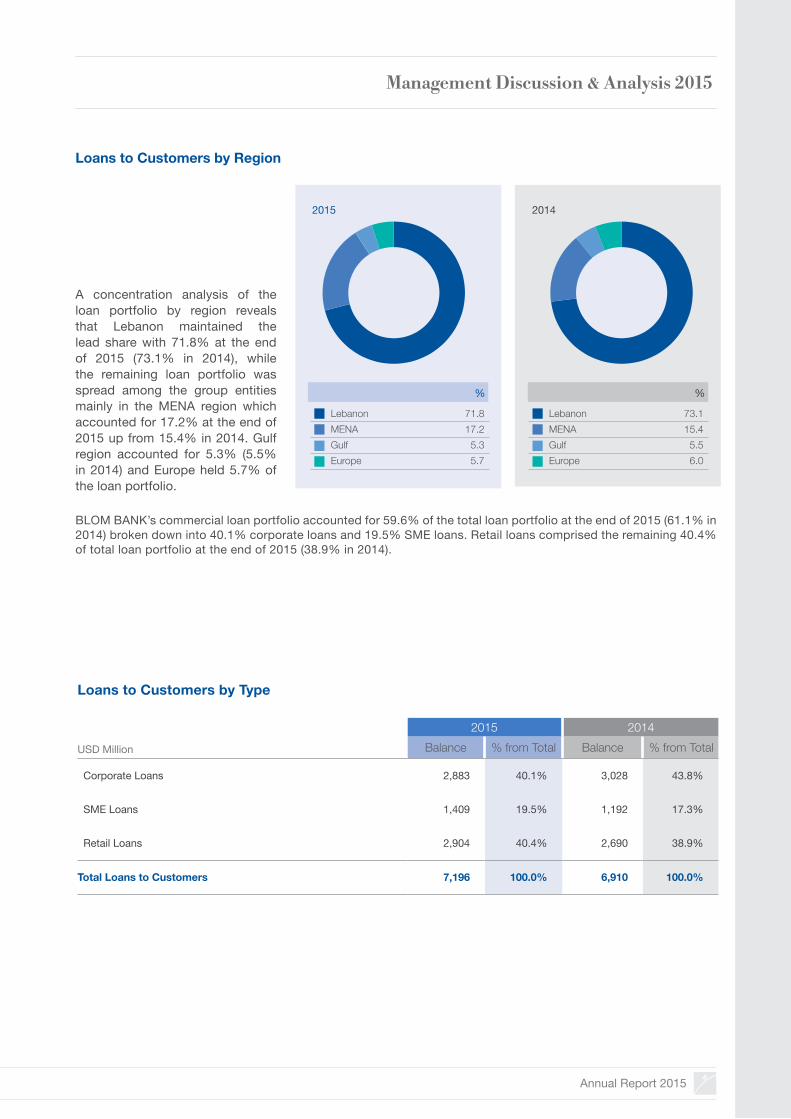
Annual Report 2015 55
2015 2014
USD Million Balance % from Total Balance % from Total
Corporate Loans 2,883 40.1% 3,028 43.8%
SME Loans 1,409 19.5% 1,192 17.3%
Retail Loans 2,904 40.4% 2,690 38.9%
Total Loans to Customers 7,196 100.0% 6,910 100.0%
Loans to Customers by Type
BLOM BANK’s commercial loan portfolio accounted for 59.6% of the total loan portfolio at the end of 2015 (61.1% in 2014) broken down into 40.1% corporate loans and 19.5% SME loans. Retail loans comprised the remaining 40.4% of total loan portfolio at the end of 2015 (38.9% in 2014).
Loans to Customers by Region
%
LebanonMENAGulfEurope
73.115.45.56.0
%
LebanonMENAGulfEurope
71.817.2
5.35.7
20142015
71+20+4+5+GA concentration analysis of the loan portfolio by region reveals that Lebanon maintained the lead share with 71.8% at the end of 2015 (73.1% in 2014), while the remaining loan portfolio was spread among the group entities mainly in the MENA region which accounted for 17.2% at the end of 2015 up from 15.4% in 2014. Gulf region accounted for 5.3% (5.5% in 2014) and Europe held 5.7% of the loan portfolio.
73+16+5+6+GManagement Discussion & Analysis 2015
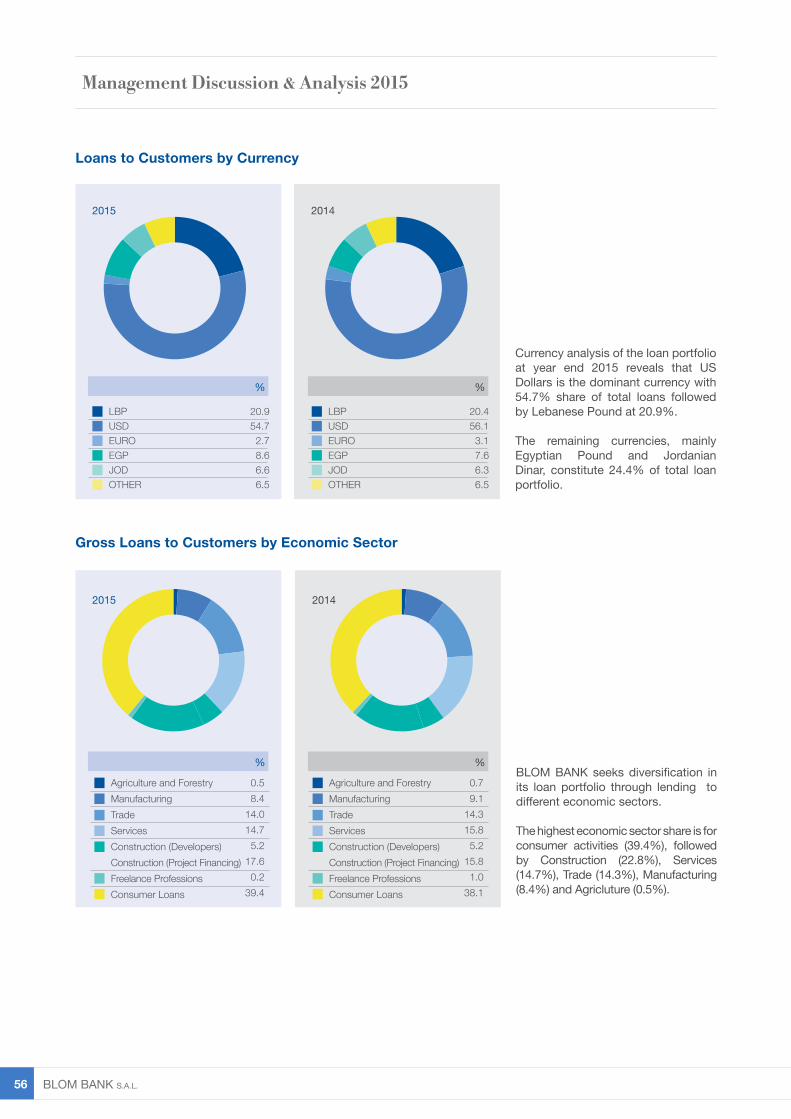
BLOM BANK s.A.L. 56
BLOM BANK seeks diversification in its loan portfolio through lending to different economic sectors.
The highest economic sector share is for consumer activities (39.4%), followed by Construction (22.8%), Services (14.7%), Trade (14.3%), Manufacturing (8.4%) and Agricluture (0.5%).
Gross Loans to Customers by Economic Sector
%
Agriculture and ForestryManufacturingTradeServicesConstruction (Developers)Construction (Project Financing)Freelance ProfessionsConsumer Loans
0.79.1
14.315.8
5.215.8 1.0 38.1
%
Agriculture and ForestryManufacturingTradeServicesConstruction (Developers)Construction (Project Financing)Freelance ProfessionsConsumer Loans
0.58.4
14.014.75.2
17.6 0.2
39.4
20142015
1+8+14+15+5+17+1+39G 1+9+14+16+5+16+1+38G
Loans to Customers by Currency
Currency analysis of the loan portfolio at year end 2015 reveals that US Dollars is the dominant currency with 54.7% share of total loans followed by Lebanese Pound at 20.9%.
The remaining currencies, mainly Egyptian Pound and Jordanian Dinar, constitute 24.4% of total loan portfolio.
LBPUSDEUROEGPJOD OTHER
20142015
20.954.72.78.66.66.5
21+55+2+9+6+7G 20+57+3+7+6+7GLBPUSDEUROEGPJOD OTHER
20.456.1
3.17.66.36.5
Management Discussion & Analysis 2015
%%
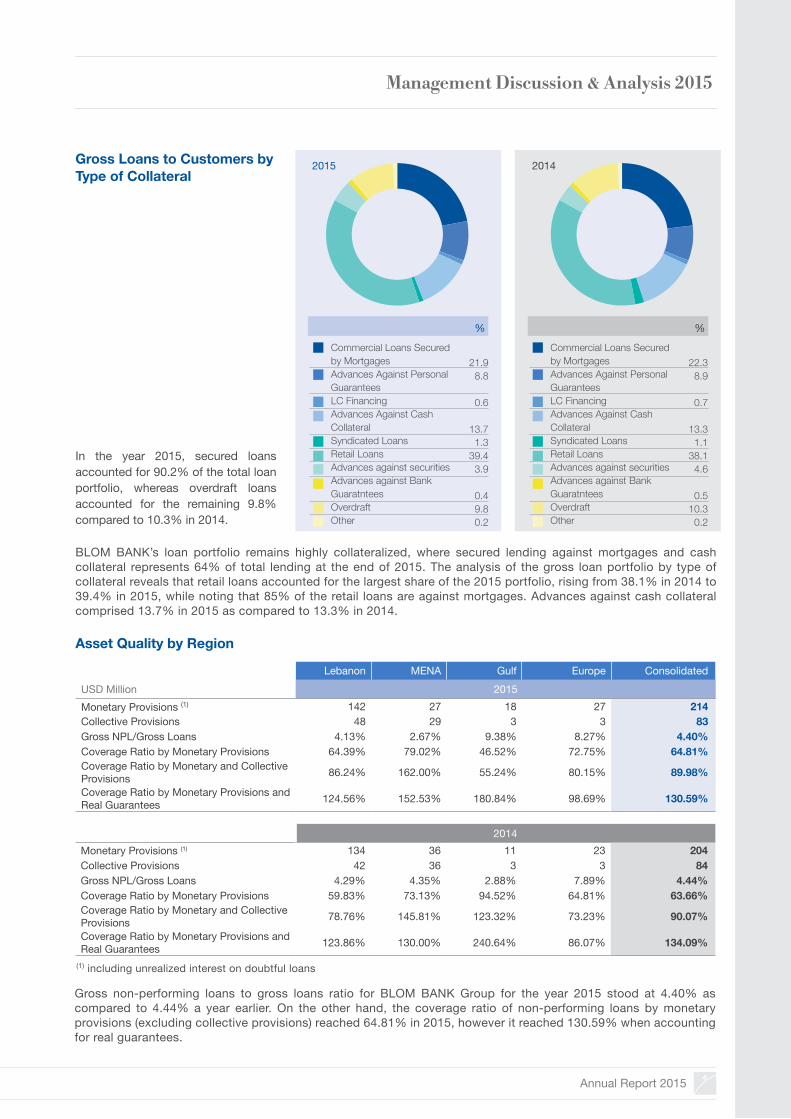
Annual Report 2015 57
In the year 2015, secured loans accounted for 90.2% of the total loan portfolio, whereas overdraft loans accounted for the remaining 9.8% compared to 10.3% in 2014.
Gross Loans to Customers by Type of Collateral
Asset Quality by Region
%
2014
23+8+1+13+2+36+4+1+11+1GCommercial Loans Securedby Mortgages Advances Against Personal GuaranteesLC FinancingAdvances Against Cash CollateralSyndicated LoansRetail Loans Advances against securitiesAdvances against Bank GuaratnteesOverdraftOther
22.38.9
0.7
13.31.1
38.14.6
0.510.30.2
%
2015
22+9+1+12+1+38+5+1+10+1GCommercial Loans Securedby Mortgages Advances Against Personal GuaranteesLC FinancingAdvances Against Cash CollateralSyndicated LoansRetail Loans Advances against securitiesAdvances against Bank GuaratnteesOverdraftOther
21.98.8
0.6
13.71.3
39.43.9
0.49.80.2
BLOM BANK’s loan portfolio remains highly collateralized, where secured lending against mortgages and cash collateral represents 64% of total lending at the end of 2015. The analysis of the gross loan portfolio by type of collateral reveals that retail loans accounted for the largest share of the 2015 portfolio, rising from 38.1% in 2014 to 39.4% in 2015, while noting that 85% of the retail loans are against mortgages. Advances against cash collateral comprised 13.7% in 2015 as compared to 13.3% in 2014.
Lebanon MENA Gulf Europe ConsolidatedUSD Million 2015Monetary Provisions (1) 142 27 18 27 214 Collective Provisions 48 29 3 3 83 Gross NPL/Gross Loans 4.13% 2.67% 9.38% 8.27% 4.40%Coverage Ratio by Monetary Provisions 64.39% 79.02% 46.52% 72.75% 64.81%Coverage Ratio by Monetary and Collective Provisions 86.24% 162.00% 55.24% 80.15% 89.98%
Coverage Ratio by Monetary Provisions and Real Guarantees 124.56% 152.53% 180.84% 98.69% 130.59%
2014Monetary Provisions (1) 134 36 11 23 204 Collective Provisions 42 36 3 3 84 Gross NPL/Gross Loans 4.29% 4.35% 2.88% 7.89% 4.44%Coverage Ratio by Monetary Provisions 59.83% 73.13% 94.52% 64.81% 63.66%Coverage Ratio by Monetary and Collective Provisions 78.76% 145.81% 123.32% 73.23% 90.07%
Coverage Ratio by Monetary Provisions and Real Guarantees 123.86% 130.00% 240.64% 86.07% 134.09%
Gross non-performing loans to gross loans ratio for BLOM BANK Group for the year 2015 stood at 4.40% as compared to 4.44% a year earlier. On the other hand, the coverage ratio of non-performing loans by monetary provisions (excluding collective provisions) reached 64.81% in 2015, however it reached 130.59% when accounting for real guarantees.
Management Discussion & Analysis 2015
(1) including unrealized interest on doubtful loans
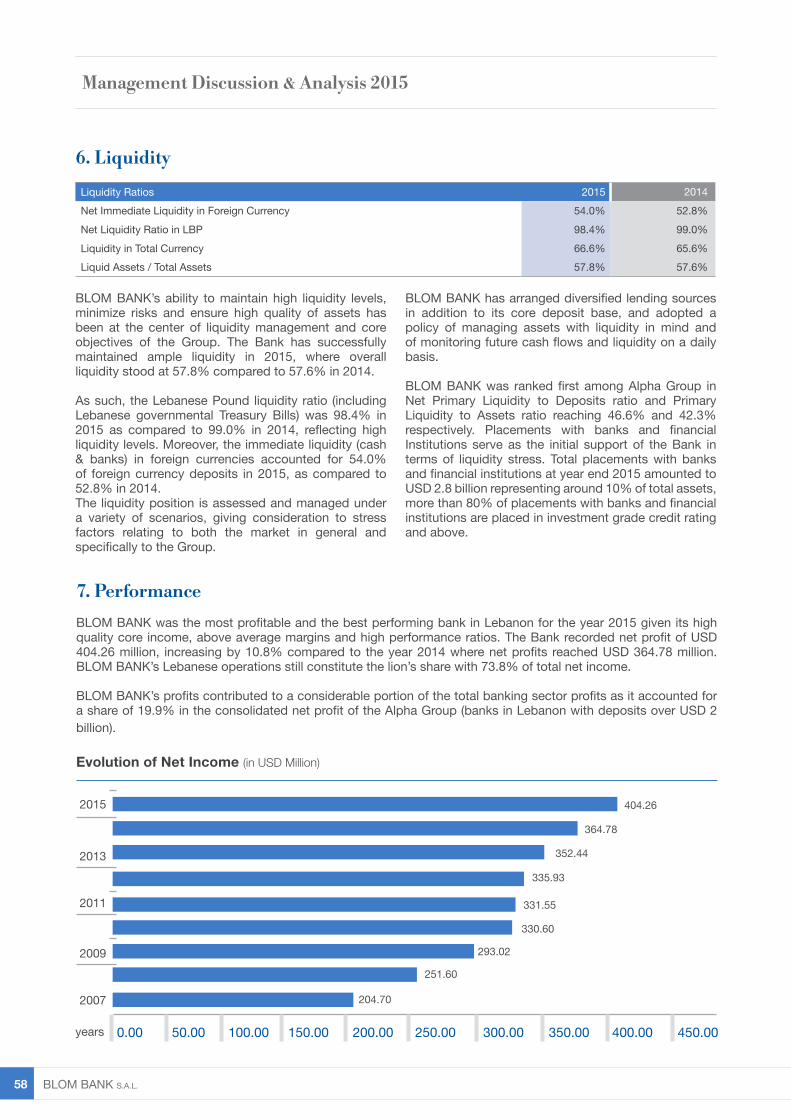
BLOM BANK s.A.L. 58
7. Performance
BLOM BANK was the most profitable and the best performing bank in Lebanon for the year 2015 given its high quality core income, above average margins and high performance ratios. The Bank recorded net profit of USD 404.26 million, increasing by 10.8% compared to the year 2014 where net profits reached USD 364.78 million. BLOM BANK’s Lebanese operations still constitute the lion’s share with 73.8% of total net income.
BLOM BANK’s profits contributed to a considerable portion of the total banking sector profits as it accounted for a share of 19.9% in the consolidated net profit of the Alpha Group (banks in Lebanon with deposits over USD 2 billion).
Evolution of Net Income (in USD Million)
2015
2013
2011
2009
2007
years 300.00 350.00 400.00 450.00200.00 250.00150.00100.0050.000.00
6. Liquidity
BLOM BANK’s ability to maintain high liquidity levels, minimize risks and ensure high quality of assets has been at the center of liquidity management and core objectives of the Group. The Bank has successfully maintained ample liquidity in 2015, where overall liquidity stood at 57.8% compared to 57.6% in 2014.
As such, the Lebanese Pound liquidity ratio (including Lebanese governmental Treasury Bills) was 98.4% in 2015 as compared to 99.0% in 2014, reflecting high liquidity levels. Moreover, the immediate liquidity (cash & banks) in foreign currencies accounted for 54.0% of foreign currency deposits in 2015, as compared to 52.8% in 2014.The liquidity position is assessed and managed under a variety of scenarios, giving consideration to stress factors relating to both the market in general and specifically to the Group.
BLOM BANK has arranged diversified lending sources in addition to its core deposit base, and adopted a policy of managing assets with liquidity in mind and of monitoring future cash flows and liquidity on a daily basis.
BLOM BANK was ranked first among Alpha Group in Net Primary Liquidity to Deposits ratio and Primary Liquidity to Assets ratio reaching 46.6% and 42.3% respectively. Placements with banks and financial Institutions serve as the initial support of the Bank in terms of liquidity stress. Total placements with banks and financial institutions at year end 2015 amounted to USD 2.8 billion representing around 10% of total assets, more than 80% of placements with banks and financial institutions are placed in investment grade credit rating and above.
Liquidity Ratios 2015 2014Net Immediate Liquidity in Foreign Currency 54.0% 52.8%Net Liquidity Ratio in LBP 98.4% 99.0%Liquidity in Total Currency 66.6% 65.6%Liquid Assets / Total Assets 57.8% 57.6%
364.78
404.26
204.70
251.60
330.60
331.55
335.93
352.44
293.02
Management Discussion & Analysis 2015
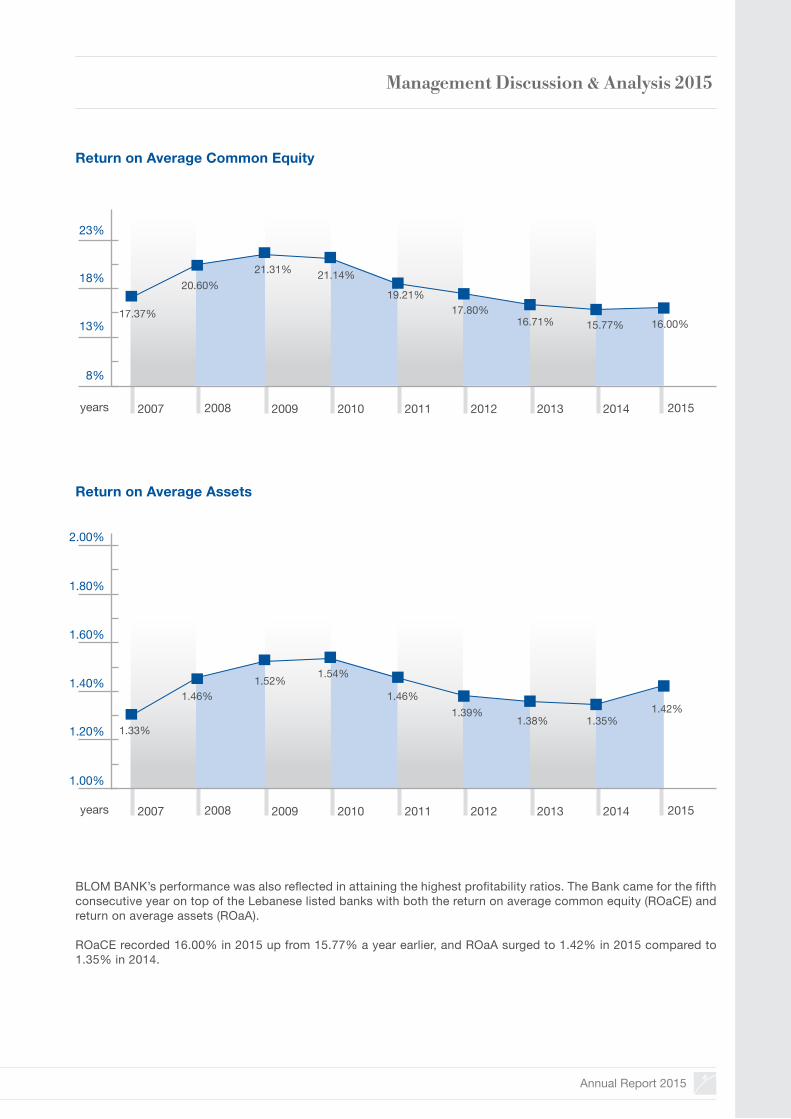
Annual Report 2015 59
23%
1.60%
1.80%
2.00%
18%
1.40%
13%
1.20%
8%
1.00%
years
years
2008
2008
2007
2007
17.37%
1.33%
21.31%
1.52%
21.14%
1.54%
19.21%
1.46%
17.80%
1.39%
16.71%
1.38%
15.77%
1.35%
16.00%
1.42%
20.60%
1.46%
2009
2009
2011
2011
2013
2013
2015
2015
2010
2010
2012
2012
2014
2014
BLOM BANK’s performance was also reflected in attaining the highest profitability ratios. The Bank came for the fifth consecutive year on top of the Lebanese listed banks with both the return on average common equity (ROaCE) and return on average assets (ROaA).
ROaCE recorded 16.00% in 2015 up from 15.77% a year earlier, and ROaA surged to 1.42% in 2015 compared to 1.35% in 2014.
Return on Average Common Equity
Return on Average Assets
Management Discussion & Analysis 2015
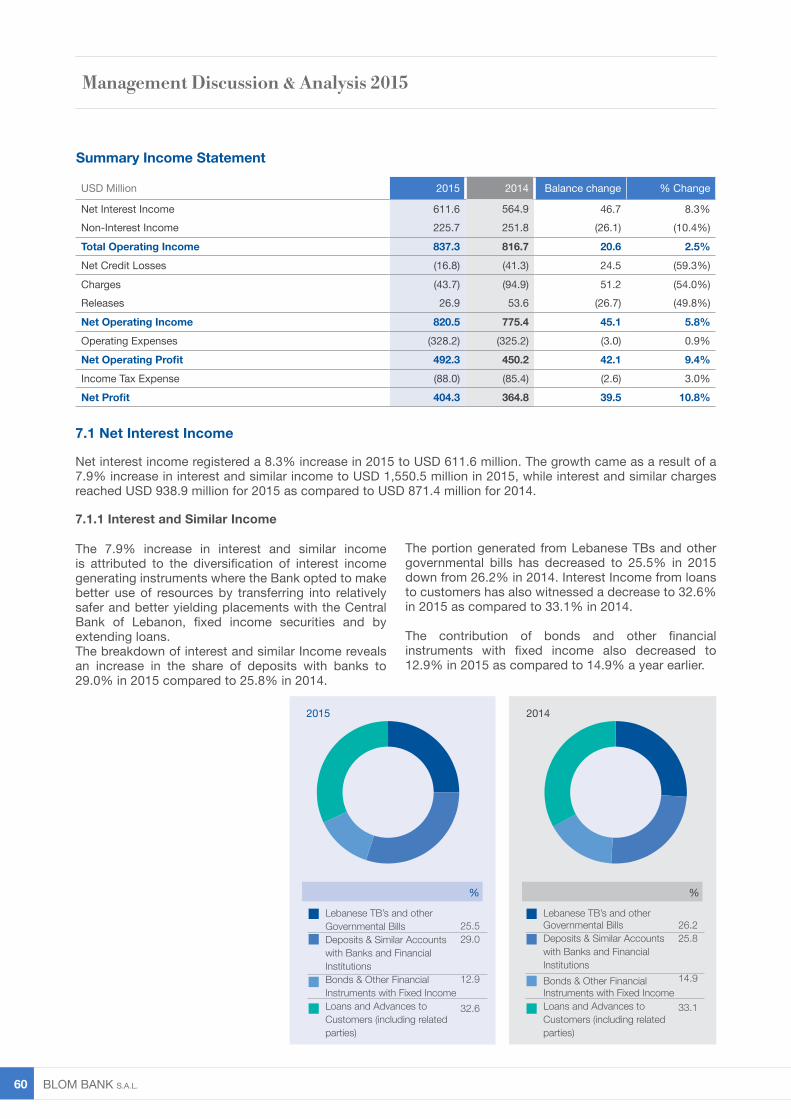
BLOM BANK s.A.L. 60
7.1 Net Interest Income
Net interest income registered a 8.3% increase in 2015 to USD 611.6 million. The growth came as a result of a 7.9% increase in interest and similar income to USD 1,550.5 million in 2015, while interest and similar charges reached USD 938.9 million for 2015 as compared to USD 871.4 million for 2014.
7.1.1 Interest and Similar Income
The 7.9% increase in interest and similar income is attributed to the diversification of interest income generating instruments where the Bank opted to make better use of resources by transferring into relatively safer and better yielding placements with the Central Bank of Lebanon, fixed income securities and by extending loans.The breakdown of interest and similar Income reveals an increase in the share of deposits with banks to 29.0% in 2015 compared to 25.8% in 2014.
The portion generated from Lebanese TBs and other governmental bills has decreased to 25.5% in 2015 down from 26.2% in 2014. Interest Income from loans to customers has also witnessed a decrease to 32.6% in 2015 as compared to 33.1% in 2014.
The contribution of bonds and other financial instruments with fixed income also decreased to 12.9% in 2015 as compared to 14.9% a year earlier.
USD Million 2015 2014 Balance change % Change
Net Interest Income 611.6 564.9 46.7 8.3%Non-Interest Income 225.7 251.8 (26.1) (10.4%)
Total Operating Income 837.3 816.7 20.6 2.5% Net Credit Losses (16.8) (41.3) 24.5 (59.3%)
Charges (43.7) (94.9) 51.2 (54.0%)Releases 26.9 53.6 (26.7) (49.8%)
Net Operating Income 820.5 775.4 45.1 5.8% Operating Expenses (328.2) (325.2) (3.0) 0.9% Net Operating Profit 492.3 450.2 42.1 9.4%Income Tax Expense (88.0) (85.4) (2.6) 3.0% Net Profit 404.3 364.8 39.5 10.8%
%
Lebanese TB’s and other Governmental BillsDeposits & Similar Accounts with Banks and Financial InstitutionsBonds & Other Financial Instruments with Fixed Income Loans and Advances to Customers (including related parties)
26.225.8
14.9
33.1
%
20142015
25+30+13+32+G 26+25+16+33+GLebanese TB’s and other Governmental BillsDeposits & Similar Accounts with Banks and Financial InstitutionsBonds & Other Financial Instruments with Fixed Income Loans and Advances to Customers (including related parties)
25.529.0
12.9
32.6
Management Discussion & Analysis 2015
Summary Income Statement
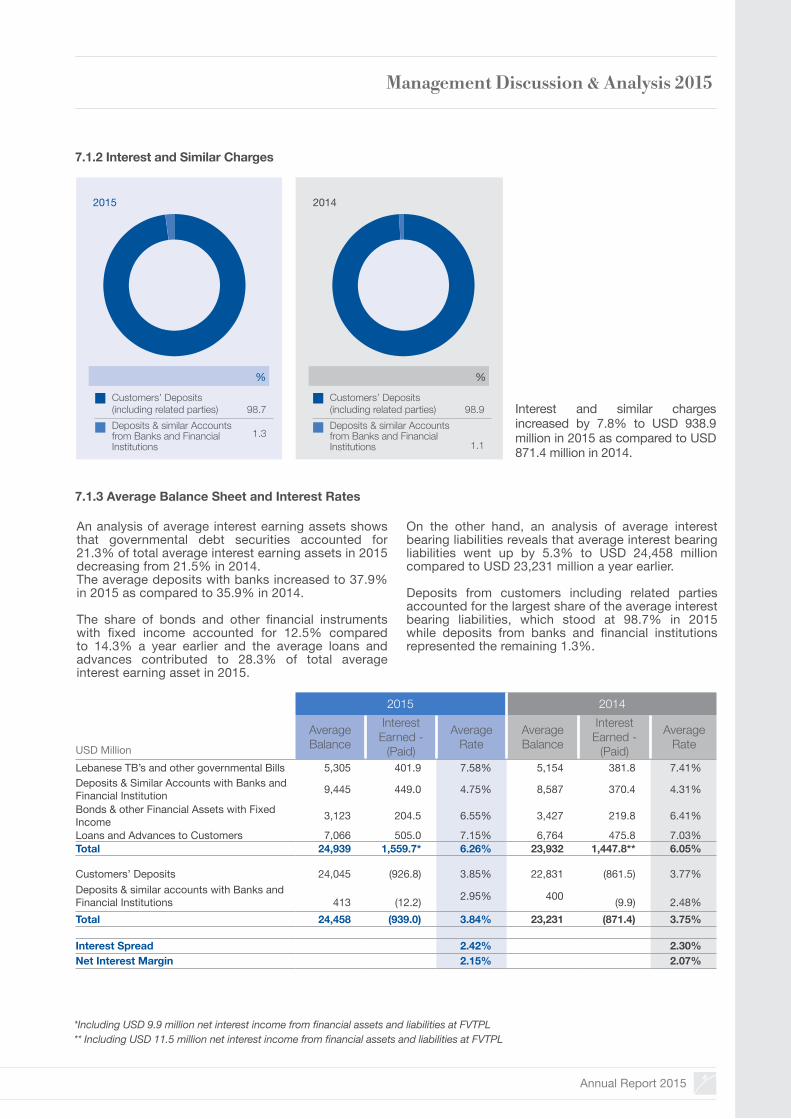
Annual Report 2015 61
7.1.3 Average Balance Sheet and Interest Rates
2015 2014
USD Million
Average Balance
Interest Earned -
(Paid)
Average Rate
Average Balance
Interest Earned -
(Paid)
Average Rate
Lebanese TB’s and other governmental Bills 5,305 401.9 7.58% 5,154 381.8 7.41%Deposits & Similar Accounts with Banks and Financial Institution 9,445 449.0 4.75% 8,587 370.4 4.31%
Bonds & other Financial Assets with Fixed Income 3,123 204.5 6.55% 3,427 219.8 6.41%
Loans and Advances to Customers 7,066 505.0 7.15% 6,764 475.8 7.03%Total 24,939 1,559.7* 6.26% 23,932 1,447.8** 6.05% Customers’ Deposits 24,045 (926.8) 3.85% 22,831 (861.5) 3.77%Deposits & similar accounts with Banks and Financial Institutions 413 (12.2) 2.95% 400 (9.9) 2.48%Total 24,458 (939.0) 3.84% 23,231 (871.4) 3.75% Interest Spread 2.42% 2.30%Net Interest Margin 2.15% 2.07%
*Including USD 9.9 million net interest income from financial assets and liabilities at FVTPL** Including USD 11.5 million net interest income from financial assets and liabilities at FVTPL
Interest and similar charges increased by 7.8% to USD 938.9 million in 2015 as compared to USD 871.4 million in 2014.
7.1.2 Interest and Similar Charges
An analysis of average interest earning assets shows that governmental debt securities accounted for 21.3% of total average interest earning assets in 2015 decreasing from 21.5% in 2014. The average deposits with banks increased to 37.9% in 2015 as compared to 35.9% in 2014.
The share of bonds and other financial instruments with fixed income accounted for 12.5% compared to 14.3% a year earlier and the average loans and advances contributed to 28.3% of total average interest earning asset in 2015.
On the other hand, an analysis of average interest bearing liabilities reveals that average interest bearing liabilities went up by 5.3% to USD 24,458 million compared to USD 23,231 million a year earlier.
Deposits from customers including related parties accounted for the largest share of the average interest bearing liabilities, which stood at 98.7% in 2015 while deposits from banks and financial institutions represented the remaining 1.3%.
%
Customers’ Deposits(including related parties)Deposits & similar Accounts from Banks and Financial Institutions
98.9
1.1
%
20142015
Customers’ Deposits(including related parties)Deposits & similar Accounts from Banks and Financial Institutions
98.7
1.3
99+1+G98+2+GManagement Discussion & Analysis 2015
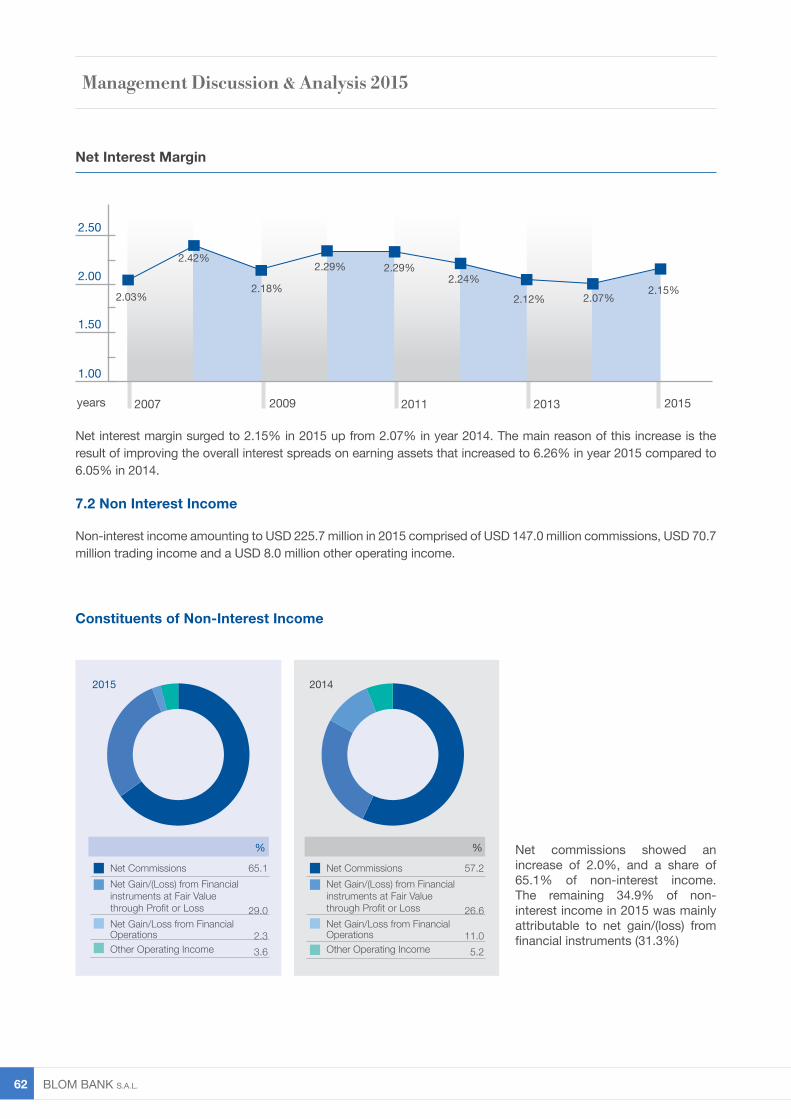
BLOM BANK s.A.L. 62
2.50
2.00
1.50
1.00
Net Interest Margin
7.2 Non Interest Income
Non-interest income amounting to USD 225.7 million in 2015 comprised of USD 147.0 million commissions, USD 70.7 million trading income and a USD 8.0 million other operating income.
Net interest margin surged to 2.15% in 2015 up from 2.07% in year 2014. The main reason of this increase is the result of improving the overall interest spreads on earning assets that increased to 6.26% in year 2015 compared to 6.05% in 2014.
Net commissions showed an increase of 2.0%, and a share of 65.1% of non-interest income. The remaining 34.9% of non-interest income in 2015 was mainly attributable to net gain/(loss) from financial instruments (31.3%)
2014
Net CommissionsNet Gain/(Loss) from Financial instruments at Fair Value through Profit or LossNet Gain/Loss from FinancialOperationsOther Operating Income
57.2
26.6
11.05.2
2015
Net CommissionsNet Gain/(Loss) from Financial instruments at Fair Value through Profit or LossNet Gain/Loss from FinancialOperationsOther Operating Income
65.1
29.0
2.33.6
Constituents of Non-Interest Income
years 20092007
65+29+2+4+G%%
2.03%2.18%
2.29% 2.29%2.24%
2.12% 2.07%2.15%
2.42%
2011 20152013
57+26+11+6+G
Management Discussion & Analysis 2015

Annual Report 2015 63
USD Million 2015 2014Staff Expenses 188.3 191.2Other operating expenses 113.7 112.3Depreciation and Amortization 26.2 21.7
328.2 325.2
Cost to Income Ratio
years 201520132009 2011
40.00
38.00
36.00
32.00
34.00
30.00
2007
2015 2014Number of Employees* 4,818 4,705Staff Expenses per employee (USD) 39,073 40,645 Operating expenses per employee (USD) 23,605 23,866
* For more details refer to 13.1
34.63%
35.58%35.04%
36.21%
37.99% 37.68%
39.11%
36.80%37.26%
7.3 Operating Expenses
Operating expenses reached USD 328.2 million in 2015, compared to USD 325.2 million in 2014.
Staff expenses (salaries and related charges) decreased by 1.6% in 2015 to USD 188.3 million while other operating expenses increased by 1.3% to reach USD 113.7 million.Thus, staff expenses accounted for the largest share of
operating expenses with 57.4% while other operating expenses share stood at 34.7%.
That said, BLOM BANK is still maintaining a relatively low cost-to-income ratio, reflecting the Bank’s efficient cost-containment policy. The cost-to-income ratio decreased to 36.8 % in 2015 compared to 39.1% in 2014.
Management Discussion & Analysis 2015

BLOM BANK s.A.L. 64

Annual Report 2015 65
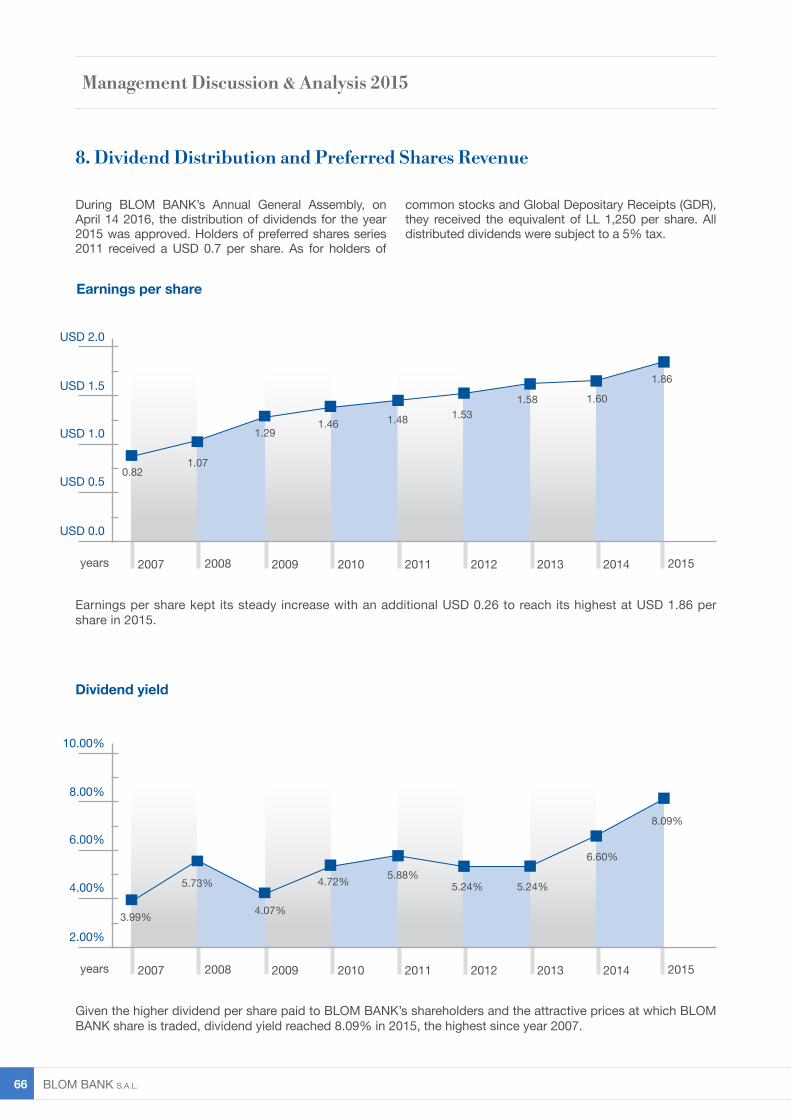
BLOM BANK s.A.L. 66
8. Dividend Distribution and Preferred Shares Revenue
During BLOM BANK’s Annual General Assembly, on April 14 2016, the distribution of dividends for the year 2015 was approved. Holders of preferred shares series 2011 received a USD 0.7 per share. As for holders of
common stocks and Global Depositary Receipts (GDR), they received the equivalent of LL 1,250 per share. All distributed dividends were subject to a 5% tax.
Earnings per share
USD 1.5
USD 2.0
8.00%
10.00%
USD 1.0
6.00%
USD 0.5
4.00%
USD 0.0
2.00%
years
years
2008
2008
2007
2007
0.82
3.99%
1.29
4.07%
1.46
4.72%
1.48
5.88%
1.53
5.24%
1.58
5.24%
1.60
6.60%
1.86
8.09%
1.07
5.73%
2009
2009
2011
2011
2013
2013
2015
2015
2010
2010
2012
2012
2014
2014
Earnings per share kept its steady increase with an additional USD 0.26 to reach its highest at USD 1.86 per share in 2015.
Given the higher dividend per share paid to BLOM BANK’s shareholders and the attractive prices at which BLOM BANK share is traded, dividend yield reached 8.09% in 2015, the highest since year 2007.
Dividend yield
Management Discussion & Analysis 2015
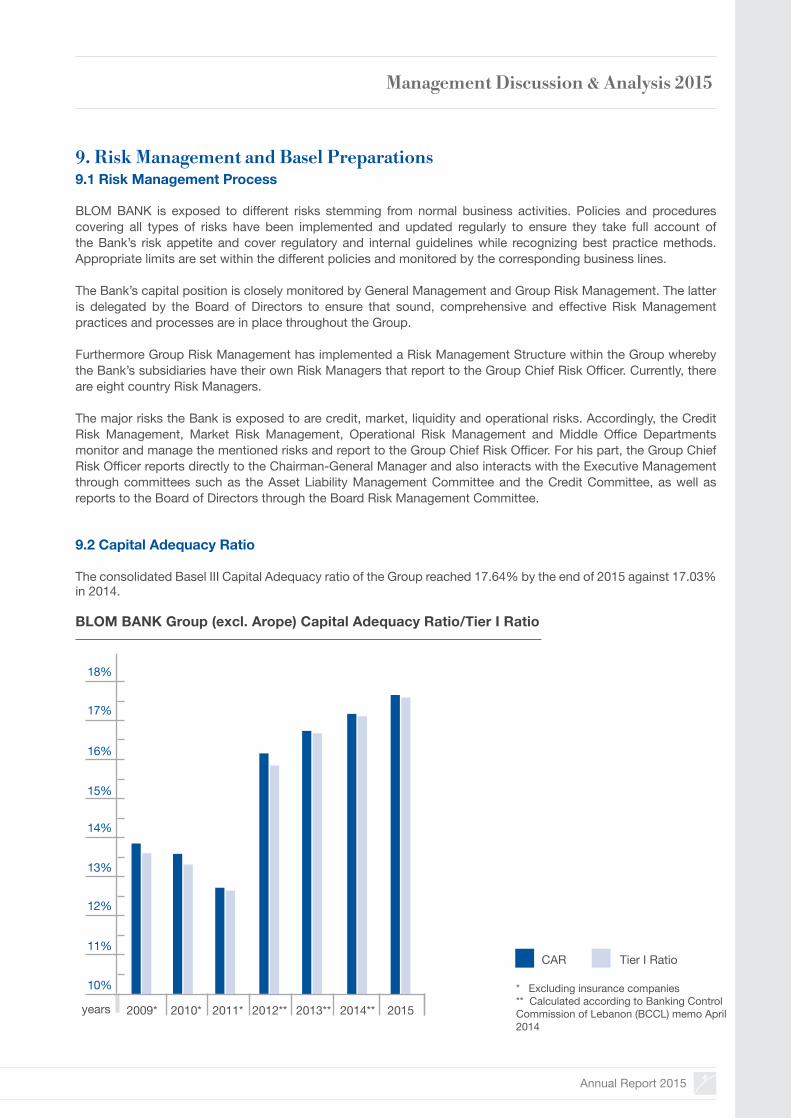
Annual Report 2015 67
9.1 Risk Management Process
BLOM BANK is exposed to different risks stemming from normal business activities. Policies and procedures covering all types of risks have been implemented and updated regularly to ensure they take full account of the Bank’s risk appetite and cover regulatory and internal guidelines while recognizing best practice methods. Appropriate limits are set within the different policies and monitored by the corresponding business lines.
The Bank’s capital position is closely monitored by General Management and Group Risk Management. The latter is delegated by the Board of Directors to ensure that sound, comprehensive and effective Risk Management practices and processes are in place throughout the Group.
Furthermore Group Risk Management has implemented a Risk Management Structure within the Group whereby the Bank’s subsidiaries have their own Risk Managers that report to the Group Chief Risk Officer. Currently, there are eight country Risk Managers.
The major risks the Bank is exposed to are credit, market, liquidity and operational risks. Accordingly, the Credit Risk Management, Market Risk Management, Operational Risk Management and Middle Office Departments monitor and manage the mentioned risks and report to the Group Chief Risk Officer. For his part, the Group Chief Risk Officer reports directly to the Chairman-General Manager and also interacts with the Executive Management through committees such as the Asset Liability Management Committee and the Credit Committee, as well as reports to the Board of Directors through the Board Risk Management Committee.
9.2 Capital Adequacy Ratio
The consolidated Basel III Capital Adequacy ratio of the Group reached 17.64% by the end of 2015 against 17.03% in 2014.
9. Risk Management and Basel Preparations
BLOM BANK Group (excl. Arope) Capital Adequacy Ratio/Tier I Ratio
Tier I Ratio
* Excluding insurance companies** Calculated according to Banking Control Commission of Lebanon (BCCL) memo April 2014
CAR
14%
16%
17%
18%
13%
15%
12%
11%
10%
years 2009* 2010* 2011* 2012** 2014** 2015
Management Discussion & Analysis 2015
2013**
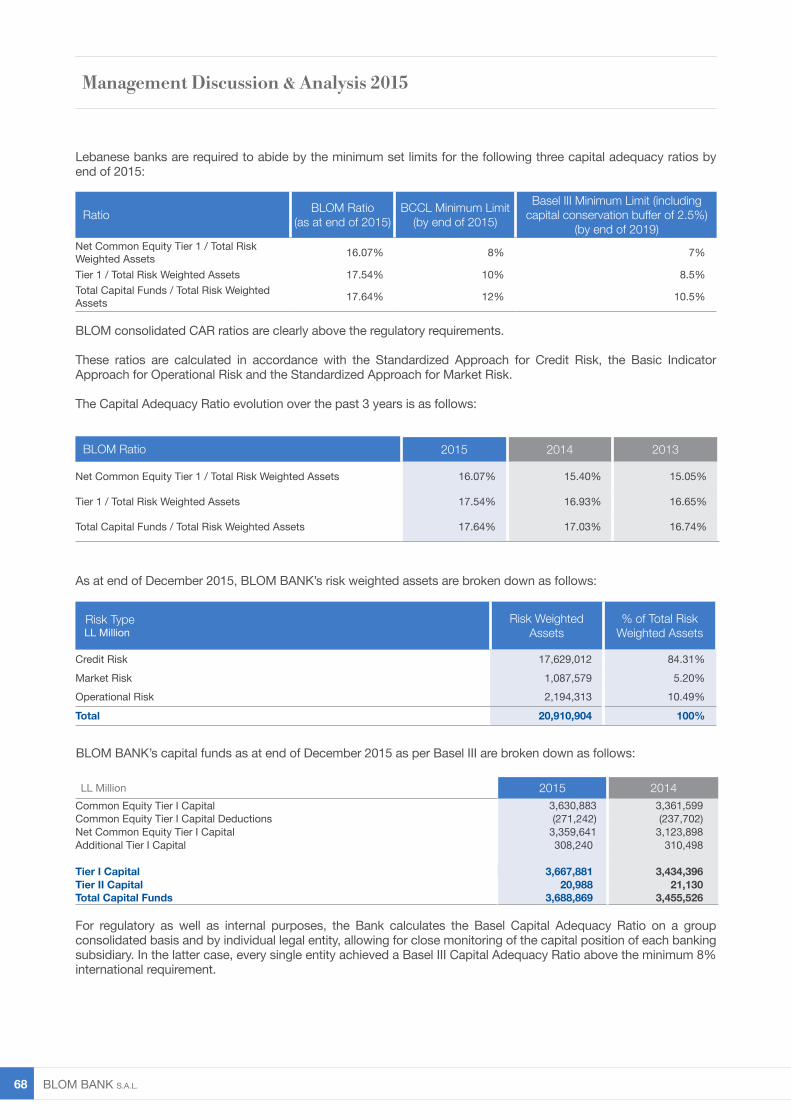
BLOM BANK s.A.L. 68
Ratio BLOM Ratio(as at end of 2015)
BCCL Minimum Limit (by end of 2015)
Basel III Minimum Limit (including capital conservation buffer of 2.5%)
(by end of 2019)Net Common Equity Tier 1 / Total Risk Weighted Assets 16.07% 8% 7%
Tier 1 / Total Risk Weighted Assets 17.54% 10% 8.5%Total Capital Funds / Total Risk Weighted Assets 17.64% 12% 10.5%
BLOM Ratio 2015 2014 2013
Net Common Equity Tier 1 / Total Risk Weighted Assets 16.07% 15.40% 15.05%
Tier 1 / Total Risk Weighted Assets 17.54% 16.93% 16.65%
Total Capital Funds / Total Risk Weighted Assets 17.64% 17.03% 16.74%
Risk Type LL Million
Risk Weighted Assets
% of Total Risk Weighted Assets
Credit Risk 17,629,012 84.31%Market Risk 1,087,579 5.20%Operational Risk 2,194,313 10.49%
Total 20,910,904 100%
Lebanese banks are required to abide by the minimum set limits for the following three capital adequacy ratios by end of 2015:
As at end of December 2015, BLOM BANK’s risk weighted assets are broken down as follows:
BLOM consolidated CAR ratios are clearly above the regulatory requirements.
These ratios are calculated in accordance with the Standardized Approach for Credit Risk, the Basic Indicator Approach for Operational Risk and the Standardized Approach for Market Risk. The Capital Adequacy Ratio evolution over the past 3 years is as follows:
For regulatory as well as internal purposes, the Bank calculates the Basel Capital Adequacy Ratio on a group consolidated basis and by individual legal entity, allowing for close monitoring of the capital position of each banking subsidiary. In the latter case, every single entity achieved a Basel III Capital Adequacy Ratio above the minimum 8% international requirement.
LL Million 2015 2014Common Equity Tier I Capital 3,630,883 3,361,599Common Equity Tier I Capital Deductions (271,242) (237,702)Net Common Equity Tier I Capital 3,359,641 3,123,898Additional Tier I Capital 308,240 310,498
Tier I Capital 3,667,881 3,434,396Tier II Capital 20,988 21,130Total Capital Funds 3,688,869 3,455,526
BLOM BANK’s capital funds as at end of December 2015 as per Basel III are broken down as follows:
Management Discussion & Analysis 2015
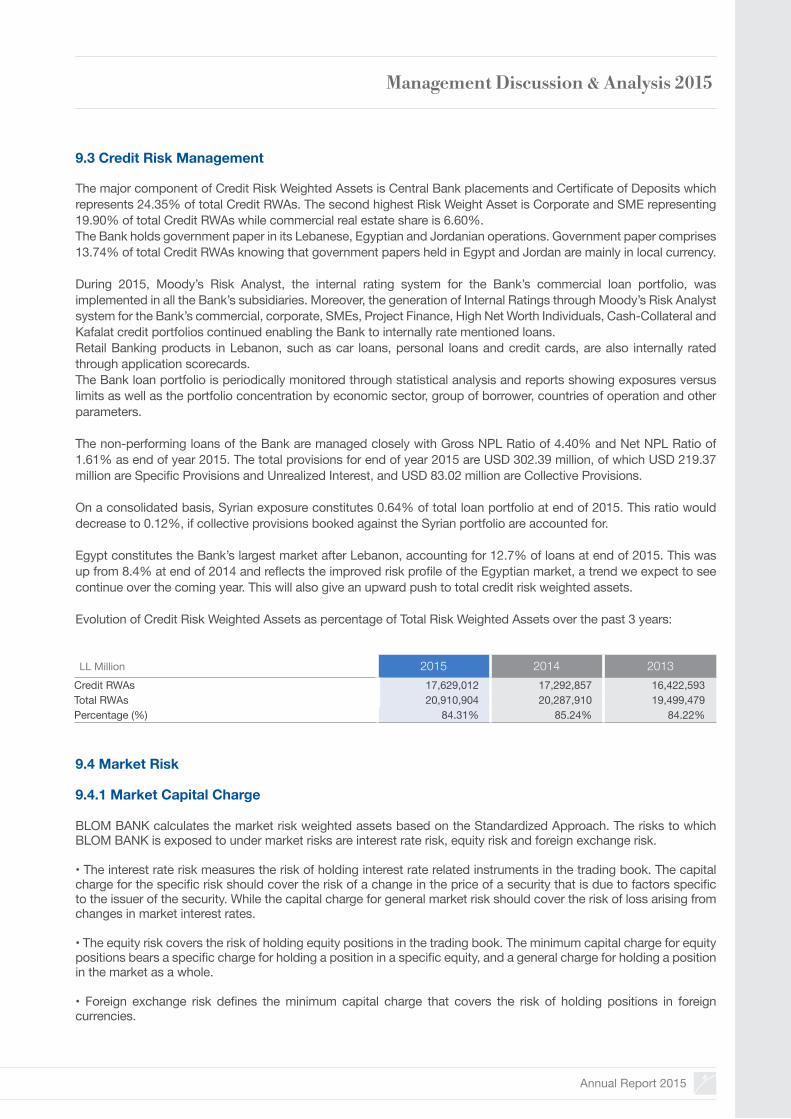
Annual Report 2015 69
9.3 Credit Risk Management
The major component of Credit Risk Weighted Assets is Central Bank placements and Certificate of Deposits which represents 24.35% of total Credit RWAs. The second highest Risk Weight Asset is Corporate and SME representing 19.90% of total Credit RWAs while commercial real estate share is 6.60%. The Bank holds government paper in its Lebanese, Egyptian and Jordanian operations. Government paper comprises 13.74% of total Credit RWAs knowing that government papers held in Egypt and Jordan are mainly in local currency.
During 2015, Moody’s Risk Analyst, the internal rating system for the Bank’s commercial loan portfolio, was implemented in all the Bank’s subsidiaries. Moreover, the generation of Internal Ratings through Moody’s Risk Analyst system for the Bank’s commercial, corporate, SMEs, Project Finance, High Net Worth Individuals, Cash-Collateral and Kafalat credit portfolios continued enabling the Bank to internally rate mentioned loans. Retail Banking products in Lebanon, such as car loans, personal loans and credit cards, are also internally rated through application scorecards. The Bank loan portfolio is periodically monitored through statistical analysis and reports showing exposures versus limits as well as the portfolio concentration by economic sector, group of borrower, countries of operation and other parameters.
The non-performing loans of the Bank are managed closely with Gross NPL Ratio of 4.40% and Net NPL Ratio of 1.61% as end of year 2015. The total provisions for end of year 2015 are USD 302.39 million, of which USD 219.37 million are Specific Provisions and Unrealized Interest, and USD 83.02 million are Collective Provisions.
On a consolidated basis, Syrian exposure constitutes 0.64% of total loan portfolio at end of 2015. This ratio would decrease to 0.12%, if collective provisions booked against the Syrian portfolio are accounted for.
Egypt constitutes the Bank’s largest market after Lebanon, accounting for 12.7% of loans at end of 2015. This was up from 8.4% at end of 2014 and reflects the improved risk profile of the Egyptian market, a trend we expect to see continue over the coming year. This will also give an upward push to total credit risk weighted assets.
Evolution of Credit Risk Weighted Assets as percentage of Total Risk Weighted Assets over the past 3 years:
9.4 Market Risk
9.4.1 Market Capital Charge
BLOM BANK calculates the market risk weighted assets based on the Standardized Approach. The risks to which BLOM BANK is exposed to under market risks are interest rate risk, equity risk and foreign exchange risk.
• The interest rate risk measures the risk of holding interest rate related instruments in the trading book. The capital charge for the specific risk should cover the risk of a change in the price of a security that is due to factors specific to the issuer of the security. While the capital charge for general market risk should cover the risk of loss arising from changes in market interest rates.
• The equity risk covers the risk of holding equity positions in the trading book. The minimum capital charge for equity positions bears a specific charge for holding a position in a specific equity, and a general charge for holding a position in the market as a whole.
• Foreign exchange risk defines the minimum capital charge that covers the risk of holding positions in foreign currencies.
LL Million 2015 2014 2013Credit RWAs 17,629,012 17,292,857 16,422,593Total RWAs 20,910,904 20,287,910 19,499,479Percentage (%) 84.31% 85.24% 84.22%
Management Discussion & Analysis 2015
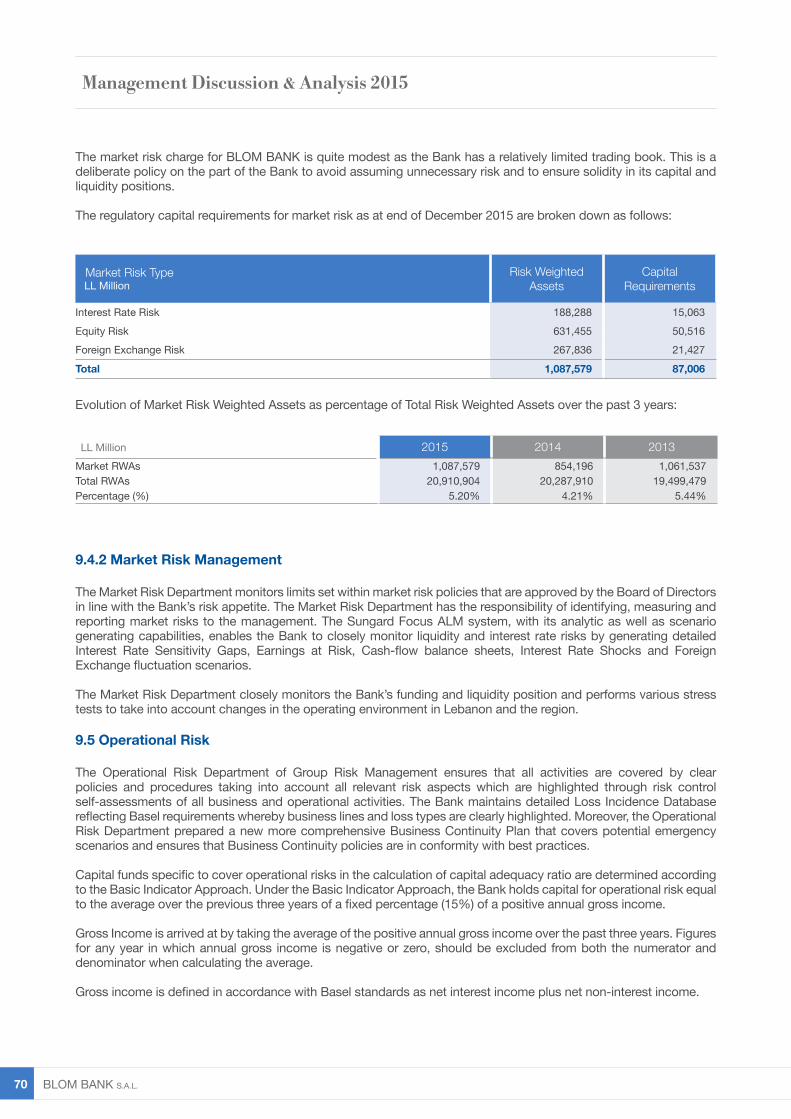
BLOM BANK s.A.L. 70
The market risk charge for BLOM BANK is quite modest as the Bank has a relatively limited trading book. This is a deliberate policy on the part of the Bank to avoid assuming unnecessary risk and to ensure solidity in its capital and liquidity positions.
The regulatory capital requirements for market risk as at end of December 2015 are broken down as follows:
9.4.2 Market Risk Management
The Market Risk Department monitors limits set within market risk policies that are approved by the Board of Directors in line with the Bank’s risk appetite. The Market Risk Department has the responsibility of identifying, measuring and reporting market risks to the management. The Sungard Focus ALM system, with its analytic as well as scenario generating capabilities, enables the Bank to closely monitor liquidity and interest rate risks by generating detailed Interest Rate Sensitivity Gaps, Earnings at Risk, Cash-flow balance sheets, Interest Rate Shocks and Foreign Exchange fluctuation scenarios.
The Market Risk Department closely monitors the Bank’s funding and liquidity position and performs various stress tests to take into account changes in the operating environment in Lebanon and the region.
9.5 Operational Risk
The Operational Risk Department of Group Risk Management ensures that all activities are covered by clear policies and procedures taking into account all relevant risk aspects which are highlighted through risk control self-assessments of all business and operational activities. The Bank maintains detailed Loss Incidence Database reflecting Basel requirements whereby business lines and loss types are clearly highlighted. Moreover, the Operational Risk Department prepared a new more comprehensive Business Continuity Plan that covers potential emergency scenarios and ensures that Business Continuity policies are in conformity with best practices.
Capital funds specific to cover operational risks in the calculation of capital adequacy ratio are determined according to the Basic Indicator Approach. Under the Basic Indicator Approach, the Bank holds capital for operational risk equal to the average over the previous three years of a fixed percentage (15%) of a positive annual gross income.
Gross Income is arrived at by taking the average of the positive annual gross income over the past three years. Figures for any year in which annual gross income is negative or zero, should be excluded from both the numerator and denominator when calculating the average.
Gross income is defined in accordance with Basel standards as net interest income plus net non-interest income.
Evolution of Market Risk Weighted Assets as percentage of Total Risk Weighted Assets over the past 3 years:
Market Risk Type LL Million
Risk Weighted Assets
Capital Requirements
Interest Rate Risk 188,288 15,063Equity Risk 631,455 50,516Foreign Exchange Risk 267,836 21,427
Total 1,087,579 87,006
LL Million 2015 2014 2013Market RWAs 1,087,579 854,196 1,061,537Total RWAs 20,910,904 20,287,910 19,499,479Percentage (%) 5.20% 4.21% 5.44%
Management Discussion & Analysis 2015

Annual Report 2015 71
LL Million 2015 2014 2013Operational RWAs 2,194,313 2,140,857 2,015,349Total RWAs 20,910,904 20,287,910 19,499,479Percentage (%) 10.49% 10.55% 10.34%
Further, this measure should:
• Be gross of any provisions (e.g. for unpaid interest)• Be gross of operating expenses, including fees paid to outsourcing service providers• Exclude realized profits/losses from the sale of securities in the banking book and• Exclude extraordinary or irregular items as well as income derived from insurance
Evolution of Operational Risk Weighted Assets as percentage of Total Risk Weighted Assets over the past 3 years:
9.6 Liquidity Risk
Liquidity refers to the condition where the Bank has ability to fund, on an on-going basis, any decreases in its liabilities or increases in its assets by either obtaining new liabilities or selling or leveraging on existing assets. Liquidity management in the Bank aims to enable the Bank to adequately fund its business activities both in normal and stressed market conditions. The Bank places importance on maintaining high liquidity to meet short term needs, as well as sustaining a stable deposits base. The Bank manages liquidity in line with regulatory requirements, Basel committee directives and best practices.The Bank, and in the process of monitoring its liquidity status, has established early warning indicators that could warn it of impending liquidity problems. Should such a situation occur, a contingency funding plan is put in place in order to restore the status quo as soon as possible, while at the same time to avoid any unnecessary measures that could aggravate the problem and lead to contagion of the wider market.The Bank has a variety of liquidity measures that are regularly monitored and include limits on maturity gaps and ratios covering the concentration of deposits base, the availability and concentration of liquid assets. The Bank places a great deal of emphasis on ensuring a solid funding base. In its home market, this translates into a heavy weighting of retail deposits which have traditionally been characterized by high stability in terms of customer loyalty and therefore high roll-over rates. The loans to deposits ratio was stable at 28.7% at end of December 2015 indicating a conservative liquid asset deployment strategy.
The two minimum standards for funding liquidity that were developed by the BCBS, the Liquidity Coverage Ratio (LCR) and the Net Stable Funding Ratio (NSFR) are
measured for the Bank’s different entities. For Lebanon the Basel calculation of the LCR results in a particularly high level, exceeding by far the Basel minimum limit. An internal measure of the LCR is set and monitored regularly.
Liquidity stress tests are periodically conducted in order to assess to which level the set Liquidity Contingency Plan is capable of handling various liquidity crisis scenarios.
9.7 Interest Rate Risk in the Banking Book
Interest rate risk is the risk where changes in market interest rates might adversely affect the Bank’s financial conditions through its impact on Net Interest Income (NII) in the short term and its impact on the economic value of the Bank’s assets, liabilities and off-balance sheet positions in the long term.
The impact of a 2% sudden interest rate shock across all currencies for the group would result in a reduction of 30.2% of 2015 Net Interest Income. BLOM BANK Lebanon constitutes the biggest portion of the Group’s balance sheet. In Lebanon a structural gap is inevitable due to short term contractual maturity of deposits even though empirically their behavioral maturities are much longer. Should such a shock be realized, which is highly unlikely, the Central Bank has a variety of tools at its disposal which would alleviate the results of such an outcome.
9.8 Internal Capital Adequacy Assessment Process (ICAAP)
The ICAAP of BLOM BANK is driven by the Board of Directors (BOD) through the Board Risk Management Committee (BRMC) and the Group Chief Risk Officer
Management Discussion & Analysis 2015
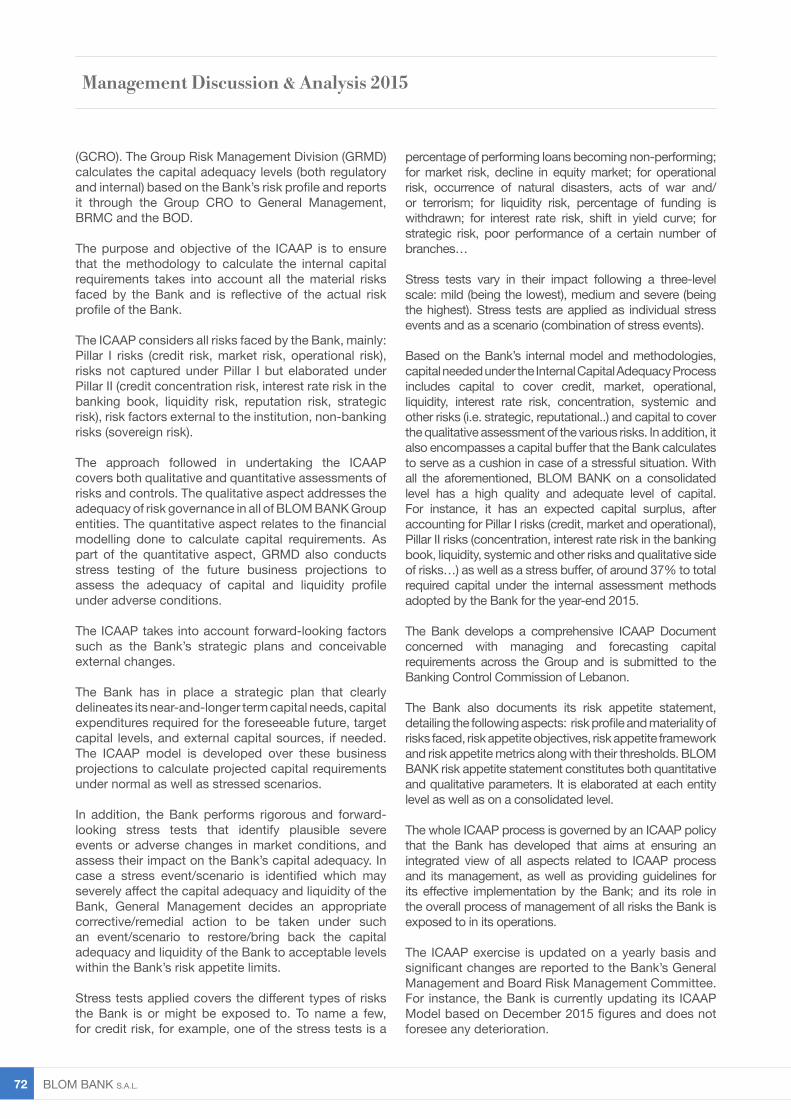
BLOM BANK s.A.L. 72
(GCRO). The Group Risk Management Division (GRMD) calculates the capital adequacy levels (both regulatory and internal) based on the Bank’s risk profile and reports it through the Group CRO to General Management, BRMC and the BOD.
The purpose and objective of the ICAAP is to ensure that the methodology to calculate the internal capital requirements takes into account all the material risks faced by the Bank and is reflective of the actual risk profile of the Bank.
The ICAAP considers all risks faced by the Bank, mainly: Pillar I risks (credit risk, market risk, operational risk), risks not captured under Pillar I but elaborated under Pillar II (credit concentration risk, interest rate risk in the banking book, liquidity risk, reputation risk, strategic risk), risk factors external to the institution, non-banking risks (sovereign risk).
The approach followed in undertaking the ICAAP covers both qualitative and quantitative assessments of risks and controls. The qualitative aspect addresses the adequacy of risk governance in all of BLOM BANK Group entities. The quantitative aspect relates to the financial modelling done to calculate capital requirements. As part of the quantitative aspect, GRMD also conducts stress testing of the future business projections to assess the adequacy of capital and liquidity profile under adverse conditions.
The ICAAP takes into account forward-looking factors such as the Bank’s strategic plans and conceivable external changes.
The Bank has in place a strategic plan that clearly delineates its near-and-longer term capital needs, capital expenditures required for the foreseeable future, target capital levels, and external capital sources, if needed. The ICAAP model is developed over these business projections to calculate projected capital requirements under normal as well as stressed scenarios.
In addition, the Bank performs rigorous and forward-looking stress tests that identify plausible severe events or adverse changes in market conditions, and assess their impact on the Bank’s capital adequacy. In case a stress event/scenario is identified which may severely affect the capital adequacy and liquidity of the Bank, General Management decides an appropriate corrective/remedial action to be taken under such an event/scenario to restore/bring back the capital adequacy and liquidity of the Bank to acceptable levels within the Bank’s risk appetite limits.
Stress tests applied covers the different types of risks the Bank is or might be exposed to. To name a few, for credit risk, for example, one of the stress tests is a
percentage of performing loans becoming non-performing; for market risk, decline in equity market; for operational risk, occurrence of natural disasters, acts of war and/or terrorism; for liquidity risk, percentage of funding is withdrawn; for interest rate risk, shift in yield curve; for strategic risk, poor performance of a certain number of branches…
Stress tests vary in their impact following a three-level scale: mild (being the lowest), medium and severe (being the highest). Stress tests are applied as individual stress events and as a scenario (combination of stress events).
Based on the Bank’s internal model and methodologies, capital needed under the Internal Capital Adequacy Process includes capital to cover credit, market, operational, liquidity, interest rate risk, concentration, systemic and other risks (i.e. strategic, reputational..) and capital to cover the qualitative assessment of the various risks. In addition, it also encompasses a capital buffer that the Bank calculates to serve as a cushion in case of a stressful situation. With all the aforementioned, BLOM BANK on a consolidated level has a high quality and adequate level of capital. For instance, it has an expected capital surplus, after accounting for Pillar I risks (credit, market and operational), Pillar II risks (concentration, interest rate risk in the banking book, liquidity, systemic and other risks and qualitative side of risks…) as well as a stress buffer, of around 37% to total required capital under the internal assessment methods adopted by the Bank for the year-end 2015.
The Bank develops a comprehensive ICAAP Document concerned with managing and forecasting capital requirements across the Group and is submitted to the Banking Control Commission of Lebanon.
The Bank also documents its risk appetite statement, detailing the following aspects: risk profile and materiality of risks faced, risk appetite objectives, risk appetite framework and risk appetite metrics along with their thresholds. BLOM BANK risk appetite statement constitutes both quantitative and qualitative parameters. It is elaborated at each entity level as well as on a consolidated level.
The whole ICAAP process is governed by an ICAAP policy that the Bank has developed that aims at ensuring an integrated view of all aspects related to ICAAP process and its management, as well as providing guidelines for its effective implementation by the Bank; and its role in the overall process of management of all risks the Bank is exposed to in its operations.
The ICAAP exercise is updated on a yearly basis and significant changes are reported to the Bank’s General Management and Board Risk Management Committee. For instance, the Bank is currently updating its ICAAP Model based on December 2015 figures and does not foresee any deterioration.
Management Discussion & Analysis 2015
Annual Report 2015 73
The Bank’s capital management philosophy is aimed at maintaining an optimum level of capital and liquidity to enable it to pursue strategies that build long-term shareholder value, while maintaining adequate capital and sufficient liquidity levels.
In brief, the ICAAP exercise showed that the Bank has a highly adequate capital base to support its operations and to finance its growth in line with its strategic objectives. The Bank holds sufficient capital to weather stressed situations.
10. Corporate Governance
BLOM BANK’s Corporate Governance Code was approved at the end of 2007 by the Board of Directors and most recently updated in December 2015. The Corporate Governance Code is published on the Bank’s Website.
BLOM BANK continued in 2015 to promote good corporate governance practices and to implement solid corporate governance standards in its portfolio of regional investments to mitigate financial risks and protect its shareholders’ rights, knowing that BLOM BANK was the first bank in Lebanon to sign the Investors for Governance and Integrity (IGI) Declaration and to commit to implement the Governance and Integrity Rating (GIR) guidelines and recommendations into its own ownership policies and practices, and work to further the advancement of good corporate governance practices, thus contributing to the safety of the financial environment in Lebanon.
According to the 2015 Governance and Integrity Ratings (GIR) on Online Transparency and Disclosure report published by Capital Concept’s Shareholder-Rights (Shareholders-Rights by Capital Concept is an independent provider of research and ratings on corporate governance affecting the performance of public and private companies), BLOM BANK received a “B+” grade. BLOM BANK ranked better than its peers on its disclosure of Corporate Governance Code. The Bank falls within the “Very good” range according to the Shareholders-Rights’ Grading System. A “B+” score means the Bank indicates strong performance demonstrating a high level of corporate governance attainment. Shareholders-Rights has rated all ten listed companies on the Beirut Stock Exchange according to international corporate governance standards, against current disclosure requirements by the local regulators and voluntary codes of ethics used in the Lebanese market. BLOM BANK has ranked first.
In December 2014, BLOM BANK joined the United Global Compact network and became a member of the Global Compact Network in Lebanon. In September 2015, the Bank received a certificate for joining the United Nations Global Compact. The United Nations Global Compact is a strategic policy initiative for businesses that are committed to aligning their operations and strategies with ten universally accepted principles in the areas of
human rights, labor, environment and anti-corruption. With over 8,000 corporate participants and 4,000 other stakeholders, it is the largest voluntary corporate responsibility initiative in the world. The Global Compact Network Lebanon has 37 participants and still growing. By joining the United Nations Global Compact, BLOM BANK committed to incorporate the ten principles in its daily operations and all its strategic decisions.
The Board of Directors exercises its oversight function to a large degree through four dedicated Board Committees: the Board Audit Committee, the Board Risk Management Committee, the Board Consulting Strategy and Corporate Governance Committee and the Board Nomination and Remuneration Committee. The Charters of the four Board Committees are published on the Bank’s Website. Other details related to the Board Committees’ meetings are also available on the Bank’s Website. The Board Committees are fully functional and meet in accordance with their stipulated frequency.
The Board Audit Committee’s responsibility is to monitor and assess the integrity of the Bank’s financial accounting. The Board Audit Committee also assesses the competence of External Auditors as well as the Group Internal Audit Division, in addition to internal controls and compliance with the Bank’s by-laws and internal regulations.
The Board Risk Management Committee periodically reviews and evaluates the Risk Management function of the Group, reviews the adequacy of the Bank’s capital and its allocation within the Group, recommends to the Board the parameters of BLOM BANK’s risk management strategy, monitors the risk profile and oversees inherent risks, reviews the risk limits and reports and makes recommendations to the Board.
The Board Consulting Strategy and Corporate Governance Committee oversees the development of the strategic plan and monitors its progress throughout the Group. It approves and monitors large projects, develops corporate governance policies and practices, and advises the Board on overall business development. It is also responsible for assessing, making recommendations on and approving the Bank’s vision, mission and values, its goals, programs, annual and long term budget and business plan for eventual submission for approval by the Board of Directors.
The Board Nomination and Remuneration Committee provides assistance to the Board in identifying individuals qualified for directorship, nominating competent Board Committees’ members and recommending nominees to the Board of Directors, establishing a succession plan for Board members as well as General Managers, setting remuneration standards for the Bank’s Top management in BLOM BANK and its local subsidiaries in Lebanon and submitting these standards to the Board of Directors, assessing the performance of Top Management and Board of Directors, preparing and submitting the Remuneration Policy and the Remuneration System to the Board of Directors for its approval, supervising
Management Discussion & Analysis 2015
BLOM BANK s.A.L. 74
the proper implementation of the Remuneration Policy, performing a periodic review of the rules/principles based on which the Remuneration Policy is implemented and submitting recommendations to the Board of Directors for amending and updating the Policy.
The Bank in its Corporate Governance Code has established independence criteria for non-executive members of the Board who must constitute a majority of the Board.In April 2015, the General Assembly of shareholders elected a new Board of Directors for a three years mandate (ten members were re-elected and two new members were elected increasing the total number of Board members to twelve with a majority of independent Directors). In their first Board meeting after their election, the Directors have re-elected the current Chairman for a new mandate and have elected new members for the Board Committees to ensure that new Directors are involved in the Committees’ work. The Bank firmly believes in the basic principles of accountability, reporting and transparency throughout the organizational structure. Senior Management exercises the authority delegated to it by the Board through clear and segregated reporting channels, including Management Committees covering all areas of operations. Senior Management also ensures that internal risk and control procedures and structures are overseen by the Group Internal Audit Division, the Group Risk Management Division and the Group Compliance Division. In addition, the Bank is keen on developing its engagement and commitment to social responsibility initiatives and spreading this culture within the Bank. A detailed plan has been elaborated for the coming five years, along with a complete budget forecast for 2016 to be spent on environmental, social, economic and governance-driven initiatives. In the same perspective, a new management committee: the Social Responsibility Committee was established in 2015 and its charter was approved by the Board of Directors. The primary purpose of this committee is to assist the Board of Directors in fulfilling its oversight responsibilities in relation to the Bank’s social responsibility policies and programs, and the Bank’s social responsibility performance.
To strengthen the Board’s oversight function of management, the independent and non-executive Board members meet at least once a year independently from Management and other executive Board members and outside the framework of Board Committees to discuss the various operations and the overall situation of the Bank.
In June 2015, the independent Board members held a meeting and elected among themselves a Director to serve as “Lead Director” for one year. The Lead Director is annually elected by independent Directors and is responsible for leading the Board’s independent Directors to engagement and consensus, ensuring that independent consensus is heard and implemented. The Lead Director coordinates the activities of the other independent Directors, and performs such other duties
and responsibilities as the independent Directors may determine. He also assists the Board in discharging its duties, responsibilities and obligations independently of Management.
In order to assess its areas of strengths and weaknesses, and improve the efficiency and effectiveness of its decision making, the Board of Directors undertakes an annual evaluation of its performance. Board members fill a questionnaire to evaluate the global performance of the Board. Questions focus on topics like: Board Structure and Committees, Board Meetings and Procedures, Strategy Formulation and Effectiveness, Relationship with Management, Board of Directors’ Functions, Succession Planning and Training. The Board can then discuss the outcome of the evaluation in a constructive manner and focus on ways to improve itself. The same exercise is also conducted by the Directors to evaluate the performance of the Chairman.
In order to evaluate the effectiveness of the CEO, the Board of Directors undertakes an annual evaluation of his performance. The CEO as the leading member of Top Management is evaluated on an annual basis by way of questionnaire filled by members of the Board on the basis of various criteria covering: Leadership and Managerial qualities, Communication, Strategy Formulation, Strategy Execution, Judgment and Sensitivity, Financial Planning/ Performance, Relationship with the Board, External Relations, Human Resources Management Relations, Operations Management, Product/ Service Knowledge and Personal Qualities. The outcome of the evaluation will be disclosed to members by the Corporate Secretary.
The Corporate Secretary, appointed by the Board of Directors, is responsible for updating the Bank’s Code of Corporate Governance and its appendices: the Board Committees’ Charters and the Disclosure Policy in compliance with regulations and updates and the international best practices requirements, and ensuring that these changes are approved by the Chairman – General Manager and then approved and signed off by the Bank’s Board of Directors as well as ensuring the proper implementation of the Code at all levels and the compliance of the Bank with its Code. The Corporate Secretary is also responsible to perform several other tasks stated in the Corporate Secretary Charter and the Corporate Governance Code. The Corporate Secretary acts as the Secretary of the Board of Directors and as Secretary for the Board Consulting Strategy and Corporate Governance Committee as well as for the Board Nomination and Remuneration Committee.
The Remuneration policy covers all categories of remunerations and their granting conditions in order to contribute to the enhancement of the Bank’s general long-term performance from both a financial and non-financial standpoint and to achieve the purpose for which those remunerations were granted.The remunerations of all Bank employees can comprise fixed and variable components (cash revenues and other non-monetary incentives). These components are determined based on the different business specifications of the Bank and its scope of work as well
Management Discussion & Analysis 2015
Annual Report 2015 75
as the nature of work of the employees, their levels and their responsibilities. The overall granted remunerations should not affect the financial position of the Bank, its interests, its current or future capacities (in the medium and long terms), its liquidity, its reputation as well as its capital adequacy.
The remuneration of all employees should be based on their performance evaluation. In order to evaluate the performance of all employees in an objective and transparent manner, the written performance appraisal guidelines and the performance appraisal forms should include at least the following elements:. The employee’s commitment to the Risk Management
policies and procedures.. The risks associated with the operations performed by
the employee.. The total revenues or profits generated by the employee
for the Bank, if applicable. . The evaluation of the employee’s individual contribution
to the Bank’s overall performance, if possible.. Other elements according to the nature of the work.
The Bank makes sure that all employees act professionally, ethically and with the utmost integrity in accordance with an established Fraud Policy and Code of Conduct. Additionally, the Bank recognizes the value of its Human Resources as a prime stakeholder in the institution, endeavoring to treat all employees in the most equitable manner. The Human Resources Division has drawn-up a procedure for compliance with the Code of Conduct including the organization of training on annual basis. The Code of Conduct is available on the Bank’s Website. Presentations are given to employees to facilitate their understanding as well as raise their awareness of good corporate governance. These presentations are conducted at entry level and at least every two years to representatives of all branches and business units.In order to implement the policy relating to the Principles of Banking Operations with Customers as stated in the BDL basic circular 134 and the BCC circular 281, the Bank established a new department that was approved by the Board of Directors in June 2015: The Group Customer Advocacy Department. The department shall perform mainly the following tasks:. Contribute to the development of customers’ awareness
and education programs.. Receive claims from customers, to examine them and
give an opinion in this regard.. Inform the customer about the outcome of the claim. . Submit directly to the Senior Management periodic
reports, at least quarterly, about customers’ claims, the nature, handling, and outcome of these claims, and the measures proposed to improve the “Customer Obligations and Rights” (COR) document. The Senior Management must be promptly notified of any major critical claim that might expose the Bank to high reputational risks or significant financial losses; and a copy of these claims must be sent to the Board of Directors.
. Take prior cognizance of the ads, brochures, contract samples, account statements and other documents provided to customers; to review them and submit
the necessary suggestions that guarantee their clarity, transparency and consistency with the provisions of the BDL circular 134 and the relevant regulatory and implementation texts issued by the Central Bank and the Banking Control Commission.
The Bank will continue to develop its Corporate Governance practices as well as its governance structure in line with the latest regulatory requirements and international best practices, while seeking to protect minority shareholders’ rights and enhance stakeholders’ interests from shareholders to employees.
11. Universal Banking Services
In line with its aim of maximizing customer satisfaction and increasing shareholders’ value, BLOM BANK has adopted the policy of diversification of its products and services. BLOM BANK provides the following universal banking services that suit all customers’ needs:
• BLOMINVEST BANK Services• Commercial and Corporate Banking• Retail Banking• Islamic Banking• Insurance Products and Services
11.1 BLOMINVEST BANK Services
BLOM BANK through its investment banking arm, BLOMINVEST BANK, is one of few institutions within the greater Levant region that offer Private banking, Investment banking, Asset Management, Brokerage, Real Estate and Research services under one roof and across the geographical scope of BLOM BANK Group’s operations. Based on its track record, BLOMINVEST BANK to date remains the most awarded local investment bank.
Private Banking ServicesA dedicated team of private bankers optimize the wealth management and financial advisory experience of clients by offering them tailor-made investment instruments that are in line with their risk profile and across an open architecture platform of diverse asset classes.
Investment Banking ServicesA team of investment banking experts offers equity and debt capital markets advisory services to the private and public sector in terms of sovereign placements, private equity, capital raising, and mergers and acquisitions.
Asset Management ServicesAn experienced team of asset managers oversee the entire value chain of fund management business by engineering sustainably performing funds that meet the low-medium risk profile of client demand, in addition to undertaking discretionary portfolio management.
Management Discussion & Analysis 2015
BLOM BANK s.A.L. 76
Brokerage Services A team of skilled traders extend competitive and around the clock execution on global capital markets from fixed income instruments to equities to derivatives to currencies and precious metals with active market- making capabilities.
Research Services A team of economists and analysts provide value-added research and equity coverage across the MENA region by systematically publishing economic and financial information including indices as well as conducting equity analysis on leading regional institutions.
Real Estate ServicesOur Real Estate team has extensive experience in sponsoring, structuring and carefully managing selected real estate projects spanning across retail, commercial and residential markets and across BLOM BANK Group’s presence abroad.
11.2 Commercial and Corporate Banking
A conservative expansion strategy was adopted by BLOM BANK in 2015 by opening new branches in promising areas and countries while maintaining tight control and supervision for all of its credit operations. In this regard, the Bank’s portfolio maintained its stable increase at both the corporate and the SME levels, benefiting from the availability of high liquidity and wide range of credit products tailored to satisfy customer needs at all destinations, whilst restricting doubtful debts to the lowest possible level.
Subsidized and Soft loansUpon Central Bank extension of its several incentive schemes, BLOM BANK continued to take advantage of stated schemes by offering privileged products to its customers operating in different sectors of the economy. Focus was made on environmental friendly products as well as channeling funds to startup businesses to maintain its commitment towards corporate social responsibility.
Arab Trade Finance Program (ATFP)During 2015, BLOM BANK strengthened its relationship with Arab Trade Finance Program that was reflected in increasing the line of credits allocated to traders by almost 50% from the previous year. Such line of facilities was granted at similar favorable terms and conditions, that allowed for additional benefits to Lebanese traders and contributed to enhancing Inter-Arab Trade.
SME Relationship DepartmentIn 2015, the SME Relationship Department witnessed a remarkable presence in the Lebanese market building up on its experience and the Bank’s strong geographic distribution and reputation.
Corporate Financing and Syndicated Loans BLOM BANK’s Corporate Department strengthened its management on existing portfolio of corporate and syndicated facilities, while aggressively targeting new corporate clients with sophisticated financing tools tailored to meet different needs in the Lebanese economy and abroad.
Islamic FinancingBLOM BANK enhanced its presence in the Islamic banking market in Lebanon building up on its previous experience and its wide network of Groups’ branches by offering preferential Islamic products and services compliant with Islamic Shariaa.
Overseas FinancingDespite the challenging conditions prevailing at many overseas market especially in the Arab region, BLOM BANK succeeded to increase its presence in well operating markets while maintaining effective control and supervision in all markets. During 2015 the Bank expanded its regional presence in Baghdad and Erbil offering its wide banking services to its clients with current and potential business activities in these markets. Moreover, the Egyptian market contributed remarkably to the Bank’s credit portfolio benefiting from the political and economic stability in the country.
In conclusion, BLOM Group was successfully able to mitigate all challenges facing its credit portfolio locally and abroad while further developing its portfolio building up on its sound lending and control policies, in addition to maintaining its high contribution to the development of the Lebanese and Arab Economies.
11.3 Retail Banking
In 2015, BLOM BANK collaborated with strategic partners and developed its portfolio of existing payment cards, upgraded its reward programs and introduced innovative services. Payment cardsBLOM BANK offers a wide range of payment cards that target different customers, provide different methods of payments and meet different purposes. These cards vary in type and in currency. The segmentation of cards takes into consideration the various types of customers and their card needs: debit, charge, credit and prepaid. As such, BLOM cards are under both brands: Visa and MasterCard; and range between Electronic, Classic, Gold, Titanium, Platinum, Signature, Infinite, and Corporate (Business Platinum, Platinum Corporate, and Classic Corporate cards).
In August 2015, BLOM BANK introduced the world’s first of its kind UberBLOM Visa prepaid card in collaboration with Uber, the San Francisco-based
Management Discussion & Analysis 2015
Annual Report 2015 77
technology company. UberBLOM Visa card was developed exclusively for Uber riders, and can be used for Uber rides in Beirut or any of the 330+ cities Uber is currently present in. All first-time Uber riders who purchase the UberBLOM card will be entitled to enjoy the first 2 rides for free up to USD10 each. The card was chosen as a finalist in the EFMA-Accenture ‘Distribution and Marketing Innovation Awards 2015’ under the category of ‘Best Innovation in Payment’.
Additionally, another collaboration took place in 2015 featuring the launching of Beirut Circle Visa Platinum Card. Beirut Circle Visa Platinum cardholders receive various “buy 2 for the price of 1” offers when paying with their cards. The card can be used for purchases in Lebanon or abroad with a revolving credit limit. Cardholders will also benefit from the opportunity to accumulate BLOM Golden Points with every USD 1 they spend and redeem them for items of their choice at selected merchant stores.
Moreover, BLOM BANK has partnered with Fitness Zone, the leading fitness centers in Lebanon, to introduce Fitness Zone Visa card which is available in two types: Fitness Zone Visa Platinum and Fitness Zone Visa Prepaid card. This card is the first-of-its kind in CEMEA as it is at the same time the membership card for Fitness Zone through the use of Mifare technology and can be used for purchases around the world.
During 2015, and in reply to the demanding market needs, BLOM BANK has enabled all of its cards (except for electron) for internet usage with predefined internet limits. To guarantee maximum safety and empower users to control their cards’ internet limits, the cardholders have the ability to manage these limits easily through eBLOM.
In addition to the above innovations launched in 2015, BLOM BANK takes pride in the BLOM MasterCard Giving cards, launched in 2010, one of Lebanon’s most innovative affinity cards, a first of its kind program in the world. In collaboration with the Lebanese Mine Action Center, a unit in the Lebanese Army, the BLOM Giving cards assist in the removal of mines and cluster bombs from the Lebanese territories. The program offers a Gold MasterCard or a Titanium MasterCard, which combine the benefits of a credit card, with the ability to donate to the LMAC, which is in charge of demining the Lebanese territory, spreading awareness
in the minefields’ surroundings and caring for those who are injured due to mines. Donations are made whenever BLOM MasterCard Giving cardholders pay the card’s annual fee and whenever they use their cards for purchases or for cash withdrawals.
BLOM BANK also offers BLOM Shabeb credit cards, free for students of predetermined universities. The BLOM Shabeb Program (www.blomshabeb.com) is a comprehensive platform launched in 2010 that helps the Lebanese young generation plan their education and facilitate their career choice to ensure a successful future.
Launched in 2013 in partnership with the Beirut Traders Association, The Beirut Traders Shopping card is a groundbreaking program granting its users unsurpassed exclusive discounts from over 1,000 merchants in Beirut and surrounding areas, making it the largest network of deals in Lebanon. With LeMall joining the program in 2014, cardholders can benefit from 3 points with every USD 1 spent at any of the merchants available at LeMall Dbayeh, Sin El Fil; in addition to 1 point with every USD 1 spent anywhere else in the world.
BLOM BANK and AROPE Insurance introduced the All-New and unique in its category for the Insurance sector, AROPE SIGNATURE Credit Card from VISA. The card is loaded with unsurpassed exclusive benefits and discounts. AROPE Signature cardholders benefit from exclusive offers associated with the card, in addition to a special double rewards program where cardholders get 4 Golden Points or 2 Golden Miles for every USD 1 spent at AROPE Insurance, and 2 Golden Miles or 1 Golden Point for every USD 1 spent elsewhere.
In addition to the various cards launched in the previous years, BLOM BANK is proud of the partnerships it has developed along the years with the two telecommunications operators in Lebanon, Alfa and Touch, granting users free instant talk time of the mobile lines: the Touch Visa cards (Touch Visa Platinum and Touch Visa Gold cards for post-paid touch line users and the Touch Visa Gold card for pre-paid touch lines users); the Alfa BLOM cards introduced in 2007 (Alfa BLOM Corporate card, Alfa BLOM Titanium and Alfa BLOM Gold card for post-paid lines users, Alfa BLOM Classic card for pre-paid Alfa lines) in addition to the Contactless Alfa Titanium card.
Management Discussion & Analysis 2015
BLOM BANK s.A.L. 78
Additionally, BLOM BANK offers the Khoury Home Visa cards, specially designed for the distinguished customers of Khoury Home, combining the benefits of holding a Visa credit card and the rewards for enrolling in Khoury Home loyalty program. The card offers a repayment method allowing cardholders to settle their purchased item in equal monthly installments.
Moreover, the Bank has a dedicated Internet card, a Platinum Euro card for those who visit Europe frequently, and prepaid cards “mini” for those wishing to have a card without opening an account. BLOM BANK also has “Watan”, a card which was launched solely for the Lebanese army, internal security and national security forces.
In addition to the above, BLOM BANK offers the “Personalize your card” service whereby cardholders can add on the front of their card a personal image of their choice or an image from BLOM BANK’s Image Library.
POS MachinesBLOM BANK’s Point of Sale (POS) machines accept payment cards under the brands of Visa, Visa Electron, MasterCard, MasterCard Electronic, Maestro, and JCB. The machines are equipped with the latest EMV technology to allow acceptance of chip cards that provide ultimate security to both the cardholder and the merchant. BLOM BANK’s POS machines are also NFC-enabled for contactless cards and mobile device payments. All BLOM BANK’s POS machines accept dual currencies (USD and LL).
BLOM BANK’s POS machines also offer the choice for international cardholders to pay in their home currency through the Dynamic Currency Conversion feature whereby any international cardholder can choose whether to pay using their card’s currency or the local currency after knowing the exact amount of their purchase in their home currency.
BLOM BANK provides merchants with a next day settlement of the transaction amount, with a one day value date as of the settlement of the amounts. BLOM BANK also dedicates an account manager to handle all inquiries and suggestions concerning POS issues. In addition, BLOM BANK puts at its merchants’ disposal a 24 hour call center which is tailored to cater for all needs and to provide all the needed support.
BLOM BANK’s POS machines have been upgraded to accept instant redemption for Golden Points and Golden Miles (this service is applicable only to selected merchants that are part of BLOM Golden Points program). Cardholders can instantly pay for their airline tickets or chosen gift via their accumulated miles and points.
Merchants in Lebanon wishing to install BLOM POS machines have a choice between:
Dial-up MachinesThese machines are easy to install and use, and require a fixed telephone line to setup the connection.
GPRS MachinesThe GPRS machines are wireless, do not require cables connection and operate with a SIM card that is provided by BLOM BANK. These machines are portable, allowing merchants to move them anywhere they desire.
Ethernet/Internet MachinesEthernet POS machines offer faster connections than the conventional types of POS machines and eliminate the use of another phone line just for doing point-of-sale transactions. This provides significant savings for multi-terminal operations, such as those used by bigger retail stores.
eCommerce SolutionBLOM BANK offers a secure online payment gateway (e-commerce solution) with the latest and most advanced technology that ensures ultimate security and peace of mind. With this top notch electronic payment solution, merchants get an end-to-end e-commerce website that processes online payments. The gateway is hosted by CyberSource, the world’s first payment management company (part of VISA).
Reward ProgramsThe BLOM Golden Points Loyalty program enables customers to accumulate Points and Miles with every USD 1 spent using their card. Cardholders may redeem their points for valuable gifts such as free stays at the finest hotels, fragrances, electronics, and much more. Miles are redeemable for airline tickets to the destination of their choice, and on the carrier they desire.
A Shift towards DigitalAfter the success of introducing a groundbreaking service that allowed cardholders to redeem their miles and points instantly via the merchant’s POS machine, BLOM BANK has shifted its strategy towards the digital direction, and replaced the printed catalogue by developing a dedicated mobile application and website. BLOM BANK has enhanced the Golden Points website and application whereby BLOM clients can now check the exclusive Visa offers and discounts that they can benefit from when using their BLOM Visa at selected merchants. All offers are available on www.blomgoldenpoints.com
Management Discussion & Analysis 2015
Annual Report 2015 79
Instant Redemption of BTA PointsIn June 2015, BLOM BANK has launched a new campaign pertaining to Beirut Traders Shopping card loyalty program. Beirut Traders Shopping cardholders accumulate BTA points every time they use their card and now they can instantly redeem them at any participating merchant for any item of their choice, without the need for a voucher. Accumulated points can be exchanged instantly for a gift of their choice from over 1,000 merchants in Lebanon.
Retail LoansBLOM BANK’s customers can take advantage of a number of loans to satisfy their various needs. The available loans are: student loans in cooperation with the American University of Beirut and other institutions; consumer loans in association with a number of leading retailers in Lebanon; solar loans in association with numerous local companies that offer solar system installations.Clients can also apply for a personal loan with Kardi, a car loan with Sayarati, or a housing loan with Darati.
SME LoansSmall-and-medium enterprises or even self-employed or business owners can benefit from a variety of loans tailored for their needs:
Small Business Loan for SMEs (ESFD)A special program offered in coordination with the European Social Fund for Development, this loan grants individuals, financial institutions or companies that operate in Lebanon to finance the launching of a new project or the expansion of an existing one.
Business LoanBLOM BANK’s Business loan - Maktabi is suitable for clients who wish to buy, expand or refurbish their office, convenience store, warehouse, clinic etc. The loan is offered in USD and clients can get a preliminary approval within 48 hours from the application date.
KAFALATBLOM BANK’s Kafalat loan is convenient for individuals who want to finance the startup of their new project or the expansion for their business in one of the following sectors: industry, agriculture, tourism, craftsmanship or specialized techniques. Kafalat loan is subsidized by the Central Bank.
Bancassurance ServicesAROPE Insurance, BLOM BANK’s subsidiary, offers all kinds of insurance services from personal accident, to health, to fire, to car insurance and so on. BLOM BANK also offers investment programs coupled with a life insurance policy in collaboration with Arope Insurance.
A successful line of savings/insurance plans is also on offer; DAMANATI Plus, a retirement plan coupled with life insurance and WALADI Plus, a child’s education program, coupled with life insurance.
Investment ProductsBLOM BANK offers a collection of investment products to help manage one’s finances in a better, safer and more profitable way. Accordingly, BLOM BANK, in collaboration with BLOMINVEST BANK, offers a collection of Mutual Funds.
Special AccountsBLOM BANK offers a number of special accounts, catered for special needs. In addition to “Maksabi”, and the traditional savings and current accounts, below are other special accounts from BLOM BANK:
Full Option AccountBLOM BANK introduced an account to help clients benefit from flexibility, convenience, and liquidity. The Full Option Account will be given with every loan or salary domiciliation, granting clients services and benefits designed to make their banking journey a rewarding one. The Full Option Account is coupled with an overdraft that provides clients with even more flexibility in addition to a free Visa Debit Classic card and 2,000 bonus Golden Points.
Oumnyati AccountThe ‘Oumnyati’ savings account is another extension of BLOM BANK’s peace of mind designed to provide clients with interest on small amounts of money. ‘Oumnyati’ is a time deposit account that allows saving for a brighter future from as low as USD 50 or LL 75,000 per month.
Salary Domiciliation accountsBLOM BANK’s Salary Domiciliation Account is the ideal solution for both employers and employees to make the most out of their salary. Clients opening a salary domiciliation account receive many banking facilities including credit cards with nine times worth their salary, personal loans and much more.
Account PlusThree types of bundled accounts that offer the client current accounts with various services for a monthly fee: Account Plus Classic, Account Plus Gold and Account Plus Platinum.
Wedding AccountClients opening a Wedding Account benefit from personalized debit cards, a preapproved credit card, along with exclusive offers that are related to that Special Day, and created to save up on all wedding expenses.
Management Discussion & Analysis 2015
BLOM BANK s.A.L. 80
Customer Service
Live Chat through eBLOMIn 2015, BLOM BANK launched another first of its kind: Live chatting from the eBLOM internet and mobile banking. Real-time banking assistance is accessible through BLOM BANK’s Live Chat Support service 24/7. Clients can instantly chat with a representative from the Bank, from anywhere in the world.
Bills Payment through eBLOMIn line with its continuous strategy to enhance and develop its digital platforms, BLOM BANK also launched in 2015 a new feature exclusively on eBLOM, the mobile application. This new feature allows clients to settle payments for several institutions, universities and schools at any time via the eBLOM mobile application or through www.blombank.mobi. Through a simple click of a button, eBLOM users can now settle hassle-free many of their bills and utilities.
Instant Check CashingOne of the latest ATM technology innovations has been introduced by BLOM BANK during 2015: BLOM clients can deposit a BLOM check at the nearest BLOM ATM Pro and cash it on the spot.
Mobile BankingThe Mobile Banking service is a member of the eBLOM suite of electronic services and delivery channels and is a completely optimized service for mobile and devices which puts at the client’s disposal a wide range of online banking services. Just by getting connected, BLOM BANK customers can manage their accounts and cards on a real-time, fast and secure bases, along with access to unique features that are constantly updated.
BLOM eCashThe BLOM eCash service offers customers the possibility of making transfers to any person without the need for a bank account. The transfer is initiated by the customer through his eBLOM account on his PC or mobile and the funds are withdrawn by the recipient from any BLOM ATM without a card.
Mobile Recharge - Alfa and TouchThis new service allows eBLOM users to recharge any Alfa or Touch prepaid line instantly from their mobile phones or any internet-connected device, from wherever they are and at the time that best suits them without any additional cost.
Call CenterBLOM BANK customers can enjoy the convenience of a 24-hour call center, ready to cater for all their needs and inquiries. The Retail Department also has a
telemarketing team to make outbound informative calls to existing clients. The Call Center’s monitoring system has been upgraded for a better examination and control: Fraud Monitor System, and ATM Monitor System.
E-BankingBLOM BANK offers its customers phone banking services such as “Allô BLOM” (a 24-hour customer service) as well as internet banking services such as e-BLOM. This service allows users to complete many of their routine banking transactions in the comfort of their home/office. The client may even apply for a card, issue a prepaid card, or even perform outgoing transfers.
SMS Alert ServiceThe Bank provides a convenient SMS ALERT service, enabling customers to receive alerts whenever the balance of accounts changes or whenever a transaction is being performed.
Social Media PlatformsThe BLOM Retail page on Facebook features constant updates about the latest promotions and the various products and services launched by the Bank. The page currently has more than 180,000 fans and is considered one of the most successful pages on Facebook-Lebanon. BLOM Retail has established its presence on Twitter in 2013 handling on-the-spot inquiries and customer feedback. The account currently has 1,800 followers. BLOM Retail also has a YouTube channel that features BLOM BANK’s TVC’s and TV releases.
Public WebsiteBLOM Retail products and services enjoy an independent, user-friendly website where users can make use of simulators and of online applications through: www.blomretail.com. BLOM BANK developed a friendly, easy-to-use mobile version of the public website compatible with all smartphones in the market.
Mobile Applications
eBLOM Mobile Banking ApplicationEarly in 2015, BLOM BANK introduced its mobile banking application, eBLOM mobile application, available on both iOS and Android. Clients were previously able to do their online banking on their mobile phones through the mobile version of eBLOM (www.blombank.mobi); however, the development of the new mobile application allows clients to get access to their accounts and cards in an easier and more convenient manner.
Golden Points/Miles and BLOM BTA Mobile ApplicationsIn the previous years, BLOM BANK developed two mobile applications available on both iOS and Android.
Management Discussion & Analysis 2015
Annual Report 2015 81
The first application is the BLOM Golden Points/ Miles mobile application. This application helps cardholders choose their gifts in an easy and simple way depending on the number of points that they have; the result can be filtered by category, keyword, and merchant. The second application is the BLOM BTA mobile application, which is exclusively for clients that hold the Beirut Traders Shopping card. The BLOM BTA mobile application guide clients through the largest network of deals in Lebanon with hundreds of offers that they can choose from. Once clients download the application they will receive notifications whenever they are near a participating merchant, and they can also get details and directions to a certain retailor.
11.4 Islamic Banking
Islamic Banking in Lebanon has continued to be challenged by the inadequate awareness of its presence, as well as the inappropriate legal framework covering its operations.The current institutional framework which is structured to support the conventional banking system continued to prevail. As such, the Islamic Banking share out of the total Lebanese banking sector has remained stagnant at its current level of less than 1%.
During 2015 Islamic Banks in Lebanon witnessed zero growth in its total footings, as compared to almost 6% growth in the overall Lebanese banking sector. Despite that, BLOM Development Bank (BDB) was able to gain more market share and hence achieve a growth in its total assets of 14% versus 13% during the year 2014, and a growth in its client’s deposits of 18% versus 15% during the year 2014.
BDB continued its endeavors to implement new products, matching those being exclusively offered by conventional banks, including but not limited to the Sharia-compliant soft house financing offered in collaboration with the Central Bank of Lebanon, noting that this product has reached its final phase and is expected to be presented to clients during the first half of the year 2016.
11.5 Insurance Products & Services
Established in 1974, AROPE Insurance is today one of the major players in Lebanon’s insurance industry. Since its foundation, AROPE has maintained continuous growth and sustained development, backed by BLOM BANK’s solid financial background and its excellent track of good reputation and credibility. In 2006, AROPE started its geographic expansion to inaugurate the first regional subsidiary, Syria International Insurance S.A. (AROPE Syria). And in 2009, AROPE founded two
companies in Egypt: AROPE Life Insurance S.A.E. and AROPE Insurance for Properties and Liabilities S.A.E.
Operating in all lines of insurance, AROPE is committed to providing the finest services to its partners and customers while offering comprehensive solutions shaped to satisfy all customers’ requirements, and include:
Life and Personal Accident Insurance Healthcare InsuranceMotor InsuranceMarine InsuranceProperty InsuranceLiabilities InsuranceTakaful Window (offered in Lebanon only)Micro-Insurance
In terms of consolidated results for 2015, and despite the unstable regional situation, AROPE Lebanon and its Regional Subsidiaries scored USD 108.9 million of Gross Premium, a Net Profit after Tax of USD 19 million, and a Shareholders’ Equity reaching USD 124.5 million.
As a pioneer innovator in its field, AROPE launched in September 2015 the first Life Micro-Insurance Plan via mobile in Lebanon and the region, “Allo…Hayete”, in partnership with InMobiles and in collaboration with Alfa and Touch. “Allo…Hayete” is offered exclusively in Lebanon for people wishing to benefit from a life insurance worth LBP 5,000,000 at a very adequate cost of USD 3/month only, covering Death resulting from Sickness, Accident, Passive War and Terrorism. The service allows fixed and prepaid line owners aged between 18 and 60 to join regardless of their nationality, provided their residence in Lebanon is permanent and legitimate.
Thanks to “Allo…Hayete”, AROPE was shortlisted for two International awards “Insurer of the year” by MENA Insurance Review in Dubai and “Industry Innovation” by Continuity Insurance and Risks in London.
12. Information Systems and Technology
Powerful forces such as changing customer expectations, regulatory requirements, demographics and economics are reshaping the banking industry. Also, technology continues to heavily influence the banking industry with trends such as social networking, mobile, cloud computing and the internet of things which can be perceived, on one hand, as disruptions and, on the other hand, as opportunities for banks nowadays.
Management Discussion & Analysis 2015
BLOM BANK s.A.L. 82
Our experience at BLOM BANK portrays the fact that, by having the right technology mix, we are able to run our business in a conventional way, while continuing to support the traditional branch delivery channel, and at the same time, to make it evolve and to progressively embrace the new technology trends and fulfill customer demands and expectations across different markets in the region while optimizing costs and increasing revenues.
Hence, the underlying principle that defines the outlook of the Information Systems Division for the future is to provide the bank’s clients with a portfolio of products and services built around the “Easy Technology” slogan. This position is at the very core of our commitment to provide our clients with rich digital experiences, built around the omnichannel banking trend, thus providing innovative products and services offerings.
Expand Digital Banking Services in the EMEA Region while Optimizing CostsAt the core of the Information Systems and Technology strategy is the support of BLOM BANK GROUP strategy, which is based on measured regional expansion to markets with strong potential and on the continuous modernization and diversification of its universal banking services.
At BLOM BANK, we pride ourselves on delivering the best and most comprehensive and integrated digital experience to our customers and we will continue to build on top of our current achievements in order to further enhance our competitiveness and our innovative edge among Lebanese and regional banks. Hence, and in order to advance the expansion of our market share in Lebanon and the EMEA (Europe, Middle East and Africa) region, our strategy is to embrace the digital banking trend without compromising on data availability or efficiency, and to provide innovative products and services to customers by staying at the forefront of technology.
Moreover, the continued investments that we are making in digital technologies are a key contributor towards higher efficiency, driving our costs savings and thus contributing towards achieving a cost-to-income ratio (CI ratio) among the lowest when compared to peer players in the banking and financial services industry. Hence, the IT investments that we make are usually well balanced despite the fact that in the banking industry, in general, the banks’ IT costs are about twice the average across all other industries, and that the IT spending as a percent of total costs is also the highest in the banking sector when compared to other fields.
Embrace the Omnichannel Banking TrendThe current Internet of Things revolution, with its proliferation of connected devices, is opening up new context information and new channels for banks that are now operating in a challenging world of rapid technological change, technology-savvy customers, and increasing expectations. So the demand for digital is now globally pervasive, especially among Generation Y - the ‘digital natives’ born between the years 1982 and 2000 – who naturally expect a rich digital experience that is both mobile and social, and seamlessly integrates their banking needs with their digital lives.
Along these lines, BLOM BANK has embraced the omnichannel banking trend which includes tighter integration between core and channel systems than is typically seen in multichannel banking, in order to extend our reach to customers not only within a channel but across channels so as to allow simultaneous access to all channels immediately and in real time.
To achieve this goal and to progressively evolve towards an omnichannel banking experience, BLOM BANK has invested in a Core Banking Application that is built around a middleware which centralizes customer data and interactions thus driving efficiency, productivity and speed to market. Moreover, middleware systems facilitate consistent cross-channel messaging and functionality through a Service Oriented Architecture (SOA) which enables us to use the same services across all channels thus optimizing costs. Our middleware system is enabling us to achieve a more streamlined integration across systems and with business partners, in addition to seamless interactions across channels including the traditional and digital channels.
By using this strategy, BLOM BANK is being able to offer the most complete portfolio of technology-enabled products and services which is a superset of those offered by banks at the local and regional levels, and this has allowed us to achieve several awards from many renowned institutions for being the “Best Bank in Lebanon”, the “Most Innovative Bank in the Middle East” and the “World’s Best Consumer Digital Bank in Lebanon”.
Finally, and as part of our omnichannel support strategy, we have been improving our portable customer/prospect engagement touchpoint - which has enabled us to expand the reach of our loan origination workflow systems along with other business processes outside the physical premises of our traditional branches - in order to provide our customers or potential customers with a more engaging, welcoming, and informative banking experience.
Provide a Platform for InnovationTechnology-based innovative products and services are becoming increasingly essential to achieve product differentiation and institutional growth in an ever-changing competitive environment. At BLOM BANK, we
Management Discussion & Analysis 2015

Annual Report 2015 83
believe that nurturing innovation starts by challenging the status-quo, and by daring a radical shift from the “business as usual” paradigm, supported by a long-term vision and coupled with audacious yet measurable interim goals.
Along these lines, the Information Systems Division team works closely with all business-centric divisions at the bank and enters into strategic partnerships with telecom operators, retailers as well as with national and international payment systems and networks, in order to offer innovative technology-driven products and services. In addition we are keen on having our innovation taskforce at a constant technology and market dynamics watch, as well as on attracting and training talent who are capable of implementing new and innovative technologies.
Examples of recent cross-departmental projects and initiatives which succeeded in introducing, in a record time, innovative and pioneering products and services to our customers and prospects include:• The “Instant Recharge for Touch/Alfa Prepaid Lines”
service which allows customers to recharge their Touch/Alfa GSM prepaid lines, on a real-time basis, from their smartphones via our eBlom Internet/Mobile Banking service
• The “Instant Cheque Cashing” service which is the first of its kind service allowing customers to cash their cheques, in pseudo real-time, as soon as they deposit cheques drawn on BLOM Bank at our Cash and Cheque Deposit ATMs, instead of waiting for the normal cheque clearing procedure which normally takes 1-2 business days
• The “PayPass/NFC Payment Cards” enabling customers to simply tap the card and go without the need to swipe the card
• The “Credit Cards for Touch/Alfa Prepaid Lines” service which grants, on a real-time basis, GSM prepaid lines with talk time as soon as the card is used
• The “Golden Points/Miles Instant POS Redemption” allowing customers to instantly redeem their golden points/miles while at the merchants’ premises
• The “BLOM eCASH” service allowing for person-to-person payments using card-less ATM transactions
• The BLOM BTA card offering special rewards based on customer behavior geo-targeting
With the proliferation of smart phones, tablets and increasing technological innovation, most customers prefer to communicate and transact through their smart phones and other hand held devices. To cater to these savvy customers, BLOM BANK will continue to enhance its eBLOM Mobile Banking Application to stay connected to its customers by embracing mobile payments and other innovative offerings.
In addition, our innovative efforts will encompass the introduction of innovative Visa and MasterCard payment cards, and the introduction of new features on our POS machines at merchants across Lebanon thus expanding our point-of-sale acquiring business. Moreover, we shall keep on watching the market and technology dynamics in relation to new entrants in the area of mobile payments such as Apple Pay, Google/Android/Samsung Pay and others in order to position BLOM BANK within the newest mobile payment trends.
Finally, we will continue to enter into strategic partnerships with software vendors in order to adopt innovative solutions such as cloud-based human capital management solutions.
Maintain a Resilient, Agile and Secure Information Systems InfrastructureSince we are committed to achieve a modular information systems architecture linking business processes with IT capabilities in a way that dramatically increases agility and reliability, we have designed an optimal, robust and stable information systems backbone for our mission- critical applications, which can evolve with proven technology innovations while optimizing costs.
In addition, our information systems infrastructure supporting private cloud services will allow us to scale up our services way quicker, and to provision IT resources with exceptional speed and flexibility while at the same time cutting costs, saving energy, improving services reliability and increasing end-users productivity.
Moreover, the high degree of modularity and componentization of our information systems infrastructure will continue to allow us to quickly introduce new and/or innovative products to our customers across multiple channels, thus competing in today’s whirling digital era without compromising on service quality or limiting our agility as an organization.
Also, BLOM BANK shall keep on improving its IT Infrastructure reliability and high availability through servers’ virtualization and consolidation, enterprise storage consolidation and desktop virtualization while following the Green IT trend.
To be noted that by investing in state-of-the-art data centers, disaster recovery sites and data protection technologies, BLOM BANK will continue to provide a comprehensive, resilient and modernized technical infrastructure with “right-sized” data center and business continuity capabilities. In fact, these facilities would ensure higher availability and protect the bank’s information systems and data assets from losses in case of an unforeseen disaster. Along these lines, it is
Management Discussion & Analysis 2015
BLOM BANK s.A.L. 84
worth mentioning that BLOM BANK has implemented a three-site data center replication setup, which links the bank’s primary, high availability and remote disaster recovery data centers, and this implementation has been supported by IBM Lab Services. To be noted that, as a result of this achievement and since this set-up was the first of its kind in Lebanon, IBM has enlisted BLOMBANK as an IBM reference.
Address Security, Regulatory and Compliance Challenges
Since BLOM BANK is operating in a highly regulated industry, we will continue to address security and regulatory challenges which are introduced at an unprecedented pace. As such, BLOM BANK shall continue to address compliance, reporting and data analytics requirements, through the usage of state-of-the-art systems based on specialized data marts and analytics and reporting software aimed at fulfilling regulatory and reporting requirements. In addition, BLOM BANK will keep on building credit scorecards by integrating to the loan origination workflow a credit scoring system for loans based on advanced scoring models.
Furthermore, BLOM BANK will keep on reaping the benefits of its online card fraud-monitoring system which has drastically reduced fraud losses and incidents, and which is capable of sending real-time alerts to the bank’s call center agents thus enabling immediate action and insight, as well as reporting and tracking, should a fraud pattern be detected.
Moreover, BLOMBANK will continue to put in place the information systems and related controls to allow for the compliance, for example, with the U.S. FATCA and with the upcoming IFRS 9 regulations.
In addition, BLOM BANK will continue to develop the needed Information Systems and related policies and procedures in order to comply with the Payment Card Industry Data Security Standard (PCI DSS). To be noted that we have succeeded in 2015 in obtaining the PCI Certificate of Compliance at BLOM BANK Jordan against the PCI DSS v.3.0.
It is also worth mentioning that customers expect tight security measures when digitally interacting with their banks, and that they expect to have the ability to use single sign-on credentials when interacting with the bank’s various digital channels. Hence, BLOM BANK has adopted a channel-agnostic, multifactor authentication process so as to strongly authenticate customers on various channels.
13. People Development
13.1 General Overview
BLOM BANK recognizes that its human capital is its most valuable asset. Through their efforts, employees continue to maintain and improve the Bank’s status as a major player in the regional financial markets.
People at BLOM BANK are treated with the utmost respect in a culture that strives on fairness, ethics, and transparency. Hiring, advancement, compensation, training, and other privileges of employment are handled according to set standards and procedures. BLOM BANK prohibits discrimination of any type, and offers equal opportunities to all its employees without regard to sex, religion, ethnical background, age, or disability.
In turn, employees are expected to comply with various policies concerning safety, information security, fraud, code of conduct, etc. They are also expected to adhere to the highest standards of ethical behavior in terms of confidentiality, professionalism, transparency, and integrity.
BLOM BANK continues to pride itself on its employees’ high level of education where at the end of 2015, 80.47% of employees held a university degree, professional certification, or higher education degree. Also, the average age of employees was 34.62 years old which is quite young for our industry.
Management Discussion & Analysis 2015
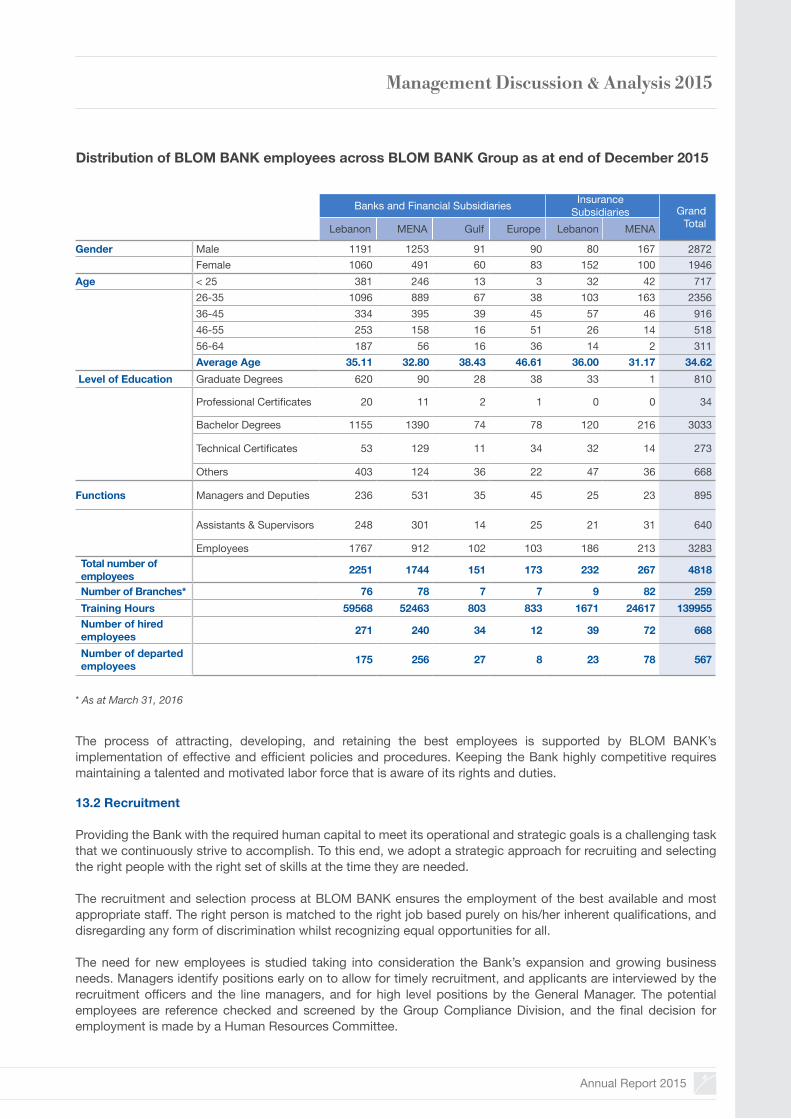
Annual Report 2015 85
The process of attracting, developing, and retaining the best employees is supported by BLOM BANK’s implementation of effective and efficient policies and procedures. Keeping the Bank highly competitive requires maintaining a talented and motivated labor force that is aware of its rights and duties.
13.2 Recruitment
Providing the Bank with the required human capital to meet its operational and strategic goals is a challenging task that we continuously strive to accomplish. To this end, we adopt a strategic approach for recruiting and selecting the right people with the right set of skills at the time they are needed.
The recruitment and selection process at BLOM BANK ensures the employment of the best available and most appropriate staff. The right person is matched to the right job based purely on his/her inherent qualifications, and disregarding any form of discrimination whilst recognizing equal opportunities for all.
The need for new employees is studied taking into consideration the Bank’s expansion and growing business needs. Managers identify positions early on to allow for timely recruitment, and applicants are interviewed by the recruitment officers and the line managers, and for high level positions by the General Manager. The potential employees are reference checked and screened by the Group Compliance Division, and the final decision for employment is made by a Human Resources Committee.
Banks and Financial Subsidiaries Insurance Subsidiaries Grand
TotalLebanon MENA Gulf Europe Lebanon MENA
Gender Male 1191 1253 91 90 80 167 2872Female 1060 491 60 83 152 100 1946
Age < 25 381 246 13 3 32 42 71726-35 1096 889 67 38 103 163 235636-45 334 395 39 45 57 46 91646-55 253 158 16 51 26 14 51856-64 187 56 16 36 14 2 311Average Age 35.11 32.80 38.43 46.61 36.00 31.17 34.62
Level of Education Graduate Degrees 620 90 28 38 33 1 810
Professional Certificates 20 11 2 1 0 0 34
Bachelor Degrees 1155 1390 74 78 120 216 3033
Technical Certificates 53 129 11 34 32 14 273
Others 403 124 36 22 47 36 668
Functions Managers and Deputies 236 531 35 45 25 23 895
Assistants & Supervisors 248 301 14 25 21 31 640
Employees 1767 912 102 103 186 213 3283Total number of employees 2251 1744 151 173 232 267 4818
Number of Branches* 76 78 7 7 9 82 259Training Hours 59568 52463 803 833 1671 24617 139955Number of hired employees 271 240 34 12 39 72 668
Number of departed employees 175 256 27 8 23 78 567
Distribution of BLOM BANK employees across BLOM BANK Group as at end of December 2015
Management Discussion & Analysis 2015
* As at March 31, 2016
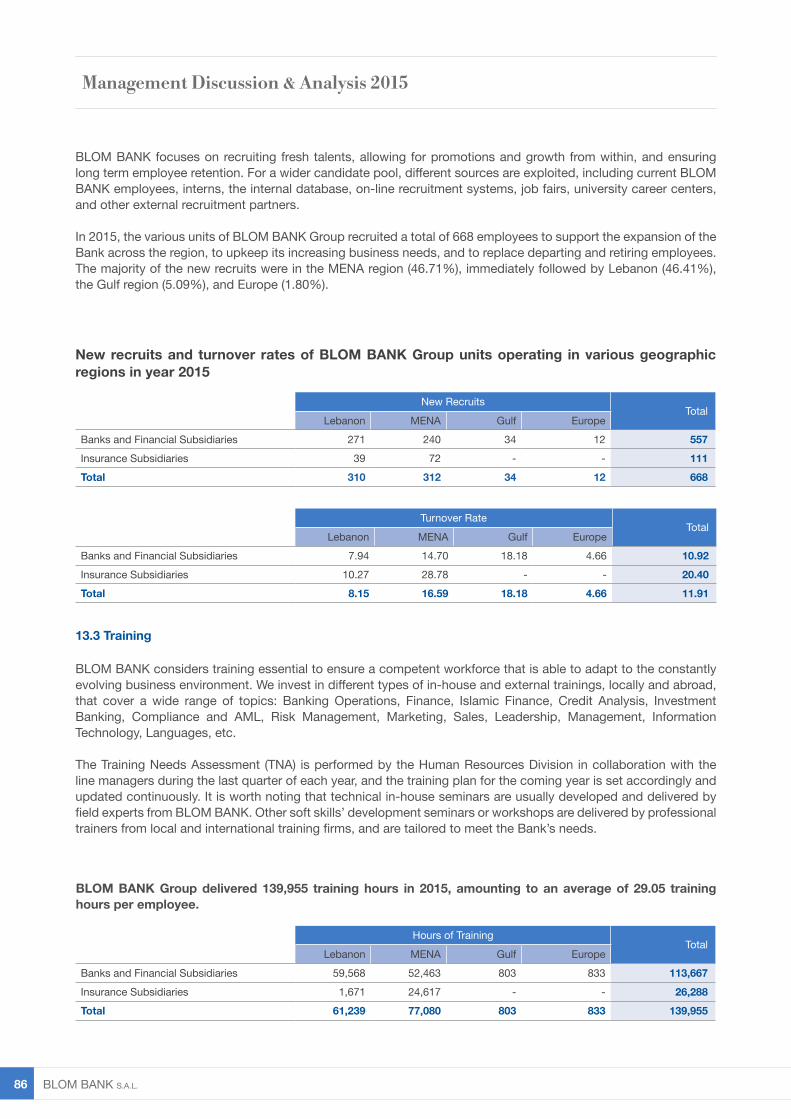
BLOM BANK s.A.L. 86
BLOM BANK Group delivered 139,955 training hours in 2015, amounting to an average of 29.05 training hours per employee.
13.3 Training
BLOM BANK considers training essential to ensure a competent workforce that is able to adapt to the constantly evolving business environment. We invest in different types of in-house and external trainings, locally and abroad, that cover a wide range of topics: Banking Operations, Finance, Islamic Finance, Credit Analysis, Investment Banking, Compliance and AML, Risk Management, Marketing, Sales, Leadership, Management, Information Technology, Languages, etc.
The Training Needs Assessment (TNA) is performed by the Human Resources Division in collaboration with the line managers during the last quarter of each year, and the training plan for the coming year is set accordingly and updated continuously. It is worth noting that technical in-house seminars are usually developed and delivered by field experts from BLOM BANK. Other soft skills’ development seminars or workshops are delivered by professional trainers from local and international training firms, and are tailored to meet the Bank’s needs.
Hours of TrainingTotal
Lebanon MENA Gulf EuropeBanks and Financial Subsidiaries 59,568 52,463 803 833 113,667Insurance Subsidiaries 1,671 24,617 - - 26,288Total 61,239 77,080 803 833 139,955
New recruits and turnover rates of BLOM BANK Group units operating in various geographic regions in year 2015
New RecruitsTotal
Lebanon MENA Gulf EuropeBanks and Financial Subsidiaries 271 240 34 12 557Insurance Subsidiaries 39 72 - - 111Total 310 312 34 12 668
Turnover RateTotal
Lebanon MENA Gulf EuropeBanks and Financial Subsidiaries 7.94 14.70 18.18 4.66 10.92Insurance Subsidiaries 10.27 28.78 - - 20.40Total 8.15 16.59 18.18 4.66 11.91
BLOM BANK focuses on recruiting fresh talents, allowing for promotions and growth from within, and ensuring long term employee retention. For a wider candidate pool, different sources are exploited, including current BLOM BANK employees, interns, the internal database, on-line recruitment systems, job fairs, university career centers, and other external recruitment partners.
In 2015, the various units of BLOM BANK Group recruited a total of 668 employees to support the expansion of the Bank across the region, to upkeep its increasing business needs, and to replace departing and retiring employees. The majority of the new recruits were in the MENA region (46.71%), immediately followed by Lebanon (46.41%), the Gulf region (5.09%), and Europe (1.80%).
Management Discussion & Analysis 2015
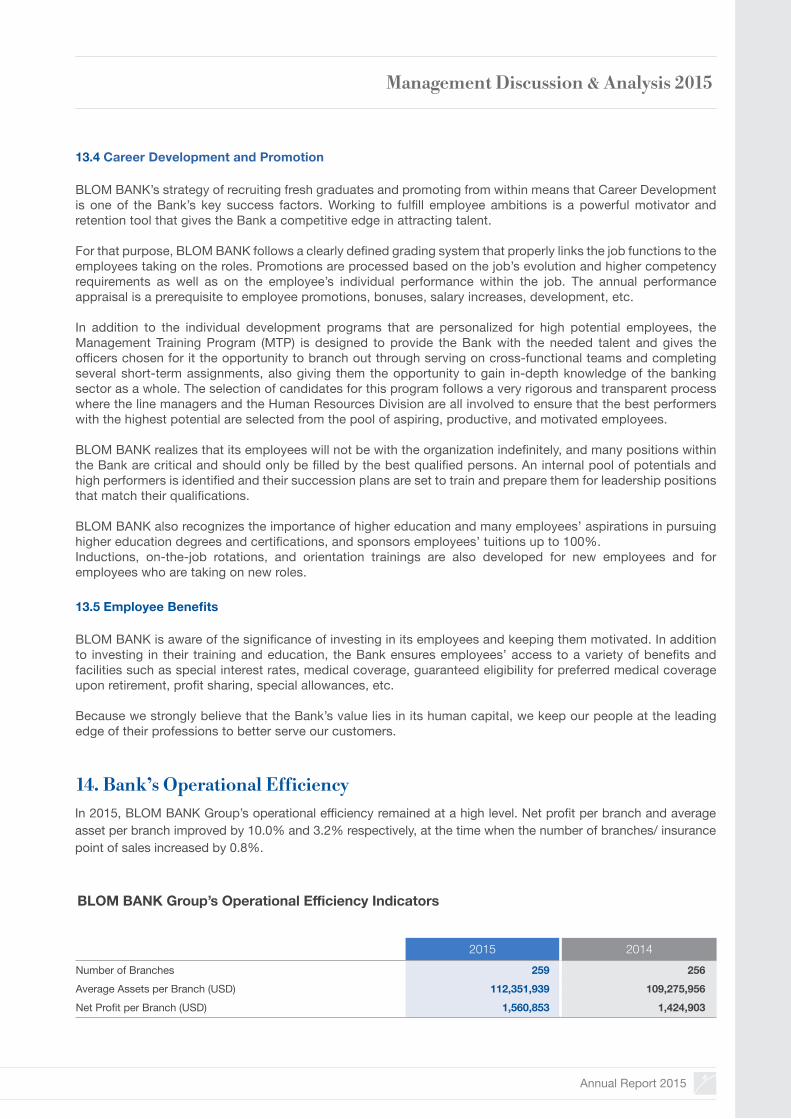
Annual Report 2015 87
13.4 Career Development and Promotion
BLOM BANK’s strategy of recruiting fresh graduates and promoting from within means that Career Development is one of the Bank’s key success factors. Working to fulfill employee ambitions is a powerful motivator and retention tool that gives the Bank a competitive edge in attracting talent.
For that purpose, BLOM BANK follows a clearly defined grading system that properly links the job functions to the employees taking on the roles. Promotions are processed based on the job’s evolution and higher competency requirements as well as on the employee’s individual performance within the job. The annual performance appraisal is a prerequisite to employee promotions, bonuses, salary increases, development, etc.
In addition to the individual development programs that are personalized for high potential employees, the Management Training Program (MTP) is designed to provide the Bank with the needed talent and gives the officers chosen for it the opportunity to branch out through serving on cross-functional teams and completing several short-term assignments, also giving them the opportunity to gain in-depth knowledge of the banking sector as a whole. The selection of candidates for this program follows a very rigorous and transparent process where the line managers and the Human Resources Division are all involved to ensure that the best performers with the highest potential are selected from the pool of aspiring, productive, and motivated employees.
BLOM BANK realizes that its employees will not be with the organization indefinitely, and many positions within the Bank are critical and should only be filled by the best qualified persons. An internal pool of potentials and high performers is identified and their succession plans are set to train and prepare them for leadership positions that match their qualifications.
BLOM BANK also recognizes the importance of higher education and many employees’ aspirations in pursuing higher education degrees and certifications, and sponsors employees’ tuitions up to 100%.Inductions, on-the-job rotations, and orientation trainings are also developed for new employees and for employees who are taking on new roles.
13.5 Employee Benefits
BLOM BANK is aware of the significance of investing in its employees and keeping them motivated. In addition to investing in their training and education, the Bank ensures employees’ access to a variety of benefits and facilities such as special interest rates, medical coverage, guaranteed eligibility for preferred medical coverage upon retirement, profit sharing, special allowances, etc.
Because we strongly believe that the Bank’s value lies in its human capital, we keep our people at the leading edge of their professions to better serve our customers.
In 2015, BLOM BANK Group’s operational efficiency remained at a high level. Net profit per branch and average asset per branch improved by 10.0% and 3.2% respectively, at the time when the number of branches/ insurance point of sales increased by 0.8%.
BLOM BANK Group’s Operational Efficiency Indicators
14. Bank’s Operational Efficiency
2015 2014Number of Branches 259 256Average Assets per Branch (USD) 112,351,939 109,275,956 Net Profit per Branch (USD) 1,560,853 1,424,903
Management Discussion & Analysis 2015

BLOM BANK s.A.L. 88

Annual Report 2015 89
BLOM BANK S.A.L. CONSOLIDATED FINANCIAL STATEMENTS1. Auditors’ Report2. Consolidated Income Statement for the year ended
31 December 20153. Consolidated Statement of Comprehensive Income for
the year ended 31 December 20154. Consolidated Statement of Financial Position at 31
December 20155. Consolidated Statement of Changes in Equity for the
year ended 31 December 20156. Consolidated Statement of Cash Flows at 31 December 2015
NOTES TO THE CONSOLIDATED FINANCIAL STATEMENTS1. Corporate Information2. Accounting Policies
2.1 Basis of Preparation2.2 Basis of Consolidation2.3 Changes in Accounting Policies and Disclosures2.4 Standards Issued but not yet Effective2.5 Summary of Significant Accounting Policies
3. Significant Accounting Estimates and Judgements4. Group Information5. Material Partly-Owned Subsidiaries6. Segmental Information7. Interest and Similar Income8. Interest and Similar Expense9. Net Fee and Commission Income10. Net Gain from Financial Instruments at Fair Value through Profit or Loss11. Net Gain from Derecognition of Financial Assets at Amortized Cost12. Other Operating Income13. Net Credit Losses14. Personnel Expenses15. Other Operating Expenses16. Income Tax Expense17. Earnings Per Share18. Cash and Balances with Central Banks19. Due from Banks and Financial Institutions20. Loans to Banks and Financial Institutions21. Derivative Financial Instruments22. Financial Assets at Fair Value through Profit or Loss23. Net Loans and Advances to Customers at
Amortized Cost
9293
94
95
96
100
101101
125128129132136136136137
138
138138139139139140141141142142143143
Consolidated Financial Statements 31 December 2015
24. Financial Assets at Amortized Cost25. Financial Assets at Fair Value through Other
Comprehensive Income26. Property and Equipment27. Intangible Assets28. Assets Obtained in Settlement of Debt29. Other Assets30. Goodwill31. Due to Central Banks and Repurchase Agreements32. Due to Banks and Financial Institutions33. Customers’ Deposits at Amortized Cost34. Other Liabilities35. Provisions for Risks and Charges36. Share Capital and Premiums37. Non-Distributable Reserves 38. Distributable Reserves39. Treasury Shares40. Retained Earnings41. Revaluation Reserve of Real Estate42. Change in Fair Value of Financial Assets at Fair Value through Other Comprehensive Income43. Cash and Cash Equivalents44. Dividends Declared and Paid45. Related Party Transactions46. Contingent Liabilities, Commitments and Leasing
Arrangements47. Assets Held in Custody and Under Administration48. Fair Value of the Financial Instruments49. Maturity Analysis of Assets and Liabilities50. Risk Management
50.1 Credit Risk50.2 Liquidity Risk and Funding Management
50.2.1 Analysis of Financial Assets and Liabilities by Remaining Contractual Maturities50.3 Market Risk
50.3.1 Interest Rate Risk 50.3.2 Currency Risk 50.3.3 Equity Price Risk 50.3.4 Prepayment Risk
50.4 Operational Risk51. Capital Management
145146
146147148148149150
150151151151152153154155156156156
157157158159
162162168169
186

BLOM BANK s.A.L. 92
INDEPENDENT AUDITORS’ REPORT TO THE SHAREHOLDERS OF BLOM BANK SAL
We have audited the accompanying consolidated financial statements of BLOM Bank SAL (the “Bank”) and its subsidiaries (the “Group”), which comprise the consolidated statement of financial position as at 31 December 2015 and the consolidated income statement, consolidated statement of comprehensive income, consolidated statement of changes in equity and consolidated statement of cash flows for the year then ended, and a summary of significant accounting policies and other explanatory information.
Management’s Responsibility for the Consolidated Financial StatementsManagement is responsible for the preparation and fair presentation of these consolidated financial statements in accordance with International Financial Reporting Standards, and for such internal control as management determines is necessary to enable the preparation of consolidated financial statements that are free from material misstatement, whether due to fraud or error.
Auditors’ ResponsibilityOur responsibility is to express an opinion on these consolidated financial statements based on our audit. We conducted our audit in accordance with International Standards on Auditing. Those standards require that we comply with ethical requirements and plan and perform the audit to obtain reasonable assurance about whether the financial statements are free from material misstatement.
An audit involves performing procedures to obtain audit evidence about the amounts and disclosures in the consolidated financial statements. The procedures selected depend on the auditors’ judgement, including the assessment of the risks of material misstatement of the consolidated financial statements, whether due to fraud or error. In making those risk assessments, the auditors consider internal control relevant to the entity’s preparation and fair presentation of the consolidated financial statements in order to design audit procedures that are appropriate in the circumstances, but not for the purpose of expressing an opinion on the effectiveness of the entity’s internal control. An audit also includes evaluating the appropriateness of accounting policies used and the reasonableness of accounting estimates made by management, as well as evaluating the overall presentation of the consolidated financial statements.
We believe that the audit evidence we have obtained is sufficient and appropriate to provide a basis for our audit opinion.
OpinionIn our opinion, the consolidated financial statements present fairly, in all material respects, the financial position of the Group as at 31 December 2015, and its financial performance and its cash flows for the year then ended in accordance with International Financial Reporting Standards.
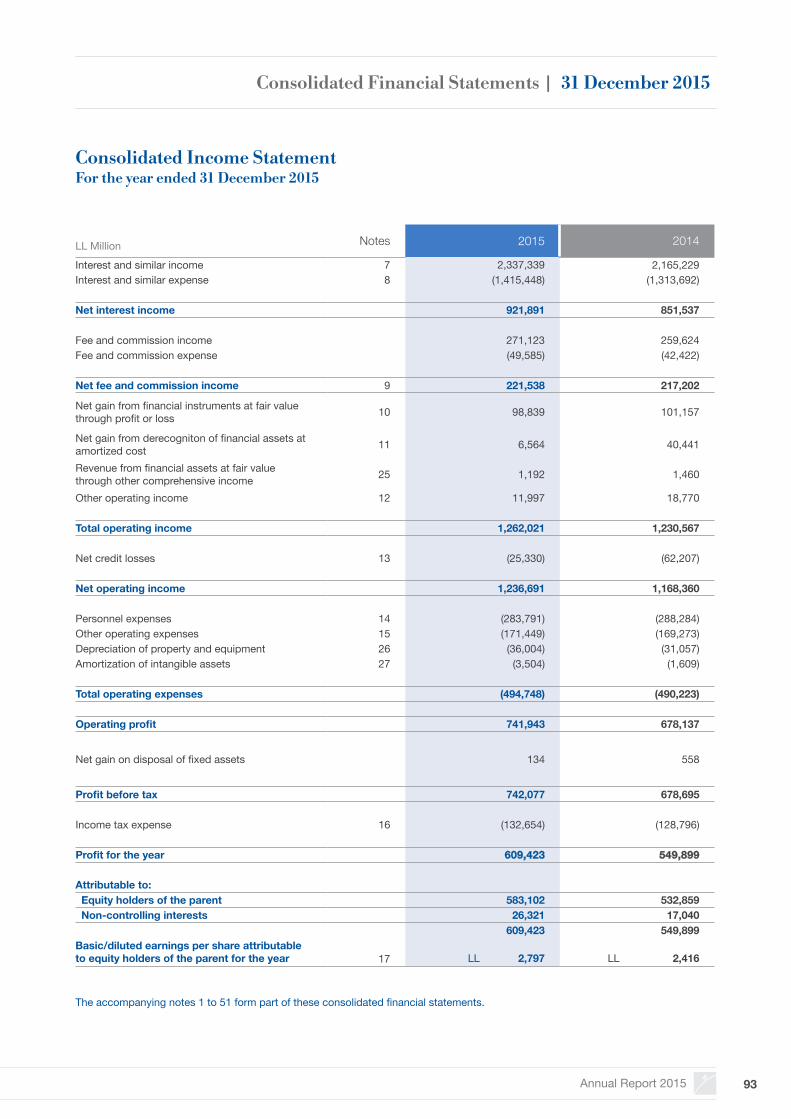
Annual Report 2015 93
LL Million Notes 2015 2014
Interest and similar income 7 2,337,339 2,165,229Interest and similar expense 8 (1,415,448) (1,313,692)
Net interest income 921,891 851,537
Fee and commission income 271,123 259,624Fee and commission expense (49,585) (42,422)
Net fee and commission income 9 221,538 217,202
Net gain from financial instruments at fair value through profit or loss 10 98,839 101,157
Net gain from derecogniton of financial assets at amortized cost 11 6,564 40,441
Revenue from financial assets at fair value through other comprehensive income 25 1,192 1,460
Other operating income 12 11,997 18,770
Total operating income 1,262,021 1,230,567
Net credit losses 13 (25,330) (62,207)
Net operating income 1,236,691 1,168,360 Personnel expenses 14 (283,791) (288,284)Other operating expenses 15 (171,449) (169,273)Depreciation of property and equipment 26 (36,004) (31,057)Amortization of intangible assets 27 (3,504) (1,609)
Total operating expenses (494,748) (490,223)
Operating profit 741,943 678,137
Net gain on disposal of fixed assets 134 558
Profit before tax 742,077 678,695 Income tax expense 16 (132,654) (128,796)
Profit for the year 609,423 549,899
Attributable to: Equity holders of the parent 583,102 532,859 Non-controlling interests 26,321 17,040
609,423 549,899Basic/diluted earnings per share attributable to equity holders of the parent for the year 17 LL 2,797 LL 2,416
The accompanying notes 1 to 51 form part of these consolidated financial statements.
Consolidated Income StatementFor the year ended 31 December 2015
Consolidated Financial Statements | 31 December 2015
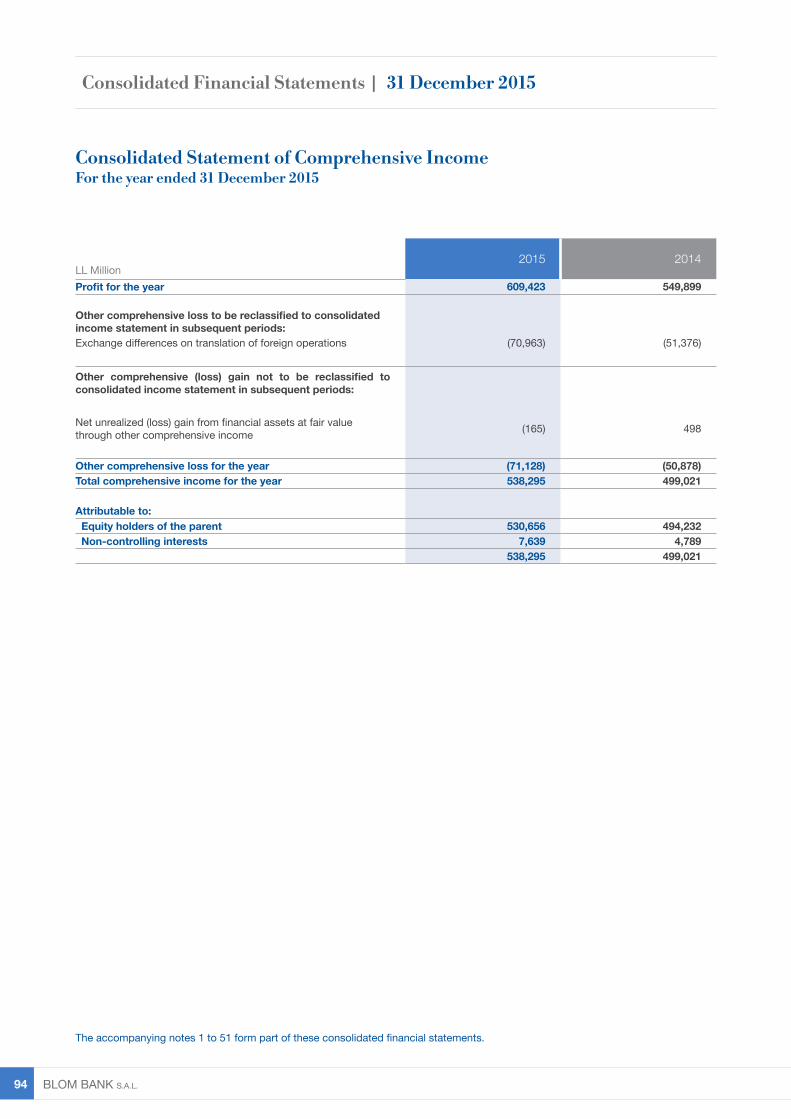
BLOM BANK s.A.L. 94
LL Million2015 2014
Profit for the year 609,423 549,899
Other comprehensive loss to be reclassified to consolidated income statement in subsequent periods:Exchange differences on translation of foreign operations (70,963) (51,376)
Other comprehensive (loss) gain not to be reclassified to consolidated income statement in subsequent periods:
Net unrealized (loss) gain from financial assets at fair value through other comprehensive income (165) 498
Other comprehensive loss for the year (71,128) (50,878)Total comprehensive income for the year 538,295 499,021
Attributable to: Equity holders of the parent 530,656 494,232 Non-controlling interests 7,639 4,789
538,295 499,021
Consolidated Statement of Comprehensive Income For the year ended 31 December 2015
The accompanying notes 1 to 51 form part of these consolidated financial statements.
Consolidated Financial Statements | 31 December 2015
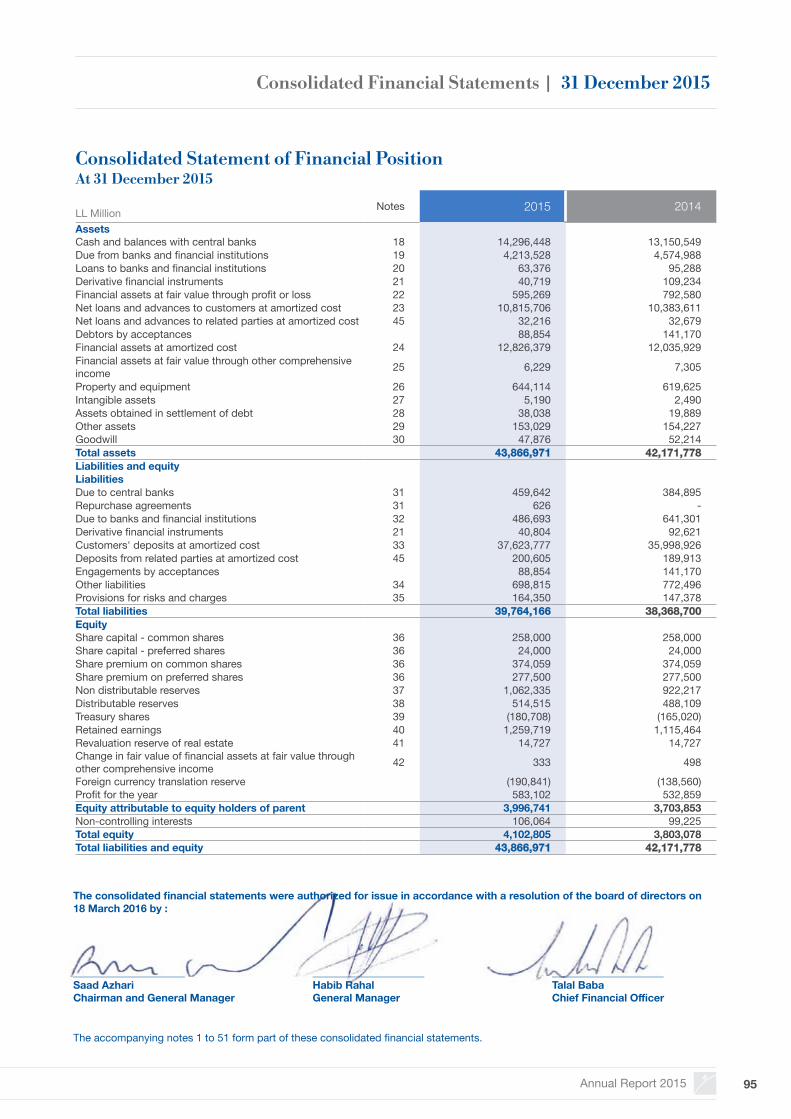
Annual Report 2015 95
LL Million Notes 2015 2014
AssetsCash and balances with central banks 18 14,296,448 13,150,549Due from banks and financial institutions 19 4,213,528 4,574,988Loans to banks and financial institutions 20 63,376 95,288Derivative financial instruments 21 40,719 109,234Financial assets at fair value through profit or loss 22 595,269 792,580Net loans and advances to customers at amortized cost 23 10,815,706 10,383,611Net loans and advances to related parties at amortized cost 45 32,216 32,679Debtors by acceptances 88,854 141,170Financial assets at amortized cost 24 12,826,379 12,035,929Financial assets at fair value through other comprehensive income 25 6,229 7,305
Property and equipment 26 644,114 619,625Intangible assets 27 5,190 2,490Assets obtained in settlement of debt 28 38,038 19,889Other assets 29 153,029 154,227Goodwill 30 47,876 52,214Total assets 43,866,971 42,171,778Liabilities and equityLiabilitiesDue to central banks 31 459,642 384,895Repurchase agreements 31 626 -Due to banks and financial institutions 32 486,693 641,301Derivative financial instruments 21 40,804 92,621Customers' deposits at amortized cost 33 37,623,777 35,998,926Deposits from related parties at amortized cost 45 200,605 189,913Engagements by acceptances 88,854 141,170Other liabilities 34 698,815 772,496Provisions for risks and charges 35 164,350 147,378Total liabilities 39,764,166 38,368,700Equity Share capital - common shares 36 258,000 258,000Share capital - preferred shares 36 24,000 24,000Share premium on common shares 36 374,059 374,059Share premium on preferred shares 36 277,500 277,500Non distributable reserves 37 1,062,335 922,217Distributable reserves 38 514,515 488,109Treasury shares 39 (180,708) (165,020)Retained earnings 40 1,259,719 1,115,464Revaluation reserve of real estate 41 14,727 14,727Change in fair value of financial assets at fair value through other comprehensive income 42 333 498
Foreign currency translation reserve (190,841) (138,560)Profit for the year 583,102 532,859Equity attributable to equity holders of parent 3,996,741 3,703,853Non-controlling interests 106,064 99,225Total equity 4,102,805 3,803,078Total liabilities and equity 43,866,971 42,171,778
Consolidated Statement of Financial Position At 31 December 2015
The accompanying notes 1 to 51 form part of these consolidated financial statements.
The consolidated financial statements were authorized for issue in accordance with a resolution of the board of directors on 18 March 2016 by :
_____________________ _____________________ _____________________Saad Azhari Habib Rahal Talal BabaChairman and General Manager General Manager Chief Financial Officer
Consolidated Financial Statements | 31 December 2015
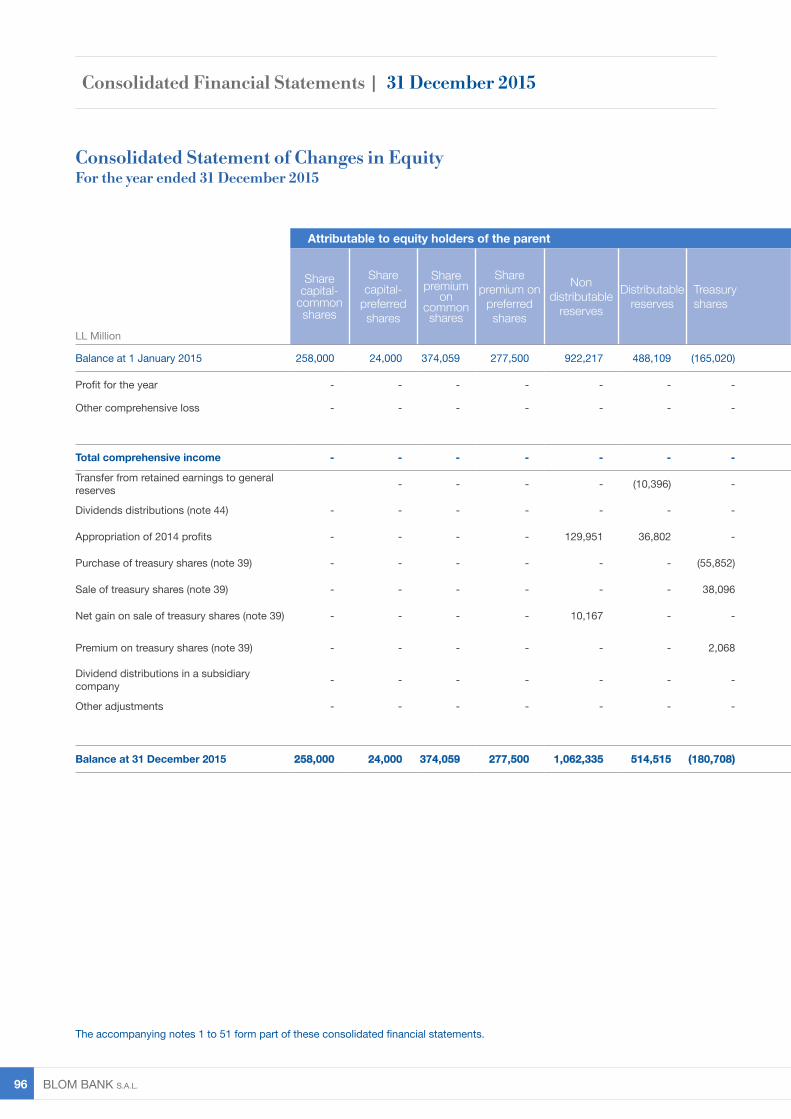
BLOM BANK s.A.L. 96
The accompanying notes 1 to 51 form part of these consolidated financial statements.
LL Million
Attributable to equity holders of the parent 2015
Non-controlling interests
Total equityShare capital-
common shares
Share capital-
preferred shares
Share premium
on common shares
Share premium on
preferred shares
Non distributable
reserves
Distributablereserves
Treasury shares
Retained earnings
Revaluation reserves of real
estate
Change in fair value of financial assets
at fair value through other comprehensive
income
Foreign currency translation
reserve
Profit for the year Total
Balance at 1 January 2015 258,000 24,000 374,059 277,500 922,217 488,109 (165,020) 1,115,464 14,727 498 (138,560) 532,859 3,703,853 99,225 3,803,078
Profit for the year - - - - - - - - - - - 583,102 583,102 26,321 609,423
Other comprehensive loss - - - - - - - - - (165) (52,281) - (52,446) (18,682) (71,128)
Total comprehensive income - - - - - - - - - (165) (52,281) 583,102 530,656 7,639 538,295
Transfer from retained earnings to generalreserves - - - - (10,396) - 10,396 - - - - - - -
Dividends distributions (note 44) - - - - - - - - - - - (231,478) (231,478) - (231,478)
Appropriation of 2014 profits - - - - 129,951 36,802 - 134,654 - - - (301,407) - - -
Purchase of treasury shares (note 39) - - - - - - (55,852) - - - - - (55,852) - (55,852)
Sale of treasury shares (note 39) - - - - - - 38,096 - - - - - 38,096 - 38,096
Net gain on sale of treasury shares (note 39) - - - - 10,167 - - - - - - - 10,167 - 10,167
Premium on treasury shares (note 39) - - - - - - 2,068 - - - - - 2,068 - 2,068
Dividend distributions in a subsidiary company - - - - - - - (92) - - - 26 (66) (220) (286)
Other adjustments - - - - - - - (703) - - - - (703) (580) (1,283)
Balance at 31 December 2015 258,000 24,000 374,059 277,500 1,062,335 514,515 (180,708) 1,259,719 14,727 333 (190,841) 583,102 3,996,741 106,064 4,102,805
Consolidated Statement of Changes in EquityFor the year ended 31 December 2015
Consolidated Financial Statements | 31 December 2015
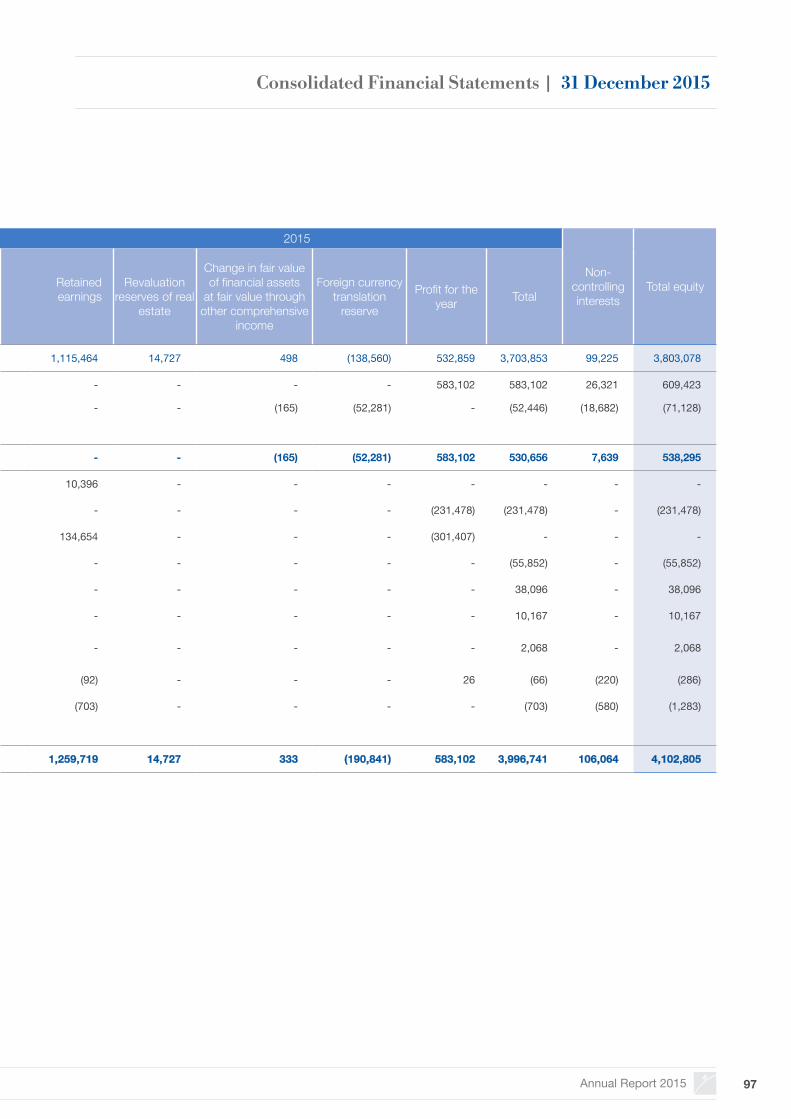
Annual Report 2015 97
LL Million
Attributable to equity holders of the parent 2015
Non-controlling interests
Total equityShare capital-
common shares
Share capital-
preferred shares
Share premium
on common shares
Share premium on
preferred shares
Non distributable
reserves
Distributablereserves
Treasury shares
Retained earnings
Revaluation reserves of real
estate
Change in fair value of financial assets
at fair value through other comprehensive
income
Foreign currency translation
reserve
Profit for the year Total
Balance at 1 January 2015 258,000 24,000 374,059 277,500 922,217 488,109 (165,020) 1,115,464 14,727 498 (138,560) 532,859 3,703,853 99,225 3,803,078
Profit for the year - - - - - - - - - - - 583,102 583,102 26,321 609,423
Other comprehensive loss - - - - - - - - - (165) (52,281) - (52,446) (18,682) (71,128)
Total comprehensive income - - - - - - - - - (165) (52,281) 583,102 530,656 7,639 538,295
Transfer from retained earnings to generalreserves - - - - (10,396) - 10,396 - - - - - - -
Dividends distributions (note 44) - - - - - - - - - - - (231,478) (231,478) - (231,478)
Appropriation of 2014 profits - - - - 129,951 36,802 - 134,654 - - - (301,407) - - -
Purchase of treasury shares (note 39) - - - - - - (55,852) - - - - - (55,852) - (55,852)
Sale of treasury shares (note 39) - - - - - - 38,096 - - - - - 38,096 - 38,096
Net gain on sale of treasury shares (note 39) - - - - 10,167 - - - - - - - 10,167 - 10,167
Premium on treasury shares (note 39) - - - - - - 2,068 - - - - - 2,068 - 2,068
Dividend distributions in a subsidiary company - - - - - - - (92) - - - 26 (66) (220) (286)
Other adjustments - - - - - - - (703) - - - - (703) (580) (1,283)
Balance at 31 December 2015 258,000 24,000 374,059 277,500 1,062,335 514,515 (180,708) 1,259,719 14,727 333 (190,841) 583,102 3,996,741 106,064 4,102,805
Consolidated Financial Statements | 31 December 2015
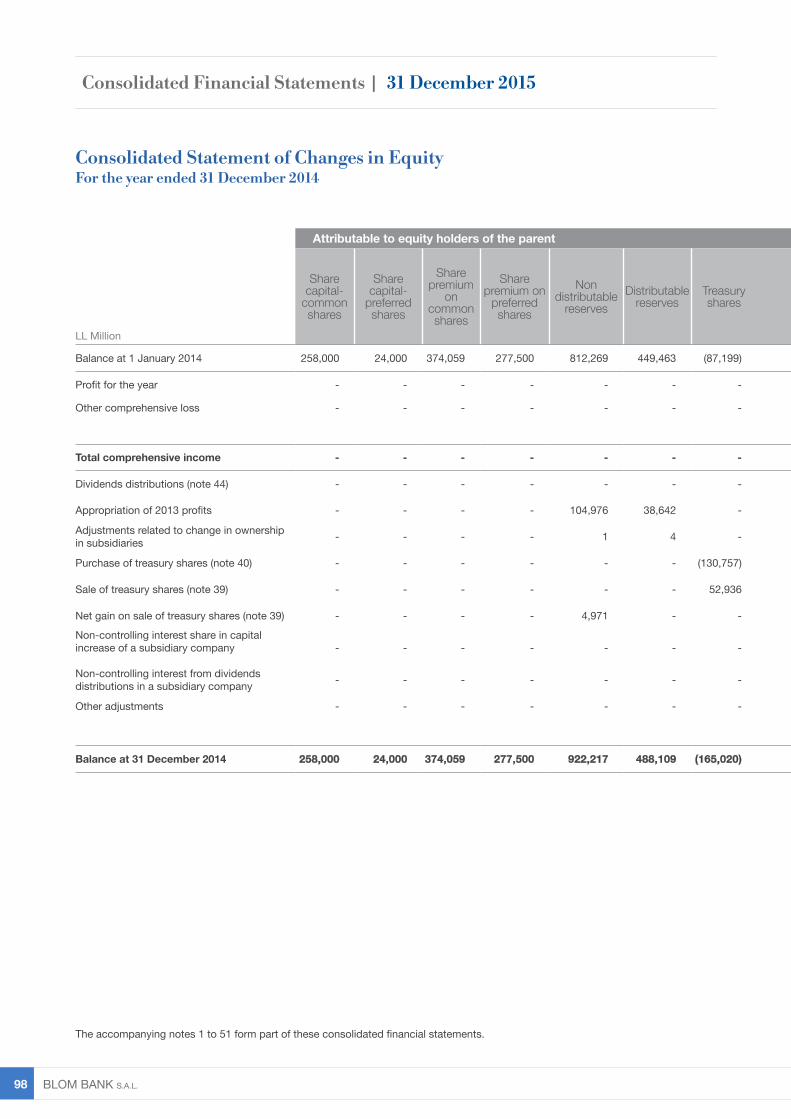
BLOM BANK s.A.L. 98
The accompanying notes 1 to 51 form part of these consolidated financial statements.
LL Million
Attributable to equity holders of the parent 2014
Non-controlling interests
Total equityShare capital-
common shares
Share capital-
preferred shares
Share premium
on common shares
Share premium on
preferred shares
Non distributable
reservesDistributable
reservesTreasury shares
Retained earnings
Revaluation reserves of real estate
Change in fair value of financial assets
at fair value through other comprehensive
income
Foreign currency translation
reserve
Profit for the year Total
Balance at 1 January 2014 258,000 24,000 374,059 277,500 812,269 449,463 (87,199) 917,522 14,727 - (99,095) 520,763 3,462,009 78,837 3,540,846
Profit for the year - - - - - - - - - - - 532,859 532,859 17,040 549,899
Other comprehensive loss - - - - - - - - - 498 (39,125) - (38,627) (12,251) (50,878)
Total comprehensive income - - - - - - - - - 498 (39,125) 532,859 494,232 4,789 499,021
Dividends distributions (note 44) - - - - - - - - - - - (178,630) (178,630) - (178,630)
Appropriation of 2013 profits - - - - 104,976 38,642 - 198,517 - - - (342,135) - - -
Adjustments related to change in ownership in subsidiaries - - - - 1 4 - (3) - - - 2 4 (9) (5)
Purchase of treasury shares (note 40) - - - - - - (130,757) - - - - - (130,757) - (130,757)
Sale of treasury shares (note 39) - - - - - - 52,936 - - - - - 52,936 - 52,936
Net gain on sale of treasury shares (note 39) - - - - 4,971 - - - - - - - 4,971 - 4,971
Non-controlling interest share in capital increase of a subsidiary company - - - - - - - - - - - - - 16,076 16,076
Non-controlling interest from dividends distributions in a subsidiary company - - - - - - - - - - - - - (87) (87)
Other adjustments - - - - - - - (572) - - (340) - (912) (381) (1,293)
Balance at 31 December 2014 258,000 24,000 374,059 277,500 922,217 488,109 (165,020) 1,115,464 14,727 498 (138,560) 532,859 3,703,853 99,225 3,803,078
Consolidated Statement of Changes in EquityFor the year ended 31 December 2014
Consolidated Financial Statements | 31 December 2015
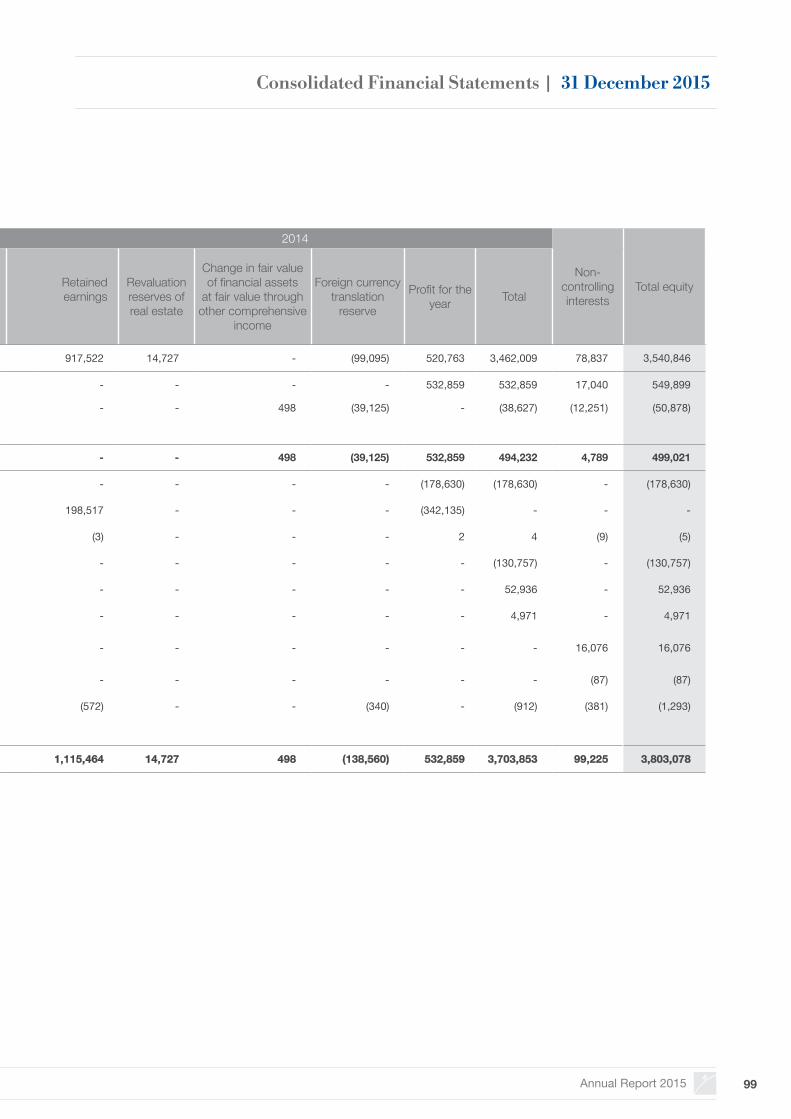
Annual Report 2015 99
LL Million
Attributable to equity holders of the parent 2014
Non-controlling interests
Total equityShare capital-
common shares
Share capital-
preferred shares
Share premium
on common shares
Share premium on
preferred shares
Non distributable
reservesDistributable
reservesTreasury shares
Retained earnings
Revaluation reserves of real estate
Change in fair value of financial assets
at fair value through other comprehensive
income
Foreign currency translation
reserve
Profit for the year Total
Balance at 1 January 2014 258,000 24,000 374,059 277,500 812,269 449,463 (87,199) 917,522 14,727 - (99,095) 520,763 3,462,009 78,837 3,540,846
Profit for the year - - - - - - - - - - - 532,859 532,859 17,040 549,899
Other comprehensive loss - - - - - - - - - 498 (39,125) - (38,627) (12,251) (50,878)
Total comprehensive income - - - - - - - - - 498 (39,125) 532,859 494,232 4,789 499,021
Dividends distributions (note 44) - - - - - - - - - - - (178,630) (178,630) - (178,630)
Appropriation of 2013 profits - - - - 104,976 38,642 - 198,517 - - - (342,135) - - -
Adjustments related to change in ownership in subsidiaries - - - - 1 4 - (3) - - - 2 4 (9) (5)
Purchase of treasury shares (note 40) - - - - - - (130,757) - - - - - (130,757) - (130,757)
Sale of treasury shares (note 39) - - - - - - 52,936 - - - - - 52,936 - 52,936
Net gain on sale of treasury shares (note 39) - - - - 4,971 - - - - - - - 4,971 - 4,971
Non-controlling interest share in capital increase of a subsidiary company - - - - - - - - - - - - - 16,076 16,076
Non-controlling interest from dividends distributions in a subsidiary company - - - - - - - - - - - - - (87) (87)
Other adjustments - - - - - - - (572) - - (340) - (912) (381) (1,293)
Balance at 31 December 2014 258,000 24,000 374,059 277,500 922,217 488,109 (165,020) 1,115,464 14,727 498 (138,560) 532,859 3,703,853 99,225 3,803,078
Consolidated Financial Statements | 31 December 2015
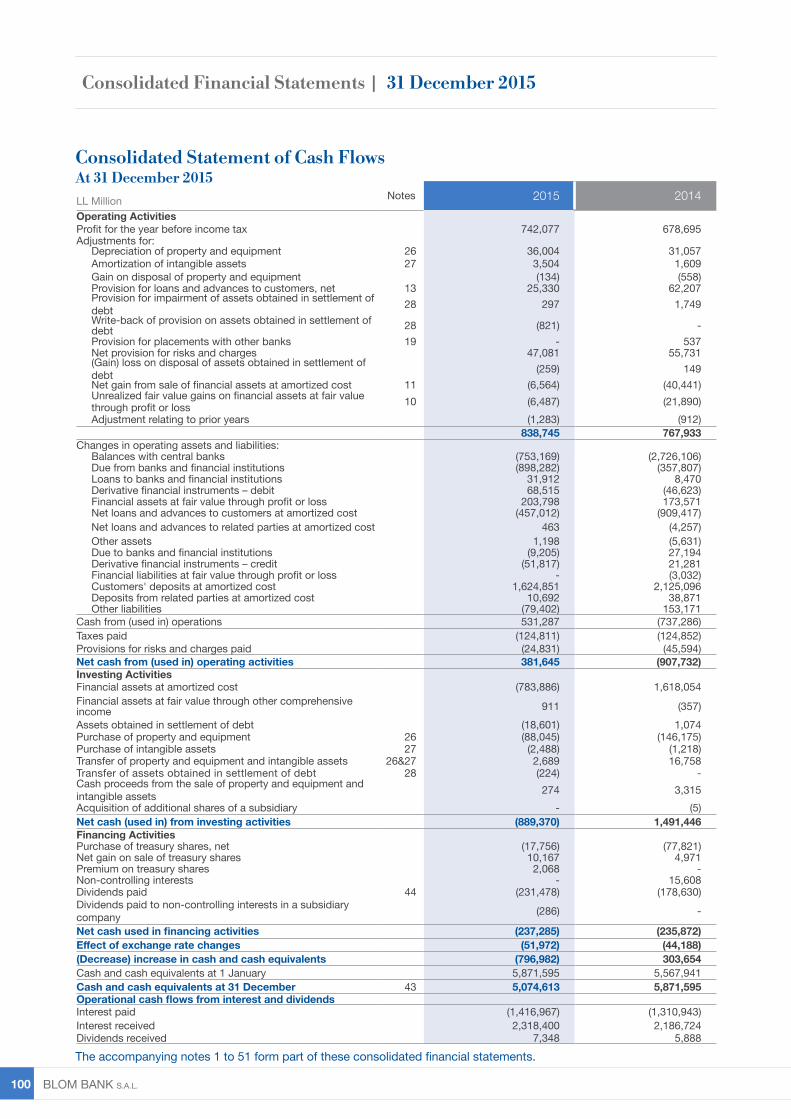
BLOM BANK s.A.L. 100
LL Million Notes 2015 2014Operating ActivitiesProfit for the year before income tax 742,077 678,695Adjustments for:
Depreciation of property and equipment 26 36,004 31,057Amortization of intangible assets 27 3,504 1,609Gain on disposal of property and equipment (134) (558)Provision for loans and advances to customers, net 13 25,330 62,207Provision for impairment of assets obtained in settlement of debt 28 297 1,749Write-back of provision on assets obtained in settlement of debt 28 (821) -Provision for placements with other banks 19 - 537Net provision for risks and charges 47,081 55,731(Gain) loss on disposal of assets obtained in settlement of debt (259) 149Net gain from sale of financial assets at amortized cost 11 (6,564) (40,441)Unrealized fair value gains on financial assets at fair value through profit or loss 10 (6,487) (21,890)Adjustment relating to prior years (1,283) (912)
838,745 767,933Changes in operating assets and liabilities:
Balances with central banks (753,169) (2,726,106)Due from banks and financial institutions (898,282) (357,807)Loans to banks and financial institutions 31,912 8,470Derivative financial instruments – debit 68,515 (46,623)Financial assets at fair value through profit or loss 203,798 173,571Net loans and advances to customers at amortized cost (457,012) (909,417)Net loans and advances to related parties at amortized cost 463 (4,257)Other assets 1,198 (5,631)Due to banks and financial institutions (9,205) 27,194Derivative financial instruments – credit (51,817) 21,281Financial liabilities at fair value through profit or loss - (3,032)Customers' deposits at amortized cost 1,624,851 2,125,096Deposits from related parties at amortized cost 10,692 38,871Other liabilities (79,402) 153,171
Cash from (used in) operations 531,287 (737,286)Taxes paid (124,811) (124,852)Provisions for risks and charges paid (24,831) (45,594)Net cash from (used in) operating activities 381,645 (907,732)Investing ActivitiesFinancial assets at amortized cost (783,886) 1,618,054Financial assets at fair value through other comprehensive income 911 (357)Assets obtained in settlement of debt (18,601) 1,074Purchase of property and equipment 26 (88,045) (146,175)Purchase of intangible assets 27 (2,488) (1,218)Transfer of property and equipment and intangible assets 26&27 2,689 16,758Transfer of assets obtained in settlement of debt 28 (224) -Cash proceeds from the sale of property and equipment and intangible assets 274 3,315Acquisition of additional shares of a subsidiary - (5)Net cash (used in) from investing activities (889,370) 1,491,446Financing ActivitiesPurchase of treasury shares, net (17,756) (77,821)Net gain on sale of treasury shares 10,167 4,971Premium on treasury shares 2,068 -Non-controlling interests - 15,608Dividends paid 44 (231,478) (178,630)Dividends paid to non-controlling interests in a subsidiary company (286) -
Net cash used in financing activities (237,285) (235,872)Effect of exchange rate changes (51,972) (44,188)(Decrease) increase in cash and cash equivalents (796,982) 303,654Cash and cash equivalents at 1 January 5,871,595 5,567,941Cash and cash equivalents at 31 December 43 5,074,613 5,871,595Operational cash flows from interest and dividendsInterest paid (1,416,967) (1,310,943)Interest received 2,318,400 2,186,724Dividends received 7,348 5,888
Consolidated Statement of Cash FlowsAt 31 December 2015
The accompanying notes 1 to 51 form part of these consolidated financial statements.
Consolidated Financial Statements | 31 December 2015
Annual Report 2015 101
1. Corporate InformationBLOM Bank SAL (the “Bank”), a Lebanese joint stock company, was incorporated in 1951 and registered under No 2464 at the commercial registry of Beirut and under No 14 on the banks’ list published by the Central Bank of Lebanon. The Bank’s head office is located in Verdun, Rashid Karameh Street, Beirut, Lebanon. The Bank’s shares are listed on the Beirut Stock Exchange and Luxembourg Stock Exchange.
The Bank, together with its affiliated banks and subsidiaries (collectively the “Group”), provides a wide range of retail, commercial, investment and private banking activities, insurance and brokerage services through its headquarter as well as its branches in Lebanon and its presence in Europe, the Middle East and North Africa.
Further information on the Group’s structure is provided in note 4.
2. Accounting Policies2.1 Basis of preparation
The consolidated financial statements have been prepared on a historical cost basis except for: a) the restatement of certain tangible real estate properties in Lebanon according to the provisions of law No 282 dated 30 December 1993, and b) the measurement at fair value of derivative financial instruments, financial assets at fair value through profit or loss, financial assets at fair value through other comprehensive income and financial liabilities at fair value through profit or loss. The carrying values of recognised assets and liabilities that are hedged items in fair value hedges, and otherwise carried at amortised cost, are adjusted to record changes in fair value attributable to the risks that are being hedged. The consolidated financial statements are presented in Lebanese Pounds (LL) and all values are rounded to the nearest LL million, except when otherwise indicated.
Statement of complianceThe consolidated financial statements have been prepared in accordance with International Financial Reporting Standards (IFRS) as issued by International Accounting Standards Board (IASB), and the regulations of the Central Bank of Lebanon and the Banking Control Commission (“BCC”).
Presentation of the consolidated financial statementsThe Group presents its consolidated statement of financial position broadly in order of liquidity. An analysis regarding recovery or settlement within one year after the statement of financial position date (current) and more than 1 year after the statement of financial position date (non-current) is presented in the notes.
Financial assets and financial liabilities are offset and the net amount is reported in the consolidated statement of financial position only when there is a legally enforceable right to offset the recognised amounts and there is an intention to settle on a net basis, or to realise the assets and settle the liability simultaneously. This is not generally the case with master netting agreements, therefore the related assets and liabilities are presented gross in the consolidated statement of financial position. Income and expense will not be offset in the consolidated income statement unless required or permitted by any accounting standard or interpretation, as specifically disclosed in the accounting policies of the Group.
Notes to the Consolidated Financial Statements | 31 December 2015

BLOM BANK s.A.L. 102
2.2 Basis of consolidation
The consolidated financial statements comprise the financial statements of the Group and its subsidiaries as at 31 December 2015. Control is achieved when the Group is exposed, or has rights, to variable returns from its involvement with the investee and has the ability to affect those returns through its power over the investee. Specifically, the Group controls an investee if and only if the Group has:
• Power over the investee (i.e. existing rights that give it the current ability to direct the relevant activities of the investee)• Exposure, or rights, to variable returns from its involvement with the investee, and• The ability to use its power over the investee to affect its returns
Generally, there is a presumption that a majority of voting rights result in control. To support this presumption and when the Group has less than a majority of the voting or similar rights of an investee, the Group considers all relevant facts and circumstances in assessing whether it has power over an investee, including:
• The contractual arrangement with the other vote holders of the investee• Rights arising from other contractual arrangements• The Group’s voting rights and potential voting rights
The Group re-assesses whether or not it controls an investee if facts and circumstances indicate that there are changes to one or more of the three elements of control. Consolidation of a subsidiary begins when the Group obtains control over the subsidiary and ceases when the Group loses control of the subsidiary. Assets, liabilities, income and expenses of a subsidiary acquired or disposed of during the year are included in the statement of comprehensive income from the date the Group gains control until the date the Group ceases to control the subsidiary.
Profit or loss and each component of other comprehensive income (OCI) are attributed to the equity holders of the parent of the Group and to the non-controlling interests, even if this results in the non-controlling interests having a deficit balance. When necessary, adjustments are made to the financial statements of subsidiaries to bring their accounting policies into line with the Group’s accounting policies. All intra-group assets and liabilities, equity, income, expenses and cash flows relating to transactions between members of the Group are eliminated in full on consolidation.
A change in the ownership interest of a subsidiary, without a loss of control, is accounted for as an equity transaction.
If the Group loses control over a subsidiary, it derecognises the related assets (including goodwill), liabilities, non-controlling interest and other components of equity while any resultant gain or loss is recognised in profit or loss. Any investment retained is recognised at fair value.
Non-Controlling interestNon-controlling interest represent the portion of profit or loss and net assets of subsidiaries not owned by the Group. The Group has elected to measure the non-controlling interest in acquirees at the proportionate share of each acquiree’s identifiable net assets. Interests in the equity of subsidiaries not attributable to the Group are reported in consolidated equity as non-controlling interests. Profit or loss and each component of OCI are attributed to the equity holders of the parent of the Group and to the non-controlling interests, even if this results in the non-controlling interests having a deficit balance.
The Group treats transactions with non-controlling interests as transactions with equity holders of the Group. For purchases from non-controlling interests, the difference between any consideration paid and the relevant share acquired of the carrying value of net assets of the subsidiary is recorded in equity. Gains or losses on disposals to non-controlling interests are also recorded in equity.
Notes to the Consolidated Financial Statements | 31 December 2015
Annual Report 2015 103
2.3 Changes in accounting policies and disclosures
New and amended standards and interpretations The Group applied for the first time certain standards and amendments, which are effective for annual periods beginning on or after 1 January 2015.
The nature and the impact of each new standard and amendment is described below:
Amendments to IAS 19 Defined Benefit Plans: Employee ContributionsIAS 19 requires an entity to consider contributions from employees or third parties when accounting for defined benefit plans. Where the contributions are linked to service, they should be attributed to periods of service as a negative benefit. These amendments clarify that, if the amount of the contributions is independent of the number of years of service, an entity is permitted to recognize such contributions as a reduction in the service cost in the period in which the service is rendered, instead of allocating the contributions to the periods of service. This amendment is effective for annual periods beginning on or after 1 July 2014. This amendment is not relevant to the Group, since it does not have defined benefit plans with contributions from employees or third parties.
Annual Improvements 2010-2012 CycleWith the exception of the improvement relating to IFRS 2 Share-based Payment applied to share-based payment transactions with a grant date on or after 1 July 2014, all other improvements are effective for accounting periods beginning on or after 1 July 2014. The Group has applied these improvements for the first time in these consolidated financial statements. They include:
IFRS 2 Share-based PaymentsThis improvement is applied prospectively and clarifies various issues relating to the definitions of performance and service conditions which are vesting conditions. The clarifications are consistent with how the Group has identified any performance and service conditions which are vesting conditions in previous periods.
In addition, the Group had not granted any awards during the second half of 2014 and 2015. Thus, these amendments did not impact the Group’s financial statements or accounting policies.
IFRS 3 Business CombinationsThe amendment is applied prospectively and clarifies that all contingent consideration arrangements classified as liabilities (or assets) arising from a business combination should be subsequently measured at fair value through profit or loss whether or not they fall within the scope of IFRS 9. This is consistent with the Group’s current accounting policy, and thus this amendment does not impact the Group’s accounting policy.
IFRS 8 Operating SegmentsThe amendments are applied retrospectively and clarify that:
• An entity must disclose the judgments made by management in applying the aggregation criteria in paragraph 12 of IFRS 8, including a brief description of operating segments that have been aggregated and the economic characteristics (e.g., sales and gross margins) used to assess whether the segments are ‘similar’
• The reconciliation of segment assets to total assets is only required to be disclosed if the reconciliation is reported to the chief operating decision maker, similar to the required disclosure for segment liabilities.
The adoption of the above amendments did not have a significant impact on the Group’s financial position or performance.
IAS 16 Property, Plant and Equipment and IAS 38 Intangible AssetsThe amendment is applied retrospectively and clarifies in IAS 16 and IAS 38 that the asset may be revalued by reference to observable data by either adjusting the gross carrying amount of the asset to market value or by determining the market value of the carrying value and adjusting the gross carrying amount proportionately so that the resulting carrying amount equals
Notes to the Consolidated Financial Statements | 31 December 2015
BLOM BANK s.A.L. 104
the market value. In addition, the accumulated depreciation or amortization is the difference between the gross and carrying amounts of the asset. The Group did not record any revaluation adjustments during the current period.
IAS 24 Related Party DisclosuresThe amendment is applied retrospectively and clarifies that a management entity (an entity that provides key management personnel services) is a related party subject to the related party disclosures. In addition, an entity that uses a management entity is required to disclose the expenses incurred for management services. This amendment is not relevant for the Group as it does not receive any management services from other entities.
Annual Improvements 2011-2013 CycleThese improvements are effective for the time in the current year. They include:
IFRS 3 Business CombinationsThe amendment is applied prospectively and clarifies for the scope
exceptions within IFRS 3 that:• Joint arrangements, not just joint ventures, are outside the scope of
IFRS 3• This scope exception applies only to the accounting in the financial
statements of the joint arrangement itself
The Group is not a joint arrangement, and thus this amendment is not relevant.
IFRS 13 Fair Value MeasurementThe amendment is applied prospectively and clarifies that the portfolio exception in IFRS 13 can be applied not only to financial assets and financial liabilities, but also to other contracts within the scope of IFRS 9. The Group does not apply the portfolio exception in IFRS 13.
IAS 40 Investment PropertyThe description of ancillary services in IAS 40 differentiates between investment property and owner-occupied property (i.e., property, plant and equipment). The amendment is applied prospectively and clarifies that IFRS 3, and not the description of ancillary services in IAS 40, is used to determine if the transaction is the purchase of an asset or a business combination. In previous periods, the Group has relied on IFRS 3, not IAS 40, in determining whether an acquisition is of an asset or is a business acquisition. Thus, this amendment does not impact the accounting policy of the Group.
2.4 Standards issued but not yet effective
The standards and interpretations that are issued, but not yet effective, up to the date of issuance of the Group’s financial statements are disclosed below. The Group intends to adopt these standards, if applicable, when they become effective.
IFRS 9 Financial InstrumentsIn July 2014, the IASB issued the final version of IFRS 9 Financial Instruments which reflects all phases of the financial instruments project and replaces IAS 39 Financial Instruments: Recognition and Measurement and all previous versions of IFRS 9. The standard introduces new requirements for classification and measurement, impairment, and hedge accounting. In prior years the Group has early adopted IFRS 9 (2011) which includes the requirements for the classification and measurement. IFRS 9 is effective for annual periods beginning on or after 1 January 2018, with early application permitted. Retrospective application is required, but comparative information is not compulsory. The adoption of IFRS 9 will have an effect on measuring impairment allowances and on the classification and measurement of the Group’s financial assets, but no impact on the classification and measurement of the Group’s financial liabilities. The Group is currently assessing the impact of IFRS 9 and plans to adopt the new standard on the required effective date.
IFRS 15 Revenue from Contracts with CustomersIFRS 15 was issued in May 2014 and establishes a new five-step model that will apply to revenue arising from contracts with customers. Under IFRS
Notes to the Consolidated Financial Statements | 31 December 2015
Annual Report 2015 105
15 revenue is recognised at an amount that reflects the consideration to which an entity expects to be entitled in exchange for transferring goods or services to a customer. The principles in IFRS 15 provide a more structured approach to measuring and recognising revenue. The new revenue standard is applicable to all entities and will supersede all current revenue recognition requirements under IFRS. Either a full or modified retrospective application is required for annual periods beginning on or after 1 January 2018 with early adoption permitted. The Group is currently assessing the impact of IFRS 15 and plans to adopt the new standard on the required effective date.
Amendments to IFRS 11 Joint Arrangements: Accounting for Acquisitions of InterestsThe amendments to IFRS 11 require that a joint operator accounting for the acquisition of an interest in a joint operation, in which the activity of the joint operation constitutes a business must apply the relevant IFRS 3 principles for business combinations accounting. The amendments also clarify that a previously held interest in a joint operation is not remeasured on the acquisition of an additional interest in the same joint operation while joint control is retained. In addition, a scope exclusion has been added to IFRS 11 to specify that the amendments do not apply when the parties sharing joint control, including the reporting entity, are under common control of the same ultimate controlling party. The amendments apply to both the acquisition of the initial interest in a joint operation and the acquisition of any additional interests in the same joint operation and are prospectively effective for annual periods beginning on or after 1 January 2016, with early adoption permitted. These amendments are not expected to have any impact to the Group.
Amendments to IAS 16 and IAS 38: Clarification of Acceptable Methods of Depreciation and AmortisationThe amendments clarify the principle in IAS 16 and IAS 38 that revenue reflects a pattern of economic benefits that are generated from operating a business (of which the asset is part) rather than the economic benefits that are consumed through use of the asset. As a result, a revenue-based method cannot be used to depreciate property, plant and equipment and may only be used in very limited circumstances to amortise intangible assets. The amendments are effective prospectively for annual periods beginning on or after 1 January 2016, with early adoption permitted. These amendments are not expected to have any impact to the Group given that the Group has not used a revenue-based method to depreciate its non-current assets.
Amendments to IAS 27: Equity Method in Separate Financial StatementsThe amendments will allow entities to use the equity method to account for investments in subsidiaries, joint ventures and associates in their separate financial statements. Entities already applying IFRS and electing to change to the equity method in its separate financial statements will have to apply that change retrospectively. For first-time adopters of IFRS electing to use the equity method in its separate financial statements, they will be required to apply this method from the date of transition to IFRS. The amendments are effective for annual periods beginning on or after 1 January 2016, with early adoption permitted. These amendments will not have any impact on the Group’s consolidated financial statements.
Amendments to IFRS 10 and IAS 28: Sale or Contribution of Assets between an Investor and its Associate or Joint VentureThe amendments address the conflict between IFRS 10 and IAS 28 in dealing with the loss of control of a subsidiary that is sold or contributed to an associate or joint venture. The amendments clarify that the gain or loss resulting from the sale or contribution of assets that constitute a business, as defined in IFRS 3, between an investor and its associate or joint venture, is recognised in full. Any gain or loss resulting from the sale or contribution of assets that do not constitute a business, however, is recognised only to the extent of unrelated investors’ interests in the associate or joint venture. These amendments must be applied prospectively and are effective for annual periods beginning on or after 1 January 2016, with early adoption permitted. These amendments are not expected to have any impact on the Group.
Notes to the Consolidated Financial Statements | 31 December 2015
BLOM BANK s.A.L. 106
Annual Improvements 2012-2014 CycleThese improvements are effective for annual periods beginning on or after 1 January 2016. They include:
IFRS 5 Non-current Assets Held for Sale and Discontinued OperationsAssets (or disposal groups) are generally disposed of either through sale or distribution to owners. The amendment clarifies that changing from one of these disposal methods to the other would not be considered a new plan of disposal, rather it is a continuation of the original plan. There is, therefore, no interruption of the application of the requirements in IFRS 5. This amendment must be applied prospectively.
IFRS 7 Financial Instruments: Disclosures(i) Servicing contractsThe amendment clarifies that a servicing contract that includes a fee can constitute continuing involvement in a financial asset. An entity must assess the nature of the fee and the arrangement against the guidance for continuing involvement in IFRS 7 in order to assess whether the disclosures are required. The assessment of which servicing contracts constitute continuing involvement must be done retrospectively. However, the required disclosures would not need to be provided for any period beginning before the annual period in which the entity first applies the amendments.
(ii) Applicability of the amendments to IFRS 7 to condensed interim financial statementsThe amendment clarifies that the offsetting disclosure requirements do not apply to condensed interim financial statements, unless such disclosures provide a significant update to the information reported in the most recent annual report. This amendment must be applied retrospectively.
IAS 19 Employee BenefitsThe amendment clarifies that market depth of high quality corporate bonds is assessed based on the currency in which the obligation is denominated, rather than the country where the obligation is located. When there is no deep market for high quality corporate bonds in that currency, government bond rates must be used. This amendment must be applied prospectively.
Amendments to IAS 1 Disclosure InitiativeThe amendments to IAS 1 Presentation of Financial Statements clarify, rather than significantly change, existing IAS 1 requirements. The amendments clarify:
• The materiality requirements in IAS 1• That specific line items in the statement(s) of profit or loss and OCI
and the statement of financial position may be disaggregated• That entities have flexibility as to the order in which they present the
notes to financial statements• That the share of OCI of associates and joint ventures accounted for
using the equity method must be presented in aggregate as a single line item, and classified between those items that will or will not be subsequently reclassified to profit or loss
Furthermore, the amendments clarify the requirements that apply when additional subtotals are presented in the statement of financial position and the statement(s) of profit or loss and OCI. These amendments are effective for annual periods beginning on or after 1 January 2016, with early adoption permitted. These amendments are not expected to have any impact on the Group.
Amendments to IFRS 10, IFRS 12 and IAS 28 Investment Entities: Applying the Consolidation ExceptionThe amendments address issues that have arisen in applying the investment entities exception under IFRS 10. The amendments to IFRS 10 clarify that
Notes to the Consolidated Financial Statements | 31 December 2015

Annual Report 2015 107
the exemption from presenting consolidated financial statements applies to a parent entity that is a subsidiary of an investment entity, when the investment entity measures all of its subsidiaries at fair value.Furthermore, the amendments to IFRS 10 clarify that only a subsidiary of an investment entity that is not an investment entity itself and that provides support services to the investment entity is consolidated. All other subsidiaries of an investment entity are measured at fair value. The amendments to IAS 28 allow the investor, when applying the equity method, to retain the fair value measurement applied by the investment entity associate or joint venture to its interests in subsidiaries. These amendments must be applied retrospectively and are effective for annual periods beginning on or after 1 January 2016, with early adoption permitted. These amendments are not expected to have any impact on the Group.
2.5 Summary of significant accounting policies
Foreign currency translationThe consolidated financial statements are presented in Lebanese Lira which is the Bank’s presentation currency. Each entity in the Group determines its own functional currency and items included in the financial statements of each entity are measured using that functional currency.
(i) Transactions and balancesTransactions in foreign currencies are initially recorded at the functional currency rate of exchange ruling at the date of the transaction.
Monetary assets and liabilities denominated in foreign currencies are retranslated at the functional currency rate of exchange at the date of the statement of financial position. All differences are taken to “Net gain from financial instruments designated at fair value through profit or loss” in the consolidated income statement.
Non–monetary items that are measured in terms of historical cost in a foreign currency are translated using the exchange rates as at the dates of the initial transactions. Non–monetary items measured at fair value in a foreign currency are translated using the exchange rates at the date when the fair value was determined. The gain or loss arising on retranslation of non-monetary items is treated in line with the recognition of gain or loss on change in fair value of the item (i.e., translation differences on items whose fair value gain or loss is recognized in other comprehensive income or profit or loss is also recognized in other comprehensive income or profit or loss respectively).
Any goodwill arising on the acquisition of a foreign operation and any fair value adjustments to the carrying amounts of assets and liabilities arising on the acquisition are treated as assets and liabilities of the foreign operations and translated at closing rate.
(ii) Group companiesOn consolidation, the assets and liabilities of subsidiaries and overseas branches are translated into the Bank’s presentation currency at the rate of exchange as at the reporting date, and their income statements are translated at the weighted average exchange rates for the year. Exchange differences arising on translation are taken directly to a separate component of equity. On disposal of a foreign entity, the deferred cumulative amount recognised in equity relating to that particular foreign operation is recognised in the consolidated income statement.
Any goodwill arising on the acquisition of a foreign operation and any fair value adjustments to the carrying amounts of assets and liabilities arising on the acquisition are treated as assets and liabilities of the foreign operations and translated at closing rate.
Notes to the Consolidated Financial Statements | 31 December 2015
BLOM BANK s.A.L. 108
Financial instruments – classification and measurement (i) Date of recognition All financial assets and liabilities are initially recognized on the trade date, i.e. the date that the Group becomes a party to the contractual provisions of the instrument. This includes “regular way trades”: purchases or sales of financial assets that require delivery of assets within the time frame generally established by regulation or convention in the market place.
(ii) Classification and measurement of financial instruments
a. Financial assetsThe classification of financial assets depends on the basis of the entity’s business model for managing the financial assets and the contractual cash flow characteristics of the financial asset. Assets are initially measured at fair value plus, in the case of a financial asset not at fair value through profit or loss, particular transaction costs. Assets are subsequently measured at amortized cost or fair value. An entity may, at initial recognition, irrevocably designate a financial asset as measured at fair value through profit or loss if doing so eliminates or significantly reduces a measurement or recognition inconsistency (sometimes referred to as an ‘accounting mismatch’) that would otherwise arise from measuring assets or liabilities or recognizing the gains and losses on them on different basis. An entity is required to disclose such financial assets separately from those mandatorily measured at fair value.
Financial assets at amortized cost Debt instruments are subsequently measured at amortized cost less any impairment loss (except for debt instruments that are designated at fair value through profit or loss upon initial recognition) if they meet the following two conditions:
• The asset is held within a business model whose objective is to hold assets in order to collect contractual cash flows; and
• The contractual terms of the instrument give rise on specified dates to cash flows that are solely payments of principal and interest on the principal amount outstanding.
These financial assets are initially recognized at cost, being the fair value of the consideration paid for the acquisition of the investment. All transaction costs directly attributed to the acquisition are also included in the cost of investment. After initial measurement, these financial assets are measured at amortized cost using the effective interest rate method (EIR), less allowance for impairment. Amortized cost is calculated by taking into account any discount or premium on acquisition and fees and costs that are an integral part of the effective interest rate. The amortization is included in “Interest and similar income” in the consolidated income statement. The losses arising from impairment are recognized in the consolidated income statement in “Impairment losses on other financial assets”.
Although the objective of an entity’s business model may be to hold financial assets in order to collect contractual cash flows, the entity need not hold all of those instruments until maturity. Thus an entity’s business model can be to hold financial assets to collect contractual cash flows even when sales of financial assets occur. However, if more than an infrequent number of sales are made out of a portfolio, the entity needs to assess whether and how such sales are consistent with an objective of collecting contractual cash flows. If the objective of the entity’s business model for managing those financial assets changes, the entity is required to reclassify financial assets.
Gains and losses arising from the derecognition of financial assets measured at amortized cost are reflected under “Net gain from derecognition of financial assets at amortized cost” in the consolidated income statement.
Notes to the Consolidated Financial Statements | 31 December 2015
Annual Report 2015 109
Balances with central banks, due from banks and financial institutions, loans to banks and financial institutions and net loans and advances to customers and related parties – at amortized cost After initial measurement, “Balances with central banks”, “Due from banks and financial institutions”, “Loans to banks and financial institutions” and “Net loans and advances to customers and related parties” are subsequently measured at amortized cost using the EIR method, less allowance for impairment. Amortized cost is calculated by taking into account any discount or premium on acquisition and fees and costs that are an integral part of the EIR. The amortization is included in ‘Interest and similar income’ in the consolidated income statement. The losses arising from impairment are recognized in the consolidated income statement in “Net credit losses”. Financial assets at fair value through profit or lossIncluded in this category are those debt instruments that do not meet the conditions in “Financial assets at amortized cost” above, debt instruments designated at fair value through profit or loss upon initial recognition and equity instruments at fair value through profit or loss.
Debt instruments at fair value through profit or lossThese financial assets are recorded in the consolidated statement of financial position at fair value. Changes in fair value and interest income are recorded under “Net gain from financial instruments at fair value through profit or loss” in the consolidated income statement showing separately, those related to financial assets designated at fair value upon initial recognition from those mandatorily measured at fair value. Gains and losses arising from the derecognition of debt instruments at fair value through profit or loss are also reflected under “Net gain from financial instruments at fair value through profit or loss” in the consolidated income statement showing separately, those related to financial assets designated at fair value upon initial recognition from those mandatorily measured at fair value.
Equity instruments at fair value through profit or lossInvestments in equity instruments are classified at fair value through profit or loss, unless the Group designates at initial recognition an investment that is not held for trading as at fair value through other comprehensive income. These financial assets are recorded in the consolidated statement of financial position at fair value. Changes in fair value and dividend income are recorded under “Net gain from financial instruments at fair value through profit or loss” in the consolidated income statement. Gains and losses arising from the derecognition of equity instruments at fair value through profit or loss are also reflected under “Net gain from financial instruments at fair value through profit or loss” in the consolidated income statement. Financial assets at fair value through other comprehensive income Investments in equity instruments designated at initial recognition as not held for trading are classified at fair value through other comprehensive income. These financial assets are initially measured at fair value plus transaction costs. Subsequently, they are measured at fair value, with gains and losses arising from changes in fair value recognized in other comprehensive income and accumulated under equity. The cumulative gain or loss will not be reclassified to the consolidated income statement on disposal of the investments. Dividends on these investments are recognized under “Revenue from financial assets at fair value through other comprehensive income” in the consolidated income statement when the entity’s right to receive payment of dividend is established in accordance with IAS 18: “Revenue”, unless the dividends clearly represent a recovery of part of the cost of the investment.
Notes to the Consolidated Financial Statements | 31 December 2015
BLOM BANK s.A.L. 110
b. Financial liabilitiesLiabilities are initially measured at fair value plus, in the case of a financial liability not at fair value through profit or loss, particular transaction costs. Liabilities are subsequently measured at amortised cost or fair value. The Group classifies all financial liabilities as subsequently measured at amortised cost using the effective interest method, except for: • financial liabilities at fair value through profit or loss (including derivatives); • financial liabilities that arise when a transfer of a financial asset does not
qualify for derecognition or when the continuing involvement approach applies.
• financial guarantee contracts and commitments to provide a loan at a below-market interest rate which after initial recognition are subsequently measured at the higher of the amount determined in accordance with IAS 37 Provisions, Contingent Liabilities and Contingent Assets and the amount initially recognised less, when appropriate, cumulative amortisation recognised in accordance with IAS 18 Revenue.
Fair value optionThe Group may, at initial recognition, irrevocably designate a financial liability as measured at fair value through profit or loss when:
• doing so results in more relevant information, because it either eliminates or significantly reduces a measurement or recognition inconsistency (sometimes referred to as ‘an accounting mismatch’) that would otherwise arise from measuring assets or liabilities or recognizing the gains and losses on them on different bases; or
• a group of financial liabilities or financial assets and financial liabilities is managed and its performance is evaluated on a fair value basis, in accordance with a documented risk management or investment strategy, and information about the group is provided internally on that basis to the entity’s key management personnel.
The amount of changes in fair value of a financial liability designated at fair value through profit or loss at initial recognition that is attributable to changes in credit risk of that liability is recognized in other comprehensive income, unless such recognition would create an accounting mismatch in the consolidated income statement. Changes in fair value attributable to changes in credit risk are not reclassified to consolidated income statement.
As at 31 December 2015, financial liabilities designated at amortized cost held by the group consist of due to central banks, repurchase agreements, due to banks and financial institutions, and customers’ and related parties’ deposits.
Due to central banks, repurchase agreements, due to banks and financial institutions, customers’ deposits and related parties depositsAfter initial measurement, due to central banks, repurchase agreements, due to banks and financial institutions, customers’ and related parties’ deposits are measured at amortised cost less amounts repaid using the effective interest rate method. Amortised cost is calculated by taking into account any discount or premium on the issue and costs that are an integral part of the effective interest rate method.
c. Derivatives recorded at fair value through profit or lossThe Group uses derivatives such as futures, currency swaps, forward foreign exchange contracts and equity swaps and options. Derivatives are recorded at fair value and carried as assets when their fair value is positive and as liabilities when their fair value is negative. Changes in the fair value of derivatives are recognised in “Net gain from financial instruments at
Notes to the Consolidated Financial Statements | 31 December 2015

Annual Report 2015 111
fair value through profit or loss” in the consolidated income statement. An embedded derivative shall be separated from the host and accounted for as a derivative if, and only if: (a) the hybrid contract contains a host that is not an asset within the scope
of IFRS 9
(b) the economic characteristics and risks of the embedded derivative are not closely related to the economic characteristics and risks of the host
(c) a separate instrument with the same terms as the embedded derivative would meet the definition of a derivative; and
(d) the hybrid contract is not measured at fair value with changes in fair value recognised in profit or loss
(iii) Day 1 profit or lossWhen the transaction price differs from the fair value of other observable current market transactions in the same instrument or based on a valuation technique whose variables include only data from observable markets, the Group immediately recognizes the difference between the transaction price and fair value (a “Day 1” profit or loss) in the consolidated income statement. In cases where fair value is determined using data which is not observable, the difference between the transaction price and model value is only recognized in the consolidated income statement when the inputs become observable, or when the instrument is derecognized.
(iv) Reclassification of financial assets The Group reclassifies financial assets if the objective of the business model for managing those financial assets changes. Such changes are expected to be very infrequent. Such changes are determined by the Group’s senior management as a result of external or internal changes when significant to the Group’s operations and demonstrable to external parties. If financial assets are reclassified, the reclassification is applied prospectively from the reclassification date, which is the first day of the first reporting period following the change in business model that results in the reclassification of financial assets. Any previously recognised gains, losses or interest are not restated. If a financial asset is reclassified so that it is measured at fair value, its fair value is determined at the reclassification date. Any gain or loss arising from a difference between the previous carrying amount and fair value is recognised in profit or loss. If a financial asset is reclassified so that it is measured at amortised cost, its fair value at the reclassification date becomes its new carrying amount. Derecognition of financial assets and financial liabilities
(i) Financial assetsA financial asset (or, where applicable a part of a financial asset or part of a group of similar financial assets) is derecognized when:
• The rights to receive cash flows from the asset have expired.• The Group has transferred its rights to receive cash flows from the asset
or has assumed an obligation to pay the received cash flows in full without material delay to a third party under a “pass-through” arrangement; and either:
(a) The Group has transferred substantially all the risks and rewards of the asset, ora
(b) The Group has neither transferred nor retained substantially all the risks and rewards of the asset, but has transferred control of the asset.
When the Group has transferred its rights to receive cash flows from an asset or has entered into a pass-through arrangement, and has neither transferred nor retained substantially all the risks and rewards of the asset nor transferred
Notes to the Consolidated Financial Statements | 31 December 2015
BLOM BANK s.A.L. 112
control of the asset, the asset is recognized to the extent of the Group’s continuing involvement in the asset. In that case, the Group also recognizes an associated liability. The transferred asset and the associated liability are measured on a basis that reflects the rights and obligations that the Group has retained.
Continuing involvement that takes the form of a guarantee over the transferred asset is measured at the lower of the original carrying amount of the asset and the maximum amount of consideration that the Group could be required to repay.
(ii) Financial liabilitiesA financial liability is derecognized when the obligation under the liability is discharged or cancelled or expires. Where an existing financial liability is replaced by another from the same lender on substantially different terms, or the terms of an existing liability are substantially modified, such an exchange or modification is treated as a derecognition of the original liability and the recognition of a new liability. The difference between the carrying value of the original financial liability and the consideration paid is recognized in the consolidated income statement.
Repurchase and reverse repurchase agreementsSecurities sold under agreements to repurchase at a specified future date are not derecognised from the consolidated statement of financial position as the Group retains substantially all the risks and rewards of ownership. The corresponding cash received is recognised in the consolidated statement of financial position as an asset with a corresponding obligation to return it, including accrued interest as a liability within “repurchase agreements”, reflecting the transaction’s economic substances as a loan to the Group. The difference between the sale and repurchase prices is treated as interest expense and is accrued over the life of the agreement using the EIR. When the counterparty has the right to sell or repledge the securities, the Group reclassifies those securities in its consolidated statement of financial position to “Financial assets given as collateral” as appropriate.
Conversely, securities purchased under agreements to resell at a specified future date are not recognised in the consolidated statement of financial position. The consideration paid, including accrued interest is recorded in the consolidated statement of financial position within “Cash collateral on securities borrowed and reverse purchase agreements”, reflecting the transaction’s economic substance as a loan by the Group. The difference between the purchase and resale prices is recorded in “Net interest income” and is accrued over the life of the agreement using the EIR.
If securities purchased under agreement to resell are subsequently sold to third parties, the obligation to return the securities is recorded as a short sale within “Financial liabilities at fair value through profit or loss” and measured at fair value with any gains or losses included in “Net gain from financial instruments at fair value through profit or loss” in the consolidated income statement.
Fair value measurementThe Group measures financial instruments, such as, derivatives, financial assets at fair value through profit or loss and financial assets at fair value through other comprehensive income, at fair value at each consolidated statement of financial position date. Fair value related disclosures for financial instruments and non-financial assets that are measured at fair value or where fair values are disclosed, are summarised in the notes.
Fair value is the price that would be received to sell an asset or paid to transfer a liability in an orderly transaction between market participants at the measurement date. The fair value measurement is based on the presumption that the transaction to sell the asset or transfer the liability takes place either:
• In the principal market for the asset or liability, or• In the absence of a principal market, in the most advantageous market for the asset or liability
Notes to the Consolidated Financial Statements | 31 December 2015
Annual Report 2015 113
The principal or the most advantageous market must be accessible by the Group. The fair value of an asset or a liability is measured using the assumptions that market participants would use when pricing the asset or liability, assuming that market participants act in their economic best interest.
A fair value measurement of a non-financial asset takes into account a market participant’s ability to generate economic benefits by using the asset in its highest and best use or by selling it to another market participant that would use the asset in its highest and best use.
The Group uses valuation techniques that are appropriate in the circumstances and for which sufficient data are available to measure fair value, maximizing the use of relevant observable inputs and minimizing the use of unobservable inputs.
All assets and liabilities for which fair value is measured or disclosed in the consolidated financial statements are categorized within the fair value hierarchy, described as follows, based on the lowest level input that is significant to the fair value measurement as a whole:
• Level 1 — Quoted (unadjusted) market prices in active markets for identical assets or liabilities
• Level 2 — Valuation techniques for which the lowest level input that is significant to the fair value measurement is directly or indirectly observable
• Level 3 — Valuation techniques for which the lowest level input that is significant to the fair value measurement is unobservable
For assets and liabilities that are recognised in the consolidated financial statements on a recurring basis, the Group determines whether transfers have occurred between Levels in the hierarchy by re-assessing categorization (based on the lowest level input that is significant to the fair value measurement as a whole) at the end of each reporting period.
The Group’s management determines the policies and procedures for recurring fair value measurement, such as unquoted financial assets.
At each reporting date, the management analyses the movements in the values of assets and liabilities which are required to be re-measured or re-assessed as per the Group’s accounting policies. For this analysis, the management verifies the major inputs applied in the latest valuation by agreeing the information in the valuation computation to contracts and other relevant documents.
For the purpose of fair value disclosures, the Group has determined classes of assets and liabilities on the basis of the nature, characteristics and risks of the asset or liability and the level of the fair value hierarchy as explained above.
Impairment of financial assetsThe Group assesses at each reporting date whether there is any objective evidence that a financial asset or a group of financial assets is impaired. An impairment exists if one or more events that has occurred since the initial recognition of the asset (an incurred ‘loss event’), has an impact on the estimated future cash flows of the financial asset or the group of financial assets that can be reliably estimated. Evidence of impairment may include indications that the debtors or a group of debtors is experiencing significant financial difficulty, default or delinquency in interest or principal payments, the probability that they will enter bankruptcy or other financial reorganisation and observable data indicating that there is a measurable decrease in the estimated future cash flows, such as changes in arrears or economic conditions that correlate with defaults.
Notes to the Consolidated Financial Statements | 31 December 2015
BLOM BANK s.A.L. 114
(i) Financial assets at amortised costFor financial assets carried at amortised cost, the Group first assesses whether impairment exists individually for financial assets that are individually significant, or collectively for financial assets that are not individually significant. If the Group determines that no objective evidence of impairment exists for an individually assessed financial asset, whether significant or not, it includes the asset in a group of financial assets with similar credit risk characteristics and collectively assesses them for impairment. Assets that are individually assessed for impairment and for which an impairment loss is, or continues to be, recognised are not included in a collective assessment of impairment.
The amount of any impairment loss identified is measured as the difference between the asset’s carrying amount and the present value of estimated future cash flows (excluding future expected credit losses that have not yet been incurred). The present value of the estimated future cash flows is discounted at the financial asset’s original effective interest rate.
The carrying amount of the asset is reduced through the use of an allowance account and the loss is recognised in the consolidated income statement. Interest income continues to be accrued on the reduced carrying amount and is accrued using the rate of interest used to discount the future cash flows for the purpose of measuring the impairment loss. Loans together with the associated allowance are written off when there is no realistic prospect of future recovery and all collateral has been realised or has been transferred to the Group. If, in a subsequent year, the amount of the estimated impairment loss increases or decreases because of an event occurring after the impairment was recognised, the previously recognised impairment loss is increased or reduced by adjusting the allowance account. If a write-off is later recovered, the recovery is credited to “Net credit losses” in the consolidated income statement.
(ii) Renegotiated loans Where possible, the Group seeks to restructure loans rather than to take possession of collateral. This may involve extending the payment arrangements and the agreement of new loan conditions. Once the terms have been renegotiated any impairment is measured using the original effective interest rate as calculated before the modification of terms and the loan is no longer considered past due. The loans continue to be subject to an individual or collective impairment assessment, calculated using the loan’s original effective interest rate.
(iii) Collateral repossessedThe Group occasionally acquires properties in settlement of loans and advances. Upon initial recognition, those assets are measured at fair value as approved by the regulatory authorities. Subsequently these properties are measured at the lower of carrying value or net realizable value.
Upon sale of repossessed assets, any gain or loss realized is recognized in the consolidated income statement under “Other operating income” or “Other operating expenses”. Gains resulting from the sale of repossessed assets are transferred to “Reserves for capital increase” in the following financial year.
Notes to the Consolidated Financial Statements | 31 December 2015
Annual Report 2015 115
Hedge accountingThe Group makes use of derivative instruments to manage exposures to interest rate, foreign currency and credit risks, including exposures arising from forecast transactions and firm commitments. In order to manage particular risks, the Group applies hedge accounting for transactions which meet the specified criteria.
At inception of the hedge relationship, the Group formally documents the relationship between the hedged item and the hedging instrument, including the nature of the risk, the objective and strategy for undertaking the hedge and the method that will be used to assess the effectiveness of the hedging relationship.
At each hedge effectiveness assessment date, a hedge relationship must be expected to be highly effective on a prospective basis and demonstrate that it was effective (retrospective effectiveness) for the designated period in order to qualify for hedge accounting. A formal assessment is undertaken to ensure the hedging instrument is expected to be highly effective in offsetting the designated risk in the hedged item, both at inception and at each quarter end on an ongoing basis. A hedge is expected to be highly effective if the changes in fair value or cash flows attributable to the hedged risk during the period for which the hedge is designated are expected to offset in a range of 80% to 125% and are expected to achieve such offset in future periods. Hedge ineffectiveness is recognized in the consolidated income statement in “Net gain from financial instruments at fair value through profit or loss”. For situations where that hedged item is a forecast transaction, the Group also assesses whether the transaction is highly probable and presents an exposure to variations in cash flows that could ultimately affect the consolidated income statement.
(i) Fair value hedgesFor designated and qualifying fair value hedges, the change in the fair value of a hedging derivative is recognised in the consolidated income statement. Meanwhile, the change in the fair value of the hedged item attributable to the risk hedged is recorded as part of the carrying value of the hedged item and is also recognised in “Net gain from financial instruments at fair value through profit or loss” in the consolidated income statement.
If the hedging instrument expires or is sold, terminated or exercised, or where the hedge no longer meets the criteria for hedge accounting, the hedge relationship is discontinued prospectively. For hedged items recorded at amortised cost, the difference between the carrying value of the hedged item on termination and the face value is amortised over the remaining term of the original hedge using the effective interest rate (EIR method). If the hedged item is derecognised, the unamortised fair value adjustment is recognised immediately in the consolidated income statement.
(ii) Cash flow hedgesFor designated and qualifying cash flow hedges, the effective portion of the gain or loss on the hedging instrument is initially recognised directly in equity in the “Cash flow hedge” reserve. The ineffective portion of the gain or loss on the hedging instrument is recognised immediately in the consolidated income statement.
Notes to the Consolidated Financial Statements | 31 December 2015
BLOM BANK s.A.L. 116
When the forecast transaction subsequently results in the recognition of a non-financial asset or a non-financial liability, the gains and losses previously recognised in the other comprehensive income are removed from the reserve and included in the initial cost of the asset or liability.
When the hedged cash flow affects the consolidated income statement, the gain or loss on the hedging instrument is recorded in the corresponding income or expense line of the consolidated income statement. When a hedging instrument expires, or is sold, terminated, exercised, or when a hedge no longer meets the criteria for hedge accounting, any cumulative gain or loss existing in equity at that time remains in equity and is recognised when the hedged forecast transaction is ultimately recognised in the consolidated income statement. When a forecast transaction is no longer expected to occur, the cumulative gain or loss that was reported in equity is immediately transferred to the consolidated income statement.
(iii) Hedge of a net investment Hedges of net investments in a foreign operation, including a hedge of a monetary item that is accounted for as part of the net investment, are accounted for in a way similar to cash flow hedges. Gains or losses on the hedging instrument relating to the effective portion of the hedge are recognised directly in equity while any gains or losses relating to the ineffective portion are recognised in the consolidated income statement.
On disposal of the foreign operation, the cumulative value of any such gains or losses recognised directly in equity is transferred to the consolidated income statement.
LeasingThe determination of whether an arrangement is (or contains) a lease is based on the substance of the arrangement at the inception of the lease. The arrangement is, or contains, a lease if fulfilment of the arrangement is dependent on the use of a specific asset or assets and the arrangement conveys a right to use the asset or assets, even if that right is not explicitly specified in an arrangement.
Group as a lessee A lease is classified at the inception date as a finance lease or an operating lease. A lease that transfers substantially all the risks and rewards incidental to ownership to the Group is classified as a finance lease. Finance leases are capitalised at the commencement of the lease at the inception date fair value of the leased property or, if lower, at the present value of the minimum lease payments. Lease payments are apportioned between finance charges and reduction of the lease liability so as to achieve a constant rate of interest on the remaining balance of the liability. Finance charges are recognised in finance costs in the statement of profit or loss.
A leased asset is depreciated over the useful life of the asset. However, if there is no reasonable certainty that the Group will obtain ownership by the end of the lease term, the asset is depreciated over the shorter of the estimated useful life of the asset and the lease term.
Notes to the Consolidated Financial Statements | 31 December 2015
Annual Report 2015 117
Operating lease payments are recognised as an operating expense in the statement of profit or loss on a straight-line basis over the lease term.
Group as a lessor Leases in which the Group does not transfer substantially all the risks and rewards of ownership of an asset are classified as operating leases. Initial direct costs incurred in negotiating and arranging an operating lease are added to the carrying amount of the leased asset and recognised over the lease term on the same basis as rental income. Contingent rents are recognised as revenue in the period in which they are earned. Recognition of income and expensesRevenue is recognised to the extent that it is probable that the economic benefits will flow to the Group and the revenue can be reliably measured. The following specific recognition criteria must also be met before revenue is recognised.
(i) Interest and similar income and expense For all financial instruments measured at amortized cost, interest income or expense is recorded using the EIR method, which is the rate that exactly discounts estimated future cash payments or receipts through the expected life of the financial instrument or a shorter period, where appropriate, to the net carrying amount of the financial asset or financial liability. The calculation takes into account all contractual terms of the financial instrument and includes any fees or incremental costs that are directly attributable to the instrument and are an integral part of the effective interest rate, but not future credit losses. The carrying amount of the financial asset or financial liability is adjusted if the Group revises its estimates of payments or receipts. The adjusted carrying amount is calculated based on the original effective interest rate and the change in the carrying amount is recorded as “Interest and similar income” for financial assets and “Interest and similar expense” for financial liabilities. Once the recorded value of a financial asset on a group of similar financial assets has been reduced due to an impairment loss, interest income continue to be recognized using the rate of interest used to discount the future cash flows of the purpose of measuring the impairment loss. (ii) Fee and commission incomeThe Group earns fee and commission income from a diverse range of services it provides to its customers. Fee income can be divided into the following two categories: Fee income earned from services that are provided over a certain period of timeFees earned for the provision of services over a period of time are accrued over that period. These fees include commission income and asset management, custody and other management and advisory fees. Loan commitment fees for loans that are likely to be drawn down and other credit related fees are deferred (together with any incremental costs) and recognized as an adjustment to the EIR on the loan. When it is unlikely that a loan be drawn down, the loan commitment fees are recognized over the commitment period on a straight line basis.
Notes to the Consolidated Financial Statements | 31 December 2015
BLOM BANK s.A.L. 118
Fee income from providing transaction servicesFee arising from negotiating or participating in the negotiation of a transaction for a third party, such as the arrangement of the acquisition of shares or other securities or the purchase or sale of businesses, are recognized on completion of the underlying transaction. Fee or components of fees that are linked to a certain performance are recognized after fulfilling the corresponding criteria. Fee and commission income from providing insurance servicesInsurance and investment contract policyholders are charged for policy administration services, investment management services, surrenders and other contract fees. These fees are recognized as revenue over the period in which the related services are performed. If the fees are for services provided in future periods, then they are deferred and recognized over those future periods. (iii) Dividend incomeDividend income is recognised when the right to receive the payment is established. (iv) Net gain from financial instruments at fair value through profit or loss Results arising from financial assets at fair value through profit or loss include all gains and losses from changes in fair value and related income or expense and dividends for financial assets at fair value through profit or loss. This includes any ineffectiveness recorded in hedging transactions. This caption also includes the results arising from trading activities including all gains and losses from changes in fair value and related income or expense and dividends for financial assets held for trading. (v) Insurance revenueFor the insurance subsidiaries, net premiums and accessories (gross premiums) are taken to income over the terms of the policies to which they relate using the prorate temporise method for non-marine business and 25% of gross premiums for marine business. Unearned premiums reserve represents the portion of the gross premiums written relating to the unexpired period of coverage. If the unearned premiums reserve is not considered adequate to cover future claims arising on these premiums a premium deficiency reserve is created.
Cash and cash equivalentsCash and cash equivalents as referred to in the cash flow statement comprise balances with original maturities of a period of three months or less including: cash and balances with the central banks, deposits with banks and financial institutions, due to central banks and due to banks and financial institutions.
Property and equipment Property and equipment is stated at cost excluding the costs of day-to-day servicing, less accumulated depreciation and accumulated impairment in value. Such cost includes the cost of replacing part of the property and equipment if the recognition criteria are met. When significant parts
Notes to the Consolidated Financial Statements | 31 December 2015
Annual Report 2015 119
of property and equipment are required to be replaced at intervals, the Group recognises such parts as individual assets with specific useful lives and depreciates them accordingly. Likewise, when a major inspection is performed, its cost is recognised in the carrying amount of the equipment as a replacement if the recognition criteria are satisfied. All other repair and maintenance costs are recognised in the consolidated income statement as incurred. The present value of the expected cost for the decommissioning of an asset after its use is included in the cost of the respective asset if the recognition criteria for a provision are met.
Changes in the expected useful life are accounted for by changing the depreciation period or method, as appropriate and treated as changes in accounting estimates.
Depreciation is calculated using the straight line method to write down the cost of property and equipment to their residual values over their estimated useful lives. Land is not depreciated. The estimated useful lives are as follows:
Buildings 50 yearsFurniture, office installations and computer equipment (2–16.67) yearsVehicles 6.67 years Property and equipment is derecognised on disposal or when no future economic benefits are expected from its use. Any gain or loss arising on derecognition of the asset (calculated as the difference between the net disposal proceeds and the carrying amount of the asset) is recognized in “Net gain on disposal of fixed assets” in the year the asset is derecognized. The asset’s residual lives and methods of depreciation are reviewed at each financial year end and adjusted prospectively if applicable.
Assets obtained in settlement of debtAssets obtained in settlement of debt are measured at the lower of their carrying amount and fair value less costs to sell. Non-current assets are classified as held for sale if their carrying amounts will be recovered principally through a sale transaction rather than through continuing use. This condition is regarded as met only when the sale is highly probable and the asset or disposal group is available for immediate sale in its present condition, management has committed to the sale, and the sale is expected to have been completed within one year from the date of classification.
Business combinations and goodwillBusiness combinations are accounted for using the acquisition method. The cost of an acquisition is measured as the aggregate of the consideration transferred, measured at acquisition date fair value and the amount of any non-controlling interest in the acquiree. For each business combination, the Group elects whether to measures the non-controlling interest in the acquiree at fair value or at the proportionate share of the acquiree’s identifiable net assets. Acquisition-related costs incurred are expensed and included in administrative expenses.
When the Group acquires a business, it assesses the financial assets and liabilities assumed for appropriate classification and designation in
Notes to the Consolidated Financial Statements | 31 December 2015
BLOM BANK s.A.L. 120
accordance with the contractual terms, economic circumstances and pertinent conditions as at the acquisition date. This includes the separation of embedded derivatives in host contracts by the acquiree.
If the business combination is achieved in stages, any previously held equity interest is remeasured at its acquisition date fair value and any resulting gain or loss is recognized in the consolidated income statement.
Any contingent consideration to be transferred by the acquirer will be recognised at fair value at the acquisition date. Contingent consideration classified as an asset or liability that is a financial instrument and within the scope of IAS 39 Financial Instruments: Recognition and Measurement, is measured at fair value with changes in fair value recognised either in either profit or loss or as a change to OCI. If the contingent consideration is not within the scope of IAS 39, it is measured in accordance with the appropriate IFRS. Contingent consideration that is classified as equity is not remeasured and subsequent settlement is accounted for within equity.
Goodwill is initially measured at cost being the excess of the aggregate of the consideration transferred and the amount recognised for non-controlling interest, and any previous interest held, over the net identifiable assets acquired and liabilities assumed. If the fair value of the net assets acquired is in excess of the aggregate consideration transferred, the Group re-assesses whether it has correctly identified all of the assets acquired and all of the liabilities assumed and reviews the procedures used to measure the amounts to be recognised at the acquisition date. If the re-assessment still results in an excess of the fair value of net assets acquired over the aggregate consideration transferred, then the gain is recognised in profit or loss.
After initial recognition, goodwill is measured at cost less any accumulated impairment losses. For the purpose of impairment testing, goodwill acquired in a business combination is, from the acquisition date, allocated to each of the Group’s cash-generating units that are expected to benefit from the combination, irrespective of whether other assets or liabilities of the acquiree are assigned to those units.
Where goodwill forms part of a cash-generating unit and part of the operation within that unit is disposed of, the goodwill associated with the operation disposed of is included in the carrying amount of the operation when determining the gain or loss on disposal of the operation. Goodwill disposed of in this circumstance is measured based on the relative values of the operation disposed of and the portion of the cash-generating unit retained.
Intangible assetsAn intangible asset is recognized only when its cost can be measured reliably and it is probable that the expected future economic benefits that are attributable to it will flow to the Group. Intangible assets acquired separately are measured on initial recognition at cost. The cost of intangible assets acquired in a business combination is their fair value as at the date of acquisition. Following initial recognition,
Notes to the Consolidated Financial Statements | 31 December 2015
Annual Report 2015 121
intangible assets are carried at cost less any accumulated amortisation and any accumulated impairment losses. The useful lives of intangible assets are assessed to be either finite of indefinite. Intangible assets with finite lives are amortised over the useful economic life. The amortisation period and the amortisation method for an intangible asset with a finite useful life are reviewed at least at each financial year-end. Changes in the expected useful life or the expected pattern of consumption of future economic benefits embodied in the asset are accounted for by changing the amortisation period or method, as appropriate, and treated as changes in accounting estimates. The amortisation expense on intangible assets with finite lives is recognised in the consolidated income statement. Amortisation is calculated using the straight-line method to write down the cost of intangible assets to their residual values over their estimated useful lives as follows: • Key money lower of lease period or 5 years• Software development 2.5 years
Intangible assets with indefinite useful lives are not amortised, but are tested for impairment annually, either individually or at the cash-generating unit level. The assessment of indefinite life is reviewed annually to determine whether the indefinite life continues to be supportable. If not, the change in useful life from indefinite to finite is made on a prospective basis.
Gains or losses arising from de-recognition of an intangible asset are measured as the difference between the net disposal proceeds and the carrying amount of the asset and are recognised in the consolidated income statement when the asset is derecognised.The Group does not have intangible assets with indefinite economic life.
Impairment of non-financial assetsThe Group assesses at each reporting date whether there is an indication that an asset may be impaired. If any indication exists, or when annual impairment testing for an asset is required, the Group estimates the asset’s recoverable amount. An asset’s recoverable amount is the higher of an asset’s or cash-generating unit’s fair value less costs to sell and its value in use. Where the carrying amount of an asset or cash-generating unit exceeds its recoverable amount, the asset is considered impaired and is written down to its recoverable amount. In assessing value in use, the estimated future cash flows are discounted to their present value using a pre-tax discount rate that reflects current market assessments of the time value of money and the risks specific to the asset. In determining fair value less costs to sell, an appropriate valuation model is used. These calculations are corroborated by valuation multiples, quoted share prices for publicly traded subsidiaries or other available fair value indicators.
Notes to the Consolidated Financial Statements | 31 December 2015
BLOM BANK s.A.L. 122
For assets excluding goodwill, an assessment is made at each reporting date as to whether there is any indication that previously recognised impairment losses may no longer exist or may have decreased. If such indication exists, the recoverable amount is estimated. A previously recognised impairment loss is reversed only if there has been a change in the estimates used to determine the asset’s recoverable amount since the last impairment loss was recognised. The reversal is limited so that the carrying amount of the asset does not exceed its recoverable amount, nor exceeds the carrying amount that would have been determined, net of depreciation, had no impairment loss been recognised for the asset in prior years. Such reversal is recognized in the consolidated income statement.
Impairment losses relating to goodwill cannot be reversed in future periods.
Financial guaranteesIn the ordinary course of business, the Group gives financial guarantees, consisting of letters of credit, guarantees and acceptances. Financial guarantees are initially recognised in the consolidated financial statements (within “Other liabilities”) at fair value, being the premium received. Subsequent to initial recognition, the Group’s liability under each guarantee is measured at the higher of the amount initially recognised less, when appropriate, cumulative amortization recognised in the consolidated income statement, and the best estimate of expenditure required to settle any financial obligation arising as a result of the guarantee. Any increase in the liability relating to financial guarantees is recorded in the consolidated income statement in “Net credit losses”. The premium received is recognised in the consolidated income statement on a straight line basis over the life of the guarantee in “Net fees and commission income”.
Provisions for risks and charges Provisions are recognised when the Group has a present obligation (legal or constructive) as a result of a past event, and it is probable that an outflow of resources embodying economic benefits will be required to settle the obligation and a reliable estimate can be made of the amount of the obligation. The expense relating to any provision is presented in the consolidated income statement net of any reimbursement.
Employees’ end-of-service benefitsFor the Group and its subsidiaries operating in Lebanon, end-of-service benefit subscriptions paid and due to the National Social Security Fund (NSSF) are calculated on the basis of 8.5% of the staff salaries. The final end-of-service benefits due to employees after completing 20 years of service, at the retirement age, or if the employee permanently leaves employment, are calculated based on the last salary multiplied by the number of years of service. The Group is liable to pay to the NSSF the difference between the subscriptions paid and the final end-of-service benefits due to employees. The Group provides for end-of-service benefits on that basis. End-of-service benefits for employees at foreign branches and subsidiaries are accrued for in accordance with the laws and regulations of the respective countries in which the branches and subsidiaries are located.
TaxesTaxes are provided for in accordance with regulations and laws that are effective in the countries where the Group operates.
Notes to the Consolidated Financial Statements | 31 December 2015
Annual Report 2015 123
(i) Current taxCurrent tax assets and liabilities for the current and prior years are measured at the amount expected to be recovered from or paid to the taxation authorities. The tax rates and tax laws used to compute the amount are those that are enacted or substantively enacted at the reporting date in the countries where the Group operates and generates taxable income.
Current income tax relating to items recognised directly in equity is recognised in equity and not in the consolidated income statement. Management periodically evaluates positions taken in the tax returns with respect to situations in which applicable tax regulations are subject to interpretation and establishes provisions where appropriate.
(ii) Deferred taxDeferred tax is provided on temporary differences at the reporting date between the tax bases of assets and liabilities and their carrying amounts for financial reporting purposes. Deferred tax liabilities are recognized for all taxable temporary differences, except:
• When the deferred tax liability arises from the initial recognition of goodwill or of an asset or liability in a transaction that is not a business combination and, at the time of the transaction, affects neither the accounting profit nor taxable profit or loss.
• In respect of taxable temporary differences associated with investments in subsidiaries and associates, where the timing of the reversal of the temporary differences can be controlled and it is probable that the temporary differences will not reverse in the foreseeable future.
Deferred tax assets are recognized for all deductible temporary differences, carry forward of unused tax credits and unused tax losses, to the extent that it is probable that taxable profit will be available against which the deductible temporary differences, and the carry forward of unused tax credits and unused tax losses can be utilized except:
• Where the deferred tax asset relating to the deductible temporary difference arises from the initial recognition of an asset or liability in a transaction that is not a business combination and, at the time of the transaction, affects neither the accounting profit nor taxable profit or loss.
• In respect of deductible temporary differences associated with investments in subsidiaries and associates, deferred tax assets are recognized only to the extent that it is probable that the temporary differences will reverse in the foreseeable future and taxable profit will be available against which the temporary differences can be utilized.
The carrying amount of deferred tax assets is reviewed at each consolidated statement of financial position date and reduced to the extent that it is no longer probable that sufficient taxable profit will be available to allow all or part of the deferred tax asset to be utilized. Unrecognized deferred tax assets are reassessed at each consolidated statement of financial position date and are recognized to the extent that it has become probable that future taxable profit will allow the deferred tax asset to be recovered.
Notes to the Consolidated Financial Statements | 31 December 2015
BLOM BANK s.A.L. 124
Deferred tax assets and liabilities are measured at the tax rates that are expected to apply in the year when the asset is realized or the liability is settled, based on tax rates (and tax laws) that have been enacted or substantively enacted at the consolidated statement of financial position date.
Deferred tax relating to items recognised outside profit or loss is recognised outside profit or loss. Deferred tax items are recognised in correlation to the underlying transaction either in other comprehensive income or directly in equity.
Deferred tax assets and deferred tax liabilities are offset if a legally enforceable right exists to set off current tax assets against current tax liabilities and the deferred taxes relate to the same taxable entity and the same taxation authority.
Treasury sharesOwn equity instruments of the Group which are acquired by it or by any of its subsidiaries (treasury shares) are deducted from equity and accounted for at weighted average cost. Consideration paid or received on the purchase sale, issue or cancellation of the Group’s own equity instruments is recognized directly in equity. No gain or loss is recognized in the consolidated income statement on the purchase, sale, issue or cancellation of the Group’s own equity instruments.
When the Group holds own equity instruments on behalf of its clients, those holdings are not included in the Group’s consolidated statement of financial position.
Contracts on own shares that require physical settlement of a fixed number of own shares for a fixed consideration are classified as equity and added to or deducted from equity. Contracts on own shares that require net cash settlement or provide a choice of settlement are classified as trading instruments and changes in the fair value are reported in the consolidated income statement.
Assets held in custody and under administrationThe Group provides custody and administration services that result in the holding or investing of assets on behalf of its clients. Assets held in custody or under administration, are not treated as assets of the Group and accordingly are recorded as off financial position items.
Dividends on ordinary sharesDividends on ordinary shares are recognized as a liability and deducted from equity when they are approved by the Bank’s shareholders. Interim dividends are deducted from equity when they are declared and no longer at the discretion of the Bank.
Dividends for the year that are approved after the reporting date are disclosed as an event after the reporting date.
Notes to the Consolidated Financial Statements | 31 December 2015
Annual Report 2015 125
Customers’ acceptancesCustomers’ acceptances represent term documentary credits which the Group has committed to settle on behalf of its clients against commitments by those clients (acceptances). The commitments resulting from these acceptances are stated as a liability in the consolidated statement of financial position for the same amount.
Segment reportingThe Group’s segmental reporting is based on the following operating segments: retail banking; corporate banking; treasury, money and capital markets; and asset management and private banking.
3. Significant Accounting Estimates and Judgments
The preparation of the Group’s consolidated financial statements requires management to make judgments, estimates and assumptions that affect the reported amounts of revenues, expenses, assets and liabilities, and the accompanying disclosures, and the disclosure of contingent liabilities. Uncertainty about these assumptions and estimates could result in outcomes that require a material adjustment to the carrying amount of assets or liabilities affected in future periods.
JudgmentsIn the process of applying the Group’s accounting policies, management has made the following judgments, apart from those involving estimations, which have the most significant effect in the amounts recognised in the consolidated financial statements:
Going concernThe Group’s management has made an assessment of the Group’s ability to continue as a going concern and is satisfied that the Group has the resources to continue in business for the foreseeable future. Furthermore, management is not aware of any material uncertainties that may cast significant doubt upon the Group’s ability to continue as a going concern. Therefore, the consolidated financial statements continue to be prepared on the going concern basis.
Business modelIn making an assessment whether a business model’s objective is to hold assets in order to collect contractual cash flows, the Group considers at which level of its business activities such assessment should be made.
Generally, a business model is a matter of fact which can be evidenced by the way business is managed and the information provided to management. However, in some circumstances it may not be clear whether a particular activity involves one business model with some infrequent asset sales or whether the anticipated sales indicate that there are two different business models.
Notes to the Consolidated Financial Statements | 31 December 2015

BLOM BANK s.A.L. 126
In determining whether its business model for managing financial assets is to hold assets in order to collect contractual cash flows the Group considers: - management’s stated policies and objectives for the portfolio and the
operation of those policies in practice; - how management evaluates the performance of the portfolio;- whether management’s strategy focuses on earning contractual interest
revenues;- the degree of frequency of any expected asset sales;- the reason for any asset sales; and- whether assets that are sold are held for an extended period of time
relative to their contractual maturity. Contractual cash flows of financial assetsThe Group exercises judgment in determining whether the contractual terms of financial assets it originates or acquires give rise on specific dates to cash flows that are solely payments of principal and interest on the principal outstanding and so may qualify for amortised cost measurement. In making the assessment the Group considers all contractual terms, including any prepayment terms or provisions to extend the maturity of the assets, terms that change the amount and timing of cash flows and whether the contractual terms contain leverage.
Consolidation of entities in which the Group holds less than majority of voting rightsThe Group considers that it controls Bank of Syria and Overseas SA even though it owns less than 50% of the voting rights; 49% ownership (31 December 2014: the same). This is because the Group obtained control on 1 January 2004, by virtue of agreement with other investors, over Bank of Syria and Overseas SA, and consequently, the financial statements of Bank of Syria and Overseas SA have been consolidated with those of the Group.
In its meeting held on 5 May 2010, the Bank’s board of directors approved the increase of ownership in Bank of Syria and Overseas SA up to 60% as follows:
• At a first stage, increase the ownership from 39% to 49% by acquiring International Finance Corporation’s (IFC) shares (720,000 shares) in Bank of Syria and Overseas SA.
• The remaining 11% increase to reach 60% will be performed at a later stage through acquisition from the market.
The Group considers also that it controls Syria International Insurance (Arope Syria) SA and Syria and Overseas Company for Financial Services even though it owns less than 50% of the voting rights in each entity. This is because the Group obtained control, by virtue of agreement with other investors, over Syria International Insurance (Arope Syria) SA on 1 January 2006 and because, Syria and Overseas Company for Financial Services is 52% owned by Bank of Syria and Overseas SA. Consequently, the financial statements of these two entities have been consolidated with those of the Group.
The Group also considers that it controls Aza Holding SAL even though it owns less than 50% of the voting rights; 37.44% ownership (31 December 2014: nil). This is because the Group obtained control on 1 January 2015, by virtue of agreement with other investors, over Aza Holding SAL, and consequently, the financial statements of Aza Holding SAL have been consolidated with those of the Group.
Notes to the Consolidated Financial Statements | 31 December 2015
Annual Report 2015 127
Estimates and assumptionsThe key assumptions concerning the future and other key sources of estimation uncertainty at the reporting date, that have a significant risk of causing a material adjustment to the carrying amounts of assets and liabilities within the next financial year, are described below. The Group based its assumptions and estimates on parameters available when the consolidated financial statements were prepared. Existing circumstances and assumptions about future developments, however, may change due to market changes or circumstances arising beyond the control of the Group. Such changes are reflected in the assumptions when they occur.
Fair value of financial instruments Where the fair values of financial assets and financial liabilities recorded on the consolidated statement of financial position cannot be derived from active markets, they are determined using a variety of valuation techniques that include the use of mathematical models. The inputs to these models are derived from observable market data where possible, but where observable market data are not available, judgment is required to establish fair values. The judgments include considerations of liquidity and model inputs such as volatility for longer dated derivatives and discount rates, prepayment rates and default rate assumptions for asset backed securities. Changes in assumptions about these factors could affect the reported fair value of financial instruments.
Impairment losses on loans and advancesThe Group reviews its individually significant loans and advances at each consolidated statement of financial position date to assess whether an impairment loss should be recorded in the consolidated income statement. In particular, judgment by management is required in the estimation of the amount and timing of future cash flows when determining the impairment loss. In estimating these cash flows, the Group makes judgments about the borrower’s financial situation and the net realizable value of collateral. These estimates are based on assumptions about a number of factors and actual results may differ, resulting in future changes to the allowance.
Loans and advances that have been assessed individually and found not to be impaired and all individually insignificant loans and advances are then assessed collectively, in groups of assets with similar risk characteristics, to determine whether provision should be made due to incurred loss events for which there is objective evidence but whose effects are not yet evident. The collective assessment takes account of data from the loan portfolio (such as credit quality, levels of arrears, credit utilization, loan to collateral ratios etc.), concentrations of risks and economic date (including levels of unemployment, real estate prices indices, country risk and the performance of different individual groups).
Deferred tax assetsDeferred tax assets are recognized in respect to tax losses to the extent that it is probable that taxable profit will be available against which the losses can be utilized. Judgment is required to determine the amount of deferred tax assets that can be recognized, based upon the likely timing and level of future taxable profits, together with future tax planning strategies.
Notes to the Consolidated Financial Statements | 31 December 2015
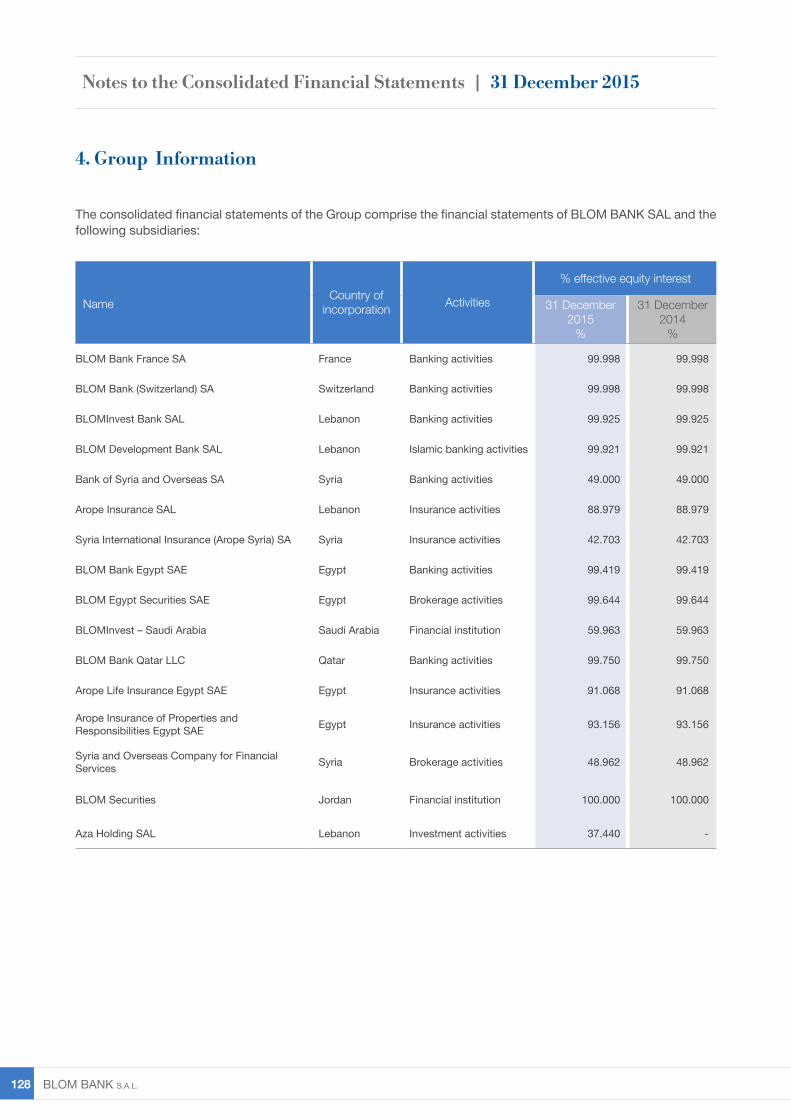
BLOM BANK s.A.L. 128
The consolidated financial statements of the Group comprise the financial statements of BLOM BANK SAL and the following subsidiaries:
NameCountry of
incorporation Activities
% effective equity interest
31 December2015
%
31 December2014
%
BLOM Bank France SA France Banking activities 99.998 99.998
BLOM Bank (Switzerland) SA Switzerland Banking activities 99.998 99.998
BLOMInvest Bank SAL Lebanon Banking activities 99.925 99.925
BLOM Development Bank SAL Lebanon Islamic banking activities 99.921 99.921
Bank of Syria and Overseas SA Syria Banking activities 49.000 49.000
Arope Insurance SAL Lebanon Insurance activities 88.979 88.979
Syria International Insurance (Arope Syria) SA Syria Insurance activities 42.703 42.703
BLOM Bank Egypt SAE Egypt Banking activities 99.419 99.419
BLOM Egypt Securities SAE Egypt Brokerage activities 99.644 99.644
BLOMInvest – Saudi Arabia Saudi Arabia Financial institution 59.963 59.963
BLOM Bank Qatar LLC Qatar Banking activities 99.750 99.750
Arope Life Insurance Egypt SAE Egypt Insurance activities 91.068 91.068
Arope Insurance of Properties and Responsibilities Egypt SAE Egypt Insurance activities 93.156 93.156
Syria and Overseas Company for Financial Services Syria Brokerage activities 48.962 48.962
BLOM Securities Jordan Financial institution 100.000 100.000
Aza Holding SAL Lebanon Investment activities 37.440 -
4. Group Information
Notes to the Consolidated Financial Statements | 31 December 2015
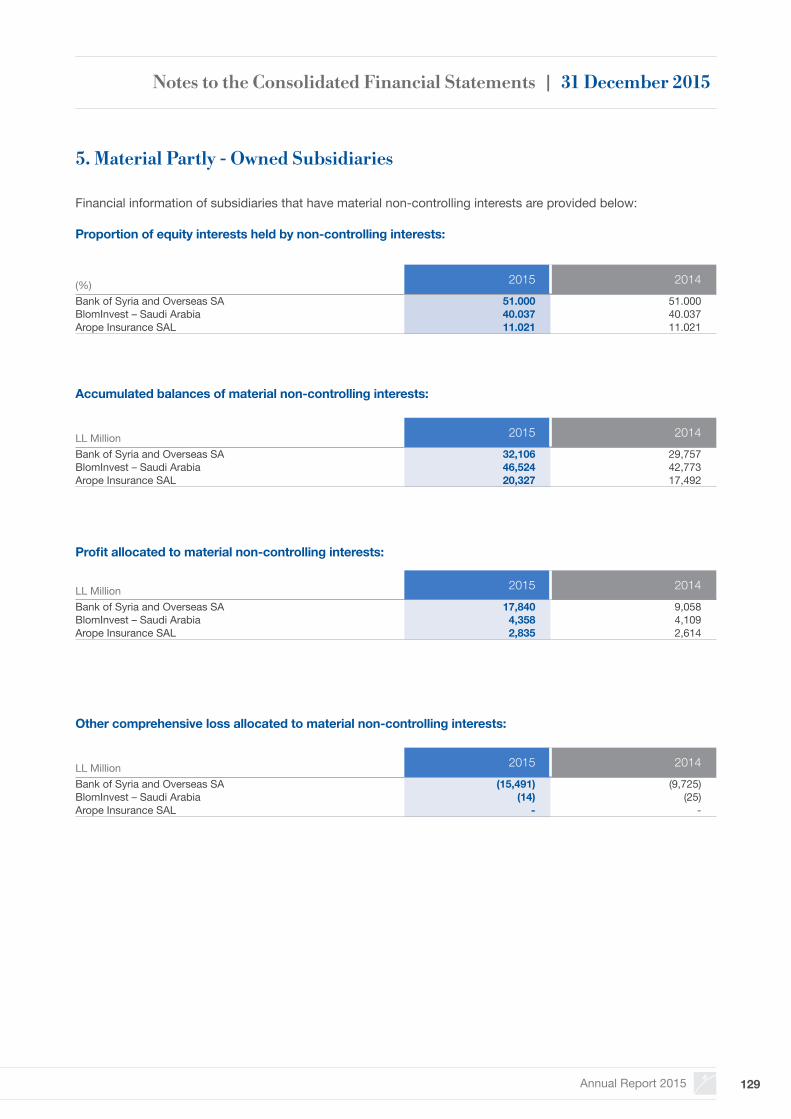
Annual Report 2015 129
Financial information of subsidiaries that have material non-controlling interests are provided below:
Proportion of equity interests held by non-controlling interests:
Accumulated balances of material non-controlling interests:
5. Material Partly - Owned Subsidiaries
(%) 2015 2014Bank of Syria and Overseas SA 51.000 51.000BlomInvest – Saudi Arabia 40.037 40.037Arope Insurance SAL 11.021 11.021
LL Million 2015 2014Bank of Syria and Overseas SA 32,106 29,757BlomInvest – Saudi Arabia 46,524 42,773Arope Insurance SAL 20,327 17,492
Profit allocated to material non-controlling interests:
Other comprehensive loss allocated to material non-controlling interests:
LL Million 2015 2014Bank of Syria and Overseas SA 17,840 9,058BlomInvest – Saudi Arabia 4,358 4,109Arope Insurance SAL 2,835 2,614
LL Million 2015 2014Bank of Syria and Overseas SA (15,491) (9,725)BlomInvest – Saudi Arabia (14) (25)Arope Insurance SAL - -
Notes to the Consolidated Financial Statements | 31 December 2015
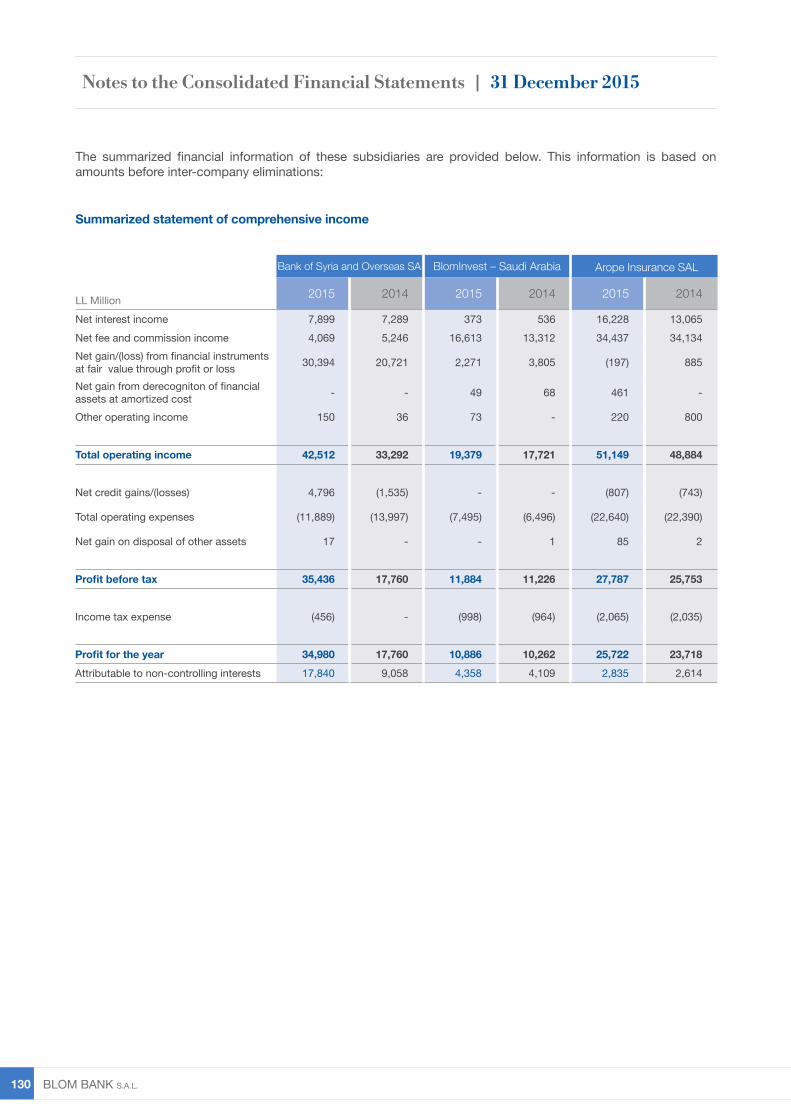
BLOM BANK s.A.L. 130
The summarized financial information of these subsidiaries are provided below. This information is based on amounts before inter-company eliminations:
Summarized statement of comprehensive income
Bank of Syria and Overseas SA BlomInvest – Saudi Arabia Arope Insurance SAL
LL Million 2015 2014 2015 2014 2015 2014
Net interest income 7,899 7,289 373 536 16,228 13,065Net fee and commission income 4,069 5,246 16,613 13,312 34,437 34,134Net gain/(loss) from financial instruments at fair value through profit or loss 30,394 20,721 2,271 3,805 (197) 885
Net gain from derecogniton of financial assets at amortized cost - - 49 68 461 -
Other operating income 150 36 73 - 220 800
Total operating income 42,512 33,292 19,379 17,721 51,149 48,884
Net credit gains/(losses) 4,796 (1,535) - - (807) (743)
Total operating expenses (11,889) (13,997) (7,495) (6,496) (22,640) (22,390)
Net gain on disposal of other assets 17 - - 1 85 2
Profit before tax 35,436 17,760 11,884 11,226 27,787 25,753
Income tax expense (456) - (998) (964) (2,065) (2,035)
Profit for the year 34,980 17,760 10,886 10,262 25,722 23,718Attributable to non-controlling interests 17,840 9,058 4,358 4,109 2,835 2,614
Notes to the Consolidated Financial Statements | 31 December 2015
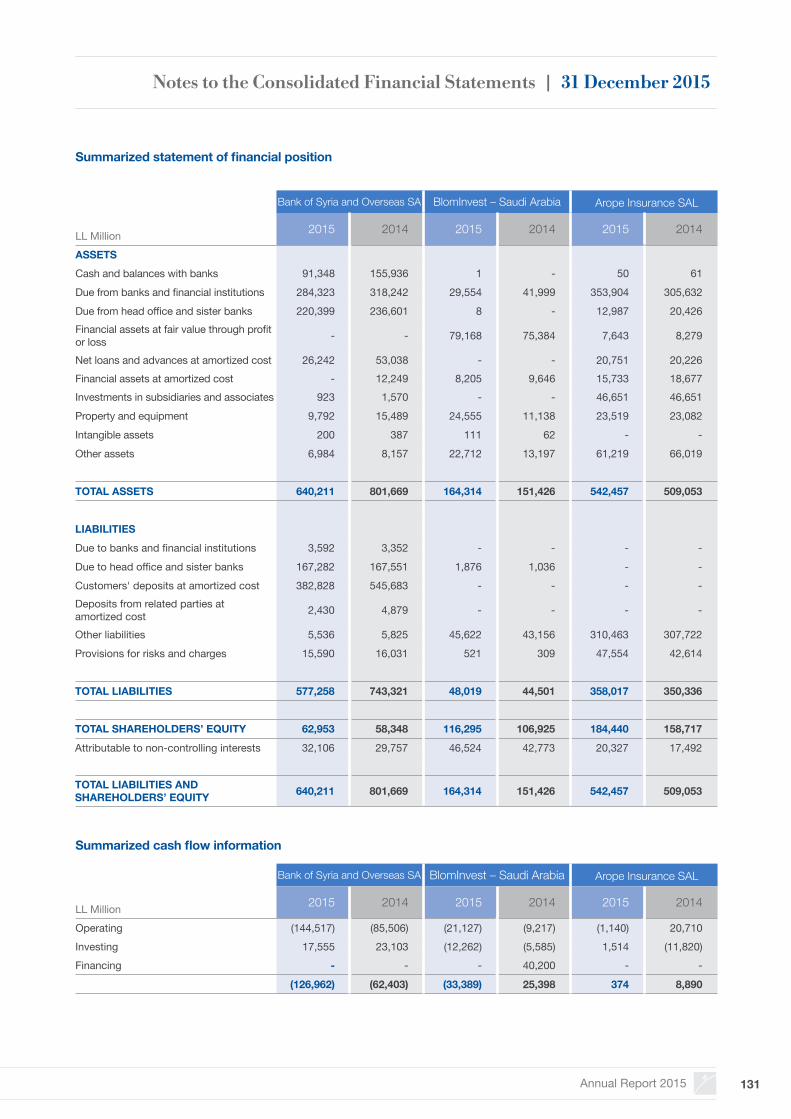
Annual Report 2015 131
Summarized statement of financial position
Summarized cash flow information
Bank of Syria and Overseas SA BlomInvest – Saudi Arabia Arope Insurance SAL
LL Million 2015 2014 2015 2014 2015 2014
ASSETSCash and balances with banks 91,348 155,936 1 - 50 61Due from banks and financial institutions 284,323 318,242 29,554 41,999 353,904 305,632Due from head office and sister banks 220,399 236,601 8 - 12,987 20,426Financial assets at fair value through profit or loss - - 79,168 75,384 7,643 8,279
Net loans and advances at amortized cost 26,242 53,038 - - 20,751 20,226Financial assets at amortized cost - 12,249 8,205 9,646 15,733 18,677Investments in subsidiaries and associates 923 1,570 - - 46,651 46,651Property and equipment 9,792 15,489 24,555 11,138 23,519 23,082Intangible assets 200 387 111 62 - -Other assets 6,984 8,157 22,712 13,197 61,219 66,019
TOTAL ASSETS 640,211 801,669 164,314 151,426 542,457 509,053
LIABILITIESDue to banks and financial institutions 3,592 3,352 - - - -Due to head office and sister banks 167,282 167,551 1,876 1,036 - -Customers' deposits at amortized cost 382,828 545,683 - - - -Deposits from related parties at amortized cost 2,430 4,879 - - - -
Other liabilities 5,536 5,825 45,622 43,156 310,463 307,722Provisions for risks and charges 15,590 16,031 521 309 47,554 42,614
TOTAL LIABILITIES 577,258 743,321 48,019 44,501 358,017 350,336
TOTAL SHAREHOLDERS’ EQUITY 62,953 58,348 116,295 106,925 184,440 158,717
Attributable to non-controlling interests 32,106 29,757 46,524 42,773 20,327 17,492
TOTAL LIABILITIES AND SHAREHOLDERS’ EQUITY 640,211 801,669 164,314 151,426 542,457 509,053
Bank of Syria and Overseas SA BlomInvest – Saudi Arabia Arope Insurance SAL
LL Million 2015 2014 2015 2014 2015 2014
Operating (144,517) (85,506) (21,127) (9,217) (1,140) 20,710Investing 17,555 23,103 (12,262) (5,585) 1,514 (11,820)Financing - - - 40,200 - -
(126,962) (62,403) (33,389) 25,398 374 8,890
Notes to the Consolidated Financial Statements | 31 December 2015
BLOM BANK s.A.L. 132
6. Segmental Information
The Group operates in four major business segments: retail; corporate; treasury, money and capital markets; and asset management and private banking.
Retail BankingProvides a diversified range of products and services to meet the personal banking and consumer finance needs of individuals. The range includes deposits, housing loans, consumer loans, credit cards, funds transfers, foreign exchange and other branch related services.
Corporate BankingProvides a comprehensive product and service offering to corporate and institutional customers, including loans and other credit facilities, deposits and current accounts, trade finance and foreign exchange operations.
Treasury, money and capital marketsIs mostly responsible for the liquidity management and market risk of the Group as well as managing the Group’s own portfolio of stocks, bonds and other financial instruments. In addition, this segment provides treasury and investments products and services to investors and other institutional customers.
Asset management and private bankingProvides investment products and services to institutional investors and intermediaries.
Management monitors the operating results of its business units separately for the purpose of making decisions about resource allocation and performance assessment. Segment performance is evaluated based on operating profit or loss which in certain respects is measured differently from operating profit or loss in the consolidated financial statements. Income taxes, personnel expenses, other operating expenses and net gain on disposal of fixed assets are managed on a group basis and are not allocated to operating segments.
Interest income is reported net since the majority of the segments’ revenues are from interest. Management primarily relies on net interest revenue as performance measure, not the gross revenue and expense amounts.
Transfer prices between operating segments are on an arm’s length basis in a manner similar to transactions with third parties.
Notes to the Consolidated Financial Statements | 31 December 2015
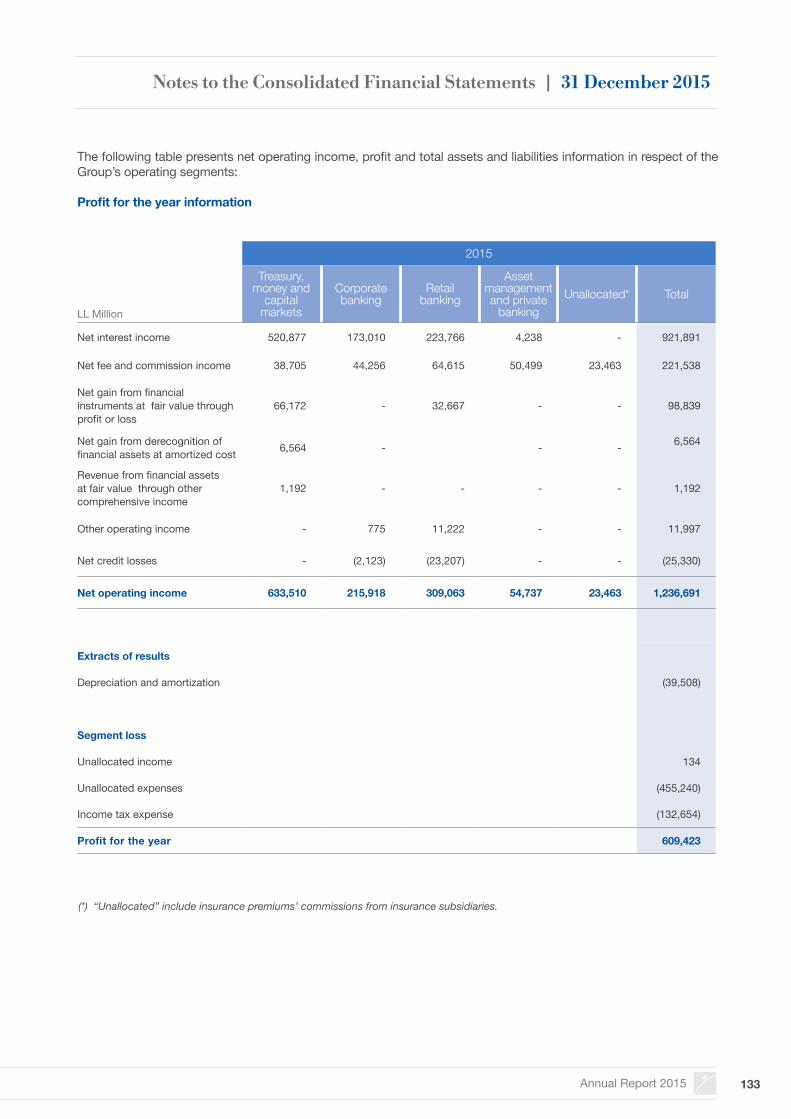
Annual Report 2015 133
The following table presents net operating income, profit and total assets and liabilities information in respect of the Group’s operating segments:
Profit for the year information
2015
LL Million
Treasury, money and
capital markets
Corporate banking
Retail banking
Asset management and private
bankingUnallocated* Total
Net interest income 520,877 173,010 223,766 4,238 - 921,891
Net fee and commission income 38,705 44,256 64,615 50,499 23,463 221,538
Net gain from financial instruments at fair value through profit or loss
66,172 - 32,667 - - 98,839
Net gain from derecognition of financial assets at amortized cost 6,564 - - - 6,564
Revenue from financial assets at fair value through other comprehensive income
1,192 - - - - 1,192
Other operating income - 775 11,222 - - 11,997
Net credit losses - (2,123) (23,207) - - (25,330)
Net operating income 633,510 215,918 309,063 54,737 23,463 1,236,691
Extracts of results
Depreciation and amortization (39,508)
Segment loss
Unallocated income 134
Unallocated expenses (455,240)
Income tax expense (132,654)
Profit for the year 609,423
(*) “Unallocated” include insurance premiums’ commissions from insurance subsidiaries.
Notes to the Consolidated Financial Statements | 31 December 2015
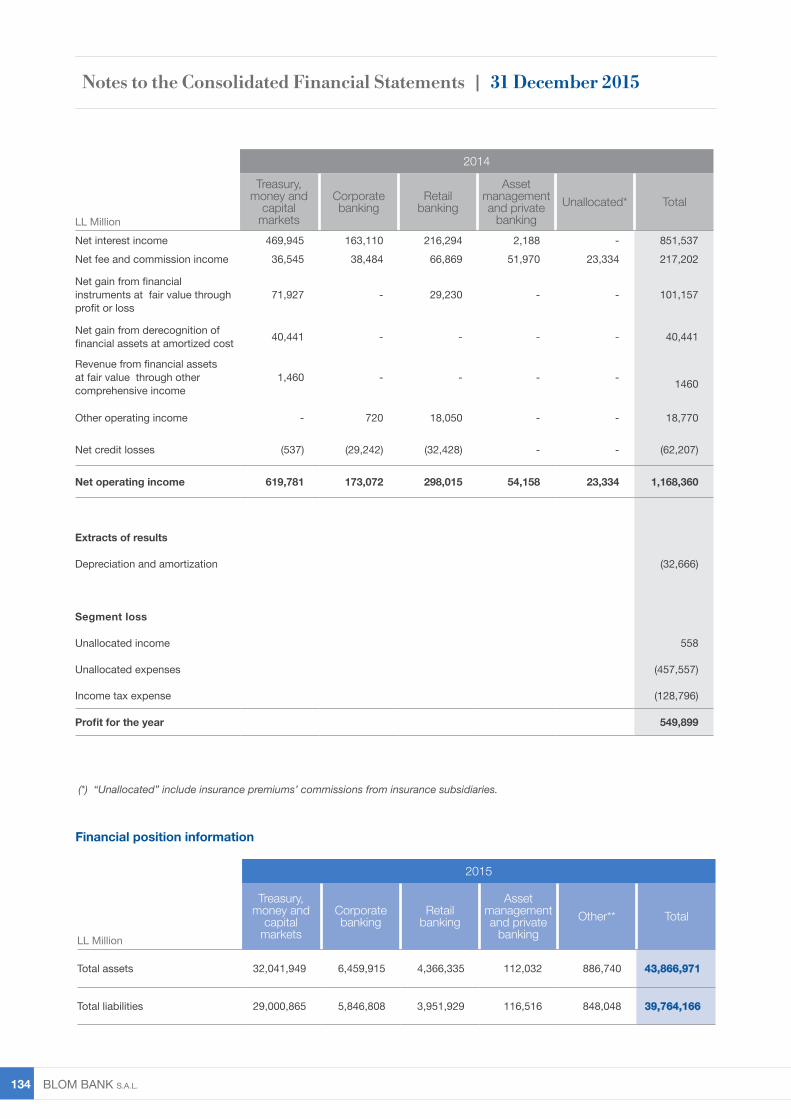
BLOM BANK s.A.L. 134
2015
LL Million
Treasury, money and
capital markets
Corporate banking
Retail banking
Asset management and private
bankingOther** Total
Total assets 32,041,949 6,459,915 4,366,335 112,032 886,740 43,866,971
Total liabilities 29,000,865 5,846,808 3,951,929 116,516 848,048 39,764,166
(*) “Unallocated” include insurance premiums’ commissions from insurance subsidiaries.
Financial position information
2014
LL Million
Treasury, money and
capital markets
Corporate banking
Retail banking
Asset management and private
bankingUnallocated* Total
Net interest income 469,945 163,110 216,294 2,188 - 851,537Net fee and commission income 36,545 38,484 66,869 51,970 23,334 217,202
Net gain from financial instruments at fair value through profit or loss
71,927 - 29,230 - - 101,157
Net gain from derecognition of financial assets at amortized cost 40,441 - - - - 40,441
Revenue from financial assets at fair value through other comprehensive income
1,460 - - - - 1460
Other operating income - 720 18,050 - - 18,770
Net credit losses (537) (29,242) (32,428) - - (62,207)
Net operating income 619,781 173,072 298,015 54,158 23,334 1,168,360
Extracts of results
Depreciation and amortization (32,666)
Segment loss
Unallocated income 558
Unallocated expenses (457,557)
Income tax expense (128,796)
Profit for the year 549,899
Notes to the Consolidated Financial Statements | 31 December 2015
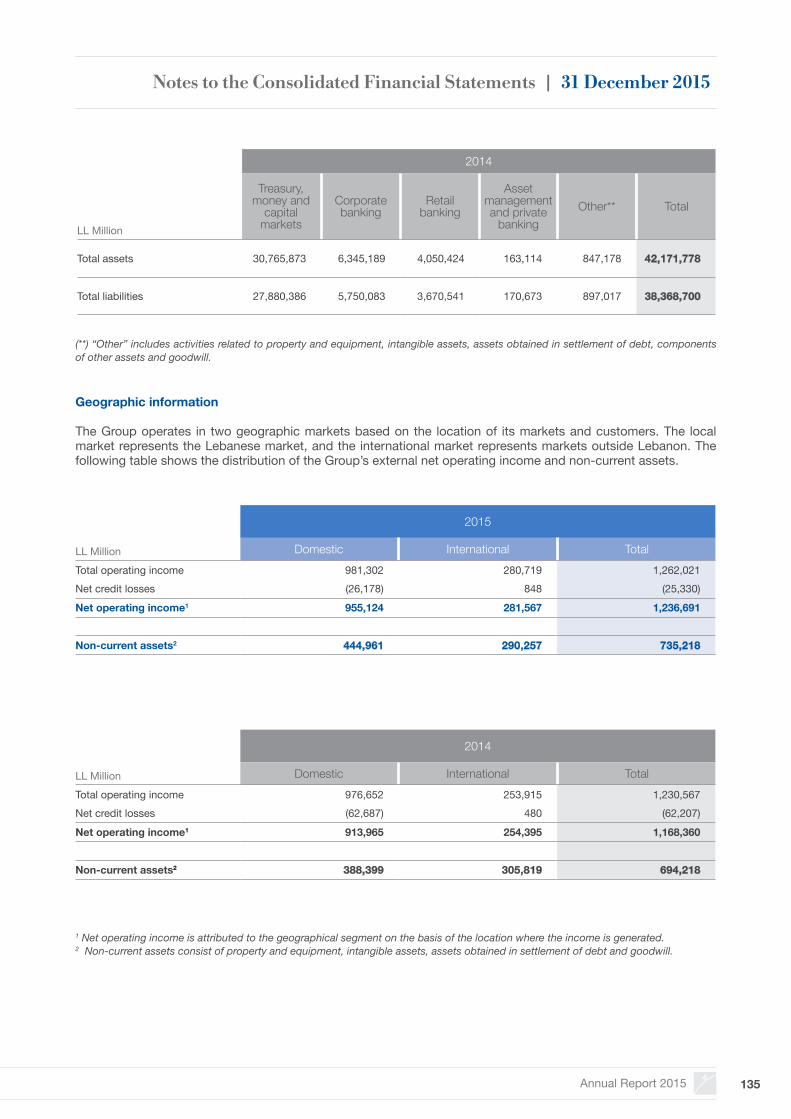
Annual Report 2015 135
Geographic information
The Group operates in two geographic markets based on the location of its markets and customers. The local market represents the Lebanese market, and the international market represents markets outside Lebanon. The following table shows the distribution of the Group’s external net operating income and non-current assets.
1 Net operating income is attributed to the geographical segment on the basis of the location where the income is generated.2 Non-current assets consist of property and equipment, intangible assets, assets obtained in settlement of debt and goodwill.
2015
LL Million Domestic International TotalTotal operating income 981,302 280,719 1,262,021Net credit losses (26,178) 848 (25,330)
Net operating income1 955,124 281,567 1,236,691
Non-current assets2 444,961 290,257 735,218
(**) “Other” includes activities related to property and equipment, intangible assets, assets obtained in settlement of debt, components of other assets and goodwill.
2014
LL Million
Treasury, money and
capital markets
Corporate banking
Retail banking
Asset management and private
bankingOther** Total
Total assets 30,765,873 6,345,189 4,050,424 163,114 847,178 42,171,778
Total liabilities 27,880,386 5,750,083 3,670,541 170,673 897,017 38,368,700
2014
LL Million Domestic International TotalTotal operating income 976,652 253,915 1,230,567Net credit losses (62,687) 480 (62,207)
Net operating income1 913,965 254,395 1,168,360
Non-current assets2 388,399 305,819 694,218
Notes to the Consolidated Financial Statements | 31 December 2015
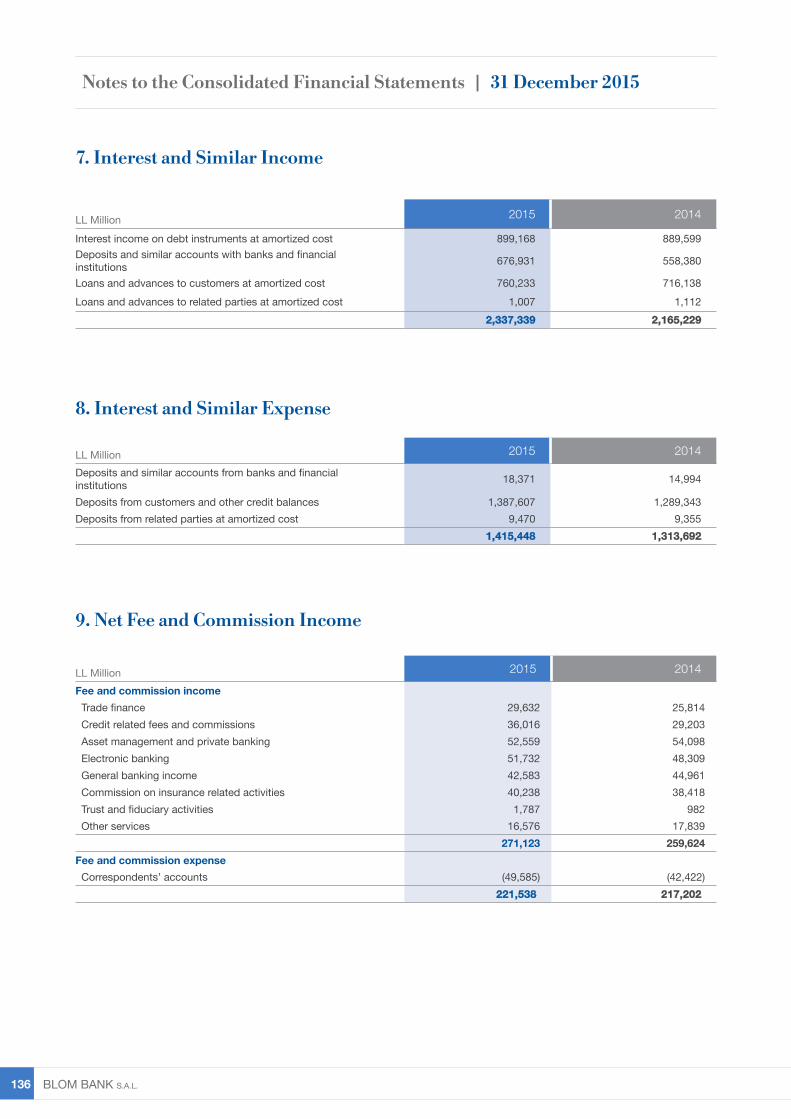
BLOM BANK s.A.L. 136
LL Million 2015 2014
Interest income on debt instruments at amortized cost 899,168 889,599Deposits and similar accounts with banks and financial institutions 676,931 558,380
Loans and advances to customers at amortized cost 760,233 716,138Loans and advances to related parties at amortized cost 1,007 1,112
2,337,339 2,165,229
LL Million 2015 2014
Deposits and similar accounts from banks and financial institutions 18,371 14,994
Deposits from customers and other credit balances 1,387,607 1,289,343Deposits from related parties at amortized cost 9,470 9,355
1,415,448 1,313,692
LL Million 2015 2014
Fee and commission income Trade finance 29,632 25,814 Credit related fees and commissions 36,016 29,203 Asset management and private banking 52,559 54,098 Electronic banking 51,732 48,309 General banking income 42,583 44,961 Commission on insurance related activities 40,238 38,418 Trust and fiduciary activities 1,787 982 Other services 16,576 17,839
271,123 259,624Fee and commission expense Correspondents’ accounts (49,585) (42,422)
221,538 217,202
8. Interest and Similar Expense
9. Net Fee and Commission Income
7. Interest and Similar Income
Notes to the Consolidated Financial Statements | 31 December 2015

Annual Report 2015 137
LL Million 2015 2014
Interest and similar income from debt instruments and other financial assets at fair value though profit or loss Government debt securities 9,364 9,023 Corporate debt securities 4,656 8,265 Certificates of deposit 800 - Funds 70 -
14,890 17,288
Net gain from sale of debt instruments and other financial assets at fair value through profit or loss Governmental debt securities 640 459 Corporate debt securities 8,769 5,417 Funds 195 449 Options (9) -
9,595 6,325
Unrealized gain from revaluation of debt instruments and other financial assets at fair value through profit or loss Government debt securities (2,084) 150 Corporate debt securities 2,903 8,036 Funds 3,132 2,038 Certificates of deposit 60 -
4,011 10,224Dividend income from Funds at fair value through profit or loss 42 41
Net gain from debt instruments and other financial assets at fair value through profit or loss 28,538 33,878
Net gain from equity instruments at fair value through profit or loss Unrealized gain from revaluation 2,476 11,666 Dividend income 6,114 4,387 Gain from sale 1,366 4,509Net gain from equity instruments at fair value through profit or loss 9,956 20,562Foreign exchange income 60,345 46,717
98,839 101,157
10. Net Gain from Financial Instruments at Fair Value through Profit or Loss
Foreign exchange income includes gains and losses from spot and forward contracts, other currency derivatives and the revaluation of the daily open trading and structural positions.
Notes to the Consolidated Financial Statements | 31 December 2015

BLOM BANK s.A.L. 138
13. Net Credit Losses
12. Other Operating Income
LL Million 2015 2014Gain from sale of assets obtained in settlement of debt 531 3Write back of provisions for risks and charges (note 35) 839 720Write back of provisions for assets taken in settlement of debt (note 28) 821 -Others 9,806 18,047
11,997 18,770
LL Million 2015 2014
Provision for loans and advances Commercial loans (note 23) (34,172) (94,333) Consumer loans (note 23) (30,823) (43,472) Provision for doubtful banks (note 19) - (537) Commitment by signature (note 35) (918) (4,776)
(65,913) (143,118)Write-back of provisions for loans and advances Commercial loans (note 23) 15,429 59,403 Consumer loans (note 23) 7,615 11,044 Unrealized interest (note 23) 8,341 7,025 Recoveries from loans reflected as off-financial position (note 23) 4,593 2,667 Recoveries from sundry debtors (note 29) - 235 Recoveries from commitment by signature (note 35) 4,605 537
40,583 80,911(25,330) (62,207)
2015
LL Million Gains (Losses) TotalLebanese sovereign and Central Bank of Lebanon Certificates of deposit 107 - 107 Treasury bills and bonds 7,472 (21) 7,451 Placements with the Central Bank of Lebanon - (1,074) (1,074)
7,579 (1,095) 6,484
Other sovereign Treasury bills and bonds 80 - 80
7,659 (1,095) 6,564
2014
LL Million Gains (Losses) TotalLebanese sovereign and Central Bank of Lebanon Certificates of deposit 40,275 (5,050) 35,225 Treasury bills and bonds 5,118 (6) 5,112
45,393 (5,056) 40,337
Other sovereign Treasury bills and bonds 104 - 104
45,497 (5,056) 40,441
The schedule below details the gains and losses arising from derecognition of these financial assets:
11. Net Gain from Derecognition of Financial Assets at Amortized Cost
Derecognition of financial assets at amortized cost were made during the year due to exchange of financial assets by the Central Bank of Lebanon, liquidity gap and yield management.
Notes to the Consolidated Financial Statements | 31 December 2015
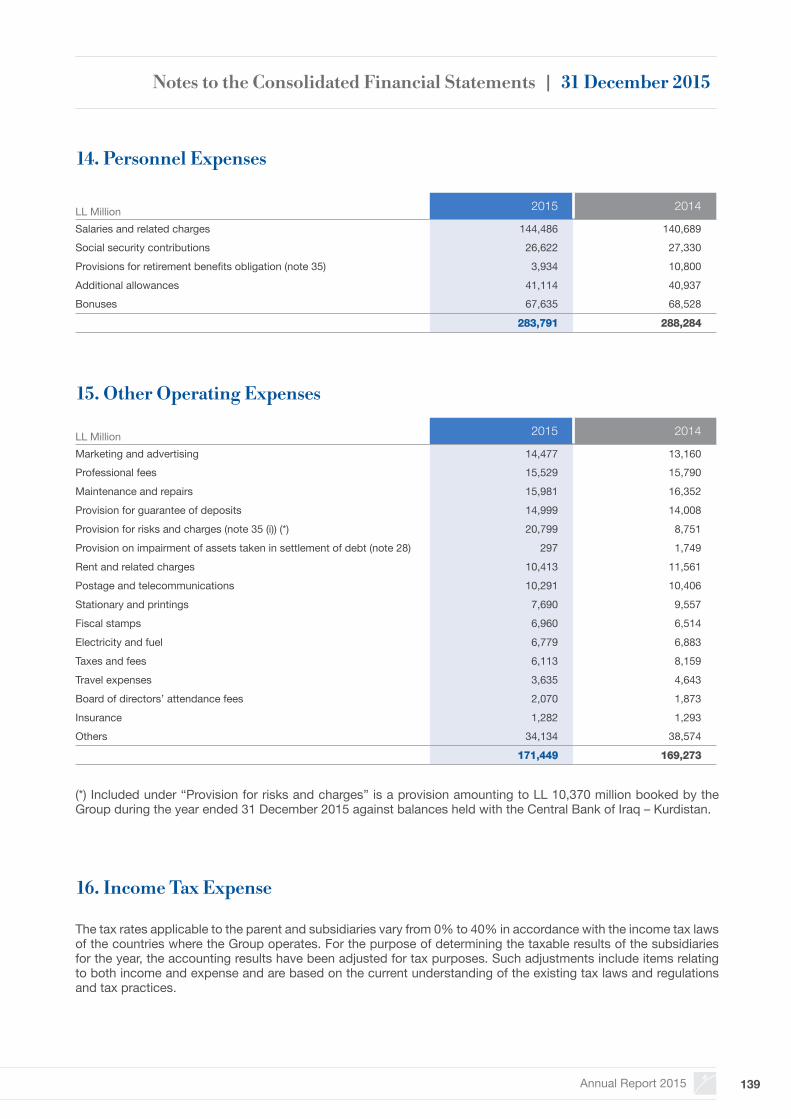
Annual Report 2015 139
14. Personnel Expenses
16. Income Tax Expense
15. Other Operating Expenses
LL Million 2015 2014
Salaries and related charges 144,486 140,689Social security contributions 26,622 27,330Provisions for retirement benefits obligation (note 35) 3,934 10,800Additional allowances 41,114 40,937Bonuses 67,635 68,528
283,791 288,284
LL Million 2015 2014
Marketing and advertising 14,477 13,160Professional fees 15,529 15,790Maintenance and repairs 15,981 16,352Provision for guarantee of deposits 14,999 14,008Provision for risks and charges (note 35 (i)) (*) 20,799 8,751Provision on impairment of assets taken in settlement of debt (note 28) 297 1,749Rent and related charges 10,413 11,561Postage and telecommunications 10,291 10,406Stationary and printings 7,690 9,557Fiscal stamps 6,960 6,514Electricity and fuel 6,779 6,883Taxes and fees 6,113 8,159Travel expenses 3,635 4,643Board of directors’ attendance fees 2,070 1,873Insurance 1,282 1,293Others 34,134 38,574
171,449 169,273
The tax rates applicable to the parent and subsidiaries vary from 0% to 40% in accordance with the income tax laws of the countries where the Group operates. For the purpose of determining the taxable results of the subsidiaries for the year, the accounting results have been adjusted for tax purposes. Such adjustments include items relating to both income and expense and are based on the current understanding of the existing tax laws and regulations and tax practices.
(*) Included under “Provision for risks and charges” is a provision amounting to LL 10,370 million booked by the Group during the year ended 31 December 2015 against balances held with the Central Bank of Iraq – Kurdistan.
Notes to the Consolidated Financial Statements | 31 December 2015
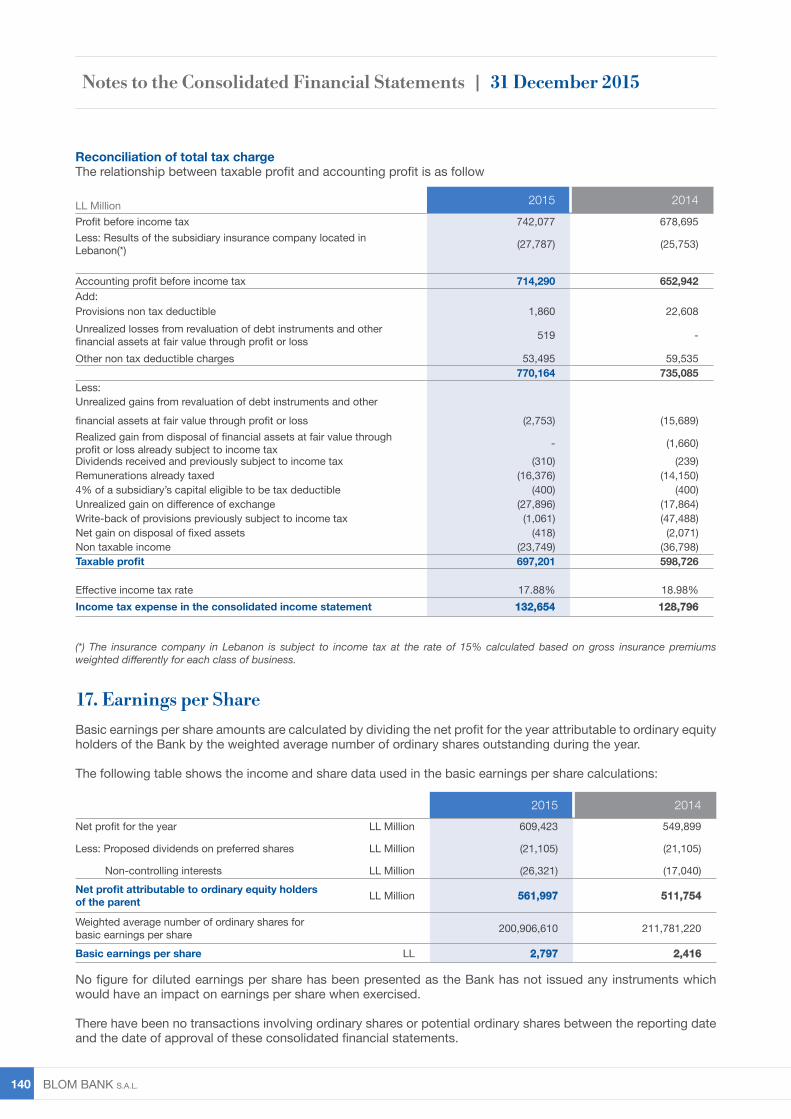
BLOM BANK s.A.L. 140
Reconciliation of total tax chargeThe relationship between taxable profit and accounting profit is as follow
Basic earnings per share amounts are calculated by dividing the net profit for the year attributable to ordinary equity holders of the Bank by the weighted average number of ordinary shares outstanding during the year.
The following table shows the income and share data used in the basic earnings per share calculations:
No figure for diluted earnings per share has been presented as the Bank has not issued any instruments which would have an impact on earnings per share when exercised.
There have been no transactions involving ordinary shares or potential ordinary shares between the reporting date and the date of approval of these consolidated financial statements.
LL Million 2015 2014Profit before income tax 742,077 678,695Less: Results of the subsidiary insurance company located in Lebanon(*) (27,787) (25,753)
Accounting profit before income tax 714,290 652,942Add: Provisions non tax deductible 1,860 22,608Unrealized losses from revaluation of debt instruments and other financial assets at fair value through profit or loss 519 -
Other non tax deductible charges 53,495 59,535770,164 735,085
Less:Unrealized gains from revaluation of debt instruments and other financial assets at fair value through profit or loss (2,753) (15,689)Realized gain from disposal of financial assets at fair value through profit or loss already subject to income tax - (1,660)Dividends received and previously subject to income tax (310) (239)Remunerations already taxed (16,376) (14,150)4% of a subsidiary’s capital eligible to be tax deductible (400) (400)Unrealized gain on difference of exchange (27,896) (17,864)Write-back of provisions previously subject to income tax (1,061) (47,488)Net gain on disposal of fixed assets (418) (2,071)Non taxable income (23,749) (36,798)Taxable profit 697,201 598,726
Effective income tax rate 17.88% 18.98%Income tax expense in the consolidated income statement 132,654 128,796
2015 2014Net profit for the year LL Million 609,423 549,899
Less: Proposed dividends on preferred shares LL Million (21,105) (21,105)
Non-controlling interests LL Million (26,321) (17,040)Net profit attributable to ordinary equity holders of the parent LL Million 561,997 511,754
Weighted average number of ordinary shares for basic earnings per share 200,906,610 211,781,220
Basic earnings per share LL 2,797 2,416
(*) The insurance company in Lebanon is subject to income tax at the rate of 15% calculated based on gross insurance premiums weighted differently for each class of business.
17. Earnings per Share
Notes to the Consolidated Financial Statements | 31 December 2015
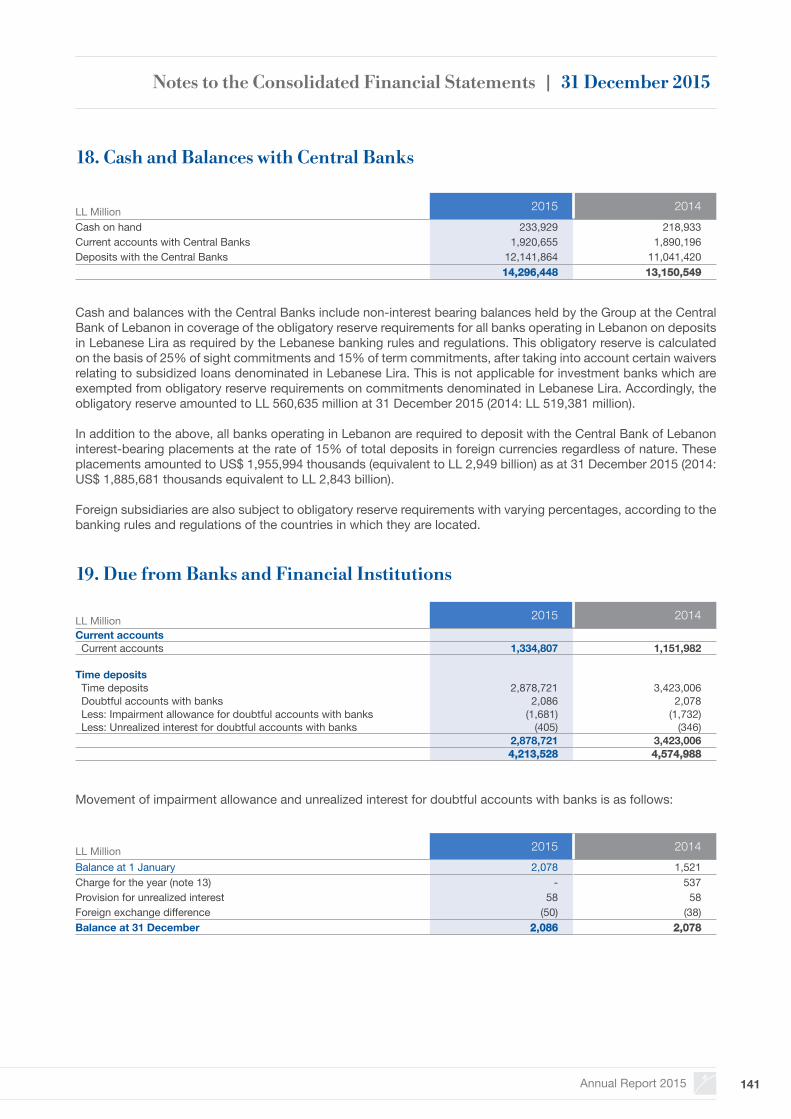
Annual Report 2015 141
Movement of impairment allowance and unrealized interest for doubtful accounts with banks is as follows:
Cash and balances with the Central Banks include non-interest bearing balances held by the Group at the Central Bank of Lebanon in coverage of the obligatory reserve requirements for all banks operating in Lebanon on deposits in Lebanese Lira as required by the Lebanese banking rules and regulations. This obligatory reserve is calculated on the basis of 25% of sight commitments and 15% of term commitments, after taking into account certain waivers relating to subsidized loans denominated in Lebanese Lira. This is not applicable for investment banks which are exempted from obligatory reserve requirements on commitments denominated in Lebanese Lira. Accordingly, the obligatory reserve amounted to LL 560,635 million at 31 December 2015 (2014: LL 519,381 million).
In addition to the above, all banks operating in Lebanon are required to deposit with the Central Bank of Lebanon interest-bearing placements at the rate of 15% of total deposits in foreign currencies regardless of nature. These placements amounted to US$ 1,955,994 thousands (equivalent to LL 2,949 billion) as at 31 December 2015 (2014: US$ 1,885,681 thousands equivalent to LL 2,843 billion).
Foreign subsidiaries are also subject to obligatory reserve requirements with varying percentages, according to the banking rules and regulations of the countries in which they are located.
LL Million 2015 2014Cash on hand 233,929 218,933Current accounts with Central Banks 1,920,655 1,890,196Deposits with the Central Banks 12,141,864 11,041,420
14,296,448 13,150,549
LL Million 2015 2014Current accounts Current accounts 1,334,807 1,151,982
Time deposits Time deposits 2,878,721 3,423,006 Doubtful accounts with banks 2,086 2,078 Less: Impairment allowance for doubtful accounts with banks (1,681) (1,732) Less: Unrealized interest for doubtful accounts with banks (405) (346)
2,878,721 3,423,0064,213,528 4,574,988
18. Cash and Balances with Central Banks
19. Due from Banks and Financial Institutions
LL Million 2015 2014Balance at 1 January 2,078 1,521Charge for the year (note 13) - 537Provision for unrealized interest 58 58Foreign exchange difference (50) (38)Balance at 31 December 2,086 2,078
Notes to the Consolidated Financial Statements | 31 December 2015
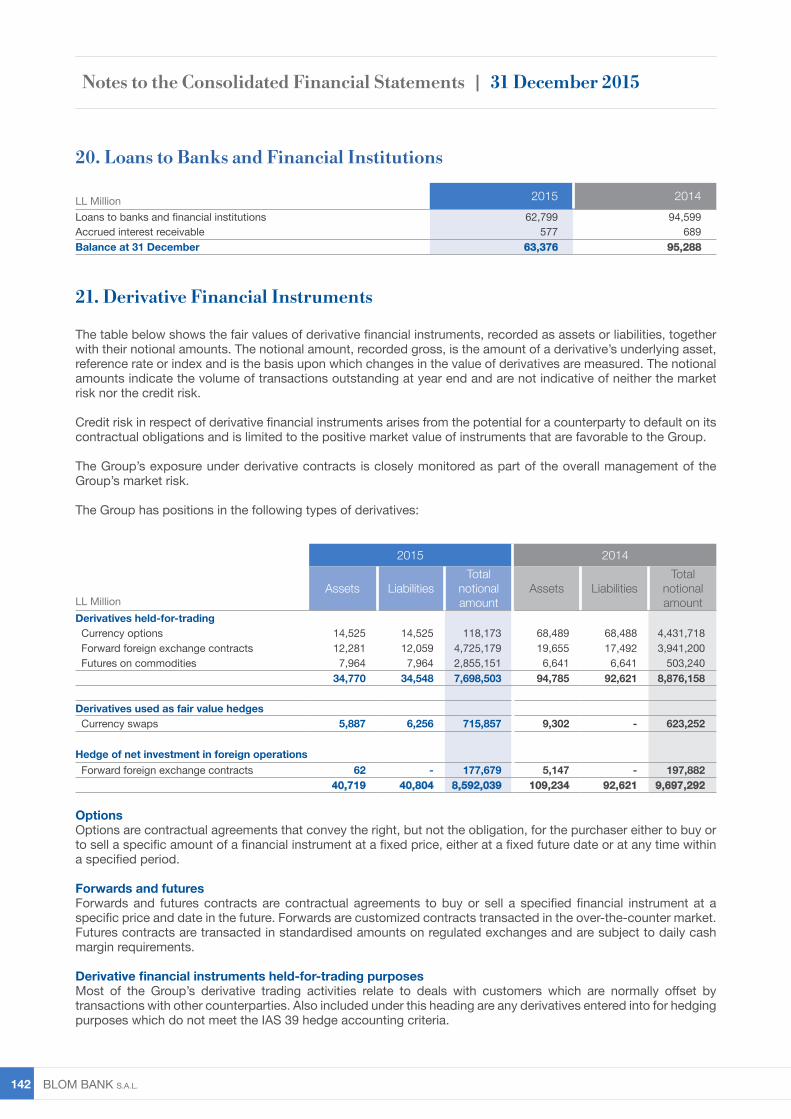
BLOM BANK s.A.L. 142
The table below shows the fair values of derivative financial instruments, recorded as assets or liabilities, together with their notional amounts. The notional amount, recorded gross, is the amount of a derivative’s underlying asset, reference rate or index and is the basis upon which changes in the value of derivatives are measured. The notional amounts indicate the volume of transactions outstanding at year end and are not indicative of neither the market risk nor the credit risk.
Credit risk in respect of derivative financial instruments arises from the potential for a counterparty to default on its contractual obligations and is limited to the positive market value of instruments that are favorable to the Group.
The Group’s exposure under derivative contracts is closely monitored as part of the overall management of the Group’s market risk.
The Group has positions in the following types of derivatives:
OptionsOptions are contractual agreements that convey the right, but not the obligation, for the purchaser either to buy or to sell a specific amount of a financial instrument at a fixed price, either at a fixed future date or at any time within a specified period.
Forwards and futuresForwards and futures contracts are contractual agreements to buy or sell a specified financial instrument at a specific price and date in the future. Forwards are customized contracts transacted in the over-the-counter market. Futures contracts are transacted in standardised amounts on regulated exchanges and are subject to daily cash margin requirements.
Derivative financial instruments held-for-trading purposesMost of the Group’s derivative trading activities relate to deals with customers which are normally offset by transactions with other counterparties. Also included under this heading are any derivatives entered into for hedging purposes which do not meet the IAS 39 hedge accounting criteria.
21. Derivative Financial Instruments
2015 2014
LL MillionAssets Liabilities
Total notional amount
Assets LiabilitiesTotal
notional amount
Derivatives held-for-trading Currency options 14,525 14,525 118,173 68,489 68,488 4,431,718 Forward foreign exchange contracts 12,281 12,059 4,725,179 19,655 17,492 3,941,200 Futures on commodities 7,964 7,964 2,855,151 6,641 6,641 503,240
34,770 34,548 7,698,503 94,785 92,621 8,876,158
Derivatives used as fair value hedges Currency swaps 5,887 6,256 715,857 9,302 - 623,252
Hedge of net investment in foreign operations Forward foreign exchange contracts 62 - 177,679 5,147 - 197,882
40,719 40,804 8,592,039 109,234 92,621 9,697,292
20. Loans to Banks and Financial Institutions
LL Million 2015 2014Loans to banks and financial institutions 62,799 94,599Accrued interest receivable 577 689Balance at 31 December 63,376 95,288
Notes to the Consolidated Financial Statements | 31 December 2015
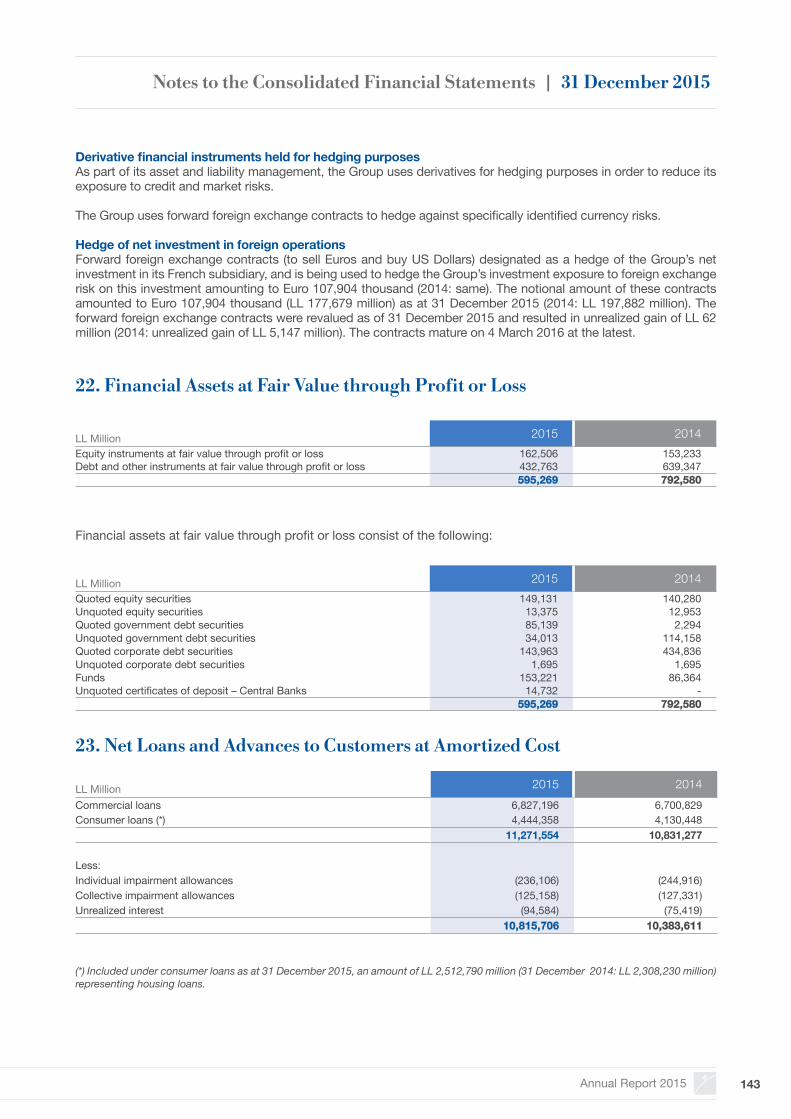
Annual Report 2015 143
Financial assets at fair value through profit or loss consist of the following:
Derivative financial instruments held for hedging purposesAs part of its asset and liability management, the Group uses derivatives for hedging purposes in order to reduce its exposure to credit and market risks.
The Group uses forward foreign exchange contracts to hedge against specifically identified currency risks.
Hedge of net investment in foreign operationsForward foreign exchange contracts (to sell Euros and buy US Dollars) designated as a hedge of the Group’s net investment in its French subsidiary, and is being used to hedge the Group’s investment exposure to foreign exchange risk on this investment amounting to Euro 107,904 thousand (2014: same). The notional amount of these contracts amounted to Euro 107,904 thousand (LL 177,679 million) as at 31 December 2015 (2014: LL 197,882 million). The forward foreign exchange contracts were revalued as of 31 December 2015 and resulted in unrealized gain of LL 62 million (2014: unrealized gain of LL 5,147 million). The contracts mature on 4 March 2016 at the latest.
22. Financial Assets at Fair Value through Profit or Loss
23. Net Loans and Advances to Customers at Amortized Cost
LL Million 2015 2014Equity instruments at fair value through profit or loss 162,506 153,233Debt and other instruments at fair value through profit or loss 432,763 639,347
595,269 792,580
LL Million 2015 2014Quoted equity securities 149,131 140,280Unquoted equity securities 13,375 12,953Quoted government debt securities 85,139 2,294Unquoted government debt securities 34,013 114,158Quoted corporate debt securities 143,963 434,836Unquoted corporate debt securities 1,695 1,695Funds 153,221 86,364Unquoted certificates of deposit – Central Banks 14,732 -
595,269 792,580
LL Million 2015 2014Commercial loans 6,827,196 6,700,829Consumer loans (*) 4,444,358 4,130,448
11,271,554 10,831,277
Less: Individual impairment allowances (236,106) (244,916)Collective impairment allowances (125,158) (127,331)Unrealized interest (94,584) (75,419)
10,815,706 10,383,611
(*) Included under consumer loans as at 31 December 2015, an amount of LL 2,512,790 million (31 December 2014: LL 2,308,230 million) representing housing loans.
Notes to the Consolidated Financial Statements | 31 December 2015
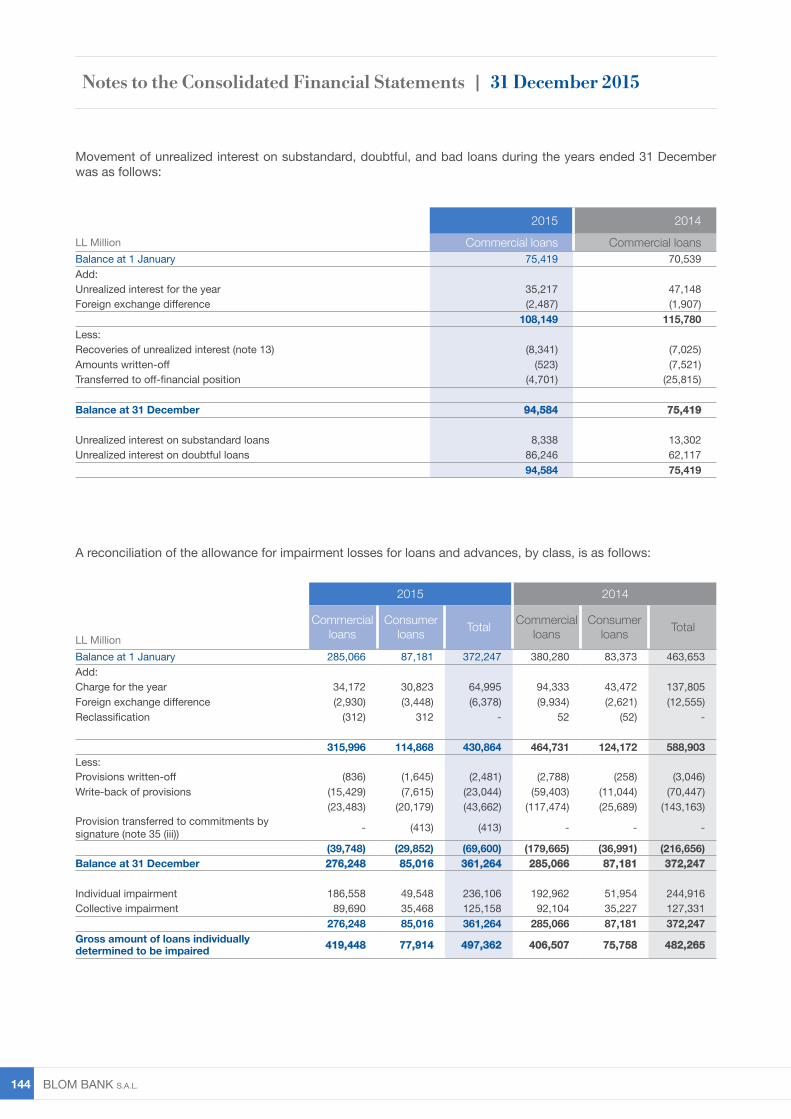
BLOM BANK s.A.L. 144
Movement of unrealized interest on substandard, doubtful, and bad loans during the years ended 31 December was as follows:
2015 2014LL Million Commercial loans Commercial loansBalance at 1 January 75,419 70,539Add:Unrealized interest for the year 35,217 47,148Foreign exchange difference (2,487) (1,907)
108,149 115,780Less:Recoveries of unrealized interest (note 13) (8,341) (7,025)Amounts written-off (523) (7,521)Transferred to off-financial position (4,701) (25,815)
Balance at 31 December 94,584 75,419
Unrealized interest on substandard loans 8,338 13,302Unrealized interest on doubtful loans 86,246 62,117
94,584 75,419
A reconciliation of the allowance for impairment losses for loans and advances, by class, is as follows:
2015 2014
LL Million
Commercial loans
Consumer loans Total Commercial
loansConsumer
loans Total
Balance at 1 January 285,066 87,181 372,247 380,280 83,373 463,653Add:Charge for the year 34,172 30,823 64,995 94,333 43,472 137,805Foreign exchange difference (2,930) (3,448) (6,378) (9,934) (2,621) (12,555)Reclassification (312) 312 - 52 (52) -
315,996 114,868 430,864 464,731 124,172 588,903Less:Provisions written-off (836) (1,645) (2,481) (2,788) (258) (3,046)Write-back of provisions (15,429) (7,615) (23,044) (59,403) (11,044) (70,447)
(23,483) (20,179) (43,662) (117,474) (25,689) (143,163)Provision transferred to commitments by signature (note 35 (iii)) - (413) (413) - - -
(39,748) (29,852) (69,600) (179,665) (36,991) (216,656)Balance at 31 December 276,248 85,016 361,264 285,066 87,181 372,247
Individual impairment 186,558 49,548 236,106 192,962 51,954 244,916Collective impairment 89,690 35,468 125,158 92,104 35,227 127,331
276,248 85,016 361,264 285,066 87,181 372,247Gross amount of loans individually determined to be impaired 419,448 77,914 497,362 406,507 75,758 482,265
Notes to the Consolidated Financial Statements | 31 December 2015
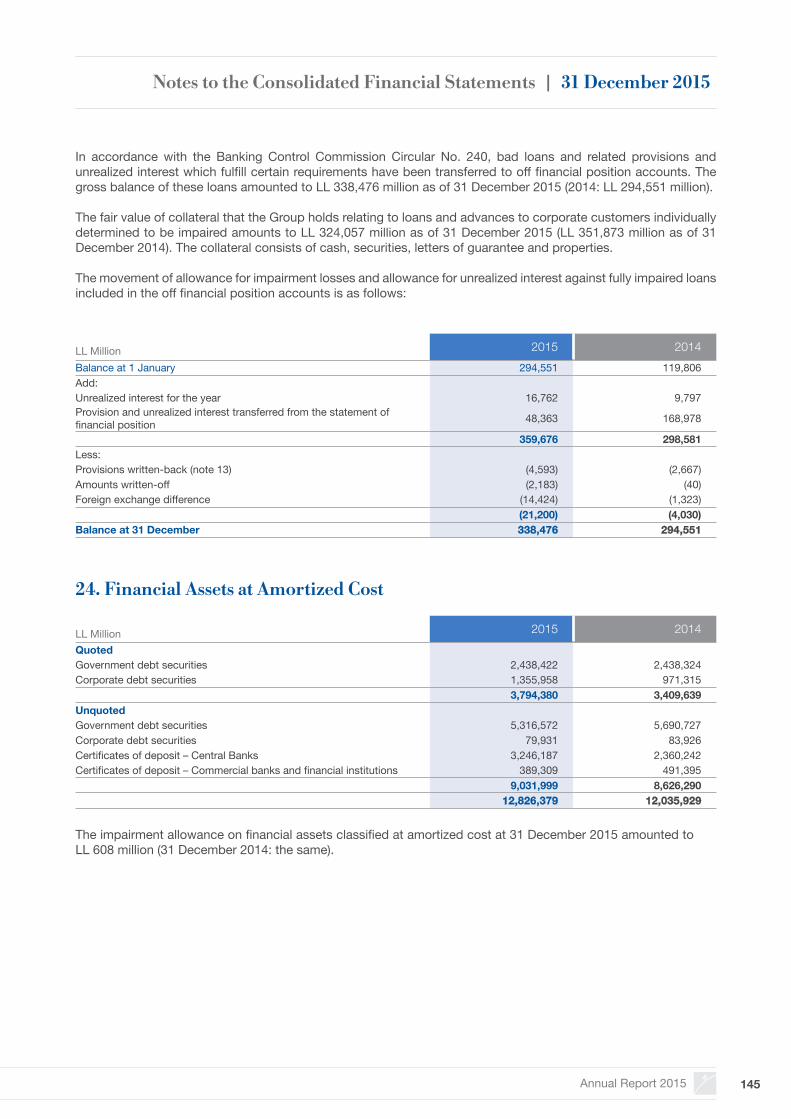
Annual Report 2015 145
LL Million 2015 2014QuotedGovernment debt securities 2,438,422 2,438,324Corporate debt securities 1,355,958 971,315
3,794,380 3,409,639UnquotedGovernment debt securities 5,316,572 5,690,727Corporate debt securities 79,931 83,926Certificates of deposit – Central Banks 3,246,187 2,360,242Certificates of deposit – Commercial banks and financial institutions 389,309 491,395
9,031,999 8,626,29012,826,379 12,035,929
In accordance with the Banking Control Commission Circular No. 240, bad loans and related provisions and unrealized interest which fulfill certain requirements have been transferred to off financial position accounts. The gross balance of these loans amounted to LL 338,476 million as of 31 December 2015 (2014: LL 294,551 million).
The fair value of collateral that the Group holds relating to loans and advances to corporate customers individually determined to be impaired amounts to LL 324,057 million as of 31 December 2015 (LL 351,873 million as of 31 December 2014). The collateral consists of cash, securities, letters of guarantee and properties.
The movement of allowance for impairment losses and allowance for unrealized interest against fully impaired loans included in the off financial position accounts is as follows:
The impairment allowance on financial assets classified at amortized cost at 31 December 2015 amounted to LL 608 million (31 December 2014: the same).
LL Million 2015 2014Balance at 1 January 294,551 119,806Add:Unrealized interest for the year 16,762 9,797Provision and unrealized interest transferred from the statement of financial position 48,363 168,978
359,676 298,581Less: Provisions written-back (note 13) (4,593) (2,667)Amounts written-off (2,183) (40)Foreign exchange difference (14,424) (1,323)
(21,200) (4,030)Balance at 31 December 338,476 294,551
24. Financial Assets at Amortized Cost
Notes to the Consolidated Financial Statements | 31 December 2015

BLOM BANK s.A.L. 146
The table below details the financial assets at fair value through other comprehensive income as at 31 December:
Dividend income amounted to 1,192 million for the year ended 31 December 2015 (2014: LL 1,460 million) and resulted from equity instruments and funds held at year end (2014: same).
25. Financial Assets at Fair Value through other Comprehensive Income
LL Million 2015 2014Equity securities 2,991 3,579Funds 3,238 3,726
6,229 7,305
2015 2014
LL Million
Carrying amount
Cumulative fair value changes
Dividend income
Carrying amount
Cumulative fair value changes
Dividend income
Equity securities 2,991 108 1,126 3,579 18 1,407Funds 3,238 907 66 3,726 1,162 53
6,229 1,015 1,192 7,305 1,180 1,460
26. Property and Equipment
LL Million
Freehold landand buildings Vehicles
Furniture, office installations and
computerequipment
Advances on acquisition
of fixed assets and construction
in progress
Total
Cost At 1 January 2015 435,179 6,994 309,353 125,691 877,217 Additions 21,012 1,767 15,710 49,556 88,045 Disposals - (1,600) (3,413) - (5,013) Transfers 58,223 136 19,362 (84,308) (6,587) Translation difference (18,361) (227) (7,062) (5,920) (31,570)
At 31 December 2015 496,053 7,070 333,950 85,019 922,092
Depreciation
At 1 January 2015 68,391 3,634 185,567 - 257,592
Charge for the year 9,402 1,271 25,331 - 36,004 Relating to disposals - (1,551) (2,933) - (4,484) Translation difference (3,775) (148) (7,211) - (11,134)
At 31 December 2015 74,018 3,206 200,754 - 277,978
Net carrying value
At 31 December 2015 422,035 3,864 133,196 85,019 644,114
Notes to the Consolidated Financial Statements | 31 December 2015
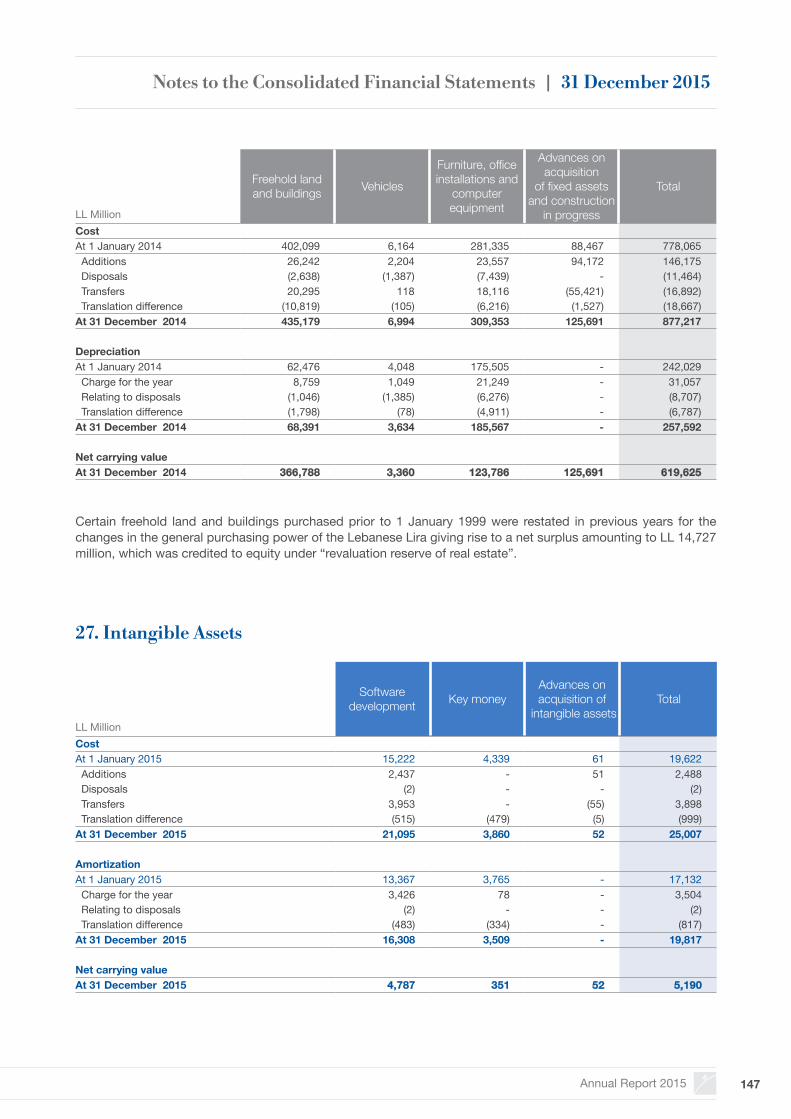
Annual Report 2015 147
Certain freehold land and buildings purchased prior to 1 January 1999 were restated in previous years for the changes in the general purchasing power of the Lebanese Lira giving rise to a net surplus amounting to LL 14,727 million, which was credited to equity under “revaluation reserve of real estate”.
LL Million
Freehold landand buildings Vehicles
Furniture, office installations and
computerequipment
Advances on acquisition
of fixed assets and construction
in progress
Total
Cost At 1 January 2014 402,099 6,164 281,335 88,467 778,065 Additions 26,242 2,204 23,557 94,172 146,175 Disposals (2,638) (1,387) (7,439) - (11,464) Transfers 20,295 118 18,116 (55,421) (16,892) Translation difference (10,819) (105) (6,216) (1,527) (18,667)At 31 December 2014 435,179 6,994 309,353 125,691 877,217
DepreciationAt 1 January 2014 62,476 4,048 175,505 - 242,029 Charge for the year 8,759 1,049 21,249 - 31,057 Relating to disposals (1,046) (1,385) (6,276) - (8,707) Translation difference (1,798) (78) (4,911) - (6,787)At 31 December 2014 68,391 3,634 185,567 - 257,592
Net carrying valueAt 31 December 2014 366,788 3,360 123,786 125,691 619,625
27. Intangible Assets
LL Million
Softwaredevelopment Key money
Advances on acquisition of
intangible assetsTotal
Cost At 1 January 2015 15,222 4,339 61 19,622 Additions 2,437 - 51 2,488 Disposals (2) - - (2) Transfers 3,953 - (55) 3,898 Translation difference (515) (479) (5) (999)At 31 December 2015 21,095 3,860 52 25,007
AmortizationAt 1 January 2015 13,367 3,765 - 17,132 Charge for the year 3,426 78 - 3,504 Relating to disposals (2) - - (2) Translation difference (483) (334) - (817)At 31 December 2015 16,308 3,509 - 19,817
Net carrying valueAt 31 December 2015 4,787 351 52 5,190
Notes to the Consolidated Financial Statements | 31 December 2015
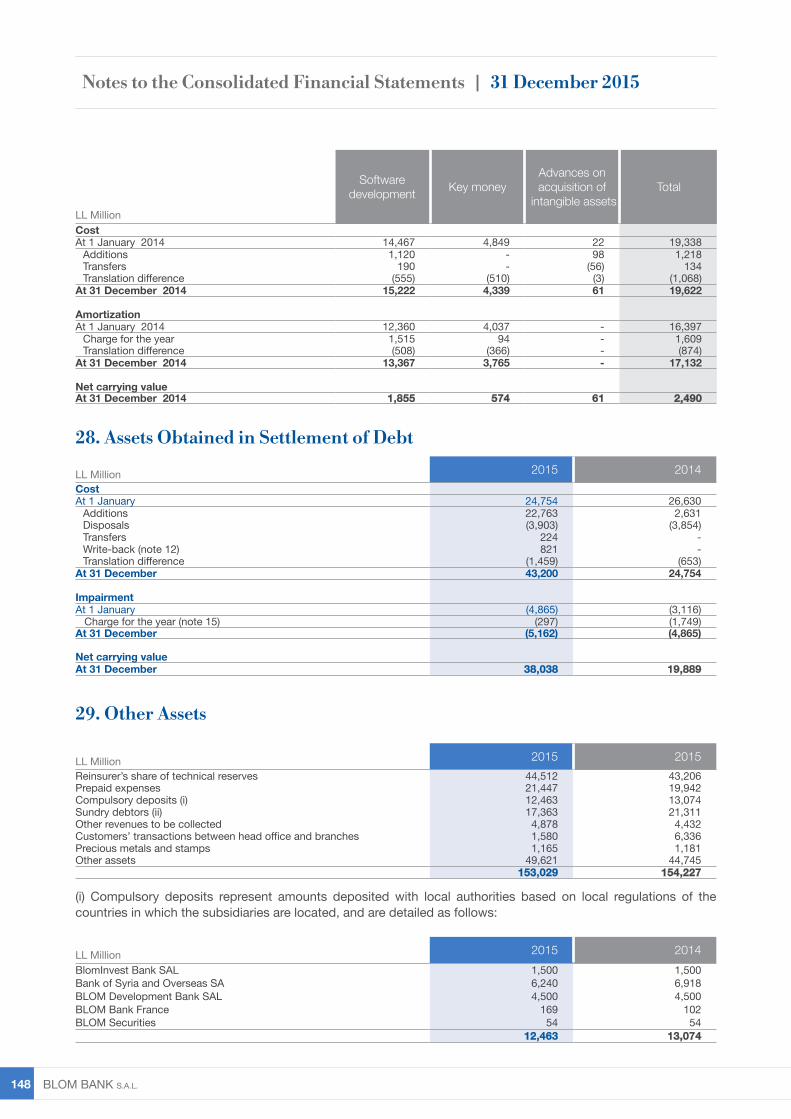
BLOM BANK s.A.L. 148
LL Million 2015 2014CostAt 1 January 24,754 26,630
Additions 22,763 2,631Disposals (3,903) (3,854)Transfers 224 -Write-back (note 12) 821 -Translation difference (1,459) (653)
At 31 December 43,200 24,754
ImpairmentAt 1 January (4,865) (3,116) Charge for the year (note 15) (297) (1,749)At 31 December (5,162) (4,865)
Net carrying valueAt 31 December 38,038 19,889
28. Assets Obtained in Settlement of Debt
LL Million
Softwaredevelopment Key money
Advances on acquisition of
intangible assetsTotal
Cost At 1 January 2014 14,467 4,849 22 19,338
Additions 1,120 - 98 1,218Transfers 190 - (56) 134Translation difference (555) (510) (3) (1,068)
At 31 December 2014 15,222 4,339 61 19,622
AmortizationAt 1 January 2014 12,360 4,037 - 16,397
Charge for the year 1,515 94 - 1,609Translation difference (508) (366) - (874)
At 31 December 2014 13,367 3,765 - 17,132
Net carrying valueAt 31 December 2014 1,855 574 61 2,490
29. Other Assets
LL Million 2015 2015Reinsurer’s share of technical reserves 44,512 43,206Prepaid expenses 21,447 19,942Compulsory deposits (i) 12,463 13,074Sundry debtors (ii) 17,363 21,311Other revenues to be collected 4,878 4,432Customers’ transactions between head office and branches 1,580 6,336Precious metals and stamps 1,165 1,181Other assets 49,621 44,745
153,029 154,227
(i) Compulsory deposits represent amounts deposited with local authorities based on local regulations of the countries in which the subsidiaries are located, and are detailed as follows:
LL Million 2015 2014BlomInvest Bank SAL 1,500 1,500Bank of Syria and Overseas SA 6,240 6,918BLOM Development Bank SAL 4,500 4,500BLOM Bank France 169 102BLOM Securities 54 54
12,463 13,074
Notes to the Consolidated Financial Statements | 31 December 2015
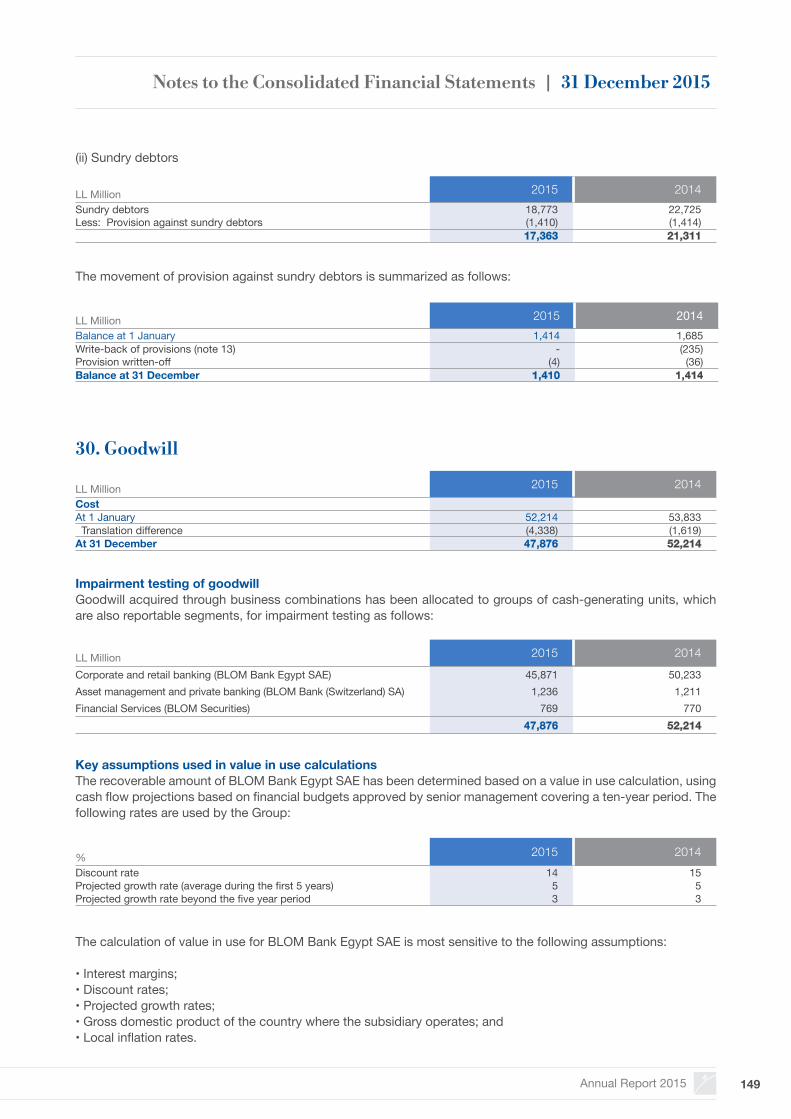
Annual Report 2015 149
LL Million 2015 2014Sundry debtors 18,773 22,725Less: Provision against sundry debtors (1,410) (1,414)
17,363 21,311
LL Million 2015 2014Balance at 1 January 1,414 1,685Write-back of provisions (note 13) - (235)Provision written-off (4) (36)Balance at 31 December 1,410 1,414
(ii) Sundry debtors
The movement of provision against sundry debtors is summarized as follows:
30. Goodwill
LL Million 2015 2014CostAt 1 January 52,214 53,833 Translation difference (4,338) (1,619)At 31 December 47,876 52,214
LL Million 2015 2014
Corporate and retail banking (BLOM Bank Egypt SAE) 45,871 50,233Asset management and private banking (BLOM Bank (Switzerland) SA) 1,236 1,211Financial Services (BLOM Securities) 769 770
47,876 52,214
Impairment testing of goodwillGoodwill acquired through business combinations has been allocated to groups of cash-generating units, which are also reportable segments, for impairment testing as follows:
Key assumptions used in value in use calculationsThe recoverable amount of BLOM Bank Egypt SAE has been determined based on a value in use calculation, using cash flow projections based on financial budgets approved by senior management covering a ten-year period. The following rates are used by the Group:
% 2015 2014Discount rate 14 15Projected growth rate (average during the first 5 years) 5 5Projected growth rate beyond the five year period 3 3
The calculation of value in use for BLOM Bank Egypt SAE is most sensitive to the following assumptions:
• Interest margins;• Discount rates;• Projected growth rates;• Gross domestic product of the country where the subsidiary operates; and• Local inflation rates.
Notes to the Consolidated Financial Statements | 31 December 2015
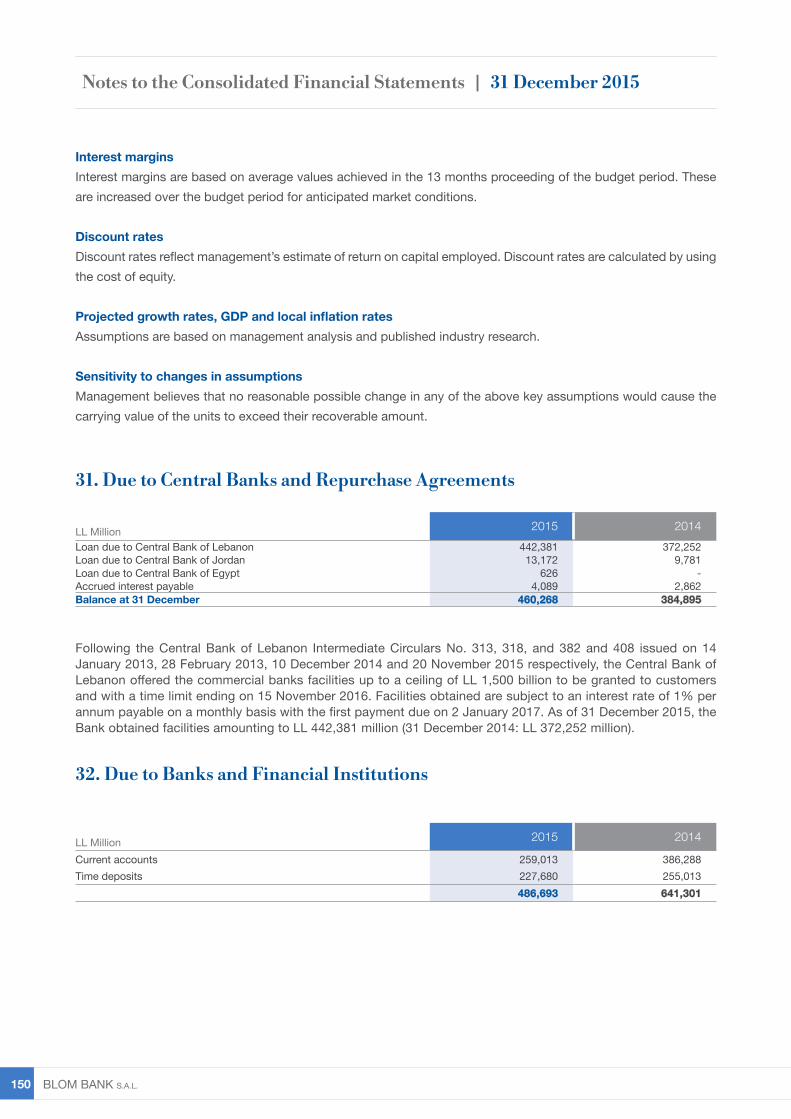
BLOM BANK s.A.L. 150
LL Million 2015 2014Loan due to Central Bank of Lebanon 442,381 372,252Loan due to Central Bank of Jordan 13,172 9,781Loan due to Central Bank of Egypt 626 -Accrued interest payable 4,089 2,862Balance at 31 December 460,268 384,895
LL Million 2015 2014
Current accounts 259,013 386,288Time deposits 227,680 255,013
486,693 641,301
31. Due to Central Banks and Repurchase Agreements
32. Due to Banks and Financial Institutions
Following the Central Bank of Lebanon Intermediate Circulars No. 313, 318, and 382 and 408 issued on 14 January 2013, 28 February 2013, 10 December 2014 and 20 November 2015 respectively, the Central Bank of Lebanon offered the commercial banks facilities up to a ceiling of LL 1,500 billion to be granted to customers and with a time limit ending on 15 November 2016. Facilities obtained are subject to an interest rate of 1% per annum payable on a monthly basis with the first payment due on 2 January 2017. As of 31 December 2015, the Bank obtained facilities amounting to LL 442,381 million (31 December 2014: LL 372,252 million).
Interest marginsInterest margins are based on average values achieved in the 13 months proceeding of the budget period. These are increased over the budget period for anticipated market conditions.
Discount ratesDiscount rates reflect management’s estimate of return on capital employed. Discount rates are calculated by using the cost of equity.
Projected growth rates, GDP and local inflation ratesAssumptions are based on management analysis and published industry research.
Sensitivity to changes in assumptionsManagement believes that no reasonable possible change in any of the above key assumptions would cause the carrying value of the units to exceed their recoverable amount.
Notes to the Consolidated Financial Statements | 31 December 2015
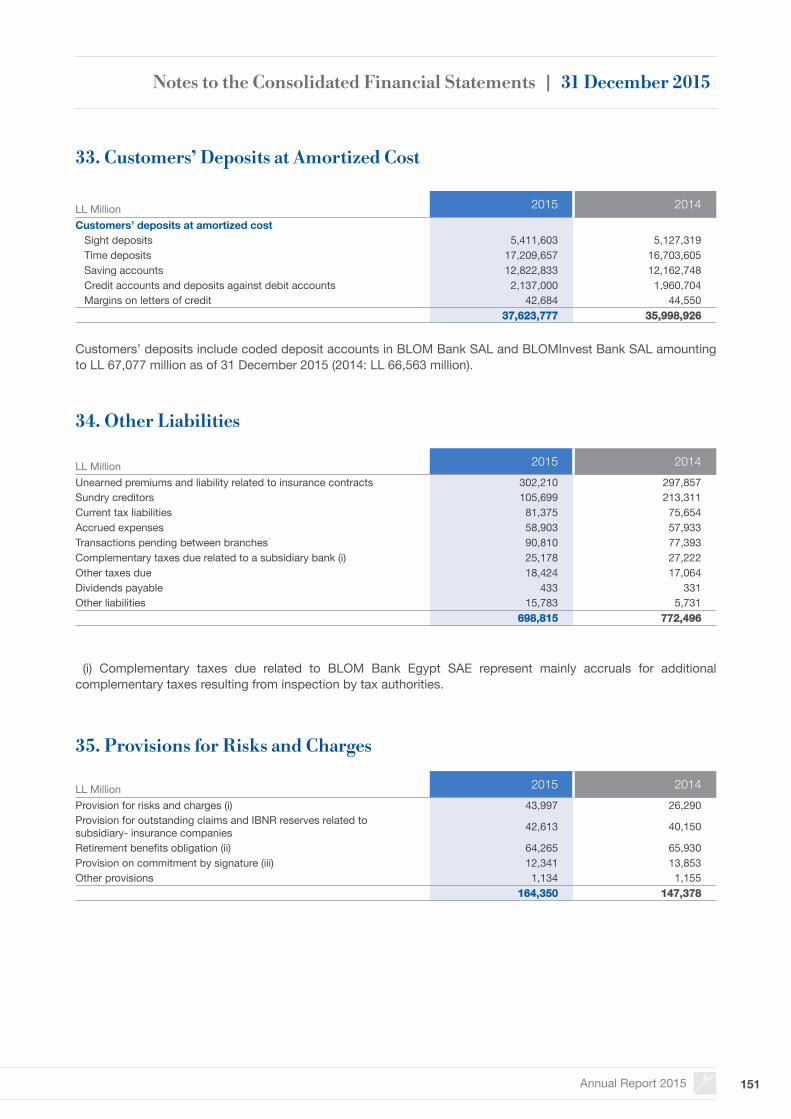
Annual Report 2015 151
33. Customers’ Deposits at Amortized Cost
LL Million 2015 2014Customers’ deposits at amortized cost Sight deposits 5,411,603 5,127,319 Time deposits 17,209,657 16,703,605 Saving accounts 12,822,833 12,162,748 Credit accounts and deposits against debit accounts 2,137,000 1,960,704 Margins on letters of credit 42,684 44,550
37,623,777 35,998,926
Customers’ deposits include coded deposit accounts in BLOM Bank SAL and BLOMInvest Bank SAL amounting to LL 67,077 million as of 31 December 2015 (2014: LL 66,563 million).
34. Other Liabilities
LL Million 2015 2014Unearned premiums and liability related to insurance contracts 302,210 297,857Sundry creditors 105,699 213,311Current tax liabilities 81,375 75,654Accrued expenses 58,903 57,933Transactions pending between branches 90,810 77,393Complementary taxes due related to a subsidiary bank (i) 25,178 27,222Other taxes due 18,424 17,064Dividends payable 433 331Other liabilities 15,783 5,731
698,815 772,496
(i) Complementary taxes due related to BLOM Bank Egypt SAE represent mainly accruals for additional complementary taxes resulting from inspection by tax authorities.
35. Provisions for Risks and Charges
LL Million 2015 2014Provision for risks and charges (i) 43,997 26,290Provision for outstanding claims and IBNR reserves related to subsidiary- insurance companies 42,613 40,150
Retirement benefits obligation (ii) 64,265 65,930Provision on commitment by signature (iii) 12,341 13,853Other provisions 1,134 1,155
164,350 147,378
Notes to the Consolidated Financial Statements | 31 December 2015
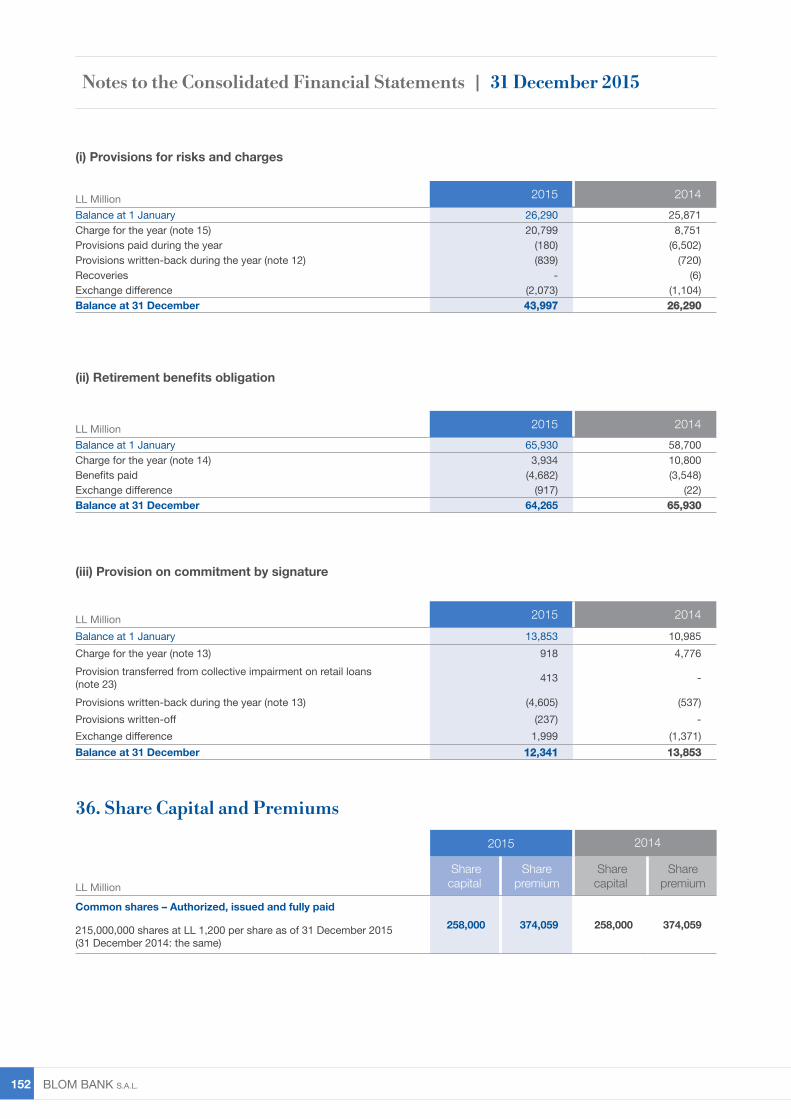
BLOM BANK s.A.L. 152
LL Million 2015 2014Balance at 1 January 26,290 25,871Charge for the year (note 15) 20,799 8,751Provisions paid during the year (180) (6,502)Provisions written-back during the year (note 12) (839) (720)Recoveries - (6)Exchange difference (2,073) (1,104)Balance at 31 December 43,997 26,290
LL Million 2015 2014Balance at 1 January 65,930 58,700Charge for the year (note 14) 3,934 10,800Benefits paid (4,682) (3,548)Exchange difference (917) (22)Balance at 31 December 64,265 65,930
(i) Provisions for risks and charges
(ii) Retirement benefits obligation
LL Million 2015 2014
Balance at 1 January 13,853 10,985Charge for the year (note 13) 918 4,776Provision transferred from collective impairment on retail loans(note 23) 413 -
Provisions written-back during the year (note 13) (4,605) (537)Provisions written-off (237) -Exchange difference 1,999 (1,371)Balance at 31 December 12,341 13,853
(iii) Provision on commitment by signature
36. Share Capital and Premiums
2015 2014
LL Million Share capital
Sharepremium
Share capital
Sharepremium
Common shares – Authorized, issued and fully paid
215,000,000 shares at LL 1,200 per share as of 31 December 2015 (31 December 2014: the same)
258,000 374,059 258,000 374,059
Notes to the Consolidated Financial Statements | 31 December 2015
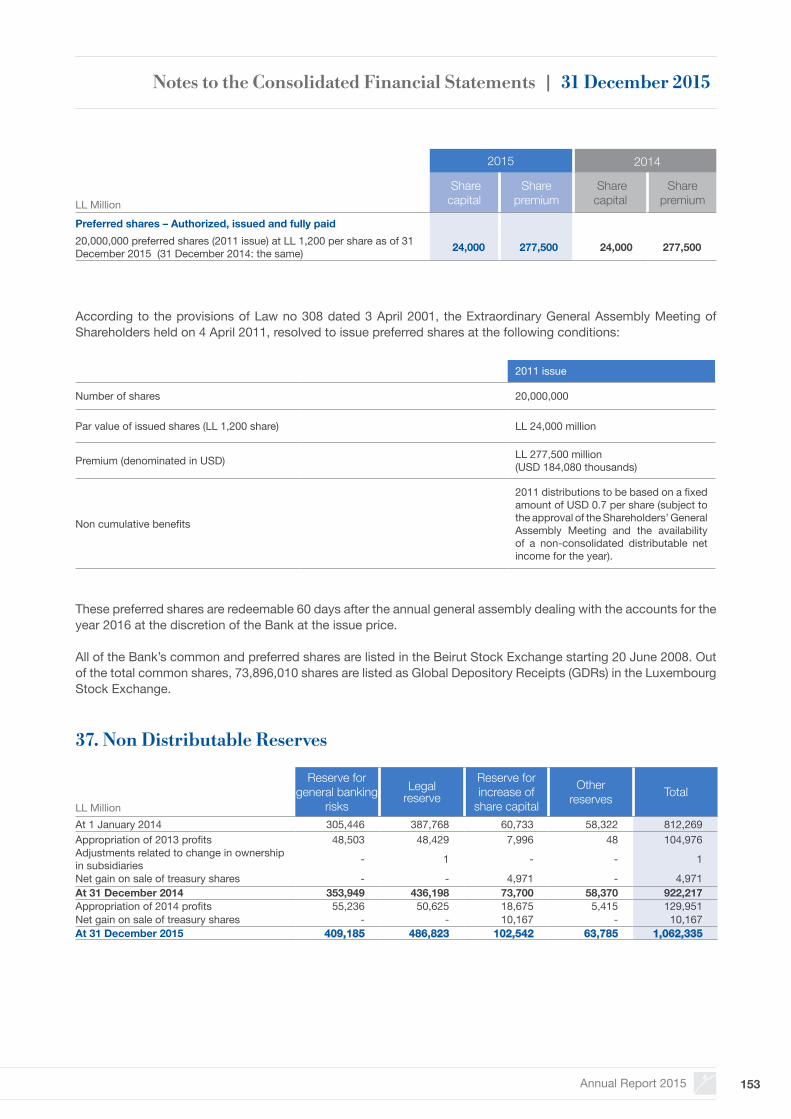
Annual Report 2015 153
2011 issue
Number of shares 20,000,000
Par value of issued shares (LL 1,200 share) LL 24,000 million
Premium (denominated in USD) LL 277,500 million(USD 184,080 thousands)
Non cumulative benefits
2011 distributions to be based on a fixed amount of USD 0.7 per share (subject to the approval of the Shareholders’ General Assembly Meeting and the availability of a non-consolidated distributable net income for the year).
According to the provisions of Law no 308 dated 3 April 2001, the Extraordinary General Assembly Meeting of Shareholders held on 4 April 2011, resolved to issue preferred shares at the following conditions:
These preferred shares are redeemable 60 days after the annual general assembly dealing with the accounts for the year 2016 at the discretion of the Bank at the issue price.
All of the Bank’s common and preferred shares are listed in the Beirut Stock Exchange starting 20 June 2008. Out of the total common shares, 73,896,010 shares are listed as Global Depository Receipts (GDRs) in the Luxembourg Stock Exchange.
2015 2014
LL Million Share capital
Sharepremium
Share capital
Sharepremium
Preferred shares – Authorized, issued and fully paid20,000,000 preferred shares (2011 issue) at LL 1,200 per share as of 31 December 2015 (31 December 2014: the same) 24,000 277,500 24,000 277,500
37. Non Distributable Reserves
LL Million
Reserve for general banking
risksLegal
reserveReserve for increase of
share capital
Otherreserves Total
At 1 January 2014 305,446 387,768 60,733 58,322 812,269Appropriation of 2013 profits 48,503 48,429 7,996 48 104,976Adjustments related to change in ownership in subsidiaries - 1 - - 1
Net gain on sale of treasury shares - - 4,971 - 4,971At 31 December 2014 353,949 436,198 73,700 58,370 922,217Appropriation of 2014 profits 55,236 50,625 18,675 5,415 129,951Net gain on sale of treasury shares - - 10,167 - 10,167At 31 December 2015 409,185 486,823 102,542 63,785 1,062,335
Notes to the Consolidated Financial Statements | 31 December 2015
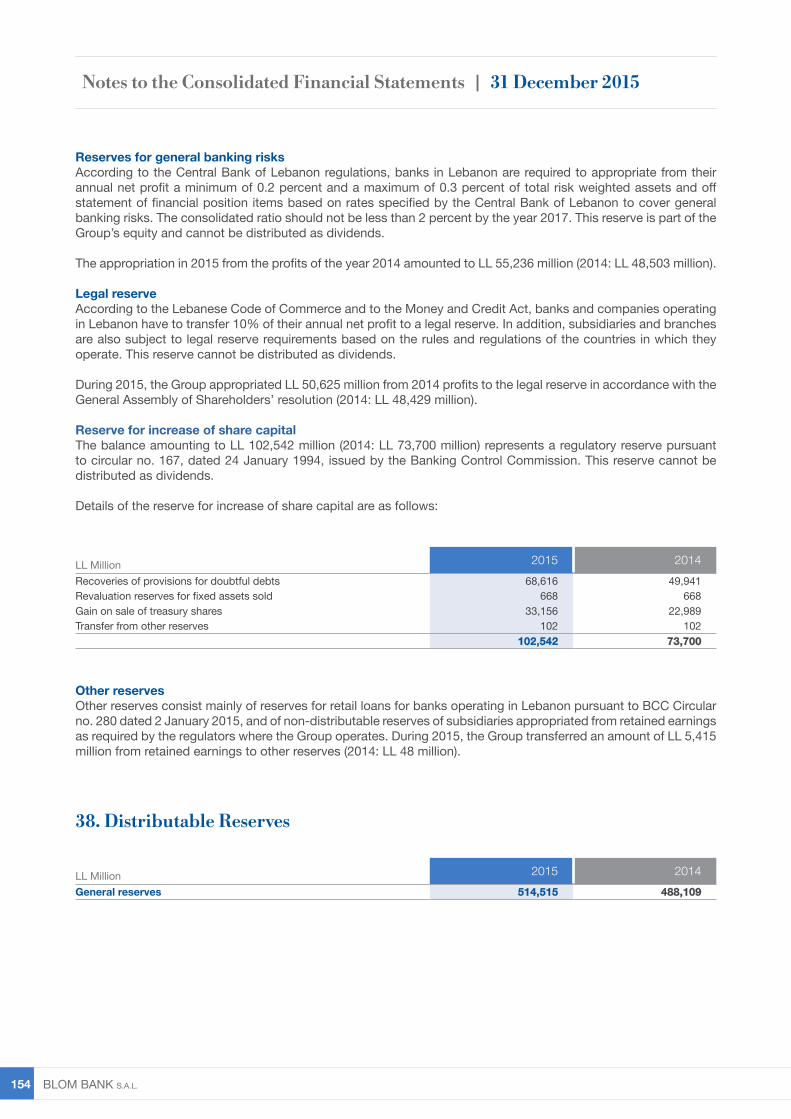
BLOM BANK s.A.L. 154
Reserves for general banking risks According to the Central Bank of Lebanon regulations, banks in Lebanon are required to appropriate from their annual net profit a minimum of 0.2 percent and a maximum of 0.3 percent of total risk weighted assets and off statement of financial position items based on rates specified by the Central Bank of Lebanon to cover general banking risks. The consolidated ratio should not be less than 2 percent by the year 2017. This reserve is part of the Group’s equity and cannot be distributed as dividends.
The appropriation in 2015 from the profits of the year 2014 amounted to LL 55,236 million (2014: LL 48,503 million).
Legal reserveAccording to the Lebanese Code of Commerce and to the Money and Credit Act, banks and companies operating in Lebanon have to transfer 10% of their annual net profit to a legal reserve. In addition, subsidiaries and branches are also subject to legal reserve requirements based on the rules and regulations of the countries in which they operate. This reserve cannot be distributed as dividends.
During 2015, the Group appropriated LL 50,625 million from 2014 profits to the legal reserve in accordance with the General Assembly of Shareholders’ resolution (2014: LL 48,429 million).
Reserve for increase of share capitalThe balance amounting to LL 102,542 million (2014: LL 73,700 million) represents a regulatory reserve pursuant to circular no. 167, dated 24 January 1994, issued by the Banking Control Commission. This reserve cannot be distributed as dividends.
Details of the reserve for increase of share capital are as follows:
Other reservesOther reserves consist mainly of reserves for retail loans for banks operating in Lebanon pursuant to BCC Circular no. 280 dated 2 January 2015, and of non-distributable reserves of subsidiaries appropriated from retained earnings as required by the regulators where the Group operates. During 2015, the Group transferred an amount of LL 5,415 million from retained earnings to other reserves (2014: LL 48 million).
38. Distributable Reserves
LL Million 2015 2014Recoveries of provisions for doubtful debts 68,616 49,941Revaluation reserves for fixed assets sold 668 668Gain on sale of treasury shares 33,156 22,989Transfer from other reserves 102 102
102,542 73,700
LL Million 2015 2014General reserves 514,515 488,109
Notes to the Consolidated Financial Statements | 31 December 2015
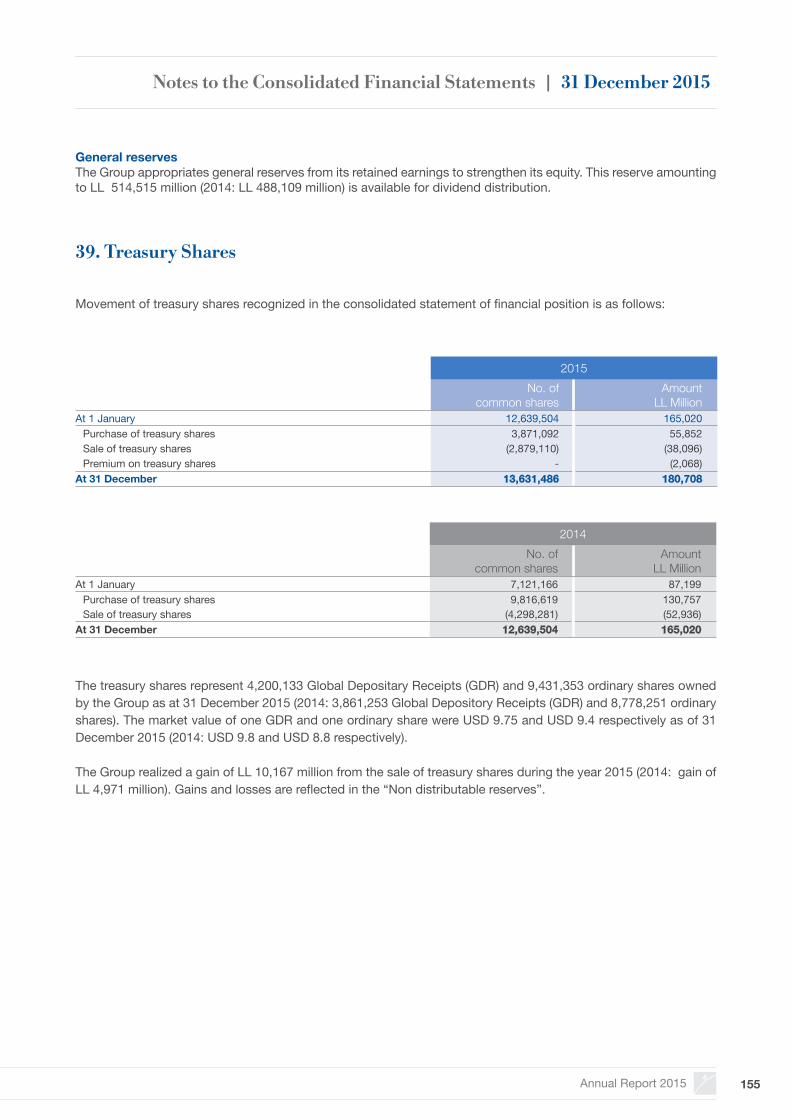
Annual Report 2015 155
General reservesThe Group appropriates general reserves from its retained earnings to strengthen its equity. This reserve amounting to LL 514,515 million (2014: LL 488,109 million) is available for dividend distribution.
Movement of treasury shares recognized in the consolidated statement of financial position is as follows:
39. Treasury Shares
2015No. of
common sharesAmount
LL MillionAt 1 January 12,639,504 165,020
Purchase of treasury shares 3,871,092 55,852Sale of treasury shares (2,879,110) (38,096)Premium on treasury shares - (2,068)
At 31 December 13,631,486 180,708
2014No. of
common sharesAmount
LL MillionAt 1 January 7,121,166 87,199
Purchase of treasury shares 9,816,619 130,757Sale of treasury shares (4,298,281) (52,936)
At 31 December 12,639,504 165,020
The treasury shares represent 4,200,133 Global Depositary Receipts (GDR) and 9,431,353 ordinary shares owned by the Group as at 31 December 2015 (2014: 3,861,253 Global Depository Receipts (GDR) and 8,778,251 ordinary shares). The market value of one GDR and one ordinary share were USD 9.75 and USD 9.4 respectively as of 31 December 2015 (2014: USD 9.8 and USD 8.8 respectively).
The Group realized a gain of LL 10,167 million from the sale of treasury shares during the year 2015 (2014: gain of LL 4,971 million). Gains and losses are reflected in the “Non distributable reserves”.
Notes to the Consolidated Financial Statements | 31 December 2015

BLOM BANK s.A.L. 156
As of 31 December, retained earnings include the following non distributable amounts:
In accordance with decision 362 of the Council of Money and Credit of Syria, unrealized accumulated foreign exchange profits from the revaluation of the structural position in foreign currency maintained by the subsidiary bank in Syria are non-distributable. These are classified as non- distributable amounts in retained earnings after the closing of each financial year ending 31 December, upon transfer of the profit for the period to retained earnings.
Movement of the change in fair value of financial assets at fair value through other comprehensive income during the year was as follows:
LL Million 2015 2014Group’s share of accumulated unrealized gain on revaluation of structural position of subsidiary bank 34,940 37,900
Unrealized gain on financial assets at fair value through profit or loss 72,176 68,820107,116 106,720
LL Million 2015 2014
At 1 January 498 -Net changes in fair values during the year (165) 498
Balance at 31 December 333 498
LL Million 2015 2014
Revaluation reserve accepted in Tier II capital 14,727 14,727
40. Retained Earnings
41. Revaluation Reserve of Real Estate
42. Change in Fair Value of Financial Assets at Fair Value through other Comprehensive Income
Notes to the Consolidated Financial Statements | 31 December 2015

Annual Report 2015 157
LL Million 2015 2014
Cash and balances with central banks 2,960,762 2,652,992Deposits with banks and financial institutions (whose original maturities are less than 3 months) 2,503,682 3,763,424
5,464,444 6,416,416Less:Due to central banks (13,350) (23,563)Repurchase agreements (626) -Due to banks and financial institutions (whose original maturities are less than 3 months) (375,855) (521,258)
5,074,613 5,871,595
43. Cash and Cash Equivalents
According to the resolution of the General Assembly meeting held on 15 April 2015, the following dividends were declared and paid, from the 2014 profits.
44. Dividends Declared and Paid
2015
Number of shares
Dividends per share in LL
TotalLL Million
Dividends on preferred shares – 2011 issue 20,000,000 1,055.25 21,105Dividends on common shares 210,373,123 1,000 210,373
231,478
The dividends on common shares, declared on 15 April 2015, were paid net of the treasury shares as of that date.
According to the resolution of the General Assembly meeting held on 9 April 2014, the following dividends were declared and paid, from the 2013 profits.
2014
Number ofshares
Dividends per share in LL
TotalLL Million
Dividends on preferred shares – 2011 issue 20,000,000 1,055.25 21,105Dividends on common shares 210,033,222 750 157,525
178,630
The dividends on common shares, declared on 9 April 2014, were paid net of the treasury shares as of that date.
Notes to the Consolidated Financial Statements | 31 December 2015
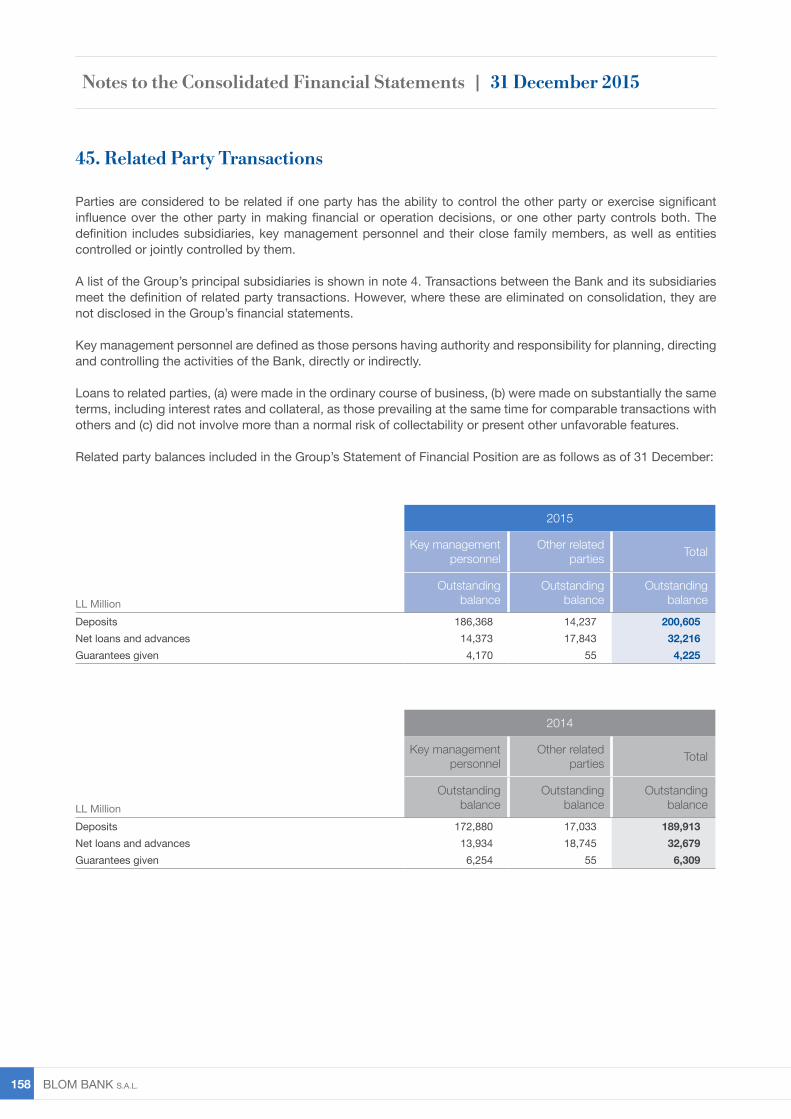
BLOM BANK s.A.L. 158
Parties are considered to be related if one party has the ability to control the other party or exercise significant influence over the other party in making financial or operation decisions, or one other party controls both. The definition includes subsidiaries, key management personnel and their close family members, as well as entities controlled or jointly controlled by them.
A list of the Group’s principal subsidiaries is shown in note 4. Transactions between the Bank and its subsidiaries meet the definition of related party transactions. However, where these are eliminated on consolidation, they are not disclosed in the Group’s financial statements.
Key management personnel are defined as those persons having authority and responsibility for planning, directing and controlling the activities of the Bank, directly or indirectly.
Loans to related parties, (a) were made in the ordinary course of business, (b) were made on substantially the same terms, including interest rates and collateral, as those prevailing at the same time for comparable transactions with others and (c) did not involve more than a normal risk of collectability or present other unfavorable features.
Related party balances included in the Group’s Statement of Financial Position are as follows as of 31 December:
2015
Key management personnel
Other related parties Total
LL MillionOutstanding
balanceOutstanding
balanceOutstanding
balance
Deposits 186,368 14,237 200,605Net loans and advances 14,373 17,843 32,216Guarantees given 4,170 55 4,225
2014
Key management personnel
Other related parties Total
LL MillionOutstanding
balanceOutstanding
balanceOutstanding
balance
Deposits 172,880 17,033 189,913Net loans and advances 13,934 18,745 32,679Guarantees given 6,254 55 6,309
45. Related Party Transactions
Notes to the Consolidated Financial Statements | 31 December 2015
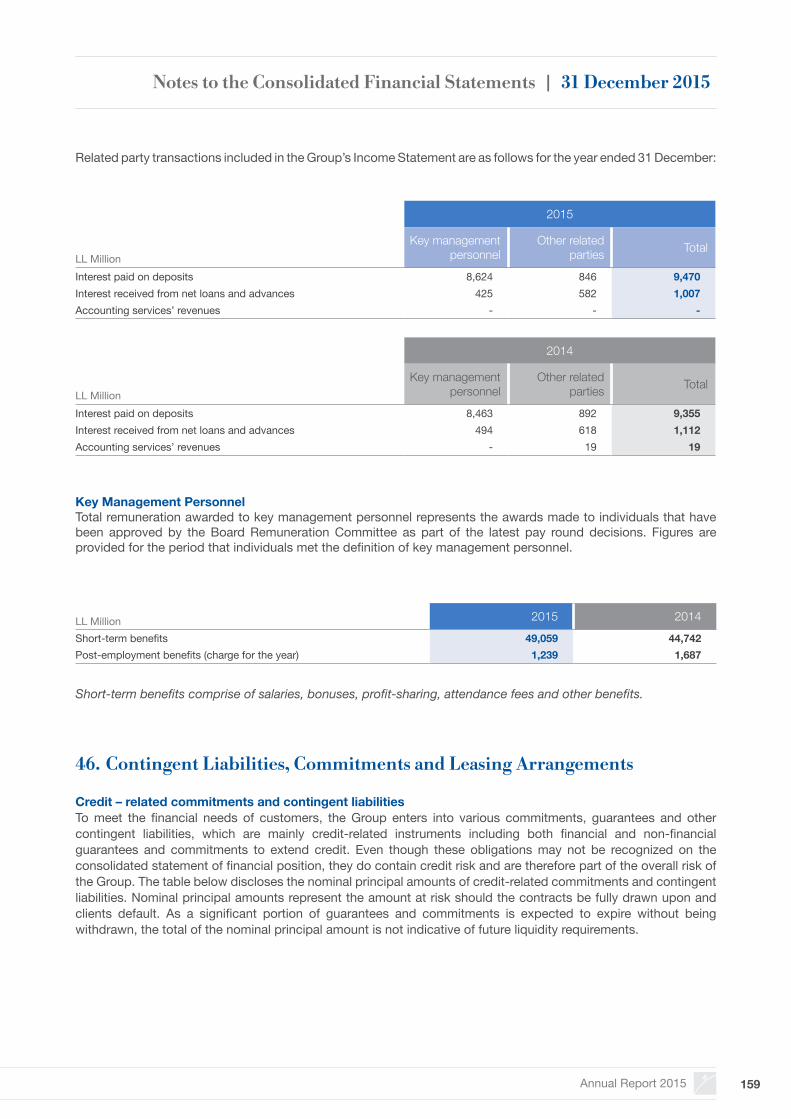
Annual Report 2015 159
Related party transactions included in the Group’s Income Statement are as follows for the year ended 31 December:
Short-term benefits comprise of salaries, bonuses, profit-sharing, attendance fees and other benefits.
2015
LL MillionKey management
personnelOther related parties Total
Interest paid on deposits 8,624 846 9,470Interest received from net loans and advances 425 582 1,007Accounting services’ revenues - - -
2014
LL MillionKey management
personnelOther related parties Total
Interest paid on deposits 8,463 892 9,355Interest received from net loans and advances 494 618 1,112Accounting services’ revenues - 19 19
Key Management Personnel Total remuneration awarded to key management personnel represents the awards made to individuals that have been approved by the Board Remuneration Committee as part of the latest pay round decisions. Figures are provided for the period that individuals met the definition of key management personnel.
LL Million 2015 2014
Short-term benefits 49,059 44,742Post-employment benefits (charge for the year) 1,239 1,687
Credit – related commitments and contingent liabilities To meet the financial needs of customers, the Group enters into various commitments, guarantees and other contingent liabilities, which are mainly credit-related instruments including both financial and non-financial guarantees and commitments to extend credit. Even though these obligations may not be recognized on the consolidated statement of financial position, they do contain credit risk and are therefore part of the overall risk of the Group. The table below discloses the nominal principal amounts of credit-related commitments and contingent liabilities. Nominal principal amounts represent the amount at risk should the contracts be fully drawn upon and clients default. As a significant portion of guarantees and commitments is expected to expire without being withdrawn, the total of the nominal principal amount is not indicative of future liquidity requirements.
46. Contingent Liabilities, Commitments and Leasing Arrangements
Notes to the Consolidated Financial Statements | 31 December 2015
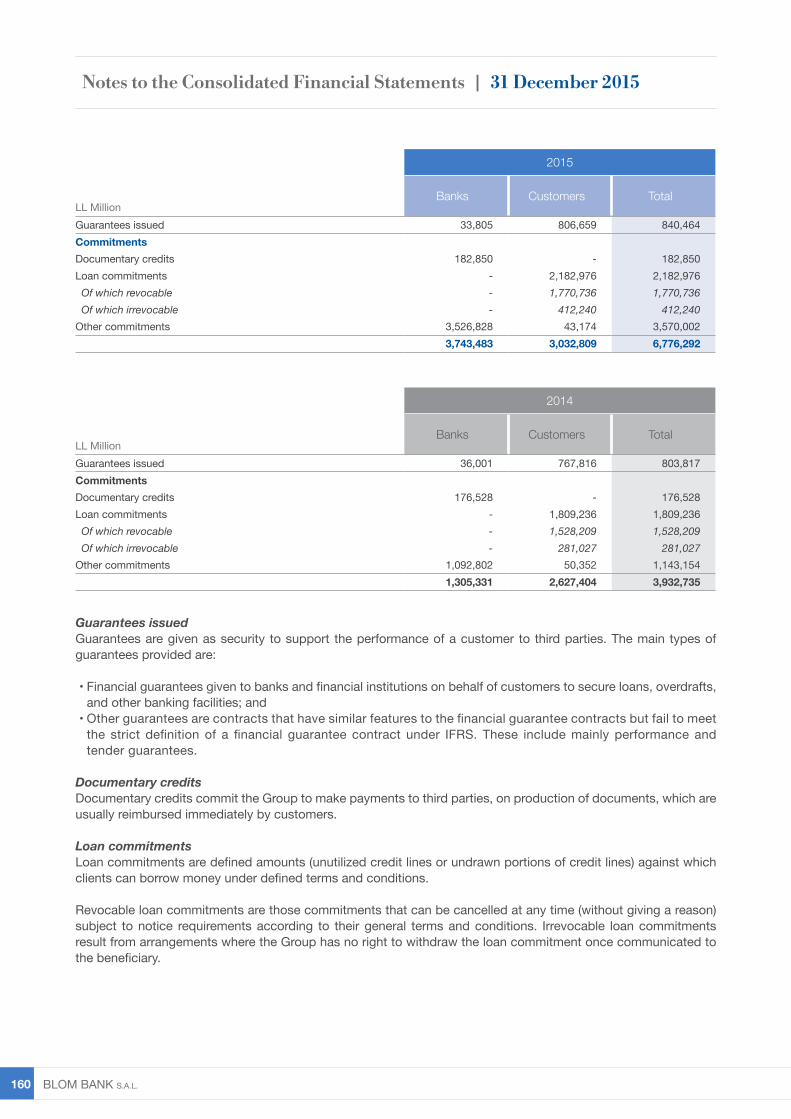
BLOM BANK s.A.L. 160
Guarantees issuedGuarantees are given as security to support the performance of a customer to third parties. The main types of guarantees provided are:
• Financial guarantees given to banks and financial institutions on behalf of customers to secure loans, overdrafts, and other banking facilities; and
• Other guarantees are contracts that have similar features to the financial guarantee contracts but fail to meet the strict definition of a financial guarantee contract under IFRS. These include mainly performance and tender guarantees.
Documentary creditsDocumentary credits commit the Group to make payments to third parties, on production of documents, which are usually reimbursed immediately by customers.
Loan commitmentsLoan commitments are defined amounts (unutilized credit lines or undrawn portions of credit lines) against which clients can borrow money under defined terms and conditions.
Revocable loan commitments are those commitments that can be cancelled at any time (without giving a reason) subject to notice requirements according to their general terms and conditions. Irrevocable loan commitments result from arrangements where the Group has no right to withdraw the loan commitment once communicated to the beneficiary.
2015
LL MillionBanks Customers Total
Guarantees issued 33,805 806,659 840,464CommitmentsDocumentary credits 182,850 - 182,850Loan commitments - 2,182,976 2,182,976 Of which revocable - 1,770,736 1,770,736 Of which irrevocable - 412,240 412,240Other commitments 3,526,828 43,174 3,570,002
3,743,483 3,032,809 6,776,292
2014
LL MillionBanks Customers Total
Guarantees issued 36,001 767,816 803,817CommitmentsDocumentary credits 176,528 - 176,528Loan commitments - 1,809,236 1,809,236 Of which revocable - 1,528,209 1,528,209 Of which irrevocable - 281,027 281,027Other commitments 1,092,802 50,352 1,143,154
1,305,331 2,627,404 3,932,735
Notes to the Consolidated Financial Statements | 31 December 2015
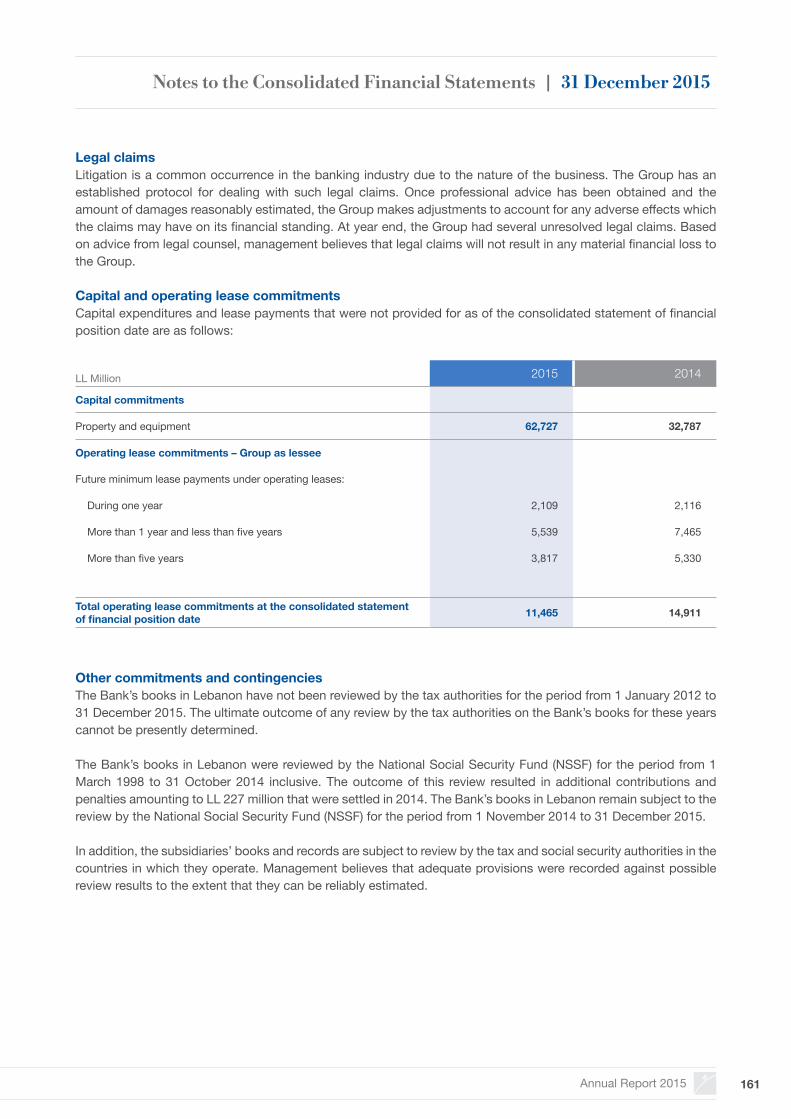
Annual Report 2015 161
Legal claimsLitigation is a common occurrence in the banking industry due to the nature of the business. The Group has an established protocol for dealing with such legal claims. Once professional advice has been obtained and the amount of damages reasonably estimated, the Group makes adjustments to account for any adverse effects which the claims may have on its financial standing. At year end, the Group had several unresolved legal claims. Based on advice from legal counsel, management believes that legal claims will not result in any material financial loss to the Group.
Capital and operating lease commitmentsCapital expenditures and lease payments that were not provided for as of the consolidated statement of financial position date are as follows:
Other commitments and contingenciesThe Bank’s books in Lebanon have not been reviewed by the tax authorities for the period from 1 January 2012 to 31 December 2015. The ultimate outcome of any review by the tax authorities on the Bank’s books for these years cannot be presently determined.
The Bank’s books in Lebanon were reviewed by the National Social Security Fund (NSSF) for the period from 1 March 1998 to 31 October 2014 inclusive. The outcome of this review resulted in additional contributions and penalties amounting to LL 227 million that were settled in 2014. The Bank’s books in Lebanon remain subject to the review by the National Social Security Fund (NSSF) for the period from 1 November 2014 to 31 December 2015.
In addition, the subsidiaries’ books and records are subject to review by the tax and social security authorities in the countries in which they operate. Management believes that adequate provisions were recorded against possible review results to the extent that they can be reliably estimated.
LL Million 2015 2014
Capital commitments
Property and equipment 62,727 32,787
Operating lease commitments – Group as lessee
Future minimum lease payments under operating leases:
During one year 2,109 2,116
More than 1 year and less than five years 5,539 7,465
More than five years 3,817 5,330
Total operating lease commitments at the consolidated statement of financial position date 11,465 14,911
Notes to the Consolidated Financial Statements | 31 December 2015
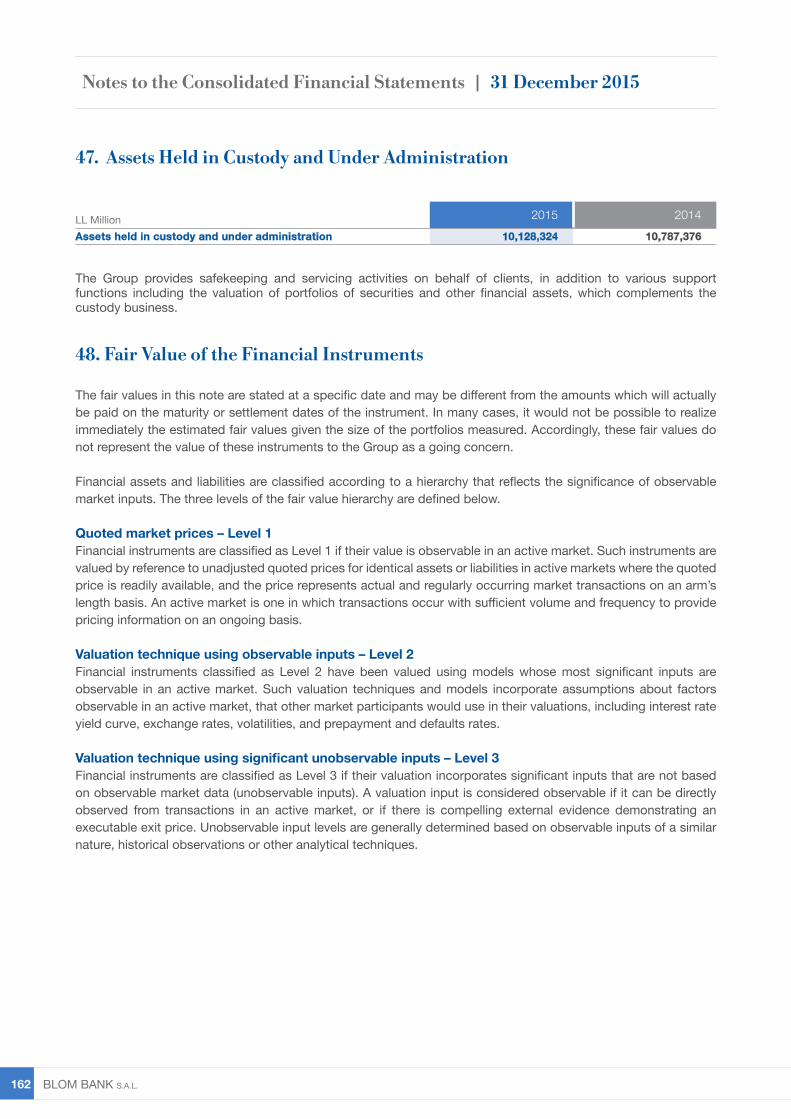
BLOM BANK s.A.L. 162
The Group provides safekeeping and servicing activities on behalf of clients, in addition to various support functions including the valuation of portfolios of securities and other financial assets, which complements the custody business.
The fair values in this note are stated at a specific date and may be different from the amounts which will actually be paid on the maturity or settlement dates of the instrument. In many cases, it would not be possible to realize immediately the estimated fair values given the size of the portfolios measured. Accordingly, these fair values do not represent the value of these instruments to the Group as a going concern.
Financial assets and liabilities are classified according to a hierarchy that reflects the significance of observable market inputs. The three levels of the fair value hierarchy are defined below.
Quoted market prices – Level 1Financial instruments are classified as Level 1 if their value is observable in an active market. Such instruments are valued by reference to unadjusted quoted prices for identical assets or liabilities in active markets where the quoted price is readily available, and the price represents actual and regularly occurring market transactions on an arm’s length basis. An active market is one in which transactions occur with sufficient volume and frequency to provide pricing information on an ongoing basis.
Valuation technique using observable inputs – Level 2Financial instruments classified as Level 2 have been valued using models whose most significant inputs are observable in an active market. Such valuation techniques and models incorporate assumptions about factors observable in an active market, that other market participants would use in their valuations, including interest rate yield curve, exchange rates, volatilities, and prepayment and defaults rates.
Valuation technique using significant unobservable inputs – Level 3Financial instruments are classified as Level 3 if their valuation incorporates significant inputs that are not based on observable market data (unobservable inputs). A valuation input is considered observable if it can be directly observed from transactions in an active market, or if there is compelling external evidence demonstrating an executable exit price. Unobservable input levels are generally determined based on observable inputs of a similar nature, historical observations or other analytical techniques.
LL Million 2015 2014Assets held in custody and under administration 10,128,324 10,787,376
47. Assets Held in Custody and Under Administration
48. Fair Value of the Financial Instruments
Notes to the Consolidated Financial Statements | 31 December 2015
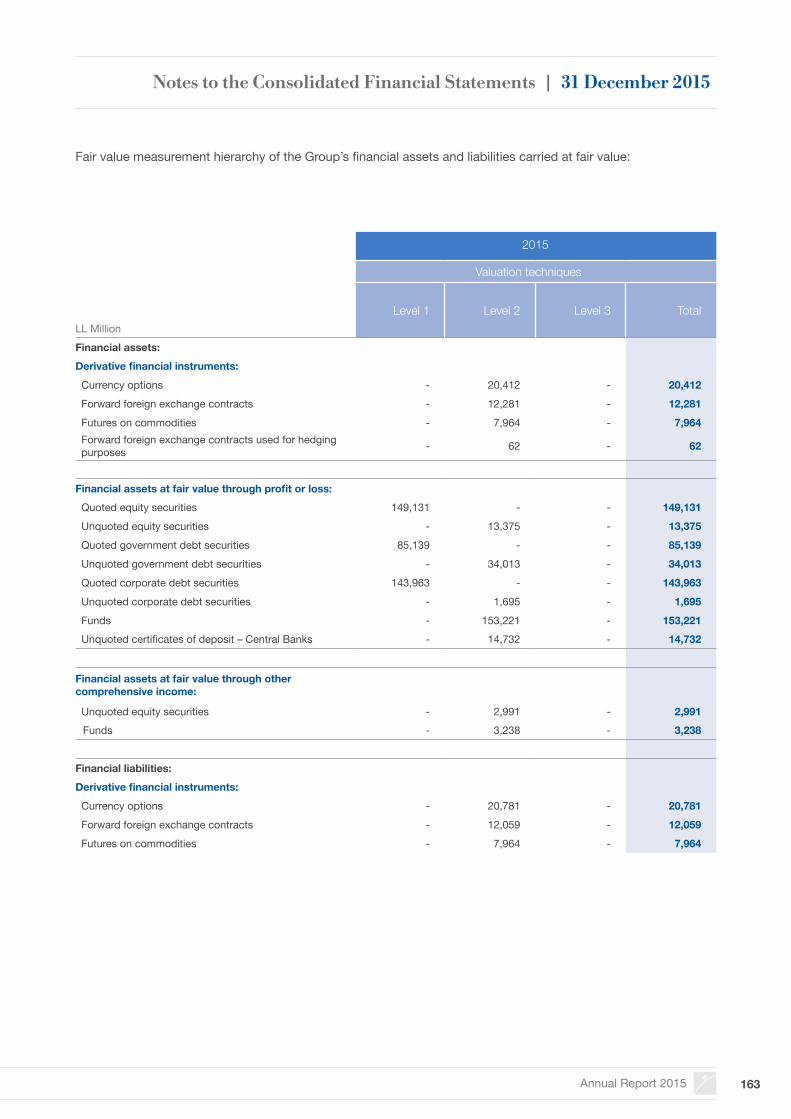
Annual Report 2015 163
Fair value measurement hierarchy of the Group’s financial assets and liabilities carried at fair value:
2015
Valuation techniques
LL MillionLevel 1 Level 2 Level 3 Total
Financial assets:Derivative financial instruments: Currency options - 20,412 - 20,412 Forward foreign exchange contracts - 12,281 - 12,281 Futures on commodities - 7,964 - 7,964 Forward foreign exchange contracts used for hedging purposes - 62 - 62
Financial assets at fair value through profit or loss: Quoted equity securities 149,131 - - 149,131 Unquoted equity securities - 13,375 - 13,375 Quoted government debt securities 85,139 - - 85,139 Unquoted government debt securities - 34,013 - 34,013 Quoted corporate debt securities 143,963 - - 143,963 Unquoted corporate debt securities - 1,695 - 1,695 Funds - 153,221 - 153,221 Unquoted certificates of deposit – Central Banks - 14,732 - 14,732
Financial assets at fair value through other comprehensive income:
Unquoted equity securities - 2,991 - 2,991Funds - 3,238 - 3,238
Financial liabilities:Derivative financial instruments: Currency options - 20,781 - 20,781 Forward foreign exchange contracts - 12,059 - 12,059 Futures on commodities - 7,964 - 7,964
Notes to the Consolidated Financial Statements | 31 December 2015
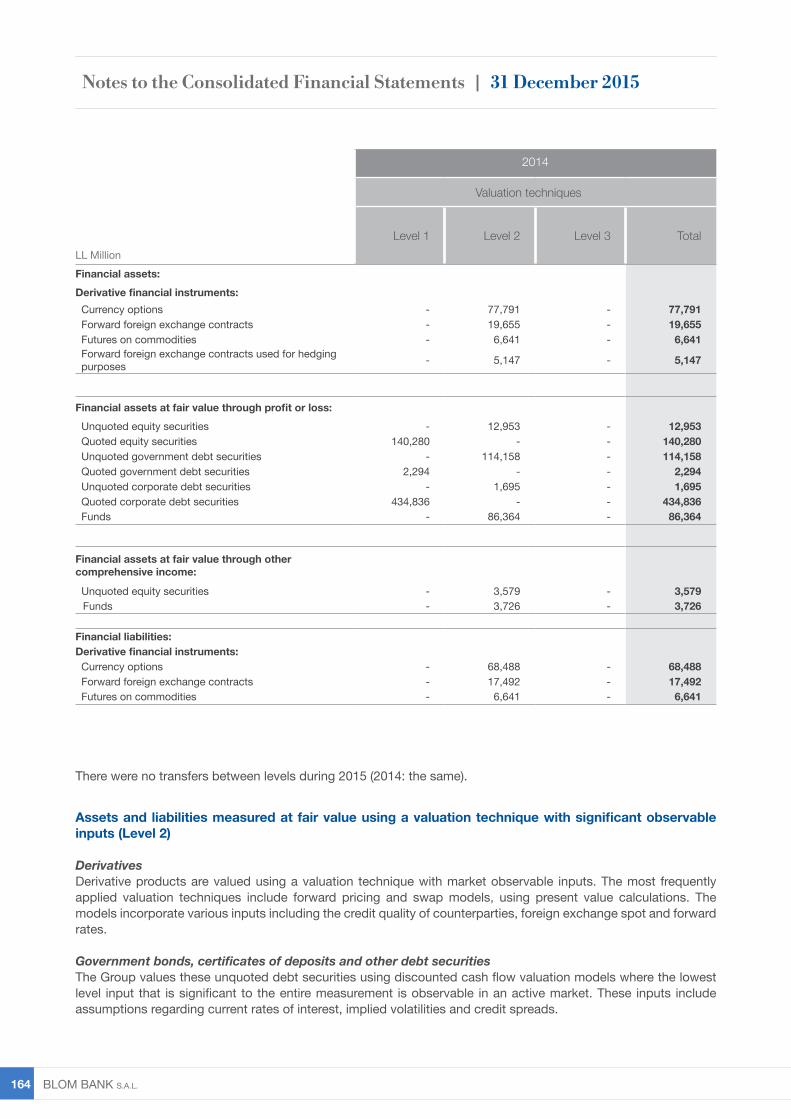
BLOM BANK s.A.L. 164
2014
Valuation techniques
LL MillionLevel 1 Level 2 Level 3 Total
Financial assets:Derivative financial instruments: Currency options - 77,791 - 77,791 Forward foreign exchange contracts - 19,655 - 19,655 Futures on commodities - 6,641 - 6,641 Forward foreign exchange contracts used for hedging purposes - 5,147 - 5,147
Financial assets at fair value through profit or loss: Unquoted equity securities - 12,953 - 12,953 Quoted equity securities 140,280 - - 140,280 Unquoted government debt securities - 114,158 - 114,158 Quoted government debt securities 2,294 - - 2,294 Unquoted corporate debt securities - 1,695 - 1,695 Quoted corporate debt securities 434,836 - - 434,836 Funds - 86,364 - 86,364
Financial assets at fair value through other comprehensive income:
Unquoted equity securities - 3,579 - 3,579Funds - 3,726 - 3,726
Financial liabilities:Derivative financial instruments: Currency options - 68,488 - 68,488 Forward foreign exchange contracts - 17,492 - 17,492 Futures on commodities - 6,641 - 6,641
Assets and liabilities measured at fair value using a valuation technique with significant observable inputs (Level 2)
DerivativesDerivative products are valued using a valuation technique with market observable inputs. The most frequently applied valuation techniques include forward pricing and swap models, using present value calculations. The models incorporate various inputs including the credit quality of counterparties, foreign exchange spot and forward rates.
Government bonds, certificates of deposits and other debt securitiesThe Group values these unquoted debt securities using discounted cash flow valuation models where the lowest level input that is significant to the entire measurement is observable in an active market. These inputs include assumptions regarding current rates of interest, implied volatilities and credit spreads.
There were no transfers between levels during 2015 (2014: the same).
Notes to the Consolidated Financial Statements | 31 December 2015
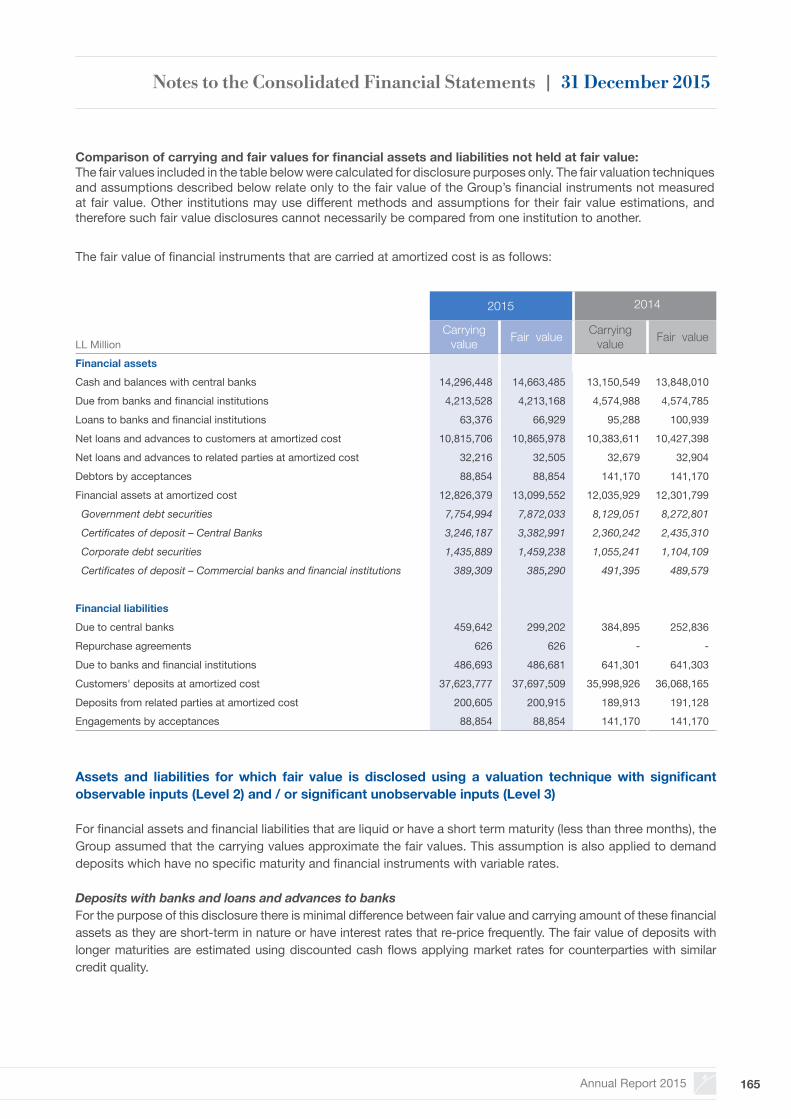
Annual Report 2015 165
The fair value of financial instruments that are carried at amortized cost is as follows:
Comparison of carrying and fair values for financial assets and liabilities not held at fair value:The fair values included in the table below were calculated for disclosure purposes only. The fair valuation techniques and assumptions described below relate only to the fair value of the Group’s financial instruments not measured at fair value. Other institutions may use different methods and assumptions for their fair value estimations, and therefore such fair value disclosures cannot necessarily be compared from one institution to another.
2015 2014
LL MillionCarrying
value Fair value Carrying value Fair value
Financial assetsCash and balances with central banks 14,296,448 14,663,485 13,150,549 13,848,010Due from banks and financial institutions 4,213,528 4,213,168 4,574,988 4,574,785Loans to banks and financial institutions 63,376 66,929 95,288 100,939Net loans and advances to customers at amortized cost 10,815,706 10,865,978 10,383,611 10,427,398Net loans and advances to related parties at amortized cost 32,216 32,505 32,679 32,904Debtors by acceptances 88,854 88,854 141,170 141,170Financial assets at amortized cost 12,826,379 13,099,552 12,035,929 12,301,799 Government debt securities 7,754,994 7,872,033 8,129,051 8,272,801 Certificates of deposit – Central Banks 3,246,187 3,382,991 2,360,242 2,435,310 Corporate debt securities 1,435,889 1,459,238 1,055,241 1,104,109 Certificates of deposit – Commercial banks and financial institutions 389,309 385,290 491,395 489,579 Financial liabilitiesDue to central banks 459,642 299,202 384,895 252,836Repurchase agreements 626 626 - -Due to banks and financial institutions 486,693 486,681 641,301 641,303Customers' deposits at amortized cost 37,623,777 37,697,509 35,998,926 36,068,165Deposits from related parties at amortized cost 200,605 200,915 189,913 191,128Engagements by acceptances 88,854 88,854 141,170 141,170
Assets and liabilities for which fair value is disclosed using a valuation technique with significant observable inputs (Level 2) and / or significant unobservable inputs (Level 3)
For financial assets and financial liabilities that are liquid or have a short term maturity (less than three months), the Group assumed that the carrying values approximate the fair values. This assumption is also applied to demand deposits which have no specific maturity and financial instruments with variable rates.
Deposits with banks and loans and advances to banksFor the purpose of this disclosure there is minimal difference between fair value and carrying amount of these financial assets as they are short-term in nature or have interest rates that re-price frequently. The fair value of deposits with longer maturities are estimated using discounted cash flows applying market rates for counterparties with similar credit quality.
Notes to the Consolidated Financial Statements | 31 December 2015
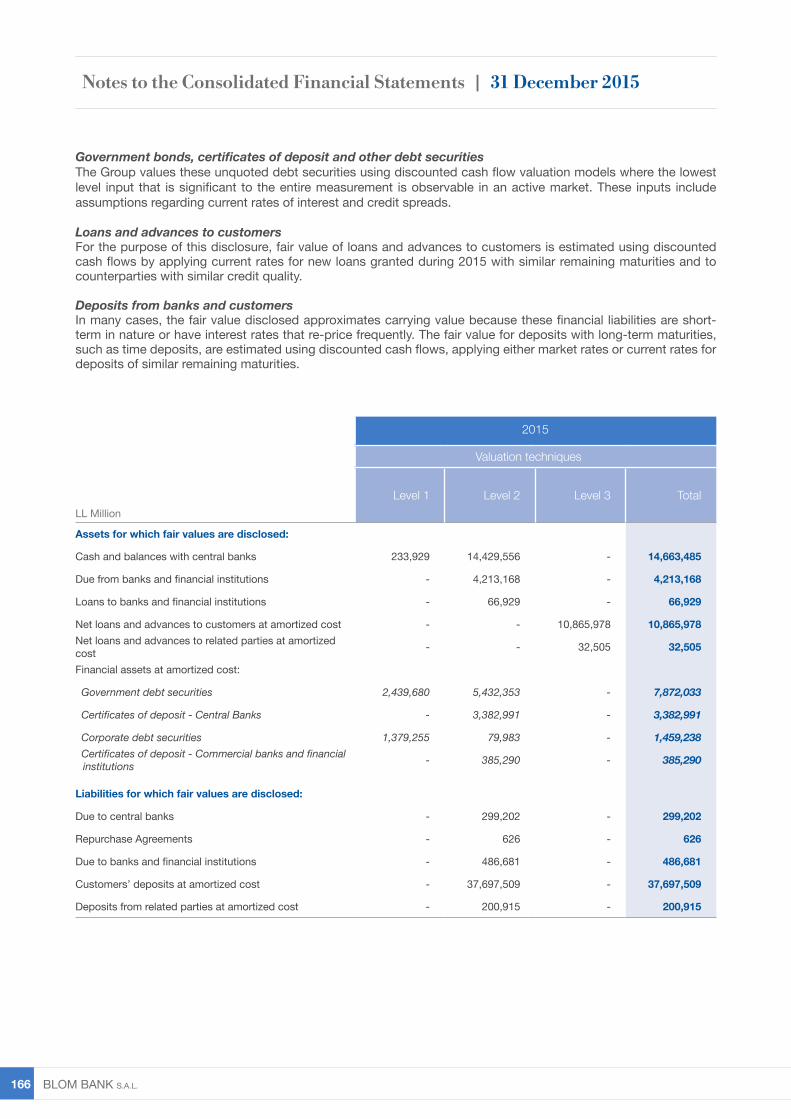
BLOM BANK s.A.L. 166
Government bonds, certificates of deposit and other debt securitiesThe Group values these unquoted debt securities using discounted cash flow valuation models where the lowest level input that is significant to the entire measurement is observable in an active market. These inputs include assumptions regarding current rates of interest and credit spreads.
Loans and advances to customersFor the purpose of this disclosure, fair value of loans and advances to customers is estimated using discounted cash flows by applying current rates for new loans granted during 2015 with similar remaining maturities and to counterparties with similar credit quality.
Deposits from banks and customersIn many cases, the fair value disclosed approximates carrying value because these financial liabilities are short-term in nature or have interest rates that re-price frequently. The fair value for deposits with long-term maturities, such as time deposits, are estimated using discounted cash flows, applying either market rates or current rates for deposits of similar remaining maturities.
2015
Valuation techniques
LL MillionLevel 1 Level 2 Level 3 Total
Assets for which fair values are disclosed:
Cash and balances with central banks 233,929 14,429,556 - 14,663,485
Due from banks and financial institutions - 4,213,168 - 4,213,168
Loans to banks and financial institutions - 66,929 - 66,929
Net loans and advances to customers at amortized cost - - 10,865,978 10,865,978Net loans and advances to related parties at amortizedcost - - 32,505 32,505
Financial assets at amortized cost:
Government debt securities 2,439,680 5,432,353 - 7,872,033
Certificates of deposit - Central Banks - 3,382,991 - 3,382,991
Corporate debt securities 1,379,255 79,983 - 1,459,238 Certificates of deposit - Commercial banks and financial
institutions - 385,290 - 385,290
Liabilities for which fair values are disclosed:
Due to central banks - 299,202 - 299,202
Repurchase Agreements - 626 - 626
Due to banks and financial institutions - 486,681 - 486,681
Customers’ deposits at amortized cost - 37,697,509 - 37,697,509
Deposits from related parties at amortized cost - 200,915 - 200,915
Notes to the Consolidated Financial Statements | 31 December 2015
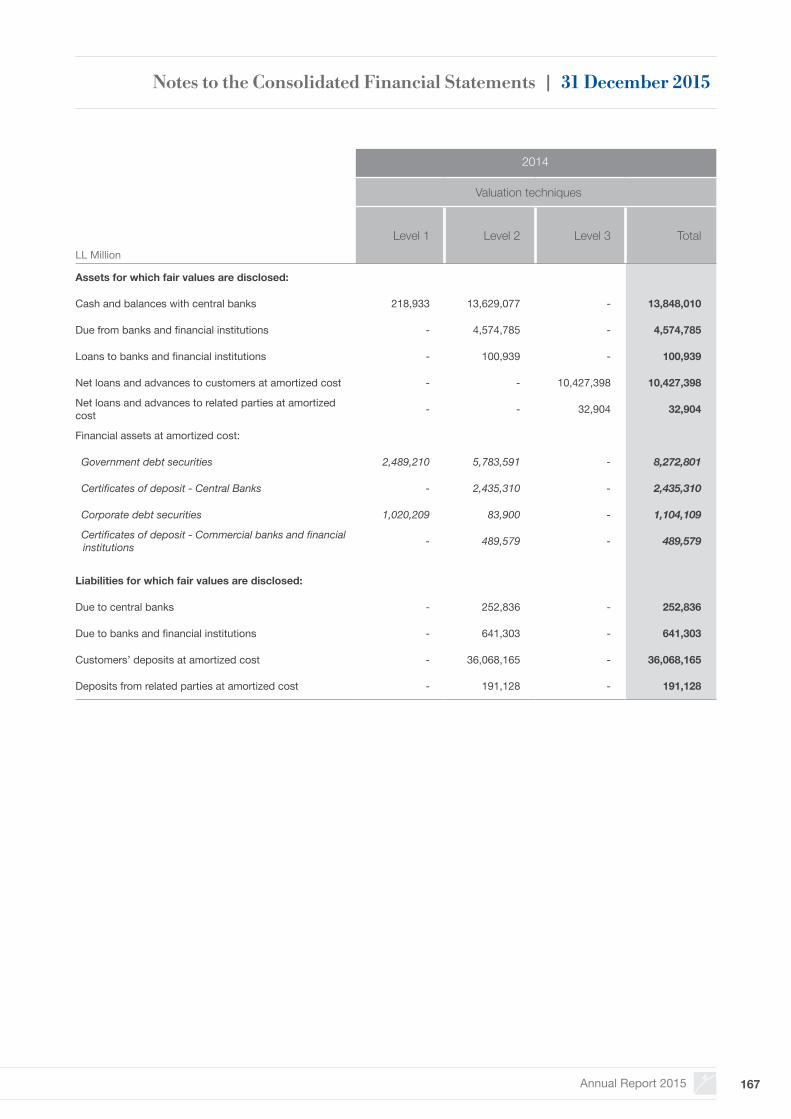
Annual Report 2015 167
2014
Valuation techniques
LL MillionLevel 1 Level 2 Level 3 Total
Assets for which fair values are disclosed:
Cash and balances with central banks 218,933 13,629,077 - 13,848,010
Due from banks and financial institutions - 4,574,785 - 4,574,785
Loans to banks and financial institutions - 100,939 - 100,939
Net loans and advances to customers at amortized cost - - 10,427,398 10,427,398
Net loans and advances to related parties at amortizedcost - - 32,904 32,904
Financial assets at amortized cost:
Government debt securities 2,489,210 5,783,591 - 8,272,801
Certificates of deposit - Central Banks - 2,435,310 - 2,435,310
Corporate debt securities 1,020,209 83,900 - 1,104,109
Certificates of deposit - Commercial banks and financial institutions - 489,579 - 489,579
Liabilities for which fair values are disclosed:
Due to central banks - 252,836 - 252,836
Due to banks and financial institutions - 641,303 - 641,303
Customers’ deposits at amortized cost - 36,068,165 - 36,068,165
Deposits from related parties at amortized cost - 191,128 - 191,128
Notes to the Consolidated Financial Statements | 31 December 2015
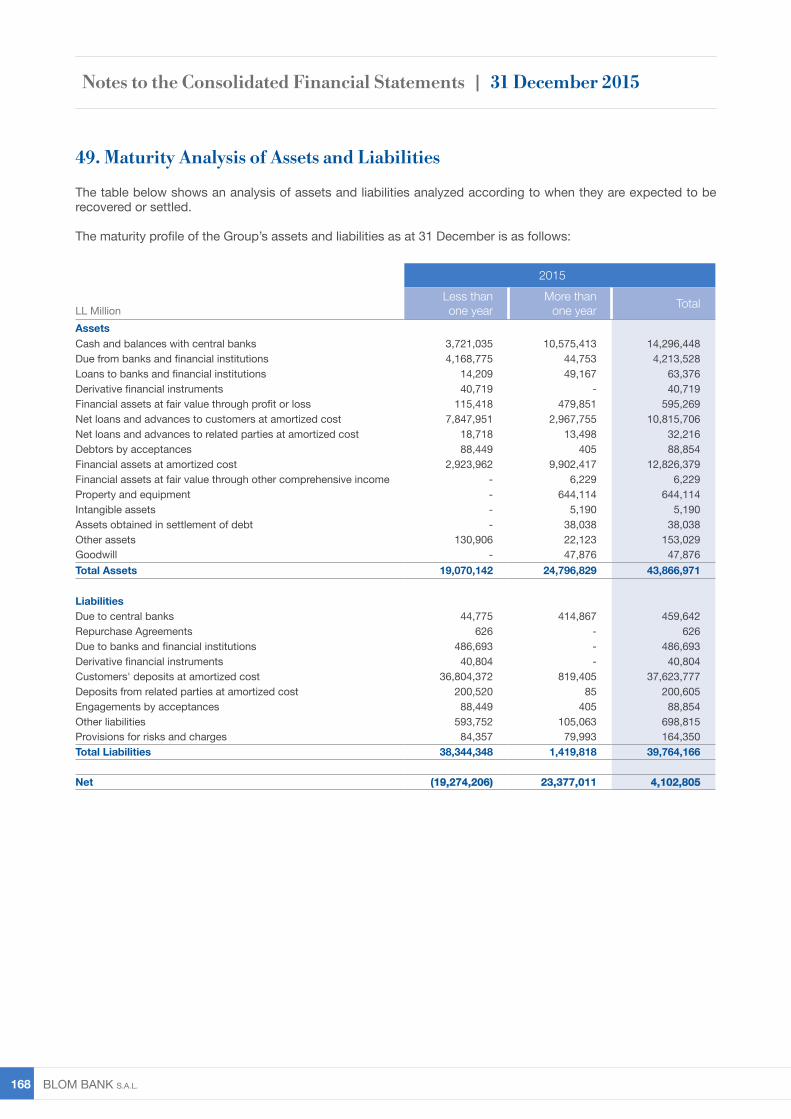
BLOM BANK s.A.L. 168
The table below shows an analysis of assets and liabilities analyzed according to when they are expected to be recovered or settled.
The maturity profile of the Group’s assets and liabilities as at 31 December is as follows:
49. Maturity Analysis of Assets and Liabilities
2015
LL MillionLess than
one yearMore than
one year Total
AssetsCash and balances with central banks 3,721,035 10,575,413 14,296,448Due from banks and financial institutions 4,168,775 44,753 4,213,528Loans to banks and financial institutions 14,209 49,167 63,376Derivative financial instruments 40,719 - 40,719Financial assets at fair value through profit or loss 115,418 479,851 595,269Net loans and advances to customers at amortized cost 7,847,951 2,967,755 10,815,706Net loans and advances to related parties at amortized cost 18,718 13,498 32,216Debtors by acceptances 88,449 405 88,854Financial assets at amortized cost 2,923,962 9,902,417 12,826,379Financial assets at fair value through other comprehensive income - 6,229 6,229Property and equipment - 644,114 644,114Intangible assets - 5,190 5,190Assets obtained in settlement of debt - 38,038 38,038Other assets 130,906 22,123 153,029Goodwill - 47,876 47,876Total Assets 19,070,142 24,796,829 43,866,971
LiabilitiesDue to central banks 44,775 414,867 459,642Repurchase Agreements 626 - 626Due to banks and financial institutions 486,693 - 486,693Derivative financial instruments 40,804 - 40,804Customers' deposits at amortized cost 36,804,372 819,405 37,623,777Deposits from related parties at amortized cost 200,520 85 200,605Engagements by acceptances 88,449 405 88,854Other liabilities 593,752 105,063 698,815Provisions for risks and charges 84,357 79,993 164,350Total Liabilities 38,344,348 1,419,818 39,764,166
Net (19,274,206) 23,377,011 4,102,805
Notes to the Consolidated Financial Statements | 31 December 2015
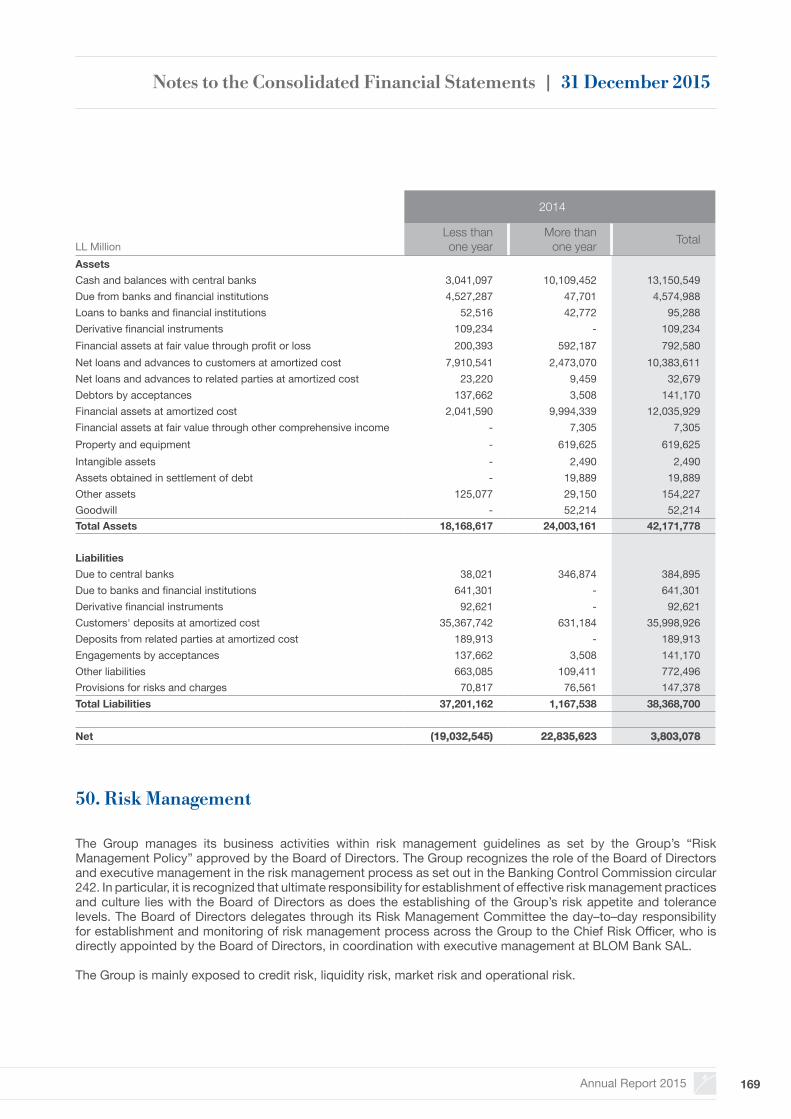
Annual Report 2015 169
2014
LL MillionLess than
one yearMore than
one year Total
AssetsCash and balances with central banks 3,041,097 10,109,452 13,150,549Due from banks and financial institutions 4,527,287 47,701 4,574,988Loans to banks and financial institutions 52,516 42,772 95,288Derivative financial instruments 109,234 - 109,234Financial assets at fair value through profit or loss 200,393 592,187 792,580Net loans and advances to customers at amortized cost 7,910,541 2,473,070 10,383,611Net loans and advances to related parties at amortized cost 23,220 9,459 32,679Debtors by acceptances 137,662 3,508 141,170Financial assets at amortized cost 2,041,590 9,994,339 12,035,929Financial assets at fair value through other comprehensive income - 7,305 7,305Property and equipment - 619,625 619,625Intangible assets - 2,490 2,490Assets obtained in settlement of debt - 19,889 19,889Other assets 125,077 29,150 154,227Goodwill - 52,214 52,214Total Assets 18,168,617 24,003,161 42,171,778
LiabilitiesDue to central banks 38,021 346,874 384,895Due to banks and financial institutions 641,301 - 641,301Derivative financial instruments 92,621 - 92,621Customers' deposits at amortized cost 35,367,742 631,184 35,998,926Deposits from related parties at amortized cost 189,913 - 189,913Engagements by acceptances 137,662 3,508 141,170Other liabilities 663,085 109,411 772,496Provisions for risks and charges 70,817 76,561 147,378Total Liabilities 37,201,162 1,167,538 38,368,700
Net (19,032,545) 22,835,623 3,803,078
50. Risk Management
The Group manages its business activities within risk management guidelines as set by the Group’s “Risk Management Policy” approved by the Board of Directors. The Group recognizes the role of the Board of Directors and executive management in the risk management process as set out in the Banking Control Commission circular 242. In particular, it is recognized that ultimate responsibility for establishment of effective risk management practices and culture lies with the Board of Directors as does the establishing of the Group’s risk appetite and tolerance levels. The Board of Directors delegates through its Risk Management Committee the day–to–day responsibility for establishment and monitoring of risk management process across the Group to the Chief Risk Officer, who is directly appointed by the Board of Directors, in coordination with executive management at BLOM Bank SAL.
The Group is mainly exposed to credit risk, liquidity risk, market risk and operational risk.
Notes to the Consolidated Financial Statements | 31 December 2015
BLOM BANK s.A.L. 170
The Board’s Risk Management Committee has the mission to periodically (1) review and assess the risk management function of the Group, (2) review the adequacy of the Group’s capital and its allocation within the Group, and (3) review risk limits and reports and make recommendations to the Board.
The Chief Risk Officer undertakes his responsibilities through the “Risk Management Division” in Beirut which also acts as Group Risk Management, overseeing and monitoring risk management activities throughout the Group. The Chief Risk Officer is responsible for establishing the function of Risk Management and its employees across the Group.
BLOM Bank’s Group Risk Management aids executive management in monitoring, controlling and actively managing and mitigating the Group’s overall risk. The Division mainly ensures that:
• Risk policies and methodologies are consistent with the Group’s risk appetite.• Limits and risk across banking activities are monitored and managed throughout the Group.
Through a comprehensive risk management framework, transactions and outstanding risk exposures are quantified and compared against authorized limits, whereas non-quantifiable risks are monitored against policy guidelines as set by the Group’s “Risk Management Policy”. Any discrepancies, breaches or deviations are escalated to executive senior management in a timely manner for appropriate action.
In addition to the Group’s Risk Management in Lebanon, risk managers and / or risk officers were assigned within the Group’s foreign subsidiaries or branches to report to the Group Risk Management and executive senior management in a manner that ensures:• Standardization of risk management functions and systems developed across the Group.• Regional consistency of conducted business in line with the Board’s approved risk appetite.
The major objective of risk management is the implementation of sound risk management practices and the Basel II and Basel III frameworks as well as all related regulatory requirements within the Group. Pillar I capital adequacy calculations have been generated since December 2004, while preparations for moving on to the more advanced approaches of pillar I have been initiated. Group Risk Management is progressively complying with the requirements of pillars II and III and is periodically updating and submitting the Internal Capital Adequacy Assessment Process (ICAAP) for BLOM Bank on an individual and consolidated basis. The Group has documented a Board approved Disclosure Policy taking into account the requirements of pillar III of the Basel framework.
Excessive risk concentrationConcentrations arise when the Group has significant exposure to one borrower or a group of related borrowers or to a number of counter parties engaging in similar business activities or activities in the same geographic region, or have similar economic features that would cause their ability to meet contractual obligations to be similarly affected by changes in economic, political or other conditions. Concentrations indicate the relative sensitivity of the Group’s performance developments affecting a particular industry or geographic location.
In order to avoid excessive concentrations of risk, the Group’s policies and procedures include specific guidelines to focus on maintaining a diversified portfolio. Identified concentrations of credit risks are controlled and managed accordingly. The Group applies stress testing on its concentrations in order to assess their effect on the Group financial standing and capital adequacy in a stressed situation.
Notes to the Consolidated Financial Statements | 31 December 2015
Annual Report 2015 171
50.1 Credit Risk
Credit risk is the risk that one party or group of related parties fail to discharge an obligation and cause the other party to incur a financial loss. The Group attempts to control credit risk by monitoring credit exposures, limiting transactions with specific counter parties, and continuously assessing the creditworthiness of counter parties.
The Group manages credit risk in line with the guidelines set by the Basel Framework and regulatory guidance. The Group has set a credit risk policy which lays down norms for credit risk governance, methodologies and procedures for credit risk management and measurement. It consists of the following:
• The permissible activities, segments, programs and services that the Group intends to deliver and the acceptable limits;• The mechanism of the approval on credit-facilities;• The mechanism for managing and following up credit-facilities; and• The required actions for analyzing and organizing credit files.
The debt securities included in investments are mainly sovereign risk and standard grade securities. For details of the composition of the net loans and advances refer to note 23. Information on credit risk relating to derivative instruments is provided in note 21 and for commitments and contingencies in note 46. The information on the Group’s net maximum exposure by economic sectors is given in note (A) below.
The Group’s Risk Management is designed to identify and to set appropriate risk limits and to monitor the risk adherence to limits. Actual exposures against limits are monitored daily, monthly and periodically. Group Risk Management is responsible for monitoring the risk profile of the Group’s loan portfolio by producing internal reports highlighting any exposure of concern in corporate, commercial and consumer lending. The Group examines the level of concentration whether by credit quality, client groupings or economic sector and collateral coverage. Further, the Group monitors non-performing loans and takes the required provisions for these loans.
The Group in the ordinary course of lending activities holds collaterals and guarantees as security to mitigate credit risk in the net loans and advances. Collaterals and guarantees are continuously monitored and revaluated. These collaterals mostly include cash collateral, quoted shares and debt securities, real estate mortgages, personal guarantees and others. In addition, the Recovery Unit in the Group dynamically manages and takes remedial actions for non-performing loans.
The Group applies the BDL risk rating classifications in addition to an internal rating system for its Corporate and Small and Medium Enterprises (SMEs) that provides a rating at client level and at transaction level. Each individual borrower is rated based on an internally developed debt rating model that evaluates risk based on financial as well as qualitative inputs. The BDL classification system includes six grades, of which three grades relate to the performing portfolio (regular credit facilities: risk ratings “1” and “2” and special mention – watch list: risk rating “3”), one grade relates to substandard loans (risk rating “4”) and two grades relate to non-performing loans (risk ratings “5” and “6”). Credit cards, personal loans, car loans, housing loans and other retail loans are classified as regular as they are performing and have timely repayment with no past dues; except for those loans that have unsettled payments due for more than 90 days. The associated loss estimate norms for each grade have been calculated based on the Group’s historical default rates for each rating. These risk ratings are reviewed on a regular basis.
Introduction of the Moody’s Risk Analyst credit analysis and internal ratings system in the domestic market has provided the Group with an additional tool to enhance risk measurement and assessment of the corporate and commercial loan portfolios. This system was extended to all group entities.
At the same time, implementation of consumer loan application scorecards will aid significantly in meeting Basel II requirements for the retail portfolio as well as making available new quality management resources.
Notes to the Consolidated Financial Statements | 31 December 2015
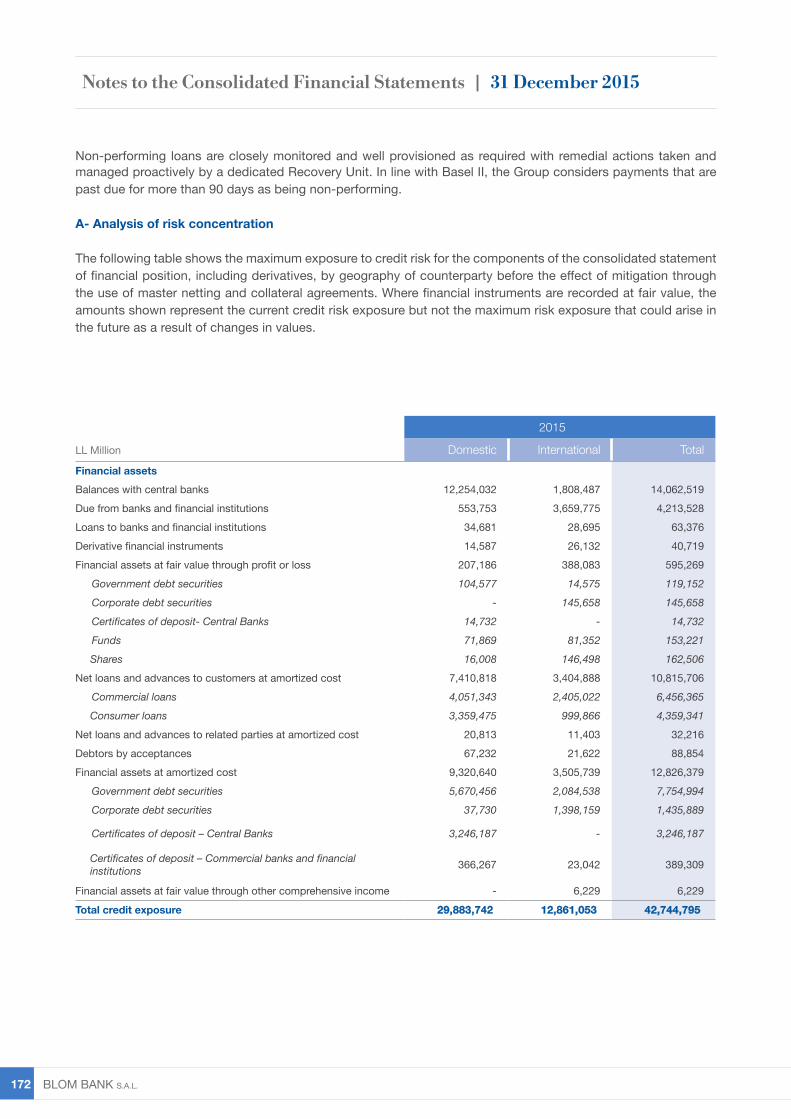
BLOM BANK s.A.L. 172
Non-performing loans are closely monitored and well provisioned as required with remedial actions taken and managed proactively by a dedicated Recovery Unit. In line with Basel II, the Group considers payments that are past due for more than 90 days as being non-performing.
A- Analysis of risk concentration
The following table shows the maximum exposure to credit risk for the components of the consolidated statement of financial position, including derivatives, by geography of counterparty before the effect of mitigation through the use of master netting and collateral agreements. Where financial instruments are recorded at fair value, the amounts shown represent the current credit risk exposure but not the maximum risk exposure that could arise in the future as a result of changes in values.
2015
LL Million Domestic International TotalFinancial assetsBalances with central banks 12,254,032 1,808,487 14,062,519Due from banks and financial institutions 553,753 3,659,775 4,213,528Loans to banks and financial institutions 34,681 28,695 63,376Derivative financial instruments 14,587 26,132 40,719Financial assets at fair value through profit or loss 207,186 388,083 595,269
Government debt securities 104,577 14,575 119,152 Corporate debt securities - 145,658 145,658 Certificates of deposit- Central Banks 14,732 - 14,732 Funds 71,869 81,352 153,221
Shares 16,008 146,498 162,506Net loans and advances to customers at amortized cost 7,410,818 3,404,888 10,815,706
Commercial loans 4,051,343 2,405,022 6,456,365 Consumer loans 3,359,475 999,866 4,359,341Net loans and advances to related parties at amortized cost 20,813 11,403 32,216Debtors by acceptances 67,232 21,622 88,854Financial assets at amortized cost 9,320,640 3,505,739 12,826,379
Government debt securities 5,670,456 2,084,538 7,754,994 Corporate debt securities 37,730 1,398,159 1,435,889
Certificates of deposit – Central Banks 3,246,187 - 3,246,187
Certificates of deposit – Commercial banks and financial institutions 366,267 23,042 389,309
Financial assets at fair value through other comprehensive income - 6,229 6,229
Total credit exposure 29,883,742 12,861,053 42,744,795
Notes to the Consolidated Financial Statements | 31 December 2015
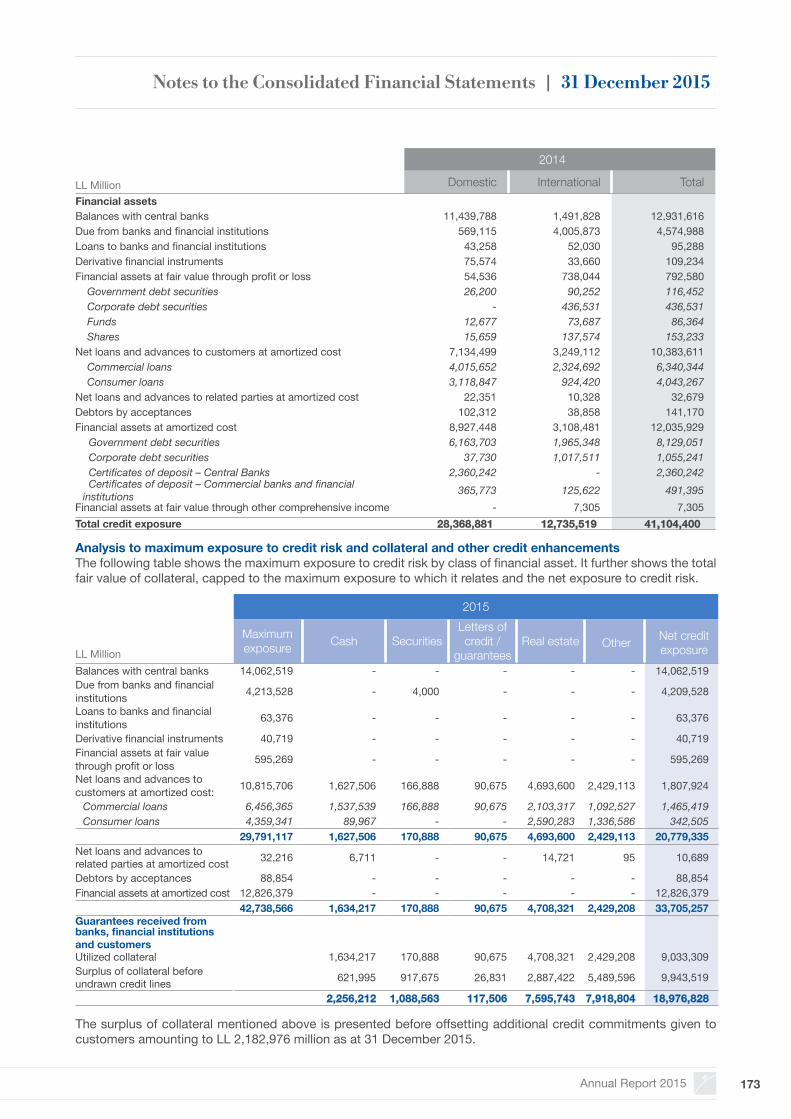
Annual Report 2015 173
2014
LL Million Domestic International TotalFinancial assetsBalances with central banks 11,439,788 1,491,828 12,931,616Due from banks and financial institutions 569,115 4,005,873 4,574,988Loans to banks and financial institutions 43,258 52,030 95,288Derivative financial instruments 75,574 33,660 109,234Financial assets at fair value through profit or loss 54,536 738,044 792,580 Government debt securities 26,200 90,252 116,452 Corporate debt securities - 436,531 436,531 Funds 12,677 73,687 86,364 Shares 15,659 137,574 153,233Net loans and advances to customers at amortized cost 7,134,499 3,249,112 10,383,611 Commercial loans 4,015,652 2,324,692 6,340,344 Consumer loans 3,118,847 924,420 4,043,267Net loans and advances to related parties at amortized cost 22,351 10,328 32,679Debtors by acceptances 102,312 38,858 141,170Financial assets at amortized cost 8,927,448 3,108,481 12,035,929
Government debt securities 6,163,703 1,965,348 8,129,051 Corporate debt securities 37,730 1,017,511 1,055,241 Certificates of deposit – Central Banks 2,360,242 - 2,360,242 Certificates of deposit – Commercial banks and financial institutions 365,773 125,622 491,395
Financial assets at fair value through other comprehensive income - 7,305 7,305Total credit exposure 28,368,881 12,735,519 41,104,400
Analysis to maximum exposure to credit risk and collateral and other credit enhancementsThe following table shows the maximum exposure to credit risk by class of financial asset. It further shows the total fair value of collateral, capped to the maximum exposure to which it relates and the net exposure to credit risk.
The surplus of collateral mentioned above is presented before offsetting additional credit commitments given to customers amounting to LL 2,182,976 million as at 31 December 2015.
2015
LL Million
Maximum exposure Cash Securities
Letters of credit /
guaranteesReal estate Other Net credit
exposureBalances with central banks 14,062,519 - - - - - 14,062,519Due from banks and financial institutions 4,213,528 - 4,000 - - - 4,209,528
Loans to banks and financial institutions 63,376 - - - - - 63,376
Derivative financial instruments 40,719 - - - - - 40,719Financial assets at fair value through profit or loss 595,269 - - - - - 595,269
Net loans and advances to customers at amortized cost: 10,815,706 1,627,506 166,888 90,675 4,693,600 2,429,113 1,807,924
Commercial loans 6,456,365 1,537,539 166,888 90,675 2,103,317 1,092,527 1,465,419Consumer loans 4,359,341 89,967 - - 2,590,283 1,336,586 342,505
29,791,117 1,627,506 170,888 90,675 4,693,600 2,429,113 20,779,335Net loans and advances to related parties at amortized cost 32,216 6,711 - - 14,721 95 10,689
Debtors by acceptances 88,854 - - - - - 88,854Financial assets at amortized cost 12,826,379 - - - - - 12,826,379
42,738,566 1,634,217 170,888 90,675 4,708,321 2,429,208 33,705,257Guarantees received from banks, financial institutions and customersUtilized collateral 1,634,217 170,888 90,675 4,708,321 2,429,208 9,033,309Surplus of collateral before undrawn credit lines 621,995 917,675 26,831 2,887,422 5,489,596 9,943,519
2,256,212 1,088,563 117,506 7,595,743 7,918,804 18,976,828
Notes to the Consolidated Financial Statements | 31 December 2015
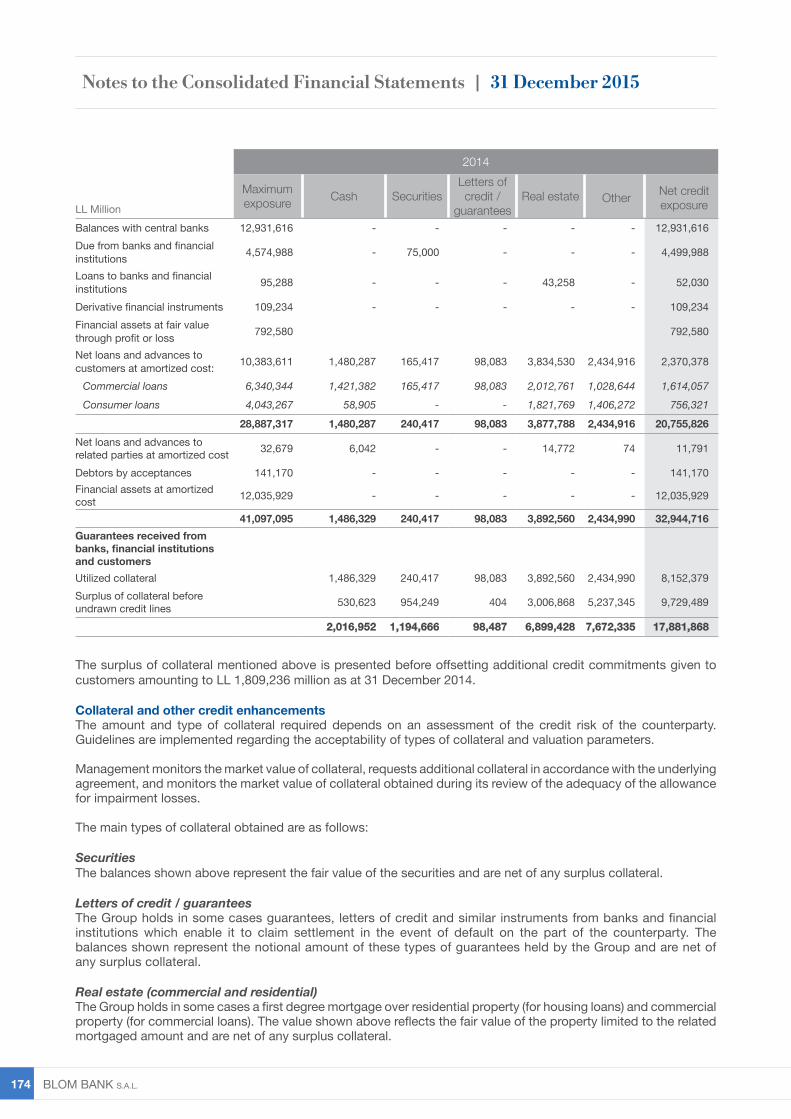
BLOM BANK s.A.L. 174
2014
LL Million
Maximum exposure Cash Securities
Letters of credit /
guaranteesReal estate Other Net credit
exposure
Balances with central banks 12,931,616 - - - - - 12,931,616Due from banks and financial institutions 4,574,988 - 75,000 - - - 4,499,988
Loans to banks and financial institutions 95,288 - - - 43,258 - 52,030
Derivative financial instruments 109,234 - - - - - 109,234Financial assets at fair value through profit or loss 792,580 792,580
Net loans and advances to customers at amortized cost: 10,383,611 1,480,287 165,417 98,083 3,834,530 2,434,916 2,370,378
Commercial loans 6,340,344 1,421,382 165,417 98,083 2,012,761 1,028,644 1,614,057Consumer loans 4,043,267 58,905 - - 1,821,769 1,406,272 756,321
28,887,317 1,480,287 240,417 98,083 3,877,788 2,434,916 20,755,826Net loans and advances to related parties at amortized cost 32,679 6,042 - - 14,772 74 11,791
Debtors by acceptances 141,170 - - - - - 141,170Financial assets at amortized cost 12,035,929 - - - - - 12,035,929
41,097,095 1,486,329 240,417 98,083 3,892,560 2,434,990 32,944,716Guarantees received from banks, financial institutions and customersUtilized collateral 1,486,329 240,417 98,083 3,892,560 2,434,990 8,152,379Surplus of collateral before undrawn credit lines 530,623 954,249 404 3,006,868 5,237,345 9,729,489
2,016,952 1,194,666 98,487 6,899,428 7,672,335 17,881,868
The surplus of collateral mentioned above is presented before offsetting additional credit commitments given to customers amounting to LL 1,809,236 million as at 31 December 2014.
Collateral and other credit enhancementsThe amount and type of collateral required depends on an assessment of the credit risk of the counterparty. Guidelines are implemented regarding the acceptability of types of collateral and valuation parameters.
Management monitors the market value of collateral, requests additional collateral in accordance with the underlying agreement, and monitors the market value of collateral obtained during its review of the adequacy of the allowance for impairment losses.
The main types of collateral obtained are as follows:
SecuritiesThe balances shown above represent the fair value of the securities and are net of any surplus collateral.
Letters of credit / guaranteesThe Group holds in some cases guarantees, letters of credit and similar instruments from banks and financial institutions which enable it to claim settlement in the event of default on the part of the counterparty. The balances shown represent the notional amount of these types of guarantees held by the Group and are net of any surplus collateral.
Real estate (commercial and residential)The Group holds in some cases a first degree mortgage over residential property (for housing loans) and commercial property (for commercial loans). The value shown above reflects the fair value of the property limited to the related mortgaged amount and are net of any surplus collateral.
Notes to the Consolidated Financial Statements | 31 December 2015
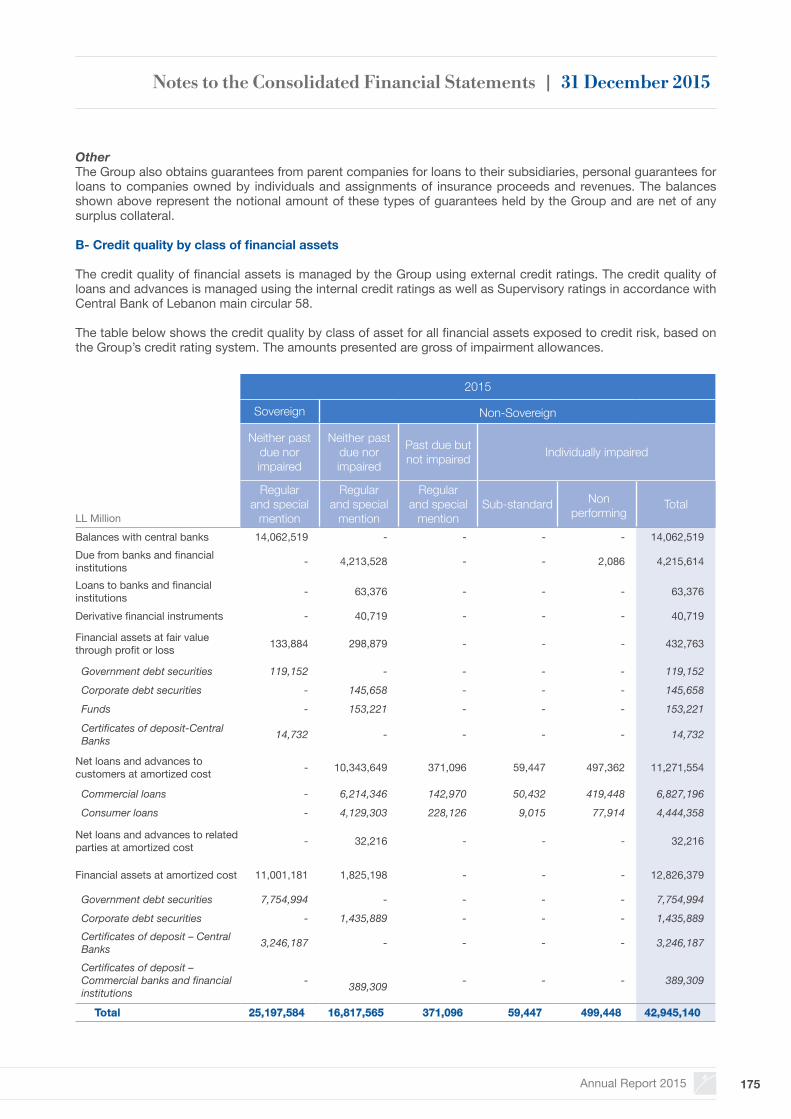
Annual Report 2015 175
OtherThe Group also obtains guarantees from parent companies for loans to their subsidiaries, personal guarantees for loans to companies owned by individuals and assignments of insurance proceeds and revenues. The balances shown above represent the notional amount of these types of guarantees held by the Group and are net of any surplus collateral.
B- Credit quality by class of financial assets
The credit quality of financial assets is managed by the Group using external credit ratings. The credit quality of loans and advances is managed using the internal credit ratings as well as Supervisory ratings in accordance with Central Bank of Lebanon main circular 58.
The table below shows the credit quality by class of asset for all financial assets exposed to credit risk, based on the Group’s credit rating system. The amounts presented are gross of impairment allowances.
2015
Sovereign Non-Sovereign
LL Million
Neither past due nor impaired
Neither past due nor impaired
Past due but not impaired Individually impaired
Regular and special
mention
Regular and special
mention
Regular and special
mentionSub-standard Non
performingTotal
Balances with central banks 14,062,519 - - - - 14,062,519Due from banks and financial institutions - 4,213,528 - - 2,086 4,215,614
Loans to banks and financial institutions - 63,376 - - - 63,376
Derivative financial instruments - 40,719 - - - 40,719
Financial assets at fair value through profit or loss 133,884 298,879 - - - 432,763
Government debt securities 119,152 - - - - 119,152 Corporate debt securities - 145,658 - - - 145,658 Funds - 153,221 - - - 153,221
Certificates of deposit-Central Banks 14,732 - - - - 14,732
Net loans and advances to customers at amortized cost - 10,343,649 371,096 59,447 497,362 11,271,554
Commercial loans - 6,214,346 142,970 50,432 419,448 6,827,196 Consumer loans - 4,129,303 228,126 9,015 77,914 4,444,358
Net loans and advances to related parties at amortized cost - 32,216 - - - 32,216
Financial assets at amortized cost 11,001,181 1,825,198 - - - 12,826,379
Government debt securities 7,754,994 - - - - 7,754,994 Corporate debt securities - 1,435,889 - - - 1,435,889 Certificates of deposit – Central Banks 3,246,187 - - - - 3,246,187
Certificates of deposit – Commercial banks and financial institutions
- 389,309 - - - 389,309
Total 25,197,584 16,817,565 371,096 59,447 499,448 42,945,140
Notes to the Consolidated Financial Statements | 31 December 2015
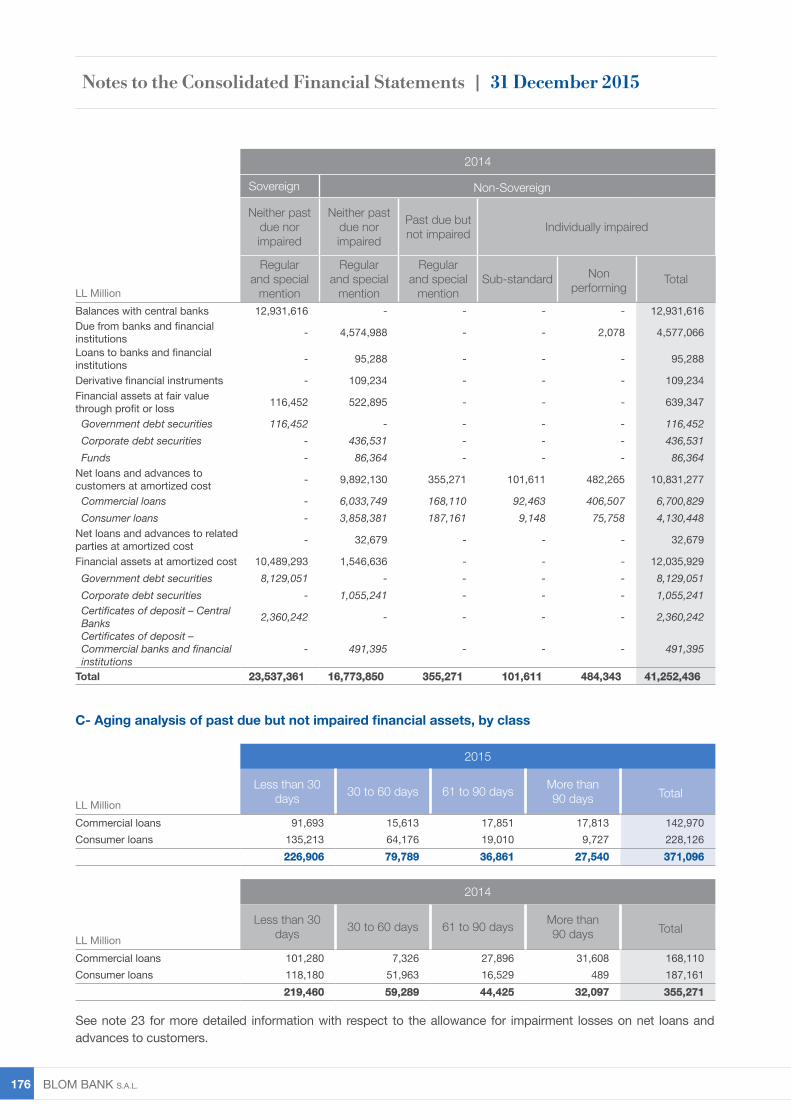
BLOM BANK s.A.L. 176
C- Aging analysis of past due but not impaired financial assets, by class
2015
LL Million
Less than 30 days 30 to 60 days 61 to 90 days More than
90 days Total
Commercial loans 91,693 15,613 17,851 17,813 142,970Consumer loans 135,213 64,176 19,010 9,727 228,126
226,906 79,789 36,861 27,540 371,096
2014
LL Million
Less than 30 days 30 to 60 days 61 to 90 days More than
90 days Total
Commercial loans 101,280 7,326 27,896 31,608 168,110Consumer loans 118,180 51,963 16,529 489 187,161
219,460 59,289 44,425 32,097 355,271
2014
Sovereign Non-Sovereign
LL Million
Neither past due nor impaired
Neither past due nor impaired
Past due but not impaired Individually impaired
Regular and special
mention
Regular and special
mention
Regular and special
mentionSub-standard Non
performingTotal
Balances with central banks 12,931,616 - - - - 12,931,616Due from banks and financial institutions - 4,574,988 - - 2,078 4,577,066
Loans to banks and financial institutions - 95,288 - - - 95,288
Derivative financial instruments - 109,234 - - - 109,234Financial assets at fair value through profit or loss 116,452 522,895 - - - 639,347
Government debt securities 116,452 - - - - 116,452 Corporate debt securities - 436,531 - - - 436,531 Funds - 86,364 - - - 86,364Net loans and advances to customers at amortized cost - 9,892,130 355,271 101,611 482,265 10,831,277
Commercial loans - 6,033,749 168,110 92,463 406,507 6,700,829 Consumer loans - 3,858,381 187,161 9,148 75,758 4,130,448Net loans and advances to related parties at amortized cost - 32,679 - - - 32,679
Financial assets at amortized cost 10,489,293 1,546,636 - - - 12,035,929 Government debt securities 8,129,051 - - - - 8,129,051 Corporate debt securities - 1,055,241 - - - 1,055,241 Certificates of deposit – Central Banks 2,360,242 - - - - 2,360,242
Certificates of deposit – Commercial banks and financial institutions
- 491,395 - - - 491,395
Total 23,537,361 16,773,850 355,271 101,611 484,343 41,252,436
See note 23 for more detailed information with respect to the allowance for impairment losses on net loans and advances to customers.
Notes to the Consolidated Financial Statements | 31 December 2015
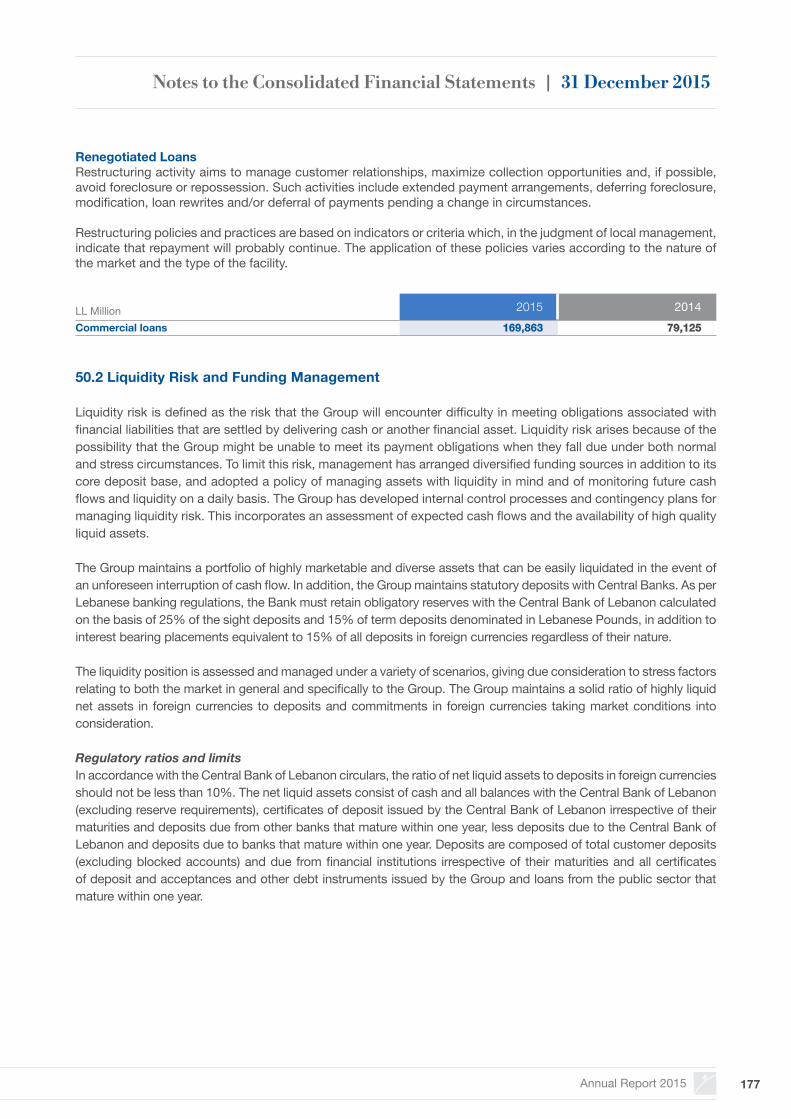
Annual Report 2015 177
Renegotiated Loans Restructuring activity aims to manage customer relationships, maximize collection opportunities and, if possible, avoid foreclosure or repossession. Such activities include extended payment arrangements, deferring foreclosure, modification, loan rewrites and/or deferral of payments pending a change in circumstances.
Restructuring policies and practices are based on indicators or criteria which, in the judgment of local management, indicate that repayment will probably continue. The application of these policies varies according to the nature of the market and the type of the facility.
50.2 Liquidity Risk and Funding Management
Liquidity risk is defined as the risk that the Group will encounter difficulty in meeting obligations associated with financial liabilities that are settled by delivering cash or another financial asset. Liquidity risk arises because of the possibility that the Group might be unable to meet its payment obligations when they fall due under both normal and stress circumstances. To limit this risk, management has arranged diversified funding sources in addition to its core deposit base, and adopted a policy of managing assets with liquidity in mind and of monitoring future cash flows and liquidity on a daily basis. The Group has developed internal control processes and contingency plans for managing liquidity risk. This incorporates an assessment of expected cash flows and the availability of high quality liquid assets.
The Group maintains a portfolio of highly marketable and diverse assets that can be easily liquidated in the event of an unforeseen interruption of cash flow. In addition, the Group maintains statutory deposits with Central Banks. As per Lebanese banking regulations, the Bank must retain obligatory reserves with the Central Bank of Lebanon calculated on the basis of 25% of the sight deposits and 15% of term deposits denominated in Lebanese Pounds, in addition to interest bearing placements equivalent to 15% of all deposits in foreign currencies regardless of their nature.
The liquidity position is assessed and managed under a variety of scenarios, giving due consideration to stress factors relating to both the market in general and specifically to the Group. The Group maintains a solid ratio of highly liquid net assets in foreign currencies to deposits and commitments in foreign currencies taking market conditions into consideration.
Regulatory ratios and limitsIn accordance with the Central Bank of Lebanon circulars, the ratio of net liquid assets to deposits in foreign currencies should not be less than 10%. The net liquid assets consist of cash and all balances with the Central Bank of Lebanon (excluding reserve requirements), certificates of deposit issued by the Central Bank of Lebanon irrespective of their maturities and deposits due from other banks that mature within one year, less deposits due to the Central Bank of Lebanon and deposits due to banks that mature within one year. Deposits are composed of total customer deposits (excluding blocked accounts) and due from financial institutions irrespective of their maturities and all certificates of deposit and acceptances and other debt instruments issued by the Group and loans from the public sector that mature within one year.
LL Million 2015 2014Commercial loans 169,863 79,125
Notes to the Consolidated Financial Statements | 31 December 2015
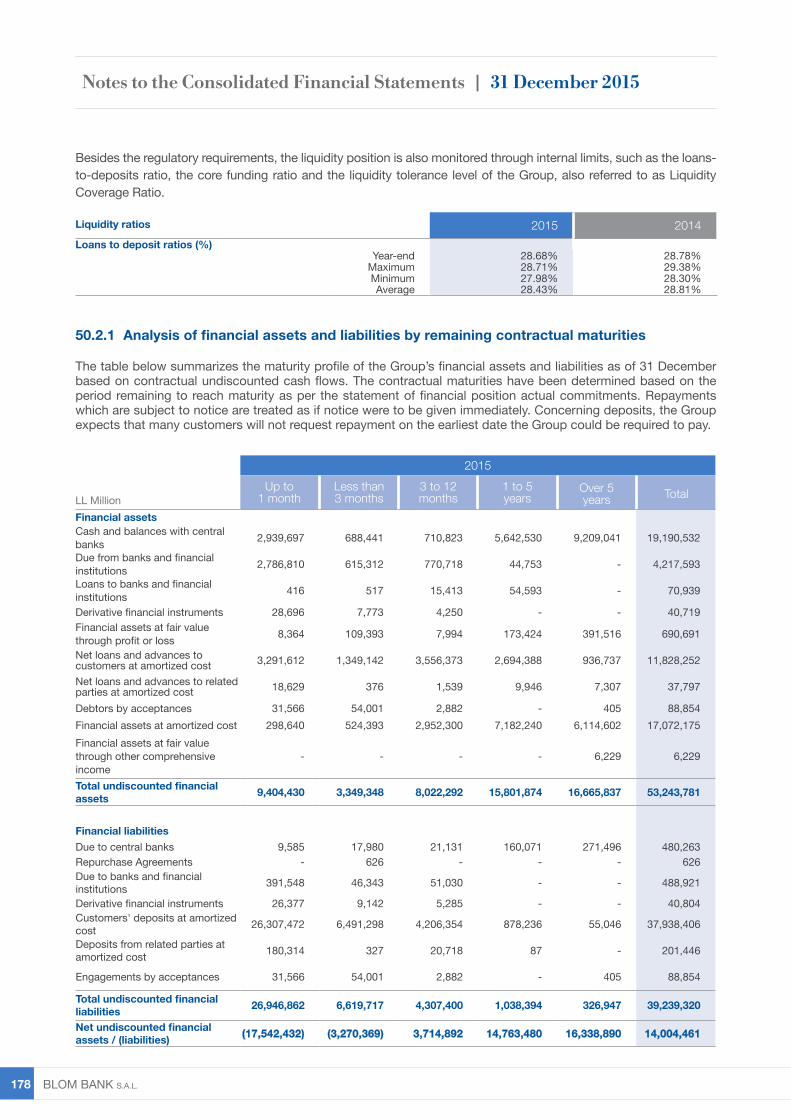
BLOM BANK s.A.L. 178
Besides the regulatory requirements, the liquidity position is also monitored through internal limits, such as the loans-to-deposits ratio, the core funding ratio and the liquidity tolerance level of the Group, also referred to as Liquidity Coverage Ratio.
Liquidity ratios 2015 2014Loans to deposit ratios (%)
Year-end 28.68% 28.78%Maximum 28.71% 29.38%Minimum 27.98% 28.30%Average 28.43% 28.81%
50.2.1 Analysis of financial assets and liabilities by remaining contractual maturities
The table below summarizes the maturity profile of the Group’s financial assets and liabilities as of 31 December based on contractual undiscounted cash flows. The contractual maturities have been determined based on the period remaining to reach maturity as per the statement of financial position actual commitments. Repayments which are subject to notice are treated as if notice were to be given immediately. Concerning deposits, the Group expects that many customers will not request repayment on the earliest date the Group could be required to pay.
2015
LL MillionUp to
1 monthLess than3 months
3 to 12months
1 to 5years
Over 5years Total
Financial assetsCash and balances with central banks 2,939,697 688,441 710,823 5,642,530 9,209,041 19,190,532
Due from banks and financial institutions 2,786,810 615,312 770,718 44,753 - 4,217,593
Loans to banks and financial institutions 416 517 15,413 54,593 - 70,939
Derivative financial instruments 28,696 7,773 4,250 - - 40,719Financial assets at fair value through profit or loss 8,364 109,393 7,994 173,424 391,516 690,691
Net loans and advances to customers at amortized cost 3,291,612 1,349,142 3,556,373 2,694,388 936,737 11,828,252
Net loans and advances to related parties at amortized cost 18,629 376 1,539 9,946 7,307 37,797
Debtors by acceptances 31,566 54,001 2,882 - 405 88,854Financial assets at amortized cost 298,640 524,393 2,952,300 7,182,240 6,114,602 17,072,175Financial assets at fair value through other comprehensive income
- - - - 6,229 6,229
Total undiscounted financial assets 9,404,430 3,349,348 8,022,292 15,801,874 16,665,837 53,243,781
Financial liabilitiesDue to central banks 9,585 17,980 21,131 160,071 271,496 480,263Repurchase Agreements - 626 - - - 626Due to banks and financial institutions 391,548 46,343 51,030 - - 488,921
Derivative financial instruments 26,377 9,142 5,285 - - 40,804Customers' deposits at amortized cost 26,307,472 6,491,298 4,206,354 878,236 55,046 37,938,406
Deposits from related parties at amortized cost 180,314 327 20,718 87 - 201,446
Engagements by acceptances 31,566 54,001 2,882 - 405 88,854
Total undiscounted financial liabilities 26,946,862 6,619,717 4,307,400 1,038,394 326,947 39,239,320
Net undiscounted financial assets / (liabilities) (17,542,432) (3,270,369) 3,714,892 14,763,480 16,338,890 14,004,461
Notes to the Consolidated Financial Statements | 31 December 2015
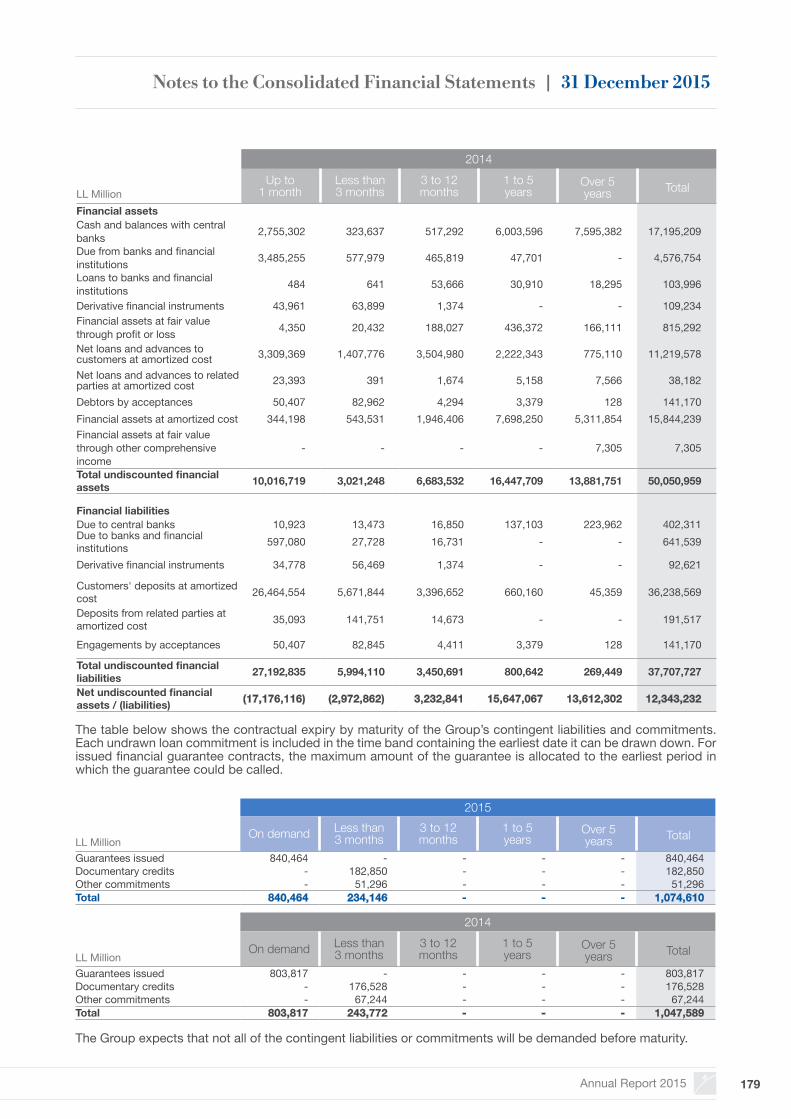
Annual Report 2015 179
The table below shows the contractual expiry by maturity of the Group’s contingent liabilities and commitments. Each undrawn loan commitment is included in the time band containing the earliest date it can be drawn down. For issued financial guarantee contracts, the maximum amount of the guarantee is allocated to the earliest period in which the guarantee could be called.
The Group expects that not all of the contingent liabilities or commitments will be demanded before maturity.
2015
LL MillionOn demand Less than
3 months3 to 12months
1 to 5years
Over 5years Total
Guarantees issued 840,464 - - - - 840,464Documentary credits - 182,850 - - - 182,850Other commitments - 51,296 - - - 51,296Total 840,464 234,146 - - - 1,074,610
2014
LL MillionOn demand Less than
3 months3 to 12months
1 to 5years
Over 5years Total
Guarantees issued 803,817 - - - - 803,817Documentary credits - 176,528 - - - 176,528Other commitments - 67,244 - - - 67,244Total 803,817 243,772 - - - 1,047,589
2014
LL MillionUp to
1 monthLess than3 months
3 to 12months
1 to 5years
Over 5years Total
Financial assetsCash and balances with central banks 2,755,302 323,637 517,292 6,003,596 7,595,382 17,195,209
Due from banks and financial institutions 3,485,255 577,979 465,819 47,701 - 4,576,754
Loans to banks and financial institutions 484 641 53,666 30,910 18,295 103,996
Derivative financial instruments 43,961 63,899 1,374 - - 109,234Financial assets at fair value through profit or loss 4,350 20,432 188,027 436,372 166,111 815,292
Net loans and advances to customers at amortized cost 3,309,369 1,407,776 3,504,980 2,222,343 775,110 11,219,578
Net loans and advances to related parties at amortized cost 23,393 391 1,674 5,158 7,566 38,182
Debtors by acceptances 50,407 82,962 4,294 3,379 128 141,170Financial assets at amortized cost 344,198 543,531 1,946,406 7,698,250 5,311,854 15,844,239Financial assets at fair value through other comprehensive income
- - - - 7,305 7,305
Total undiscounted financial assets 10,016,719 3,021,248 6,683,532 16,447,709 13,881,751 50,050,959
Financial liabilitiesDue to central banks 10,923 13,473 16,850 137,103 223,962 402,311Due to banks and financial institutions 597,080 27,728 16,731 - - 641,539
Derivative financial instruments 34,778 56,469 1,374 - - 92,621
Customers' deposits at amortized cost 26,464,554 5,671,844 3,396,652 660,160 45,359 36,238,569
Deposits from related parties at amortized cost 35,093 141,751 14,673 - - 191,517
Engagements by acceptances 50,407 82,845 4,411 3,379 128 141,170
Total undiscounted financial liabilities 27,192,835 5,994,110 3,450,691 800,642 269,449 37,707,727
Net undiscounted financial assets / (liabilities) (17,176,116) (2,972,862) 3,232,841 15,647,067 13,612,302 12,343,232
Notes to the Consolidated Financial Statements | 31 December 2015
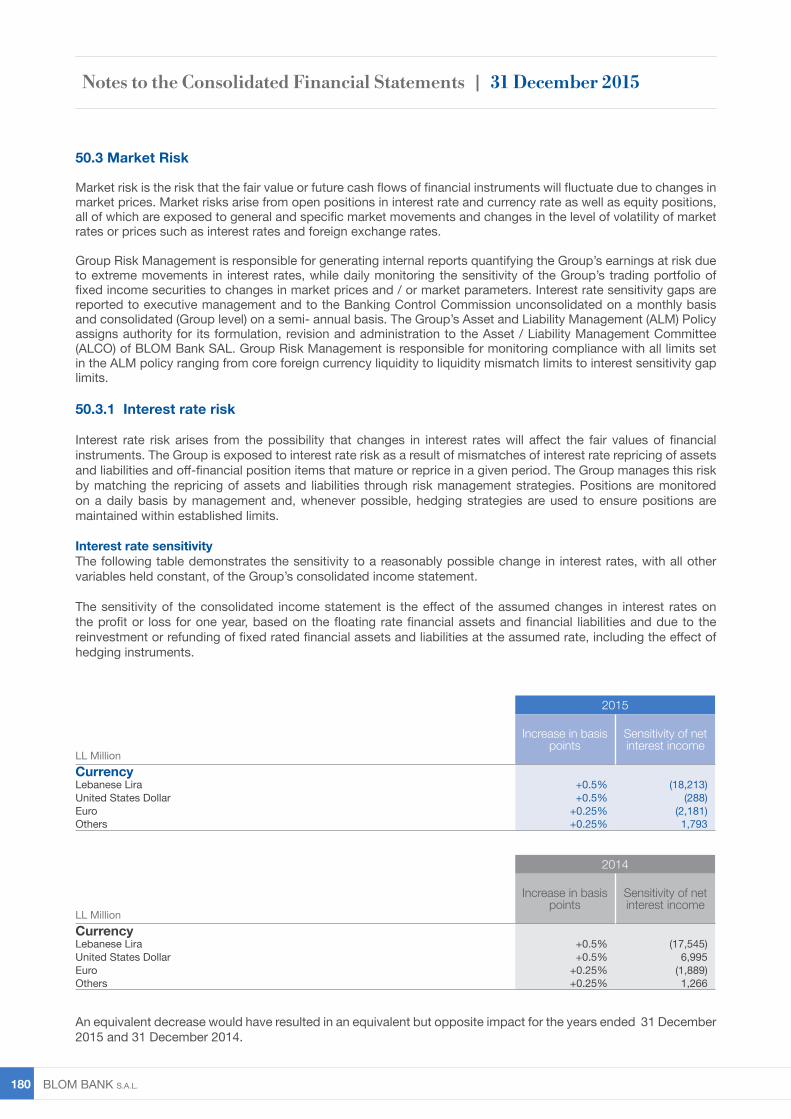
BLOM BANK s.A.L. 180
50.3 Market Risk
Market risk is the risk that the fair value or future cash flows of financial instruments will fluctuate due to changes in market prices. Market risks arise from open positions in interest rate and currency rate as well as equity positions, all of which are exposed to general and specific market movements and changes in the level of volatility of market rates or prices such as interest rates and foreign exchange rates.
Group Risk Management is responsible for generating internal reports quantifying the Group’s earnings at risk due to extreme movements in interest rates, while daily monitoring the sensitivity of the Group’s trading portfolio of fixed income securities to changes in market prices and / or market parameters. Interest rate sensitivity gaps are reported to executive management and to the Banking Control Commission unconsolidated on a monthly basis and consolidated (Group level) on a semi- annual basis. The Group’s Asset and Liability Management (ALM) Policy assigns authority for its formulation, revision and administration to the Asset / Liability Management Committee (ALCO) of BLOM Bank SAL. Group Risk Management is responsible for monitoring compliance with all limits set in the ALM policy ranging from core foreign currency liquidity to liquidity mismatch limits to interest sensitivity gap limits.
50.3.1 Interest rate risk
Interest rate risk arises from the possibility that changes in interest rates will affect the fair values of financial instruments. The Group is exposed to interest rate risk as a result of mismatches of interest rate repricing of assets and liabilities and off-financial position items that mature or reprice in a given period. The Group manages this risk by matching the repricing of assets and liabilities through risk management strategies. Positions are monitored on a daily basis by management and, whenever possible, hedging strategies are used to ensure positions are maintained within established limits.
Interest rate sensitivityThe following table demonstrates the sensitivity to a reasonably possible change in interest rates, with all other variables held constant, of the Group’s consolidated income statement.
The sensitivity of the consolidated income statement is the effect of the assumed changes in interest rates on the profit or loss for one year, based on the floating rate financial assets and financial liabilities and due to the reinvestment or refunding of fixed rated financial assets and liabilities at the assumed rate, including the effect of hedging instruments.
An equivalent decrease would have resulted in an equivalent but opposite impact for the years ended 31 December 2015 and 31 December 2014.
2015
LL Million
Increase in basis points
Sensitivity of net interest income
CurrencyLebanese Lira +0.5% (18,213)United States Dollar +0.5% (288)Euro +0.25% (2,181)Others +0.25% 1,793
2014
LL Million
Increase in basis points
Sensitivity of net interest income
CurrencyLebanese Lira +0.5% (17,545)United States Dollar +0.5% 6,995Euro +0.25% (1,889)Others +0.25% 1,266
Notes to the Consolidated Financial Statements | 31 December 2015
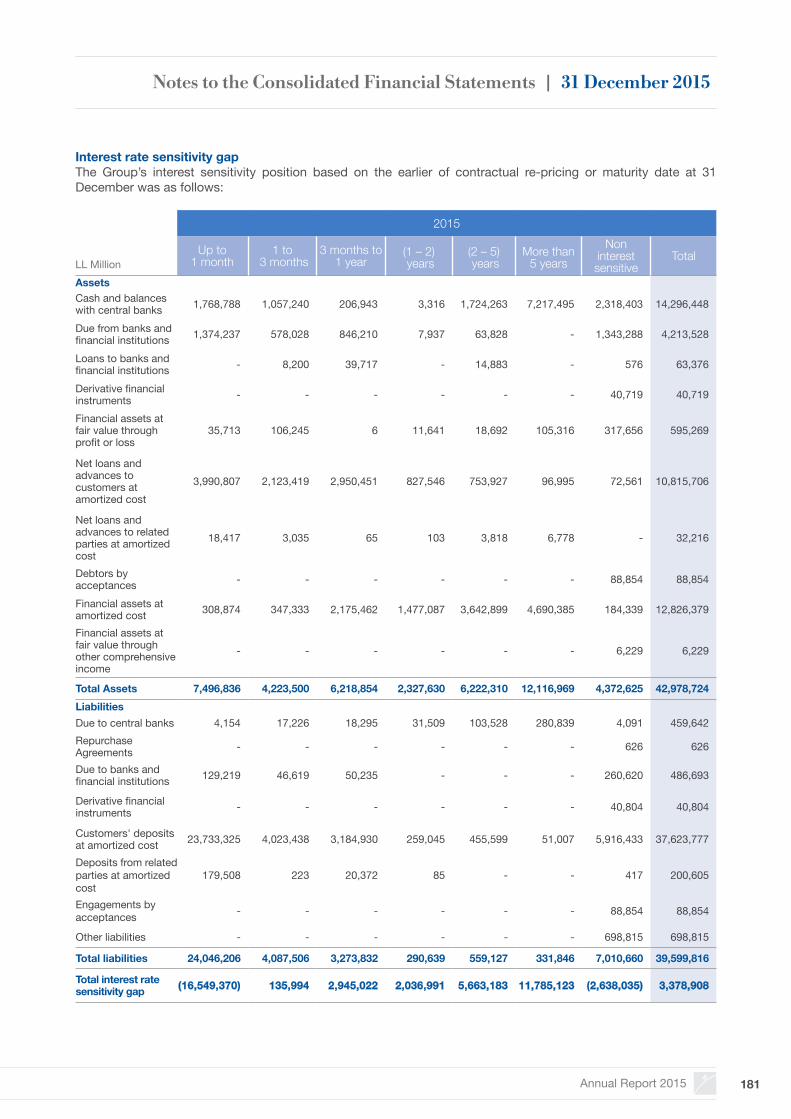
Annual Report 2015 181
Interest rate sensitivity gapThe Group’s interest sensitivity position based on the earlier of contractual re-pricing or maturity date at 31 December was as follows:
2015
LL MillionUp to
1 month1 to
3 months3 months to
1 year(1 – 2) years
(2 – 5) years
More than5 years
Noninterest sensitive
Total
AssetsCash and balances with central banks 1,768,788 1,057,240 206,943 3,316 1,724,263 7,217,495 2,318,403 14,296,448
Due from banks and financial institutions 1,374,237 578,028 846,210 7,937 63,828 - 1,343,288 4,213,528
Loans to banks and financial institutions - 8,200 39,717 - 14,883 - 576 63,376
Derivative financial instruments - - - - - - 40,719 40,719
Financial assets at fair value through profit or loss
35,713 106,245 6 11,641 18,692 105,316 317,656 595,269
Net loans and advances to customers at amortized cost
3,990,807 2,123,419 2,950,451 827,546 753,927 96,995 72,561 10,815,706
Net loans and advances to related parties at amortized cost
18,417 3,035 65 103 3,818 6,778 - 32,216
Debtors by acceptances - - - - - - 88,854 88,854
Financial assets at amortized cost 308,874 347,333 2,175,462 1,477,087 3,642,899 4,690,385 184,339 12,826,379
Financial assets at fair value through other comprehensive income
- - - - - - 6,229 6,229
Total Assets 7,496,836 4,223,500 6,218,854 2,327,630 6,222,310 12,116,969 4,372,625 42,978,724LiabilitiesDue to central banks 4,154 17,226 18,295 31,509 103,528 280,839 4,091 459,642Repurchase Agreements - - - - - - 626 626
Due to banks and financial institutions 129,219 46,619 50,235 - - - 260,620 486,693
Derivative financial instruments - - - - - - 40,804 40,804
Customers' deposits at amortized cost 23,733,325 4,023,438 3,184,930 259,045 455,599 51,007 5,916,433 37,623,777
Deposits from related parties at amortized cost
179,508 223 20,372 85 - - 417 200,605
Engagements by acceptances - - - - - - 88,854 88,854
Other liabilities - - - - - - 698,815 698,815
Total liabilities 24,046,206 4,087,506 3,273,832 290,639 559,127 331,846 7,010,660 39,599,816
Total interest rate sensitivity gap (16,549,370) 135,994 2,945,022 2,036,991 5,663,183 11,785,123 (2,638,035) 3,378,908
Notes to the Consolidated Financial Statements | 31 December 2015
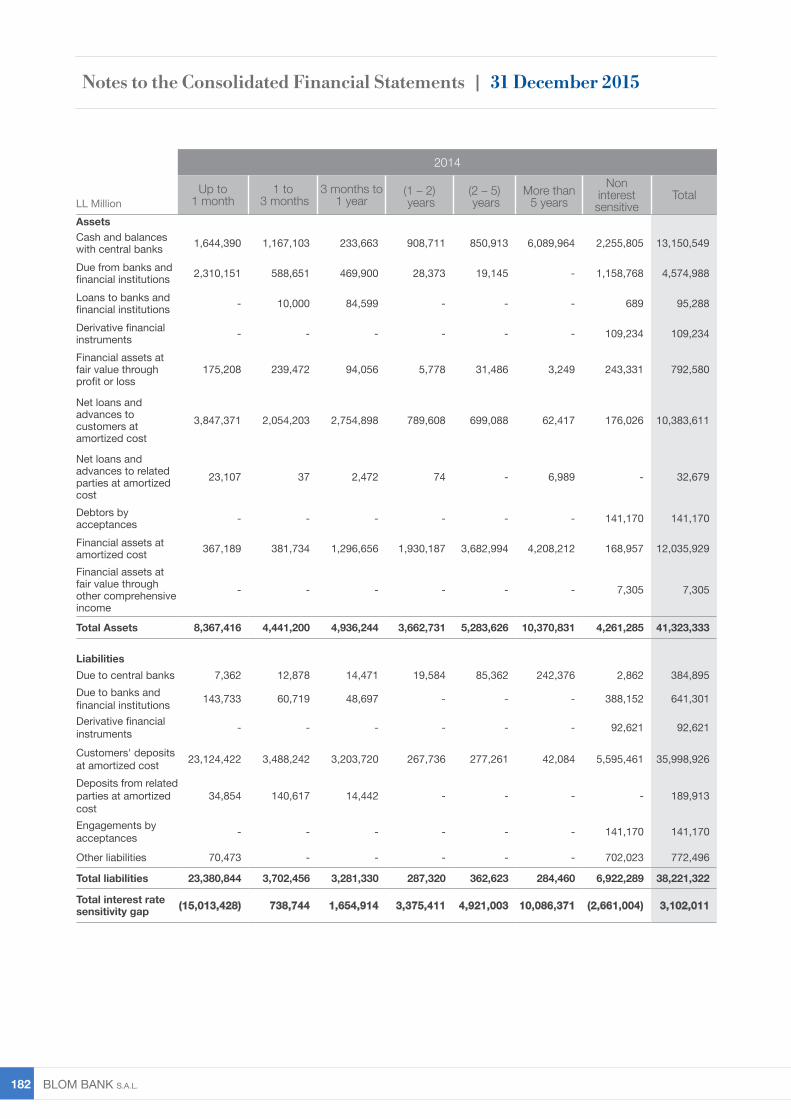
BLOM BANK s.A.L. 182
2014
LL MillionUp to
1 month1 to
3 months3 months to
1 year(1 – 2) years
(2 – 5) years
More than5 years
Noninterest sensitive
Total
AssetsCash and balances with central banks 1,644,390 1,167,103 233,663 908,711 850,913 6,089,964 2,255,805 13,150,549
Due from banks and financial institutions 2,310,151 588,651 469,900 28,373 19,145 - 1,158,768 4,574,988
Loans to banks and financial institutions - 10,000 84,599 - - - 689 95,288
Derivative financial instruments - - - - - - 109,234 109,234
Financial assets at fair value through profit or loss
175,208 239,472 94,056 5,778 31,486 3,249 243,331 792,580
Net loans and advances to customers at amortized cost
3,847,371 2,054,203 2,754,898 789,608 699,088 62,417 176,026 10,383,611
Net loans and advances to related parties at amortized cost
23,107 37 2,472 74 - 6,989 - 32,679
Debtors by acceptances - - - - - - 141,170 141,170
Financial assets at amortized cost 367,189 381,734 1,296,656 1,930,187 3,682,994 4,208,212 168,957 12,035,929
Financial assets at fair value through other comprehensive income
- - - - - - 7,305 7,305
Total Assets 8,367,416 4,441,200 4,936,244 3,662,731 5,283,626 10,370,831 4,261,285 41,323,333
LiabilitiesDue to central banks 7,362 12,878 14,471 19,584 85,362 242,376 2,862 384,895Due to banks and financial institutions 143,733 60,719 48,697 - - - 388,152 641,301
Derivative financial instruments - - - - - - 92,621 92,621
Customers' deposits at amortized cost 23,124,422 3,488,242 3,203,720 267,736 277,261 42,084 5,595,461 35,998,926
Deposits from related parties at amortized cost
34,854 140,617 14,442 - - - - 189,913
Engagements by acceptances - - - - - - 141,170 141,170
Other liabilities 70,473 - - - - - 702,023 772,496
Total liabilities 23,380,844 3,702,456 3,281,330 287,320 362,623 284,460 6,922,289 38,221,322
Total interest rate sensitivity gap (15,013,428) 738,744 1,654,914 3,375,411 4,921,003 10,086,371 (2,661,004) 3,102,011
Notes to the Consolidated Financial Statements | 31 December 2015
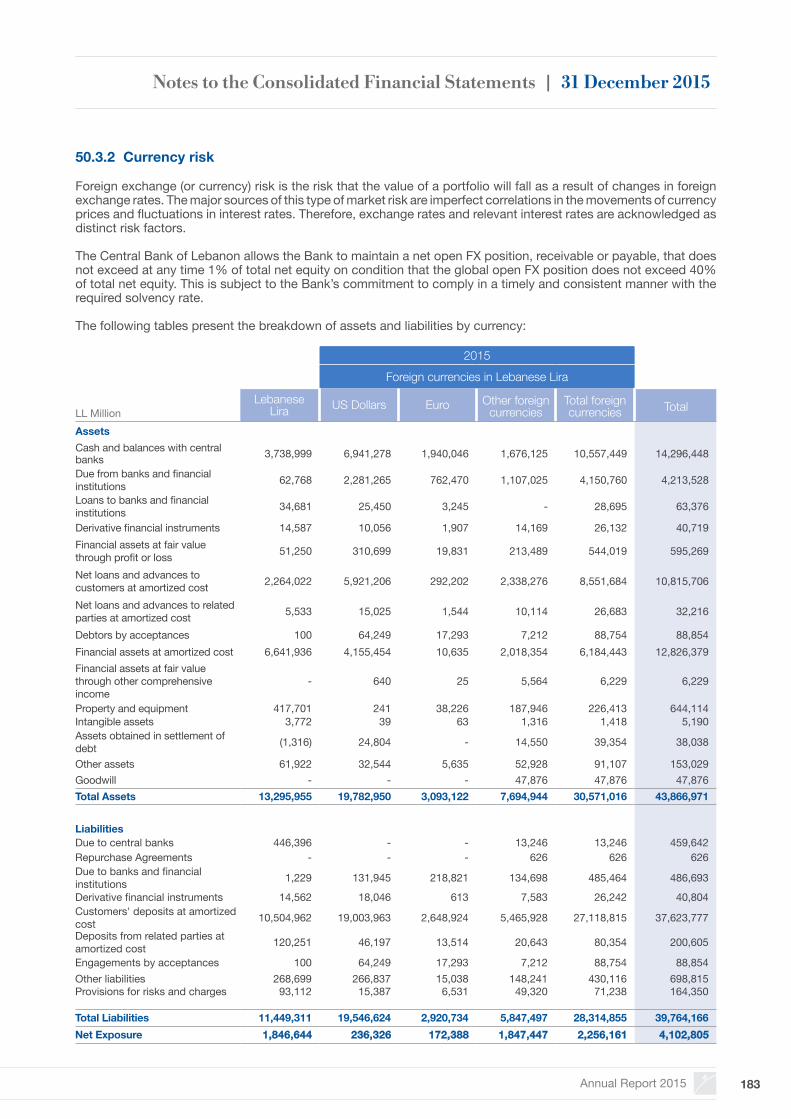
Annual Report 2015 183
50.3.2 Currency risk
Foreign exchange (or currency) risk is the risk that the value of a portfolio will fall as a result of changes in foreign exchange rates. The major sources of this type of market risk are imperfect correlations in the movements of currency prices and fluctuations in interest rates. Therefore, exchange rates and relevant interest rates are acknowledged as distinct risk factors.
The Central Bank of Lebanon allows the Bank to maintain a net open FX position, receivable or payable, that does not exceed at any time 1% of total net equity on condition that the global open FX position does not exceed 40% of total net equity. This is subject to the Bank’s commitment to comply in a timely and consistent manner with the required solvency rate.
The following tables present the breakdown of assets and liabilities by currency:
2015
Foreign currencies in Lebanese Lira
LL MillionLebanese
Lira US Dollars Euro Other foreign currencies
Total foreign currencies Total
AssetsCash and balances with central banks 3,738,999 6,941,278 1,940,046 1,676,125 10,557,449 14,296,448
Due from banks and financial institutions 62,768 2,281,265 762,470 1,107,025 4,150,760 4,213,528
Loans to banks and financial institutions 34,681 25,450 3,245 - 28,695 63,376
Derivative financial instruments 14,587 10,056 1,907 14,169 26,132 40,719Financial assets at fair value through profit or loss 51,250 310,699 19,831 213,489 544,019 595,269
Net loans and advances to customers at amortized cost 2,264,022 5,921,206 292,202 2,338,276 8,551,684 10,815,706
Net loans and advances to related parties at amortized cost 5,533 15,025 1,544 10,114 26,683 32,216
Debtors by acceptances 100 64,249 17,293 7,212 88,754 88,854Financial assets at amortized cost 6,641,936 4,155,454 10,635 2,018,354 6,184,443 12,826,379Financial assets at fair value through other comprehensive income
- 640 25 5,564 6,229 6,229
Property and equipment 417,701 241 38,226 187,946 226,413 644,114Intangible assets 3,772 39 63 1,316 1,418 5,190Assets obtained in settlement of debt (1,316) 24,804 - 14,550 39,354 38,038
Other assets 61,922 32,544 5,635 52,928 91,107 153,029Goodwill - - - 47,876 47,876 47,876Total Assets 13,295,955 19,782,950 3,093,122 7,694,944 30,571,016 43,866,971
Liabilities Due to central banks 446,396 - - 13,246 13,246 459,642Repurchase Agreements - - - 626 626 626Due to banks and financial institutions 1,229 131,945 218,821 134,698 485,464 486,693
Derivative financial instruments 14,562 18,046 613 7,583 26,242 40,804Customers' deposits at amortized cost 10,504,962 19,003,963 2,648,924 5,465,928 27,118,815 37,623,777Deposits from related parties at amortized cost 120,251 46,197 13,514 20,643 80,354 200,605
Engagements by acceptances 100 64,249 17,293 7,212 88,754 88,854Other liabilities 268,699 266,837 15,038 148,241 430,116 698,815Provisions for risks and charges 93,112 15,387 6,531 49,320 71,238 164,350
Total Liabilities 11,449,311 19,546,624 2,920,734 5,847,497 28,314,855 39,764,166Net Exposure 1,846,644 236,326 172,388 1,847,447 2,256,161 4,102,805
Notes to the Consolidated Financial Statements | 31 December 2015
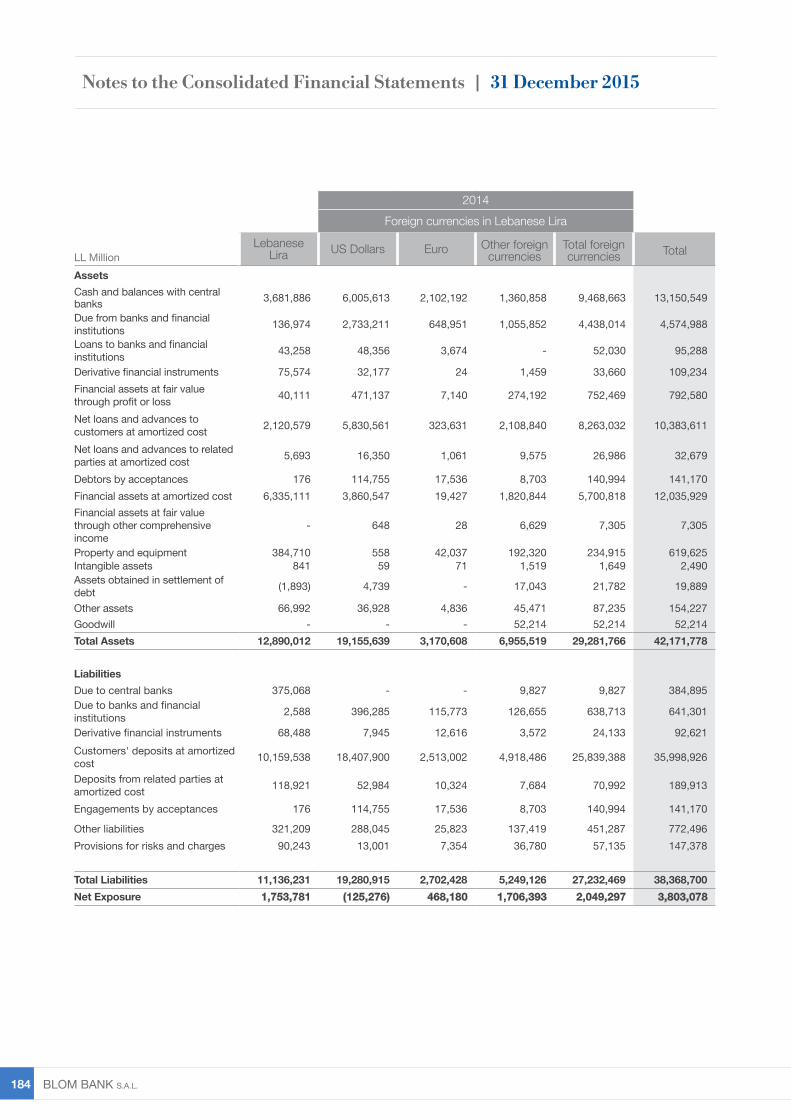
BLOM BANK s.A.L. 184
2014Foreign currencies in Lebanese Lira
LL MillionLebanese
Lira US Dollars Euro Other foreign currencies
Total foreign currencies Total
AssetsCash and balances with central banks 3,681,886 6,005,613 2,102,192 1,360,858 9,468,663 13,150,549
Due from banks and financial institutions 136,974 2,733,211 648,951 1,055,852 4,438,014 4,574,988
Loans to banks and financial institutions 43,258 48,356 3,674 - 52,030 95,288
Derivative financial instruments 75,574 32,177 24 1,459 33,660 109,234Financial assets at fair value through profit or loss 40,111 471,137 7,140 274,192 752,469 792,580
Net loans and advances to customers at amortized cost 2,120,579 5,830,561 323,631 2,108,840 8,263,032 10,383,611
Net loans and advances to related parties at amortized cost 5,693 16,350 1,061 9,575 26,986 32,679
Debtors by acceptances 176 114,755 17,536 8,703 140,994 141,170Financial assets at amortized cost 6,335,111 3,860,547 19,427 1,820,844 5,700,818 12,035,929Financial assets at fair value through other comprehensive income
- 648 28 6,629 7,305 7,305
Property and equipment 384,710 558 42,037 192,320 234,915 619,625Intangible assets 841 59 71 1,519 1,649 2,490Assets obtained in settlement of debt (1,893) 4,739 - 17,043 21,782 19,889
Other assets 66,992 36,928 4,836 45,471 87,235 154,227Goodwill - - - 52,214 52,214 52,214Total Assets 12,890,012 19,155,639 3,170,608 6,955,519 29,281,766 42,171,778
Liabilities Due to central banks 375,068 - - 9,827 9,827 384,895Due to banks and financial institutions 2,588 396,285 115,773 126,655 638,713 641,301
Derivative financial instruments 68,488 7,945 12,616 3,572 24,133 92,621Customers' deposits at amortized cost 10,159,538 18,407,900 2,513,002 4,918,486 25,839,388 35,998,926
Deposits from related parties at amortized cost 118,921 52,984 10,324 7,684 70,992 189,913
Engagements by acceptances 176 114,755 17,536 8,703 140,994 141,170
Other liabilities 321,209 288,045 25,823 137,419 451,287 772,496Provisions for risks and charges 90,243 13,001 7,354 36,780 57,135 147,378
Total Liabilities 11,136,231 19,280,915 2,702,428 5,249,126 27,232,469 38,368,700Net Exposure 1,753,781 (125,276) 468,180 1,706,393 2,049,297 3,803,078
Notes to the Consolidated Financial Statements | 31 December 2015
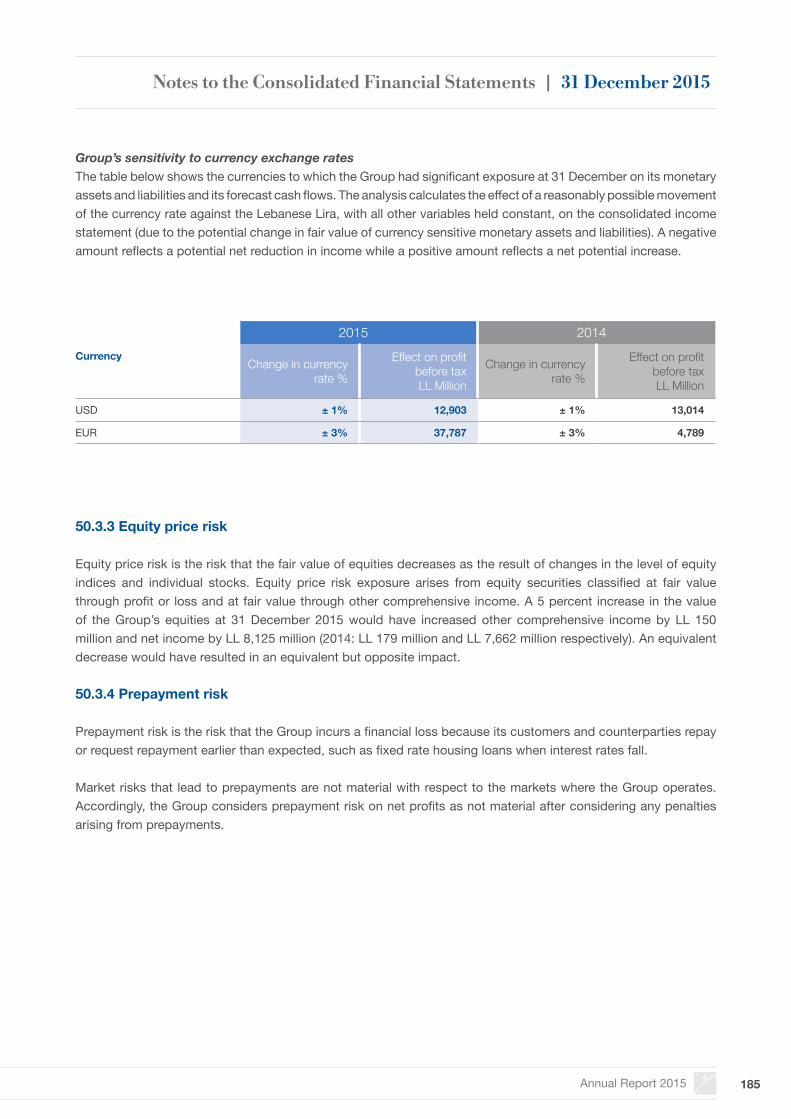
Annual Report 2015 185
Group’s sensitivity to currency exchange ratesThe table below shows the currencies to which the Group had significant exposure at 31 December on its monetary assets and liabilities and its forecast cash flows. The analysis calculates the effect of a reasonably possible movement of the currency rate against the Lebanese Lira, with all other variables held constant, on the consolidated income statement (due to the potential change in fair value of currency sensitive monetary assets and liabilities). A negative amount reflects a potential net reduction in income while a positive amount reflects a net potential increase.
50.3.3 Equity price risk
Equity price risk is the risk that the fair value of equities decreases as the result of changes in the level of equity indices and individual stocks. Equity price risk exposure arises from equity securities classified at fair value through profit or loss and at fair value through other comprehensive income. A 5 percent increase in the value of the Group’s equities at 31 December 2015 would have increased other comprehensive income by LL 150 million and net income by LL 8,125 million (2014: LL 179 million and LL 7,662 million respectively). An equivalent decrease would have resulted in an equivalent but opposite impact.
50.3.4 Prepayment risk
Prepayment risk is the risk that the Group incurs a financial loss because its customers and counterparties repay or request repayment earlier than expected, such as fixed rate housing loans when interest rates fall.
Market risks that lead to prepayments are not material with respect to the markets where the Group operates. Accordingly, the Group considers prepayment risk on net profits as not material after considering any penalties arising from prepayments.
2015 2014Currency
Change in currency rate %
Effect on profit before taxLL Million
Change in currency rate %
Effect on profit before taxLL Million
USD ± 1% 12,903 ± 1% 13,014
EUR ± 3% 37,787 ± 3% 4,789
Notes to the Consolidated Financial Statements | 31 December 2015
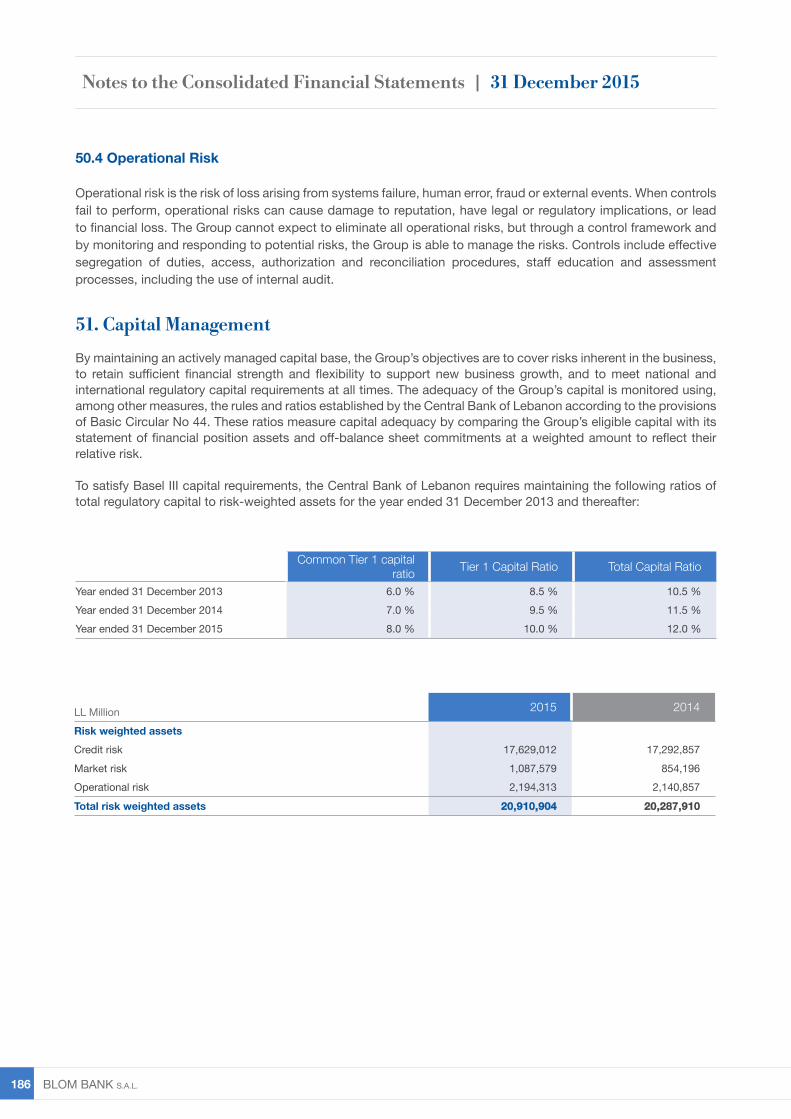
BLOM BANK s.A.L. 186
Common Tier 1 capital ratio Tier 1 Capital Ratio Total Capital Ratio
Year ended 31 December 2013 6.0 % 8.5 % 10.5 %Year ended 31 December 2014 7.0 % 9.5 % 11.5 %Year ended 31 December 2015 8.0 % 10.0 % 12.0 %
51. Capital Management
By maintaining an actively managed capital base, the Group’s objectives are to cover risks inherent in the business, to retain sufficient financial strength and flexibility to support new business growth, and to meet national and international regulatory capital requirements at all times. The adequacy of the Group’s capital is monitored using, among other measures, the rules and ratios established by the Central Bank of Lebanon according to the provisions of Basic Circular No 44. These ratios measure capital adequacy by comparing the Group’s eligible capital with its statement of financial position assets and off-balance sheet commitments at a weighted amount to reflect their relative risk.
To satisfy Basel III capital requirements, the Central Bank of Lebanon requires maintaining the following ratios of total regulatory capital to risk-weighted assets for the year ended 31 December 2013 and thereafter:
50.4 Operational Risk
Operational risk is the risk of loss arising from systems failure, human error, fraud or external events. When controls fail to perform, operational risks can cause damage to reputation, have legal or regulatory implications, or lead to financial loss. The Group cannot expect to eliminate all operational risks, but through a control framework and by monitoring and responding to potential risks, the Group is able to manage the risks. Controls include effective segregation of duties, access, authorization and reconciliation procedures, staff education and assessment processes, including the use of internal audit.
LL Million 2015 2014
Risk weighted assetsCredit risk 17,629,012 17,292,857Market risk 1,087,579 854,196Operational risk 2,194,313 2,140,857
Total risk weighted assets 20,910,904 20,287,910
Notes to the Consolidated Financial Statements | 31 December 2015
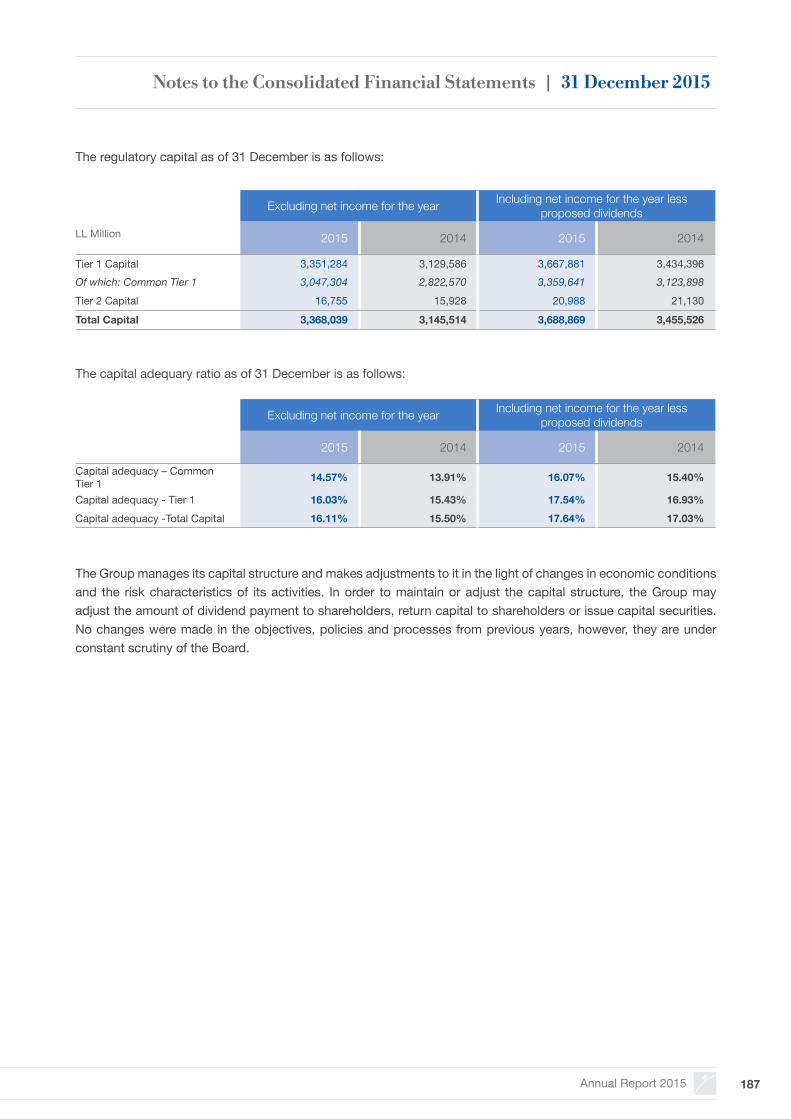
Annual Report 2015 187
The Group manages its capital structure and makes adjustments to it in the light of changes in economic conditions and the risk characteristics of its activities. In order to maintain or adjust the capital structure, the Group may adjust the amount of dividend payment to shareholders, return capital to shareholders or issue capital securities. No changes were made in the objectives, policies and processes from previous years, however, they are under constant scrutiny of the Board.
The capital adequary ratio as of 31 December is as follows:
The regulatory capital as of 31 December is as follows:
Excluding net income for the year Including net income for the year lessproposed dividends
LL Million 2015 2014 2015 2014
Tier 1 Capital 3,351,284 3,129,586 3,667,881 3,434,396Of which: Common Tier 1 3,047,304 2,822,570 3,359,641 3,123,898Tier 2 Capital 16,755 15,928 20,988 21,130
Total Capital 3,368,039 3,145,514 3,688,869 3,455,526
Excluding net income for the year Including net income for the year lessproposed dividends
2015 2014 2015 2014
Capital adequacy – Common Tier 1 14.57% 13.91% 16.07% 15.40%
Capital adequacy - Tier 1 16.03% 15.43% 17.54% 16.93%Capital adequacy -Total Capital 16.11% 15.50% 17.64% 17.03%
Notes to the Consolidated Financial Statements | 31 December 2015

BLOM BANK s.A.L. 188
LEBANONHeadquarters (Beirut)
Annual Report 2015 189
BLOM BANK GROUP DIRECTORY

BLOM BANK s.A.L. 190
Country Correspondent BankAustralia, Melbourne National Australia Bank Ltd
Bahrain, Manama National Bank of Bahrain BSC
Belgium, Brussels KBC Bank NV
Canada, Toronto Bank of Montreal
China, Beijing Bank of China Limited
Denmark, Copenhagen Danske Bank A/S
France, Paris BLOM Bank France SA
Germany, Frankfurt am Main Commerzbank AG
Germany, Frankfurt am Main Deutsche Bank AG
Italy, Milan Intesa Sanpaolo SpA
Italy, Milan UniCredit SpA
Japan, Tokyo Sumitomo Mitsui Banking Corporation
Japan, Tokyo The Bank of Tokyo-Mitsubishi UFJ Ltd
KSA, Jeddah The National Commercial Bank
KSA, Riyadh Riyad Bank
Kuwait, Kuwait City Gulf Bank KSC
Norway, Oslo Dnb Bank ASA
Qatar, Doha BLOM Bank Qatar LLC
Qatar, Doha The Commercial Bank of Qatar (QSC)
Romania, Bucharest BLOM Bank France SA
Spain, Barcelona Banco de Sabadell SA
Spain, Madrid Banco Bilbao Vizcaya Argentaria SA
Sweden, Stockholm Skandinaviska Enskilda Banken AB
Switzerland, Geneva BLOM Bank (Switzerland) SA
Switzerland, Zurich Credit Suisse AG
Turkey, Istanbul Yapi ve Kredi Bankasi AS
U.A.E, Abu Dhabi National Bank of Abu Dhabi
U.A.E, Dubai BLOM Bank France SA
U.K, London Barclays Bank Plc
U.K, London BLOM Bank France SA
U.K, London JPMorgan Chase Bank National Association
U.S.A, New York Citibank NA
U.S.A, New York Deutsche Bank Trust Company Americas
U.S.A, New York JPMorgan Chase Bank National Association
U.S.A, New York Standard Chartered Bank
U.S.A, New York The Bank of New York Mellon
Worldwide Correspondent Banks
Annual Report 2015
BLOM BANK Group | Management & Network
Banks & Financial Subsidiaries
Insurance Subsidiaries
BLOM BANK s.A.L. 192
LEBANON
Refer to page 17 until 26 of this report for management.
Branch NetworkHEADQUARTERS (BEIRUT)Verdun, Rachid Karami St., BLOM BANK Bldg. P.O.Box: 11-1912 Riad El-Solh, Beirut 1107 2807, LebanonPhone: (961-1) 743300 – 738938Fax: (961-1) 738946 Email: [email protected]: www.blombank.com
Beirut Branches
Main Branch Verdun, Rachid Karami St., BLOM BANK Bldg.Phone: (961-1) 743300 – 738938Fax: (961-1) 343092Principal Branch Manager: Mr. Walid ARISS
Ain El-MreissehAin El-Mreisseh, Ibn Sina St., Mashkhas Bldg.Phone: (961-1) 372780 – 370830 Fax: (961-1) 370237Senior Branch Manager: Mr. Mahmoud MARRACHE
Ashrafieh Ashrafieh, Sassine Square, Michel Sassine Bldg.Phone: (961-1) 200147/8Fax: (961-1) 320949Senior Branch Manager: Mrs. Denise Nasr Abi Raad JALKH
Ashrafieh EmbassyAshrafieh, Iskandar St., Embassy II Bldg.Phone: (961-1) 322391 -2/3/4Fax: (961-1) 320591Branch Manager: Mr. Nadim CHACHATI
Bab IdrissDowntown Beirut, Bab Idriss, Weygand St., Semiramis Bldg.Phone: (961-1) 991671/2-6Fax: (961-1) 991670Branch Manager: Mrs. Souraya BCHOUTY
BadaroBadaro, Main St., Khoury Bldg.Phone: (961-1) 615818/19/20/21Fax: (961-1) 615825Branch Manager: Mr. Jad RAAD
Bechara El Khoury Bechara El Khoury Highway, Bozweir & Bdeir, Tower 951, Ground Flr.Phone: (961-79) 300594 - (961-76) 667791/2Branch Manager: Mr. Weam DARWICH
BlissRas Beirut, Bliss St., Al Rayess Bldg.Phone: (961-1) 363742 - 363734Fax: (961-1) 363732Branch Manager: Mr. Wael KADI (AL)
Burj Abi HaidarBurj Abi Haidar, Salim Salem Highway, Salam TowerPhone: (961-1) 310687 – 310677/8Fax: (961-1) 310679Principal Branch Manager: Mr. Samer DAYA
ConcordVerdun, Rachid Karami St., BLOM BANK Bldg. Phone: (961-1) 750160/1/2/3 Fax: (961-1) 738859Branch Manager: Mr. Marwan NASSER
HamraHamra, Abdel Aziz St., Monte Carlo Bldg., 2nd Flr.Phone: (961-1) 346290/1/2/3 – 341955 - 343503Fax: (961- 1) 744407Principal Branch Manager: Mr. Sami FARHAT
Hamra - Abdel AzizHamra, Abdel Aziz St., Monte Carlo Bldg.Phone: (961-1) 747752 /59 /60Fax: (961-1) 747749Branch Manager: Mr. Mohamad Masri SIDANI
IstiklalKarakol Druze, Istiklal St., Salhab Bldg.Phone: (961-1) 738050/1 - 749624 Fax: (961-1) 748337Branch Manager: Mr. Chafic KOUSSA
Jnah Bir Hassan, United Nations St., Jaber Bldg.Phone: (961-1) 855903/4/5Fax: (961-1) 855906Principal Branch Manager: Mr. Abbas KALOT
Banks & Financial Subsidiaries
Management
BLOM BANK Group | Management & Network

Annual Report 2015
Maarad Downtown Beirut, Emir Bechir St., Hibat el Maarad Bldg.Phone: (961-1) 983230/1/2/3Fax: (961-1) 983234Senior Branch Manager: Mr. Amer KAMAL
Mar EliasCorniche El Mazraa, Main St., Zantout Bldg.Phone: (961-1) 818616/7/8 Fax: (961-1) 818009Branch Manager: Mr. Mazen ALIEH
MazraaCorniche El Mazraa, Barbir Square, Majdalani Bldg.Phone: (961-1) 664337 – 648021/2Fax: (961-1) 648020Branch Manager: Mr. Omar HALABI (EL)
Mina El HosnMina El Hosn, Adnan El Hakim St., Beirut Tower Bldg.Phone: (961-1) 365234/5/6/7Fax: (961-1) 365230Principal Branch Manager: Mr. Samer BOHSALI
NoueiriNoueiri, Al Noueiri Station, Hamada Bldg.Phone: (961-1) 658611 – 658610 Fax: (961-1) 630319Branch Manager: Mrs. Nahida Mehdi WEHBE
RaoucheRaouche Blvd., Al Rayess & Bou Dagher Bldg.Phone: (961-1) 812603/4/5/6Fax: (961-1) 801634 Senior Branch Manager: Mr. Yehia ORFALI
RmeilRmeil, Saint George Hospital St., Medica Center Bldg.Phone: (961-1) 565454 – 567140/1 Fax: (961-1) 565252Branch Manager: Mrs. Salma Rbeiz ACHKOUTY
SaifiSaifi, Al Arz St., Akar Bldg.Phone: (961-1) 566794 – 587196 Fax: (961-1) 581683Senior Branch Manager: Mr. Laurent CHEBLI
SanayehSanayeh, Spears St., Chamber of Commerce & Industry Bldg.Phone: (961-1) 346042/3 – 748339 Fax: (961-1) 738404Branch Manager: Mr. Abbas TANNIR (AL)
SodecoSodeco, Damascus Road, Sodeco Square TowerPhone: (961-1) 611360/1/2Fax: (961-1) 423805Branch Manager: Dr. Gladys Younes KREIKER
Tabaris Tabaris, Gebran Tueini Square, Sursock Tower Phone: (961-1) 203142/3/4Fax: (961-1) 203145Principal Branch Manager: Ms. Claire ABOU MRAD
Tariq Al-JedidehTariq Al-Jedideh, Al Malaab Al Baladi Square, Salim Bldg.Phone: (961-1) 818621 – 816985 – 309959Fax: (961-1) 818620Branch Manager: Mr. Khodor MNEIMNEH
VerdunVerdun, Ras Beirut / Snoubra, Takieddine Solh St., Ghalayini Bldg.Phone: (961-1) 788412/3 – 800081 Fax: (961-1) 800032Branch Manager: Mr. Marwan PHARAON
Mount Lebanon Branches
Ain El-Remaneh Ain El-Remaneh, Boueiz and Matar St., Bou Chedid Bldg.Phone: (961-1) 386750/1/2Fax: (961-1) 386753Branch Manager: Mr. Georges NASSIF
Airport RoadGhobeyri, Airport Road – Facing Zaarour Center Phone: (961-70) 475299 – (961-76) 649607/8/9Fax: (961-1) 841586Branch Manager: Mr. Ezzat MELHEM
Aley Aley, Al Balakine St., Faysal Sultane Wahab Bldg.Phone: (961-5) 556612/3Fax: (961-5) 556614Senior Branch Manager: Mrs. May Abou Alwan BOU ALWAN
AnteliasAntelias, Rahbani St., Kheirallah Bldg.Phone: (961-4) 411472 – 520210 – 411418 – 410123Fax: (961-4) 523666Principal Branch Manager: Mr. Bassem MERHEJ
Aramoun Aramoun, Main Road, Zaynab Center Phone: (961-5) 808591/2/3Fax: (961-5) 808594Principal Branch Manager: Mrs. Nawal Merhi ABOU DIAB
BaabdaBaabda, Main Road, 610 Bldg., Block APhone: (961-5) 921869/70/1/2/4Fax: (961-5) 921864Branch Manager: Mr. Joe GHAZAL
BroumanaBroumana, Main St., BLOM BANK Bldg.Phone: (961-4) 862263/4Fax: (961-4) 862265Branch Manager: Mr. Paul TOUMA
Burj Al-BarajnehBurj Al-Barajneh, Ain El Sekka St., Rahal Bldg.Phone: (961-1) 450381/2/3 – 450446Fax: (961-1) 450384Branch Manager: Mr. Rabih CHDID
BLOM BANK Group | Management & Network
BLOM BANK s.A.L. 194
Burj HammoudBurj Hammoud, Armenia St., Harboyan CenterPhone: (961-1) 262067 – 266337/8 Fax: (961-1) 259061Branch Manager: Mr. Youssef HOMSI
ChiyahChiyah Blvd., Ariss St., Orient Center Bldg.Phone: (961-1) 270172/3/4 - 275783Fax: (961-1) 270064Principal Branch Manager: Mr. Abbas TLAIS
ChoueifatAl Omaraa, Main Road, Mouhtar & Haidar Bldg.Phone: (961-5) 433203/6 Fax: (961-5) 433208Branch Manager: Mr. Marwan MOHTAR
DbayehDbayeh Highway, Victoria Center, Ground Flr.Phone: (961-4) 520425/6/7/8Fax: (961-4) 520432Branch Manager: Mrs. Rita NEHME
Dekwaneh Dekwaneh, Main St., Mohanna Center Phone: (961-1) 686072- 686035/6 Fax: (961-1) 686095Senior Branch Manager: Mr. Farid ZOGHBI
DoraDora, Main Highway, Banking Center Bldg.Phone: (961-1) 256527/28/32Fax: (961-1) 256522Branch Manager: Mr. Georges MAMO
ElissarElissar, Main Road, Villa Marie Bldg.Phone: (961-4) 916111/2/3/4Fax: (961-4) 916115Senior Branch Manager: Mr. Joseph Francois GHOUSSOUB
Furn El ChebbakFurn El Chebbak, Main St., Abraj CenterPhone: (961-1) 293810/3 Fax: (961-1) 293816Branch Manager: Mr. Ronald FARAH
GhobeyriGhobeyri, Chiah Blvd., Tohme & Jaber & Kalot Bldg.Phone: (961-1) 825509 – 825870Fax: (961-1) 820153Principal Branch Manager: Mrs. Majida Alameh MIKATI
HadathHadath, Sfeir district, Hoteit Bldg.Phone: (961-5) 461506 - 461438Fax: (961-5) 461815Branch Manager: Mr. Wassim FAHS
Haret HreikHaret Hreik, Sayyed Hadi Nasrallah Highway, Abou Taam & Hoteit Bldg.Phone: (961-1) 543662 – 543658/9Fax: (961-1) 543661Senior Branch Manager: Dr. Hassan JABAK
HazmiehHazmieh, Damascus Road, Chahine CenterPhone: (961-5) 955241/2/3/4Fax: (961-5) 955240Principal Branch Manager: Mr. Ziad KAREH
JbeilEl Berbara, Voie 13, Byblos Canari Bldg.Phone: (961-9) 943701/2/3Fax: (961-9) 943704Branch Manager: Mr. Yves KHOURY (EL)
JdeidehJdeideh, New Jdeideh St., Etoile CenterPhone: (961-1) 889351/2 – 889360Fax: (961-1) 889363Branch Manager: Mrs. Aline Sakr BOU ZERDANE
JouniehJounieh, Saraya St., Executive Center Bldg.Phone: (961-9) 638012/3/4Fax: (961-9) 638011Branch Manager: Mrs. Ghada Fadous MOUAWAD
KaslikKaslik, Main St., Debs CenterPhone: (961-9) 640273 – 640095 – 636998/9Fax: (961-9) 831113Principal Branch Manager: Mr. Charles AOUDE
KfarhbabKfarhbab, Main St., Oueiss CenterPhone: (961-9) 856810/1/2/3/4Fax: (961-9) 856820Branch Manager: Mr. Zakhia SARKIS
Mansourieh Mansourieh, New Main Highway, Dar El Ain Plaza Bldg. Phone: (961-4) 532856/7/8Fax: (961-4) 532854Branch Manager: Mr. Ziad SROUGI
Sin El FilSin El Fil, Fouad Chehab Avenue, Far Vision Center Phone: (961-1) 485270/1/2Fax: (961-1) 485273Principal Branch Manager: Mr. Fadi MIR (EL)
BLOM BANK Group | Management & Network
Annual Report 2015
Sin El Fil – Horsh TabetHorsh Tabet, Charles De Gaulle St., Tayar CenterPhone: (961-1) 489733 – 489750/7Fax: (961-1) 489739Branch Manager: Mr. Eddy EID
Zalka Zalka, Main St., BLOM BANK Bldg.Phone: (961-4) 713074/5/6 – 723074/5Fax: (961-4) 713077Senior Branch Manager: Mr. Walid LABBAN
Zouk Mosbeh Zouk Mosbeh, Main Road, Le Paradis CentrePhone: (961-9) 226991/2/3/4/5Fax: (961-9) 226990Branch Manager: Mrs. Marlène Mezraany ABOU NAJM
North Lebanon Branches
AmiounAmioun, Main Road, Nassif Bldg.Phone: (961-6) 951801/2/3Fax: (961-6) 951813Branch Manager: Mrs. Ralda Rouss AZAR
Tripoli Abi SamraTripoli Abi Samra, Al-Dinnawi Square, Khaled Darwiche Bldg.Phone: (961-6) 423565/6/7/8Fax: (961-6) 423569Branch Manager: Mrs. Salwa Ajaj MERHI
Tripoli – AzmiTripoli, Azmi St., Fattal Bldg.Phone: (961-6) 433064 – 443550/1/2Fax: (961-6) 435947Branch Manager: Mr. Fouad HAJJ
Tripoli – Al TellTripoli Al Tell, Abdel Hamid Karameh Square, Ghandour Bldg.Phone: (961-6) 430153 – 628200/1/2 Fax: (961-6) 431624Senior Branch Manager: Mr. Chaina ASSI
Tripoli BoulevardBoulevard St., Near Banque du Liban, 1st Flr.Phone: (961-78) 880058/68 - (961-76) 181145/6 Branch Manager: Mr. Wassim BAGHDADI
Tripoli - ZahriehTripoli Zahrieh, Al Tall St., Alam Al Din & Bissar Bldg.Phone: (961-6) 430150/2 – 423414/5Fax: (961-6) 430151Branch Manager: Mrs. Lina ALAMEDDINE
Bekaa Branches
ChtauraChtaura, Main St., Najim El Din Bldg.Phone: (961-8) 540078 - 544330 - 544914Fax: (961-8) 542504Branch Manager: Mr. Marwan CHAKRA
Jib JinnineJib Jinnine, Main Road, Chibli Al Hajj Bldg.Phone: (961-8) 661951 - 660942Fax: (961-8) 661092Branch Manager : Mr. Kamel ABDOUNI
ZahlehZahleh, Manara Center, Fakhoury & Kfoury Bldg.Phone: (961-8) 807681/2/3/4Fax: (961-8) 807680Branch Manager: Mrs. Sabine Rbeiz KASSIS
South Lebanon Branches
Nabatiyeh Nabatiyeh, Hassan Kamel Al Sabbah St., Office 2000 Bldg.Phone: (961-7) 767854/5/6Fax: (961-7) 767857Branch Manager: Mr. Hussein CHAMOUN
SaidaSaida, Riad Solh St., Al Zaatari & Fakhoury & Bizri Bldg.Phone: (961-7) 724866 – 723266 Fax: (961-7) 722801Principal Branch Manager: Mr. Majdi HAMMOUD
Saida BoulevardSaida, Boulevard Square, Al Saoudi Bldg. Phone: (961-7) 730976 - 730879 Fax: (961-7) 736299Branch Manager: Mr. Wafic BABA (AL)
TyrTyr, Main St., Chehade Bldg.Phone: (961-7) 740900 – 741649 Fax: (961-7) 348487Senior Branch Manager: Mrs. Maysaa Arab RAHAL
Tyr - AbbassiehTyr Al Abbassieh, Jal El Baher St., BLOM BANK Bldg.Phone: (961-7) 350861/2/3/4 – 350841/2/3Fax: (961-7) 350865Branch Manager: Mr. Ali Daoud HAMADEH
Tyr – AtharTyr Al Athar, Al Istiraha St., Tajjudin Bldg., Ground Flr.Phone: (961-70) 584381 - (961-3) 006617/8/9Branch Manager: Mr. Marwan CHAB (AL)
BLOM BANK Group | Management & Network
BLOM BANK s.A.L. 196
JORDAN
NetworkREGIONAL MANAGEMENT (AMMAN)18 Al Sharif Abdel Hamid Sharaf St. P.O.Box: 930312 Shmeisani, Amman 111 93, JordanPhone: (962-6) 5001200 Fax: (962-6) 5677177 Call Center: (962-6) 5001222 Email: [email protected] Website: www.blom.com.jo
AbdounPrincess Basmah St., Essam Al-Khateeb Complex, Bldg. #2 Phone: (962-6) 5929663 Fax: (962-6) 5929662 Email: [email protected] Branch Manager: Mr. Omar ABU ASSAF
AqabaSherif Shaker Ben Zeid St. Phone: (962-3) 2019340 Fax: (962-3) 2019318 Email: [email protected] Branch Manager: Mr. Shady Adel AL FAKHOURY
Jubeiha20 Yajouz St., Bldg. #20 Phone: (962-6) 5336653 Fax: (962-6) 5336657 Email: [email protected] Branch Manager: Mr. Ammar SAIDI
Al AbdaliAl Abdali St., Jouba Bldg. Phone: (962-6) 5696566 Fax: (962-6) 5693955 Email: [email protected]
IrbidIrbid King Abdallah the Second St., Al-Qubba Circle, Bldg. #4 Phone: (962-2) 7240006 Fax: (962-2) 7240057 Email: [email protected] Manager: Mr. Ahmad DABAAN
Mecca StreetMecca St., Al Husseine Complex, Bldg. #152 Phone: (962-6) 5503130 Fax: (962-6) 5521347 Email: [email protected] Branch Manager: Mr. Raed JUDEH
ShmeisaniAl Sharif Abdel Hamid Sharaf St., Bldg. #18 Phone: (962-6) 5001200 Fax: (962-6) 5605652 Email: [email protected] Branch Manager: Mr. Abed Aljawad OWAISI TajAbdoun, Jordan, Taj Mall Center Phone: (962-6) 5931912 Email: [email protected] Branch Manager: Mr. Aws TAHBOB WihdatAl Amir Hassan St., Oum Heiran, Bldg. #453Phone: (962-6) 4750050 Fax: (962-6) 4750055 Email: [email protected] Branch Manager: Mr. Eyad GHAITH
TareqEbn Sahnoon St.,Phone: (962-6) 5055141Fax: (962-6) 5055231 Email: [email protected] Branch Manager: Mr. Hussein Al HELO SweifiehAbed Al Rahim Al Hajj Mohammad St., Bldg. #67 Phone: (962-6) 5865527 Fax: (962-6) 5865346 Email: [email protected] Branch Manager: Mr. Jamal MOMANI
Wadi SaqraWadi Saqra St., Al Reem Complex, Bldg. #244 Phone: (962-6) 5687333 Fax: (962-6) 5687888 Email: [email protected] Branch Manager: Ms. Elham SAUDI
ZarqaZarqa, Free Zone Gate 1Phone: (962-5) 3824921Fax: (962-5) 3823931Email: [email protected] Branch Manager: Mr. Ala’a AHMAD KhaldaWasfi Al Tal St., Opposite to Sedeen Hotel, Bldg. #25 Phone: (962-6) 5344641Fax: (962-6) 5344217Email: [email protected] Branch Manager: Mr. Marawan SALAH
Management
BLOM BANK Group | Management & Network
General ManagementDr. Adnan AL ARAJ Regional Manager Mr. Adnan SALLAKH Advisor to the General Manager Mr. Moder KURDI Assistant General Manager / Credit Mr. Muhannad AL BALBISSI Assistant Regional Manager/ FinanceMr. Omar ABDULLAH Assistant Regional Manager / Retail Mr. Ashraf Al QUDAH Treasury & Investments Manager Mr. Hani DIRANI Head of Legal & Collection Mr. Said OBEIDALLAH Head of Internal Audit Mr. Muhannad ABYAD Head of IT OperationsMr. Nabil OBALI Head of Risk Mr. Maan ZOABI Head of Compliance UnitMr. Muhannad YOUNIS Central Operations Manager
Annual Report 2015
Network205Z Makarios Avenue, Victory House Bldg., 3030 Limassol - Cyprus P.O.Box: 53243, 3301 Limassol Phone: (357-25) 376433/4/5 Fax: (357-25) 376292 Email: [email protected]: www.blombank.com
NetworkRepresentative OfficeEtihad Towers, Tower 3, Flr. 20, Corniche, Abu Dhabi - UAEP.O.Box: 63040Phone: (971-2) 6676100Fax: (971-2) 6676200Email: [email protected] Website: www.blombank.com
NetworkBaghdadKarada Kharej - Zone 905 - #9 St. - #1 Bldg. Phone: (964) 7809288690/1/2/3Business Development Manager: Mr. Ali CHREIFBranch Manager: Mr. Hussein OBEIDWebsite: www.blombank.com
ErbilErbil – 60 Meter St. – Near Iskan Intersection - BLOM BANK Bldg.Phone: (964) 751 016 1500 /1 /2 /3 Senior Branch Manager: Mr. Georges CHEDIDWebsite: www.blombank.com
ManagementMr. Ziad EL MORR Country Manager
Cyprus
ManagementMr. Ramzi AKKARI Chief Representative
Management
Mr. Georges CHEDID Senior Branch Manager for ErbilMr. Ali CHREIF Business Development Manager for BaghdadMr. Hussein OBEID Branch Manager for Baghdad
Abu Dhabi
Iraq
Management
Management
Management
BLOM BANK Group | Management & Network
BLOM BANK s.A.L. 198
Board of DirectorsMr. Saad AZHARI Chairman & General ManagerMessrs. BLOM BANK S.A.L. DirectorMr. Samer AZHARI DirectorMr. Marwan JAROUDI DirectorMr. Joseph Emile KHARRAT DirectorMr. Nicolas SAADE DirectorGeneral ManagementMr. Saad AZHARI BLOMINVEST BANK Chairman & General Manager Dr. Fadi OSSEIRAN General Manager Mr. Michel CHIKHANI Assistant General Manager, Head of Asset Management Mr. Elie CHALHOUB Senior ManagerMr. Georges ABBOUD Assistant General Manager, Head of Private BankingMr. Marwan ABOU KHALIL Head of Capital Markets Me. Sandra BOUSTANY Legal AffairsMr. Marc EL-HAGE Head of Business DevelopmentMr. Walid KADRI Head of Strategic Planning & OrganizationMs. Lara KANJ Head of Real Estate UnitMr. Joseph MATTA Head of Internal AuditMr. Marwan MIKHAEL Head of ResearchMr. Alexandre MOURADIAN Head of Investor RelationsMs. Rima Yassine RAMADAN Acting Head of OperationsDr. Ali BOLBOL Economic Advisor
Network
HEADQUARTERS (BEIRUT)Wygand St., Semiramis Bldg.P.O.Box: 11-1540, Riad El Solh, Beirut - LebanonPhone: (961-1) 983227Fax: (961-1) 749148Email: [email protected] Website: www.blominvestbank.com
General Management
BLOM BANK Group | Management & Network
Annual Report 2015
Board of Directors
Mr. Amr AZHARI Chairman & General Manager
Mr. Saad AZHARI MemberMr. Marwan JAROUDI MemberMr. Karim BAALBAKI MemberMr. Nicolas SAADE MemberMr. Habib RAHAL Representing BLOM BANK S.A.L.
Dr. Fadi OSSEIRAN Representing BLOMINVEST BANK S.A.L.
General Management
Mr. Amr AZHARI Chairman & General Manager
Mr. Moataz NATAFJI General ManagerMr. Habib EL HAJJAR Credit & Retail ManagerMr. Ibrahim EL KHALIL Operation ManagerMr. Mazen EL KOUCH Trade Finance & Payment System ManagerMrs. Nora Yassine DAROUB Acting Finance ManagerMr. Ziad HABLI Internal Audit ManagerMr. Tarek HOUSSAMI Main Branch ManagerMr. Kamil KASSIR Tripoli Branch ManagerMrs. Mona KOTOB Saida Branch Manager
Network
HEADQUARTERS (BEIRUT)Hamra, Abdel Aziz St., Daher Bldg.Phone: (961-1) 751090/1/2/3Fax: (961-1) 751094Email: [email protected]: www.blomdevelopment.com
HamraHamra, Abdel Aziz St., Daher Bldg.Phone: (961-1) 751090/2/3Fax: (961-1) 751094Email: [email protected] Branch Manager: Mr. Tarek HOUSSAMI Tripoli Al Mina Road, Al Ahli Bldg.Phone: (961-6) 429101/2/3Fax: (961-6) 429104Email: [email protected] Branch Manager: Mr. Kamil KASSIR
Saida Riad El Solh St., Zaatari Bldg., 4th Flr. Phone: (961-7) 727698 – 729362 Fax: (961-7) 731256 Email: [email protected] Branch Manager: Mrs. Mona KOTOB
General Management
BLOM BANK Group | Management & Network
BLOM BANK s.A.L. 200
BLOM BANK Group | Management & Network
Board of DirectorsMr. Samer AZHARI Chairman & General ManagerDr. Naaman AZHARI Honorary Chairman Mr. Amr AZHARI Permanent Representative of BLOM BANK S.A.L.
HE Sheikh Ghassan SHAKER(Grand Officier de la Légion d’Honneur) Director
Mr. Christian DE LONGEVIALLE Director Mr. Jean-Paul DESSERTINE Director Mr. Marwan JAROUDI Director General ManagementMr. Samer AZHARI Chairman & General Manager Mr. Michel ADWAN Deputy Chief Executive Officer Mr. Iskandar ARAMAN Country Manager – Paris Mr. Amr EL TURK Country Manager – London Mr. Dani SAWAYA Acting Manager – UAE Mr. Jean-Pierre BAAKLINI Country Manager – Romania Mr. Xavier ELLUIN Risk Manager Mr. Marc ABOU-KHALIL Audit Manager Mr. Jean HABER CIO
NetworkHEADQUARTERS (PARIS)21 Avenue George V, 75008 Paris - FrancePhone: (33-1) 44 95 06 06Fax: (33-1) 44 95 06 00Email: [email protected] Website: www.blomfrance.com Country Manager: Mr. Iskandar ARAMAN
UNITED ARAB EMIRATES
DubaiPrime Tower, Burj Khalifa St., Business Bay Area. P.O.Box: 4370 - Dubai - United Arab EmiratesPhone: (971-4) 2307230Fax: (971-4) 2236260Email: [email protected] Branch Manager: Mr. Eddy BECHARA
Jebel Ali E-Branch (Electronic Branch)Ground Flr., Bldg. 4, The GalleriesJebel Ali, DubaiPhone: (971-4) 8849311Fax: (971-4) 8849388Email: [email protected]
Deira E-Branch (Electronic Branch)Maktoum St., Dalmouk Series Bldg., Ground Flr., Deira, DubaiPhone: (971-4) 2281954 – 00971 4 2281982Fax: (971-4) 2281949Email: [email protected]
Sharjah Khaled Lagoon, Corniche Al Buhairah, Sheikh Nasser Bin Hamad Al Thani Bldg.P.O.Box: 5803 – Sharjah – United Arab EmiratesPhone: (971-6) 5736700 – 5736100 Fax: (971-6) 5736080 Email: [email protected] Branch Manager: Mr. Fouad ATTAR
United Kingdom
London193-195 Brompton Road, London SW3 1LZ, EnglandPhone: (44-20) 75907777 Fax: (44-20) 78237356Email: [email protected] Manager: Mr. Amr TURK
ROMANIA
HEADQUARTERS (BUCHAREST)66 Unirii Blvd., Bloc K3, S+P+M, Sector 3, P.O.Box: 1-850, Bucharest, Romania Phone: (40-21) 3027201 Fax: (40-21) 3185214 Email: [email protected] Manager: Mr. Jean-Pierre BAAKLINI
Branches in Romania
Unirii - Customer Desk 66 Unirii Blvd., Bloc K3, Mezzanin, Sector 3, Bucharest, Romania Phone: (40-21) 3027201 Fax: (40-21) 3185214 Email: [email protected] Head of Operations: Mrs. Florentina DELA
Victoria 72 Buzesti St., Sector 1, Bucharest, Romania Phone: (40-21) 3154205/6 Fax: (40-21) 3154208/9 Email: [email protected] Branch Manager: Mr. Marius VOICULET Constanta25 Bis Mamaia Blvd., CP 2-89, Constanta, Romania Phone: (40-241) 510950 Fax: (40-241) 510951 Email: [email protected] Branch Manager: Mr. Mihai BUTCARU
Management
Annual Report 2015
Board of DirectorsDr. Naaman AZHARI Honorary Chairman
Mr. Saad AZHARI ChairmanMr. André CATTIN Vice ChairmanMr. Jean Paul DESSERTINE MemberDr. Werner FREY MemberMe. Peter de la GANDARA Member
Mr. Ahmad SHAKER MemberGeneral ManagementMr. Antoine MAZLOUM General Manager
Mrs. Eléonore DAESCHER ManagerMr. Salim DIAB ManagerMr. Jean-Marc REBOH ManagerMr. Ziad YOUNES Deputy Manager
Network
HEADQUARTERS (GENEVA)1, Rue de la RôtisserieP.O.Box: 3040 -1211 Geneva 3 – SwitzerlandPhone: (41-22) 8177100 Fax: (41-22) 8177190Email: [email protected] Website: www.blombank.ch
Management
BLOM BANK Group | Management & Network
BLOM BANK s.A.L. 202
Board of DirectorsDr. Ahmad Rateb AL SHALLAH Chairman of the BoardDr. Ihsan BAALBAKI Vice ChairmanBLOM BANK represented by Mr. Amr AZHARI Executive Board MemberBLOM BANK represented by Mr. Samer AZHARI Board MemberBLOM BANK represented by Mr. Georges SAYEGH Executive Board MemberMiss. Nada CHEIKH DIB Board MemberMr. Fahd TFENKJI Board MemberMr. Iyad BETINJANEH Board MemberMr. Mohamad Nizar MAMISH Board MemberMr. Mohamed Adib JOUD Board AdvisorMr. Michel AZZAM Board SecretaryGeneral ManagementMr. Michel AZZAM General ManagerMr. Sameer BASSOUS Deputy General ManagerMrs. Rima Jawad ZEIN Senior Manager, Human ResourcesMrs. Inaya SOUBRA Senior Manager, InternationalMr. Firas SAMMAN Senior Manager, Information Technology & AdministrationMr. Samir ASMAR AdministrationMr. Ziad KAMAL AL DEEN ComplianceMrs. Souha HANNA Risk Management Mr. Adoniss ZODEH Internal Audit
NetworkHEADQUARTERS (DAMASCUS)Harika, Bab Barid, Lawyers’ Syndicate Bldg.P.O.Box: 3103 Damascus – Syria Phone: (963-11) 2260560Fax: (963-11) 2260555Email: [email protected] Website: www.bso.com.sy
Management
BLOM BANK Group | Management & Network
DAMASCUS Harika Harika, Bab Barid, Lawyers’ Syndicate Bldg.Phone: (963-11) 2260560Fax: (963-11) 2260555Branch Manager: Mr. Eyad EL SATI
Nejmeh SquareNejmeh Square, Parliament St.Phone: (963-11) 3344001Fax: (963-11) 3344021 Branch Manager: Rami AL BESHARA Kassaa Kassaa, Burj El Rouss Phone: (963-11) 5431350Fax: (963-11) 5431360Branch Manager: Mr. Habib SAYEGH
Mezzeh Mezzeh Highway, Next to Al Razy HospitalPhone: (963-11) 6132411Fax: (963-11) 6132409Branch Manager: Mr. Tarek SHIHAB
KafarsussehDamasquino MallPhone: (963-11) 2143701Fax: (963-11) 2143705Branch Manager: Mrs. Hadil DIB
Mazraa Al Malek Al Adel St.Phone: (963-11) 4430140Fax: (963-11) 4430145Branch Manager: Mr. George FAYAD
MidanGhawas Phone: (963-11) 8838971Fax: (963-11) 8838975Branch Manager: Ms. Iman OBEID
Adraa (temporarily closed) Adra Industrial City, Near the Administrative Building of the Industrial City. Phone: (963-11) 5851350 Fax: (963-11) 5851360
DONE
Annual Report 2015
BLOM BANK Group | Management & Network
RawdaNouri Bacha SquarePhone: (963-11) 3314560Fax: (963-11) 3314565
Free ZoneDamasus, Free ZonePhone: (963-11) 2133170Fax: (963-11) 2133173Branch Manager: Mr. Assem ABAZED
ALEPPO Al Azizieh Majd El Dine Al Jabiri St.Phone: (963-21) 2126081/0219960Fax: (963-21) 2125197Branch Manager: Mr. Amr KAYAL
Medineh (temporarily closed) Saba’ Bahrat St.Phone: (963-21) 3335277/0219961Fax: (963-21) 3335377 MuhafazaMuhafaza Blvd., Al Kahira St.Phone: (963-21) 2665022/0219962 Fax: (963-21) 2665035Branch Manager: Ms. Dalia ABDUALKAREEM
Sulaimanieh Sulaimanieh St.Phone: (963-21) 4611102/0219963Fax: (963-21) 4611107Branch Manager: Mr. Mohamad ISMAIL KASSABJI Town Mall (temporarily closed)Town Mall, Azaz RoadPhone: (963-21) 2521020/0219967Fax: (963-21) 2521025
Al Sheikh Najjar (temporarily closed)Sheikh Najjar Industrial CityPhone: (963-21) 4716600Fax: (963-21) 4716605
Fourkan (temporarily closed)Express St., Syriatel AvenuePhone: (963–21) 2645820Fax: (963-21) 2645825Acting Branch Manager: Mr. Mohamad Zakwan KHATIB LATTAKIA Al Kamilia Area, March 8th St.Phone: (963-41) 452516/0413010Fax: (963-41) 452573Branch Manager: Mr. Zafer WAZZAN
HAMA HamaAl Kouatly St.Phone: (963-33) 2213834/0339960Fax: (963- 33) 2213833Branch Manager: Mr. Morhaf AL SHAKAKI MhardaNew Church St.Phone: (963-33) 4742070Fax: (963- 33) 4742075Branch Manager : Mr. Firas BASSEEL
TARTOUSAl Thawra St.Phone: (963-43) 227474/0439960Fax: (963-43) 226869Acting Branch Manager: Mr. Naseem KOZMA HOMS City Center (temporarily closed)City Center Bldg.Phone: (963-31) 2453925/0319960Fax: (963-31) 2453936 HussiaHussia Industrial CityPhone: (963-31) 5360735Fax: (963-31) 5360735
Mahata Mahata Area, Basel El Assad St.Phone: (963-31) 2131200Fax: (963-31) 2131251Branch Manager: Mr. Khaled ZAHED
SWEIDA’A Tishreen St.Phone: (963 –16) 233328/0169960Fax: (963-16) 233478Branch Manager: Mr. Toufic BAZ RADWAN DARA’A (TEMPORARILY CLOSED)Al Mahata Blvd., Al Kouatly St.Phone: (963-15) 233309/0159960Fax: (963-15) 233055 KAMESHLI (TEMPORARILY CLOSED)Al Kouatly St.Phone: (963-52) 4496700Fax: (963-52) 433105Branch Manager: Mrs. Suhaila AFRAM
DONE
BLOM BANK s.A.L. 204
Network
HEADQUARTERS (DAMASCUS)Al-Malik Al-Adel St., Mazraa, Damascus, SyriaP.O.Box: 8093 Phone: (963-11) 4432190 Fax: (963-11) 4432195 Email: [email protected]: www.sofs.com.sy
Board of DirectorsMr. Amr AZHARI Chairman
Mr. Georges SAYEGH Vice ChairmanMr. Saad AZHARI MemberDr. Fadi OSSEIRAN MemberMr. Michel CHIKHANI MemberGeneral ManagementMr. Firas SAMMAN General Manager
Management
BLOM BANK Group | Management & Network
DONE

Annual Report 2015
Board of DirectorsMr. Saad AZHARI Chairman of the Board Mr. Mohamed OZALP Managing Director & Chief Executive Officer Mr. Rabih EL HALABI Deputy Managing Director & Executive Member of the BoardMr. Tarek METWALLY Deputy Managing Director & Executive Member of the BoardMr. Elias ARACTINGI MemberMr. Mohamed KAFAFI MemberMr. Magued SHAWKY MemberMr. Ahmed ABU ALI MemberMr. Jassim AL MANNAI MemberGeneral ManagementMr. Mohamed OZALP Managing Director & Chief Executive OfficerMr. Tarek METWALLY Deputy Managing Directors & Executive Board Member Mr. Rabih El HALABI Deputy Managing Directors & Executive Board MemberMr. Ahmed KHATTAB Head of Corporate Banking Group Mr. Ihab KHALIL Head of Retail Banking GroupMr. Khaled YOUSRY Head of Fl & Correspondent Banking GroupMr. Mohamed HISHAM Head of Compliance & AML GroupMr. Mohamed EID Head of Legal Affairs GroupMr. Mohamed RASHWAN Head of Internal AuditMr. Mohamed SHAWKY Head of Information Technology GroupMr. Mostafa EZZAT Head of Financial Control GroupMr. Mansour MANSOUR Head of Human Resources GroupMr. Mohamed Aly Taha HABIB Head of Security & Public Institutional Relations GroupMr. Hazem MOKBEL Chief Risk Officer Mr. Tarek REHAN Head of Central OperationsMr. Ali ASHRAF Head of General Administration GroupMr. Belal FAROUK Group Head, Board Affairs
Management
BLOM BANK Group | Management & Network
NetworkHEADQUARTERS (CAIRO)61 Ninety St., The 5th Compound, New CairoP.O.Box: 410 El Tagamoaa El KhamesPhone: (202) 33322770/1-9 Fax: (202) 37494508 – 37494168Website: www.blombankegypt.com
GREATER CAIRO Abbasia Abbasia St., 109 Bldg.Phone: (202) 39322342/3/4Fax: (202) 230222350Chief Branch Manager: Mr. Hussein EL SWEIFY
DokkiMohie Eldin Aboul Ezz St., 64 Bldg. Phone: (202) 37494572 - 37494643Fax: (202) 37494652 – 37494679Senior Branch Manager: Mrs. Hanaa FOUAD
Haram Haram St., Nasr El Din, 410 Bldg.Phone: (202) 35681223 Fax: (202) 35681488Chief Branch Manager: Mr. Ahmed SABRI
Heliopolis El Hegaz St., 31 Bldg. Phone: (202) 24543524 – 24519710Fax: (202) 24519730Chief Branch Manager: Mr. Ehab AHMED Khalifa El MaamounHeliopolis, El Khalifa El Maamoun, Manshiet El Bakry St., 20 Bldg.Phone: (202) 22575625 - 22575647Fax: (202) 22575651Chief Branch Manager: Mrs. Azza HINDI
MaadiNew Maadi, El Nasr Road, 4th St., 269 Bldg.Phone: (202) 25199615 - 25198244 - 25197960Fax: (202) 25199293Senior Branch Manager: Mr. Amr HASSAN
MohandessenLebanon St., 54 Bldg.Phone: (202) 33006599/02/04Fax: (202) 33039806 Zone Head: Mr. Mamdouh ZAYED
Mesadak 30 Mesadek St., Dokki, GizzaPhone: (202) 33375214 - 33375269Branch Manager: Mr. Ahmed YEHIA Nasr CityEl Nasr Road, El Akkad MallPhone: (202) 26906801/2/6Fax: (202) 26906805Zone Head: Mr. Hesham FOUAD New Cairo 61, 90 St., Tagamoa El Khames Phone: (202) 29281193 – 29281200Fax: (202) 37494508 - 37494168Zone Head: Mr. Sherif MOHASSEB New Maadi El Nasr Road, El Laselky St., 17/5 Bldg. Phone: (202) 25175546/7/8Fax: (202) 25173014 - 25173024Branch Manager: Mr. Sameh EL GHARIB
DONE

BLOM BANK s.A.L. 206
BLOM BANK Group | Management & Network
Opera Gomhoreya St., 17 Bldg.Phone: (202) 23923197 – 23927885Fax: (202) 22392265Senior Branch Manager: Mr. Tarek TALAAT
Orouba Heliopolis, Cleopatra St., 1 Bldg.Phone: (202) 24144769 – 24144759 Fax: (202) 24144793Chief Branch Manager: Mrs. Nayera LABIB
6th October Area No.4, Central Axis, 1st District, Al Madiena Commercial CenterPhone: (202) 38321024 - 38320537Fax: (202) 38339279Acting Branch Manager: Mr. Youssri TAWFIK ShoubraEl Khalafawy Square, Shoubra St., 232 Bldg.Phone: (202) 24311416 - 22015236 Fax: (202) 24311364 – 24312678 Chief Branch Manager: Mrs. Heba SAAD El Sherouq New City Plaza Mall next to BUEPhone: (202) 01028577886 - 01028577882Chief Branch Manager: Mr. Mostafa SABRY
ZamalekAbu El Feda St., 15 Bldg.Phone: (202) 27355246 - 27368045Fax: (202) 27351832 - 27358613Senior Branch Manager: Mrs. Wafaa EZZAT
Sheikh Zayed Hayat Mall, 2 El Mahwer El Merkazi El Ganouni - ElSheikh Zayed, 6 OctoberPhone: (202) 3851389 - 38513891 Fax: (202) 38513892Branch Manager: Ms. Amany NAFEA ManialManial St., El Rodah, 13 Bldg.Phone: (202) 23640604 – 23640644 Fax: (202) 23640611Acting Branch Manager: Mrs. Ghada HELMY ALEXANDRIA El Shatby El Shatby, Port Said St., 17 Bldg.Phone: (203) 5934055 Fax: (203) 5934058Chief Branch Manager: Mr. Ayman TALAAT
MontazaEl Mandara, Gamal Abd El Naser St., 414 Bldg.Phone: (203) 5488550 – 5488593Fax: (203) 5488713Branch Manager: Mr. Radwa EL FIKY
ManshiaOrabi Square, 9 Bldg.Phone: (203) 4856088 - 4856052Fax: (203) 4856120/1 Chief Branch Manager: Mr. Mohamed ABOU SHOUSHA
Stadium Seliman Yosry St., 1 Bldg.Phone: (203) 4951641/2/3Fax: (203) 4951635 Zone Head: Mr. Ashraf TAHIO
Sporting El Horia St., 273 Bldg.Phone: (203) 4270211 - 4200098Fax: (203) 4200094Branch Manager: Mrs. Rasha HAMDY GOVERNATES DamiettaBorg El Shark Insurance, Corniche El Nile St., 1 Bldg.Phone: (2057) 363470 - 363413Fax: (2057) 2363453Chief Branch Manager: Mr. Mohamed EL BERGISY
Ismalia El Ismalia Canal, in front of El Rai Bridge, 144 St., 15 Bldg.Phone: (2064) 3921758/79Fax: (2064) 3921767 Branch Manager: Mr. Mohamed ABDEL KADER Mansoura Torail, Saad Zaghloul St., 35 Bldg. Phone: (250) 2309121/4/6Fax: (250) 2309122/5Zone Head: Mr. Ehab FARHAT
Port SaidAl Gomhoureya St., 37 Bldg.Phone: (2066) 3322962/4/7Fax: (2066) 3322963 Acting Branch Manager: Mr. Mohamed EL NAGGAR Tanta El Guiesh St., 44 Bldg.Phone: (240) 3356443 – 3356431 – 3356231Fax: (240) 3356449Acting Branch Manager: Mr. Ashraf EL GUINDY
El OubourLot 1 to 12 Avenue Mall Obour City after El Tawheed & Noor and Star House Phone: 02 - 44890020/44890033Acting Branch Manager: Mr. Ayman HUSSAIN RED SEA Al HurghadaSakallah Square, Elmina St., 7 Bldg.Phone: (2065) 3447835 - 3448516/7Fax: (2065) 3447834 Chief Branch Manager: Mr. Alaa METWALLY
Sharm El SheikhSalam St., Viva MallPhone: (2069) 3664326/7Fax: (2069) 3664325Under Supervision of: Mr. Alaa METWALLY
DONE

Annual Report 2015
Online Trading Giza, Mohandessin, Gezerat El Arab St., 8 Bldg. Phone: (202) 376 217 12 - (202) 376 217 29Fax: (202) 376 176 80 Email: [email protected]
Heliopolis Branch Al Orouba, Cleopatra St., 1 Bldg.Phone: (202) 241 448 01 - (202) 241 448 47Fax: (202) 241 448 29
Board of DirectorsMr. Tarek METWALLY Chairman Mr. Hany MAHMOUD Managing Director Mrs. Maya EL KADI MemberMr. Michel CHIKHANI MemberMr. Rabih El HALABI MemberMr. Mohamed RASHWAN MemberMr. Belal FAROUK MemberGeneral ManagementMr. Hany MAHMOUD Managing DirectorMrs. Ola EL MANDOUH Deputy Managing DirectorMr. Emam WAKED Head of Institutional Sales - LocalMrs. Mayada SAYED Head of Retail Banking
NetworkHEADQUARTERS (CAIRO) Giza, Mohandessin, Gezerat El Arab St., 8 Bldg.Phone: (202) 37 617 682 - 3 - 7Fax: (202) 37 617 680Email: [email protected] Website: www.blomegyptsecurities.com
Management
BLOM BANK Group | Management & Network
DONE
BLOM BANK s.A.L. 208
Board of DirectorsMr. Abdullah Abdullatif AL-FOZAN Chairman of BLOMINVEST SAUDI ARABIA Mr. Saad AZHARI Member Mr. Essam AL-MUHAIDIB MemberMr. Walid AbdulAziz AL SUGHAYIR Member Dr. Fadi OSSEIRAN MemberMr. Marwan AL-JAROUDI MemberMr. Fawwaz Al-KHODARI MemberMr. Emad BABAN MemberMr. Ali GHANDOUR MemberGeneral ManagementMr. Abdullah Saud AL-RASHOUD Chief Executive OfficerMr. George HANNA Head of Asset ManagementMr. Moataz SIDANI Head of Corporate FinanceMr. Wael EL-TURK Chief Financial OfficerMr. Tony BOU FAYSSAL Head of Compliance & Money Laundering Reporting OfficerMr. Fady AL KHALAF Head of Real Estate
Network
HEADQUARTERS (RIYADH)Riyadh, King Fahd Road, Al Oula Bldg., 3rd Flr. P.O.Box: 8151 Riyadh - 11482Phone: (966-11) 4949555 Fax: (966-11) 4949551 Email: [email protected] Website: www.blom.sa
Management
BLOM BANK Group | Management & Network
DONE
Annual Report 2015
Board of DirectorsMr. Saad AZHARI Chairman & Executive DirectorMr. Izzat NUSEIBEH Executive Director Mr. Marwan AL JAROUDI Vice ChairmanMr. Fahim MO’DAD MemberMr. Nicolas SAADE MemberMr. Fares EL KADI MemberGeneral ManagementMr. Saad AZHARI ChairmanMr. Izzat NUSEIBEH Chief Executive OfficerMr. Abbas BOU DIAB Head of Compliance & Anti-Money LaunderingMr. Dany ABOU JAOUDE Head of Corporate BankingMrs. Rima EL ETER Risk ManagerMrs. Carine MHANNA Finance ManagerMr. Roger ABOU ZEID Head of Operations & Treasury Mr. Zaher GHOUSSAINI Human Resources Manager
Network
HEADQUARTERS (DOHA)West Bay Area, Al Qassar Region 61, Al Wahda St., NBK (Amwal) Tower, 11th Flr., Suite 1110P.O.Box: 27700 – Doha, QatarPhone: (974) 44992999 Fax: (974) 44992990Email: [email protected]
Management
NetworkHEADQUARTERS (AMMAN)Shmeisani, Rafeeq Al-Athem St., MSDR Bldg.P.O.Box: 942341 Shmeisani, Amman, 11194, JordanPhone: (962-6) 5661608/5Fax: (962-6) 5663905Email: [email protected]
Board of DirectorsDr. Adnan AL ARAJ Chief of Directors Committee Mr. Adnan SALLAKH Deputy Chief of Directors CommitteeMr. Modar KURDI DirectorGeneral ManagementMr. Anwar AL SAQQA General ManagerMr. Khaled ZU’RUB Deputy General Manager
Jordan
Management
BLOM BANK Group | Management & Network
DONE
BLOM BANK s.A.L. 210
BLOM BANK Group | Management & Network
Board of DirectorsMr. Habib RAHAL Chairman & General ManagerMr. Fateh BEKDACHE Vice Chairman & General ManagerMr. Samer AZHARI MemberSCOR SE (Represented by Mr. Victor PEIGNET) MemberMr. Serge OSOUF MemberMr. Patrick LOISY MemberMr. Marwan JAROUDI MemberMr. Rami HOURIEH MemberGeneral ManagementMr. Habib RAHAL Chairman & General ManagerMr. Fateh BEKDACHE Vice Chairman & General ManagerMs. Faten DOUGLAS Deputy General Manager
NetworkHEADQUARTERS (ZALKA)Zalka, Michel Murr St., AROPE Bldg.P.O.Box: 113-5686 Beirut – LebanonPhone: (961-1) 905777e-Fax: (961-1) 886786Hotline (24/7): 1219Email: [email protected] Website: www.arope.com
BRANCHES
VerdunRachid Karami St., AROPE Plaza, BLOM BANK Bldg.Phone:(961-1) 759999e-Fax: (961-1) 886786Email: [email protected]
Hadath*St. Therese St., Hoteit Bldg., BLOM BANK Branch, 1st Flr.Phone: (961-5) 461243e-Fax: (961-1) 886786Email: [email protected]
Jounieh Jounieh Highway, Damaa Bldg., 1st Flr.Phone: (961-9) 643222 e-Fax: (961-1) 886786Email: [email protected] TripoliBoulevard St., near Banque Du Liban, above BLOM BANKPhone: (961–6) 413333 e-Fax: (961-1) 886786Email: [email protected]
SaidaRiad El Solh St., Fakhoury & Bizri Bldg., BLOM BANK Branch, 1st Flr.Phone: (961–7) 725303 / (961 – 7) 725491e-Fax: (961-1) 886786Email: [email protected] Tyr – AbbassiehJal El Baher Main St., BLOM BANK Bldg., GF & 2nd Flr.Phone: (961–7) 741037e-Fax: (961-1) 886786Email: [email protected]
ZahleZahle Entrance, Manara Center, GFPhone: (961–8) 818640 e-Fax: (961-1) 886786Email: [email protected] Dora (Life Marketing)Dora Highway, CEBACO Center, Bloc B, 3rd Flr.Phone: (961-1) 262222e-Fax: (961-1) 886786Email: [email protected]
ZalkaZalka, Michel Murr St., AROPE Bldg.Phone: (961-1) 905777e-Fax: (961-1) 886786Email: [email protected]
*Moved to another location temporarily in 2016
Insurance Subsidiaries
Management
DONE
Annual Report 2015
BLOM BANK Group | Management & Network
Board of DirectorsMr. Fateh BEKDACHE Chairman
Mr. Amr AZHARI Vice ChairmanMr. Habib BATENJANI MemberMr. Ibrahim SHEIKH DIB MemberMr. Marwan JAROUDI MemberMr. Hassan BAALBAKI Member
Mr. Samer AZHARI MemberGeneral ManagementMr. Bachar AL HALABI General Manager
BRANCHES
AleppoAziziah, Majdduldin Al Jabiri St. Phone: (963-21) 9279Fax: (963-21) 2118800
Damascus Abou Remmaneh, Al Mahdi Ben Baraki St.Phone: (963-11) 3329010/1/2Fax: (963-11) 3348797 Latakia Al Kamliah, 8 March St. Above BANK OF SYRIA AND OVERSEASPhone: (963-41) 9279Fax: (963-41) 475223
HamaAl Alamayn St., Al Ashek Bldg., 1st Flr.Phone: (963-33) 9279Fax: (963-33) 523277 Tartous Thawra Avenue, BANK OF SYRIA AND OVERSEAS Bldg.Phone: (963-43) 9279Fax: (963-43) 230870
Homs (temporarily closed)6th District, City Mall, 1st Flr.Phone: (963-31) 9279Fax: (963-31) 2478760
Network
HEADQUARTERS (DAMASCUS)Tajheez District, Al Brazil St., Facing Omayad Hotel P.O.Box: 33015 Phone: (963-11) 9279 - 3348350 Fax: (963-11) 3348144 - 3348798 Hotline: (963-11) 9279Email: [email protected] Website: www.aropesyria.com
Management
DONE
BLOM BANK s.A.L. 212
BLOM BANK Group | Management & Network
Board of DirectorsMr. Fateh BEKDACHE ChairmanMr. Habib RAHAL MemberMr. Bachar AL HALABI MemberMr. Tarek METWALLY MemberMrs. Maya KADI MemberMr. Ahmad KHATTAB MemberMr. Rabih HALABI MemberMr. Ihab KHALIL MemberMs. Faten DOUGLAS MemberGeneral ManagementMr. Bachar EL HALABI CEO & Managing Director
Board of DirectorsMr. Fateh BEKDACHE ChairmanMr. Habib RAHAL MemberMr. Bachar AL HALABI MemberMr. Tarek METWALLY MemberMrs. Maya KADI MemberMr. Ahmad KHATTAB MemberMr. Rabih HALABI MemberMr. Ihab KHALIL MemberMr. Ali EL SISI MemberGeneral ManagementMr. Ali EL SISI Managing Director
Management
Management
AROPE Insurance for Properties and Liabilities S.A.E.
AROPE Life Insurance S.A.E.
DONE
NetworkHEADQUARTERS (CAIRO)AROPE Plaza, 30, Mesadak St., Dokki - GizaP.O.Box: 12311 - Giza Phone: (202) 33323299 Fax: (202) 33361482/3Hotline: (202) 19243 Email: [email protected] Website: www.aropeegypt.com
Insurance Agencies
Maadi4, 151 St., Maadi – CairoPhone: (202) 23802622Fax: (202) 23802631Hotline: (202) 19243 Email: [email protected]
Nasr City68, Makram Ebeid St., Nasr City – CairoPhone: (202) 26706642Fax: (202) 26706643Hotline: (202) 19243 Email: [email protected] Alexandria75, Fawzi Moaz St., Samouha – AlexandriaHotline: (202) 19243 Email: [email protected]
NetworkAROPE Insurance Egypt is present in 28 of BLOM BANK Egypt branches all over Egypt. For the list of branches and contact details, please refer to page 205-206 from this report.