1QFY16 Results Update | Sector: DCB Bank - Business...
14
15 July 2015 1QFY16 Results Update | Sector: Financials DCB Bank Alpesh Mehta ([email protected]); +91 22 3982 5415 Vallabh Kulkarni ([email protected]); +91 22 3982 5430 BSE SENSEX S&P CNX CMP: INR133 TP: INR172 (+29%) Buy 28,198 8,524 Bloomberg DCBB IN Equity Shares (m) 282.0 M.Cap. (INR b)/(USD b) 37.5/0.6 52-Week Range (INR) 151 / 76 1, 6, 12 Rel. Per (%) 2/6/55 Avg Val (INRm)/Vol ‘000 178/1,575 Free float (%) 83.7 Financials & Valuation (INR Billion) Y/E Mar 2016E 2017E 2018E NII 5.9 7.5 9.6 OP 3.6 4.6 6.1 NP 1.9 2.6 3.5 NIM (%) 3.5 3.5 3.6 EPS (INR) 6.9 9.4 12.5 EPS Gr. (%) 1.6 36.2 33.1 BV/Sh.(INR) 61.8 71.1 83.6 ROE (%) 11.8 14.1 16.1 ROA (%) 1.1 1.2 1.2 P/E(X) 19.3 14.2 10.7 P/BV (X) 2.2 1.9 1.6 Healthy core operations; trading gains compensate high tax rate DCBB reported 29% beat on PBT, aided by healthy trading gains (40% of PBT). NII and fees were in line. Higher-than-expected tax rate (~34% v/s expectation of ~22%) led to PAT beat of just 8%. Income (adjusted for interest on IT refund of INR300m in 1QFY15) growth (42% YoY) continues to outpace opex (23% YoY) growth, leading to a YoY fall in adj. cost-to-income ratio. Loan growth remains strong (+26% YoY), led by mortgages (+43% YoY), agri (+36% YoY) and CV loans (+54% YoY). Core retail deposits share remains healthy at ~81% (up from 79% in 1QFY15). GNPA increased 11% QoQ, led by a) INR100m slippage from corporate and b) INR130m slippage from gold loan portfolio (as per management, this is technical in nature). PCR, including technical write-offs, stands healthy at 72%. Other highlights: a) Trading gains were healthy at INR284m (40% of PBT) and led to non-interest income beat of 47%, b) the bank added three branches during the quarter and 23 branches during year. Valuation and view: We have increased PBT estimates by ~5% for FY16 to factor in higher trading gains. We also cut PBT estimates by 2/3% for FY17/18 to factor in marginally lower than anticipated growth. We now expect PBT CAGR of ~34% over FY15-18E and led by the increase in tax rate, PAT CAGR of ~23%. RoA (PBT) is expected to increase from 1.4% in FY15 to 1.7% in FY18E, led by strong operating leverage (opex–to-assets to decline by 40bp). DCBB is our preferred pick among small private sector banks. Reiterate Buy with a TP of INR172 (2.4x FY17E). Investors are advised to refer through disclosures made at the end of the Research Report. Motilal Oswal research is available on www.motilaloswal.com/Institutional-Equities , Bloomberg, Thomson Reuters, Factset and S&P Capital.
Transcript of 1QFY16 Results Update | Sector: DCB Bank - Business...

15 July 2015
1QFY16 Results Update | Sector: Financials
DCB Bank
Alpesh Mehta ([email protected]); +91 22 3982 5415
Vallabh Kulkarni ([email protected]); +91 22 3982 5430
BSE SENSEX S&P CNX CMP: INR133 TP: INR172 (+29%) Buy 28,198 8,524
Bloomberg DCBB IN
Equity Shares (m) 282.0
M.Cap. (INR b)/(USD b) 37.5/0.6
52-Week Range (INR) 151 / 76 1, 6, 12 Rel. Per (%) 2/6/55 Avg Val (INRm)/Vol ‘000 178/1,575 Free float (%) 83.7
Financials & Valuation (INR Billion)
Y/E Mar 2016E 2017E 2018E
NII 5.9 7.5 9.6 OP 3.6 4.6 6.1 NP 1.9 2.6 3.5 NIM (%) 3.5 3.5 3.6 EPS (INR) 6.9 9.4 12.5 EPS Gr. (%) 1.6 36.2 33.1 BV/Sh.(INR) 61.8 71.1 83.6 ROE (%) 11.8 14.1 16.1 ROA (%) 1.1 1.2 1.2 P/E(X) 19.3 14.2 10.7 P/BV (X) 2.2 1.9 1.6
Healthy core operations; trading gains compensate high tax rate DCBB reported 29% beat on PBT, aided by healthy trading gains (40% of PBT). NII
and fees were in line. Higher-than-expected tax rate (~34% v/s expectation of ~22%) led to PAT beat of just 8%. Income (adjusted for interest on IT refund of INR300m in 1QFY15) growth (42% YoY) continues to outpace opex (23% YoY) growth, leading to a YoY fall in adj. cost-to-income ratio.
Loan growth remains strong (+26% YoY), led by mortgages (+43% YoY), agri (+36% YoY) and CV loans (+54% YoY). Core retail deposits share remains healthy at ~81% (up from 79% in 1QFY15).
GNPA increased 11% QoQ, led by a) INR100m slippage from corporate and b) INR130m slippage from gold loan portfolio (as per management, this is technical in nature). PCR, including technical write-offs, stands healthy at 72%.
Other highlights: a) Trading gains were healthy at INR284m (40% of PBT) and led to non-interest income beat of 47%, b) the bank added three branches during the quarter and 23 branches during year.
Valuation and view: We have increased PBT estimates by ~5% for FY16 to factor in higher trading gains. We also cut PBT estimates by 2/3% for FY17/18 to factor in marginally lower than anticipated growth. We now expect PBT CAGR of ~34% over FY15-18E and led by the increase in tax rate, PAT CAGR of ~23%. RoA (PBT) is expected to increase from 1.4% in FY15 to 1.7% in FY18E, led by strong operating leverage (opex–to-assets to decline by 40bp). DCBB is our preferred pick among small private sector banks. Reiterate Buy with a TP of INR172 (2.4x FY17E).
Investors are advised to refer through disclosures made at the end of the Research Report.
Motilal Oswal research is available on www.motilaloswal.com/Institutional-Equities, Bloomberg, Thomson Reuters, Factset and S&P Capital.

15 July 2015 2
DCB Bank
Exhibit 1: Quarterly performance (INR m) Y/E March 1QFY16A 1QFY16E Var. (%) Comments
NII 1,404 1,396 1 NIMs up 5bp QoQ; Loan growth lower than expected; Adjusted for int. on IT refund of INR300m in 1QFY15, NII was +29% YoY % Change (Y-o-Y) 1 0
Other Income 631 430 47 Strong trading gains Net Income 2,035 1,825 11
Operating Expenses 1,138 1,098 4 Other opex (+30% YoY) higher than expectation
Operating Profit 897 728 23
% Change (Y-o-Y) 10 -11 Other Provisions 180 173 4 Inline
Profit before Tax 716 555 29 Tax Provisions 248 122 103 Tax rate higher than expected Net Profit 469 433 8 Strong operating performance; PBT beat of 29%
% Change (Y-o-Y) 5 -3
Source: MOSL, Company
Margins higher but CASA ratio soften QoQ Reported NIM increased 6bp QoQ to 3.81% mainly led by strong growth in high
yielding loans (Yield on loans up +10bp QoQ) and reduction in cost of liabilities (Cost of funds down 9bp QoQ).
CASA ratio declined ~40bp QoQ to 23% however, core retail liabilities share improved further to 80.7% (from 80% a quarter ago). Upgrade in credit rating, reduction in term deposits cost is expected to provide relief on cost of funds in ensuing quarter.
Overall retail deposits grew 29% YoY (6% QoQ) during the quarter to INR107b (81% of deposits). NRI Deposits grew 36% YoY (8% QoQ) to INR12.2b on a lower base
Asset quality largely stable QoQ; PCR declines 280bp QoQ GNPA increased 11% QoQ to INR 2.06b. In % terms GNPA stood at 1.95% (1.76%
in 4QFY15). NNPA% also increased 20bp QoQ to 1.2%. PCR declined by 280bp QoQ to 72%.
One large corporate account worth INR100m and gold loans worth INR130m slipped during the quarter. As per the management slippage in gold loans is largely technical in nature and expected to be upgraded in 2Q. 1/3rd of these gold loan slippages have been upgraded so far.
OSRL of INR490m (0.5% of loans) comprising of 7 accounts. Other highlights Loan growth was (+27% YoY) led by mortgages (+42% YoY) and AIB (+36% YoY).
Momentum in CV segment continued (+54% YoY). Share of mortgages in overall loans has increased to 45% vs. 40% a year ago (flat QoQ).
CASA ratio declined marginally to 23% from 23.4% in 4QFY15. Despite strong growth, proportion of retail deposits continues to remain higher at ~81%.
Opex grew 23% YoY (+6% QoQ) to INR1.14b vs est. of INR1.1b (4% miss). Overall adjusted income growth (42% YoY) continued to outpace opex growth (23% YoY). Adjusted cost to income ratio declined to 56% vs 64% a year ago.
Bank’s Capital Adequacy Ratio was at 14.27%; with Tier I core capital at 13.56% under Basel III.
Reported NIM increase 6bp QoQ to 3.81%
GNPA ratio ticked higher to 1.95% from 1.76% in 4Q
Loan book grew 27% YoY and flat QoQ

15 July 2015 3
DCB Bank
1QFY16 Conference Call highlights Business growth strategy Management expects loan growth of 22-25% in FY16 and plans to double
portfolio in next 36-42months SA growth of 18% YoY; Targeting to grow by 20% YoY Pricing war in corporate and SME led to drop in growth in 1QFY16; INR3-4b
corporate loans exited during the quarter and were placed by higher yielding loans
In mortgages, company is focusing on small ticket size; expanding up to Tier IV cities rather focus on only Tier I and Tier II location; LTV on an average for home loans are 75%
Proportion of LAP within mortgages is 65-70% 80-85% of CV book is PSL compliant and yield is 11.5-12% Average ticket size – AIB branches INR0.8-1m; SME INR 5-6m; Average risk
weight age 75% Average ticket size – Mortgages (30 locations) INR3-4mn; Average risk weight
age 75% Profitability related Salary increase in 1Q led to higher opex QoQ during the quarter Added 635 people – expanding on Mortgages, AIB and Operations Planning to add 25-30 branches every year; Breaking even on branches in 18-
22months Expects full tax rate hit during the year Expects NIMs to decline by 15-20bp; however management expects to maintain
NIMs above 3.6% Management expects to grow non-interest income 14-16% in FY16; Expects cost
to income ratio of 55% in next two years Asset quality related During the quarter, slippages were higher in corporate and gold loan segment.
However, 1/3rd of INR130m gold loan slippages have been recovered so far Restructured loans - INR490m (7 accounts) In case of any issues on monsoon side, problem can happen on tractor portfolio Other highlights Management is targeting to reach RoA of 1.3% and 14-14.5% RoE over next two
years Rise in RWA was led by a) drop (due to expiration of rating) in rating for
corporate and b) rise in operational risk (25bp impact) 50 branches in AIB and rest in retail 10-12% of NRI deposits are also part of CASA Digital initiatives: a) Revamping mobile banking offering b) Internet banking
getting revamped c) launch of wallet and prepaid cards d) thinking on payment bank lines with the focus on loan offering as well

15 July 2015 4
DCB Bank
Valuation and view Given its strong SME presence, expanding branch network (now 157 branches)
and healthy capitalization (tier-I ratio at ~14%), we believe DCBB is well poised to capitalize on the strong growth opportunity. Significant focus on core operating profitability, and strong growth in granular retail and niche small-ticket SME loans would drive further re-rating.
Since the management change, DCBB’s core operating parameters have improved consistently. Pre-tax RoA has increased by ~250bp. We expect this to rise further by 30bp over FY15-18, led by strong operating leverage (down 40bp).
Overall we expect PBT CAGR of ~34% over FY15-18E and RoA (PBT) to increase from 1.4% in FY15 to 1.7% in FY18E, led by strong operating leverage (opex–to-assets to decline by 40bp).
Significant focus on core operating profitability, and strong growth in granular retail and niche small-ticket SME loans and LAP would drive further re-rating.
DCBB is our preferred pick in the small private sector banks. Reiterate buy with a target price of INR172 (Residual income based model, 2.4x FY17 BV).
Exhibit 2: We reduce our earnings estimates by ~8% for FY16, ~5% for FY17 INR B Old Est. Revised Est. % Change FY16 FY17 FY17 FY16 FY17 FY17 FY16 FY17 FY18 NII 6.1 7.8 9.8 5.9 7.5 9.6 -2.9 -3.4 -1.7 Other Income 2.1 2.5 3.1 2.5 2.8 3.2 18.8 9.9 2.5 Total Income 8.2 10.3 12.9 8.4 10.3 12.8 2.6 -0.1 -0.7 Operating Expenses 4.7 5.6 6.6 4.8 5.7 6.7 2.1 2.1 2.1 Operating Profits 3.4 4.7 6.3 3.6 4.6 6.1 3.2 -2.8 -3.7 Provisions 0.7 0.9 1.1 0.7 0.8 1.0 -4.7 -5.7 -7.2 PBT 2.7 3.9 5.2 2.9 3.8 5.0 5.3 -2.1 -2.9 Tax 0.6 1.1 1.7 0.9 1.1 1.5 53.1 4.9 -9.0 PAT 2.1 2.8 3.5 1.9 2.6 3.5 -8.2 -4.8 0.0 Margins (%) 3.6 3.6 3.6 3.5 3.5 3.6 Credit Cost (%) 0.5 0.5 0.5 0.5 0.5 0.5 RoA (%) 1.2 1.2 1.2 1.1 1.2 1.2 RoE (%) 12.8 14.6 16.2 11.8 14.1 16.1
Source: MOSL
Exhibit 3: One year forward P/BV
Source: MOSL, Company
Exhibit 4: One year forward P/E
Source: MOSL, Company
16.1
47.4
17.3
6.4 5
14
23
32
41
50
Oct
-06
Sep-
07
Jul-0
8
May
-09
Apr-
10
Feb-
11
Dec
-11
Nov
-12
Sep-
13
Jul-1
4
Jun-
15
PE (x) Peak(x) Avg(x) Min(x)
Negative Earnings
Cycle 2.0
4.6
1.6
0.6 0.0
1.0
2.0
3.0
4.0
5.0
Oct
-06
Sep-
07
Jul-0
8
May
-09
Apr-
10
Feb-
11
Dec
-11
Nov
-12
Sep-
13
Jul-1
4
Jun-
15
PB (x) Peak(x) Avg(x) Min(x)
We maintain Buy with TP INR172 (2.4x FY17E BV)

15 July 2015 5
DCB Bank
Exhibit 5: DuPont Analysis: Steady improvement in core profitability; however, full tax rate to drag return ratios lower DCB Bank FY08 FY09 FY10 FY11 FY12 FY13 FY14 FY15 FY16E FY17E FY18E Net interest Income 2.71 2.92 2.35 2.79 2.83 2.85 3.04 3.50 3.24 3.27 3.32 Fee income 1.32 1.14 1.10 0.98 0.98 0.90 0.84 0.82 0.77 0.74 0.70
Fees to core income 32.7 28.0 31.9 25.9 25.7 23.9 21.5 19.0 19.23 18.37 17.43 Core Income 4.02 4.05 3.45 3.77 3.81 3.75 3.88 4.32 4.01 4.01 4.02 Operating expenses 3.71 3.58 3.32 3.18 3.04 2.76 2.64 2.73 2.64 2.48 2.32 Cost to core income 92.1 88.3 96.4 84.3 79.8 73.7 68.0 63.2 65.8 61.8 57.7
Employees 1.51 1.54 1.46 1.57 1.55 1.38 1.30 1.35 1.31 1.25 1.19 Emp cost to Opex (%) 40.8 43.1 43.8 49.4 51.0 50.1 49.2 49.4 49.6 50.5 51.3
Others 2.19 2.03 1.87 1.61 1.49 1.38 1.34 1.38 1.33 1.23 1.13 Core PPP 0.32 0.47 0.12 0.59 0.77 0.99 1.24 1.59 1.37 1.53 1.70 Non interest Income 2.70 1.78 1.77 1.65 1.25 1.17 1.15 1.14 1.35 1.21 1.10 Trading and others 1.39 0.64 0.67 0.68 0.27 0.28 0.31 0.32 0.57 0.47 0.40 Operating profits 1.71 1.11 0.80 1.27 1.04 1.26 1.55 1.91 1.95 2.00 2.10 Provisions 1.14 2.39 2.00 0.84 0.36 0.24 0.30 0.48 0.38 0.36 0.36
NPA 1.09 2.17 1.88 0.69 0.30 0.18 0.30 0.35 0.38 0.36 0.36 Others 0.05 0.22 0.13 0.15 0.06 0.06 0.00 0.13 0.00 0.00 0.00
PBT 0.56 -1.28 -1.20 0.43 0.68 1.02 1.25 1.43 1.57 1.65 1.74 Tax -0.03 0.02 0.09 0.12 0.00 0.00 0.00 0.12 0.50 0.49 0.52
Tax rate -6.1 -1.7 -7.8 26.7 0.1 0.0 0.0 8.1 32.0 30.0 30.0 ROAA (%) 0.60 -1.30 -1.30 0.32 0.68 1.02 1.25 1.32 1.07 1.15 1.22 Leverage (x) 13.6 11.6 11.2 12.3 11.8 11.4 11.8 10.9 11.09 12.25 13.24 ROAE (%) 8.13 -15.13 -14.54 3.89 8.06 11.66 14.70 14.37 11.81 14.12 16.13
Source: Company, MOSL Exhibit 6: DuPont Analysis: Stable NIMs and continued operating leverage improve core profitability YoY DuPont Analysis 4QFY13 1Q FY14 2QFY14 3QFY14 4QFY14 1QFY15 2QFY15 3QFY15 4QFY15 1QFY16 Interest Income 9.68 9.37 9.72 10.07 9.89 10.92 10.19 10.11 9.80 9.97 Inetrest Expense 6.56 6.38 6.42 6.81 6.67 6.61 6.61 6.65 6.44 6.51 NII 3.12 2.99 3.30 3.25 3.21 4.31 3.58 3.46 3.35 3.46 Other Income 1.26 1.62 0.99 1.14 1.07 1.07 1.12 1.36 1.20 1.56 Total Income 4.38 4.61 4.29 4.39 4.29 5.38 4.70 4.82 4.55 5.02 Operating Expense 2.74 2.76 2.84 2.78 2.68 2.86 2.88 2.88 2.79 2.81 Employee Expense 1.37 1.35 1.40 1.37 1.32 1.44 1.44 1.40 1.37 1.42 Other Expense 1.36 1.41 1.43 1.42 1.36 1.42 1.44 1.48 1.42 1.39 Pre-provisioning Profit 1.65 1.84 1.45 1.60 1.61 2.52 1.82 1.94 1.76 2.21 Provisions 0.34 0.31 0.25 0.35 0.35 0.71 0.42 0.52 0.37 0.44 PBT 1.31 1.54 1.20 1.26 1.26 1.81 1.40 1.42 1.39 1.77 Tax 0.00 0.00 0.00 0.00 0.00 0.42 0.15 0.21 -0.24 0.61 RoA 1.31 1.54 1.20 1.26 1.26 1.39 1.25 1.20 1.63 1.16 Leverage (x) 10.61 10.87 10.41 10.54 10.98 10.97 10.80 10.23 9.94 10.05 RoE 13.86 16.72 12.46 13.26 13.79 15.21 13.51 12.33 16.18 11.62
Source: Company, MOSL

15 July 2015 6
DCB Bank
Story in charts Exhibit 7: Loan growth driven by Mortgage and Agri business
Source: MOSL, Company
Exhibit 8: Share of mortgages up ~500 YoY to 45% (+40% YoY)
Source: MOSL, Company
Exhibit 9: Share of retail deposits improved ~210bp YoY
Source: MOSL, Company
Exhibit 10: CASA ratio declines further; Branch expansion to aid growth (%)
Source: MOSL, Company
Exhibit 11: Deposits growth in-line with loan book growth
Source: MOSL, Company
Exhibit 12: GNPAs increase on account higher than expected slippages in gold and corporate loans
Source: MOSL, Company
42
43
43
53
54
57
60
66
65
67
74
81
83
88
95
105
104
22 12 9
24 29 31
39
25 19 18 23 24
28 32 29 29 26
1QFY
12
1HFY
12
9MFY
12
FY12
1QFY
13
1HFY
13
9MFY
13
FY13
1QFY
14
1HFY
14
9MFY
14
FY14
1QFY
15
1HFY
15
9MFY
15
FY15
1QFY
16
Loan (INR b) Growth YoY %
36 40 41 39 38 40 42 43 43 45 2 2 4 3 3 3 3 3 1 0 23 22 20 19 16 16 15 14 13 12
12 12 9 12 14 14 13 13 15 16 24 21 23 24 26 24 24 24 23 21
FY13
1QFY
14
1HFY
14
9MFY
14
FY14
1QFY
15
1HFY
15
9MFY
15
FY15
1QFY
16
Mortgages CV/CE/STVL PL Gold Loan Others SME/MSME AIB Corporate
81.
95
80.
8
82.
9
84.
4
82.
7
83.
2
83.
0
77.
4
79.
5
79.
0
76.
8
76.
9
78.
8
82.
8
81.
5
80.
0
80.
7
20 17 15 17 15 17
22 21 17 17 17
23 26
30
31 27 29
1QFY
12
1HFY
12
9MFY
12
FY12
1QFY
13
1HFY
13
9MFY
13
FY13
1QFY
14
1HFY
14
9MFY
14
FY14
1QFY
15
1HFY
15
9MFY
15
FY15
1QFY
16
Retail dep share (%) Retail Deposit gr 33
.3
33.2
33.1
32.1
30.3
30.4
28.9
27.2
27.5
26.9
26.9
25.0
25.4
25.5
23.8
23.4
23.0
1QFY
12
1HFY
12
9MFY
12
FY12
1QFY
13
1HFY
13
9MFY
13
FY13
1QFY
14
1HFY
14
9MFY
14
FY14
1QFY
15
1HFY
15
9MFY
15
FY15
1QFY
16
60
63
62
63
68
71
76
84
83
88
96
103
106
109
118
126
133
17 14 10
13 14 14
22
32
22 23
27 23
27 24 24 22 26
1QFY
12
1HFY
12
9MFY
12
FY12
1QFY
13
1HFY
13
9MFY
13
FY13
1QFY
14
1HFY
14
9MFY
14
FY14
1QFY
15
1HFY
15
9MFY
15
FY15
1QFY
16
Deposit (INR b) Growth YoY %
5.0
5.8
5.7
4.4
4.2
3.9
3.8
3.2
3.4
3.4
2.8
1.7
1.8
1.9
1.9
1.8
2.0
1.2
1.0
1.0
0.6
0.8
0.7
0.7
0.8
0.8
0.9
0.8
0.9
1.0
1.1
1.0
1.0
1.2
86 88 87 91 89 90 88 86 89 84 84 81 79 77 77 75 72
1QFY
12
2QFY
12
3QFY
12
4QFY
12
1QFY
13
2QFY
13
3QFY
13
4QFY
13
1QFY
14
2QFY
14
3QFY
14
4QFY
14
1QFY
15
2QFY
15
3QFY
15
4QFY
15
1QFY
16
Gross NPA% Net NPA % PCR %

15 July 2015 7
DCB Bank
Story in charts continued…
Exhibit 13: Reported NIM improved 6bp QoQ (%)
Source: MOSL, Company
Exhibit 14: Fee income growth in-line with loan growth
Source: MOSL, Company
Exhibit 15: Opex growth outpace revenue growth since FY12
Source: MOSL, Company
Exhibit 16: Effective tax rate was higher due to run down of past year losses. Expect full tax rate effective FY16
Source: MOSL, Company
Exhibit 17: Cost to Income ratio moderates on QoQ basis (%)
Source: MOSL, Company
Exhibit 18: Confidence on growth increasing; Adding capacity
Source: MOSL, Company
3.1
3.4 3.4
3.1 3.2 3.2 3.4
3.5 3.4
3.7 3.6 3.6
3.7 3.7 3.7 3.8 3.8
1QFY
12
2QFY
12
3QFY
12
4QFY
12
1QFY
13
2QFY
13
3QFY
13
4QFY
13
1QFY
14
2QFY
14
3QFY
14
4QFY
14
1QFY
15
2QFY
15
3QFY
15
4QFY
15
1QFY
16
201
206
244
261
229
235
248
283
256
247
297
300
269
315
340
368
339
1.1 1.1 1.2 1.2
1.0 1.0 1.0 1.1 0.9 0.9
1.0 1.0 0.8
1.0 1.0 1.0 0.8
1QFY
12
2QFY
12
3QFY
12
4QFY
12
1QFY
13
2QFY
13
3QFY
13
4QFY
13
1QFY
14
2QFY
14
3QFY
14
4QFY
14
1QFY
15
2QFY
15
3QFY
15
4QFY
15
1QFY
16
Fee Income (INR m) Fee Income to avg assets (%)
3
12 14 7
21 15 17
35 40
25 26
16
35 30
34 32
17 16
17 16 7
13 11 9
17 15 15 16 16 20 21
26 30
23
1QFY
12
2QFY
12
3QFY
12
4QFY
12
1QFY
13
2QFY
13
3QFY
13
4QFY
13
1QFY
14
2QFY
14
3QFY
14
4QFY
14
1QFY
15
2QFY
15
3QFY
15
4QFY
15
1QFY
16
Total Income Growth (%) Opex Growth (%)
0 0 0
0
0 0 0 0 0 0 0 0
23
11 15
-17
35
1QFY
12
2QFY
12
3QFY
12
4QFY
12
1QFY
13
2QFY
13
3QFY
13
4QFY
13
1QFY
14
2QFY
14
3QFY
14
4QFY
14
1QFY
15
2QFY
15
3QFY
15
4QFY
15
1QFY
16
Tax rate (%)
78.
1
74.
6
73.
8
71.
9
72.
8
72.
0
68.
5
62.
4
60.
0 66.
2
63.
4
62.
4
53.
1 6
1.3
59.
8
61.
4
55.
9
1QFY
12
2QFY
12
3QFY
12
4QFY
12
1QFY
13
2QFY
13
3QFY
13
4QFY
13
1QFY
14
2QFY
14
3QFY
14
4QFY
14
1QFY
15
2QFY
15
3QFY
15
4QFY
15
1QFY
16
82
82
82
84
86
87
89
94
101
103
115
130
134
142
145
154
157
138
140
271 32
0
331
331
296
272
260
251
237
238
236
252 29
2 328
343
1QFY
12
2QFY
12
3QFY
12
4QFY
12
1QFY
13
2QFY
13
3QFY
13
4QFY
13
1QFY
14
2QFY
14
3QFY
14
4QFY
14
1QFY
15
2QFY
15
3QFY
15
4QFY
15
1QFY
16
Branches ATMs

15 July 2015 8
DCB Bank
Exhibit 19: Quarterly Snapshot FY14 FY15 FY16 Variation (%) 1Q 2Q 3Q 4Q 1Q 2Q 3Q 4Q 1Q QoQ YoY Profit and Loss (INR m) Interest Income 2,607 2,688 2,908 3,079 3,523 3,349 3,565 3,788 4,043 7 15 Loans 2,015 2,052 2,223 2,389 2,539 2,644 2,814 2,986 3,208 7 26 Investment 567 579 635 672 656 638 741 791 825 4 26 Others 25 57 50 18 328 67 10 12 11 -8 -97 Interest Expenses 1,776 1,776 1,968 2,078 2,132 2,172 2,346 2,492 2,639 6 24 Net Interest Income 831 913 940 1,000 1,391 1,177 1,219 1,297 1,404 8 1 Other Income 451 273 328 334 345 370 480 463 631 36 83 Treasury 160 9 21 26 43 40 126 68 284 318 560 Exchange Profits 22 -5 18 22 12 15 27 22 31 41 158 Recovery 35 17 10 8 33 15 14 27 8 -69 -75
CEB 224 240 267 280 260 309 307 336 299 -11 15 Others 10 12 12 -2 -3 -9 6 10 9 -10 -400 Total Income 1,282 1,185 1,268 1,335 1,736 1,546 1,699 1,759 2,035 16 17 Operating Expenses 769 784 805 833 922 948 1,015 1,079 1,138 5 23 Employee 377 388 395 411 463 474 495 529 576 9 24 Others 392 396 410 422 459 474 520 551 563 2 22 Operating Profits 513 401 464 502 813 598 684 680 897 32 10 Provisions 85 70 100 110 229 137 184 143 180 26 -21 PBT 428 331 364 391 584 461 499 537 716 33 23 Taxes 0 0 0 0 137 50 74 -93 248 N.A 81 PAT 428 331 364 391 447 411 425 629 469 -26 5 Asset Quality GNPA 2,264 2,351 2,079 1,385 1,492 1,688 1,792 1,861 2,064 11 38 NNPA 543 572 570 741 805 943 952 1,057 1,270 20 58 GNPA (%) 3.4 3.4 2.8 1.7 1.8 1.9 1.9 1.8 2.0 19 17 NNPA (%) 0.8 0.9 0.8 0.9 1.0 1.1 1.0 1.0 1.2 21 25 PCR (Calculated, %) 76.0 75.7 72.6 46.5 46.1 44.1 46.9 43.2 38.5 -474 -762 Ratios (%) CASA (Reported) 27.5 26.9 26.9 25.0 25.4 25.5 23.8 23.4 23.0 Loan/Deposit 77.8 76.0 76.7 78.8 78.6 80.7 80.1 83.0 78.6 -443 -1 CAR 13.9 13.9 12.9 13.7 13.6 13.0 14.4 15.0 14.3 RoA (Reported) 1.5 1.2 1.3 1.3 1.4 1.2 1.2 1.6 1.2 RoE (Reported) 16.7 12.5 13.3 13.8 15.2 13.5 12.3 16.2 11.6 Margins (%) - Reported Yield on loans 12.7 12.7 13.0 12.9 12.8 12.6 12.5 12.6 12.7 10 -12 Cost of deposits 7.8 7.6 7.9 7.9 7.8 7.7 7.8 7.9 7.8 -9 -2 Margins 3.4 3.7 3.6 3.6 3.7 3.7 3.7 3.8 3.8 6 10 Balance Sheet (INR B) Loans 65 67 74 81 83 88 95 105 104 0 26 Investments 32 33 36 36 35 33 40 45 45 2 28 Deposits 83 88 96 103 106 109 118 126 133 5 26 CASA Deposits 23 24 24 26 27 28 28 30 31 4 14 Borrowings 12 8 8 9 6 7 7 12 6 -49 0 Total Assets 110 111 120 129 129 134 148 161 163 1 27 Franchise Branches 101 103 115 130 134 142 145 154 157 ATM 260 251 237 238 236 252 292 328 343
Source: MOSL, Company

15 July 2015 9
DCB Bank
Exhibit 20: Financials: Valuation metrics 63.7 Rating CMP Mcap EPS (INR) P/E (x) BV (INR) P/BV (x) RoA (%) RoE (%) Dividend
(INR) (USDb) FY16 FY17 FY16 FY17 FY16 FY17 FY16 FY17 FY16 FY17 FY16 FY17 Yield (%) #
ICICIBC* Buy 315 28.6 22.9 27.4 11.0 8.9 131 151 1.92 1.61 1.72 1.78 16.3 17.2 1.6
HDFCB Buy 1,097 43.2 51.2 64.0 21.4 17.1 287 336 3.83 3.27 1.97 2.02 19.2 20.6 0.7
AXSB Buy 585 21.8 37.2 43.2 15.7 13.5 218 254 2.68 2.30 1.75 1.69 18.2 18.2 0.8
KMB* Neutral 713 20.4 23.6 29.2 30.1 24.4 188 216 3.80 3.30 1.51 1.60 13.9 14.5 0.1
YES Buy 805 5.3 60.6 77.2 13.3 10.4 328 389 2.45 2.07 1.66 1.71 19.9 21.5 1.1
IIB Buy 926 8.4 41.8 52.1 22.1 17.8 287 332 3.23 2.79 2.03 2.09 18.0 16.8 0.4
DCBB Buy 133 0.6 6.9 9.4 19.3 14.2 62 71 2.16 1.87 1.07 1.15 11.8 14.1 0.0
FB Buy 78 2.1 6.4 7.8 12.1 10.0 50 56 1.55 1.38 1.21 1.22 13.4 14.6 1.4
JKBK Neutral 106 0.8 13.1 18.0 8.1 5.9 136 150 0.78 0.71 0.79 0.97 10.0 12.6 2.0
SIB Buy 25 0.5 3.7 4.7 7.0 5.5 29 33 0.88 0.78 0.78 0.86 13.3 15.2 2.2
Private Aggregate 131.7 18.5 15.2 2.89 2.52
SBIN (cons)* Buy 268 31.4 28.0 34.9 9.2 7.3 230 258 1.11 0.99 0.72 0.80 12.2 13.9 1.2
PNB Buy 144 4.2 23.2 32.3 6.2 4.4 219 247 0.66 0.58 0.67 0.82 11.0 13.9 2.3
BOI Neutral 179 1.9 33.8 47.4 5.3 3.8 421 459 0.42 0.39 0.35 0.43 8.3 10.8 2.8
BOB Neutral 156 1.1 21.9 29.2 7.1 5.4 184 206 0.85 0.76 0.66 0.78 12.5 15.0 2.0
UNBK Buy 172 1.7 37.4 47.6 4.6 3.6 319 358 0.54 0.48 0.58 0.65 12.4 14.1 3.5
INBK Buy 138 1.0 25.7 33.1 5.4 4.2 284 310 0.48 0.44 0.58 0.65 9.2 11.1 3.1
CRPBK Neutral 52 0.1 16.5 21.9 3.1 2.4 141 158 0.37 0.33 0.54 0.64 12.3 14.7 3.1
ANDB Buy 72 0.7 20.6 25.5 3.5 2.8 170 188 0.43 0.38 0.62 0.66 12.2 14.2 2.8
IDBI Neutral 65 1.6 14.4 19.7 4.5 3.3 157 173 0.41 0.38 0.58 0.69 9.5 11.9 2.4
DBNK Neutral 44 0.4 9.7 13.6 4.6 3.3 130 141 0.34 0.32 0.36 0.44 7.7 10.0 2.5
Public Aggregate 44.1 7.8 6.0 0.80 0.72
HDFC* Buy 1,341 33.1 37 44 24.1 18.4 169 194 5.32 4.21 2.52 2.55 23.5 23.6 1.1 LICHF Buy 458 3.6 33 39 13.9 11.7 181 213 2.52 2.15 1.45 1.43 19.6 19.8 1.1 DEWH Buy 448 1.0 53 68 8.5 6.6 358 410 1.25 1.09 1.28 1.32 15.7 17.6 1.5
IHFL Buy 635 3.7 63 77 10.1 8.3 213 248 2.98 2.56 3.90 3.87 31.9 33.3 5.5
IDFC Buy 156 3.9 13 14 12.4 10.8 109 120 1.17 1.05 2.20 2.19 11.5 12.0 1.6
RECL Buy 281 4.4 62 74 4.6 3.8 300 357 0.93 0.79 3.13 3.16 22.2 22.5 3.8
POWF Buy 259 5.4 54 62 4.8 4.2 285 330 0.91 0.79 3.06 3.12 20.3 20.2 3.5
SHTF Buy 887 3.2 68 84 13.1 10.6 462 528 1.92 1.68 2.27 2.56 15.3 16.9 1.1
MMFS Buy 282 2.5 17 20 16.8 14.1 113 127 2.50 2.22 2.60 2.67 15.7 16.6 1.4
BAF Buy 5,150 4.3 215 268 23.9 19.2 1,344 1,568 3.83 3.28 3.05 2.95 19.2 18.4 0.7
NBFC Aggregate 64.0 15.8 13.4 2.83 2.47
*Multiples adj. for value of key ventures/Investments; For ICICI Bank and HDFC Ltd BV is adjusted for investments in subsidiaries

15 July 2015 10
DCB Bank
Financials and valuations
Income Statement (INR Million) Y/E March 2010 2011 2012 2013 2014 2015 2016E 2017E 2018E Interest Income 4,594 5,363 7,170 9,161 11,283 14,224 17,435 21,261 26,461 Interest Expense 3,174 3,471 4,893 6,317 7,599 9,142 11,522 13,753 16,857 Net Interest Income 1,420 1,891 2,277 2,844 3,684 5,082 5,912 7,508 9,604 Change (%) -28.0 33.2 20.4 24.9 29.5 38.0 16.3 27.0 27.9 Non Interest Income 1,071 1,121 1,004 1,170 1,387 1,657 2,455 2,773 3,180 Net Income 2,491 3,012 3,281 4,014 5,071 6,739 8,368 10,280 12,784 Change (%) -21.5 20.9 8.9 22.3 26.3 32.9 24.2 22.9 24.3 Operating Expenses 2,008 2,152 2,443 2,753 3,191 3,965 4,817 5,684 6,708 Pre Provision Profits 483 861 838 1,261 1,880 2,774 3,551 4,597 6,076 Change (%) -35.9 78.3 -2.6 50.5 49.0 47.6 28.0 29.5 32.2 Provisions (excl tax) 1,210 568 287 241 366 694 693 818 1,047 PBT -727 293 551 1,021 1,514 2,080 2,857 3,779 5,029 Tax 57 78 0 0 0 168 914 1,134 1,509 Tax Rate (%) -7.8 26.7 0.1 0.0 0.0 8.1 32.0 30.0 30.0 PAT -785 214 551 1,021 1,514 1,912 1,943 2,646 3,521 Change (%) -10.9 -127.3 157.0 85.4 48.3 26.3 1.6 36.2 33.1 Core PPP* 307 597 739 1,086 1,609 2,408 2,651 3,697 5,151 Change (%) -55.2 94.3 23.7 47.1 48.1 49.7 10.1 39.5 39.3 *Core PPP is (NII+Fee income-Opex) Balance Sheet (INR Million) Y/E March 2010 2011 2012 2013 2014 2015 2016E 2017E 2018E Equity Share Capital 2,000 2,002 2,407 2,501 2,503 2,820 2,820 2,820 2,820 Reserves & Surplus 3,990 4,185 6,179 7,499 9,007 13,034 14,976 17,622 21,142 Net Worth 5,990 6,187 8,585 10,000 11,510 15,854 17,796 20,442 23,962 Deposits 47,873 56,102 63,356 83,638 103,252 126,091 162,658 208,202 266,498 Change (%) 3.0 17.2 12.9 32.0 23.5 22.1 29.0 28.0 28.0 of which CASA Dep 16,928 19,755 20,347 22,716 25,813 29,501 34,878 42,070 50,757 Change (%) 17.5 16.7 3.0 11.6 13.6 14.3 18.2 20.6 20.7 Borrowings 5,056 8,635 11,263 15,286 8,631 11,670 14,057 16,879 20,226 Other Liabilities & Prov. 2,447 3,205 3,565 3,863 5,839 7,708 8,864 10,194 11,723 Total Liabilities 61,367 74,129 86,768 112,788 129,231 161,323 203,375 255,718 322,410 Current Assets 3,323 4,871 4,566 8,833 6,896 7,192 12,868 16,152 20,828 Investments 20,179 22,950 25,178 33,587 36,342 44,706 54,541 66,540 81,179 Change (%) 24.4 13.7 9.7 33.4 8.2 23.0 22.0 22.0 22.0 Loans 34,597 42,817 52,844 65,861 81,402 104,651 130,813 167,441 214,324 Change (%) 5.7 23.8 23.4 24.6 23.6 28.6 25.0 28.0 28.0 Fixed Assets 1,358 1,275 1,846 2,394 2,386 2,367 2,383 2,399 2,416 Other Assets 1,909 2,215 2,335 2,114 2,205 2,408 2,770 3,185 3,663 Total Assets 61,367 74,129 86,768 112,788 129,231 161,323 203,375 255,718 322,410 ASSET QUALITY GNPA (INR M) 3,192 2,636 2,418 2,150 1,385 1,861 2,438 3,092 4,035 NNPA (INR M) 1,076 412 302 491 740 1,057 1,426 1,759 2,193 GNPA Ratio 8.7 5.9 4.4 3.2 1.7 1.8 1.8 1.8 1.9 NNPA Ratio 3.1 1.0 0.6 0.7 0.9 1.0 1.1 1.1 1.0 PCR (Excl Tech. write off) 66.3 84.4 87.5 77.1 46.5 43.2 41.5 43.1 45.7 E: MOSL Estimates

15 July 2015 11
DCB Bank
Financials and valuations
Ratios Y/E March 2010 2011 2012 2013 2014 2015 2016E 2017E 2018E Spreads Analysis (%) Avg. Yield-Earning Assets 8.5 8.8 9.9 10.0 10.1 10.5 10.3 10.0 9.8 Avg. Yield on loans 10.7 10.4 11.2 12.0 11.8 11.8 11.7 11.3 11.1 Avg. Yield on Investments 5.2 6.1 7.2 6.7 7.0 7.0 7.2 6.9 6.9 Avg. Cost-Int. Bear. Liab. 6.1 5.9 7.0 7.3 7.2 7.3 7.3 6.8 6.6 Avg. Cost of Deposits 6.0 5.6 6.8 7.3 7.1 7.3 7.4 6.9 6.7 Interest Spread 2.4 2.9 2.9 2.7 2.9 3.2 3.0 3.1 3.2 Net Interest Margin 2.6 3.1 3.1 3.1 3.3 3.77 3.49 3.52 3.6 Profitability Ratios (%) RoE -14.5 3.9 8.1 11.7 14.7 14.4 11.8 14.1 16.1 RoA -1.3 0.3 0.7 1.0 1.3 1.3 1.1 1.2 1.2 Int. Expense/Int.Income 69.1 64.7 68.2 69.0 67.3 64.3 66.1 64.7 63.7 Fee Income/Net Income 93.0 91.3 97.0 95.6 94.7 94.6 89.2 91.2 92.8 Non Int. Inc./Net Income 43.0 37.2 30.6 29.2 27.3 24.6 29.3 27.0 24.9 Efficiency Ratios (%) Cost/Income* 86.8 78.0 77.2 71.0 65.8 61.4 63.7 60.0 56.0 Empl. Cost/Op. Exps. 43.8 49.4 51.0 50.1 49.2 49.4 49.6 50.5 51.3 Busi. per Empl. (INR m) 67.6 55.1 68.3 78.1 79.4 77.6 93.3 113.6 138.5 NP per Empl. (INR lac) -4.9 1.0 2.7 4.6 5.6 5.7 5.5 7.2 9.3 * ex treasury Asset-Liability Profile (%) Loans/Deposit Ratio 72.3 76.3 83.4 78.7 78.8 83.0 80.4 80.4 80.4 CASA Ratio 35.4 35.2 32.1 27.2 25.0 23.4 21.4 20.2 19.0 Investment/Deposit Ratio 33.0 31.2 31.9 29.1 27.2 27.6 25.0 24.0 24.0 G-Sec/Investment Ratio 78.2 76.3 80.3 72.4 77.2 77.7 74.6 75.1 78.8 CAR 14.9 13.3 15.4 13.6 13.7 15.0 13.2 11.6 10.7 Tier 1 11.9 11.1 13.8 12.6 12.9 14.2 12.5 11.4 10.5 Valuations Book Value (INR) 27.0 28.1 33.4 37.8 44.5 54.9 61.8 71.1 83.6 Change (%) -12.5 4.0 18.8 13.3 17.5 23.4 12.6 15.2 17.5 Price-BV (x) 4.9 4.7 4.0 3.5 3.0 2.4 2.2 1.9 1.6 Adjusted BV (INR) 23.3 26.7 32.5 36.5 42.4 52.3 58.2 66.8 78.2 Price-ABV (x) 5.7 5.0 4.1 3.7 3.1 2.5 2.3 2.0 1.7 EPS (INR) -3.9 1.1 2.3 4.1 6.0 6.8 6.9 9.4 12.5 Change (%) NM NM 113.7 78.4 48.2 12.1 1.6 36.2 33.1 Price-Earnings (x) -33.9 124.3 58.2 32.6 22.0 19.6 19.3 14.2 10.7 Dividend Per Share (INR) 0.0 0.0 0.0 0.0 0.0 0.0 0.0 0.0 0.0 Dividend Yield (%) 0.0 0.0 0.0 0.0 0.0 0.0 0.0 0.0 0.0 E: MOSL Estimates
15 July 2015 12
DCB Bank
Corporate profile
Exhibit 22: Shareholding pattern (%) Jun-15 Mar-15 Jun-14
Promoter 16.3 16.4 18.5
DII 24.4 23.5 14.6
FII 14.8 14.7 14.5
Others 44.5 45.5 52.5
Note: FII Includes depository receipts
Exhibit 23: Top holders
Holder Name % Holding
Tano Mauritius India Fvci Ii 4.7
Pi Opportunities Fund - I 2.8
Ambit Corporate Finance Pvt. Ltd. 2.6
Dsp Blackrock Micro Cap Fund 2.3 Wcp Holdings Iii 2.1 Sundaram Mutual Fund A/C Sundaram
1.9
Exhibit 24: Top management
Name Designation
Murali Natrajan MD & CEO
Bharat Sampat CFO
Sukesh Bhowal Head - Mortgages
Praveen Kutty Head - Retail & SME Banking
Atal Agarwal Head - Corporate Banking
Exhibit 25: Directors
Name Name
Nasser Munjee Amin Manekia*
Murali M Natrajan Jamal Pradhan*
S Sridhar* Suhail Nathani*
Nalin Shah* Imran Contractor*
Keki Elavia* Rupa Devi Singh
C Narasimhan* Shaffiq Dharamshi
Altaf Jiwani*
*Independent
Exhibit 26: Auditors
Name Type
BSR & Co LLP Statutory
Exhibit 27: MOSL forecast v/s consensus
EPS (INR) MOSL
forecast
Consensus
forecast Variation (%)
FY16 6.9 7.6 -9.1
FY17 9.4 9.8 -3.7
FY18 12.5 12.3 1.4
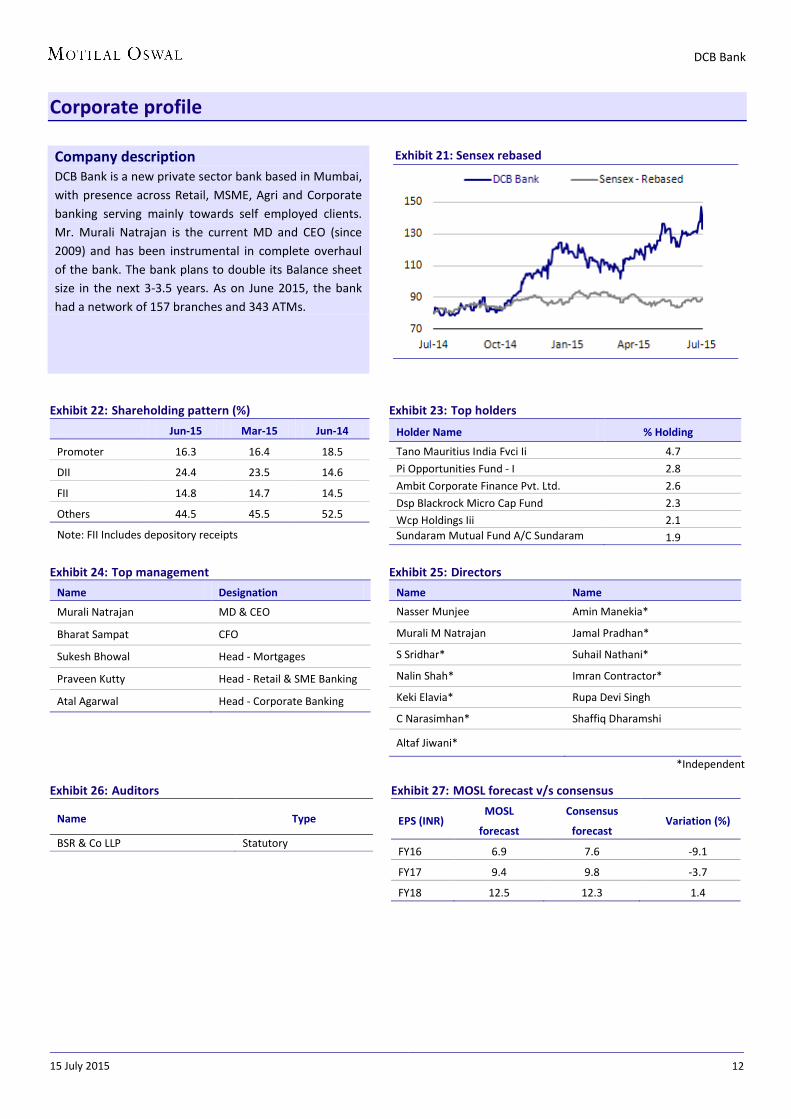
Company description DCB Bank is a new private sector bank based in Mumbai, with presence across Retail, MSME, Agri and Corporate banking serving mainly towards self employed clients. Mr. Murali Natrajan is the current MD and CEO (since 2009) and has been instrumental in complete overhaul of the bank. The bank plans to double its Balance sheet size in the next 3-3.5 years. As on June 2015, the bank had a network of 157 branches and 343 ATMs.
Exhibit 21: Sensex rebased

15 July 2015 13
DCB Bank
N O T E S

15 July 2015 14
DCB Bank
Disclosures This document has been prepared by Motilal Oswal Securities Limited (hereinafter referred to as Most) to provide information about the company(ies) and/sector(s), if any, covered in the report and may be distributed by it and/or its affiliated company(ies). This report is for personal information of the selected recipient/s and does not construe to be any investment, legal or taxation advice to you. This research report does not constitute an offer, invitation or inducement to invest in securities or other investments and Motilal Oswal Securities Limited (hereinafter referred as MOSt) is not soliciting any action based upon it. This report is not for public distribution and has been furnished to you solely for your general information and should not be reproduced or redistributed to any other person in any form. This report does not constitute a personal recommendation or take into account the particular investment objectives, financial situations, or needs of individual clients. Before acting on any advice or recommendation in this material, investors should consider whether it is suitable for their particular circumstances and, if necessary, seek professional advice. The price and value of the investments referred to in this material and the income from them may go down as well as up, and investors may realize losses on any investments. Past performance is not a guide for future performance, future returns are not guaranteed and a loss of original capital may occur.
MOSt and its affiliates are a full-service, integrated investment banking, investment management, brokerage and financing group. We and our affiliates have investment banking and other business relationships with a some companies covered by our Research Department. Our research professionals may provide input into our investment banking and other business selection processes. Investors should assume that MOSt and/or its affiliates are seeking or will seek investment banking or other business from the company or companies that are the subject of this material and that the research professionals who were involved in preparing this material may educate investors on investments in such business. The research professionals responsible for the preparation of this document may interact with trading desk personnel, sales personnel and other parties for the purpose of gathering, applying and interpreting information. Our research professionals are paid on the profitability of MOSt which may include earnings from investment banking and other business.
MOSt generally prohibits its analysts, persons reporting to analysts, and members of their households from maintaining a financial interest in the securities or derivatives of any companies that the analysts cover. Additionally, MOSt generally prohibits its analysts and persons reporting to analysts from serving as an officer, director, or advisory board member of any companies that the analysts cover. Our salespeople, traders, and other professionals or affiliates may provide oral or written market commentary or trading strategies to our clients that reflect opinions that are contrary to the opinions expressed herein, and our proprietary trading and investing businesses may make investment decisions that are inconsistent with the recommendations expressed herein. In reviewing these materials, you should be aware that any or all of the foregoing among other things, may give rise to real or potential conflicts of interest. MOSt and its affiliated company(ies), their directors and employees and their relatives may; (a) from time to time, have a long or short position in, act as principal in, and buy or sell the securities or derivatives thereof of companies mentioned herein. (b) be engaged in any other transaction involving such securities and earn brokerage or other compensation or act as a market maker in the financial instruments of the company(ies) discussed herein or act as an advisor or lender/borrower to such company(ies) or may have any other potential conflict of interests with respect to any recommendation and other related information and opinions.; however the same shall have no bearing whatsoever on the specific recommendations made by the analyst(s), as the recommendations made by the analyst(s) are completely independent of the views of the affiliates of MOSt even though there might exist an inherent conflict of interest in some of the stocks mentioned in the research report Reports based on technical and derivative analysis center on studying charts company's price movement, outstanding positions and trading volume, as opposed to focusing on a company's fundamentals and, as such, may not match with a report on a company's fundamental analysis. In addition MOST has different business segments / Divisions with independent research separated by Chinese walls catering to different set of customers having various objectives, risk profiles, investment horizon, etc, and therefore may at times have different contrary views on stocks sectors and markets.
Unauthorized disclosure, use, dissemination or copying (either whole or partial) of this information, is prohibited. The person accessing this information specifically agrees to exempt MOSt or any of its affiliates or employees from, any and all responsibility/liability arising from such misuse and agrees not to hold MOSt or any of its affiliates or employees responsible for any such misuse and further agrees to hold MOSt or any of its affiliates or employees free and harmless from all losses, costs, damages, expenses that may be suffered by the person accessing this information due to any errors and delays. The information contained herein is based on publicly available data or other sources believed to be reliable. Any statements contained in this report attributed to a third party represent MOSt’s interpretation of the data, information and/or opinions provided by that third party either publicly or through a subscription service, and such use and interpretation have not been reviewed by the third party. This Report is not intended to be a complete statement or summary of the securities, markets or developments referred to in the document. While we would endeavor to update the information herein on reasonable basis, MOSt and/or its affiliates are under no obligation to update the information. Also there may be regulatory, compliance, or other reasons that may prevent MOSt and/or its affiliates from doing so. MOSt or any of its affiliates or employees shall not be in any way responsible and liable for any loss or damage that may arise to any person from any inadvertent error in the information contained in this report. MOSt or any of its affiliates or employees do not provide, at any time, any express or implied warranty of any kind, regarding any matter pertaining to this report, including without limitation the implied warranties of merchantability, fitness for a particular purpose, and non-infringement. The recipients of this report should rely on their own investigations.
This report is intended for distribution to institutional investors. Recipients who are not institutional investors should seek advice of their independent financial advisor prior to taking any investment decision based on this report or for any necessary explanation of its contents.
Most and it’s associates may have managed or co-managed public offering of securities, may have received compensation for investment banking or merchant banking or brokerage services, may have received any compensation for products or services other than investment banking or merchant banking or brokerage services from the subject company in the past 12 months. Most and it’s associates have not received any compensation or other benefits from the subject company or third party in connection with the research report. Subject Company may have been a client of Most or its associates during twelve months preceding the date of distribution of the research report
MOSt and/or its affiliates and/or employees may have interests/positions, financial or otherwise of over 1 % at the end of the month immediately preceding the date of publication of the research in the securities mentioned in this report. To enhance transparency, MOSt has incorporated a Disclosure of Interest Statement in this document. This should, however, not be treated as endorsement of the views expressed in the report.
Motilal Oswal Securities Limited is registered as a Research Analyst under SEBI (Research Analyst) Regulations, 2014. SEBI Reg. No. INH000000412
There are no material disciplinary action that been taken by any regulatory authority impacting equity research analysis activities
Analyst Certification The views expressed in this research report accurately reflect the personal views of the analyst(s) about the subject securities or issues, and no part of the compensation of the research analyst(s) was, is, or will be directly or indirectly related to the specific recommendations and views expressed by research analyst(s) in this report. The research analysts, strategists, or research associates principally responsible for preparation of MOSt research receive compensation based upon various factors, including quality of research, investor client feedback, stock picking, competitive factors and firm revenues
Disclosure of Interest Statement DCB BANK Analyst ownership of the stock No Served as an officer, director or employee No
A graph of daily closing prices of securities is available at www.nseindia.com and http://economictimes.indiatimes.com/markets/stocks/stock-quotes
Regional Disclosures (outside India) This report is not directed or intended for distribution to or use by any person or entity resident in a state, country or any jurisdiction, where such distribution, publication, availability or use would be contrary to law, regulation or which would subject MOSt & its group companies to registration or licensing requirements within such jurisdictions.
For U.S. Motilal Oswal Securities Limited (MOSL) is not a registered broker - dealer under the U.S. Securities Exchange Act of 1934, as amended (the"1934 act") and under applicable state laws in the United States. In addition MOSL is not a registered investment adviser under the U.S. Investment Advisers Act of 1940, as amended (the "Advisers Act" and together with the 1934 Act, the "Acts), and under applicable state laws in the United States. Accordingly, in the absence of specific exemption under the Acts, any brokerage and investment services provided by MOSL, including the products and services described herein are not available to or intended for U.S. persons.
This report is intended for distribution only to "Major Institutional Investors" as defined by Rule 15a-6(b)(4) of the Exchange Act and interpretations thereof by SEC (henceforth referred to as "major institutional investors"). This document must not be acted on or relied on by persons who are not major institutional investors. Any investment or investment activity to which this document relates is only available to major institutional investors and will be engaged in only with major institutional investors. In reliance on the exemption from registration provided by Rule 15a-6 of the U.S. Securities Exchange Act of 1934, as amended (the "Exchange Act") and interpretations thereof by the U.S. Securities and Exchange Commission ("SEC") in order to conduct business with Institutional Investors based in the U.S., MOSL has entered into a chaperoning agreement with a U.S. registered broker-dealer, Motilal Oswal Securities International Private Limited. ("MOSIPL"). Any business interaction pursuant to this report will have to be executed within the provisions of this chaperoning agreement.
The Research Analysts contributing to the report may not be registered /qualified as research analyst with FINRA. Such research analyst may not be associated persons of the U.S. registered broker-dealer, MOSIPL, and therefore, may not be subject to NASD rule 2711 and NYSE Rule 472 restrictions on communication with a subject company, public appearances and trading securities held by a research analyst account.
For Singapore Motilal Oswal Capital Markets Singapore Pte Limited is acting as an exempt financial advisor under section 23(1)(f) of the Financial Advisers Act(FAA) read with regulation 17(1)(d) of the Financial Advisors Regulations and is a subsidiary of Motilal Oswal Securities Limited in India. This research is distributed in Singapore by Motilal Oswal Capital Markets Singapore Pte Limited and it is only directed in Singapore to accredited investors, as defined in the Financial Advisers Regulations and the Securities and Futures Act (Chapter 289), as amended from time to time. In respect of any matter arising from or in connection with the research you could contact the following representatives of Motilal Oswal Capital Markets Singapore Pte Limited: Kadambari Balachandran Email : [email protected] Contact : (+65) 68189233 / 65249115 Office Address : 21 (Suite 31),16 Collyer Quay,Singapore 04931
Motilal Oswal Securities Ltd
Motilal Oswal Tower, Level 9, Sayani Road, Prabhadevi, Mumbai 400 025 Phone: +91 22 3982 5500 E-mail: [email protected]