1.Pareto Analysis 2.Fish Diagram 3.Gantt Chart 4.PERT Diagram 5.Job/Worksite Analysis Guide.
20
Problem Solving Tools
-
Upload
brianne-dixon -
Category
Documents
-
view
232 -
download
1
Transcript of 1.Pareto Analysis 2.Fish Diagram 3.Gantt Chart 4.PERT Diagram 5.Job/Worksite Analysis Guide.

Problem Solving Tools

1. Exploratory TOOLS
1.Pareto Analysis2.Fish Diagram3.Gantt Chart4.PERT Diagram5.Job/Worksite Analysis Guide

Pareto Diagram
When is it used and what results will be obtained?
Please refer to the table on next slide for the usage and benefits of a Pareto diagram. It is mainly used to prioritize matters, and because of its easiness of use, the diagram is used in a wide variety of fields.
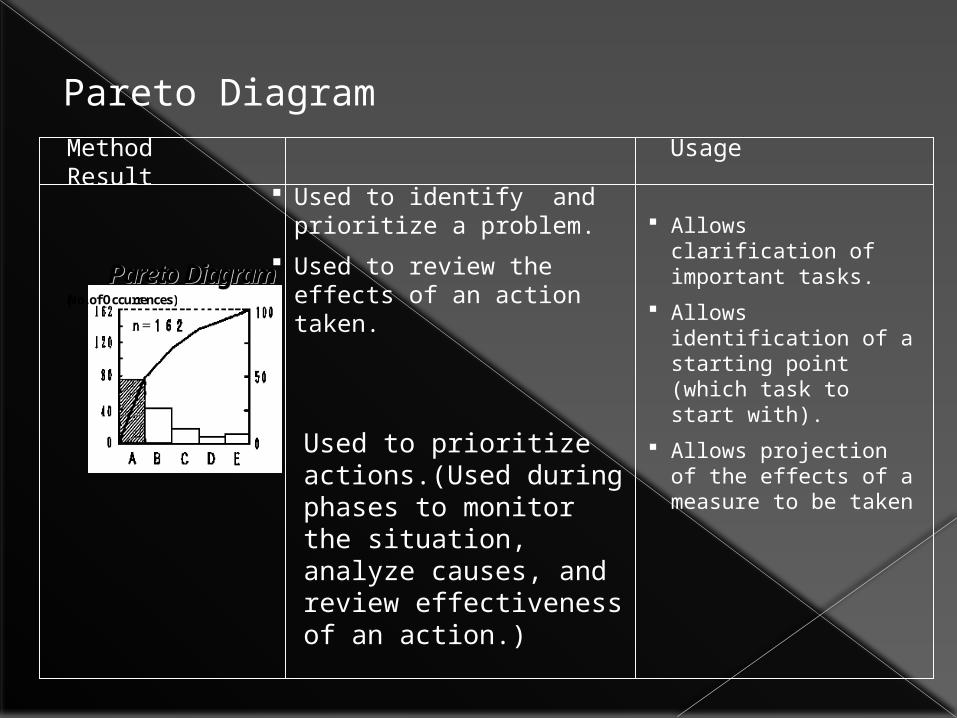
Pareto Diagram Pareto Diagram ( No. of Occurrences)
Pareto Diagram Pareto Diagram ( No. of Occurrences)
Used to prioritize actions.(Used during phases to monitor the situation, analyze causes, and review effectiveness of an action.)
Used to identify and prioritize a problem.
Used to review the effects of an action taken.
Allows clarification of important tasks.
Allows identification of a starting point (which task to start with).
Allows projection of the effects of a measure to be taken
Method Usage Result
Pareto Diagram

Cause & Effect Diagram
1. What is Cause & effect Diagram ?
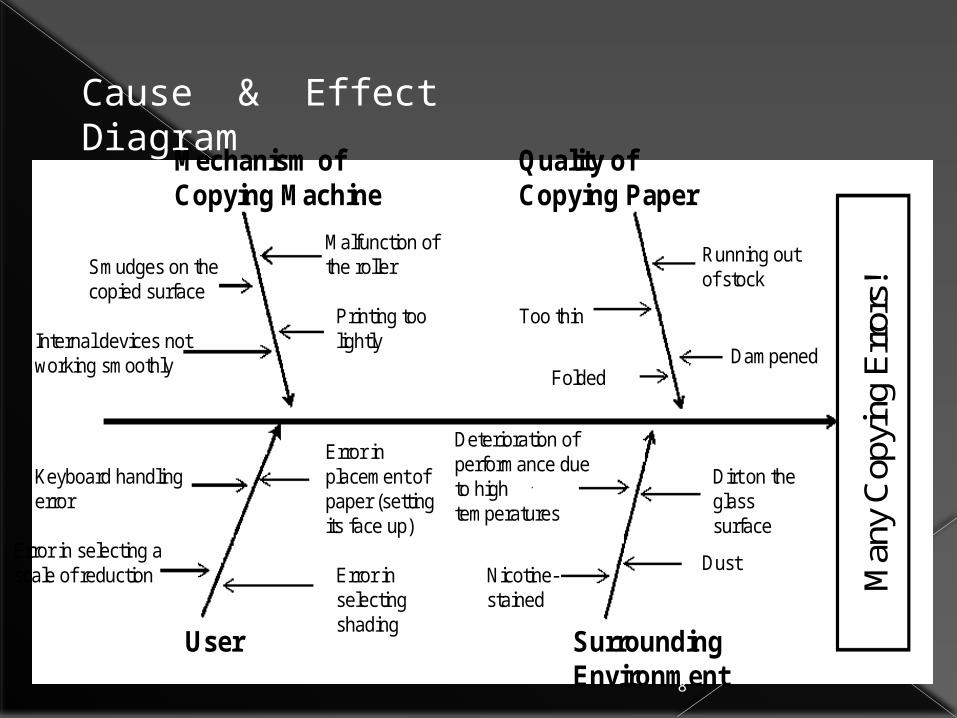
A cause and effect diagram is “a fish-bone diagram that presents a systematic representation of the relationship between the effect (result) and affecting factors (causes).”
Solving a problem in a scientific manner requires clarification of a cause and effect relationship, where the effect (e.g., the result of work) varies according to factors (e.g., facilities and machines used, method of work, workers, and materials and parts used). To obtain a good work result, we must identify the effects of various factors and develop measures to improve the result accordingly.

Cause & Effect Diagram
When is it used and what results will be obtained?
A cause and effect diagram is mainly used to study the cause of a certain matter. As mentioned above, the use of a cause and effect diagram allows clarification of causal relation for efficient problem solving. It is also effective in assessing measures developed and can be applied to other fields according to your needs.

Can obtain a clear overall picture of causal relation. (A change in the cause triggers a variation in the result.)○Can clarify the cause and effect relationship.
Can list up all causes to identify important causes.
Can determine the direction of action (countermeasure).
Method Usage Result
Cause & Effect Diagram
Used when clarifying a cause and effect relationship.[Used during a phase to analyze causes.]
Used to develop countermeasures.
[Used during a phase to plan countermeasures.]
Material Method
ManMachine
Cause (4M’s) Result (Controlled State)
Eff
ect
Cause and Effect Cause and Effect DiagramDiagram
Material Method
ManMachine
Cause (4M’s) Result (Controlled State)
Eff
ect
Cause and Effect Cause and Effect DiagramDiagram
8
Cause & Effect Diagram
Mechanism of Copying Machine
Quality of Copying Paper
User Surrounding Environment
Smudges on the copied surface
Internal devices not working smoothly
Malfunction of the roller
Printing too lightly
Too thin
Folded
Running out of stock
Dampened
Keyboard handling error
Error in selecting a scale of reduction
Error in placement of paper (setting its face up)
Error in selecting shading
Deterioration of performance due to high temperatures
Nicotine-stained
Dirt on the glass surface
Dust
Man
y C
opyi
ng E
rror
s!
Gantt and PERT charts
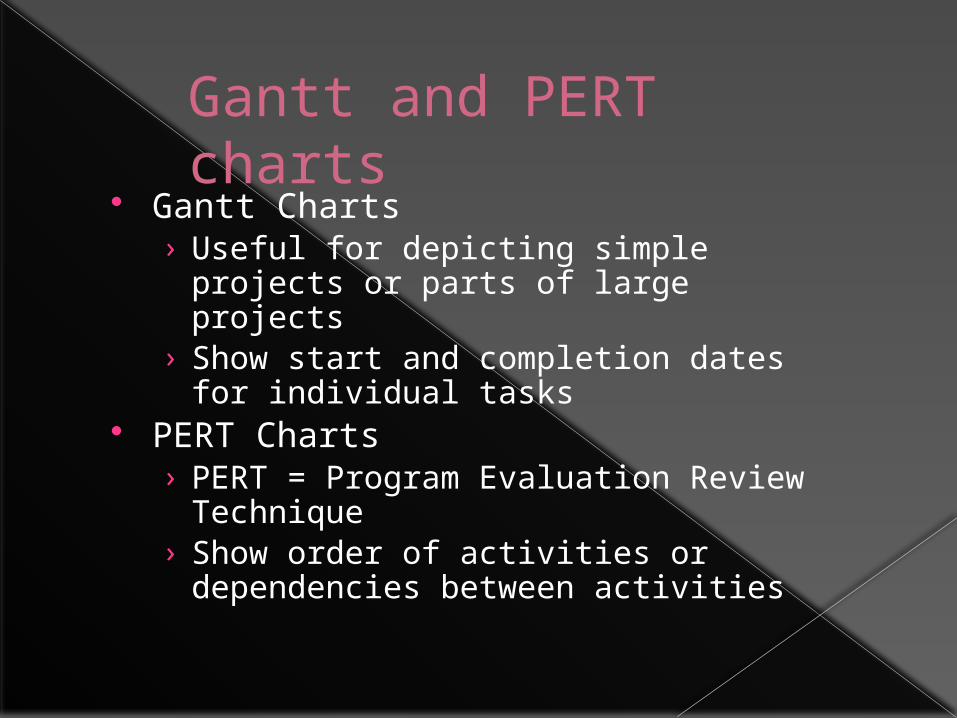
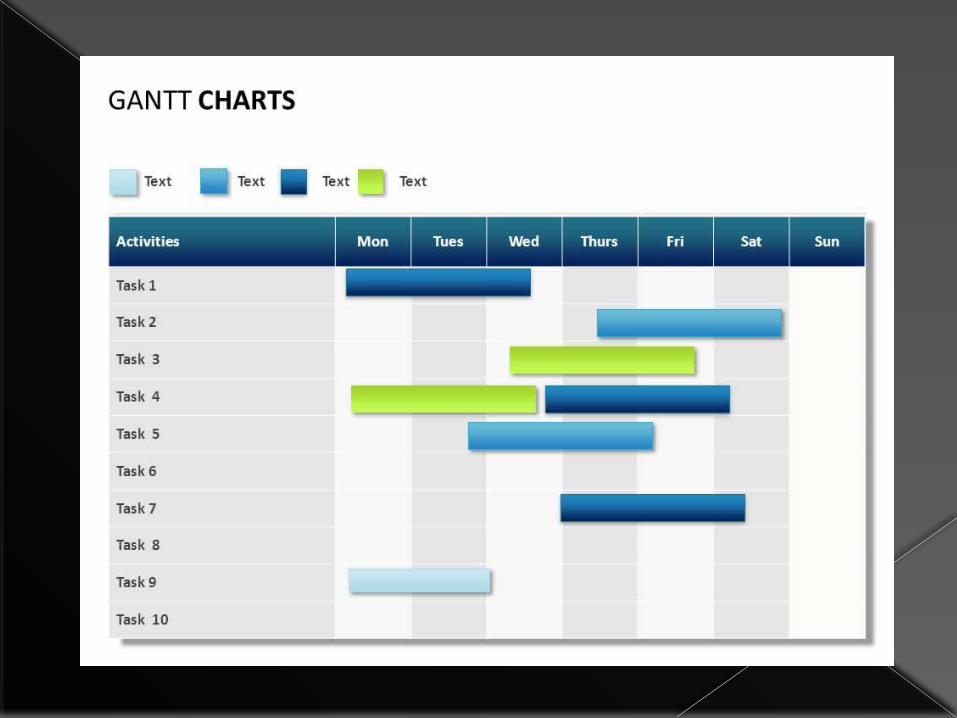
Gantt Charts› Useful for depicting simple projects or
parts of large projects› Show start and completion dates for
individual tasks PERT Charts
› PERT = Program Evaluation Review Technique
› Show order of activities or dependencies between activities

Tutorial:PERT/CPM Chart
1
2
3
4
5
6
8
7
5
6
2
6
5 3
1
TE = 5
TE = 11
TE = 12
TE = 14
TE = 20
TE = 19 TE = 22
TE = 23

12
Task. A project has been defined to contain the following list of activities along with their required times for completion:
Activity No
Activity Expected completion time
Dependency
1. Requirements collection 5 -
2. Screen design 6 1
3. Report design 7 1
4. Database design 2 2,3
5. User documentation 6 4
6. Programming 5 4
7. Testing 3 6
8. Installation 1 5,7
a. Draw a PERT chart for the activities. b. Calculate the earliest expected completion time. c. Show the critical path.
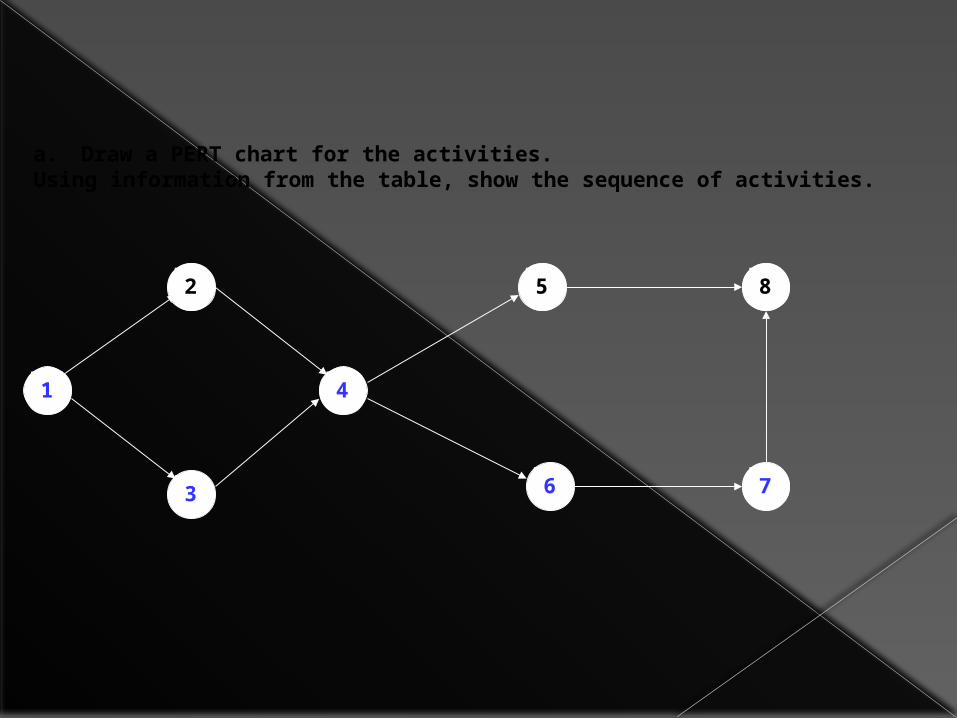
a. Draw a PERT chart for the activities. Using information from the table, show the sequence of activities.
1
2
3
4
5
6
8
7

1
2
3
4
5
6
8
7
b. Calculate the earliest expected completion time. 1. Using information from the table, indicate expected completion time for each activity.
5
6
7
2
6
5 3
1
2. Calculate earliest expected completion time for each activity (TE) and the entire project.Hint: the earliest expected completion time for a given activity is determined by summing the expected completion time of this activity and the earliest expected completion time of the immediate predecessor. Rule: if two or more activities precede an activity, the one with the largest TE is used in calculation (e.g., for activity 4, we will use TE of activity 3 but not 2 since 12 > 11).
TE = 5
TE = 11
TE = 12
TE = 14
TE = 20
TE = 19 TE = 22
TE = 23
15
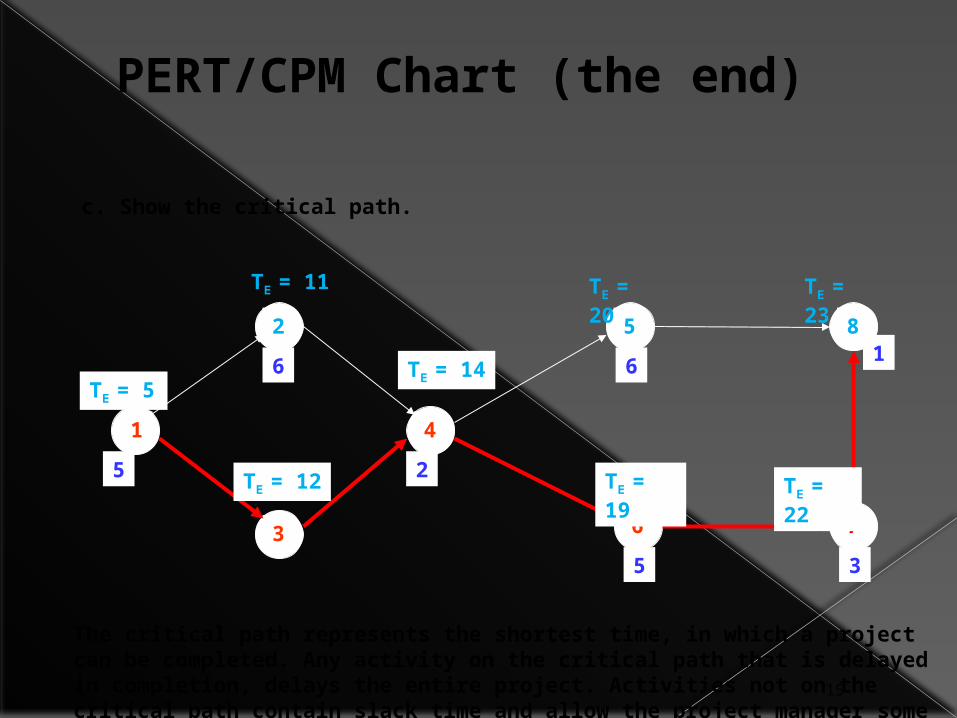
PERT/CPM Chart (the end)
1
2
3
4
5
6
8
7
5
6
2
6
5 3
1
TE = 5
TE = 11
TE = 12
TE = 14
TE = 20
TE = 19 TE = 22
TE = 23
c. Show the critical path.
The critical path represents the shortest time, in which a project can be completed. Any activity on the critical path that is delayed in completion, delays the entire project. Activities not on the critical path contain slack time and allow the project manager some flexibility in scheduling.

2. Recording and Analysis TOOLS
1. Operation Process Chart (OPC)2. Flow Process Chart3. Flow Diagram

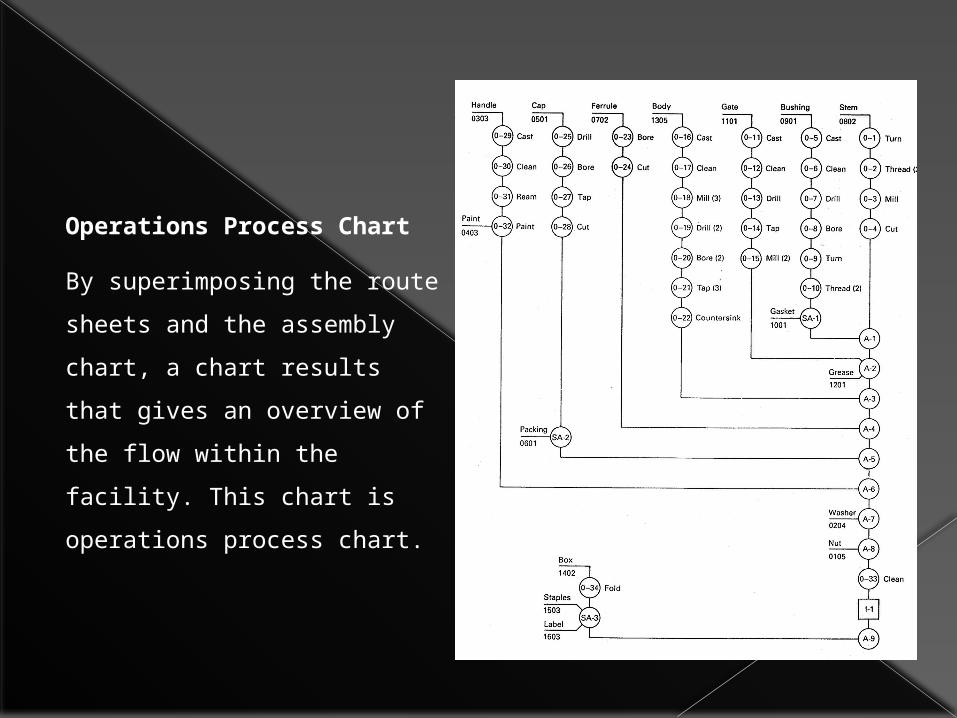
Operations Process Chart
By superimposing the route
sheets and the assembly chart,
a chart results that gives an
overview of the flow within the
facility. This chart is operations
process chart.

Flow Process Chart
This chart uses circles for
operations, arrows for
transports, squares for
inspections, triangles for
storage, and the letter D for
delays. Vertical lines
connect these symbols in
the sequence they are
performed.

Flow Diagram
It depicts the probable
movement of materials in
the floor plant. The
movement is represented
by a line in the plant
drawing.