1992;85;164-171lifemedicalcontrol.com/LMC_Pro/wp-content/uploads/2011/08/Bigger... · Linda M....
9
ISSN: 1524-4539 Copyright © 1992 American Heart Association. All rights reserved. Print ISSN: 0009-7322. Online 72514 Circulation is published by the American Heart Association. 7272 Greenville Avenue, Dallas, TX 1992;85;164-171 Circulation JT Bigger, Jr, JL Fleiss, RC Steinman, LM Rolnitzky, RE Kleiger and JN Rottman myocardial infarction Frequency domain measures of heart period variability and mortality after http://circ.ahajournals.org located on the World Wide Web at: The online version of this article, along with updated information and services, is http://www.lww.com/reprints Reprints: Information about reprints can be found online at [email protected] Fax: 410-528-8550. E-mail: Kluwer Health, 351 West Camden Street, Baltimore, MD 21202-2436. Phone: 410-528-4050. Permissions: Permissions & Rights Desk, Lippincott Williams & Wilkins, a division of Wolters http://circ.ahajournals.org/subscriptions/ Subscriptions: Information about subscribing to Circulation is online at at INSTITUT DE NEUROLOGIE MICHEL on July 16, 2008 circ.ahajournals.org Downloaded from
Transcript of 1992;85;164-171lifemedicalcontrol.com/LMC_Pro/wp-content/uploads/2011/08/Bigger... · Linda M....
ISSN: 1524-4539 Copyright © 1992 American Heart Association. All rights reserved. Print ISSN: 0009-7322. Online
72514Circulation is published by the American Heart Association. 7272 Greenville Avenue, Dallas, TX
1992;85;164-171 CirculationJT Bigger, Jr, JL Fleiss, RC Steinman, LM Rolnitzky, RE Kleiger and JN Rottman
myocardial infarctionFrequency domain measures of heart period variability and mortality after
http://circ.ahajournals.orglocated on the World Wide Web at:
The online version of this article, along with updated information and services, is
http://www.lww.com/reprintsReprints: Information about reprints can be found online at
[email protected]: 410-528-8550. E-mail: Kluwer Health, 351 West Camden Street, Baltimore, MD 21202-2436. Phone: 410-528-4050. Permissions: Permissions & Rights Desk, Lippincott Williams & Wilkins, a division of Wolters
http://circ.ahajournals.org/subscriptions/Subscriptions: Information about subscribing to Circulation is online at
at INSTITUT DE NEUROLOGIE MICHEL on July 16, 2008 circ.ahajournals.orgDownloaded from
164
Frequency Domain Measures of Heart PeriodVariability and Mortality After
Myocardial InfarctionJ. Thomas Bigger Jr., MD; Joseph L. Fleiss, PhD; Richard C. Steinman, AB;
Linda M. Rolnitzky, AB, MS; Robert E. Kleiger, MD; and Jeffrey N. Rottman, MD
Background. We studied 715 patients 2 weeks after myocardial infarction to establish theassociations between six frequency domain measures of heart period variability (HPV) andmortality during 4 years of follow-up.Methods and Results. Each measure of HPV had a significant and at least moderately strong
univariate association with all-cause mortality, cardiac death, and arrhythmic death. Power inthe lower-frequency bands -ultra low frequency (ULF) and very low frequency (VLF) power-had stronger associations with all three mortality end points than power in the higher-frequency bands - low frequency (LF) and high frequency (HF) power. The 24-hour total poweralso had a significant and strong association with all three mortality end points. VLF power wasthe only variable that was more strongly associated with arrhythmic death than with cardiacdeath or all-cause mortality. In multivariate Cox regression models using a step-up approachto evaluate the independent associations between frequency domain measures of heart periodvariability and death of all causes, ULF power was selected first (i.e., was the single componentwith the strongest association). Adding VLF or LF power to the Cox regression modelsignificantly improved the prediction of outcome. With both ULF and VLF power in the Coxregression model, the addition of the other two components, LF and HF power, singly ortogether, did not significantly improve the prediction of all-cause mortality. We explored therelation between the heart period variability measures and all-cause mortality, cardiac death,and arrhythmic death before and after adjusting for five previously established postinfarctionrisk predictors: age, New York Heart Association functional class, rales in the coronary careunit, left ventricular ejection fraction, and ventricular arrhythmias detected in a 24-hourHolter ECG recording.
Conclusions. After adjustment for the five risk predictors, the association between mortalityand total, ULF, and VLF power remained significant and strong, whereas LF and HF powerwere only moderately strongly associated with mortality. The tendency for VLF power to bemore strongly associated with arrhythmic death than with all-cause or cardiac death was stillevident after adjusting for the five covariates. Adding measures of HPV to previously knownpredictors of risk after myocardial infarction identifies small subgroups with a 2.5-yearmortality risk of approximately 50%o. (Circulation 1992;85:164-171)
W e showed previously that the standard de-viation of normal RR intervals (SDNN)computed over 24 hours predicts all-
cause mortality after myocardial infarction indepen-dently of the major risk factors identified by the
Multicenter Post-Infarction Program (MPIP) (i.e.,New York Heart Association functional class, pulmo-nary rales in the coronary care unit phase of theinfarction, radionuclide left ventricular ejection frac-tion, and frequency of ventricular arrhythmias).l
From the Division of Cardiology (J.T.B. Jr., J.L.F., R.C.S.,L.M.R.), Department of Medicine, and the Division of Biostatis-tics, School of Public Health, Columbia University, New York,N.Y.; and the Jewish Hospital of St. Louis (R.E.K., J.N.R.),Washington University School of Medicine, St. Louis, Mo.
Supported in part by National Institutes of Health grantsHL-41552 and HL-70204 from the National Heart, Lung, andBlood Institute, Bethesda, Md., and RR-00645 from the Research
Resources Administration; and by funds from The Milstein FamilyFoundation, The Dover Foundation, George and Abby O'Neill,Robert Winthrop, and the Shirlee and Henry Benach Foundation,New York, N.Y.Address for reprints: J. Thomas Bigger Jr., MD, Columbia
University, P85 9-445, 630 West 168th Street, New York, N.Y.10032.Received February 22, 1991; revision accepted August 27, 1991.
at INSTITUT DE NEUROLOGIE MICHEL on July 16, 2008 circ.ahajournals.orgDownloaded from
Bigger et al Heart Period Variability and Mortality 165
Other measures of heart period variability have beenstudied as predictors of mortality, but none has beenvalidated in a large study.2-4 Measures derived frompower spectral analysis of heart period variability areespecially attractive candidates for predictors of mor-tality after myocardial infarction because certain fre-quency bands of the heart period power spectrumhave been associated with autonomic nervous systemcontrol of sinus node period.5,6 These measures there-fore have the potential to provide insight into themechanisms of death as well as to predict mortality.The purpose of the present study was to establish
the associations between mortality and several fre-quency domain measures of heart period variabilitypresent in a 24-hour ECG recording 2 weeks aftermyocardial infarction. We explored the relation be-tween the heart period variability measures and all-cause mortality, cardiac death, and arrhythmic deathbefore and after adjusting for previously establishedpostinfarction risk predictors. We selected frequencydomain variables for our analyses because these vari-ables comprise a mutually exclusive, all-inclusive cat-egorization of heart period variability and becausethey provide insight into pathophysiology.
MethodsStudy DesignTo measure heart period variability after myocar-
dial infarction, we reanalyzed the 24-hour continu-ous ECG recordings from the MPIP, a multicenter,natural history study.7 The details of enrollment,measurement of baseline variables, quality controlprocedures, and follow-up have been described pre-viously.78 We selected the MPIP sample of patientsfor the present study because it was evaluated in alongitudinal epidemiological study designed to relatemeasures of left ventricular function, arrhythmia,and residual ischemia soon after myocardial infarc-tion to mortality during follow-up. MPIP enrolled its867 patients from diverse geographies and categoriesof hospital. All patients with recent myocardial in-farction who were less than 70 years old were eligible(i.e., the study did not suffer from the enrollmentrestrictions that render the placebo-treated groups inintervention trials biased samples of the generalpopulation of patients after myocardial infarction).The MPIP sample is representative of the generalpopulation of patients with recent infarction in theUnited States at the time the sample was collected.
Processing of 24-Hour Holter RecordingsWe retrieved the tape or cassette recordings from
the MPIP Data Coordinating Center and attemptedto reprocess all of these recordings using recentlydescribed methods.9'10 Briefly, the 24-hour record-ings were digitized by a Marquette 8000 scanner andsubmitted to the standard Marquette algorithms forQRS labeling and editing (version 5.7 software).Then, the data files were transferred via high-speedlink from the Marquette scanner to a Sun worksta-
tion where a second stage of editing was done, usingalgorithms developed at Columbia University, to findand correct any remaining errors in QRS labelingthat adversely affect measurement of heart periodvariability. For a tape to be eligible for the presentstudy, we required it to have 12 hours or more ofanalyzable data and to have at least half of thenight-time (12:00 midnight through 5:00 AM) anddaytime (7:30 AM through 11:30 PM) periods analyz-able. At least 50% had to be sinus rhythm. Weexcluded 152 patients from the analysis of heartperiod variability because of missing or inadequateHolter recordings or because the tapes had deterio-rated after 10 years of storage.
Time Series Analysis of Normal RR IntervalsAfter the second stage of editing and review of the
results by a cardiologist, the heart period powerspectrum was computed over a 24-hour interval usinga method first described by Albrecht et al.9 Ouradaptation of the method was described by Rottmanet al.10 First, a regularly spaced time series wasderived from the RR intervals by sampling the irreg-ularly spaced series defined by the succession ofnormal RR intervals. For each 24-hour ECG record-ing, 218 points were sampled at an interval of 329msec. A "boxcar" low-pass filter with a window twicethe sampling interval was then applied. Gaps in thetime series resulting from noise or ectopic beats werefilled in with linear splines. A fast Fourier transformwas computed, and the resulting power spectrum wascorrected for the attenuating effects of both the filterand the sampling.9 The effective frequency range forthis method is from 1.1574x10⁻⁵ Hz to >0.40 Hz(periods of seconds to hours) if the recording is 24hours long. Finally, frequency domain measures ofheart period variability were computed by integratingover their frequency intervals (e.g., 0.04-0.15 Hz forlow- and 0.15-0.40 Hz for high-frequency [LF andHF] power). In addition, we computed LF and HFpower for all 715 recordings using our 5-minutemethod and obtained results virtually identical to the24-hour in toto method.10
Frequency Domain Measures of HeartPeriod Variability
Six frequency domain measures were calculatedfrom spectral analysis of heart period data over a24-hour interval. We computed the 24-hour powerspectral density and calculated the power within fourfrequency bands: 1) <0.0033 Hz, ultra low frequency(ULF) power; 2) 0.0033 to <0.04 Hz, very lowfrequency (VLF) power, which shows a relative in-crease in patients with congestive heart failure1' andis the lowest-frequency band that can be estimated byour 5-minute method'0; 3) 0.04 to <0.15 Hz, LFpower, which reflects modulation of sympathetic orparasympathetic tone by baroreflex activity12; and 4)0.15-0.40 Hz, HF power, which reflects modulationof vagal tone, primarily by breathing.13"14 In addition,we calculated total power (power in the band, <0.40
at INSTITUT DE NEUROLOGIE MICHEL on July 16, 2008 circ.ahajournals.orgDownloaded from

166 Circulation Vol 85, No 1 January 1992
Hz) and the ratio of LF to HF power, a measure thathas been used as an indicator of sympathovagal bal-ance.6 High values for the ratio suggest predominanceof sympathetic nervous activity. The 24-hour ECGrecordings were digitized without benefit of phase lockloop; therefore, flutter and wow could cause small(<4%) increases in HF power (0.15-0.40 Hz).
Mortality End PointsWe estimated the association between the six mea-
sures of heart period variability and three mortalityend points: death from all causes, cardiac death, andarrhythmic death by the Hinkle-Thaler definition.15
Survival Analytic MethodsWe calculated Kaplan-Meier survival functions16 to
display graphically the survival experience of theMPIP sample of patients over a 3-year interval of timeand to tabulate survival rates up to a prespecified time,2.5 years. We performed Cox proportional hazardsanalyses17 when testing hypotheses about the associa-tion between one or more risk predictors and mortal-ity. The Cox analysis also provides a measure ofassociation, the hazard ratio, that is not linked to asingle time point. The P2L BMDP computer programwas used to carry out the Cox survival analyses.'8 Thisprogram permits categorical and continuous predictorvariables to be analyzed together. The Cox propor-tional hazards model produces estimates of the inde-pendent effects of each of several predictor variableson survival.17 The hazard function (i.e., the instanta-neous probability of dying at any point in time) isassumed in the Cox model to be proportional to theexponential function exp(YBiX-), where the Bis arethe regression coefficients and the Xis are the values ofthe predictor variables. The values of the regressioncoefficients are assumed to remain constant over time,and each exp(Bi) is interpretable as a relative risk forvariable i: exp(Bi) is the ratio of instantaneous proba-bilities of dying for patients with values of Xi 1 unitapart, holding all other variables constant.
Dichotomizing the Measures of HeartPeriod Variability
For ease of communication as well as for eventualclinical use, we dichotomized the six measures ofheart period variability when estimating their associ-ation with mortality. For each, we sought the dichot-omization point that maximized the hazard ratiofrom a Cox regression model17 for comparing pa-tients below the cutpoint (expected to be at high risk)with those at or above it (expected to be at low risk).Given our knowledge of optimal cutpoint for othermeasures and given the need for adequate numbersof patients for testing hypotheses, we restricted oursearch to dichotomizations in the interval between10% low-90% high and 35% low-65% high. Wecalculated the hazard ratio for each possible dichot-omization point within this interval (unadjusted forany covariates), identified the point at which the
hazard ratio attained its maximum, and then roundedto the nearest multiple of 5, 10, or 100.
Univariate Association Between Measures of HeartPeriod Variability and Mortality
For tabulating Kaplan-Meier mortality rates, wespecified mortality at 2.5 years of follow-up, a timewhen about 20 patients were still at risk in thesmallest subgroup. Graphs of the Kaplan-Meier sur-vival rates were drawn up to 3 years of follow-up. ForCox regression analyses and for analyses of hazardratios, we used all of the follow-up experience. Todetermine whether each of the six measures of heartperiod variability was significantly associated withmortality and to estimate the relative strengths ofassociation, we evaluated each measure separately,after dichotomization, in a Cox proportional hazardssurvival model.'7 When mortality of all causes wasthe end point, patients were included in the analysisas long as their survival status was known. In analysesof cause-specific mortality, patients who died of othercauses were censored when they died.
Multivariate Association Between Frequency DomainMeasures of Heart Period Variability and Mortality
Four frequency domain measures - ULF, VLF,LF, and HF power- provide an all-inclusive andmutually exclusive description of heart period vari-ability. The multivariate association between thesefour measures and mortality was evaluated in astep-up Cox regression analysis. The variable withthe strongest association with mortality entered themodel first. Then, each of the remaining three vari-ables was evaluated to determine whether it signifi-cantly improved the fit. If so, it was added to themodel. This process was continued until additionalvariables did not improve the fit of the model at asignificance level of 0.05.
Univariate Association Between Measures of HeartPeriod Variability and Mortality Adjusting forPreviously Reported Postinfarction Risk PredictorsWe used the Cox proportional hazards survival
model to determine whether any of the variousmeasures of heart period variability predicted mor-tality independently of five important postinfarctionrisk predictors that we previously found to bestrongly associated with mortality. The measures ofheart period variability were dichotomized to provideease of interpretation, but the covariates were codedto provide the best-fitting model to predict mortali-ty.819 Age was divided into three categories: <50,50-59, .60 years. New York Heart Associationfunctional class was dichotomized at class I or IIversus III or IV. Rales were dichotomized at none orbasilar versus greater than basilar. Left ventricularejection fraction was coded on a four-interval scale inaccordance with the relation between ejection frac-tion and mortality: <0.20, 0.20-0.29, 0.30-0.39, and>0.40. The average frequency of ventricular prema-ture complexes also was coded on a four-interval
at INSTITUT DE NEUROLOGIE MICHEL on July 16, 2008 circ.ahajournals.orgDownloaded from

Bigger et al Heart Period Variability and Mortality 167
TABLE 1. Frequency Domain Measures of Heart Period Variability: Cutoff Points Used for Analysis of All-Cause Mortality
Percent Below cutpointbelow Kaplan-Meier 2.5 year At or above cutpoint
Variable Cutpoint cutpoint n mortality rate (%) n Mortality rate (%)
Ultra low frequency power 1,600 10.1 72 42.5 643 12.0Very low frequency power 180 11.9 85 41.0 630 11.6Low frequency power 35 12.2 87 34.8 628 12.4High frequency power 20 11.7 84 30.4 631 13.0Total power 2,000 10.9 78 41.2 637 11.9Low-to-high frequency ratio 0.95 15.4 110 32.1 605 12.0
n=715.
scale: none, more than none but less than three perhour, three or more but less than 10 per hour, and 10or more per hour.We ran the Cox model twice for each of the six
measures of heart period variability, once with themeasure of heart period variability alone and thentogether with the full set of covariates. Statisticalsignificance was assessed by referring Z, the esti-mated regression coefficient Bi divided by its stan-dard error, to the standard normal distribution. Thestrength of association between measures of heartperiod variability and the mortality end points wasevaluated using exp(Bi), which can be interpreted asa relative risk for variable i.
ResultsRisk Based on Dichotomized Measures of HeartPeriod Variability
Table 1 lists the six variables we evaluated, theiroptimum cutoff points, the numbers of patients in thegroups categorized as having low or high values forthe variable, and the Kaplan-Meier 2.5 -year all-causemortality rates for the two groups. The fractions oftotal power contributed by the components wereULF power, 82+8%; VLF power, 12+6%; LFpower, 4+3%; and HF power, 2+2%. Figure 1 showsKaplan-Meier cumulative 3-year survival curves foreach of the four mutually exclusive frequency domainmeasures using death of all-causes as the end point.
Univariate Association Between Measures of HeartPeriod Variability and All-Cause orCause-Specific Mortality
Table 2 lists, for each measure of heart periodvariability, the Z scores and relative risks for threemortality end points determined using Cox regressionanalysis unadjusted for any covariates: death from allcauses, cardiac death, and arrhythmic death. Themeasures of heart period variability were dichoto-mized as shown in Table 1. Each measure had asignificant (p<0.05) and strong (hazard ratio >2)univariate association with each of the mortality endpoints. Power in the lower-frequency bands (ULF andVLF power) had stronger associations with all threemortality end points than power in the higher-fre-quency bands (LF and HF power). The 24-hour totalpower also had a significant and strong association
with all three mortality end points. Interestingly, VLFpower showed a gradient of association with theclassification of mortality (i.e., it was most stronglyassociated with arrhythmic death, slightly less so withcardiac death, and least with all-cause mortality).
Multivariate Association Between Frequency DomainMeasures of Heart Period Variability and Mortality
In multivariate Cox regression models using astep-up approach to evaluate the independent asso-ciation of the four mutually exclusive frequencydomain measures of heart period variability withdeath of all causes, ULF power was selected first(i.e., was the single component with the strongestassociation). Adding VLF or LF power to the Cox
1.0
0.9
0.8
0.7
a-
08
3
es0CL0CL
06
0.5
1.0
0.9
0.
0j
0.6
-in
ULF
21600-
LF
>35
0.50 1 2 3
1.0
0.9
0.8
0.7
0.6
0.50 1
VLF
.18
<180-
3
YearsFIGURE 1. Kaplan-Meier survival curves for 715 patients inthe high or low category for the four mutually exclusivefrequency domain measures of heart period variability -ultralow frequency (ULF), very low frequency (VLF), low fre-quency (LF), and high frequency (HF) powers- using all-cause mortality as the endpoint. The number ofpatients at thestart offollow-up and the patients known to be alive and beingfollowed after 1, 2, and 3 years were high ULF, 643, 588, 542,244; low ULF, 72, 54, 44, 24; high VLF, 630, 584, 538, 240;low VLF, 85, 58, 48, 22; high LF, 628, 579, 533, 244; low LF,87, 63, 53, 18; high HF, 631, 573, 525, 243; and low HF, 84,69, 61, 19.
at INSTITUT DE NEUROLOGIE MICHEL on July 16, 2008 circ.ahajournals.orgDownloaded from
168 Circulation Vol 85, No 1 January 1992
TABiLE 2. Frequency Domain Measures of Heart Period Variability: Unadjusted Association With All-Cause, Cardiac,and Arrhythmic Mortality
MortalityAll causes (119 deaths) Cardiac (88 deaths) Arrhythmic (68 deaths)
Variable Z* Relative riskt Z* Relative riskt Z* Relative risktUltra low frequency power 6.95 4.4 5.84 4.3 4.93 4.2Very low frequency power 7.14 4.3 6.57 4.7 5.81 4.8Low frequency power 5.61 3.3 4.73 3.3 4.51 3.6High frequency power 4.06 2.5 3.62 2.6 2.86 2.4Total power 6.79 4.1 5.47 3.9 4.54 3.7Low-to-high frequency ratio 5.35 3.1 4.67 3.1 4.29 3.3
n =715.*Z>1.96,p<0.05; Z>2.58,p<O.01; Z>3.30,p<0.001.tRelative risk, probability of dying if below the cutpoint/probability of dying if above the cutpoint.
regression model with ULF power already in signif-icantly improved the prediction of outcome. Withboth ULF and VLF power in the Cox regressionmodel, the addition of the other two components, LFand HF power, singly or together, did not signifi-cantly improve the prediction of all-cause mortality.
Univariate Association Between Measures of HeartPeriod Variability and Mortality Adjusting forPreviously Reported Postinfarction Risk Predictors
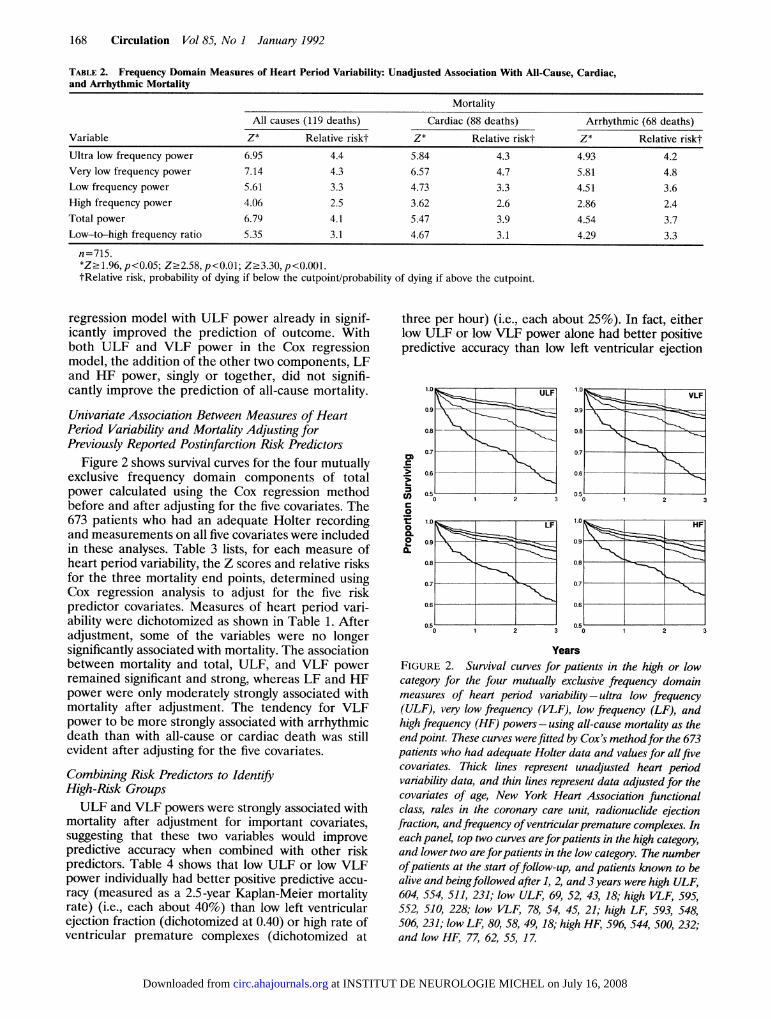
Figure 2 shows survival curves for the four mutuallyexclusive frequency domain components of totalpower calculated using the Cox regression methodbefore and after adjusting for the five covariates. The673 patients who had an adequate Holter recordingand measurements on all five covariates were includedin these analyses. Table 3 lists, for each measure ofheart period variability, the Z scores and relative risksfor the three mortality end points, determined usingCox regression analysis to adjust for the five riskpredictor covariates. Measures of heart period vari-ability were dichotomized as shown in Table 1. Afteradjustment, some of the variables were no longersignificantly associated with mortality. The associationbetween mortality and total, ULF, and VLF powerremained significant and strong, whereas LF and HFpower were only moderately strongly associated withmortality after adjustment. The tendency for VLFpower to be more strongly associated with arrhythmicdeath than with all-cause or cardiac death was stillevident after adjusting for the five covariates.
Combining Risk Predictors to IdentifyHigh-Risk GroupsULF and VLF powers were strongly associated with
mortality after adjustment for important covariates,suggesting that these two variables would improvepredictive accuracy when combined with other riskpredictors. Table 4 shows that low ULF or low VLFpower individually had better positive predictive accu-racy (measured as a 2.5-year Kaplan-Meier mortalityrate) (i.e., each about 40%) than low left ventricularejection fraction (dichotomized at 0.40) or high rate ofventricular premature complexes (dichotomized at
three per hour) (i.e., each about 25%). In fact, eitherlow ULF or low VLF power alone had better positivepredictive accuracy than low left ventricular ejection
1.0
09
0.8
0.7
0.6CD)c
0
L-
COc
0
0.0,CL
----~~==-ULF
0.50
I2
YearsFIGURE 2. Survival curves for patients in the high or lowcategory for the four mutually exclusive frequency domainmeasures of heart period variability- ultra low frequency(ULF), very low frequency (VLF), low frequency (LF), andhigh frequency (HF) powers- using all-cause mortality as theendpoint. These curves werefitted by Coxs methodfor the 673patients who had adequate Holter data and values for all fivecovariates. Thick lines represent unadjusted heart periodvariability data, and thin lines represent data adjusted for thecovariates of age, New York Heart Association functionalclass, rales in the coronary care unit, radionuclide ejectionfraction, andfrequency ofventricularpremature complexes. Ineach panel, top two curves areforpatients in the high category,and lower two are forpatients in the low category. The numberofpatients at the start offollow-up, and patients known to bealive and beingfollowed after 1, 2, and 3years were high ULF,604, 554, 511, 231; low ULF, 69, 52, 43, 18; high VLF, 595,552, 510, 228; low VLF, 78, 54, 45, 21; high LF, 593, 548,506, 231; low LF, 80, 58, 49, 18; high HF, 596, 544, 500, 232;and low HF, 77, 62, 55, 17.
0.51o
at INSTITUT DE NEUROLOGIE MICHEL on July 16, 2008 circ.ahajournals.orgDownloaded from
Bigger et al Heart Period Variability and Mortality 169
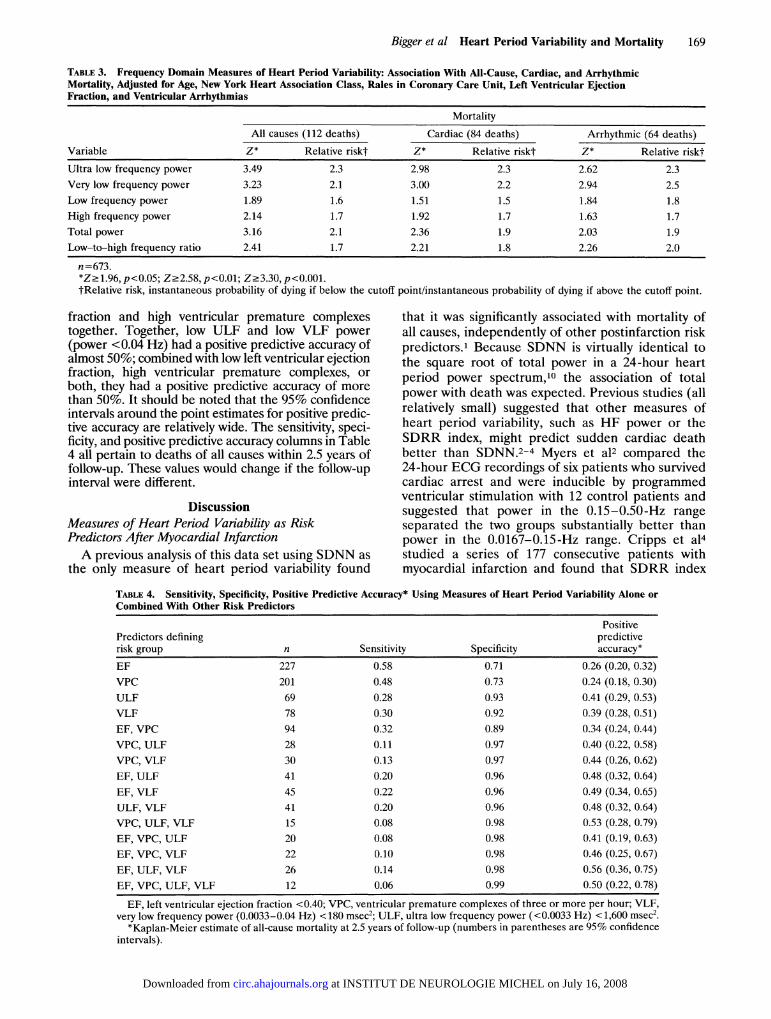
TABLE 3. Frequency Domain Measures of Heart Period Variability: Association With All-Cause, Cardiac, and ArrhythmicMortality, Adjusted for Age, New York Heart Association Class, Rales in Coronary Care Unit, Left Ventricular EjectionFraction, and Ventricular Arrhythmias
Mortality
All causes (112 deaths) Cardiac (84 deaths) Arrhythmic (64 deaths)
Variable Z* Relative riskt Z* Relative riskt Z* Relative risktUltra low frequency power 3.49 2.3 2.98 2.3 2.62 2.3Very low frequency power 3.23 2.1 3.00 2.2 2.94 2.5Low frequency power 1.89 1.6 1.51 1.5 1.84 1.8High frequency power 2.14 1.7 1.92 1.7 1.63 1.7Total power 3.16 2.1 2.36 1.9 2.03 1.9Low-to-high frequency ratio 2.41 1.7 2.21 1.8 2.26 2.0
n=673.*Z21.96,p<0.05; Z.2.58,p<0.01; Z.3.30,p<0.001.tRelative risk, instantaneous probability of dying if below the cutoff point/instantaneous probability of dying if above the cutoff point.
fraction and high ventricular premature complexestogether. Together, low ULF and low VLF power(power <0.04 Hz) had a positive predictive accuracy ofalmost 50%; combined with low left ventricular ejectionfraction, high ventricular premature complexes, orboth, they had a positive predictive accuracy of morethan 50%. It should be noted that the 95% confidenceintervals around the point estimates for positive predic-tive accuracy are relatively wide. The sensitivity, speci-ficity, and positive predictive accuracy columns in Table4 all pertain to deaths of all causes within 2.5 years offollow-up. These values would change if the follow-upinterval were different.
DiscussionMeasures of Heart Period Variability as RiskPredictors After Myocardial InfarctionA previous analysis of this data set using SDNN as
the only measure of heart period variability found
that it was significantly associated with mortality ofall causes, independently of other postinfarction riskpredictors.' Because SDNN is virtually identical tothe square root of total power in a 24-hour heartperiod power spectrum,10 the association of totalpower with death was expected. Previous studies (allrelatively small) suggested that other measures ofheart period variability, such as HF power or theSDRR index, might predict sudden cardiac deathbetter than SDNN.2-4 Myers et a12 compared the24-hour ECG recordings of six patients who survivedcardiac arrest and were inducible by programmedventricular stimulation with 12 control patients andsuggested that power in the 0.15-0.50-Hz rangeseparated the two groups substantially better thanpower in the 0.0167-0.15-Hz range. Cripps et a14studied a series of 177 consecutive patients withmyocardial infarction and found that SDRR index
TABLE 4. Sensitivity, Specificity, Positive Predictive Accuracy* Using Measures of Heart Period Variability Alone orCombined With Other Risk Predictors
PositivePredictors defining predictiverisk group n Sensitivity Specificity accuracy*EF 227 0.58 0.71 0.26 (0.20, 0.32)VPC 201 0.48 0.73 0.24 (0.18, 0.30)ULF 69 0.28 0.93 0.41 (0.29, 0.53)VLF 78 0.30 0.92 0.39 (0.28, 0.51)EF, VPC 94 0.32 0.89 0.34 (0.24, 0.44)VPC, ULF 28 0.11 0.97 0.40 (0.22, 0.58)VPC, VLF 30 0.13 0.97 0.44 (0.26, 0.62)EF, ULF 41 0.20 0.96 0.48 (0.32, 0.64)EF, VLF 45 0.22 0.96 0.49 (0.34, 0.65)ULF, VLF 41 0.20 0.96 0.48 (0.32, 0.64)VPC, ULF, VLF 15 0.08 0.98 0.53 (0.28, 0.79)EF, VPC, ULF 20 0.08 0.98 0.41 (0.19, 0.63)EF, VPC, VLF 22 0.10 0.98 0.46 (0.25, 0.67)EF, ULF, VLF 26 0.14 0.98 0.56 (0.36, 0.75)EF, VPC, ULF, VLF 12 0.06 0.99 0.50 (0.22, 0.78)EF, left ventricular ejection fraction <0.40; VPC, ventricular premature complexes of three or more per hour; VLF,
very low frequency power (0.0033-0.04 Hz) < 180 msec2; ULF, ultra low frequency power (<0.0033 Hz) < 1,600 msec2.*Kaplan-Meier estimate of all-cause mortality at 2.5 years of follow-up (numbers in parentheses are 95% confidence
intervals).
at INSTITUT DE NEUROLOGIE MICHEL on July 16, 2008 circ.ahajournals.orgDownloaded from
170 Circulation Vol 85, No 1 January 1992
predicted arrhythmic events (sudden cardiac deathor nonfatal sustained ventricular tachycardia) betterthan SDNN.4 In this study, we explored the capabilityof various measures of heart period variability topredict not only mortality from all causes but alsocardiac and arrhythmic death. We found that ULFand VLF power were excellent univariate predictorsof mortality and also predicted mortality indepen-dently of five important postinfarction risk predic-tors: age, New York Heart Association functionalclass, rales in the coronary care unit, left ventricularejection fraction, and ventricular arrhythmias de-tected in a 24-hour Holter ECG recording. LF andHF power were good univariate predictors of mor-tality but did not add much to the risk prediction ofthe five covariates. The ratio of LF to HF power wasa good univariate predictor of mortality but was onlya modest predictor after adjusting for the five covar-iates used in this study. Thus, in contrast to Myers etal, we found that VLF information (<0.04 Hz)predicted death after myocardial infarction betterthan higher-frequency information (>0.04 Hz).VLF power had an interesting relation with arrhyth-
mic death both before and after adjustment (i.e.,stronger associations with arrhythmic death than withall-cause mortality or cardiac death), relations that theother measures of heart period variability did nothave. This is a potentially important finding becausevariables that specifically predict arrhythmic deathhave not been identified previously. Accordingly, thispattern should be validated in other data sets.
Effects of Dichotomizing Measures of HeartPeriod VariabilityThe Z values for all-cause mortality in Table 2 are
slightly inflated and the corresponding significance lev-els are slightly overstated because the cutoff pointswere chosen to maximize the relative risks for mortalityof all causes. The rank orderings of the relative risks areminimally affected by the procedure, however, as arethe Z values and associated p values for death due tocardiac and arrhythmic causes. Furthermore, the use ofcutoff points that were optimal made our identificationof the weak risk predictors almost certainly correct. Asdichotomized, LF power, HF power, and LF-to-HFratio were only modestly strong risk predictors afteradjustment for the five covariates. They would havebeen found to be even weaker risk predictors hadother, suboptimal, cutoff points been used.
Mechanistic Implications of the Associations BetweenMeasures of Heart Period Variability and MortalityAfter Myocardial InfarctionHF power is a pure measure of the modulation of
vagal tone by respiratory frequency and depth.5.6 LFpower is a measure of the modulation of vagal andsympathetic tone by baroreflex activity.5,6,12 To-gether, HF and LF powers account for only about 6%of the total power in a 24-hour heart period powerspectrum. There is good evidence from animal exper-iments that individuals with greater baroreflex sensi-
tivity after myocardial infarction have a lower prev-alence of ventricular fibrillation during ischemiainduced during exercise.20 The association of HFpower with death is concordant with these findings.However, in a preliminary study, we showed that thestrength of the correlation between baroreflex sensi-tivity and measures of vagal tone was only moder-ate.21 Thus, it is possible that HF power and barore-flex sensitivity will have independent predictivepower after myocardial infarction.Although ULF and VLF power together account
for more than 90% of the total power in a 24-hourheart period power spectrum, the physiological mech-anisms for these two components have not beenidentified. The large fraction of a 24-hour powerspectrum comprised by frequencies below 0.04 Hz waspreviously reported.2223 These researchers pointedout that spectral density increased logarithmically asfrequency decreased, accounting for the large fractionof a 24-hour power spectrum contributed by LFcomponents.23 Hypotheses about the processes mod-ulating ULF and VLF powers of the heart periodpower spectrum include temperature regulation24 andfluctuations in activity of the renin-angiotensin sys-tem.25 It will be interesting and important to deter-mine the source of ULF and VLF power becausethese components of the heart period power spectrumare such powerful, independent predictors of mortal-ity. A better understanding of the origin of changes inthese components could lead to hypotheses aboutinterventions aimed at improving survival.
Combining Risk Predictors to Identify High-RiskGroups After Myocardial InfarctionWhen measures of heart period variability are used
together with other predictors of risk after myocardialinfarction (e.g., left ventricular ejection fraction andventricular arrhythmias detected by Holter record-ings), small groups can be identified with risk ap-proaching 50% mortality in 21/2 years. Such high-riskgroups are candidates for aggressive treatment in anattempt to improve survival. The signal-averaged ECGis another important risk predictor in patients withrecent myocardial infarction.26 Preliminary evidencesuggests that the signal-averaged ECG predicts mor-tality independently of left ventricular ejection frac-tion and of the frequency of ventricular prematurecomplexes detected in 24-hour ECG recordings. Un-fortunately, there have been no large-scale, longitudi-nal studies to determine whether the signal-averagedECG and one or more components of heart periodvariability provide independent prediction of arrhyth-mic events. Such studies are strongly indicated giventhe results of the present study. Also, the small,high-risk subgroups identified in this sample should bevalidated in another postinfarction sample before thefindings are assumed to be generalizable.
AcknowledgmentsThe authors gratefully acknowledge the expert
technical assistance of Bernard Glembocki, Paul
at INSTITUT DE NEUROLOGIE MICHEL on July 16, 2008 circ.ahajournals.orgDownloaded from
Bigger et al Heart Period Variability and Mortality 171
Gonzalez, Michael Fosina, Thomas Suarez, andReidar Bornholdt.
References1. Kleiger RE, Miller JP, Bigger JT Jr, Moss AJ, the Multicenter
Post-Infarction Research Group: Decreased heart rate vari-ability and its association with increased mortality after acutemyocardial infarction. Am J Cardiol 1987;59:256-262
2. Myers GA, Martin GJ, Magid NM, Barnett PS, Schaad JW,Weiss JS, Lesch M, Singer DH: Power spectral analysis ofheart rate variability in sudden cardiac death: Comparison toother methods. IEEE Trans Biomed Eng 1986;BME-33:1149-1156
3. Lombardi F, Sandrone G, Pernpruner S, Sala R, Garimoldi M,Cerutti S, Baselli G, Pagani M, Malliani A: Heart ratevariability as an index of sympatho-vagal interaction inpatients after myocardial infarction. Am J Cardiol 1987;60:1239-1245
4. Cripps TR, Malik M, Farrell TG, Camm AJ: Prognostic valueof reduced heart rate variability after myocardial infarction:Clinical evaluation of a new analysis method. Br Heart J1991;65:14-19
5. Pomeranz B, Macaulay RJB, Caudill MA, Kutz I, Adam D,Gordon D, Kilborn KM, Barger AC, Shannon DC, Cohen RJ,Benson H: Assessment of autonomic function in humans byheart rate spectral analysis.Am JPhysiol 1985;248:H151-H153
6. Pagani M, Lombardi F, Guzzetti S, Rimoldi 0, Furlan R,Pizzinelli P, Sandrone G, Malfatto G, dell'Orto S, Piccaluga E,Turiel M, Baselli G, Cerutti S, Malliani A: Power spectralanalysis of heart rate and arterial pressure variabilities as amarker of sympathovagal interaction in man and consciousdog. Circ Res 1986;59:178-193
7. The Multicenter Post-Infarction Research Group: Risk strat-ification and survival after myocardial infarction. N Engi J Med1983;309:331-336
8. Bigger JT Jr, Fleiss JL, Kleiger RE, Miller JP, Rolnitzky LM,the Multicenter Post-Infarction Research Group: The rela-tionships among ventricular arrhythmias, left ventricular dys-function and mortality in the 2 years after myocardial infarc-tion. Circulation 1984;69:250-258
9. Albrecht P, Cohen RJ: Estimation of heart rate power spec-trum bands from real-world data: Dealing with ectopic beatsand noisy data. Comput Cardiol 1988;15:311-314
10. Rottman JN, Steinman RC, Albrecht P, Bigger JT Jr,Rolnitzky LM, Fleiss JL: Efficient estimation of the heartperiod power spectrum suitable for physiologic or pharmaco-logic studies. Am J Cardiol 1990;66:1522-1524
11. Saul JP, Arai Y, Berger RD, Lilly LS, Colucci WS, Cohen RJ:Assessment of autonomic regulation in chronic congestiveheart failure by heart rate spectral analysis. Am J Cardiol1988;61:1292-1299
12. Koizumi K, Terui N, Kollai M: Effect of cardiac vagal andsympathetic nerve activity on heart rate in rhythmic regula-tions. J Auton Nerv Syst 1985;12:251-259
13. Katona PG, Jih F: Respiratory sinus arrhythmia: Measure ofthe parasympathetic cardiac control. J Appi Physiol 1975;39:801-805
14. Fouad FM, Tarazzi RC, Ferrario CM, Fighaly S, Alicandri C:Assessment of parasympathetic control of heart rate by a
noninvasive method. Am J Physiol 1984;246:H838-H84215. Hinkle LE, Thaler JT: Clinical classification of cardiac deaths.
Circulation 1982;65:457-46416. Kaplan EL, Meier P: Nonparametric estimation from incom-
plete observations. JAm Stat Assoc 1958;53:457-48117. Cox DR: Regression models and life tables (with discussion).
JR Stat Soc B 1972;34:187-22018. Dixon WJ, Brown MB, Engelman L, Frane JW, Hill MA,
Jennrich RI, Toporek JD: BMDP Statistical Software. LosAngeles, University of California Press, 1988, pp 719-743
19. Bigger JT Jr, Fleiss JL, Rolnitzky LM, The MulticenterPost-Infarction Research Group: Prevalence, characteristics,and significance of ventricular tachycardia detected by24-hour continuous electrocardiographic recordings in the latehospital phase of acute myocardial infarction. Am J Cardiol1986;58:1151-1160
20. Schwartz PJ, Vanoli E, Stramba Badiale M, De Ferrari GM,Billman GE, Foreman RD: Autonomic mechanisms and sud-den death: New insights from analysis of baroreceptor reflexesin conscious dogs with and without a myocardial infarction.Circulation 1988;78:969-979
21. Bigger JT Jr, La Rovere MT, Steinman RC, Fleiss JL,Rottman JN, Rolnitzky LM, Schwartz PJ: Comparison ofbaroreflex sensitivity and heart period variability after myo-cardial infarction. JAm Col] Cardiol 1989;14:1511-1518
22. Kobayoshi M, Musha T: 1/f fluctuation of heartbeat period.IEEE Trans Biomed Eng BME 1982;29:456- 457
23. Saul JP, Albrecht P, Berger RD, Cohen RJ: Analysis of longterm heart rate variability: Methods, 1/f scaling and implica-tions. Comput Cardiol 1987;14:419-422
24. Sayers B: Analysis of heart rate variability. Ergonomics 1973;16:17-32
25. Akselrod S, Gordon D, Ubel FA, Shannon DC, Barger AC,Cohen RJ: Power spectrum analysis of heart rate fluctuation:A quantitative probe of beat-to-beat cardiovascular control.Science 1981;213:220-223
26. Bigger JT Jr, Steinberg JS: Risk stratification for arrhythmicdeath after myocardial infarction: An overview, in El-Sherif N,Samet P (eds): Cardiac Pacing and Electrophysiology. Philadel-phia, WB Saunders, 1990, pp 303-322
KEY WORDS * nervous system, autonomic * electrocardiography* vagus nerves
at INSTITUT DE NEUROLOGIE MICHEL on July 16, 2008 circ.ahajournals.orgDownloaded from