170602 DRFT Facility Requirements Chapter v3 - Roberts … MP Ch3 Facility... · Facility...
59
Chapter 3 – Facility Requirements DRAFT June 21, 2017 Contents 3.0 FACILITY REQUIREMENTS ............................................................................................................ 3 3.1 INTRODUCTION TO FACILITY REQUIREMENTS.......................................................................... 3 3.2 AIRSIDE FACILITY REQUIREMENTS ............................................................................................. 4 3.2.1 AIRFIELD CAPACITY ................................................................................................................... 4 AIRFIELD CAPACITY CONCLUSIONS AND RECOMMENDATIONS ................................................. 5 3.2.2 AIRFIELD DESIGN ....................................................................................................................... 5 3.2.3 RUNWAY SYSTEM .................................................................................................................... 11 RUNWAY DESIGN STANDARDS ....................................................................................................... 11 RUNWAY PAVEMENT STRENGTH ................................................................................................... 24 RUNWAY SYSTEM CONCLUSION AND RECOMMENDATIONS ..................................................... 29 3.2.4 TAXIWAY SYSTEM .................................................................................................................... 29 TAXIWAY DESIGN STANDARDS....................................................................................................... 30 TAXIWAYS SERVING TDG5 .............................................................................................................. 30 3.2.5 GENERAL AVIATION FACILITIES ................................................................................................ 36 CONCLUSIONS AND RECOMMENDATIONS ................................................................................... 39 PASSENGER TERMINAL APRON ..................................................................................................... 39 3.3 LANDSIDE FACILITY REQUIREMENTS ....................................................................................... 41 3.3.1 PASSENGER TERMINAL ROADWAY ....................................................................................... 41 3.3.2 PASSENGER TERMINAL PARKING AREA – PUBLIC PARKING ............................................ 41 EMPLOYEE/Tenant Parking ................................................................................................................ 43 3.3.3 RENTAL CAR FACILITIES ......................................................................................................... 43 3.3.4 NON-AVIATION REVENUE DEVELOPMENT ........................................................................... 44 RECOMMENDED UPGRADES........................................................................................................... 44 3.4 TERMINAL AREA FACILITIES ....................................................................................................... 46 3.4.1 AIRPORT ACTIVITY ...................................................................................................................... 46 3.4.2 PASSENGER TERMINAL BUILDING......................................................................................... 47 3.4.3 GATE CAPACITY REQUIREMENTS ......................................................................................... 49 3.4.4 TERMINAL BUILDING DEVELOPMENT.................................................................................... 51 3.4.5 CONCLUSIONS AND RECOMMENDATIONS........................................................................... 54 3.5 SUPPORT FACILITY REQUIREMENTS ........................................................................................ 54 3.5.1 FIXED BASE OPERATORS (FBO)............................................................................................. 54
Transcript of 170602 DRFT Facility Requirements Chapter v3 - Roberts … MP Ch3 Facility... · Facility...

Chapter 3 – Facility Requirements DRAFT June 21, 2017
Contents 3.0 FACILITY REQUIREMENTS ............................................................................................................ 3
3.1 INTRODUCTION TO FACILITY REQUIREMENTS .......................................................................... 3
3.2 AIRSIDE FACILITY REQUIREMENTS ............................................................................................. 4
3.2.1 AIRFIELD CAPACITY ................................................................................................................... 4
AIRFIELD CAPACITY CONCLUSIONS AND RECOMMENDATIONS ................................................. 5
3.2.2 AIRFIELD DESIGN ....................................................................................................................... 5
3.2.3 RUNWAY SYSTEM .................................................................................................................... 11
RUNWAY DESIGN STANDARDS ....................................................................................................... 11
RUNWAY PAVEMENT STRENGTH ................................................................................................... 24
RUNWAY SYSTEM CONCLUSION AND RECOMMENDATIONS ..................................................... 29
3.2.4 TAXIWAY SYSTEM .................................................................................................................... 29
TAXIWAY DESIGN STANDARDS ....................................................................................................... 30
TAXIWAYS SERVING TDG5 .............................................................................................................. 30
3.2.5 GENERAL AVIATION FACILITIES ................................................................................................ 36
CONCLUSIONS AND RECOMMENDATIONS ................................................................................... 39
PASSENGER TERMINAL APRON ..................................................................................................... 39
3.3 LANDSIDE FACILITY REQUIREMENTS ....................................................................................... 41
3.3.1 PASSENGER TERMINAL ROADWAY ....................................................................................... 41
3.3.2 PASSENGER TERMINAL PARKING AREA – PUBLIC PARKING ............................................ 41
EMPLOYEE/Tenant Parking ................................................................................................................ 43
3.3.3 RENTAL CAR FACILITIES ......................................................................................................... 43
3.3.4 NON-AVIATION REVENUE DEVELOPMENT ........................................................................... 44
RECOMMENDED UPGRADES ........................................................................................................... 44
3.4 TERMINAL AREA FACILITIES ....................................................................................................... 46
3.4.1 AIRPORT ACTIVITY ...................................................................................................................... 46
3.4.2 PASSENGER TERMINAL BUILDING......................................................................................... 47
3.4.3 GATE CAPACITY REQUIREMENTS ......................................................................................... 49
3.4.4 TERMINAL BUILDING DEVELOPMENT .................................................................................... 51
3.4.5 CONCLUSIONS AND RECOMMENDATIONS ........................................................................... 54
3.5 SUPPORT FACILITY REQUIREMENTS ........................................................................................ 54
3.5.1 FIXED BASE OPERATORS (FBO)............................................................................................. 54
Chapter 3 – Facility Requirements DRAFT June 21, 2017
3.5.2 UNITED STATES FOREST SERVICE (USFS) .......................................................................... 54
3.5.3 CARGO FACILITIES ................................................................................................................... 54
3.5.4 AIR SUPPORT AND MAINTENANCE FACILITIES ....................................................................... 55
SNOW REMOVAL EQUIPMENT (SRE) .............................................................................................. 55
AIRPORT RESCUE AND FIRE FIGHTING (ARFF) ............................................................................ 55
AIR TRAFFIC CONTROL TOWER (ATCT) ......................................................................................... 55
AIRPORT SERVICE ROADS .............................................................................................................. 57
SECURITY GATES .............................................................................................................................. 57
DISASTER PLANNING FACILITY REQUIREMENTS ........................................................................ 57
3.5.5 CONCLUSIONS AND RECOMMENDATIONS .............................................................................. 57
3.6 FACILITY REQUIREMENTS SUMMARY ....................................................................................... 58
Chapter 3 – Facility Requirements DRAFT June 21, 2017
3
3.0 FACILITY REQUIREMENTS
This Facility Requirements Chapter considers the availability and capability of facilities at the Redmond Municipal Airport (RDM or the Airport) to accommodate existing and projected aviation demand over the next 20 years.
3.1 INTRODUCTION TO FACILITY REQUIREMENTS
This chapter compares current and forecasted activity levels (presented in Chapter 2 Aviation
Forecasts) to the Airport’s operational capacity, design requirements, and facility needs. Options for meeting the identified facility needs will be analyzed in Chapter 4 Alternatives Analysis. Facility requirements are presented in the following organizational structure:
Airside Facility Requirements
Airfield Capacity
Airfield Design
Runway System
Taxiway System
General Aviation Facilities
Landside Facility Requirements
Passenger Terminal Roadway
Passenger Terminal Parking Area
Rental Car Facilities
Non-aviation Revenue Development
Terminal Building
Waiting on architects
Support Facilities
Fixed Base Operators
United States Forest Service
Cargo Facilities
Airport Support and Maintenance Facilities
Airside Facilities: Facilities that are accessible to aircraft, such as runways and taxiways.
Landside Facilities: Facilities that support airside facilities, but are not part of the aircraft movement area, such as terminal buildings, hangars, aprons, access roads, and parking facilities.
Support Facilities: Facilities that can be either airside or landside facilities that aid in the operation of the airport.
Chapter 3 – Facility Requirements DRAFT June 21, 2017
4
3.2 AIRSIDE FACILITY REQUIREMENTS
An early step in reviewing an airport’s long term needs is to assess capacity and delay issues because these concerns will influence the direction of airfield planning. An airport’s annual capacity, known as the Annual Service Volume (ASV), is the number of flight operations an airfield can accommodate during a year. Existing and forecast annual demand is compared with the ASV to determine the percentage capacity at which the airport is operating and to gauge the timing of future airfield capacity improvements. As annual demand approaches ASV, average delays increase. A typical goal is to construct a new runway prior to time delays averaging 10 to 15 minutes per operation, and this requires the completion of planning, environmental, and design work before delays reach this threshold.
3.2.1 AIRFIELD CAPACITY
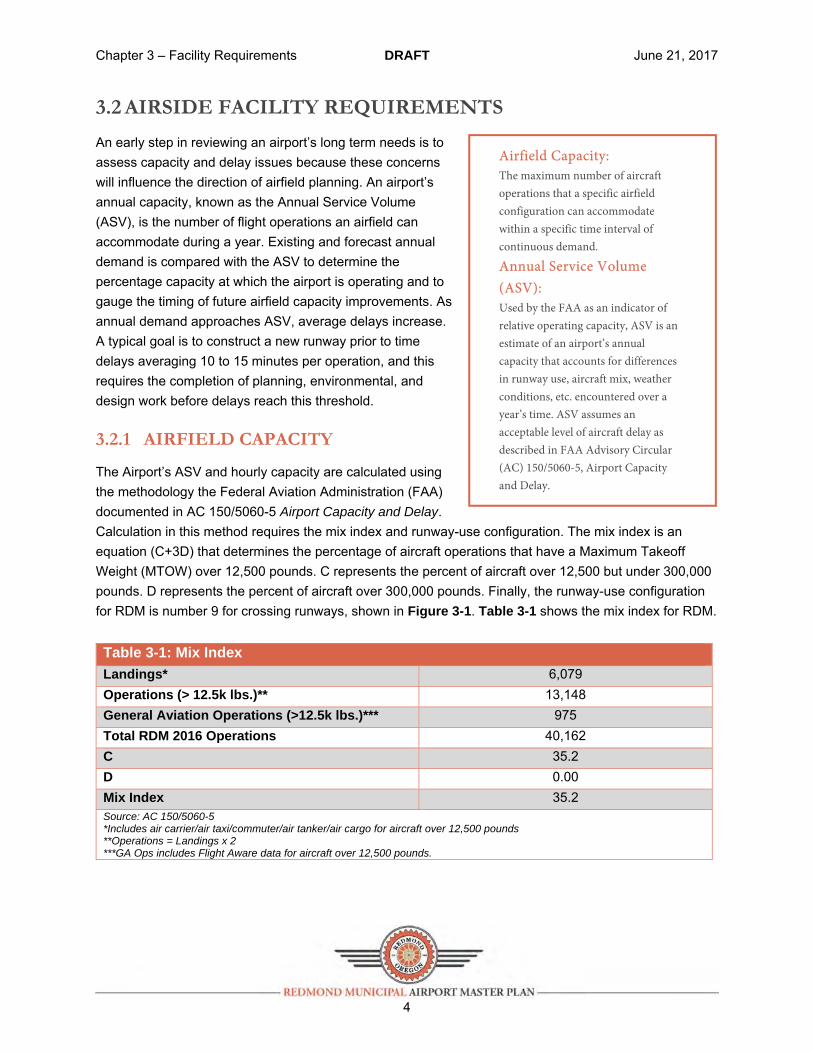
The Airport’s ASV and hourly capacity are calculated using the methodology the Federal Aviation Administration (FAA) documented in AC 150/5060-5 Airport Capacity and Delay. Calculation in this method requires the mix index and runway-use configuration. The mix index is an equation (C+3D) that determines the percentage of aircraft operations that have a Maximum Takeoff Weight (MTOW) over 12,500 pounds. C represents the percent of aircraft over 12,500 but under 300,000 pounds. D represents the percent of aircraft over 300,000 pounds. Finally, the runway-use configuration for RDM is number 9 for crossing runways, shown in Figure 3-1. Table 3-1 shows the mix index for RDM. Table 3-1: Mix Index
Landings* 6,079 Operations (> 12.5k lbs.)** 13,148 General Aviation Operations (>12.5k lbs.)*** 975 Total RDM 2016 Operations 40,162 C 35.2 D 0.00 Mix Index 35.2 Source: AC 150/5060-5 *Includes air carrier/air taxi/commuter/air tanker/air cargo for aircraft over 12,500 pounds **Operations = Landings x 2 ***GA Ops includes Flight Aware data for aircraft over 12,500 pounds.
Airfield Capacity: The maximum number of aircraft operations that a specific airfield configuration can accommodate within a specific time interval of continuous demand.
Annual Service Volume (ASV): Used by the FAA as an indicator of relative operating capacity, ASV is an estimate of an airport’s annual capacity that accounts for differences in runway use, aircraft mix, weather conditions, etc. encountered over a year’s time. ASV assumes an acceptable level of aircraft delay as described in FAA Advisory Circular (AC) 150/5060-5, Airport Capacity and Delay.
Chapter 3 – Facility Requirements DRAFT June 21, 2017
5
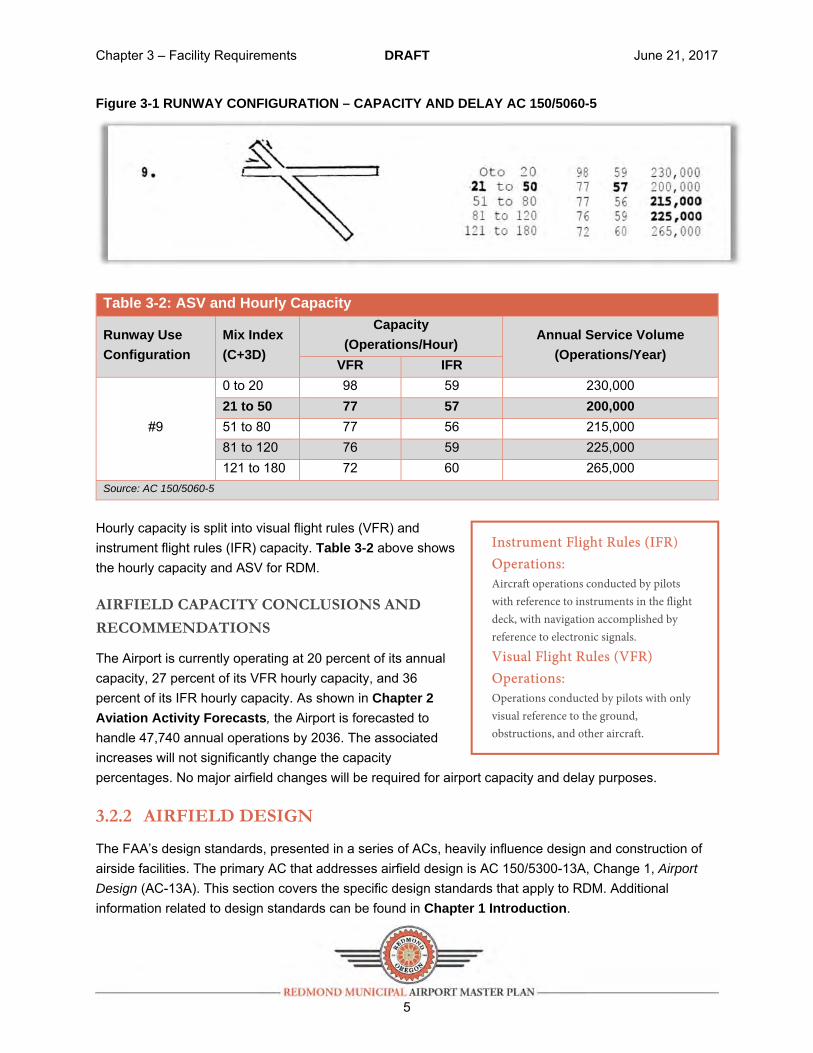
Figure 3-1 RUNWAY CONFIGURATION – CAPACITY AND DELAY AC 150/5060-5
Table 3-2: ASV and Hourly Capacity
Runway Use
Configuration
Mix Index
(C+3D)
Capacity
(Operations/Hour) Annual Service Volume
(Operations/Year) VFR IFR
#9
0 to 20 98 59 230,000 21 to 50 77 57 200,000 51 to 80 77 56 215,000 81 to 120 76 59 225,000 121 to 180 72 60 265,000
Source: AC 150/5060-5
Hourly capacity is split into visual flight rules (VFR) and instrument flight rules (IFR) capacity. Table 3-2 above shows the hourly capacity and ASV for RDM.
AIRFIELD CAPACITY CONCLUSIONS AND
RECOMMENDATIONS
The Airport is currently operating at 20 percent of its annual capacity, 27 percent of its VFR hourly capacity, and 36 percent of its IFR hourly capacity. As shown in Chapter 2
Aviation Activity Forecasts, the Airport is forecasted to handle 47,740 annual operations by 2036. The associated increases will not significantly change the capacity percentages. No major airfield changes will be required for airport capacity and delay purposes.
3.2.2 AIRFIELD DESIGN
The FAA’s design standards, presented in a series of ACs, heavily influence design and construction of airside facilities. The primary AC that addresses airfield design is AC 150/5300-13A, Change 1, Airport
Design (AC-13A). This section covers the specific design standards that apply to RDM. Additional information related to design standards can be found in Chapter 1 Introduction.
Instrument Flight Rules (IFR) Operations: Aircraft operations conducted by pilots with reference to instruments in the flight deck, with navigation accomplished by reference to electronic signals.
Visual Flight Rules (VFR) Operations: Operations conducted by pilots with only visual reference to the ground, obstructions, and other aircraft.
Chapter 3 – Facility Requirements DRAFT June 21, 2017
6
DESIGN STANDARDS CONCEPTS AND TERMINOLOGY
The FAA is responsible for the overall safety of civil aviation in the United States; therefore, FAA design standards are primarily driven by safety, with secondary goals including efficiency and utility also reflected in FAA standards and policy. Changes to improve safety and efficiency are constantly evolving as the aviation industry continues to develop, and the expectation is that design standards will continue to evolve alongside technologies and procedures.
CRITICAL AIRCRAFT
The initial step in airside facility planning is to identify the critical aircraft. According to FAA Order 5090.3C, Field
Formulation of the National Plan of Integrated Airport
Systems (NPIAS), paragraph 3-4, the critical aircraft is the most demanding aircraft that operates at the airport more than 500 times per year or an aircraft used for scheduled passenger service. The characteristics used in facility planning include approach speed, wingspan, tail height, main gear width, cockpit to main gear length, aircraft weight, and takeoff and landing distances. The existing critical aircraft are based on historical operations records and current airline schedules. The future critical aircraft is determined based on projections from Chapter 2 Aviation Activity Forecasts.
Current Critical Aircraft
The most demanding aircraft currently using the airport is the Bombardier Q400 and Bombardier CRJ-900. Together, these two aircraft are the critical aircraft for Runway 5-23. The Q400 is also the critical aircraft for Runway 11-29.
Forecast Critical Aircraft
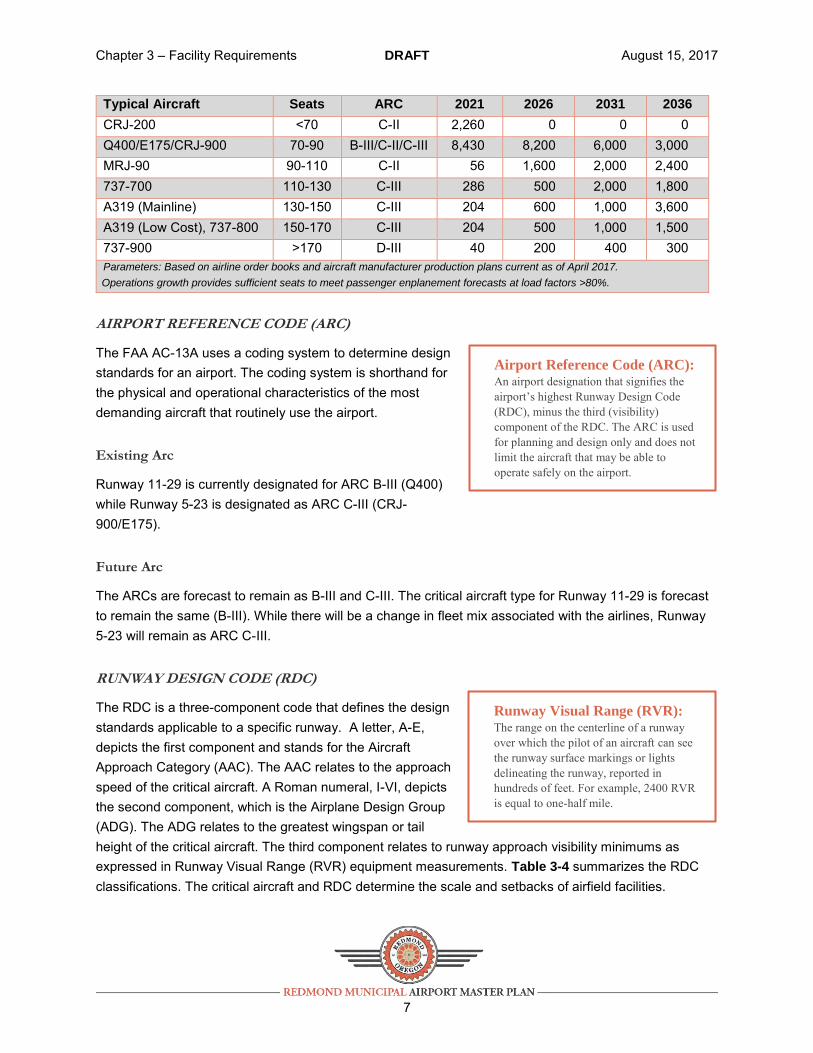
At RDM, critical air carrier aircraft are expected to follow the general trend in airline operations nationwide, leading to a likely shift in aircraft types over the next 20 years. Routes into and out of RDM will likely shift toward increased aircraft size and reduced frequency. For RDM, this means the potential for a transition to narrow body aircraft. As addressed in the Chapter 2 Aviation Activity Forecasts, future critical air carrier aircraft are expected to be a combination of narrow-body jet and turboprop aircraft as shown in Table 3-3 below.
Critical Aircraft: This is an aircraft with characteristics that determine the application of airport design standards for a specific runway, taxiway, taxilane, apron, or other facility. This can be a specific aircraft model or a composite of several aircraft currently using, expected to use, or intended to use the airport or part of the airport. This is also called the “design aircraft” or “critical design aircraft.”
Chapter 3 – Facility Requirements DRAFT August 15, 2017
7
Typical Aircraft Seats ARC 2021 2026 2031 2036
CRJ-200 <70 C-II 2,260 0 0 0 Q400/E175/CRJ-900 70-90 B-III/C-II/C-III 8,430 8,200 6,000 3,000 MRJ-90 90-110 C-II 56 1,600 2,000 2,400 737-700 110-130 C-III 286 500 2,000 1,800 A319 (Mainline) 130-150 C-III 204 600 1,000 3,600 A319 (Low Cost), 737-800 150-170 C-III 204 500 1,000 1,500 737-900 >170 D-III 40 200 400 300 Parameters: Based on airline order books and aircraft manufacturer production plans current as of April 2017.
Operations growth provides sufficient seats to meet passenger enplanement forecasts at load factors >80%.
AIRPORT REFERENCE CODE (ARC)
The FAA AC-13A uses a coding system to determine design standards for an airport. The coding system is shorthand for the physical and operational characteristics of the most demanding aircraft that routinely use the airport.
Existing Arc
Runway 11-29 is currently designated for ARC B-III (Q400) while Runway 5-23 is designated as ARC C-III (CRJ-900/E175).
Future Arc
The ARCs are forecast to remain as B-III and C-III. The critical aircraft type for Runway 11-29 is forecast to remain the same (B-III). While there will be a change in fleet mix associated with the airlines, Runway 5-23 will remain as ARC C-III.
RUNWAY DESIGN CODE (RDC)
The RDC is a three-component code that defines the design standards applicable to a specific runway. A letter, A-E, depicts the first component and stands for the Aircraft Approach Category (AAC). The AAC relates to the approach speed of the critical aircraft. A Roman numeral, I-VI, depicts the second component, which is the Airplane Design Group (ADG). The ADG relates to the greatest wingspan or tail height of the critical aircraft. The third component relates to runway approach visibility minimums as expressed in Runway Visual Range (RVR) equipment measurements. Table 3-4 summarizes the RDC classifications. The critical aircraft and RDC determine the scale and setbacks of airfield facilities.
Airport Reference Code (ARC): An airport designation that signifies the airport’s highest Runway Design Code (RDC), minus the third (visibility) component of the RDC. The ARC is used for planning and design only and does not limit the aircraft that may be able to operate safely on the airport.
Runway Visual Range (RVR): The range on the centerline of a runway over which the pilot of an aircraft can see the runway surface markings or lights delineating the runway, reported in hundreds of feet. For example, 2400 RVR is equal to one-half mile.
Chapter 3 – Facility Requirements DRAFT June 21, 2017
8
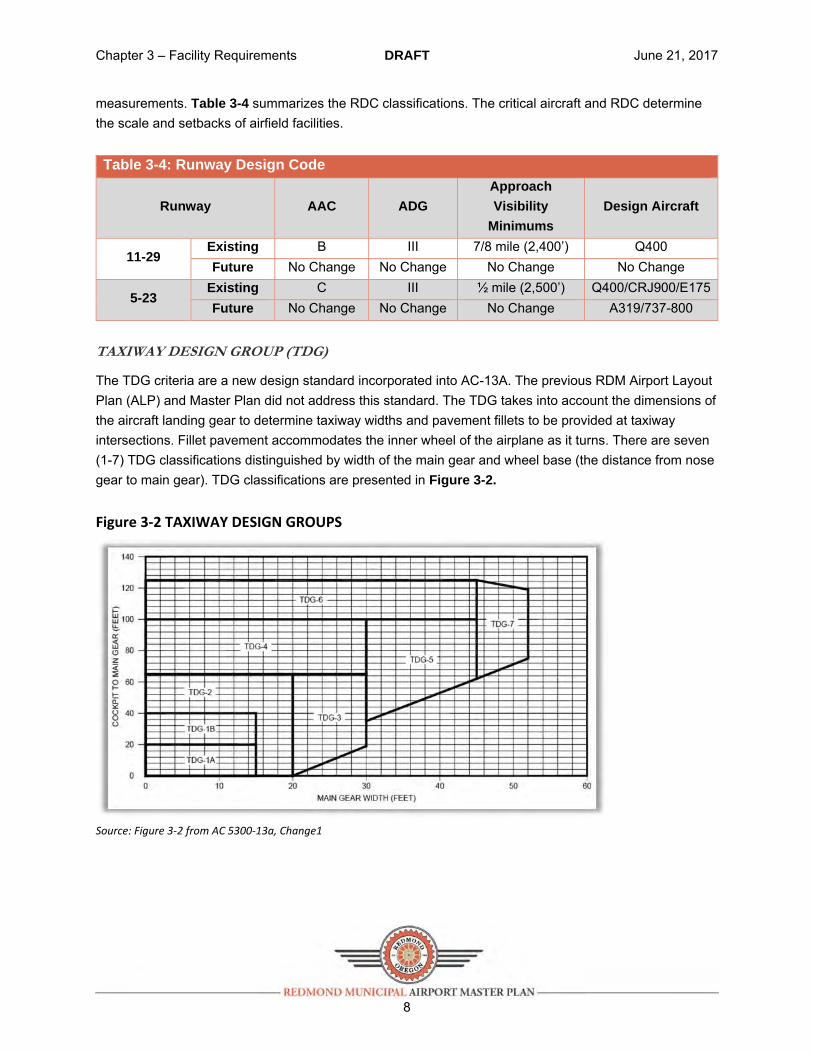
measurements. Table 3-4 summarizes the RDC classifications. The critical aircraft and RDC determine the scale and setbacks of airfield facilities. Table 3-4: Runway Design Code
Runway AAC ADG Approach
Visibility
Minimums Design Aircraft
11-29 Existing B III 7/8 mile (2,400’) Q400 Future No Change No Change No Change No Change
5-23 Existing C III ½ mile (2,500’) Q400/CRJ900/E175Future No Change No Change No Change A319/737-800
TAXIWAY DESIGN GROUP (TDG)
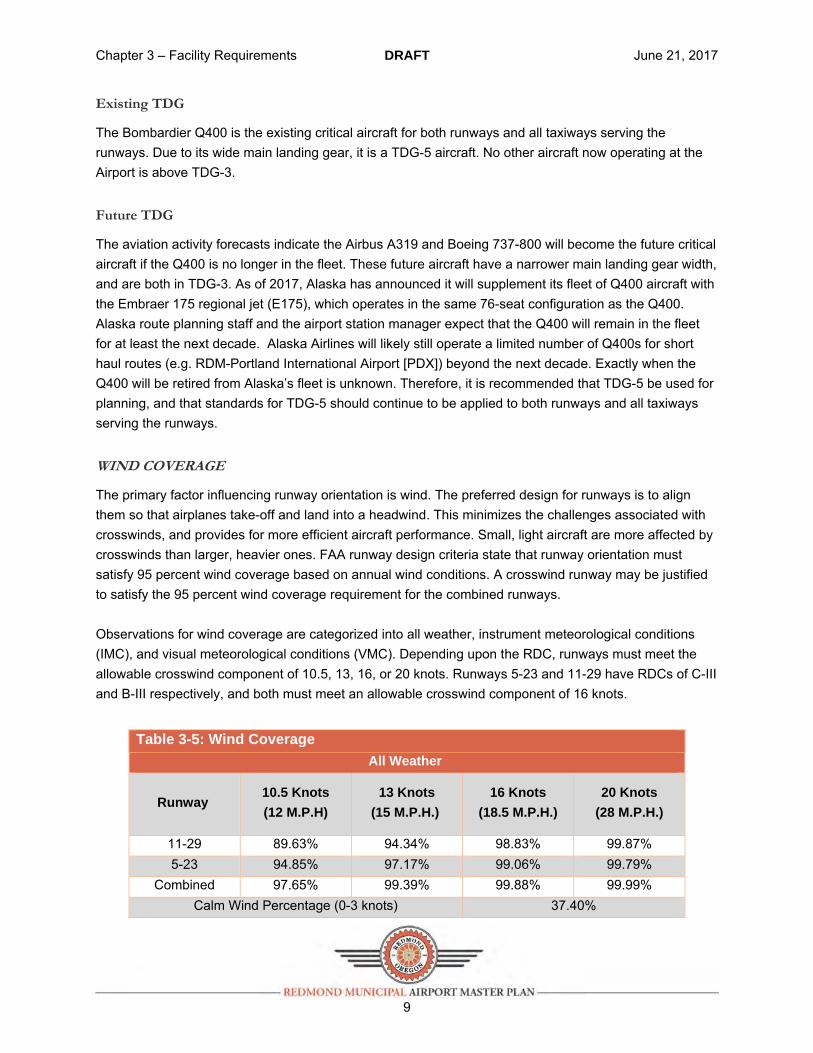
The TDG criteria are a new design standard incorporated into AC-13A. The previous RDM Airport Layout Plan (ALP) and Master Plan did not address this standard. The TDG takes into account the dimensions of the aircraft landing gear to determine taxiway widths and pavement fillets to be provided at taxiway intersections. Fillet pavement accommodates the inner wheel of the airplane as it turns. There are seven (1-7) TDG classifications distinguished by width of the main gear and wheel base (the distance from nose gear to main gear). TDG classifications are presented in Figure 3-2.
Figure 3‐2 TAXIWAY DESIGN GROUPS
Source: Figure 3‐2 from AC 5300‐13a, Change1
Chapter 3 – Facility Requirements DRAFT June 21, 2017
9
Existing TDG
The Bombardier Q400 is the existing critical aircraft for both runways and all taxiways serving the runways. Due to its wide main landing gear, it is a TDG-5 aircraft. No other aircraft now operating at the Airport is above TDG-3.
Future TDG
The aviation activity forecasts indicate the Airbus A319 and Boeing 737-800 will become the future critical aircraft if the Q400 is no longer in the fleet. These future aircraft have a narrower main landing gear width, and are both in TDG-3. As of 2017, Alaska has announced it will supplement its fleet of Q400 aircraft with the Embraer 175 regional jet (E175), which operates in the same 76-seat configuration as the Q400. Alaska route planning staff and the airport station manager expect that the Q400 will remain in the fleet for at least the next decade. Alaska Airlines will likely still operate a limited number of Q400s for short haul routes (e.g. RDM-Portland International Airport [PDX]) beyond the next decade. Exactly when the Q400 will be retired from Alaska’s fleet is unknown. Therefore, it is recommended that TDG-5 be used for planning, and that standards for TDG-5 should continue to be applied to both runways and all taxiways serving the runways.
WIND COVERAGE
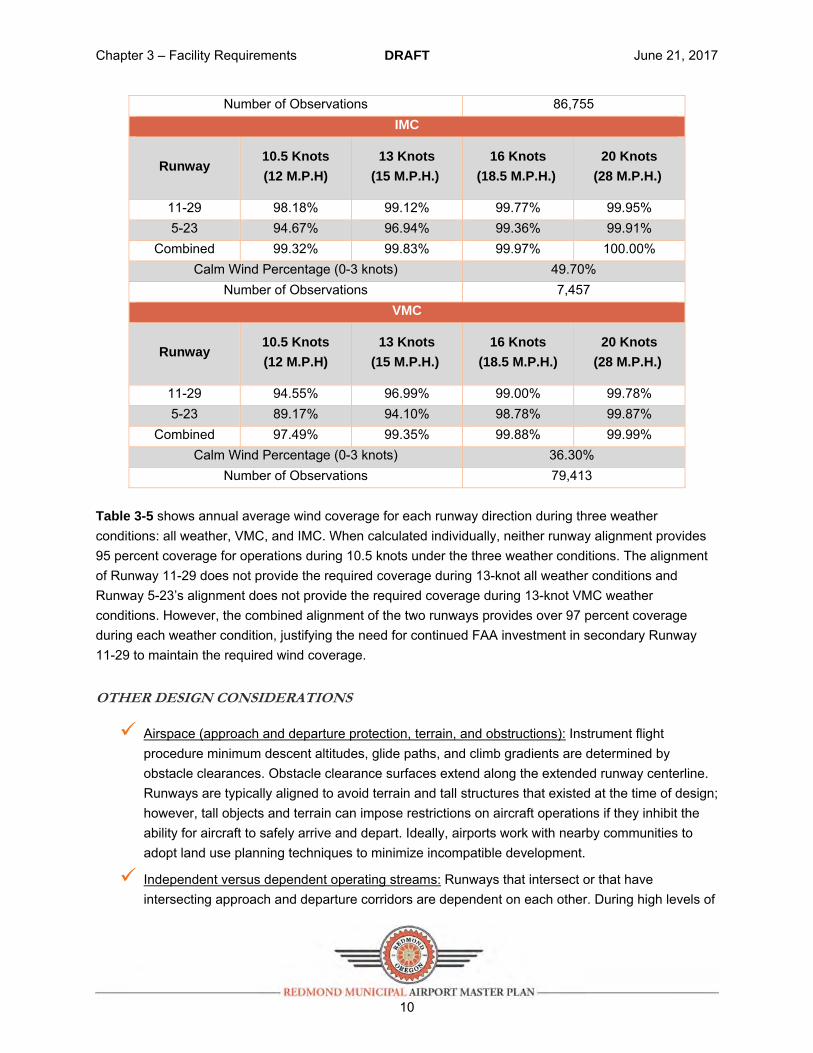
The primary factor influencing runway orientation is wind. The preferred design for runways is to align them so that airplanes take-off and land into a headwind. This minimizes the challenges associated with crosswinds, and provides for more efficient aircraft performance. Small, light aircraft are more affected by crosswinds than larger, heavier ones. FAA runway design criteria state that runway orientation must satisfy 95 percent wind coverage based on annual wind conditions. A crosswind runway may be justified to satisfy the 95 percent wind coverage requirement for the combined runways. Observations for wind coverage are categorized into all weather, instrument meteorological conditions (IMC), and visual meteorological conditions (VMC). Depending upon the RDC, runways must meet the allowable crosswind component of 10.5, 13, 16, or 20 knots. Runways 5-23 and 11-29 have RDCs of C-III and B-III respectively, and both must meet an allowable crosswind component of 16 knots.
Table 3-5: Wind Coverage
All Weather
Runway 10.5 Knots
(12 M.P.H)
13 Knots
(15 M.P.H.)
16 Knots
(18.5 M.P.H.)
20 Knots
(28 M.P.H.)
11-29 89.63% 94.34% 98.83% 99.87% 5-23 94.85% 97.17% 99.06% 99.79%
Combined 97.65% 99.39% 99.88% 99.99% Calm Wind Percentage (0-3 knots) 37.40%
Chapter 3 – Facility Requirements DRAFT June 21, 2017
10
Number of Observations 86,755 IMC
Runway 10.5 Knots
(12 M.P.H)
13 Knots
(15 M.P.H.)
16 Knots
(18.5 M.P.H.)
20 Knots
(28 M.P.H.)
11-29 98.18% 99.12% 99.77% 99.95% 5-23 94.67% 96.94% 99.36% 99.91%
Combined 99.32% 99.83% 99.97% 100.00% Calm Wind Percentage (0-3 knots) 49.70%
Number of Observations 7,457 VMC
Runway 10.5 Knots
(12 M.P.H)
13 Knots
(15 M.P.H.)
16 Knots
(18.5 M.P.H.)
20 Knots
(28 M.P.H.)
11-29 94.55% 96.99% 99.00% 99.78% 5-23 89.17% 94.10% 98.78% 99.87%
Combined 97.49% 99.35% 99.88% 99.99% Calm Wind Percentage (0-3 knots) 36.30%
Number of Observations 79,413 Table 3-5 shows annual average wind coverage for each runway direction during three weather conditions: all weather, VMC, and IMC. When calculated individually, neither runway alignment provides 95 percent coverage for operations during 10.5 knots under the three weather conditions. The alignment of Runway 11-29 does not provide the required coverage during 13-knot all weather conditions and Runway 5-23’s alignment does not provide the required coverage during 13-knot VMC weather conditions. However, the combined alignment of the two runways provides over 97 percent coverage during each weather condition, justifying the need for continued FAA investment in secondary Runway 11-29 to maintain the required wind coverage.
OTHER DESIGN CONSIDERATIONS
Airspace (approach and departure protection, terrain, and obstructions): Instrument flight procedure minimum descent altitudes, glide paths, and climb gradients are determined by obstacle clearances. Obstacle clearance surfaces extend along the extended runway centerline. Runways are typically aligned to avoid terrain and tall structures that existed at the time of design; however, tall objects and terrain can impose restrictions on aircraft operations if they inhibit the ability for aircraft to safely arrive and depart. Ideally, airports work with nearby communities to adopt land use planning techniques to minimize incompatible development.
Independent versus dependent operating streams: Runways that intersect or that have intersecting approach and departure corridors are dependent on each other. During high levels of
Chapter 3 – Facility Requirements DRAFT June 21, 2017
11
activity, these dependencies cause delay. As delays increase, establishment of an independent operating stream may be necessary. This can be accomplished by providing a new parallel runway with sufficient lateral separation from existing runways. Airplane wake turbulence and instrument landing capabilities are considerations when determining the amount of space needed between parallel runways.
ATCT Line of Sight: Air traffic controllers require an uninterrupted line of sight between the air traffic control tower (ATCT) and approach and departure corridors, runways, taxiways, and aprons. Protection of controller line of sight is considered in airport development.
NAVAID critical areas: Electronic equipment used for navigation, communication, security, and surveillance are commonly found throughout airport property. In order to function properly, most of these items require clear and graded areas, setbacks from certain objects and construction materials, and a clear corridor between transmitters and receivers. Development and most activities are restricted in these areas.
Visual aids to navigation: Certain visual aids, including the airport beacon, runway approach lighting, and runway glide path indicator lights require unobstructed line of sight from aircraft in flight. This line of sight is considered in the planning and design of airport facilities.
3.2.3 RUNWAY SYSTEM
RUNWAY DESIGN STANDARDS
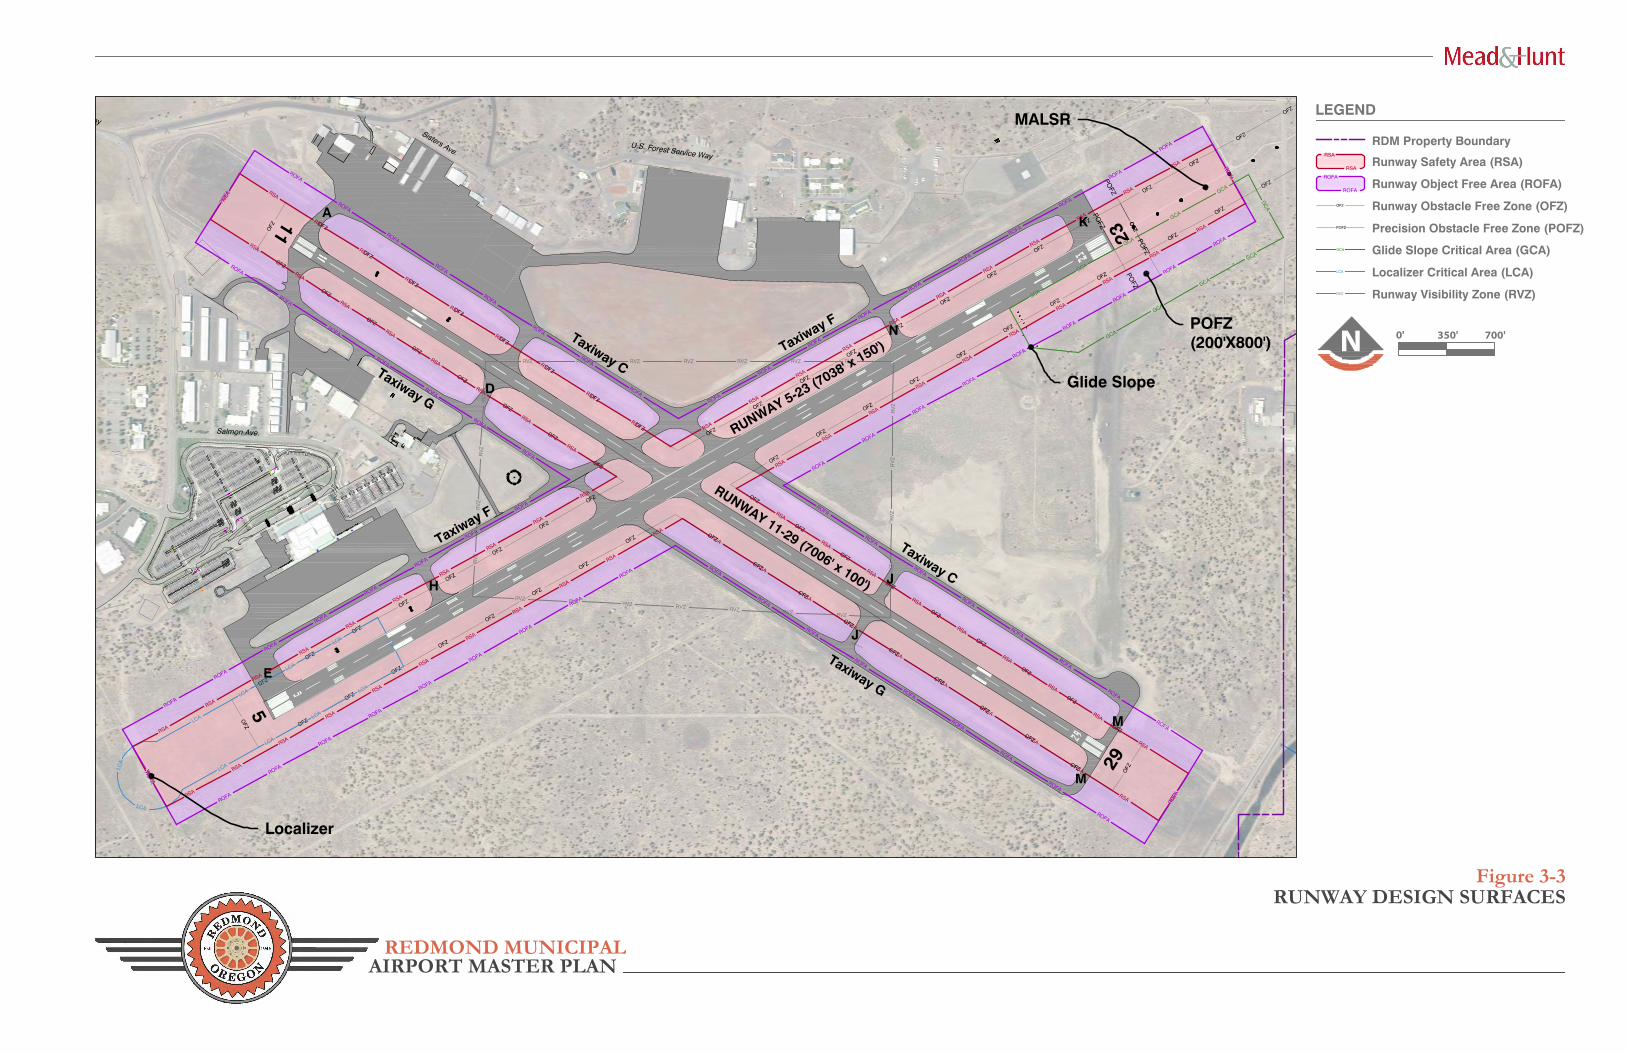
FAA AC-13A stipulates the design criteria, surfaces, and dimensions for each runway. Dimensions for the design surfaces are based upon the critical aircraft and reference code plus the type of approach instrumentation available. A brief explanation of each design surface is presented below. All runway design surfaces and instrument landing system critical areas are illustrated on Figure 3-3. Summary matrices (Tables 3-7 and 3-8) are included following the explanations.
Runway Safety Area (RSA)
The RSA provides a graded, clear area for aircraft in case of a runway excursion, and provides greater accessibility for firefighting and rescue equipment during such incidents. The RSA must be clear of all objects and capable of supporting aircraft, maintenance vehicles, and rescue vehicles. The FAA does not grant modifications to RSA standards, meaning that non-standard RSAs must be corrected as soon as possible. RSAs are illustrated with a red line in Figure 3-3. The RSA for each runway meets FAA design standards for the existing configuration. Impacts to the RSA from a potential runway extension will be explored in the Chapter 4 Alternatives Analysis. The Airport is required to continue to maintain a clear and graded area
Runway Safety Area (RSA): A rectangular area surrounding a runway suitable for reducing the risk of damage to aircraft in the event of an undershoot, overshoot, or excursion from the runway.
Object Free Area (OFA): A rectangular area centered on a runway, taxiway, or taxilane centerline provided to enhance the safety of aircraft operations by remaining clear of objects.
Chapter 3 – Facility Requirements DRAFT June 21, 2017
12
for each RSA lateral to, and beyond the runway end. Response to inspections by the FAA Runway Safety Action Team, who conducts inspections on a regular basis, will help maintain required grading.
Runway Object Free Area (ROFA)
ROFA standards require clearing of above-ground objects protruding above the nearest point of the RSA. Objects non-essential for air navigation must not be placed in the ROFA. Except where precluded by other standards, objects that need to be located in the ROFA for air navigation or aircraft ground maneuvering purposes are allowed to penetrate the ROFA. The ROFAs at RDM are illustrated with a purple line in Figure 3-3. The ROFAs for both runways currently meet standards.
Runway Obstacle Free Zone (ROFZ)
ROFZs are defined three-dimensional volumes of airspace centered above the runway centerline that must be kept clear during aircraft operations. The shape and size of the ROFZ is dependent on the size of aircraft using the runway and the approach minimums for a specific runway end. The ROFZ extends 200 feet beyond each end of each runway. The width of the ROFZs for both runways at RDM is 400 feet. The ROFZs at RDM are illustrated with a black line in Figure 3-3. The ROFZs for both runways at RDM meet FAA standards.
Inner-Approach Obstacle Free Zone (IAOFZ)
The IAOFZ only applies to the ends of runways that have an approach lighting system. Therefore, at RDM an IAOFZ only exists in the area before the threshold for Runway 23. IAOFZs begin 200 feet beyond the runway threshold at the same elevation as the runway threshold and extends 200 feet beyond the last light unit in the approach lighting system. The width is the same as the ROFZ (400 feet) and rises at a slope of 50 (horizontal) to 1 (vertical). The IAOFZ is shown with a black line in Figure 3-3.The IAOFZ for Runway 23 at RDM meets FAA standards.
POFZ
POFZ
POFZ
POFZ
OFZ
OFZ
OFZ
OFZ
OFZ
OFZ
OFZ
OFZ
OFZ
LCA
OFZ
OFZ
OFZ
OFZ
OFZ
OFZ
OFZ
OFZ
OFZ
OFZ
OFZ
OFZ
OFZ
OFZ
OFZ
OFZ
LCA
LCA
OFZ
OFZ
OFZ
OFZ
OFZ
OFZ
OFZ
OFZ
x
x
RV
ZR
VZ
RV
ZR
VZ
RV
ZR
VZ
RV
ZR
VZ
RVZ RVZ RVZ RVZ RVZ RVZ RVZ
RVZ RVZ RVZ RVZ RVZ RVZ RVZ
RSA
RSA
RSA
RSA
RSA
RSA
RSA
RSA
RSA
RSA
RSARSA
RSA
RSA
RSA
RSA
RSA
RSA
RSA
RSA
RSA
RSA
RSA
RSA
RSA
RSA
RSA
RSA
RSA
RSA
RSA
RSA
OFZ
OFZ
OFZ
OFZ
OFZ
OFZ
OFZ
OFZ
OFZ
OFZ
OFZ
OFZ
OFZ
OFZ
OFZ
OFZ
OFZ
OFZ
OFZ
OFZ
OFZ
OFZ
OFZ
OFZ
OFZ
OFZ
OFZ
OFZ
OFZ
OFZ
OFZ
OFZ
OFZ
OFZ
RSA
RSA
RSA
RSA
RSA
RSA
RSA
RSA
RSA
RSA
xx
x
xx
x
x x
x
LCA
LCA
LCA
LCA
LCA
LCA
LCA
LCA
RSA
x
RSA
RSA
RSA
RSA
RSA
RSA
RSA
RSA
RSA
RSA
RSA
RSA
RSA
RSA
RSA
RSA
RSA
RSA
RSA
RSA
RSA
RSA
RSA
RSA
RSA
RSA
RSA
RSA
RSA
RSA
RSA
RSA
RSA
RSA
RSA
RSA
RSA
RSA
RSA
GCA
GCA
GCA
GCA
GCA
GCA
GCA
GCA
GCA
GC
A
x
xxx
x
xx
x
x
x
Veterans Way
Salmon Ave.
U.S. Forest Service Way
Sisters Ave.
ROFA
ROFA
ROFA
ROFA
ROFA
ROFA
ROFA
ROFA
ROFA
ROFA
ROFA
ROFA
ROFA
ROFA
ROFA
ROFA
ROFA
ROFA
ROFA
ROFA
ROFA
ROFA
ROFA
ROFA
ROFA
ROFA
ROFA
ROFA
ROFA
ROFA
ROFA
ROFA
ROFA
ROFA
ROFA
ROFA
ROFA
ROFA
ROFA
ROFA
ROFA
ROFA
ROFA
ROFA
ROFA
ROFA
ROFA
ROFA
ROFA
ROFA
ROFA
ROFA
ROFA
ROFA
ROFA
ROFA
ROFA
ROFA
ROFA
ROFA
ROFA
ROFA
ROFA
ROFA
ROFA
ROFA
ROFA
ROFA
ROFA
ROFA
ROFA
ROFA
OFZ
OFZ
OFZ
OFZ
OFZ
OFZ
OFZ
OFZ
OFZ
OFZ
OFZ
OFZ
REDMOND MUNICIPAL
Figure 3-3RUNWAY DESIGN SURFACES
N 0' 350' 700'
Localizer
MALSR
Glide Slope
LEGEND
AIRPORT MASTER PLAN
RDM Property Boundary
RSA
RSA
Runway Safety Area (RSA)
ROFA
ROFA
Runway Object Free Area (ROFA)
Runway Obstacle Free Zone (OFZ)OFZ
Glide Slope Critical Area (GCA)GCA
Localizer Critical Area (LCA)LCA
Runway Visibility Zone (RVZ)RVZ
K
N
Taxiway GE
H
Taxiway F
J
M
D
J
M
RUNWAY 11-29 (7006' x 100')
RUNWAY 5-23 (7038' x 150')
Taxiway C
Taxiway G
Taxiway CTaxiway F
29
5
11 23
APrecision Obstacle Free Zone (POFZ)POFZ
POFZ(200'X800')
Chapter 3 – Facility Requirements DRAFT June 21, 2017
14
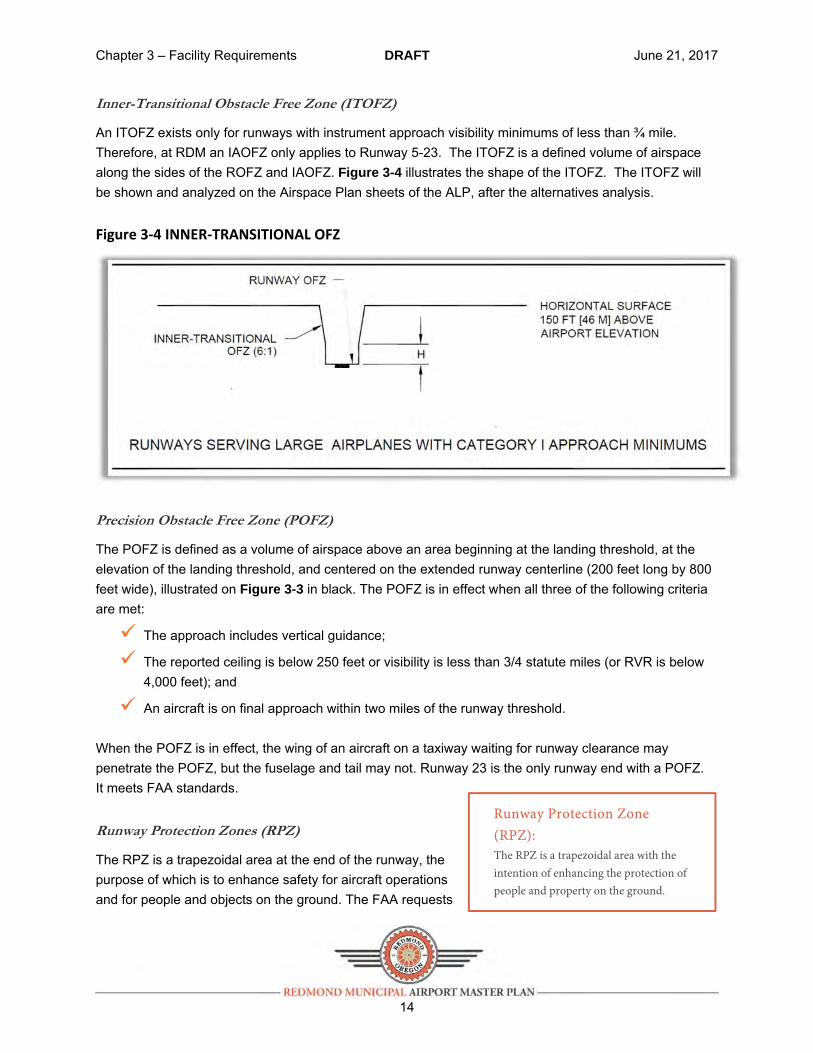
Inner-Transitional Obstacle Free Zone (ITOFZ)
An ITOFZ exists only for runways with instrument approach visibility minimums of less than ¾ mile. Therefore, at RDM an IAOFZ only applies to Runway 5-23. The ITOFZ is a defined volume of airspace along the sides of the ROFZ and IAOFZ. Figure 3-4 illustrates the shape of the ITOFZ. The ITOFZ will be shown and analyzed on the Airspace Plan sheets of the ALP, after the alternatives analysis.
Figure 3‐4 INNER‐TRANSITIONAL OFZ
Precision Obstacle Free Zone (POFZ)
The POFZ is defined as a volume of airspace above an area beginning at the landing threshold, at the elevation of the landing threshold, and centered on the extended runway centerline (200 feet long by 800 feet wide), illustrated on Figure 3-3 in black. The POFZ is in effect when all three of the following criteria are met:
The approach includes vertical guidance;
The reported ceiling is below 250 feet or visibility is less than 3/4 statute miles (or RVR is below 4,000 feet); and
An aircraft is on final approach within two miles of the runway threshold. When the POFZ is in effect, the wing of an aircraft on a taxiway waiting for runway clearance may penetrate the POFZ, but the fuselage and tail may not. Runway 23 is the only runway end with a POFZ. It meets FAA standards.
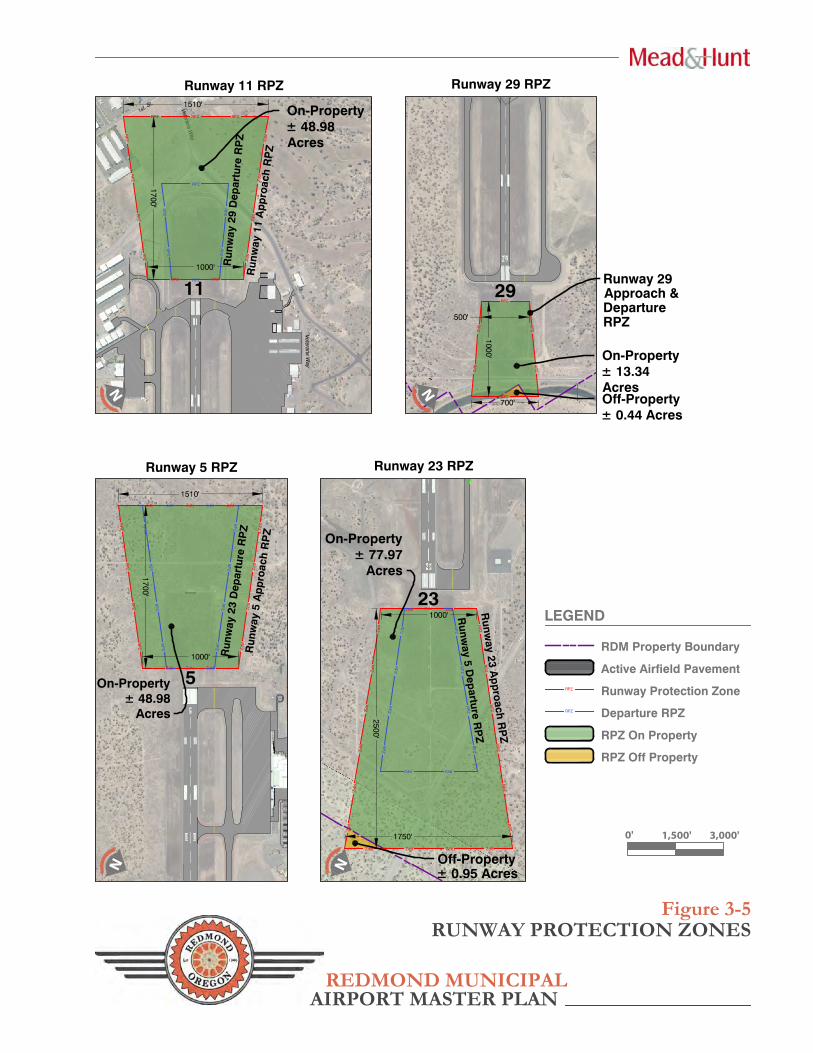
Runway Protection Zones (RPZ)
The RPZ is a trapezoidal area at the end of the runway, the purpose of which is to enhance safety for aircraft operations and for people and objects on the ground. The FAA requests
Runway Protection Zone (RPZ): The RPZ is a trapezoidal area with the intention of enhancing the protection of people and property on the ground.

Chapter 3 – Facility Requirements DRAFT June 21, 2017
15
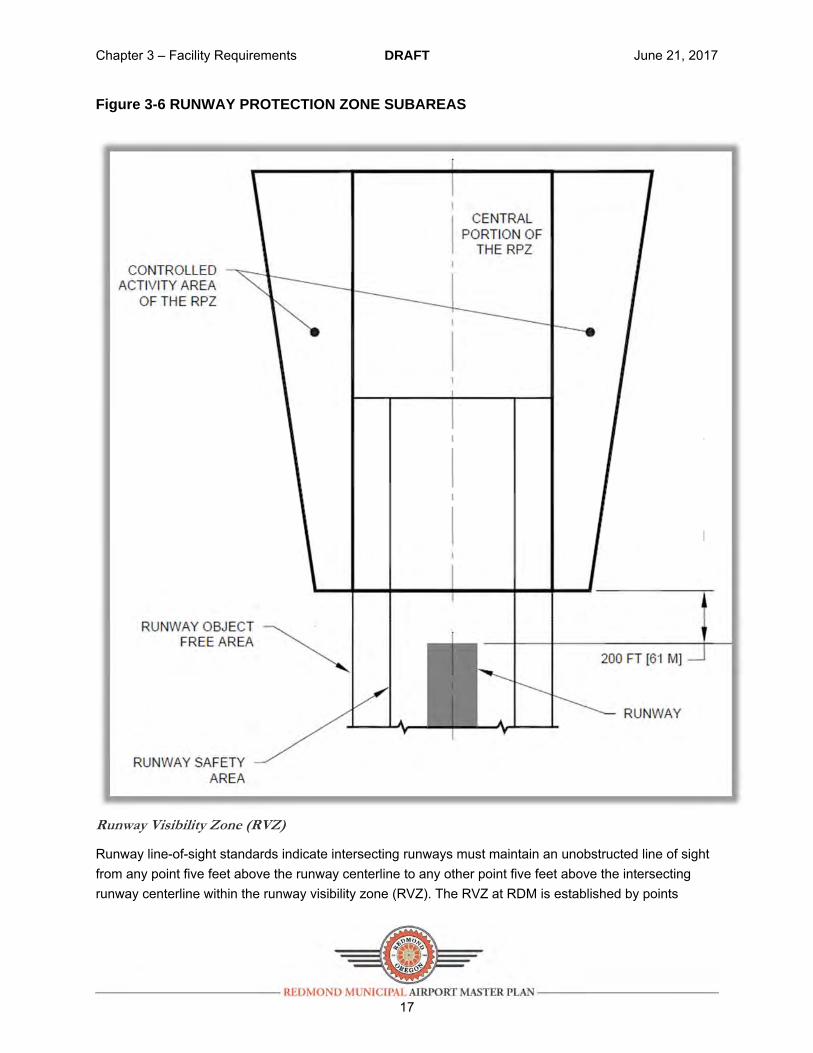
that incompatible land uses, objects, and activities be located outside of the RPZ. The FAA also requests that an airport operator maintain full control of an RPZ, ideally through fee simple property acquisition. If this is not feasible, land use control may be achieved through the use easements. Total acres for the existing RPZs located on and off RDM property are called out in Figure 3-5, and documented in summary Tables 3-7 and 3-8 at the end of this section. The RPZs within the existing airport property and under Airport control are shaded green, and those outside Airport property boundaries are shaded orange. The FAA provides guidance on RPZ land use compatibility in AC-13A and more extensive guidance in the 2012 memorandum Interim Guidance on Land Uses within a Runway Protection Zone. Land uses and structures that are not inherently compatible in the RPZ include: buildings, especially habitable structures or structures of assembly; fuel facilities; hazardous material storage; recreational land uses; and transportation facilities and roads. The City of Redmond is currently in the design process for a realignment of the intersection of SE Veterans Way and SE Airport Way. This intersection is currently located in the central controlled access portion of the Runway 11 approach RPZ (see Figure 3-6). FAA standards discourage intersections located in this portion of an RPZ. The design for the proposed realignment shifts the intersection to outside of the controlled access portion of the RPZ and replaces a three-way stop intersection with a roundabout. The FAA does not have the authority to regulate local land use, so it relies on the airport sponsor to work with local jurisdictions to promote compatible development within the RPZ. Airport actions that introduce incompatible land uses into the RPZ, either by moving a runway end or increasing the size of the RPZ, require coordination with FAA headquarters. This coordination is not needed for existing incompatible land uses if the RPZ does not move or change size. The analysis of runway extension alternatives presented in Chapter 4 addresses property acquisition that would be required to support each alternative.
Veterans Way
1st. St.
Veterans Way
RPZ
RPZ
RP
ZR
PZ
RP
ZR
PZ
RPZ RPZ
RPZ RPZ RPZ
RP
ZR
PZ
RP
ZR
PZ
RP
ZR
PZ
RP
ZR
PZ
1700'
RPZ
RPZ RPZ
RP
ZR
PZ
RP
ZR
PZ
RP
ZR
PZ
RP
ZR
PZ
RPZ RPZ
RPZ RPZ RPZR
PZ
RP
ZR
PZ
RP
Z
RP
ZR
PZ
RP
ZR
PZ
1700'
xx
RPZ
RPZ
RP
ZR
PZ
RP
ZR
PZ
1000'
RPZ
RPZ RPZ
RP
ZR
PZ
RP
ZR
PZ
RP
ZR
PZ
RP
ZR
PZ
RPZRPZ
RPZRPZRPZRPZ
RP
ZR
PZ
RP
ZR
PZ
RP
ZR
PZ
RP
ZR
PZ
RP
ZR
PZ
RP
ZR
PZ
2500'
LEGEND
RDM Property Boundary
Active Airfield Pavement
RPZ Off Property
RPZ On Property
0' 1,500' 3,000'
REDMOND MUNICIPAL
Figure 3-5RUNWAY PROTECTION ZONES
AIRPORT MASTER PLAN
Runway 5 RPZ Runway 23 RPZ
Runway 11 RPZ Runway 29 RPZ
29
23
5
11
RPZ Runway Protection ZoneRPZ Departure RPZ
N
NNN
Off-Property± 0.44 Acres
On-Property± 13.34Acres
On-Property± 48.98Acres
On-Property± 77.97
Acres
On-Property± 48.98
Acres
Runway 29Approach &DepartureRPZ
Run
way
5 A
pp
roac
h R
PZ
Run
way
23
Dep
artu
re R
PZ
Runw
ay 23 Ap
pro
ach RP
Z
Runw
ay 5 Dep
arture RP
Z
Off-Property± 0.95 Acres
Run
way
11
Ap
pro
ach
RP
Z
Run
way
29
Dep
artu
re R
PZ
1000'
1510'
1000'
1750'
700'
500'
1000'
1510'
Chapter 3 – Facility Requirements DRAFT June 21, 2017
17
Figure 3-6 RUNWAY PROTECTION ZONE SUBAREAS
Runway Visibility Zone (RVZ)
Runway line-of-sight standards indicate intersecting runways must maintain an unobstructed line of sight from any point five feet above the runway centerline to any other point five feet above the intersecting runway centerline within the runway visibility zone (RVZ). The RVZ at RDM is established by points
Chapter 3 – Facility Requirements DRAFT June 21, 2017
18
located equidistant from the intersection and the runway ends. The RVZ precludes any fixed or movable objects that may limit line of sight between the runways, and is shown as a blue line in Figure 3-3. The RVZ line-of-sight at RDM is unobstructed. It is recommended that RDM continue to limit any permanent structures with the RVZ.
Hold Positions
RDC determines the holding position distance on each connector taxiway from the runway centerline. AC-13A shows that, for RDC C-III runways such as Runway 5-23, the holding position is 250 feet from the runway centerline. In addition, the distance is increased 1 foot for each 100 feet the airport is above sea level. Using this formula, at 3,080 feet mean sea level (MSL), the required distance for hold positions from the runway centerline is 281 feet on taxiways connecting to Runway 5-23. Currently, the hold lines for Runway 5-23 are located at 200 feet from centerline and do not meet the 281-foot requirement. As Runway 11-29 is designated as RDC B-III, the elevation factor does not apply and the hold positions should be located 200 feet from the runway centerline. For Runway 11-29, the hold lines are currently located at 206 feet from runway centerline, slightly exceeding the requirement AC-13A.
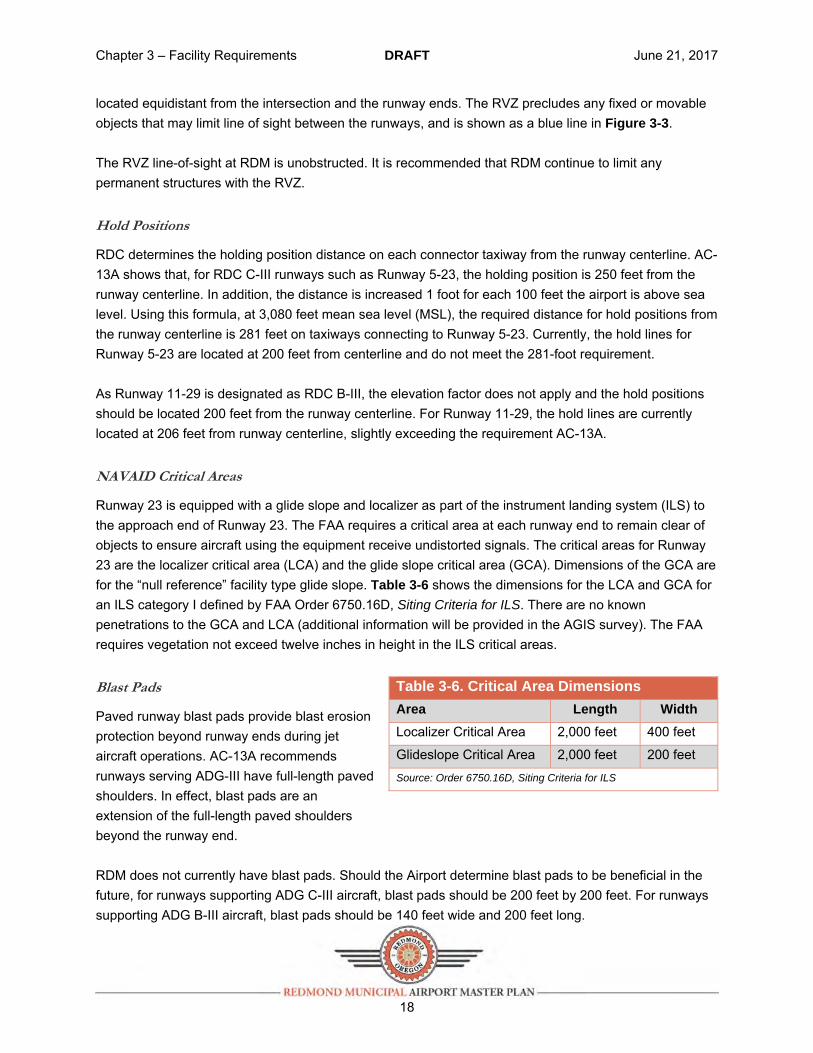
NAVAID Critical Areas
Runway 23 is equipped with a glide slope and localizer as part of the instrument landing system (ILS) to the approach end of Runway 23. The FAA requires a critical area at each runway end to remain clear of objects to ensure aircraft using the equipment receive undistorted signals. The critical areas for Runway 23 are the localizer critical area (LCA) and the glide slope critical area (GCA). Dimensions of the GCA are for the “null reference” facility type glide slope. Table 3-6 shows the dimensions for the LCA and GCA for an ILS category I defined by FAA Order 6750.16D, Siting Criteria for ILS. There are no known penetrations to the GCA and LCA (additional information will be provided in the AGIS survey). The FAA requires vegetation not exceed twelve inches in height in the ILS critical areas.
Blast Pads
Paved runway blast pads provide blast erosion protection beyond runway ends during jet aircraft operations. AC-13A recommends runways serving ADG-III have full-length paved shoulders. In effect, blast pads are an extension of the full-length paved shoulders beyond the runway end. RDM does not currently have blast pads. Should the Airport determine blast pads to be beneficial in the future, for runways supporting ADG C-III aircraft, blast pads should be 200 feet by 200 feet. For runways supporting ADG B-III aircraft, blast pads should be 140 feet wide and 200 feet long.
Table 3-6. Critical Area Dimensions
Area Length Width
Localizer Critical Area 2,000 feet 400 feet
Glideslope Critical Area 2,000 feet 200 feet
Source: Order 6750.16D, Siting Criteria for ILS
Chapter 3 – Facility Requirements DRAFT June 21, 2017
19
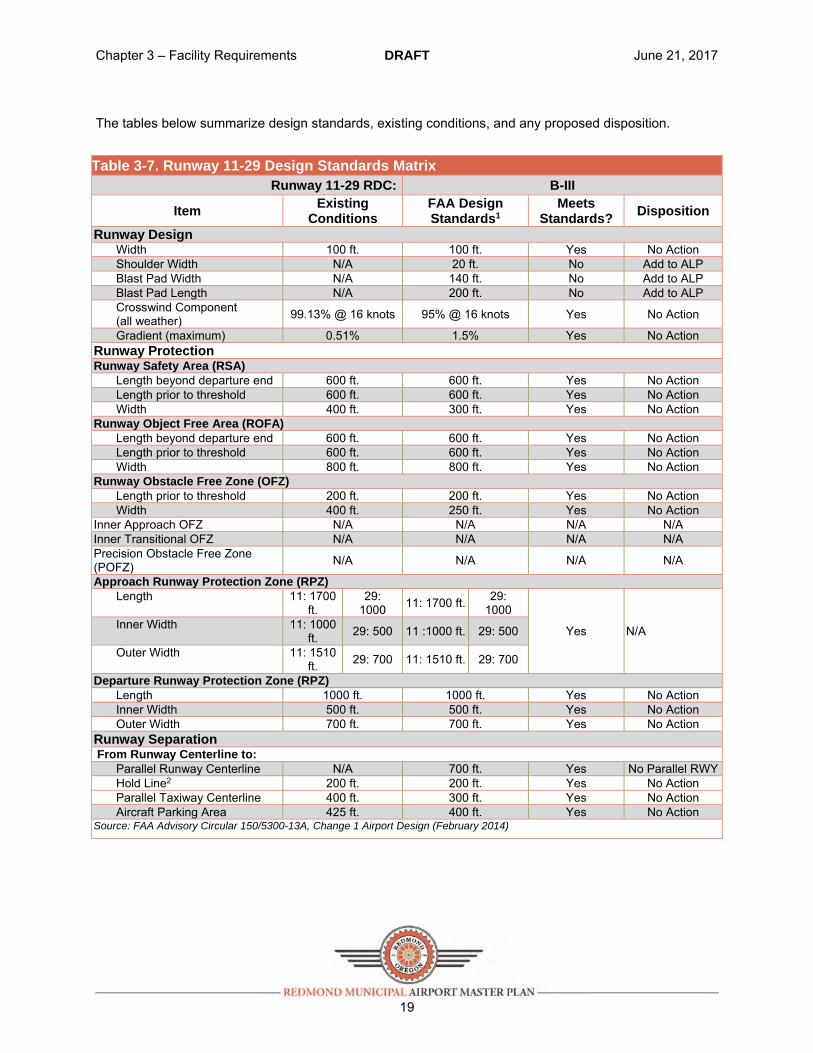
The tables below summarize design standards, existing conditions, and any proposed disposition.
Table 3-7. Runway 11-29 Design Standards Matrix Runway 11-29 RDC: B-III
Item Existing
Conditions FAA Design Standards1
Meets Standards?
Disposition
Runway Design Width 100 ft. 100 ft. Yes No Action Shoulder Width N/A 20 ft. No Add to ALP Blast Pad Width N/A 140 ft. No Add to ALP Blast Pad Length N/A 200 ft. No Add to ALP Crosswind Component (all weather) 99.13% @ 16 knots 95% @ 16 knots Yes No Action
Gradient (maximum) 0.51% 1.5% Yes No Action Runway Protection Runway Safety Area (RSA)
Length beyond departure end 600 ft. 600 ft. Yes No Action Length prior to threshold 600 ft. 600 ft. Yes No Action Width 400 ft. 300 ft. Yes No Action
Runway Object Free Area (ROFA) Length beyond departure end 600 ft. 600 ft. Yes No Action Length prior to threshold 600 ft. 600 ft. Yes No Action Width 800 ft. 800 ft. Yes No Action
Runway Obstacle Free Zone (OFZ) Length prior to threshold 200 ft. 200 ft. Yes No Action Width 400 ft. 250 ft. Yes No Action
Inner Approach OFZ N/A N/A N/A N/A Inner Transitional OFZ N/A N/A N/A N/A Precision Obstacle Free Zone (POFZ) N/A N/A N/A N/A
Approach Runway Protection Zone (RPZ) Length 11: 1700
ft. 29:
1000 11: 1700 ft. 29: 1000
Yes N/A Inner Width 11: 1000 ft. 29: 500 11 :1000 ft. 29: 500
Outer Width 11: 1510 ft. 29: 700 11: 1510 ft. 29: 700
Departure Runway Protection Zone (RPZ) Length 1000 ft. 1000 ft. Yes No Action Inner Width 500 ft. 500 ft. Yes No Action Outer Width 700 ft. 700 ft. Yes No Action
Runway Separation From Runway Centerline to:
Parallel Runway Centerline N/A 700 ft. Yes No Parallel RWYHold Line2 200 ft. 200 ft. Yes No Action Parallel Taxiway Centerline 400 ft. 300 ft. Yes No Action Aircraft Parking Area 425 ft. 400 ft. Yes No Action
Source: FAA Advisory Circular 150/5300-13A, Change 1 Airport Design (February 2014)

Chapter 3 – Facility Requirements DRAFT June 21, 2017
20
Table 3-8. Runway 5-23 Design Standards Matrix Runway 5-23 RDC: C-III
Item Existing ConditionsFAA Design Standards1
Meets Standards?
Disposition
Runway Design Width 150 ft. 150 ft. Yes No Action Shoulder Width N/A 25 ft. No Add to ALP Blast Pad Width N/A 200 ft. No Add to ALP Blast Pad Length N/A 200 ft. No Add to ALP Crosswind Component (all weather) 99.07% @ 16 knots 95% @ 16 knots Yes No Action
Gradient (maximum) 0.29% 1.5% Yes No Action Runway Protection Runway Safety Area (RSA)
Length beyond departure end
1000 ft. 1000 ft. Yes No Action
Length prior to threshold 1000 ft. 600 ft. Yes No Action Width 500 ft. 500 ft. Yes No Action
Runway Object Free Area (ROFA) Length beyond departure end
1000 ft. 1000 ft. Yes No Action
Length prior to threshold 1000 ft. 600 ft. Yes No Action Width 800 ft. 800 ft. Yes No Action
Runway Obstacle Free Zone (OFZ) Length prior to threshold 200 ft. 200 ft. Yes No Action Width 400 ft. 250 ft. Yes No Action
Inner Approach OFZ N/A N/A N/A N/A Inner Transitional OFZ N/A N/A N/A N/A Precision Obstacle Free Zone (POFZ) (Runway 23 only)
Length N/A 200 ft. No Add to ALP Width N/A 800 ft. No Add to ALP
Approach Runway Protection Zone (RPZ) Length 5: 1700 ft. 23: 2500 5: 1700 ft. 23: 2500
ft.
Yes N/A Inner Width 5: 1000 ft. 23: 1000 5 :1000 ft. 23: 1000 ft.
Outer Width 5: 1510 ft. 23: 1750 5: 1510 ft. 23: 1750 ft.
Departure Runway Protection Zone (RPZ) Length 1,700 ft. 1700 ft. Yes No Action Inner Width 500 ft. 500 ft. Yes No Action Outer Width 1,010 ft. 1010 ft. Yes No Action
Runway Separation From Runway Centerline to:
Parallel Runway Centerline N/A 700 ft. No No Parallel RWY
Hold Line2 250 ft. 250 ft. Yes No Action Parallel Taxiway Centerline 400 ft. 400 ft. Yes No Action Aircraft Parking Area 540 ft. 500 ft. Yes No Action
Source: FAA Advisory Circular 150/5300-13A, Change 1 Airport Design (February 2014)
Runway Length
The performance requirements of the critical aircraft designated for a runway determine an airport’s recommended runway length. Performance capabilities of individual aircraft are, in turn, affected by
Chapter 3 – Facility Requirements DRAFT June 21, 2017
21
factors including the aircraft payload and fuel load, the runway elevation, wind conditions, and air temperature. Currently, Runway 5-23 is 7,038 feet long and Runway 11-29 is 7,006 feet long. At these lengths, the runways adequately serve the range of piston and jet aircraft now operating at the Airport. RDM has direct flights to seven airline hubs, all under 1,000 nautical miles (nm) from the Airport. With a few aircraft and time of year exceptions, the runway length is generally sufficient1 for current aircraft and current destinations. However, as new airlines begin serving RDM, and existing airlines change fleets and add new destinations, a wide range of aircraft could serve the Airport in the future. As noted in the discussion of critical aircraft earlier in this chapter, specific fleet mix changes anticipated at the Airport include:
Replacement of Q4002 with ERJ-175
Regional jet (CRJ-200, 700 and 900) replacement with narrow body aircraft (A320 and 737). This section examines whether the available runway length meets the needs not only of existing users, but also those of future critical aircraft serving future destinations. To analyze the runway requirements for these new aircraft types, an understanding of the factors that impact aircraft performance is necessary. The following paragraphs explain the terminology and variables used in the runway length assessment.
Elevation
RDM has four runway ends from which aircraft can operate, ranging from 3,044 feet above mean sea level (AMSL) to 3,080 feet AMSL, which is the official airport elevation.
International Standard Atmosphere (ISA)
This mathematical model describes how the earth’s atmosphere, or air pressure and density, change depending on altitude. The atmosphere is less dense at higher elevations. ISA is frequently used in aircraft performance calculations because deviation from ISA will change how an aircraft performs. ISA at sea level occurs when the temperature is 59°F. ISA at RDM’s 3,080 feet AMSL occurs when the temperature is 48°F.
Density Altitude (DA)
This measurement comparing air density at a point in time and specific location to ISA is a critical component of aircraft performance calculations. DA is used to understand how aircraft performance differs than the performance that would be expected under ISA. DA is primarily influenced by elevation and air temperature. To examine the effect of changes to either variable, this calculation holds the other variable constant.
1 CRJ-200 operations to certain destinations during summer months are occasionally weight restricted on departure from RDM. 2 Some Q400 operations associated with short haul routes such as RDM-PDX will remain into the future.
Chapter 3 – Facility Requirements DRAFT June 21, 2017
22
When elevation is constant: When air temperature increases, DA increases. When air temperature decreases, DA decreases. This comparison is often used when analyzing aircraft performance at a particular airport during different times of the day and different days of the year.
When temperature is constant: When elevation increases, DA increases. When elevation decreases, DA decreases. This comparison, which is not often used, can be employed to compare aircraft performance at different airports under identical climate conditions.
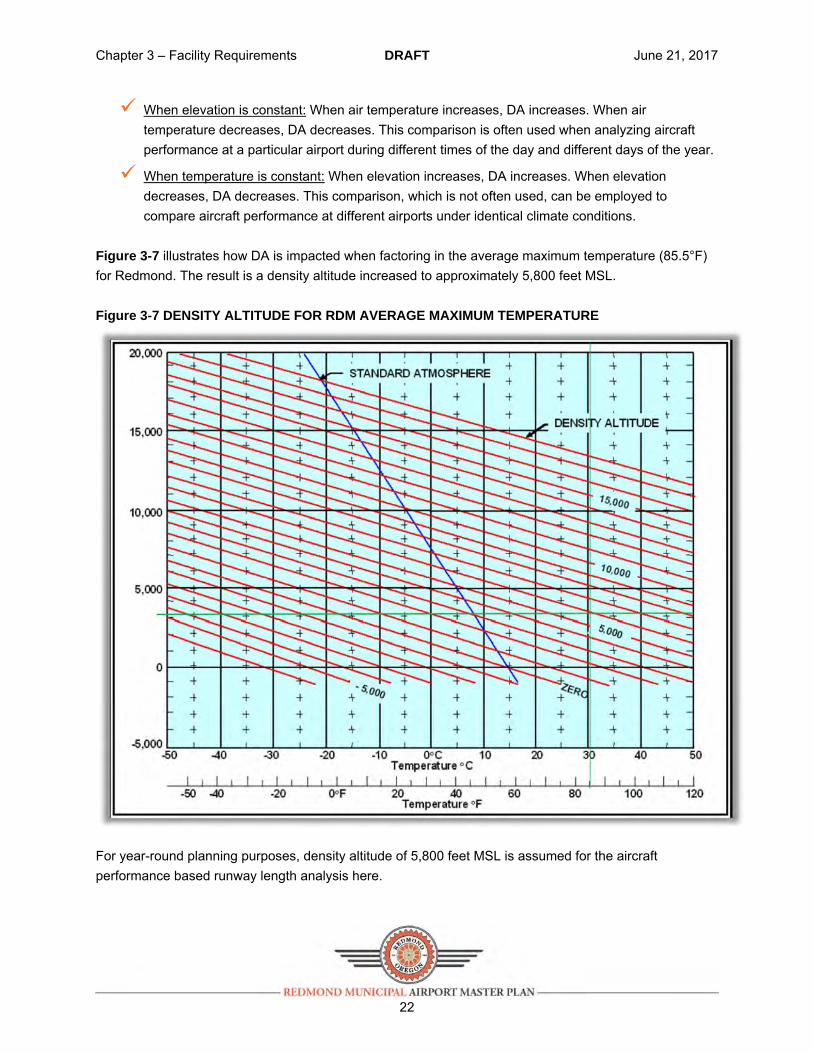
Figure 3-7 illustrates how DA is impacted when factoring in the average maximum temperature (85.5°F) for Redmond. The result is a density altitude increased to approximately 5,800 feet MSL. Figure 3-7 DENSITY ALTITUDE FOR RDM AVERAGE MAXIMUM TEMPERATURE
For year-round planning purposes, density altitude of 5,800 feet MSL is assumed for the aircraft performance based runway length analysis here.

Chapter 3 – Facility Requirements DRAFT June 21, 2017
23
Future Fleet and Destinations
DA, aircraft takeoff weight, and aircraft performance are the three primary factors to be considered when determining runway length requirements. Aircraft takeoff weight is directly related to the distance of the flight. For shorter distances, aircraft may be able to depart with a full passenger cabin and less than full fuel tanks. In those instances, the aircraft will typically be departing below MTOW and experience better takeoff performance. Aircraft will typically require a full load of fuel for longer trips. A full passenger cabin and full load of fuel will be close to the aircraft’s MTOW. This runway length analysis looks at the future fleet changes as discussed in Chapter 2 in conjunction with destinations likely to be served from RDM in the future. Destination distance is a critical factor in this analysis. RDM currently sees non-stop service to the airline hubs within 1,000 nm distance (Seattle-Tacoma International Airport, Portland International Airport, Salt Lake City International Airport, San Francisco International Airport, Los Angeles International Airport, Phoenix Sky Harbor International Airport). The next step beyond those hubs would be direct flights to Midwest or midcontinent hubs such as Minneapolis-Saint Paul, Minnesota; Denver, Colorado; and Houston and Dallas/Fort Worth, Texas. Those cities are all within 1,500 nm, which is a reasonable range for the forecast airline fleet, and likely destinations within the 20-year planning window. The following analysis documents calculated takeoff weights for each of the air carrier aircraft types to reach a 1,500 nm destination. Those takeoff weights are then used with the aircraft manufacturer’s performance tables contained in their respective airport planning manuals to determine a runway length requirement for the future.
Runway Length Recommendation
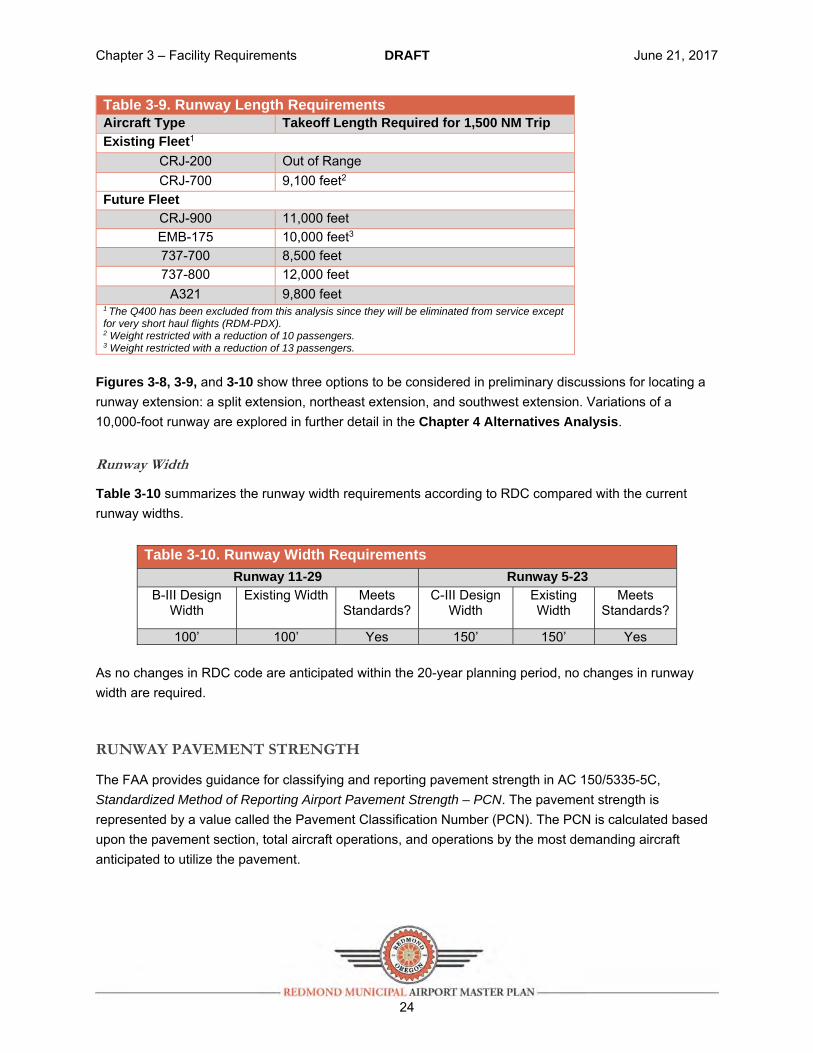
Using the 1,500 nm destination, as mentioned above, results in varying takeoff length requirements for the different aircraft types, as shown in Table 3-9. The CRJ-200 is not capable of flying for 1,500 nm. For the CRJ-700, 1,500 nm is near the range limits of the aircraft, and it must be weight restricted in order to carry enough fuel for the trip. The 737-700 and A321 can make the trip with a full passenger load, but not with the current RDM runway length. The CRJ-900, 737-800, and EMB-175 would require some weight adjustments (e.g., blocked seats) in order to make the 1,500 nm trip. The 1,500 nm destination is near the range limit of the EMB-175. No additional runway length would improve the passenger carrying capacity for the EMB-175 at RDM when adjusted for DA.
Chapter 3 – Facility Requirements DRAFT June 21, 2017
24
Table 3-9. Runway Length RequirementsAircraft Type Takeoff Length Required for 1,500 NM Trip
Existing Fleet1 CRJ-200 Out of Range CRJ-700 9,100 feet2
Future Fleet CRJ-900 11,000 feet EMB-175 10,000 feet3 737-700 8,500 feet 737-800 12,000 feet
A321 9,800 feet 1 The Q400 has been excluded from this analysis since they will be eliminated from service except for very short haul flights (RDM-PDX). 2 Weight restricted with a reduction of 10 passengers. 3 Weight restricted with a reduction of 13 passengers.
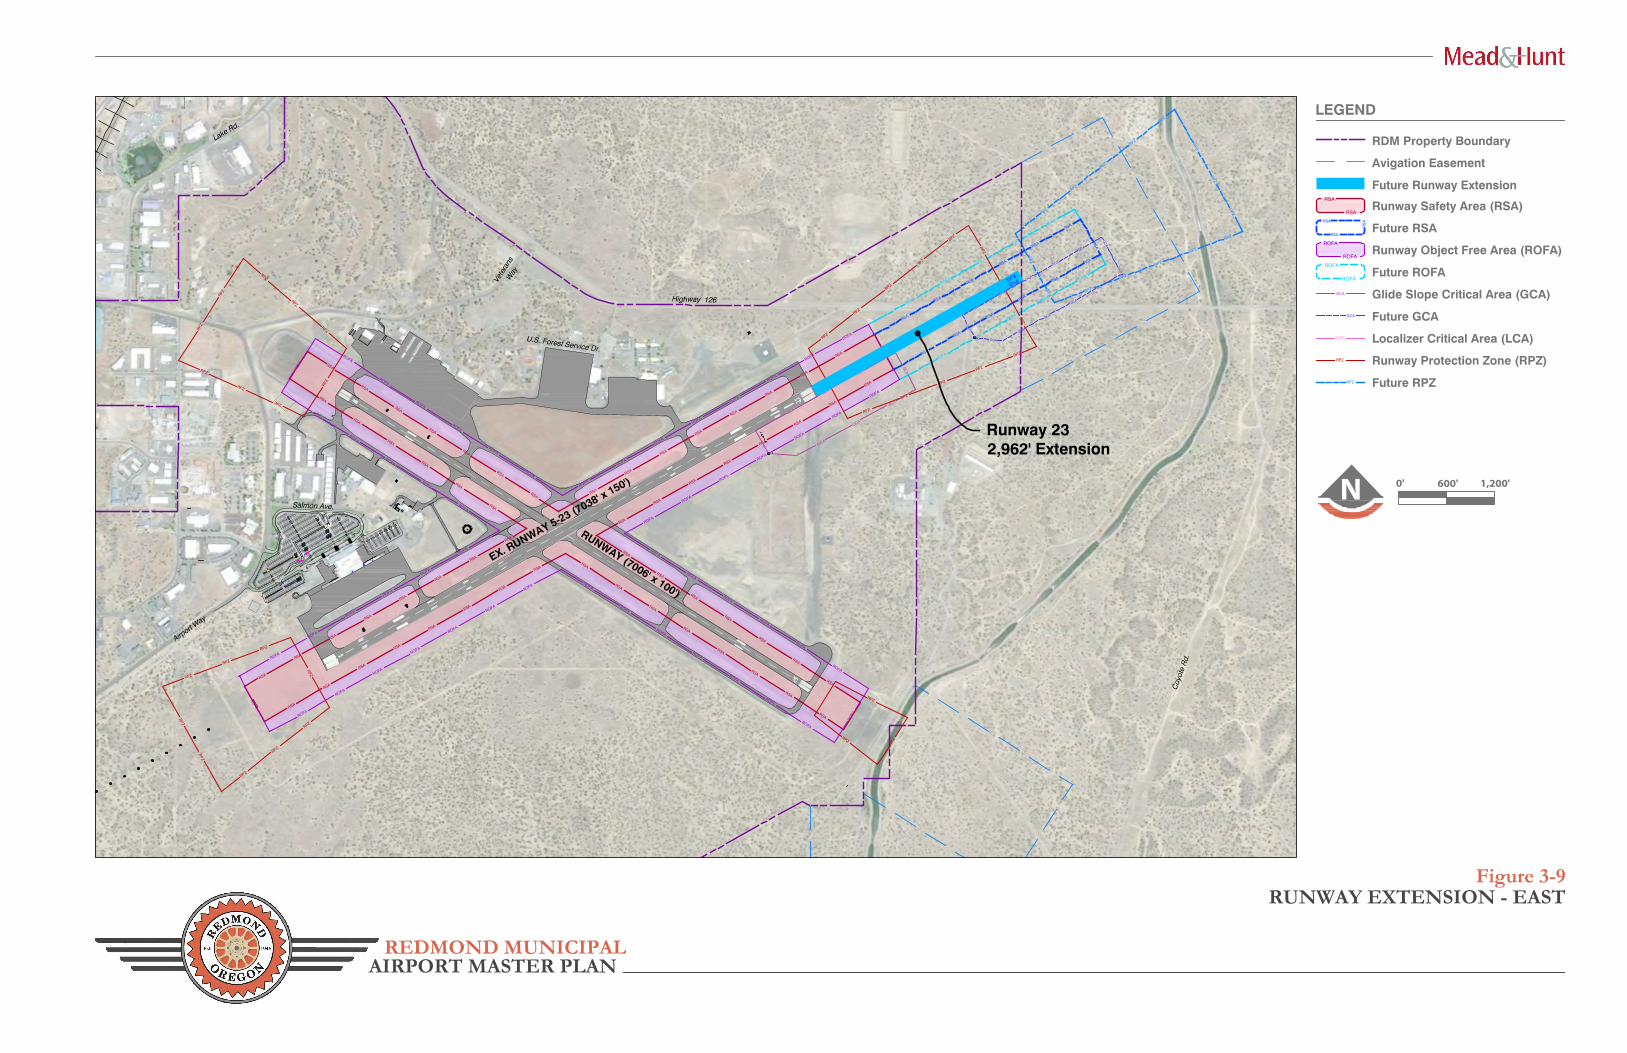
Figures 3-8, 3-9, and 3-10 show three options to be considered in preliminary discussions for locating a runway extension: a split extension, northeast extension, and southwest extension. Variations of a 10,000-foot runway are explored in further detail in the Chapter 4 Alternatives Analysis.
Runway Width
Table 3-10 summarizes the runway width requirements according to RDC compared with the current runway widths.
Table 3-10. Runway Width Requirements
Runway 11-29 Runway 5-23 B-III Design
Width Existing Width Meets
Standards?C-III Design
Width Existing Width
Meets Standards?
100’ 100’ Yes 150’ 150’ Yes As no changes in RDC code are anticipated within the 20-year planning period, no changes in runway width are required.
RUNWAY PAVEMENT STRENGTH
The FAA provides guidance for classifying and reporting pavement strength in AC 150/5335-5C, Standardized Method of Reporting Airport Pavement Strength – PCN. The pavement strength is represented by a value called the Pavement Classification Number (PCN). The PCN is calculated based upon the pavement section, total aircraft operations, and operations by the most demanding aircraft anticipated to utilize the pavement.

LCA
LCA
RPZ
RPZRPZ
RPZ
RPZ
RPZ
RPZ
RPZ
RPZ
RPZ
RPZ
RPZ
RSA
RSA
RSA
RSA
ROFA
ROFA
ROFA
ROFA
RSA
RSA
RSA
RSA
RSA
RSA
RSA
RSARSA
RSA
RSA
RSA
RSA
RSA
RSA
RSA
RSA
RSA
RSA
RSA
RSA
RSA
RSA
RSA
RPZ
RPZ
RPZ
RSA
RSA
RSA
RSA
RSA
RSA
RSA
LCA
LCA
LCA
LCA
LCA
LCA
RSA
RSA
RSA
ROFA
ROFA
ROFA
ROFA
RPZ
RPZ
RPZRPZ
RPZ
RPZ
RPZ
RPZ
RPZ
RPZ
RPZ
RPZ
RPZ
RPZ
RPZ
RSA
RSA
RSA
RSA
RSA
RSA
RSA
RSA
RSA
RSA
RSA
RSA
RSA
RSA
RSA
RSA
RSA
RSA
RSA
RSA
RSA
RSA
RSA
RSA
RSA
RSA
RSA
RSA
RSA
RSA
RSA
RSA
RSA
RSA
RSA
RSA
GCA
GCA
GCA
GCA
GCA
GCA
GCA
GCA
GCA
GCA
GCA
GC
A
1st.
St.
RPZ
RPZ
RPZ
RPZ
RPZ
RPZ
RPZ
RPZ
RPZ
RPZ
RPZ
RPZ
RPZ
RPZ
RPZ
RPZ
RPZ
RPZ
RPZ
RPZ
RPZ
RPZ
RPZ
RPZ
RPZ
RPZ
RPZ
RPZ
RPZ
RPZ
RPZ
RPZ
RPZ
RPZ
RPZ
ROFA
ROFA
ROFA
ROFA
ROFA
ROFA
ROFA
ROFA
ROFA
ROFA
ROFA
ROFA
ROFA
ROFA
ROFA
ROFA
ROFA
ROFA
ROFA
ROFA
ROFA
ROFA
ROFA
ROFA
ROFA
ROFA
ROFA
ROFA
ROFA
ROFA
ROFA
ROFA
ROFA
ROFA
ROFA
ROFA
ROFA
ROFA
ROFA
ROFA
ROFA
ROFA
ROFA
ROFA
ROFA
ROFA
ROFA
ROFA
ROFA
ROFA
ROFA
ROFA
ROFA
ROFA
ROFA
ROFA
REDMOND MUNICIPAL
Figure 3-8RUNWAY EXTENSION - SPLIT
N 0' 600' 1,200'
Runway 51,462' Extension
LEGEND
AIRPORT MASTER PLAN
RDM Property Boundary
RSA
RSA
Runway Safety Area (RSA)
ROFA
ROFA
Runway Object Free Area (ROFA)
Runway Obstacle Free Zone (OFZ)OFZ
Glide Slope Critical Area (GCA)GCA
Localizer Critical Area (LCA)LCA
Runway Protection Zone (RPZ)RPZ
Runway 231,500' Extension
Future RPZRPZ
Runway Visibility Zone (RVZ)RVZ
RSA
RS
ARSA
Future RSA
ROFA
ROFA
Future ROFA
Future Runway Extension
Avigation Easement
Airport W
ay
Salmon Ave.
Vete
rans
Highway 126
U.S. Forest Service Dr.
EX. RUNWAY 5-23 (7038' x 150')
RUNWAY (7006' x 100')
Lake Rd.
Way
Mou
ntai
n P
kwy.
RSA
RSA
RSA
RSA
RSA
RSA
RSA
RSARSA
RSA
RSA
RSA
RSA
RSA
RSA
RSA
RSA
RSA
RSA
RSA
RSA
RSA
RSA
RSA
RSA
RSA
RSA
RSA
RSA
RSA
RSA
RSA
RSA
RSA
RSA
RSA
RSA
ROFA
ROFA
ROFA
ROFA
ROFA
ROFA
ROFA
ROFA
ROFA
ROFA
RPZ
RPZ
RPZRPZ
RPZ
RPZ
RPZ
RPZ
RPZ
RPZ
RPZ
RPZ
RPZ
RPZ
RPZ
RSA
RSA
RSA
RSA
RSA
RSA
RSA
RSA
RSA
RSA
RSA
RSA
RSA
RSA
RSA
RSA
RSA
RSA
RSA
RSA
RSA
RSA
RSA
RSA
RSA
RSA
RSA
RSA
RSA
RSA
RSA
RSA
RSA
RSA
RSA
RSA
GCA
GCA
GCA
GCA
GCA
GCA
GC
A
RPZ
RPZ
RPZ
RPZ
RPZ
RPZ
RPZ
RPZ
RPZ
RPZ
RPZ
RPZ
RPZ
RPZ
RPZ
RPZ
RPZ
RPZ
RPZ
RPZ
RPZ
RPZ
RPZ
RPZ
RPZ
RPZ
RPZ
RPZ
RPZ
RPZ
RPZ
RPZ
RPZ
RPZ
RPZ
ROFA
ROFA
ROFA
ROFA
ROFA
ROFA
ROFA
ROFA
ROFA
ROFA
ROFA
ROFA
ROFA
ROFA
ROFA
ROFA
ROFA
ROFA
ROFA
ROFA
ROFA
ROFA
ROFA
ROFA
ROFA
ROFA
ROFA
ROFA
ROFA
ROFA
ROFA
ROFA
ROFA
ROFA
ROFA
ROFA
ROFA
ROFA
ROFA
ROFA
ROFA
ROFA
ROFA
ROFA
ROFA
ROFA
ROFA
ROFA
ROFA
ROFA
ROFA
ROFA
ROFA
ROFA
ROFA
ROFA
GCA
GCA
GCA
GCA
GCA
GC
A
GCA
GCA
GCA
GCA
GCA
GC
A
GC
A
REDMOND MUNICIPAL
Figure 3-9RUNWAY EXTENSION - EAST
LEGEND
AIRPORT MASTER PLAN
RDM Property Boundary
RSA
RSA
Runway Safety Area (RSA)
ROFA
ROFA
Runway Object Free Area (ROFA)
Future GCA GCA
Runway Protection Zone (RPZ)RPZ
Runway 232,962' Extension
Future RPZRPZ
RSA
RS
ARSA
Future RSA
ROFA
ROFA
Future ROFA
Future Runway Extension
Avigation Easement
Salmon Ave.
Airport W
ay
Vete
rans
Highway 126
U.S. Forest Service Dr.
Coy
ote
Rd.
EX. RUNWAY 5-23 (7038' x 150')
RUNWAY (7006' x 100')
Lake Rd.
Glide Slope Critical Area (GCA) GCA
Localizer Critical Area (LCA)LCA
Way
N 0' 600' 1,200'

OFZ
OFZ
OFZ
OFZ
OFZ
OFZ
OFZ
OFZ
OFZ
OFZ
OFZ
OFZ
OFZ
OFZ
OFZ
OFZ
OFZ
OFZ
OFZ
OFZ
OFZ
OFZ
LCA
LCA
OFZ
OFZ
OFZ
OFZ
OFZ
OFZ
RV
ZR
VZ
RV
Z
RV
ZR
VZ
RV
Z
RVZ RVZ RVZ RVZ RVZ RVZ
RVZ RVZ RVZ RVZ RVZ
RSA
RSA
RSA
RSA
RSA
RSA
ROFA
ROFA
ROFA
ROFA
ROFA
ROFA
ROFA
ROFA
ROFA
ROFA
RSA
RSA
RSA
RSA
RSA
RSA
RSA
RSARSA
RSA
RSA
RSA
RSA
RSA
RSA
RSA
RSA
RSA
RSA
RSA
RSA
RSA
RSA
RSA
OFZ
OFZ
OFZ
OFZ
OFZ
OFZ
OFZ
OFZ
OFZ
OFZ
OFZ
OFZ
OFZ
OFZ
OFZ
OFZ
OFZ
OFZ
OFZ
OFZ
OFZ
OFZ
OFZ
OFZ
OFZ
OFZ
RSA
RSA
RSA
RSA
RSA
RSA
RSA
LCA
LCA
LCA
LCA
LCA
LCA
RSA
RSA
RSA
RSA
RSA
RSA
RSA
RSA
RSA
RSA
RSA
RSA
RSA
RSA
RSA
RSA
RSA
RSA
RSA
RSA
RSA
RSA
RSA
RSA
RSA
RSA
RSA
RSA
RSA
RSA
RSA
RSA
RSA
RSA
RSA
GCA
GCA
GCA
GCA
GCA
GCA
GCA
GCA
GCA
GCA
GCA
GC
A
B.N
. RAI
LRO
AD
1st.
St.
SW
13t
h S
t.
RPZ
RPZ
RPZ
RPZ
RPZ
RPZ
RPZ
RPZ
RPZ
RPZ
RPZ
RPZ
RPZ
RPZ
RPZ
RPZ
RPZ
RPZ
RPZ
RPZ
RPZ
RPZ
RPZ
RPZ
RPZ
RPZ
RPZ
RPZ
RPZ
RPZ
RPZ
RPZ
RPZ
RPZ
RPZ
ROFA
ROFA
ROFA
ROFA
ROFA
ROFA
ROFA
ROFA
ROFA
ROFA
ROFA
ROFA
ROFA
ROFA
ROFA
ROFA
ROFA
ROFA
ROFA
ROFA
ROFA
ROFA
ROFA
ROFA
ROFA
ROFA
ROFA
ROFA
ROFA
ROFA
ROFA
ROFA
ROFA
ROFA
ROFA
ROFA
ROFA
ROFA
ROFA
ROFA
ROFA
ROFA
ROFA
ROFA
ROFA
ROFA
ROFA
ROFA
ROFA
ROFA
ROFA
ROFA
ROFA
ROFA
ROFA
ROFA
RPZ
RPZRPZ
RPZ
RPZ
RPZ
RPZ
RPZ
RPZ
RPZ
RPZ
RPZ
RPZ
RPZ
RPZ
RSA
LCA
LCA
LCA
LCA
LCA
LCA
LCA
LCA
REDMOND MUNICIPAL
Figure 3-10RUNWAY EXTENSION - WEST
N 0'
Runway 52,962' Extension
LEGEND
AIRPORT MASTER PLAN
RDM Property Boundary
RSA
RSA
Runway Safety Area (RSA)
ROFA
ROFA
Runway Object Free Area (ROFA)
Glide Slope Critical Area (GCA)GCA
Localizer Critical Area (LCA)LCA
Runway Protection Zone (RPZ)RPZ
Future RPZRPZ
RSA
RS
ARSA
Future RSA
ROFA
ROFA
Future ROFA
Future Runway Extension
Avigation Easement
Airport W
ay
Salmon Ave.
Veterans WayHighway 126
U.S. Forest Service Dr.
EX. RUNWAY 5-23 (7038' x 150')
RUNWAY (7006' x 100')
Future LCALCA
600' 1,200'
Chapter 3 – Facility Requirements DRAFT June 21, 2017
28
Airfield pavements strengths are detailed in Chapter 1 Airport Inventory. The aircraft types that currently operate at the airport are under the pavement strength limits for their respective areas on the airfield. However, as the airline fleet transitions away from regional jets to narrow body aircraft (737 and A319), the pavement ratings will be exceeded. Pavement strength ratings are not necessarily a limit, but rather a design rating. That means aircraft weighing over the design rating will not cause the pavement to immediately fail, but with continued use, the life cycle of the pavement will be reduced. When the Airport does see these larger narrow body airline aircraft increasing in frequency at the airport, pavement strengthening projects should be studied.
Instrument Approaches and Design Surfaces
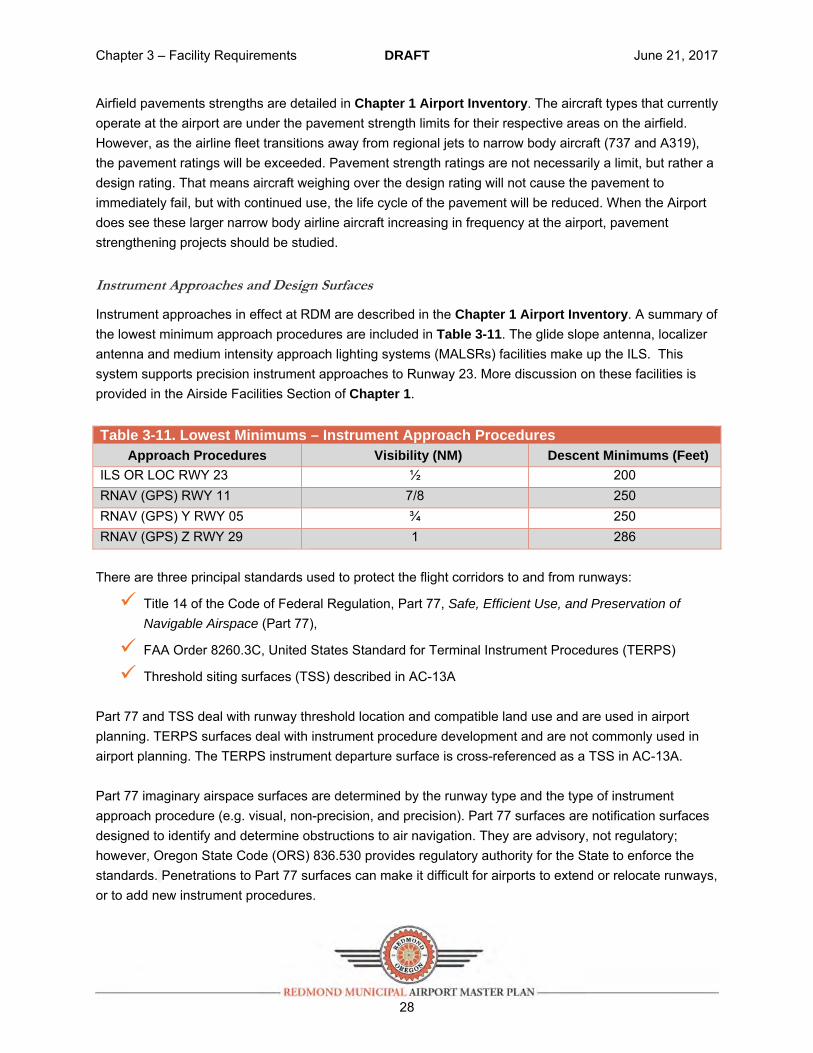
Instrument approaches in effect at RDM are described in the Chapter 1 Airport Inventory. A summary of the lowest minimum approach procedures are included in Table 3-11. The glide slope antenna, localizer antenna and medium intensity approach lighting systems (MALSRs) facilities make up the ILS. This system supports precision instrument approaches to Runway 23. More discussion on these facilities is provided in the Airside Facilities Section of Chapter 1. Table 3-11. Lowest Minimums – Instrument Approach Procedures
Approach Procedures Visibility (NM) Descent Minimums (Feet)
ILS OR LOC RWY 23 ½ 200 RNAV (GPS) RWY 11 7/8 250 RNAV (GPS) Y RWY 05 ¾ 250 RNAV (GPS) Z RWY 29 1 286
There are three principal standards used to protect the flight corridors to and from runways:
Title 14 of the Code of Federal Regulation, Part 77, Safe, Efficient Use, and Preservation of
Navigable Airspace (Part 77),
FAA Order 8260.3C, United States Standard for Terminal Instrument Procedures (TERPS)
Threshold siting surfaces (TSS) described in AC-13A Part 77 and TSS deal with runway threshold location and compatible land use and are used in airport planning. TERPS surfaces deal with instrument procedure development and are not commonly used in airport planning. The TERPS instrument departure surface is cross-referenced as a TSS in AC-13A. Part 77 imaginary airspace surfaces are determined by the runway type and the type of instrument approach procedure (e.g. visual, non-precision, and precision). Part 77 surfaces are notification surfaces designed to identify and determine obstructions to air navigation. They are advisory, not regulatory; however, Oregon State Code (ORS) 836.530 provides regulatory authority for the State to enforce the standards. Penetrations to Part 77 surfaces can make it difficult for airports to extend or relocate runways, or to add new instrument procedures.
Chapter 3 – Facility Requirements DRAFT June 21, 2017
29
TERPS surfaces are determined by the type of instrument approach procedure (e.g. ILS, global positioning system [GPS], VHF Omnidirectional Range [VOR]). TERPS surfaces are regulatory, and penetrations to TERPS surfaces will result in the modification or cancelation of an instrument approach procedure. TSS, also known as obstacle clearance surfaces, are determined by the type of instrument procedure and critical aircraft on each runway, and the visibility minimums of the lowest instrument approach. TSS apply to both approach and departure ends of the runway, and determine the location of the runway thresholds. Penetration of TSS will require modification of departure climb gradient for penetrations to departure TSS, and/or relocation of landing thresholds or reduction in approach procedure capability for penetrations to approach TSS. Airspace surfaces are drawn and analyzed as part of the ALP set development. At this time, no change in approach capabilities are under consideration. The airport already has the full spectrum of approach options.
Runway Lighting and Marking
Runway 5-23 is equipped with high-intensity runway edge lighting, runway end identifier lights, and a MALSR to the approach end of Runway 23. Runway 11-29 is equipped with medium-intensity runway edge lighting and runway end identifier lights. No approach lighting system serves either end of Runway 11-29. Runway 11-29 is marked with non-precision markings and Runway 5-23 is marked with precision markings in accordance with FAA AC 150/5340-1L, Standards for Airport Markings. No major changes, other than periodic maintenance and updates, to the runway markings or lighting systems are recommended within the 20-year planning period.
RUNWAY SYSTEM CONCLUSION AND RECOMMENDATIONS
Runway 5-23 will need an extension to a length of about 10,000 feet to accommodate the future airlines passenger fleet. Alternative means of serving this fleet are explored in the next chapter.
3.2.4 TAXIWAY SYSTEM
Taxiways enable circulation of aircraft from the runways to terminal area facilities and between facilities within the terminal area. FAA design standards and guidelines intended to enhance safety and pilot situational awareness serve as the basis for this review of the adequacy of the RDM taxiway system. RDM already has full-length parallel taxiways and regularly spaced exit taxiways serving both runways. Therefore, the focus in this master plan has been on refining the layout to meet current FAA design standards and address hot spots (defined below).

Chapter 3 – Facility Requirements DRAFT June 21, 2017
30
TAXIWAY DESIGN STANDARDS
As with runways, taxiways standards are based upon the critical aircraft expected to use each taxiway. For taxiways serving both Runway 5-23 and 11-29 the critical aircraft is in TDG 5. For taxiways serving
TAXIWAYS SERVING TDG5
The parallel taxiways serving both runways (Taxiway F, G, and C) and all connector/exit taxiways should be designed to accommodate TDG 5. Table 3-11. Taxiway Standards
Taxiway Design Group Width Taxiway Edge Safety
Margin Shoulder Width
TDG 5 75 15 30
Taxiway Geometry Analysis
AC-13A includes taxiway design recommendations for reducing the potential for runway incursions. The section that follows provides a review of those design standards relevant to the current airfield configuration. Direct Access to Runways
One of the ways to reduce runway incursions is to require pilots taxiing aircraft to make distinct, purposeful turns between leaving an apron area and accessing a runway. That is to say, there should not be direct straight-line taxiways leading from an apron to a runway. An example of the direct access issue and resolution is shown below in Figure 3-11. There are several areas on the Airport where direct access currently occurs. These areas are listed below and identified on Figure 3-12.
Taxiway A (north side): a taxiway centerline stripe leads directly from a tiedown apron across Taxiway C to the threshold for Runway 11.
Taxiway A (south side): a taxiway centerline stripe leads directly from a row of box hangars across Taxiway G to the threshold for Runway 11.
Taxiway E: a taxiway centerline stripe leads directly from the commercial apron to the threshold for Runway 5.
Taxiway H: a taxiway centerline stripe leads directly from the commercial apron to Runway 5-23.
Runway Incursions: Runway incursions are events when an aircraft or vehicle inadvertently proceeds onto an active runway without air traffic control clearance.
Chapter 3 – Facility Requirements DRAFT June 21, 2017
31
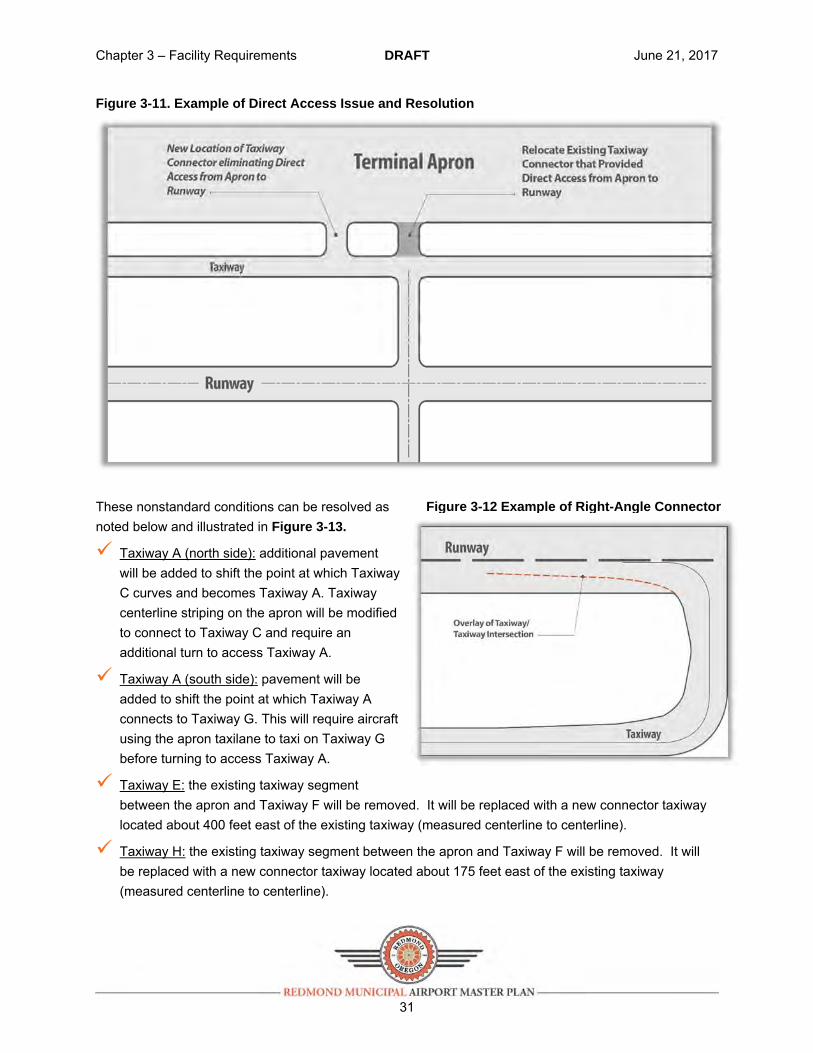
Figure 3-11. Example of Direct Access Issue and Resolution
These nonstandard conditions can be resolved as noted below and illustrated in Figure 3-13.
Taxiway A (north side): additional pavement will be added to shift the point at which Taxiway C curves and becomes Taxiway A. Taxiway centerline striping on the apron will be modified to connect to Taxiway C and require an additional turn to access Taxiway A.
Taxiway A (south side): pavement will be added to shift the point at which Taxiway A connects to Taxiway G. This will require aircraft using the apron taxilane to taxi on Taxiway G before turning to access Taxiway A.
Taxiway E: the existing taxiway segment between the apron and Taxiway F will be removed. It will be replaced with a new connector taxiway located about 400 feet east of the existing taxiway (measured centerline to centerline).
Taxiway H: the existing taxiway segment between the apron and Taxiway F will be removed. It will be replaced with a new connector taxiway located about 175 feet east of the existing taxiway (measured centerline to centerline).
Figure 3-12 Example of Right-Angle Connector

TOFA
TOFA
Salmon Ave.
TOFA
TOFA
TOFA
TOFA
TOFA
TOFA
TOFA
TOFA
TOFA
TOFA
TOFA
TOFA
TOFA
TOFA
TOFA
TOFA
TOFA
TOFA
TOFA
TOFA
TOFA
TOFA
TOFA
TOFA
TOFA
TOFA
TOFA
TOFA
TOFA
TOFA
TOFA
TOFA
TOFA
TOFA
TOFA
TOFA
TOFA
TOFA
TOFA
TOFA
TOFA
TOFA
TOFA
TOFA
TOFA
TOFA
TOFA
TOFA
TOFA
TOFA
TOFA
TOFA
TOFA
TOFA
TOFA
TOFA
TOFA
TOFA
TOFA
TOFA
TOFA
TOFA
TOFA
TOFA
TOFA
TOFA
TOFA
TOFA
TOFA
TOFA
TOFATOFA
TOFA
TOFA
TOFA
TOFA
TOFA
TOFA
TOFA
TOFA
TOFA
TOFA
TOFA
TOFA
TOFA
TOFA
TOFA
TOFA
TOFA
TOFA
TOFA
TOFA
TOFA
TOFA
TOFA
TOFA
TOFA
TOFA
TOFA
TOFA
TOFA
TOFA
TOFA
TOFA
TOFA
TOFA
TOFA
TOFA
TOFA
TOFA
TOFA
TOFA
TOFA
TOFA
TOFA
TOFA
TOFA
TOFA
TOFA
TOFA
TOFA
TOFA
TOFA
TOFA
TOFA
TOFA
TOFA
TOFA
TOFA
TOFA
TOFA
TOFA
TOFA
TOFA
TOFA
TOFA
TOFA
TOFA
TOFA
TOFA
TOFA
TOFA
TOFA
93'
93'
93'93'
93'
93'
REDMOND MUNICIPAL
Figure 3-13TAXIWAY DESIGN
N 0' 300' 600'
LEGEND
AIRPORT MASTER PLAN
TOFA Taxiway Object Free Area
FAA Taxiway Hot Spot
Non-Standard ConditionK
N
Taxiway GE
H
Taxiway F
M
D
M
RUNWAY (7006' x 100')
Taxiway C
Taxiway G
Taxiway C Taxiway F
29
5
11 23
A
RUNWAY 5-23 (7038' x 150')D
J
J
A
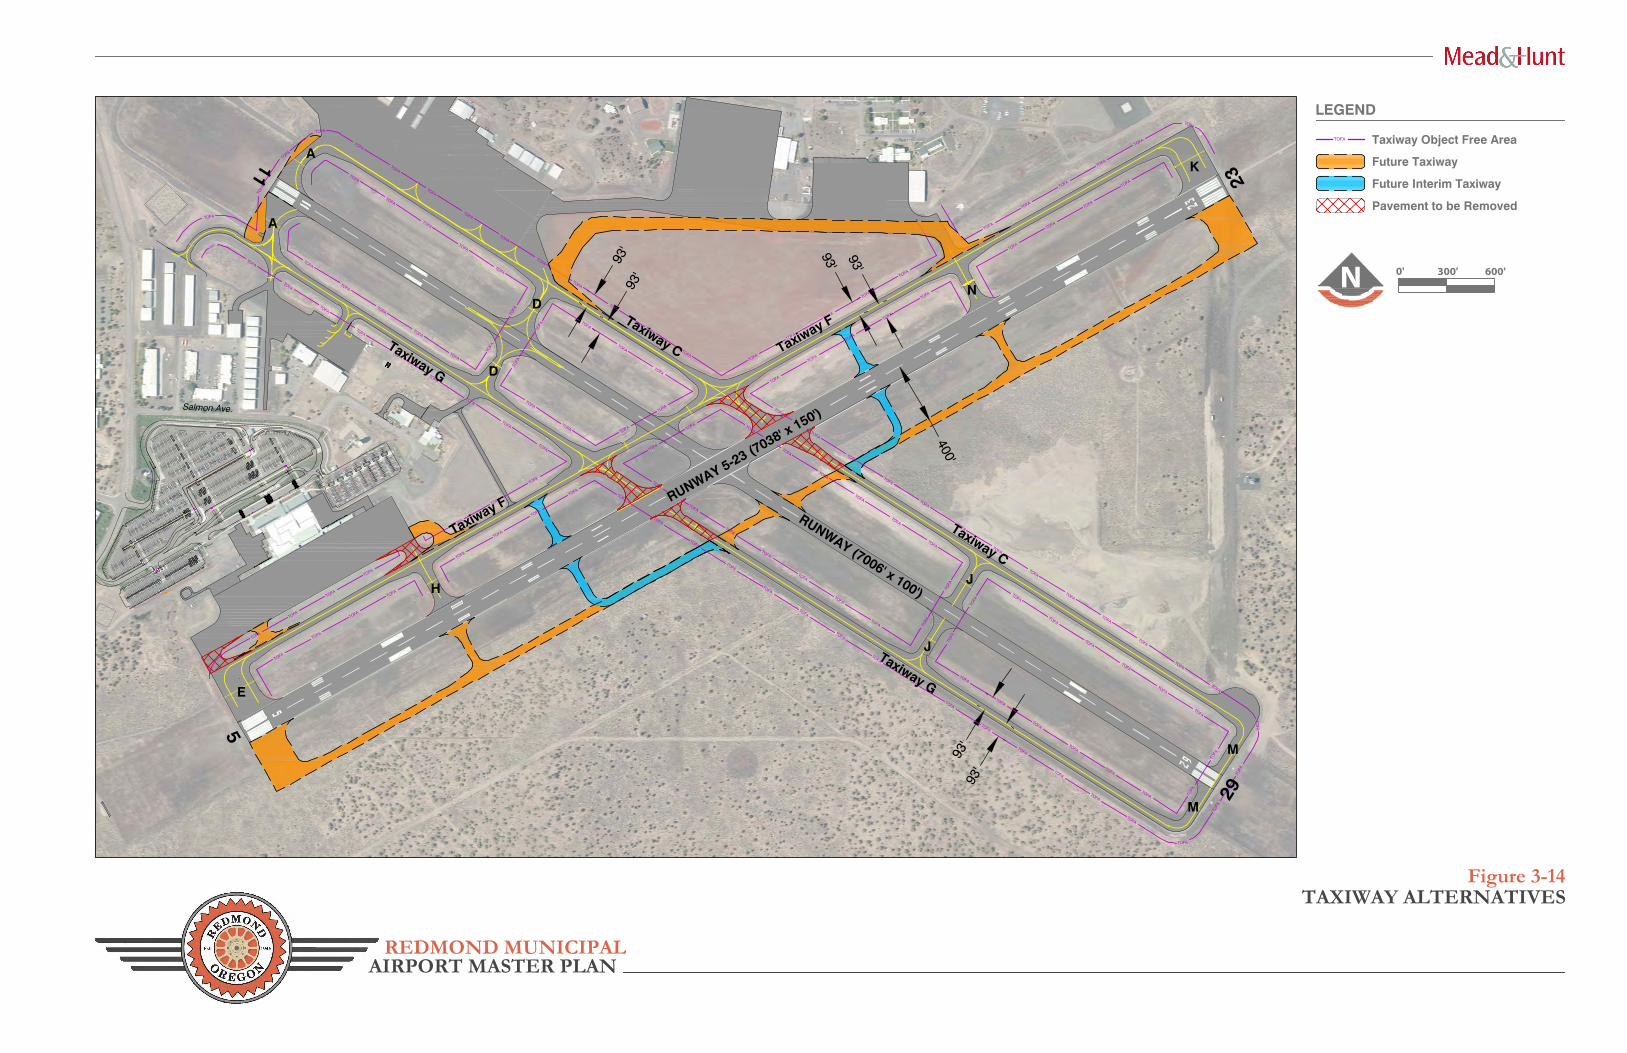
Salmon Ave.
TOFA
TOFA
TOFA
TOFA
TOFA
TOFA
TOFA
TOFA
TOFA
TOFA
TOFA
TOFA
TOFA
TOFA
TOFA
TOFA
TOFA
TOFA
TOFA
TOFA
TOFA
TOFA
93'
93'
93'93'
93'
93'
400'
TOFA
TOFA
TOFA
TOFA
TOFA
TOFA
TOFA
TOFA
TOFA
TOFA
TOFA
TOFA
TOFA
TOFA
TOFA
TOFA
TOFA
TOFA
TOFA
TOFA
TOFA
TOFA
TOFA
TOFA
TOFA
TOFA
TOFA
TOFA
TOFA
TOFA
TOFA
TOFA
TOFA
TOFA
TOFA
TOFA
TOFA
TOFA
TOFA
TOFA
TOFA
TOFA
TOFA
TOFA
TOFA
TOFA
TOFA
TOFA
TOFA
TOFA
TOFA
TOFA
TOFA
TOFA
TOFA
TOFA
TOFATOFA
TOFA
TOFA
TOFA
TOFA
TOFA
TOFA
TOFA
TOFA
TOFA
TOFA
TOFA
TOFA
TOFA
TOFA
TOFA
TOFA
TOFA
TOFA
TOFA
TOFA
TOFA
TOFA
TOFA
TOFA
TOFA
TOFA
TOFA
TOFA
TOFA
TOFA
TOFA
TOFA
TOFA
TOFA
TOFA
TOFA
TOFA
TOFA
TOFA
TOFA
TOFA
TOFA
TOFA
TOFA
TOFA
TOFA
TOFA
TOFA
TOFA
TOFA
TOFA
TOFA
TOFA
TOFA
TOFA
TOFA
TOFA
TOFA
TOFA
TOFA
TOFA
TOFA
TOFA
TOFA
TOFA
REDMOND MUNICIPAL
Figure 3-14TAXIWAY ALTERNATIVES
N 0' 300' 600'
LEGEND
AIRPORT MASTER PLAN
TOFA Taxiway Object Free Area
Future Taxiway
Future Interim TaxiwayK
N
Taxiway GE
H
Taxiway F
M
D
M
Taxiway C
Taxiway G
Taxiway C Taxiway F
29
5
11 23
A
D
J
J
A
RUNWAY 5-23 (7038' x 150')
RUNWAY (7006' x 100')
Pavement to be Removed
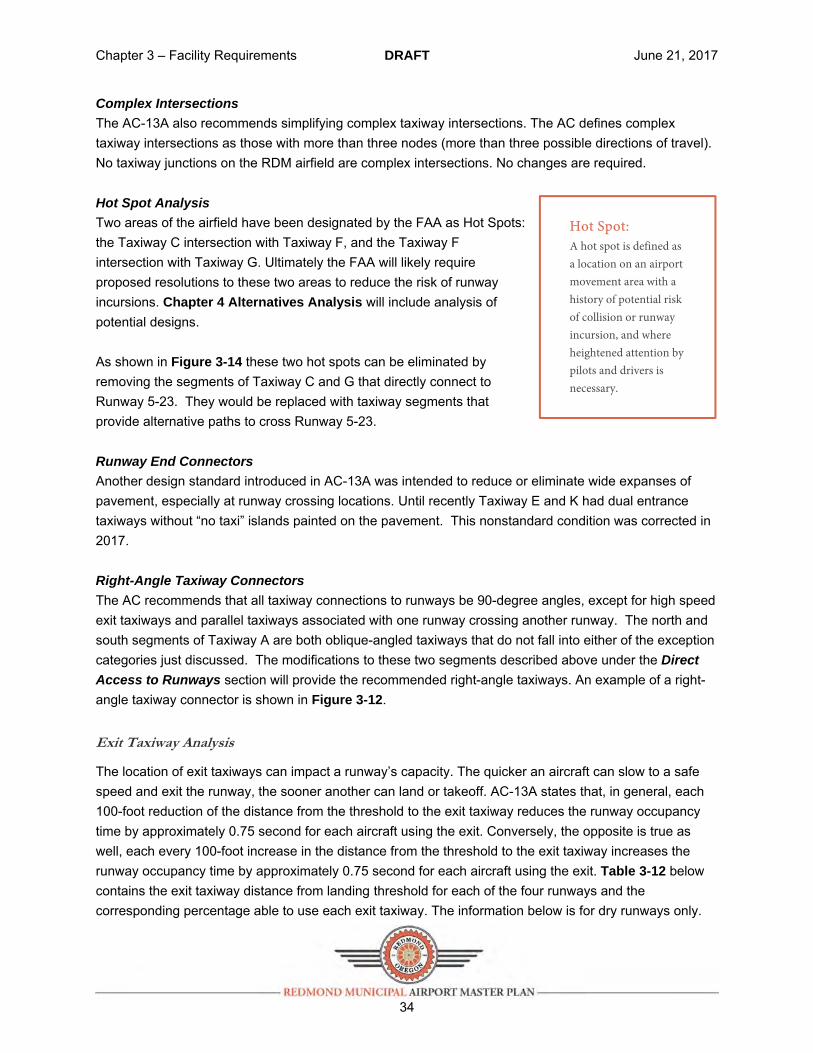
Chapter 3 – Facility Requirements DRAFT June 21, 2017
34
Complex Intersections
The AC-13A also recommends simplifying complex taxiway intersections. The AC defines complex taxiway intersections as those with more than three nodes (more than three possible directions of travel). No taxiway junctions on the RDM airfield are complex intersections. No changes are required. Hot Spot Analysis
Two areas of the airfield have been designated by the FAA as Hot Spots: the Taxiway C intersection with Taxiway F, and the Taxiway F intersection with Taxiway G. Ultimately the FAA will likely require proposed resolutions to these two areas to reduce the risk of runway incursions. Chapter 4 Alternatives Analysis will include analysis of potential designs. As shown in Figure 3-14 these two hot spots can be eliminated by removing the segments of Taxiway C and G that directly connect to Runway 5-23. They would be replaced with taxiway segments that provide alternative paths to cross Runway 5-23.
Runway End Connectors
Another design standard introduced in AC-13A was intended to reduce or eliminate wide expanses of pavement, especially at runway crossing locations. Until recently Taxiway E and K had dual entrance taxiways without “no taxi” islands painted on the pavement. This nonstandard condition was corrected in 2017. Right-Angle Taxiway Connectors
The AC recommends that all taxiway connections to runways be 90-degree angles, except for high speed exit taxiways and parallel taxiways associated with one runway crossing another runway. The north and south segments of Taxiway A are both oblique-angled taxiways that do not fall into either of the exception categories just discussed. The modifications to these two segments described above under the Direct
Access to Runways section will provide the recommended right-angle taxiways. An example of a right-angle taxiway connector is shown in Figure 3-12.
Exit Taxiway Analysis
The location of exit taxiways can impact a runway’s capacity. The quicker an aircraft can slow to a safe speed and exit the runway, the sooner another can land or takeoff. AC-13A states that, in general, each 100-foot reduction of the distance from the threshold to the exit taxiway reduces the runway occupancy time by approximately 0.75 second for each aircraft using the exit. Conversely, the opposite is true as well, each every 100-foot increase in the distance from the threshold to the exit taxiway increases the runway occupancy time by approximately 0.75 second for each aircraft using the exit. Table 3-12 below contains the exit taxiway distance from landing threshold for each of the four runways and the corresponding percentage able to use each exit taxiway. The information below is for dry runways only.
Hot Spot: A hot spot is defined as a location on an airport movement area with a history of potential risk of collision or runway incursion, and where heightened attention by pilots and drivers is necessary.
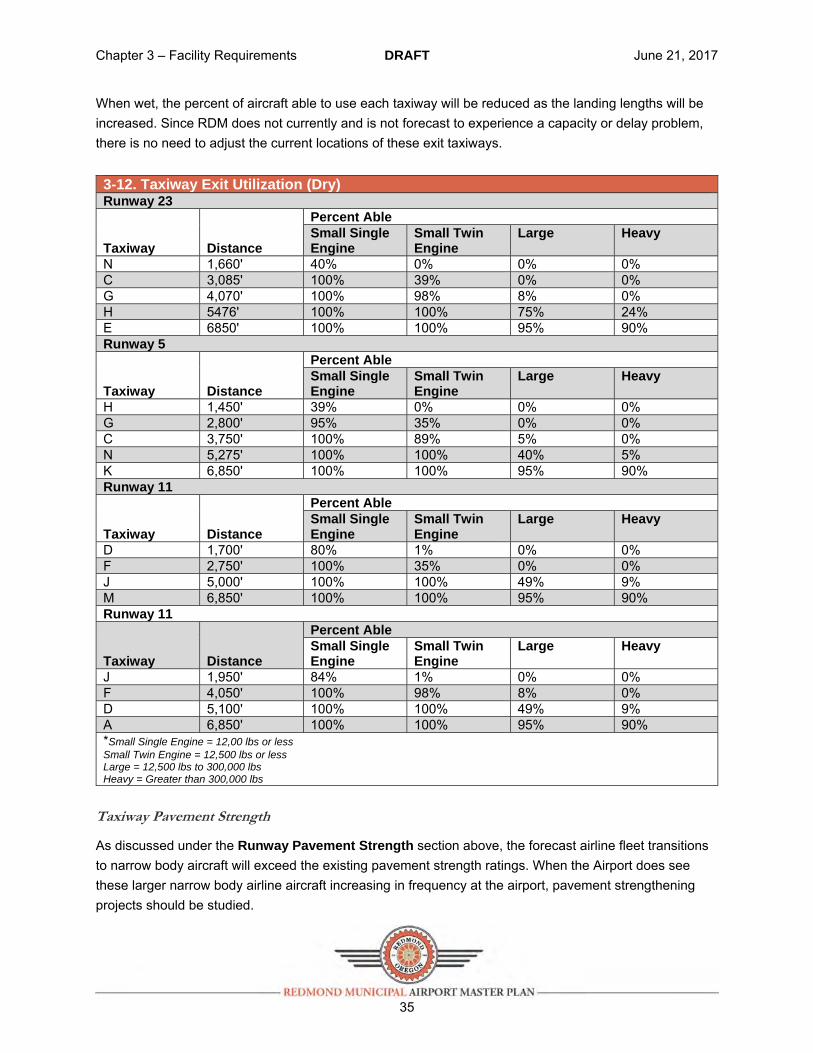
Chapter 3 – Facility Requirements DRAFT June 21, 2017
35
When wet, the percent of aircraft able to use each taxiway will be reduced as the landing lengths will be increased. Since RDM does not currently and is not forecast to experience a capacity or delay problem, there is no need to adjust the current locations of these exit taxiways. 3-12. Taxiway Exit Utilization (Dry) Runway 23
Taxiway Distance
Percent Able Small Single Engine
Small Twin Engine
Large Heavy
N 1,660' 40% 0% 0% 0% C 3,085' 100% 39% 0% 0% G 4,070' 100% 98% 8% 0% H 5476' 100% 100% 75% 24% E 6850' 100% 100% 95% 90% Runway 5
Taxiway Distance
Percent Able Small Single Engine
Small Twin Engine
Large Heavy
H 1,450' 39% 0% 0% 0% G 2,800' 95% 35% 0% 0% C 3,750' 100% 89% 5% 0% N 5,275' 100% 100% 40% 5% K 6,850' 100% 100% 95% 90% Runway 11
Taxiway Distance
Percent Able Small Single Engine
Small Twin Engine
Large Heavy
D 1,700' 80% 1% 0% 0% F 2,750' 100% 35% 0% 0% J 5,000' 100% 100% 49% 9% M 6,850' 100% 100% 95% 90% Runway 11
Taxiway Distance
Percent Able Small Single Engine
Small Twin Engine
Large Heavy
J 1,950' 84% 1% 0% 0% F 4,050' 100% 98% 8% 0% D 5,100' 100% 100% 49% 9% A 6,850' 100% 100% 95% 90% *Small Single Engine = 12,00 lbs or less Small Twin Engine = 12,500 lbs or less Large = 12,500 lbs to 300,000 lbs Heavy = Greater than 300,000 lbs
Taxiway Pavement Strength
As discussed under the Runway Pavement Strength section above, the forecast airline fleet transitions to narrow body aircraft will exceed the existing pavement strength ratings. When the Airport does see these larger narrow body airline aircraft increasing in frequency at the airport, pavement strengthening projects should be studied.
Chapter 3 – Facility Requirements DRAFT June 21, 2017
36
Taxiway System Conclusion and Recommendations
The existing taxiway system serves the RDM Airport users well. No major inadequacies exist for the current airfield configuration or activity levels. Some areas are identified below that do not comply with the latest geometry guidance from the FAA. Those areas are analyzed in Chapter 4 and depicted with solutions on the ALP.
Taxiway A (north side): add pavement and restripe to provide a right-angle taxiway.
Taxiway A (south side): add pavement and restripe to provide a right-angle taxiway.
Taxiway E: replace existing taxiway segment between the apron and Taxiway F with a new connector taxiway located about 400 feet east of the existing taxiway.
Taxiway H: replace the existing taxiway segment between the apron and Taxiway F with a new connector taxiway located about 175 feet east of the existing taxiway.
Taxiway C hot spot: shift segment that crosses Runway 5-23 to the east.
Taxiway G hot spot: shift segment that crosses Runway 5-23 to the west.
Runway exit taxiways: retain current locations.
Pavement strength: evaluate pavement strength requirements when narrow body airline aircraft begin regularly scheduled operations at the Airport.
As presented below in the General Aviation Facilities section, if the Airport moves forward with developing a new east field GA complex, the airport could ultimately benefit from a full-length parallel taxiway to the east of Runway 5-23. Figures 3-13 and 3-14 (above) highlight non-compliant areas of the airfield and proposed solutions.
3.2.5 GENERAL AVIATION FACILITIES
Growth in general aviation based aircraft at the Airport is contingent upon adequate facilities and easy developable areas. Currently, the general aviation facilities at the airport are somewhat constrained. With a few exceptions, the easily developable areas with access to the airfield are occupied. The remaining areas available can be used for infill hangar development in an effort to accommodate some of the projected 33 new based aircraft at the Airport, which are forecast within the 20-year planning period. Figure 3-15 depicts conceptual hangar infill sites and one new development area on the north side of the airfield.

N
D
RUNWAY (7006' x 100')
RUNWAY 5-23 (7038' x 150')
Taxiway G
Taxiway CTaxiway F
11
A
RPZ
RPZ
RPZ
RPZ
RPZ
RPZ
RPZ
RPZ
RPZ
RPZ
RPZ
RPZ
RPZ
RPZ
RPZ
RPZ
RPZ
RPZ
RPZ
RPZ
RPZ
RPZ
RPZ
RPZ
REDMOND MUNICIPAL
Figure 3-15HANGARS
N 0' 250' 500'
LEGEND
AIRPORT MASTER PLAN
RDM Property Boundary
E
Future Hangars Option 1
Future Taxiway
6 Unit T-Hangars147' x 33'
2 Box Hangars90' x 90'
2 Box Hangars90' x 90'or8 Unit T-hangar189' x 33'
2 Box Hangars90' x 90'
or(2) 8 Unit T-hangar
189' x 33'
Future Hangars Option 2
Potential HangarDevelopment Area
FutureRoad
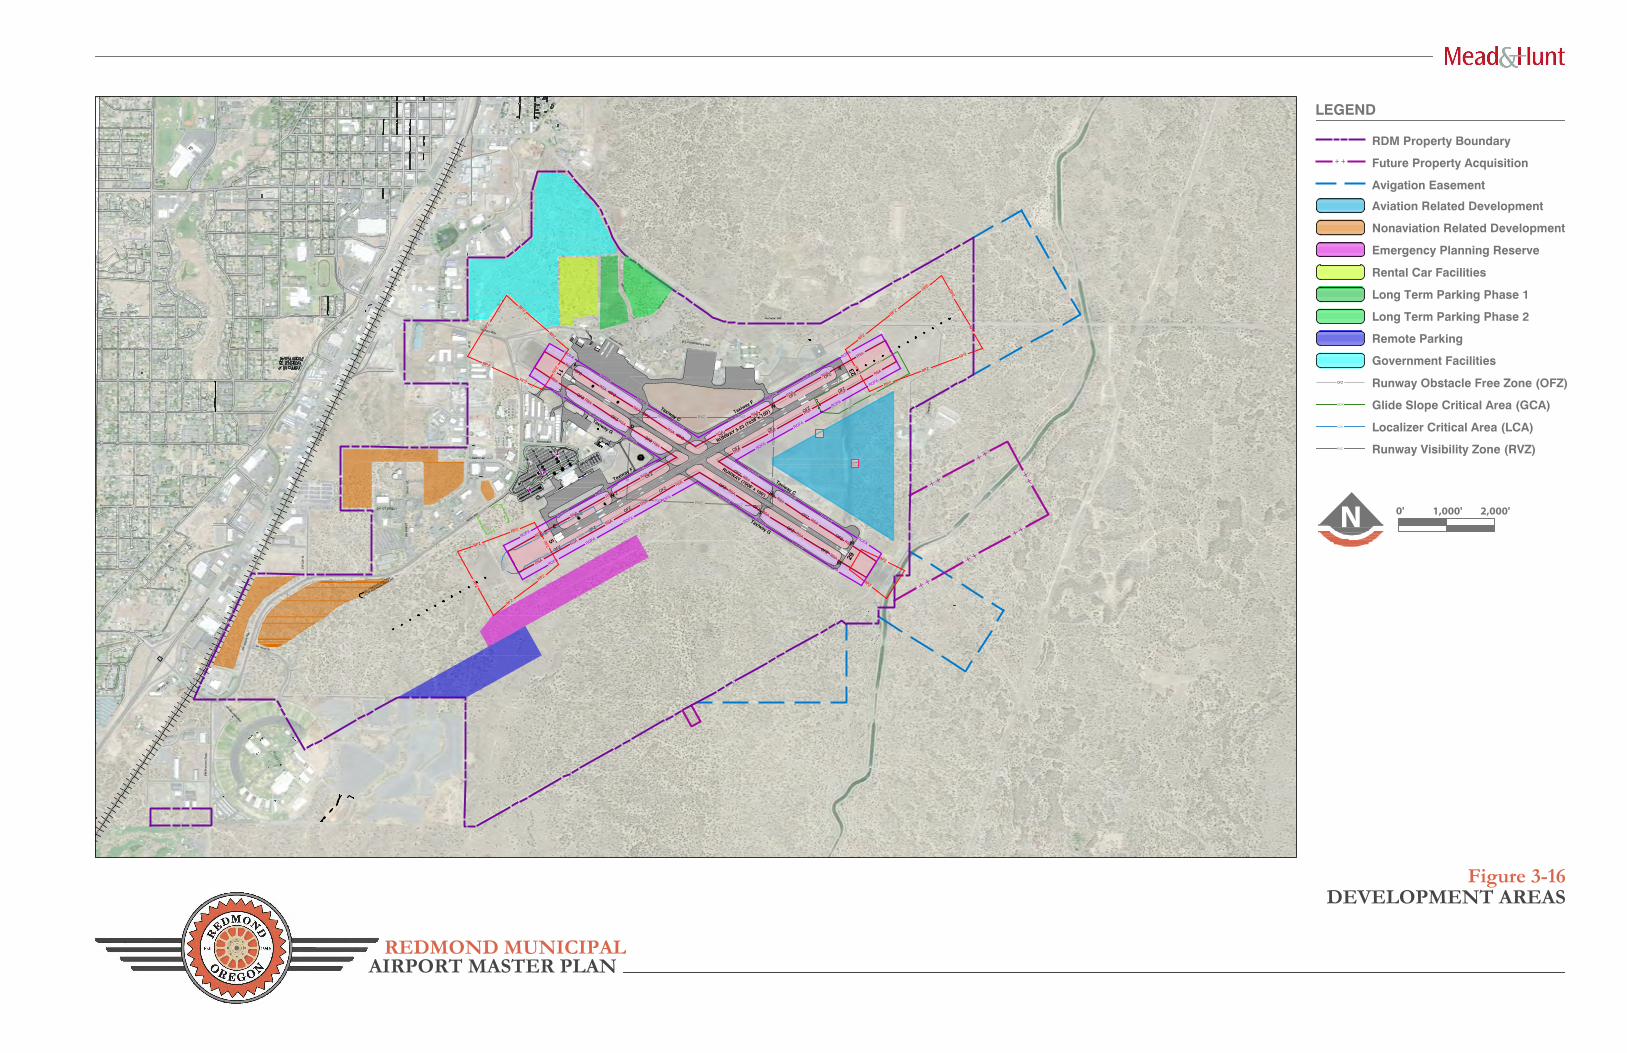
OFZ
OFZ
OFZ
OFZ
OFZ
OFZ
OFZ
OFZ
OFZ
OFZ
OFZ
OFZ
LCA
OFZ
OFZ
OFZ
OFZ
RV
ZR
VZ
RV
ZR
VZ
RVZ RVZ RVZ
RVZ RVZ RVZ
RSA
RSA
RSA
RSA
RSA
RSA
RSA
RSA
RSA
RSA
RSA
RSA
RSA
RSA
OFZ
OFZ
OFZ
OFZ
OFZ
OFZ
OFZ
OFZ
OFZ
OFZ
OFZ
OFZ
OFZ
OFZ
OFZ
RSA
RSA
RSA
RSA
xx
x
xx
x
x x xx
x
x
x
LCA
LCA
LCA
LCA
++
++
++
++
++
++
x
x
x
RSA
RSA
RSA
RSA
RSA
RSA
RSA
RSA
RSA
RSA
RSA
RSA
RSA
RSA
RSA
RSA
RSA
GCA
GCA
GCA
GCA
GCA
GCA
x
x
x
Highway 126B.
N. R
AILR
OAD
Veterans Way
Lake Rd.
3rd.
St.
1st.
St.
Salmon Dr.
Salmon Ave.
Airport W
ay
SW
Airp
ort W
ay
10th. St.
Vete
rans
Ave
.
U.S. Forest Service Way
Coy
ote
Rd.
Veterans Way
SURFACE PENETRATIONS
NO THRESHOLD SITING
SW
Mou
ntai
n P
kwy.
The
Dalle
s Ca
liforn
ia H
wy.
SW 1ST STREET
Mt. Hood Dr.
SW
13t
h S
t.
SW
6TH
ST.
SW
6TH
ST.
SW 21ST ST.
SW Mountain W
ay
K
N
Taxiway GE
H
Taxiway F
J
M
D
J
M
RUNWAY (7006' x 100')
RUNWAY 5-23 (7038' x 150')
Taxiway C
Taxiway G
Taxiway CTaxiway F
29
511 23
A RPZ
RPZ
RPZ
RPZ
RPZ
RPZ
RPZ
RPZ
RPZ
RPZ
RPZ
RPZ
RPZ
RPZ
RPZ
RPZ
RPZ
RPZ
RPZ
RPZ
RPZ
RPZ
RPZ
ROFA
ROFA
ROFA
ROFA
ROFA
ROFA
ROFA
ROFA
ROFA
ROFA
ROFA
ROFA
ROFA
ROFA
ROFA
ROFA
ROFA
ROFA
ROFAROFA
ROFA
ROFA
ROFA
ROFA
ROFA
ROFA
ROFA
ROFA
ROFA
ROFA
ROFA
REDMOND MUNICIPAL
Figure 3-16DEVELOPMENT AREAS
N 0' 1,000' 2,000'
LEGEND
AIRPORT MASTER PLAN
RDM Property Boundary
Long Term Parking Phase 2
Runway Obstacle Free Zone (OFZ)OFZ
Glide Slope Critical Area (GCA)GCA
Localizer Critical Area (LCA)LCA
Runway Visibility Zone (RVZ)RVZ
++ Future Property Acquisition
Avigation Easement
Nonaviation Related Development
Aviation Related Development
Emergency Planning Reserve
Rental Car Facilities
Long Term Parking Phase 1
Remote Parking
Government Facilities

Chapter 3 – Facility Requirements DRAFT June 21, 2017
39
Chapter 2 Aviation Activity Forecast identifies an increase of 5 single-engine aircraft, 24 jet aircraft, 6 helicopters, and 5 other type aircraft relocating to the Airport within the 20-year planning period. Some of these aircraft could be located in the infill sites as shown in Figure 3-15, however, in order to accommodate all 33 aircraft, at least one new GA development area should be planned. To protect for GA development beyond the 20-year planning period or growth exceeding this plan’s forecast, an aviation reserve area is proposed in the east quadrant of the airport between the two runways. Figure 3-16 shows this location. In the event that another Fixed Base Operator (FBO) is looking to serve the Airport, this would be a suitable location. However, development in this area will be costly due to the lack of infrastructure and the high cost of site preparation. Variations and alternative configurations of the hangar infill sites and GA development area will be further explored in the Chapter 4 Alternatives Analysis. Itinerant operations are also relevant to this master plan. The Airport is forecast to experience an increase of approximately 3,000 itinerant general aviation operations within the 20-year planning period. The 3,000 annual operations equate to approximately 8 operations per day, or 4 aircraft visiting the airport. The existing FBOs can accommodate the increase as currently configured. Additional support facilities are discussed later in this chapter.
CONCLUSIONS AND RECOMMENDATIONS
To accommodate the forecast increase in general aviation based aircraft, the following facility improvements should be made:
Identification of hangar site alternatives.
Locate long-term general aviation development area.
PASSENGER TERMINAL APRON
The passenger terminal apron is approximately 1,528 feet wide and 297 feet deep (453,816 square feet). Taxiway connectors H and E provide access to parallel taxiway F and Runway 5-23. The apron accommodates seven aircraft parked at terminal gate positions and one additional parking position. Based on current airline schedules, up to eight aircraft each day are scheduled to remain overnight (RON). As airline operations increase and schedules change this number may increase to 10 RON aircraft. Given that the passenger terminal apron is currently at capacity for RON aircraft, the airport should plan for an apron expansion as soon as practical. Figure 3-17 illustrates a conceptual apron expansion to accommodate the projected RON demand. Specific locations and alternatives will be explored in the following Chapter 4 Alternatives Analysis.
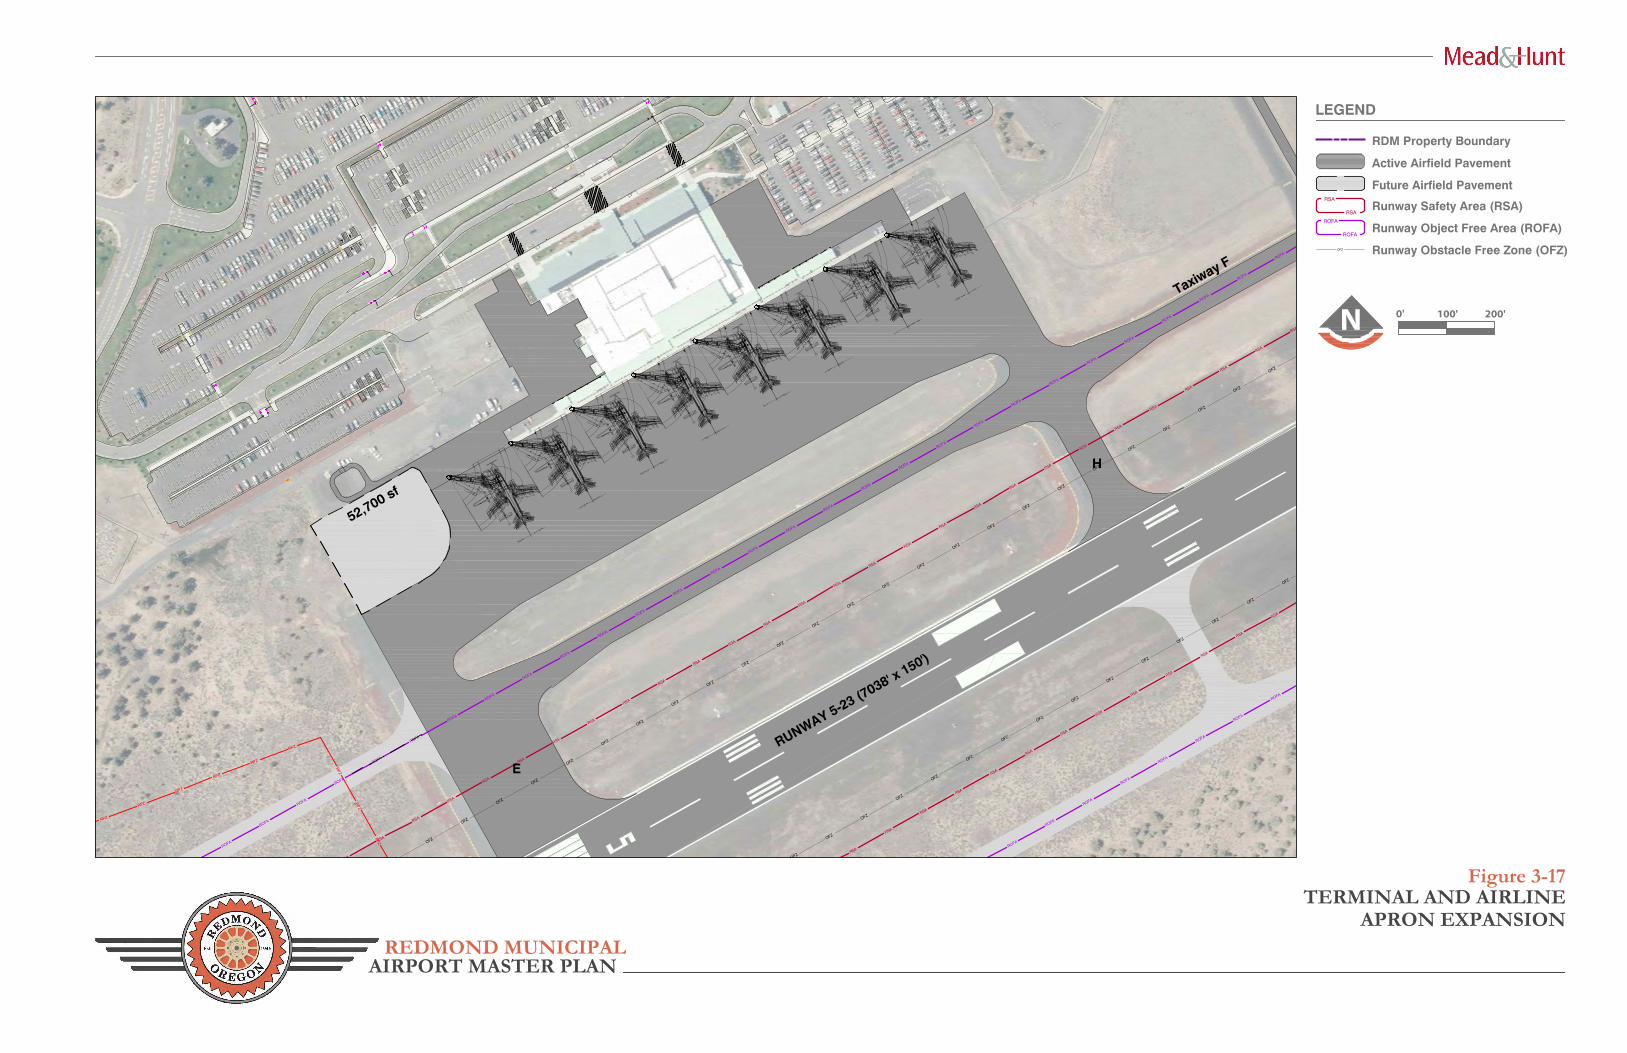
OFZ
OFZ
OFZ
OFZ
OFZ
OFZ
OFZ
OFZ
OFZ
OFZ
OFZ
OFZ
OFZ
OFZ
OFZ
OFZ
OFZ
OFZ
OFZ
OFZ
OFZ
OFZ
OFZ
OFZ
OFZ
OFZ
OFZ
OFZ
OFZ
OFZ
OFZ
OFZ
OFZ
OFZ
OFZ
OFZ
OFZ
OFZ
OFZ
OFZ
OFZ
RSA
RSA
RSA
RSA
RSA
RSA
RSA
RSA
RSA
RSA
RSA
RSA
RSA
x
x
x
x
x
x
x
x
RSA
RSA
RSA
RSA
RSA
RSA
RSA
RSA
RSA
RSA
RSA
RSA
RSA
RSA
RSA
RSA
RSA
RSA
RSA
RSA
RSA
RSA
RSA
RSA
RSA
RSA
RSA
RSA
RPZ
RPZ
RPZ
RPZ
RPZ
RPZ
RPZ
RPZ
RPZ
ROFA
ROFA
ROFA
ROFA
ROFA
ROFA
ROFA
ROFA
ROFA
ROFA
ROFA
ROFA
ROFA
ROFA
ROFA
ROFA
ROFA
ROFA
ROFA
ROFA
ROFA
ROFA
ROFA
ROFA
ROFA
ROFA
ROFA
ROFA
ROFA
ROFA
ROFA
ROFA
ROFA
ROFA
ROFA
ROFA
ROFA
LL1A
B
C
D
CS10
0
CS100
F
F
CS300
CS300
F
F
MRJ
70ER
MRJ 70ER
MRJ
90ER
MRJ 90ER
EMBR
AER 19
5 STD
EMBRAER 195 STD
F
EMBR
AER 19
0 STD
EMBRAER 190 STD
F
EMBR
AER 17
5 EWT
EMBRAER 175 EWT
F
B737 MAX 8
B737
MAX
8
F
Fv
Fv
A320 NEO-CFM
A320 N
EO-CFM
F
Fo
A321 NEO-CFM
A321 N
EO-CFM
F
Fo
B737 MAX 9
B737
MAX
9
F
Fv
Fv
Bridge1
Work.m
in
Work.m
ax
Oper.m
in
Oper.m
ax
LL1
A
B
C
D
CS10
0
CS100
CS300
CS300
MRJ
70ER
MRJ 70ER
MRJ
90ER
MRJ 90ER
EMBR
AER 19
5 STD
EMBRAER 195 STD
F
EMBR
AER 19
0 STD
EMBRAER 190 STD
F
EMBR
AER 17
5 EWT
EMBRAER 175 EWT
F
B737 MAX 8
B737
MAX
8
F
Fv
Fv
A320 NEO-CFM
A320 N
EO-CFM
F
Fo
A321 NEO-CFM
A321 N
EO-CFM
F
Fo
B737 MAX 9
B737
MAX
9
F
Fv
Fv
Bridge1
Work.m
in
Work.m
ax
Oper.m
in
Oper.m
ax
LL1A
B
C
D
CS10
0
CS100
CS300
CS300
MRJ
70ER
MRJ 70ER
MRJ
90E
R
MRJ 90ER
EMBR
AER 19
5 STD
EMBRAER 195 STD
F
EMBR
AER 19
0 STD
EMBRAER 190 STD
F
EMBR
AER 17
5 EWT
EMBRAER 175 EWT
F
B737 MAX 8
B737
MAX
8
F
Fv
Fv
A320 NEO-CFM
A320 N
EO-CFM
F
Fo
A321 NEO-CFM
A321 N
EO-CFM
F
Fo
B737 MAX 9
B737
MAX
9
F
Fv
Fv
Bridge1
Work.m
in
Work.m
ax
Oper.m
in
Oper.m
ax
LL1A
B
C
D
CS100
CS100
CS300
CS300
MRJ
70ER
MRJ 70ER
MRJ
90ER
MRJ 90ER
EMBR
AER 19
5 STD
EMBRAER 195 STD
F
EMBR
AER 19
0 STD
EMBRAER 190 STD
F
EMBR
AER 17
5 EWT
EMBRAER 175 EWT
F
B737 MAX 8
B737
MAX
8F
Fv
Fv
A320 NEO-CFM
A320
NEO
-CFM
F
Fo
A321 NEO-CFM
A321 N
EO-CFM
F
Fo
B737 MAX 9
B737
MAX
9
F
Fv
Fv
Bridge1
Work.m
in
Work.m
ax
Oper.m
in
Oper.m
ax
LL1A
B
C
D
CS100
CS100
CS300
CS300
MRJ
70ER
MRJ 70ER
MRJ
90ER
MRJ 90ER
EMBR
AER 19
5 STD
EMBRAER 195 STD
F
EMBR
AER 19
0 STD
EMBRAER 190 STD
F
EMBR
AER 17
5 EWT
EMBRAER 175 EWT
F
B737 MAX 8
B737
MAX
8
F
Fv
Fv
A320 NEO-CFM
A320 N
EO-CFM
F
Fo
A321 NEO-CFM
A321 N
EO-CFM
F
Fo
B737 MAX 9
B737
MAX
9
F
Fv
Fv
Bridge1
Work.m
in
Work.m
ax
Oper.m
in
Oper.m
ax
LL1A
B
C
D
CS10
0
CS100
CS30
0
CS300
MRJ
70ER
MRJ 70ER
MRJ
90ER
MRJ 90ER
EMBR
AER 19
5 STD
EMBRAER 195 STD
F
EMBR
AER 19
0 STD
EMBRAER 190 STD
F
EMBR
AER 17
5 EWT
EMBRAER 175 EWT
F
B737 MAX 8
B737
MAX
8
F
Fv
Fv
A320 NEO-CFM
A320 N
EO-CFM
F
Fo
A321 NEO-CFM
A321 N
EO-CFM
F
Fo
B737 MAX 9
B737
MAX
9
F
Fv
Fv
Bridge1
Work.m
in
Work.m
ax
Oper.m
in
Oper.m
ax
LL1
A
B
C
D
CS10
0
CS100
CS300
CS300
MRJ
70ER
MRJ 70ER
MRJ
90ER
MRJ 90ER
EMBR
AER 19
5 STD
EMBRAER 195 STD
F
EMBR
AER 19
0 STD
EMBRAER 190 STD
F
EMBR
AER 17
5 EWT
EMBRAER 175 EWT
F
B737 MAX 8
B737
MAX
8
F
Fv
Fv
A320 NEO-CFM
A320 N
EO-CFM
F
Fo
A321 NEO-CFM
A321 N
EO-CFM
F
Fo
B737 MAX 9
B737
MAX
9
F
Fv
Fv
Bridge1
Work.m
in
Work.m
ax
Oper.m
in
Oper.m
ax
LL1A
B
C
D
CS10
0
CS100
CS300
CS300
MRJ
70ER
MRJ 70ER
MRJ
90ER
MRJ 90ER
EMBR
AER 19
5 STD
EMBRAER 195 STD
F
EMBR
AER 19
0 STD
EMBRAER 190 STD
F
EMBR
AER 17
5 EWT
EMBRAER 175 EWT
F
B737 MAX 8
B737
MAX
8
F
Fv
Fv
A320 NEO-CFM
A320 N
EO-CFM
F
Fo
A321 NEO-CFM
A321 N
EO-CFM
F
Fo
B737 MAX 9
B737
MAX
9
F
Fv
Fv
Bridge1
Work.m
in
Work.m
ax
Oper.m
in
Oper.m
ax
REDMOND MUNICIPAL
Figure 3-17TERMINAL AND AIRLINE
APRON EXPANSION
N 0' 100' 200'
LEGEND
AIRPORT MASTER PLAN
RDM Property Boundary
RSA
RSA
Runway Safety Area (RSA)
ROFA
ROFA
Runway Object Free Area (ROFA)
Runway Obstacle Free Zone (OFZ)OFZ
E
H
Taxiway F
RUNWAY 5-23 (7038' x 150')
Active Airfield Pavement
Future Airfield Pavement
52,700 sf
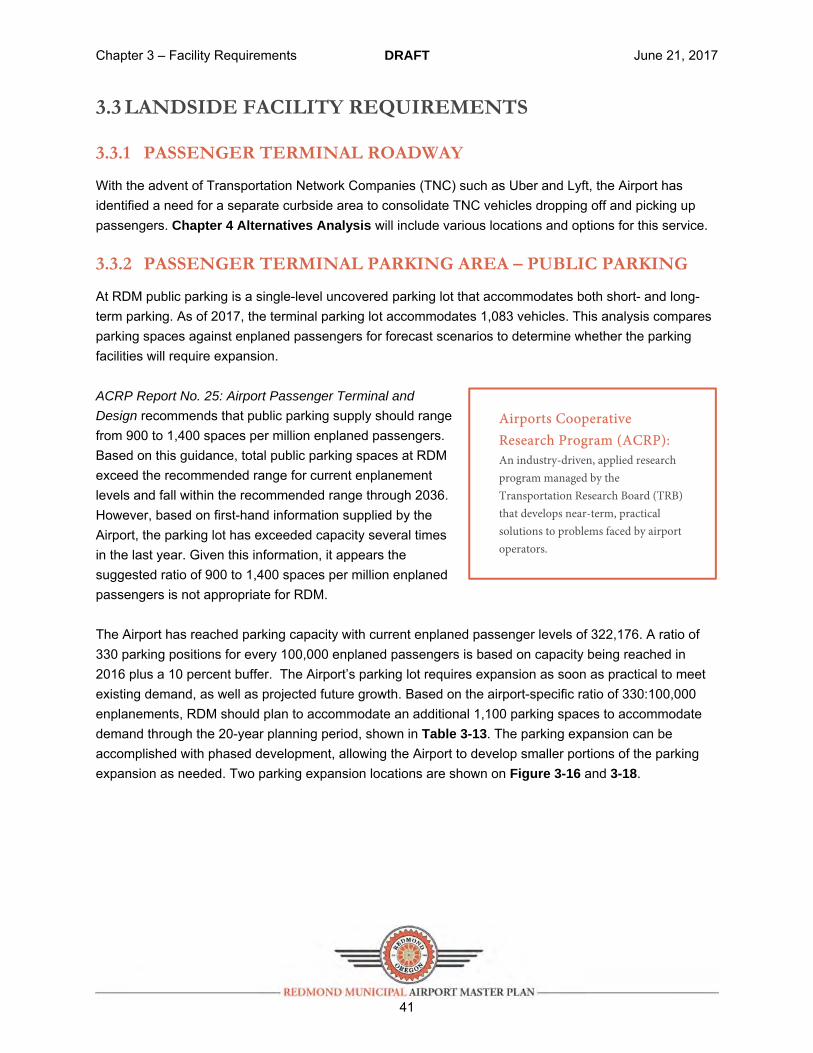
Chapter 3 – Facility Requirements DRAFT June 21, 2017
41
3.3 LANDSIDE FACILITY REQUIREMENTS
3.3.1 PASSENGER TERMINAL ROADWAY
With the advent of Transportation Network Companies (TNC) such as Uber and Lyft, the Airport has identified a need for a separate curbside area to consolidate TNC vehicles dropping off and picking up passengers. Chapter 4 Alternatives Analysis will include various locations and options for this service.
3.3.2 PASSENGER TERMINAL PARKING AREA – PUBLIC PARKING
At RDM public parking is a single-level uncovered parking lot that accommodates both short- and long-term parking. As of 2017, the terminal parking lot accommodates 1,083 vehicles. This analysis compares parking spaces against enplaned passengers for forecast scenarios to determine whether the parking facilities will require expansion. ACRP Report No. 25: Airport Passenger Terminal and
Design recommends that public parking supply should range from 900 to 1,400 spaces per million enplaned passengers. Based on this guidance, total public parking spaces at RDM exceed the recommended range for current enplanement levels and fall within the recommended range through 2036. However, based on first-hand information supplied by the Airport, the parking lot has exceeded capacity several times in the last year. Given this information, it appears the suggested ratio of 900 to 1,400 spaces per million enplaned passengers is not appropriate for RDM. The Airport has reached parking capacity with current enplaned passenger levels of 322,176. A ratio of 330 parking positions for every 100,000 enplaned passengers is based on capacity being reached in 2016 plus a 10 percent buffer. The Airport’s parking lot requires expansion as soon as practical to meet existing demand, as well as projected future growth. Based on the airport-specific ratio of 330:100,000 enplanements, RDM should plan to accommodate an additional 1,100 parking spaces to accommodate demand through the 20-year planning period, shown in Table 3-13. The parking expansion can be accomplished with phased development, allowing the Airport to develop smaller portions of the parking expansion as needed. Two parking expansion locations are shown on Figure 3-16 and 3-18.
Airports Cooperative Research Program (ACRP): An industry-driven, applied research program managed by the Transportation Research Board (TRB) that develops near-term, practical solutions to problems faced by airport operators.
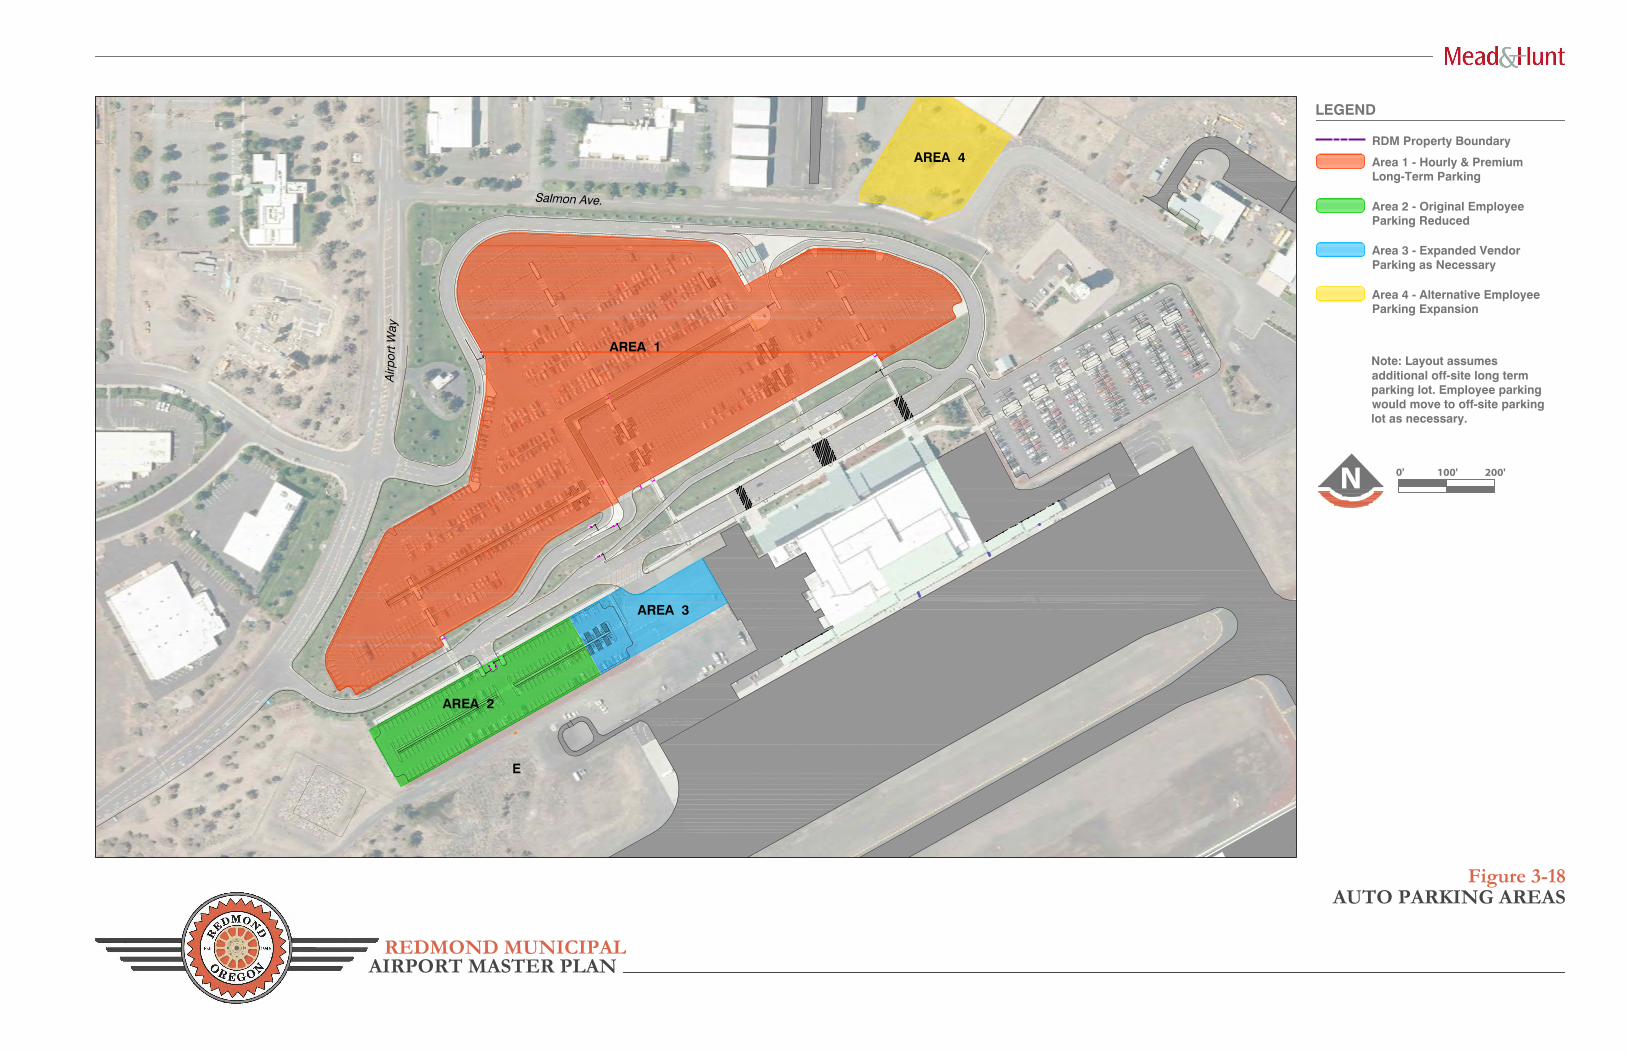
Taxiway G
REDMOND MUNICIPAL
Figure 3-18AUTO PARKING AREAS
N 0' 100' 200'
LEGEND
AIRPORT MASTER PLAN
RDM Property Boundary
E
AREA 1
AREA 2
AREA 3
Salmon Ave.
Airp
ort W
ay
Area 1 - Hourly & Premium
Area 2 - Original Employee
Area 3 - Expanded Vendor
Long-Term Parking
Parking Reduced
Parking as Necessary
Note: Layout assumesadditional off-site long termparking lot. Employee parkingwould move to off-site parkinglot as necessary.
AREA 4
Area 4 - Alternative EmployeeParking Expansion
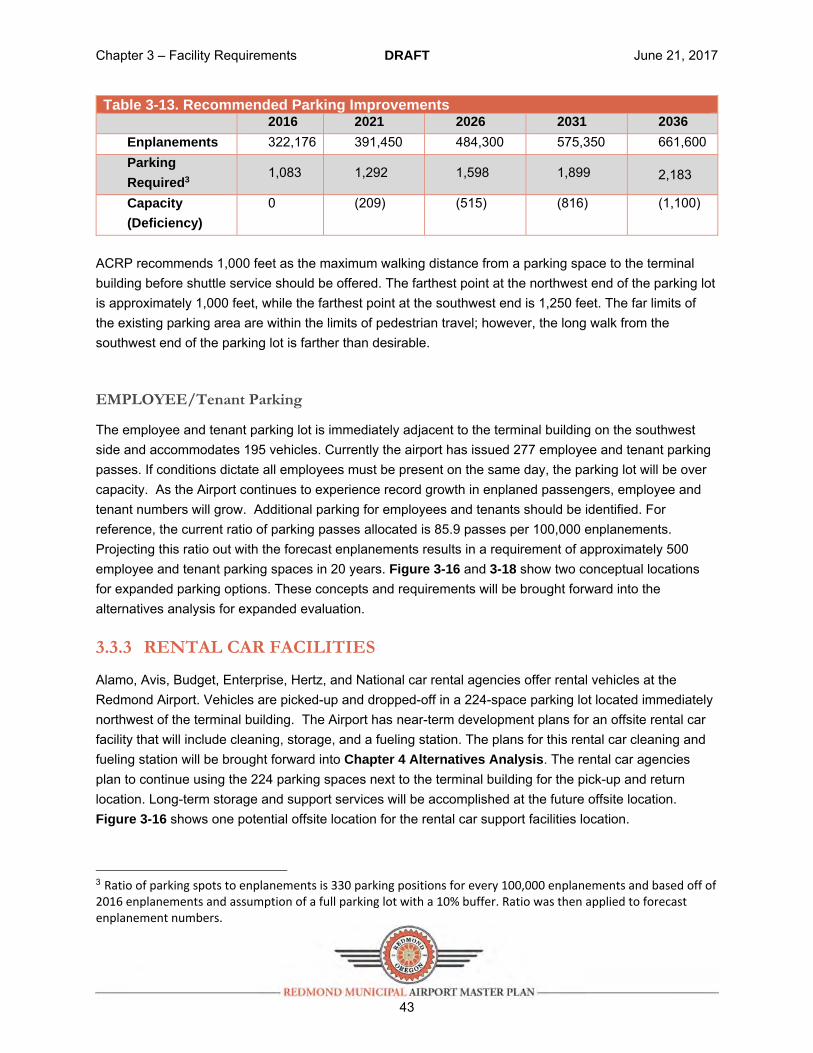
Chapter 3 – Facility Requirements DRAFT June 21, 2017
43
Table 3-13. Recommended Parking Improvements 2016 2021 2026 2031 2036
Enplanements 322,176 391,450 484,300 575,350 661,600 Parking
Required3 1,083 1,292 1,598 1,899 2,183
Capacity
(Deficiency)
0 (209) (515) (816) (1,100)
ACRP recommends 1,000 feet as the maximum walking distance from a parking space to the terminal building before shuttle service should be offered. The farthest point at the northwest end of the parking lot is approximately 1,000 feet, while the farthest point at the southwest end is 1,250 feet. The far limits of the existing parking area are within the limits of pedestrian travel; however, the long walk from the southwest end of the parking lot is farther than desirable.
EMPLOYEE/Tenant Parking
The employee and tenant parking lot is immediately adjacent to the terminal building on the southwest side and accommodates 195 vehicles. Currently the airport has issued 277 employee and tenant parking passes. If conditions dictate all employees must be present on the same day, the parking lot will be over capacity. As the Airport continues to experience record growth in enplaned passengers, employee and tenant numbers will grow. Additional parking for employees and tenants should be identified. For reference, the current ratio of parking passes allocated is 85.9 passes per 100,000 enplanements. Projecting this ratio out with the forecast enplanements results in a requirement of approximately 500 employee and tenant parking spaces in 20 years. Figure 3-16 and 3-18 show two conceptual locations for expanded parking options. These concepts and requirements will be brought forward into the alternatives analysis for expanded evaluation.
3.3.3 RENTAL CAR FACILITIES
Alamo, Avis, Budget, Enterprise, Hertz, and National car rental agencies offer rental vehicles at the Redmond Airport. Vehicles are picked-up and dropped-off in a 224-space parking lot located immediately northwest of the terminal building. The Airport has near-term development plans for an offsite rental car facility that will include cleaning, storage, and a fueling station. The plans for this rental car cleaning and fueling station will be brought forward into Chapter 4 Alternatives Analysis. The rental car agencies plan to continue using the 224 parking spaces next to the terminal building for the pick-up and return location. Long-term storage and support services will be accomplished at the future offsite location. Figure 3-16 shows one potential offsite location for the rental car support facilities location.
3 Ratio of parking spots to enplanements is 330 parking positions for every 100,000 enplanements and based off of 2016 enplanements and assumption of a full parking lot with a 10% buffer. Ratio was then applied to forecast enplanement numbers.

Chapter 3 – Facility Requirements DRAFT June 21, 2017
44
3.3.4 NON-AVIATION REVENUE DEVELOPMENT
The consultant conducted an analysis to identify the facility requirements for non-aviation businesses that complement the airport operations and are appropriate for the Redmond market, given local economic conditions. The analysis in its entirety is contained in the Appendix J. A summary of recommended infrastructure upgrades to help facilitate the revenue development are described below.
RECOMMENDED UPGRADES
The following recommendations are offered based on a comparison of the existing utility and transportation facilities and the corresponding demands of the target industries. Figure 3-19 depicts the nine subareas that are the focus of this section. In all subareas, sewer lines would need to be extended from nearby mains and storm water management facilities would need to be constructed in conjunction with site development. Local streets should be constructed to the local industrial street standard (40-foot paved width with sidewalks) to accommodate necessary truck access for most of the target industry sectors. Improved access to Oregon Route 126 will eventually be required to accommodate future growth with any of the target industry sectors and will likely include added turn lanes and traffic signals. Turn lanes at major intersections may also be needed to serve future development. Necessary improvements would be identified with the preparation of traffic impact studies for specific development proposals. Specific upgrade requirements for each subarea are noted below.
North Development Parcel Subarea: The existing water lines between Lake Road and Veterans Way are not well-connected. A loop system is recommended throughout the subarea to maintain necessary flows for high-demand industrial users. This subarea currently has no existing transportation infrastructure and will need to rely on the construction of new streets. Transportation improvements associated with the Airport Runway Extension will eventually provide access through the subarea. Local streets that provide direct site access will need to be constructed to local industrial standard (40-foot paved width with sidewalks).
North Business Park Subarea: The existing water lines between Veterans Way and OR 126 are not well-connected. A loop system is recommended to supply necessary flows for high-demand users. The local streets (10th Street, Sisters Avenue, Ochoco Way) need to be upgraded to current local industrial standard (40-foot paved width with sidewalks). Veterans Way needs to be upgraded to meet the major collector standard (36-foot paved width with sidewalks). At the Veterans Way intersection with OR 126, an eastbound right-turn deceleration lane on OR 126 may be necessary as volumes increase, and separate left- and right-turn lanes may be necessary on the Veterans Way approach. Left-turn lanes on Veterans Way at other intersecting roadways may also be needed.
Non-Aviation Development Target Industries: Accommodation and Food
Services
Speculative Light Industrial Buildings
Construction
Manufacturing
Wholesalers and Warehousing
Public Administration
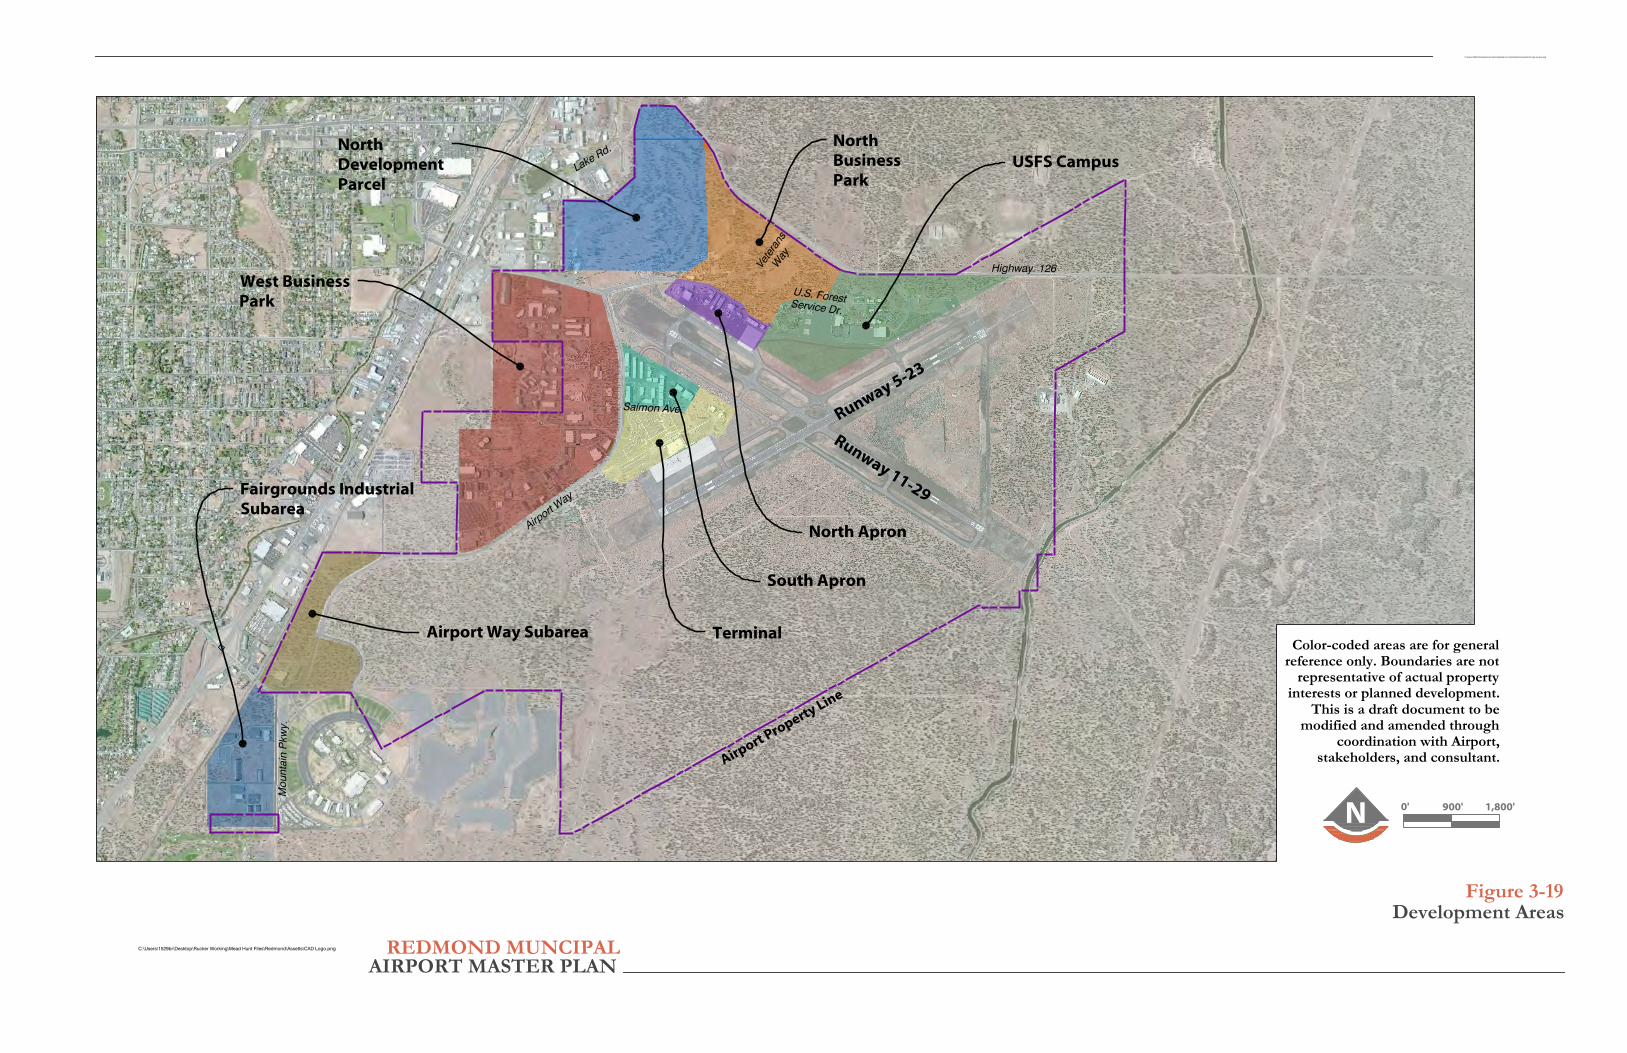
© 2016 Microsoft Corporation
C:\Users\1529br\Desktop\Rucker Working\Mead Hunt Files\Redmond\Assetts\CAD Logo.png
C:\Users\1529br\Desktop\Rucker Working\Mead Hunt Files\Redmond\Assetts\mh logo red gray.png
REDMOND MUNCIPALAIRPORT MASTER PLAN
Figure 3-19Development Areas
N 0' 900' 1,800'
Runway 5-23
Runway 11-29
Color-coded areas are for generalreference only. Boundaries are not
representative of actual propertyinterests or planned development.
This is a draft document to bemodified and amended through
coordination with Airport,stakeholders, and consultant.
Terminal
South Apron
North Apron
Fairgrounds IndustrialSubarea
Airport Way Subarea
USFS CampusNorthBusinessPark
NorthDevelopmentParcel
West BusinessPark
Airport Property Line
Airport W
ay
Salmon Ave.
Vete
rans
Highway 126
U.S. Forest
Lake Rd.
Way
Mou
ntai
n P
kwy.
Service Dr.
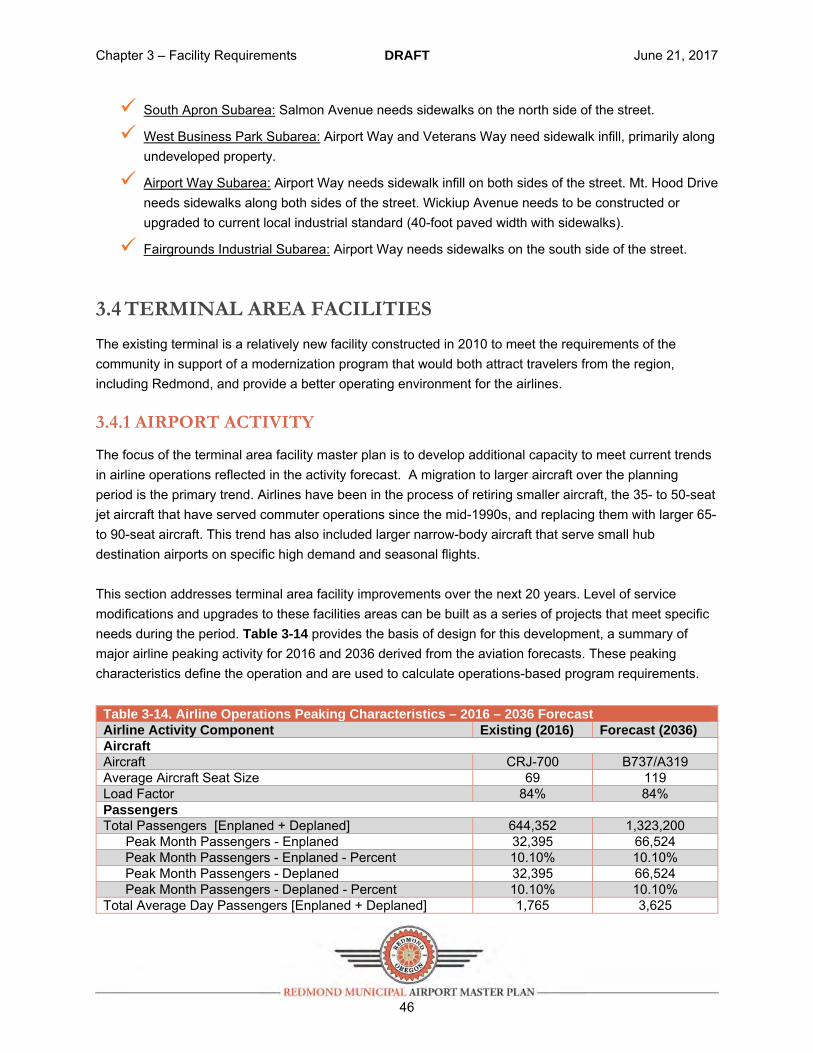
Chapter 3 – Facility Requirements DRAFT June 21, 2017
46
South Apron Subarea: Salmon Avenue needs sidewalks on the north side of the street.
West Business Park Subarea: Airport Way and Veterans Way need sidewalk infill, primarily along undeveloped property.
Airport Way Subarea: Airport Way needs sidewalk infill on both sides of the street. Mt. Hood Drive needs sidewalks along both sides of the street. Wickiup Avenue needs to be constructed or upgraded to current local industrial standard (40-foot paved width with sidewalks).
Fairgrounds Industrial Subarea: Airport Way needs sidewalks on the south side of the street.
3.4 TERMINAL AREA FACILITIES
The existing terminal is a relatively new facility constructed in 2010 to meet the requirements of the community in support of a modernization program that would both attract travelers from the region, including Redmond, and provide a better operating environment for the airlines.
3.4.1 AIRPORT ACTIVITY
The focus of the terminal area facility master plan is to develop additional capacity to meet current trends in airline operations reflected in the activity forecast. A migration to larger aircraft over the planning period is the primary trend. Airlines have been in the process of retiring smaller aircraft, the 35- to 50-seat jet aircraft that have served commuter operations since the mid-1990s, and replacing them with larger 65- to 90-seat aircraft. This trend has also included larger narrow-body aircraft that serve small hub destination airports on specific high demand and seasonal flights. This section addresses terminal area facility improvements over the next 20 years. Level of service modifications and upgrades to these facilities areas can be built as a series of projects that meet specific needs during the period. Table 3-14 provides the basis of design for this development, a summary of major airline peaking activity for 2016 and 2036 derived from the aviation forecasts. These peaking characteristics define the operation and are used to calculate operations-based program requirements.
Table 3-14. Airline Operations Peaking Characteristics – 2016 – 2036 Forecast Airline Activity Component Existing (2016) Forecast (2036) Aircraft Aircraft CRJ-700 B737/A319 Average Aircraft Seat Size 69 119 Load Factor 84% 84% Passengers Total Passengers [Enplaned + Deplaned] 644,352 1,323,200
Peak Month Passengers - Enplaned 32,395 66,524 Peak Month Passengers - Enplaned - Percent 10.10% 10.10% Peak Month Passengers - Deplaned 32,395 66,524 Peak Month Passengers - Deplaned - Percent 10.10% 10.10% Total Average Day Passengers [Enplaned + Deplaned] 1,765 3,625
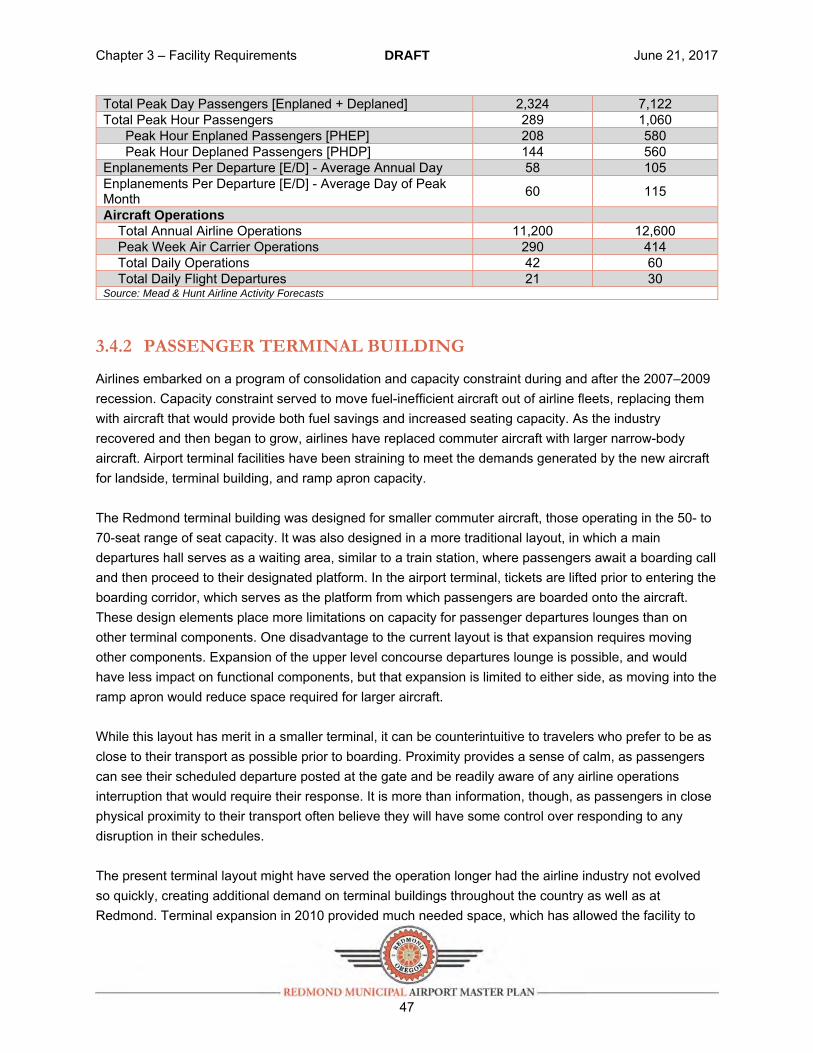
Chapter 3 – Facility Requirements DRAFT June 21, 2017
47
Total Peak Day Passengers [Enplaned + Deplaned] 2,324 7,122 Total Peak Hour Passengers 289 1,060 Peak Hour Enplaned Passengers [PHEP] 208 580 Peak Hour Deplaned Passengers [PHDP] 144 560 Enplanements Per Departure [E/D] - Average Annual Day 58 105 Enplanements Per Departure [E/D] - Average Day of Peak Month
60 115
Aircraft Operations Total Annual Airline Operations 11,200 12,600 Peak Week Air Carrier Operations 290 414 Total Daily Operations 42 60 Total Daily Flight Departures 21 30 Source: Mead & Hunt Airline Activity Forecasts
3.4.2 PASSENGER TERMINAL BUILDING
Airlines embarked on a program of consolidation and capacity constraint during and after the 2007–2009 recession. Capacity constraint served to move fuel-inefficient aircraft out of airline fleets, replacing them with aircraft that would provide both fuel savings and increased seating capacity. As the industry recovered and then began to grow, airlines have replaced commuter aircraft with larger narrow-body aircraft. Airport terminal facilities have been straining to meet the demands generated by the new aircraft for landside, terminal building, and ramp apron capacity. The Redmond terminal building was designed for smaller commuter aircraft, those operating in the 50- to 70-seat range of seat capacity. It was also designed in a more traditional layout, in which a main departures hall serves as a waiting area, similar to a train station, where passengers await a boarding call and then proceed to their designated platform. In the airport terminal, tickets are lifted prior to entering the boarding corridor, which serves as the platform from which passengers are boarded onto the aircraft. These design elements place more limitations on capacity for passenger departures lounges than on other terminal components. One disadvantage to the current layout is that expansion requires moving other components. Expansion of the upper level concourse departures lounge is possible, and would have less impact on functional components, but that expansion is limited to either side, as moving into the ramp apron would reduce space required for larger aircraft. While this layout has merit in a smaller terminal, it can be counterintuitive to travelers who prefer to be as close to their transport as possible prior to boarding. Proximity provides a sense of calm, as passengers can see their scheduled departure posted at the gate and be readily aware of any airline operations interruption that would require their response. It is more than information, though, as passengers in close physical proximity to their transport often believe they will have some control over responding to any disruption in their schedules. The present terminal layout might have served the operation longer had the airline industry not evolved so quickly, creating additional demand on terminal buildings throughout the country as well as at Redmond. Terminal expansion in 2010 provided much needed space, which has allowed the facility to
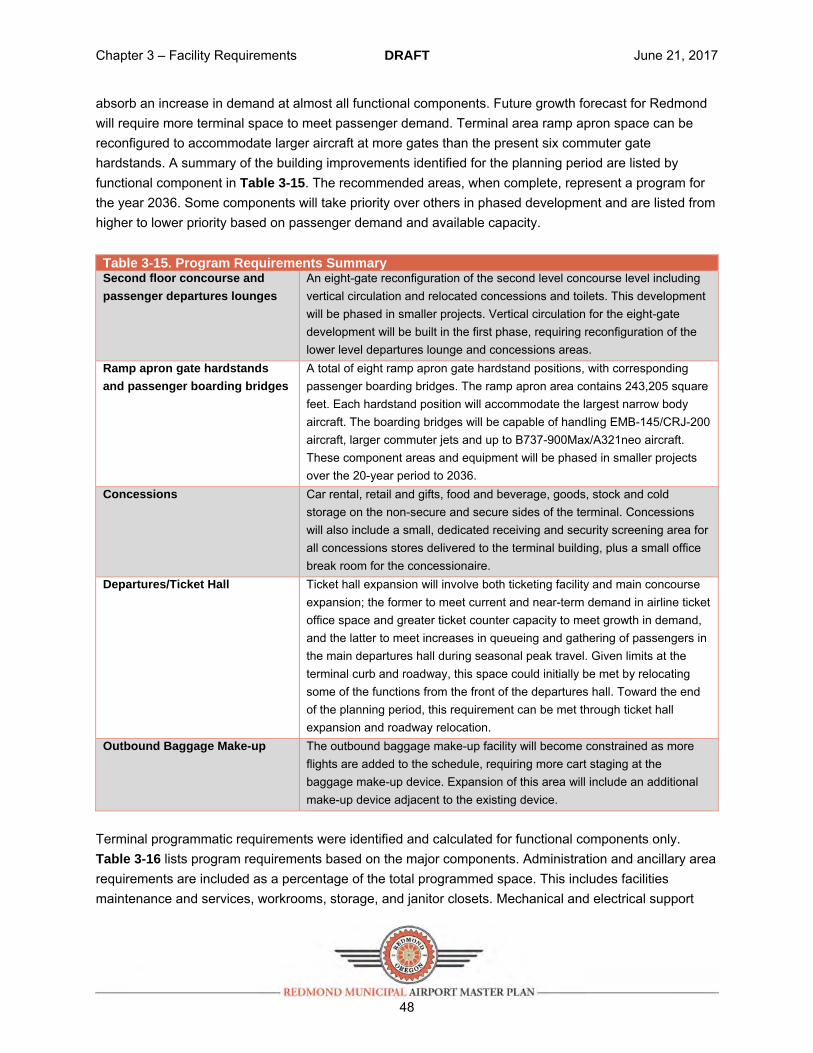
Chapter 3 – Facility Requirements DRAFT June 21, 2017
48
absorb an increase in demand at almost all functional components. Future growth forecast for Redmond will require more terminal space to meet passenger demand. Terminal area ramp apron space can be reconfigured to accommodate larger aircraft at more gates than the present six commuter gate hardstands. A summary of the building improvements identified for the planning period are listed by functional component in Table 3-15. The recommended areas, when complete, represent a program for the year 2036. Some components will take priority over others in phased development and are listed from higher to lower priority based on passenger demand and available capacity.
Table 3-15. Program Requirements Summary Second floor concourse and
passenger departures lounges An eight-gate reconfiguration of the second level concourse level including vertical circulation and relocated concessions and toilets. This development will be phased in smaller projects. Vertical circulation for the eight-gate development will be built in the first phase, requiring reconfiguration of the lower level departures lounge and concessions areas.
Ramp apron gate hardstands
and passenger boarding bridges A total of eight ramp apron gate hardstand positions, with corresponding passenger boarding bridges. The ramp apron area contains 243,205 square feet. Each hardstand position will accommodate the largest narrow body aircraft. The boarding bridges will be capable of handling EMB-145/CRJ-200 aircraft, larger commuter jets and up to B737-900Max/A321neo aircraft. These component areas and equipment will be phased in smaller projects over the 20-year period to 2036.
Concessions Car rental, retail and gifts, food and beverage, goods, stock and cold storage on the non-secure and secure sides of the terminal. Concessions will also include a small, dedicated receiving and security screening area for all concessions stores delivered to the terminal building, plus a small office break room for the concessionaire.
Departures/Ticket Hall Ticket hall expansion will involve both ticketing facility and main concourse expansion; the former to meet current and near-term demand in airline ticket office space and greater ticket counter capacity to meet growth in demand, and the latter to meet increases in queueing and gathering of passengers in the main departures hall during seasonal peak travel. Given limits at the terminal curb and roadway, this space could initially be met by relocating some of the functions from the front of the departures hall. Toward the end of the planning period, this requirement can be met through ticket hall expansion and roadway relocation.
Outbound Baggage Make-up The outbound baggage make-up facility will become constrained as more flights are added to the schedule, requiring more cart staging at the baggage make-up device. Expansion of this area will include an additional make-up device adjacent to the existing device.
Terminal programmatic requirements were identified and calculated for functional components only. Table 3-16 lists program requirements based on the major components. Administration and ancillary area requirements are included as a percentage of the total programmed space. This includes facilities maintenance and services, workrooms, storage, and janitor closets. Mechanical and electrical support
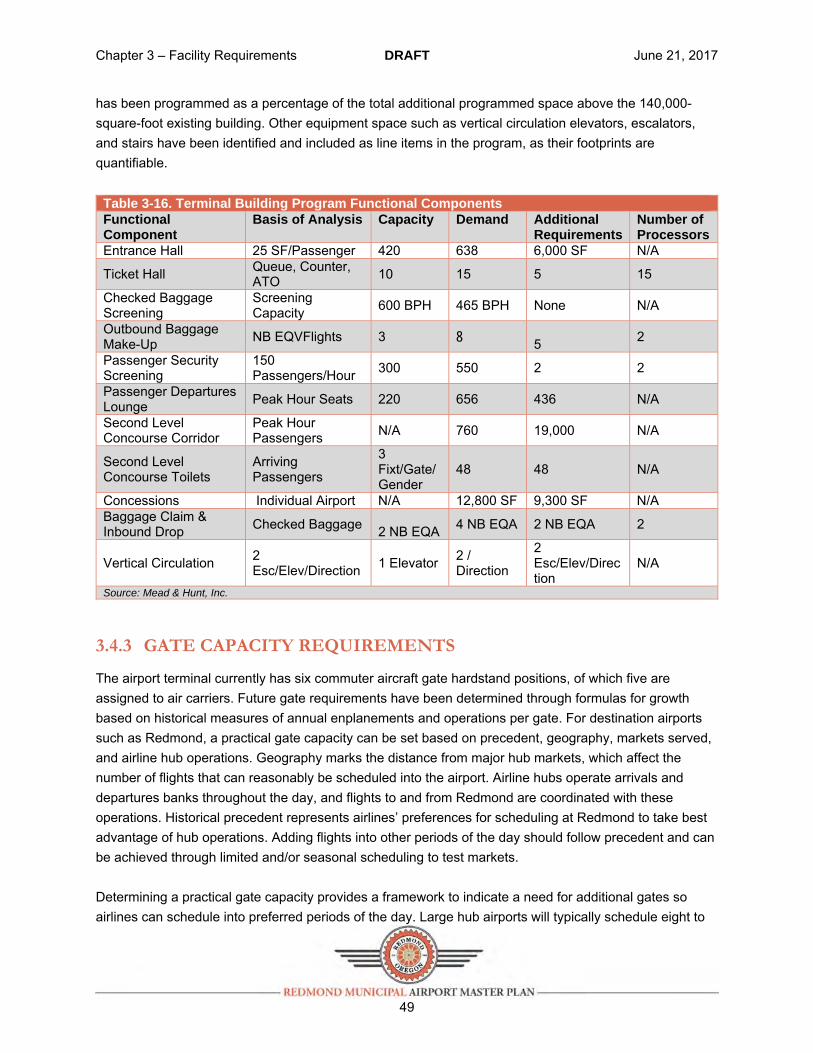
Chapter 3 – Facility Requirements DRAFT June 21, 2017
49
has been programmed as a percentage of the total additional programmed space above the 140,000-square-foot existing building. Other equipment space such as vertical circulation elevators, escalators, and stairs have been identified and included as line items in the program, as their footprints are quantifiable.
Table 3-16. Terminal Building Program Functional Components Functional Component
Basis of Analysis Capacity Demand Additional Requirements
Number of Processors
Entrance Hall 25 SF/Passenger 420 638 6,000 SF N/A
Ticket Hall Queue, Counter, ATO 10 15 5 15
Checked Baggage Screening
Screening Capacity 600 BPH 465 BPH None N/A
Outbound Baggage Make-Up NB EQVFlights 3 8 5 2
Passenger Security Screening
150 Passengers/Hour 300 550 2 2
Passenger Departures Lounge Peak Hour Seats 220 656 436 N/A
Second Level Concourse Corridor
Peak Hour Passengers N/A 760 19,000 N/A
Second Level Concourse Toilets
Arriving Passengers
3 Fixt/Gate/Gender
48 48 N/A
Concessions Individual Airport N/A 12,800 SF 9,300 SF N/A Baggage Claim & Inbound Drop Checked Baggage 2 NB EQA 4 NB EQA 2 NB EQA 2
Vertical Circulation 2 Esc/Elev/Direction 1 Elevator 2 /
Direction
2 Esc/Elev/Direction
N/A
Source: Mead & Hunt, Inc.
3.4.3 GATE CAPACITY REQUIREMENTS
The airport terminal currently has six commuter aircraft gate hardstand positions, of which five are assigned to air carriers. Future gate requirements have been determined through formulas for growth based on historical measures of annual enplanements and operations per gate. For destination airports such as Redmond, a practical gate capacity can be set based on precedent, geography, markets served, and airline hub operations. Geography marks the distance from major hub markets, which affect the number of flights that can reasonably be scheduled into the airport. Airline hubs operate arrivals and departures banks throughout the day, and flights to and from Redmond are coordinated with these operations. Historical precedent represents airlines’ preferences for scheduling at Redmond to take best advantage of hub operations. Adding flights into other periods of the day should follow precedent and can be achieved through limited and/or seasonal scheduling to test markets. Determining a practical gate capacity provides a framework to indicate a need for additional gates so airlines can schedule into preferred periods of the day. Large hub airports will typically schedule eight to
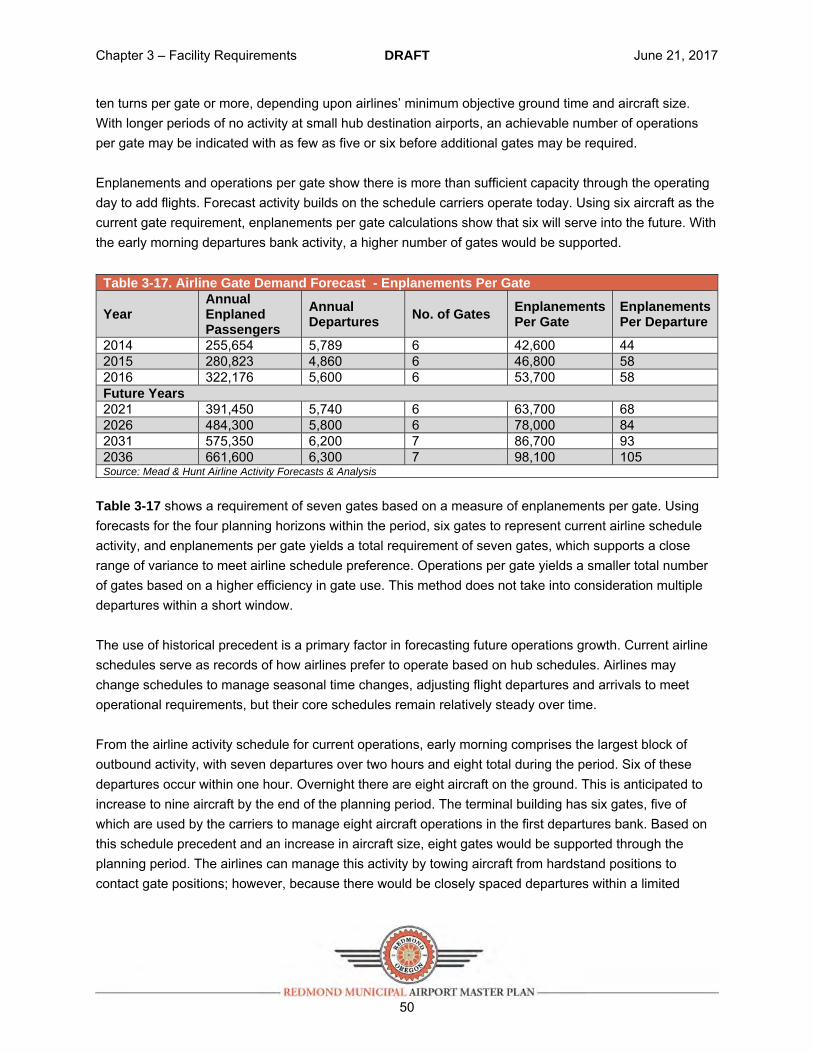
Chapter 3 – Facility Requirements DRAFT June 21, 2017
50
ten turns per gate or more, depending upon airlines’ minimum objective ground time and aircraft size. With longer periods of no activity at small hub destination airports, an achievable number of operations per gate may be indicated with as few as five or six before additional gates may be required. Enplanements and operations per gate show there is more than sufficient capacity through the operating day to add flights. Forecast activity builds on the schedule carriers operate today. Using six aircraft as the current gate requirement, enplanements per gate calculations show that six will serve into the future. With the early morning departures bank activity, a higher number of gates would be supported.
Table 3-17. Airline Gate Demand Forecast - Enplanements Per Gate
Year Annual Enplaned Passengers
Annual Departures No. of Gates Enplanements
Per Gate Enplanements Per Departure
2014 255,654 5,789 6 42,600 44 2015 280,823 4,860 6 46,800 58 2016 322,176 5,600 6 53,700 58 Future Years 2021 391,450 5,740 6 63,700 68 2026 484,300 5,800 6 78,000 84 2031 575,350 6,200 7 86,700 93 2036 661,600 6,300 7 98,100 105 Source: Mead & Hunt Airline Activity Forecasts & Analysis
Table 3-17 shows a requirement of seven gates based on a measure of enplanements per gate. Using forecasts for the four planning horizons within the period, six gates to represent current airline schedule activity, and enplanements per gate yields a total requirement of seven gates, which supports a close range of variance to meet airline schedule preference. Operations per gate yields a smaller total number of gates based on a higher efficiency in gate use. This method does not take into consideration multiple departures within a short window. The use of historical precedent is a primary factor in forecasting future operations growth. Current airline schedules serve as records of how airlines prefer to operate based on hub schedules. Airlines may change schedules to manage seasonal time changes, adjusting flight departures and arrivals to meet operational requirements, but their core schedules remain relatively steady over time. From the airline activity schedule for current operations, early morning comprises the largest block of outbound activity, with seven departures over two hours and eight total during the period. Six of these departures occur within one hour. Overnight there are eight aircraft on the ground. This is anticipated to increase to nine aircraft by the end of the planning period. The terminal building has six gates, five of which are used by the carriers to manage eight aircraft operations in the first departures bank. Based on this schedule precedent and an increase in aircraft size, eight gates would be supported through the planning period. The airlines can manage this activity by towing aircraft from hardstand positions to contact gate positions; however, because there would be closely spaced departures within a limited
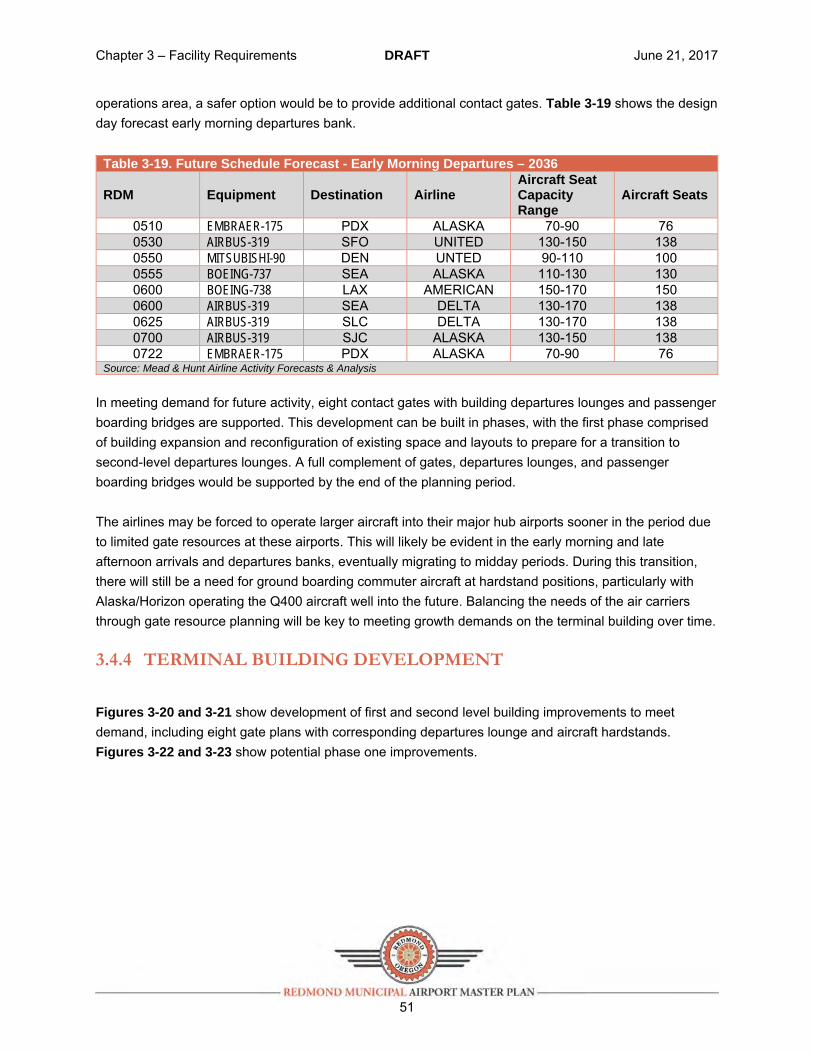
Chapter 3 – Facility Requirements DRAFT June 21, 2017
51
operations area, a safer option would be to provide additional contact gates. Table 3-19 shows the design day forecast early morning departures bank.
Table 3-19. Future Schedule Forecast - Early Morning Departures – 2036
RDM Equipment Destination Airline Aircraft Seat Capacity Range
Aircraft Seats
0510 EMBRAER-175 PDX ALASKA 70-90 76 0530 AIRBUS-319 SFO UNITED 130-150 138 0550 MITSUBISHI-90 DEN UNTED 90-110 100 0555 BOEING-737 SEA ALASKA 110-130 130 0600 BOEING-738 LAX AMERICAN 150-170 150 0600 AIRBUS-319 SEA DELTA 130-170 138 0625 AIRBUS-319 SLC DELTA 130-170 138 0700 AIRBUS-319 SJC ALASKA 130-150 138 0722 EMBRAER-175 PDX ALASKA 70-90 76
Source: Mead & Hunt Airline Activity Forecasts & Analysis
In meeting demand for future activity, eight contact gates with building departures lounges and passenger boarding bridges are supported. This development can be built in phases, with the first phase comprised of building expansion and reconfiguration of existing space and layouts to prepare for a transition to second-level departures lounges. A full complement of gates, departures lounges, and passenger boarding bridges would be supported by the end of the planning period. The airlines may be forced to operate larger aircraft into their major hub airports sooner in the period due to limited gate resources at these airports. This will likely be evident in the early morning and late afternoon arrivals and departures banks, eventually migrating to midday periods. During this transition, there will still be a need for ground boarding commuter aircraft at hardstand positions, particularly with Alaska/Horizon operating the Q400 aircraft well into the future. Balancing the needs of the air carriers through gate resource planning will be key to meeting growth demands on the terminal building over time.
3.4.4 TERMINAL BUILDING DEVELOPMENT
Figures 3-20 and 3-21 show development of first and second level building improvements to meet demand, including eight gate plans with corresponding departures lounge and aircraft hardstands. Figures 3-22 and 3-23 show potential phase one improvements.
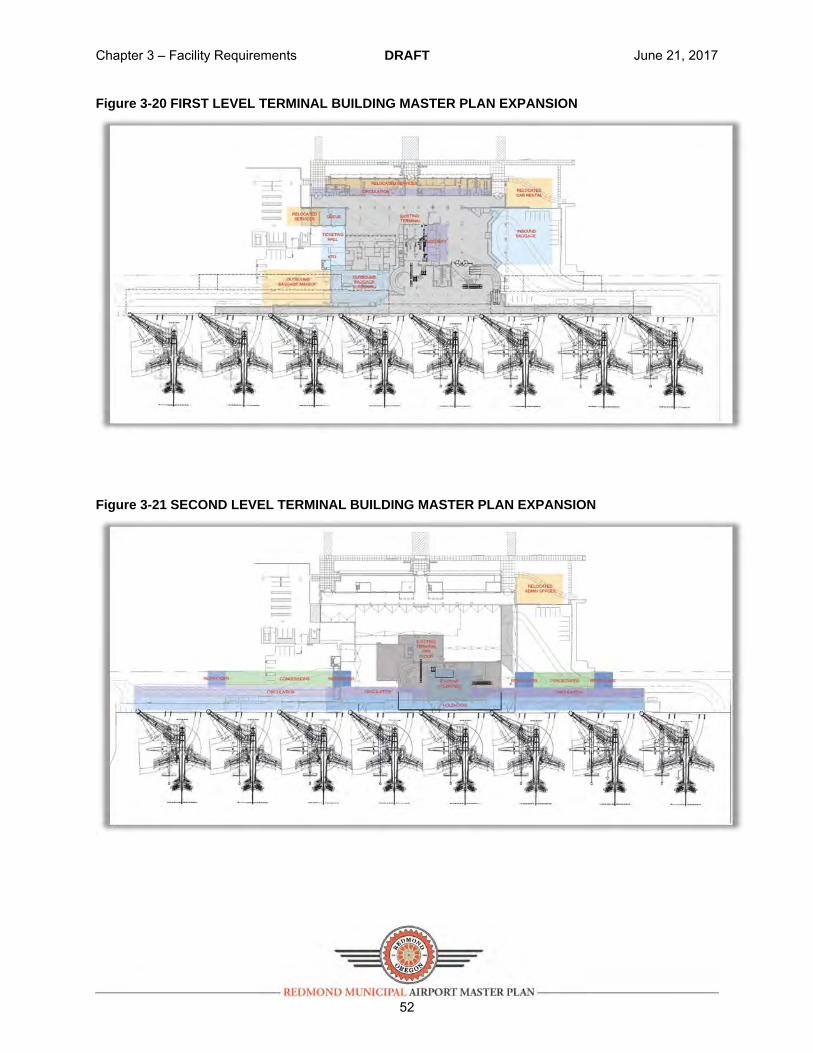
Chapter 3 – Facility Requirements DRAFT June 21, 2017
52
Figure 3-20 FIRST LEVEL TERMINAL BUILDING MASTER PLAN EXPANSION
Figure 3-21 SECOND LEVEL TERMINAL BUILDING MASTER PLAN EXPANSION

Chapter 3 – Facility Requirements DRAFT June 21, 2017
53
Figure 3-22 FIRST LEVEL TERMINAL BUILDING MASTER PLAN EXPANSION – PHASE ONE
Figure 3-23 SECOND LEVEL TERMINAL BUILDING MASTER PLAN EXPANSION – PHASE ONE
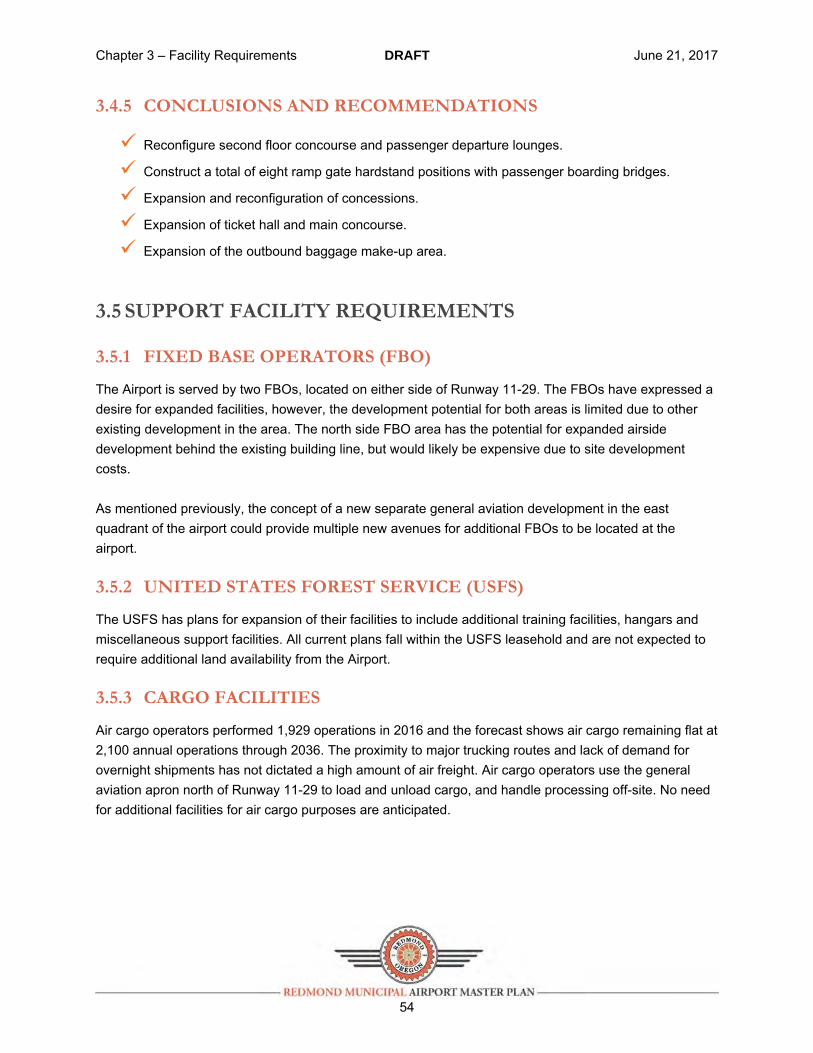
Chapter 3 – Facility Requirements DRAFT June 21, 2017
54
3.4.5 CONCLUSIONS AND RECOMMENDATIONS
Reconfigure second floor concourse and passenger departure lounges.
Construct a total of eight ramp gate hardstand positions with passenger boarding bridges.
Expansion and reconfiguration of concessions.
Expansion of ticket hall and main concourse.
Expansion of the outbound baggage make-up area.
3.5 SUPPORT FACILITY REQUIREMENTS
3.5.1 FIXED BASE OPERATORS (FBO)
The Airport is served by two FBOs, located on either side of Runway 11-29. The FBOs have expressed a desire for expanded facilities, however, the development potential for both areas is limited due to other existing development in the area. The north side FBO area has the potential for expanded airside development behind the existing building line, but would likely be expensive due to site development costs. As mentioned previously, the concept of a new separate general aviation development in the east quadrant of the airport could provide multiple new avenues for additional FBOs to be located at the airport.
3.5.2 UNITED STATES FOREST SERVICE (USFS)
The USFS has plans for expansion of their facilities to include additional training facilities, hangars and miscellaneous support facilities. All current plans fall within the USFS leasehold and are not expected to require additional land availability from the Airport.
3.5.3 CARGO FACILITIES
Air cargo operators performed 1,929 operations in 2016 and the forecast shows air cargo remaining flat at 2,100 annual operations through 2036. The proximity to major trucking routes and lack of demand for overnight shipments has not dictated a high amount of air freight. Air cargo operators use the general aviation apron north of Runway 11-29 to load and unload cargo, and handle processing off-site. No need for additional facilities for air cargo purposes are anticipated.
Chapter 3 – Facility Requirements DRAFT June 21, 2017
55
3.5.4 AIR SUPPORT AND MAINTENANCE FACILITIES
SNOW REMOVAL EQUIPMENT (SRE)
The Airport has plans underway to replace and relocate the SRE building to the north side of the airfield. The relocation will allow for an expanded building size and also open up valuable airside land for future aviation related development. The future size and location are being evaluated as of April 2017. The details will be incorporated into the Chapter 4 Alternatives Analysis.
AIRPORT RESCUE AND FIRE FIGHTING (ARFF)
The ARFF facility is centrally located northeast of the terminal building. Since RDM is certified under 14 CFR Part 139, it must comply with ARFF equipment, staff, and operational requirements developed by the FAA and the International Civil Aviation Organization Rescue and Fire Fighting Panel. According to Part 139 and FAA AC 150/5220-10E, ARFF equipment and staff requirements are based upon the length of the largest air carrier aircraft that serves an airport with an average of five or more daily departures. Table 3-20 presents the ARFF Index, aircraft length criteria, and representative air carrier aircraft. Table 3-20. ARFF Index Requirements ARFF Index Aircraft Length Criteria Representative Aircraft A Less than 90 feet CRJ-200 B 90 feet but less than 126 feet Q400,B-737, A-320, ERJ-145 C 126 feet but less than 159 feet B-757, MD-80, A-310 D 159 feet but less than 200 feet B-767, DC-10 E More than 200 feet B-747, A-380 Source: Code of Federal Regulations, Part 139.315
RDM currently falls under ARFF Index B based on the longest aircraft operating at the Airport with an average of five or more daily departures. The Airport currently meets the ARFF Index B requirements. No change to the ARFF Index is expected within the 20-year planning window.
AIR TRAFFIC CONTROL TOWER (ATCT)
No changes to the location, size, or function of the existing ATCT are anticipated within the 20-year planning timeframe. The existing ATCT line-of-sight is depicted on Figure 3-24. Several known areas of line-of-sight blockage have been depicted. ATC has an operational way of addressing these blocked areas. No new line-of-sight blockages should be created through future on-airport development. The ATCT line-of-sight will be an evaluation factor used in the Chapter 4 Alternatives Analysis.
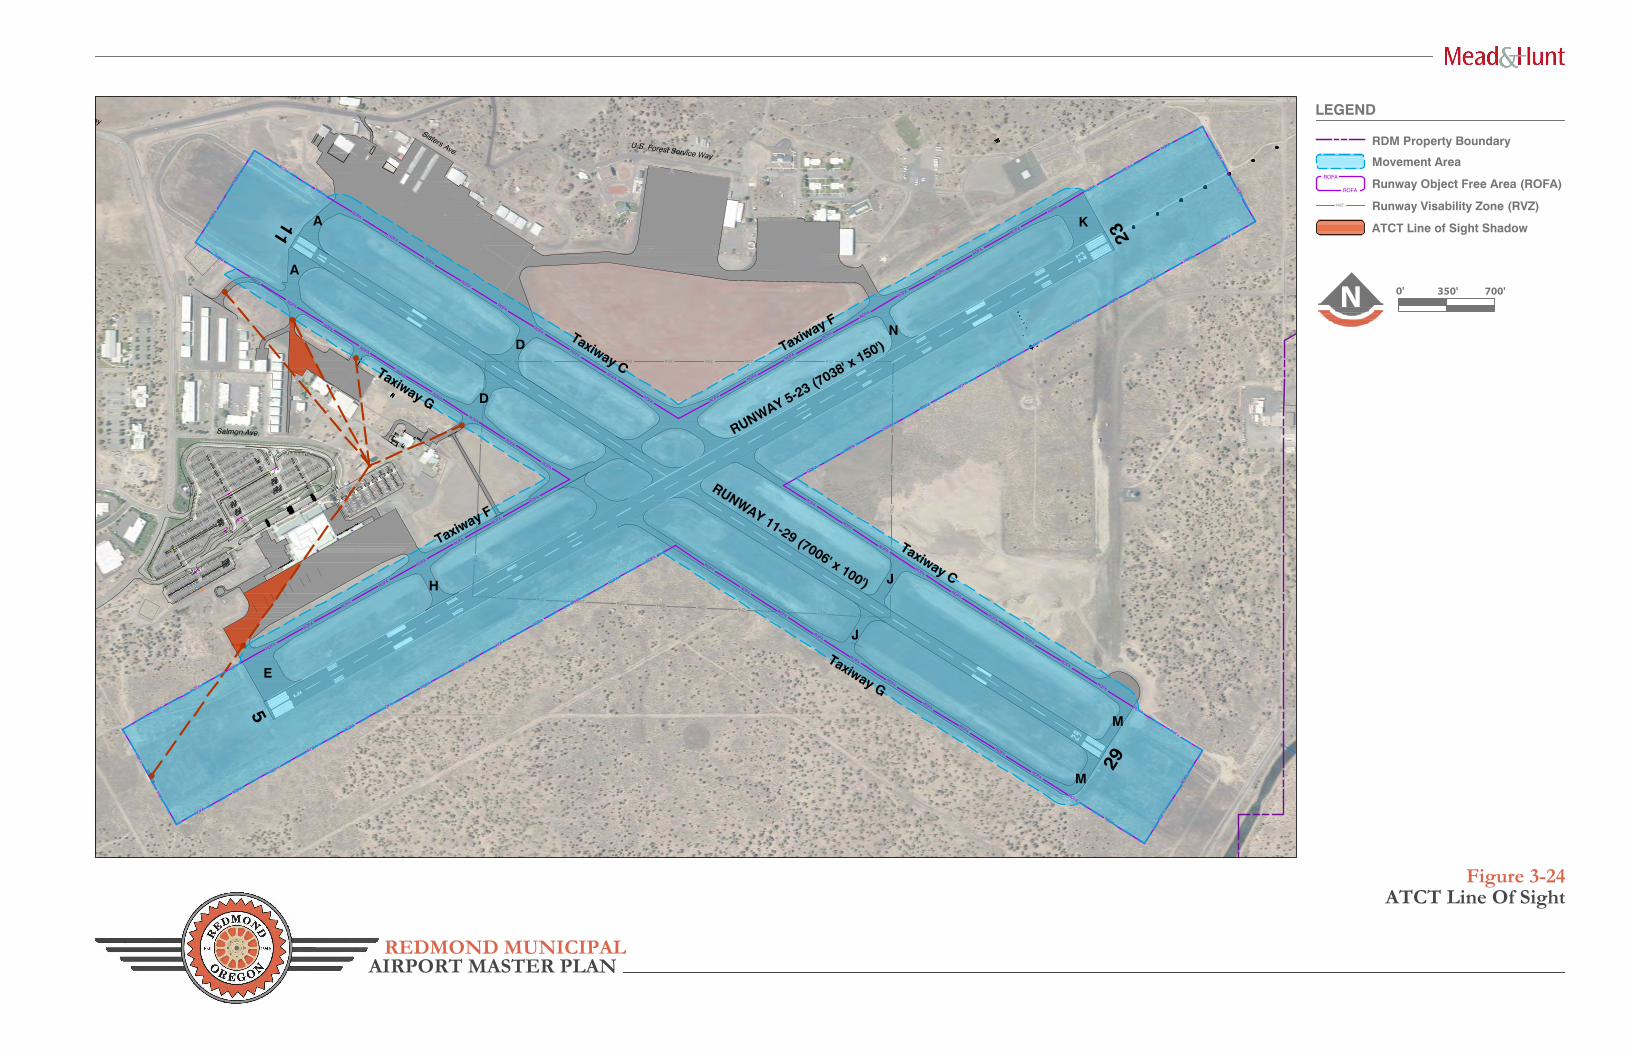
x
x
RV
ZR
VZ
RV
ZR
VZ
RV
ZR
VZ
RV
ZR
VZ
RV
ZR
VZ
RV
Z
RVZ RVZ RVZ RVZ RVZ RVZ RVZ RVZ RVZ RVZ
RVZ RVZ RVZ RVZ RVZ RVZ RVZ RVZ RVZ RVZ
xx
x
xx
x
x x
x
x
x
xxx
x
xx
x
x
x
Veterans Way
Salmon Ave.
U.S. Forest Service Way
Sisters Ave.
ROFA
ROFA
ROFA
ROFA
ROFA
ROFA
ROFA
ROFA
ROFA
ROFA
ROFA
ROFA
ROFA
ROFA
ROFA
ROFA
ROFA
ROFA
ROFA
ROFA
ROFA
ROFA
ROFA
ROFA
ROFA
ROFA
ROFA
ROFA
ROFA
ROFA
ROFA
ROFA
ROFA
ROFA
ROFA
ROFA
ROFA
ROFA
ROFA
ROFA
ROFA
ROFA
ROFA
ROFA
ROFA
ROFA
ROFA
ROFA
ROFA
ROFA
ROFA
ROFA
ROFA
ROFA
ROFA
ROFA
ROFA
ROFA
ROFA
ROFA
ROFA
ROFA
ROFA
ROFA
ROFA
ROFA
ROFA
ROFA
ROFA
ROFA
ROFA
ROFA
ROFA
ROFA
ROFA
ROFA
ROFA
ROFA
ROFA
ROFA
ROFA
ROFA
ROFA
ROFA
ROFA
ROFA
ROFA
ROFA
ROFA
ROFA
ROFA
ROFA
ROFA
ROFA
ROFA
ROFA
ROFA
ROFA
ROFA
ROFA
ROFA
REDMOND MUNICIPAL
Figure 3-24ATCT Line Of Sight
N 0' 350' 700'
LEGEND
AIRPORT MASTER PLAN
RDM Property Boundary
Movement Area
ROFA
ROFA
Runway Object Free Area (ROFA)
Runway Visability Zone (RVZ)RVZ
K
N
Taxiway GE
H
Taxiway F
J
M
D
J
M
RUNWAY 11-29 (7006' x 100')
RUNWAY 5-23 (7038' x 150')
Taxiway C
Taxiway G
Taxiway CTaxiway F
29
5
11 23 ATCT Line of Sight ShadowA
D
A
Chapter 3 – Facility Requirements DRAFT June 21, 2017
57
AIRPORT SERVICE ROADS
The Airport currently has a well-established network of perimeter service roads of varying types. A combination of dirt and paved service roads allow airport personnel to access all areas of the existing airfield. No changes to the airport service roads are anticipated for the existing airfield layout. Should the Chapter 4 Alternatives Analysis recommend a runway extension or the protection for an ultimate third runway, service roads would need to be reevaluated for those planned improvements.
SECURITY GATES
The perimeter fence line contains multiple gates. There a several types of gates used according to their purpose and need. Gates are located primarily near the north and south general aviation areas of the airport providing access to and from hangars, businesses and general aviation users. No areas of improvement have been identified for the existing airport configuration. As alternative airfield layouts are addressed in Chapter 4, so will the requirements for additional airfield access points.
DISASTER PLANNING FACILITY REQUIREMENTS
In the event of a Cascadia Subduction earthquake event or other similar magnitude disaster event, the Airport could very likely be called to serve as a critical transportation link to help supply people, equipment and supplies necessary to manage the event’s aftermath. Preliminary discussion with personnel from the Office of Emergency Management and Oregon Air National Guard have indicated that the Airport could be used as a forward operating base where supplies and people would arrive by air and be redistributed where necessary. Inbound supplies would likely arrive via C-17 and C-130 military transport aircraft. Depending on the source, personnel could also arrive on those military transport aircraft or on chartered commercial flights. Physical space for both supplies and aircraft will likely be at a premium in the immediate days/weeks following an event. Long-term development plans generated in this Master Plan will consider what areas of the Airport could be used to accommodate the mobilization following a disaster event where RDM serves a critical role. In the days/weeks immediately following a Cascadia event or similar disaster, it is likely that scheduled airline service would be halted.
3.5.5 CONCLUSIONS AND RECOMMENDATIONS
Identify location for relocated SRE building.
Identify on-airport areas for storage of supplies to assist with the response to a Cascadia Subduction event.
Chapter 3 – Facility Requirements DRAFT June 21, 2017
58
3.6 FACILITY REQUIREMENTS SUMMARY
The following summarizes the facility requirements necessary for the Airport to accommodate its projected 20-year growth, increase aviation and non-aviation related revenue generating development, and comply with required airfield design standards.
Runway 5-23 will need an extension to a length of about 10,000 feet to accommodate the future airlines passenger fleet.
The parallel taxiways and runway connector taxiways will be designated as TDG5.
Taxiway system geometry improvements:
Taxiway A (north side): add pavement and restripe to provide a right angel taxiway.
Taxiway A (south side): add pavement and restripe to provide a right angel taxiway.
Taxiway E: replace existing taxiway segment between the apron and Taxiway F with a new connector taxiway located about 400 feet east of the existing taxiway.
Taxiway H: replace the existing taxiway segment between the apron and Taxiway F with a new connector taxiway located about 175 feet east of the existing taxiway.
Taxiway C hot spot: shift segment that crosses Runway 5-23 to the east.
Taxiway G hot spot: shift segment that crosses Runway 5-23 to the west.
Runway exit taxiways: retain current locations.
Pavement strength: evaluate pavement strength requirements when narrow body airline aircraft begin regularly scheduled operations at the Airport.
General aviation development:
Site aircraft storage hangars to accommodate at least 33 aircraft.
Locate additional long-term general aviation development area for future hangars and/or future FBOs.
Expand passenger terminal apron.
Identify an area within the terminal loop road for transportation network companies to pick-up and drop-off passengers.
Locate parking lot expansion for up to 1,100 parking spaces.
Locate parking lot expansion for up to 500 employee and tenant parking spaces.
Evaluate alternative sites for off-site rental car service center.
Non-aviation revenue generating improvements:
North Development Parcel Subarea: Install a loop water line system between Lake Road and Veterans Way are not well-connected. Construct new streets.
Chapter 3 – Facility Requirements DRAFT June 21, 2017
59
North Business Park Subarea: Install a loop water system between Veterans Way and Oregon Route 126. Upgrade the local streets (10th Street, Sisters Avenue, Ochoco Way) to current local industrial standard (40-foot paved width with sidewalks). Upgrade Veterans Way to meet the major collector standard (36-foot paved width with sidewalks).
South Apron Subarea: Construct sidewalks on the north side of Salmon Avenue.
West Business Park Subarea: Install sidewalk infill as necessary along Airport Way and Veterans Way.
Airport Way Subarea: Install sidewalk on both sides of Airport Way and Mt. Hood Drive. Upgrade Wickiup Avenue to current local industrial standard (40-foot paved width with sidewalks).
Fairgrounds Industrial Subarea: Install sidewalks on south side of Airport Way.
Terminal Improvements:
Reconfigure second floor concourse and passenger departure lounges.
Construct a total of eight ramp gate hardstand positions with passenger boarding bridges.
Expansion and reconfiguration of concessions.
Expansion of ticket hall and main concourse.
Expansion of the outbound baggage make-up area.
Identify location for relocated SRE building.
Identify on-airport areas for storage of supplies to assist with the response to a Cascadia Subduction event.
Chapter 4 details alternative evaluations for each of the above facility requirements.