
17 DAVID SUTTON PICTURES The Lymphatic System
47
17 DAVID SUTTON
-
Upload
muhammad-bin-zulfiqar -
Category
Education
-
view
21 -
download
2
Transcript of 17 DAVID SUTTON PICTURES The Lymphatic System

17DAVID SUTTON

DAVID SUTTON PICTURES
DR. Muhammad Bin Zulfiqar PGR-FCPS III SIMS/SHL
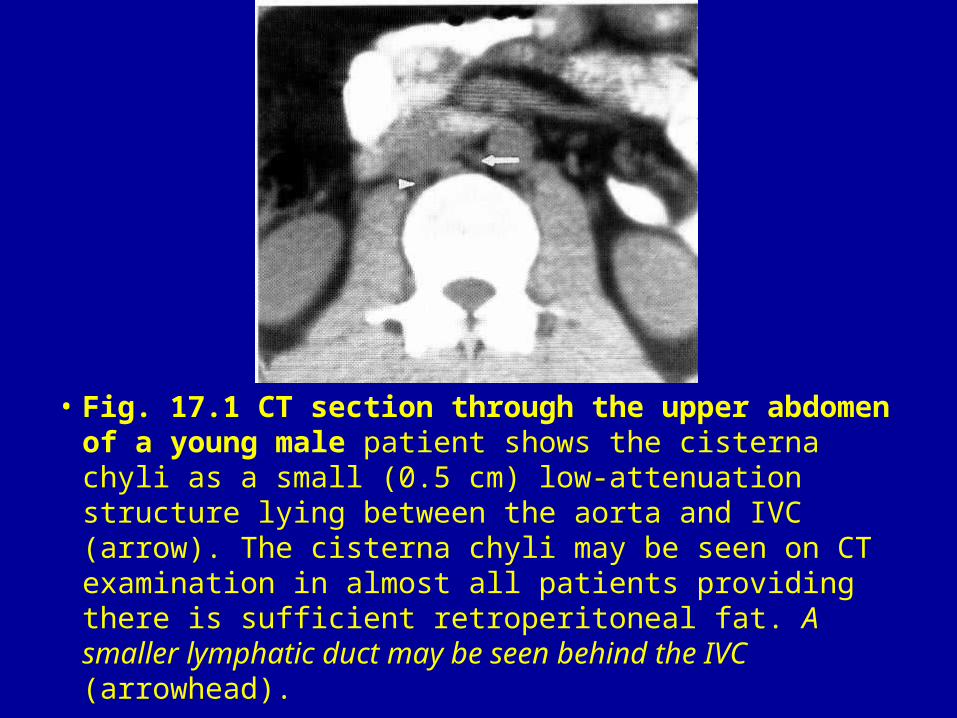
• Fig. 17.1 CT section through the upper abdomen of a young male patient shows the cisterna chyli as a small (0.5 cm) low-attenuation structure lying between the aorta and IVC (arrow). The cisterna chyli may be seen on CT examination in almost all patients providing there is sufficient retroperitoneal fat. A smaller lymphatic duct may be seen behind the IVC (arrowhead).

• Fig. 17.2 Early phase lymphogram film with contrast medium outlining the thoracic duct.

• Fig. 17.3 Early phase lymphogram film with opacification of both lymph nodes and lymph vessels. There are several afferent lymphatics feeding into each lymph node. The single efferent lymphatic always leaves the lymph node through the hilum.

• Fig. 17.4 Axial T1 -weighted MRI examination of the neck. Bilateral retropharyngeal nodes may be identified (arrows). On T 1 -weighted sequences, lymph nodes appear darker than the surrounding fat. Note the flow void phenomenon-the great vessels of the neck appear black.

• Fig. 17.5 T1 -weighted sagittal MRI scan' demonstrating a malignant lymph node in the deep cervical chain invading the jugular vein (as shown by flow void).

• Fig. 17.6 T1 -weighted axial MRI examination of a patient with Hodgkin's disease demonstrating anterior and posterior triangle nodes as small areas of low signal within the relatively bright signal of fat.

• Fig. 17.7 CT examination showing supraclavicular and superior mediastinal lymph nodes.

• Fig. 17.8 CT scan showing enlargement and almost certain involvement of a diaphragmatic lymph node. The enlargement of a diaphragmatic or paracardiac lymph node is of great importance in patients with Hodgkin's disease considered for mantle irradiation. Normal-sized lymph nodes in this area are not seen on CT examination. A = aorta.
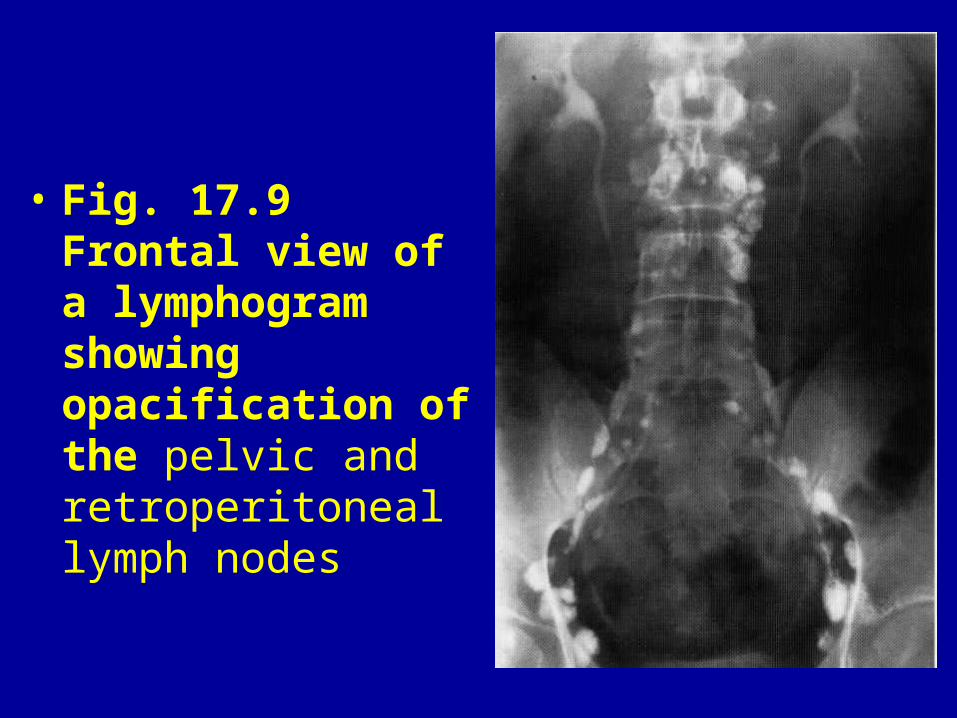
• Fig. 17.9 Frontal view of a lymphogram showing opacification of the pelvic and retroperitoneal lymph nodes

• Fig. 17.10 CT section through the pelvis showing bilateral pelvic and groin lymph node enlargement in a patient with non-Hodgkin lymphoma.

• Fig. 17.11 Contrast-enhanced CT study showing enlargement and involvement of an interaorticocaval lymph node (arrow) in a patient with a right-sided testicular malignancy. Right-sided testicular tumours frequently spread to the interaorticocaval lymph nodes. This is extremely uncommon when the testicular primary is on the left.

• Fig. 17.12 CT section showing mesenteric lymph node involvement (arrowheads) in a patient with non-Hodgkin's lymphoma. This is common in non-Hodgkin's lymphoma, but seen in fewer than 5% of patients with Hodgkin's disease.

• Fig. 17.13 Contrast-enhanced CT scan showing considerable enlargement of upper abdominal, peripancreatic and portal lymph nodes (arrows). The superior mesenteric artery and the hepatic artery are outlined by contrast.

• Fig. 17.14 Frontal chest radiograph. A large mediastinal nodal mass in a patient presenting with Hodgkin's disease is seen compressing the major airways.

• Fig. 17.15 (A) The opacified ureters are seen on intravenous urography to be displaced around a large central abdominal mass. (B) The presence of this mass is confirmed on the CT section. The final diagnosis was testicular teratoma.

• Fig 17.16 Lymphangioscintigram demonstrating lymphoedema with poor lymph drainage in the left leg. Letters a, b and c correspond to groin nodes, the knees and ankles, respectively.

• Fig. 17.17 Gallium-67 radioisotope scan in a patient with nodular sclerosing Hodgkin's disease affecting supraclavicular and mediastinal nodes. Note the normal uptake in the liver.

• Fig. 17.18 Early phase lymphogram film. The limb is swollen, and when lymphography was attempted, lymphatics filled poorly. This is an example of secondary lymphoedema due to filariasis.

• Fig. 17.19 (A) Staging CT on this patient with a testicular primary shows no significant adenopathy. Note the 0.25 cm node in the left retroperitoneum (arrowhead). (B) Seven months later this lymph node has enlarged (arrowhead), indicating the presence of an occult primary in the lymph node at the time of original staging.

• Fig. 17.20 T 1 -weighted axial MRI showing lymph node involvement from a supraglottic SCC (arrows) pre contrast (A), and demonstrating rim enhancement secondary to central necrosis post contrast (B).
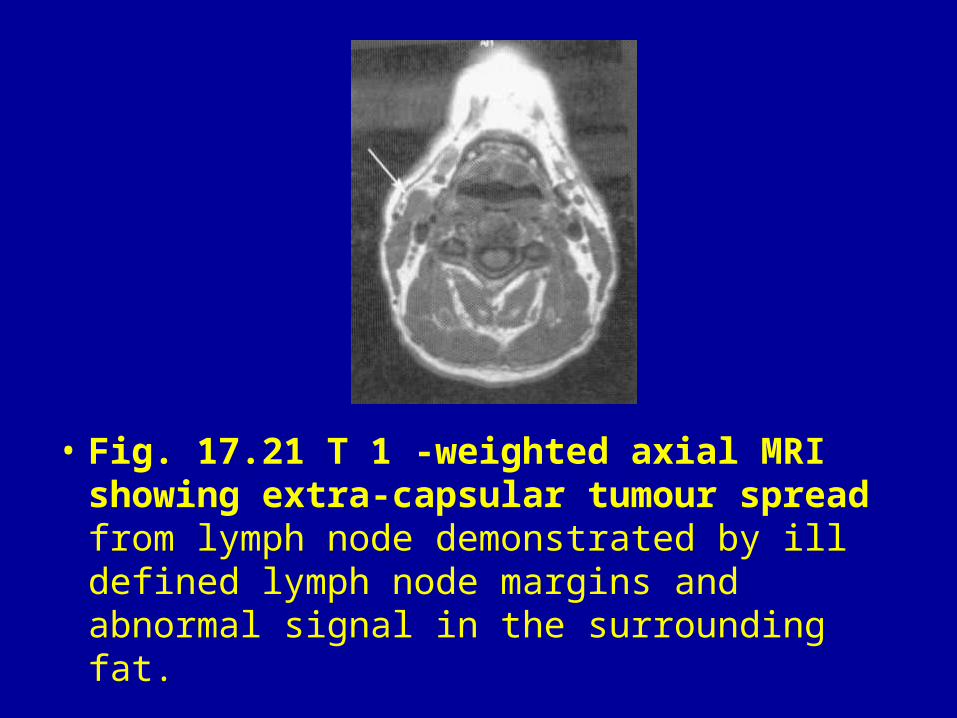
• Fig. 17.21 T 1 -weighted axial MRI showing extra-capsular tumour spread from lymph node demonstrated by ill defined lymph node margins and abnormal signal in the surrounding fat.

• Fig. 17.22 The lymph nodes are generally enlarged and appear foamy in a patient with lymphoma.

• Fig. 17.23 A single focal deposit is seen within the enlarged and opacified lymph node medial to the left ureter (arrow) in this patient with an endometrial cancer.

• Fig. 17.24 (A) Staging CT scans in a patient with a recently resected right-sided testicular tumour showed prominent lymph nodes between the aorta and inferior vena cava (arrow). (B) One month later these have resolved without treatment. Reactive enlargement of lymph nodes is a possible source of error if patients are scanned too close to the date of their surgery. It is better to wait 3-4 weeks.
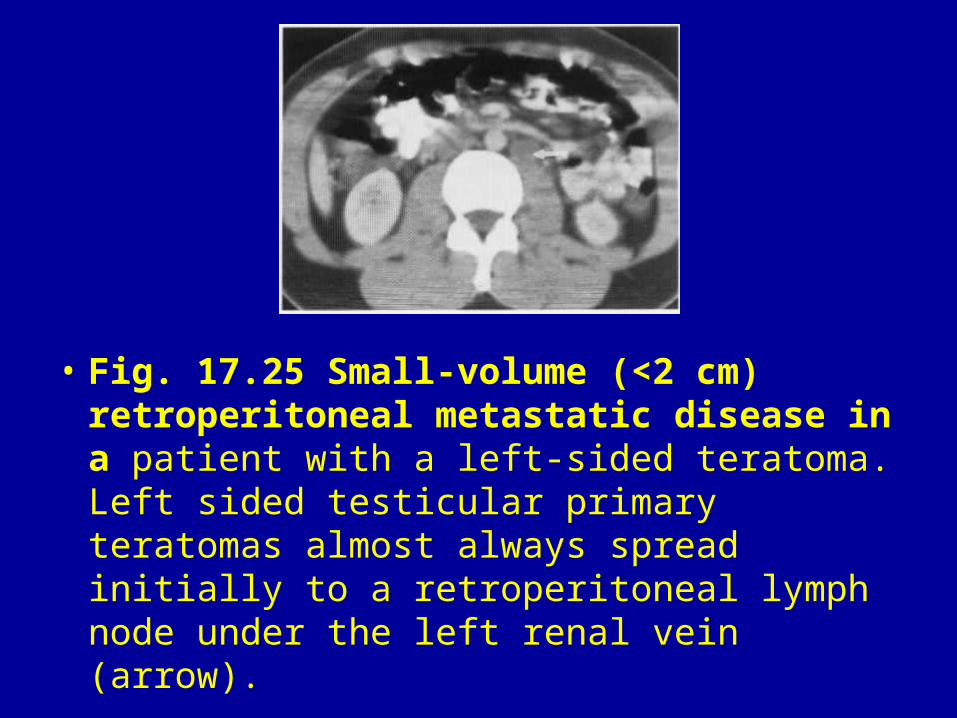
• Fig. 17.25 Small-volume (<2 cm) retroperitoneal metastatic disease in a patient with a left-sided teratoma. Left sided testicular primary teratomas almost always spread initially to a retroperitoneal lymph node under the left renal vein (arrow).

• Fig. 17.26 Large retroperitoneal metastasis ( M) arising from an ipsilateral testicular teratoma seen both on CT (A) and MRI (B).

• Fig. 17.27 (A) CT scan through the abdomen of this patient with metastatic teratoma. (B) CT scan showing an increase in tumour size, along with a decrease in attenuation following treatment, for a testicular teratoma. This almost always indicates differentiation of the tumour into a benign variant. The residuum is excised to protect the patient in the future. Note both the residual interaorticocaval lymph node (arrow) and the liver metastasis (M), both of which enlarge on treatment.

• Fig. 17.28 Long-term reassessment of a patient who had previously had a parotid malignancy resected, now with clinical suspicion of recurrence, shows considerable distortion of the architecture, but the low signal intensity on T2-weighted MRI sequences suggested the scar tissue (arrow) to be benign. This was confirmed at subsequent re-exploration.

• Fig. 17.29 CT examination of the abdomen demonstrating hulk retroperitoneal lymph node disease (stage X).

• Fig. 17.30 CT scans through the abdomen of a patient with gastric NHL showing thickening of the gastric wall and prominence of the rugal folds, with associated nodal disease, (A) before (B) and after treatment.

• Fig. 17.31 T 1 -weighted contrast-enhanced axial MRI of the brain showing periventricular enhancing nodules in disseminated mantle cell lymphoma.

• Fig. 17.32 CT scan showing normal fat and soft-tissue densities in the left paravertebral area. On the right the fat in the paravertebral area is obliterated by lymphoma tissue (arrow), which is closely applied to the nerve root exit foramen. The paravertebral tissues should be systematically reviewed when CT scanning any patient with malignant disease, so that lesions may be detected and treated prior to the onset of cord compression.

• Fig. 17.33 CT scan through the orbits of a patient presenting with orbital NHL. Diffuse thickening of the tissues is seen bilaterally.

• Fig. 17.34 Lateral soft-tissue radiograph of the neck showing abnormal soft tissue from a primary NHL of the neck arising in the epiglottis and presenting with dysphagia.

• Fig. 17.35 CT scan showing pulmonary involvement in a patient with NHL. A mass of tumour tissue is seen around the right hilum. In addition, a number of ill-defined intrapulmonary nodules are seen on the right.

• Fig. 17.36 Abdominal CT examination of a patient with NHL showing secondary involvement of the iliac bone. Note also the involvement of the terminal ileum demonstrated by the use of oral contrast.

• Fig. 17.37 (A) Possible terminal ileal lymphoma in a symptomatic patient with previous abdominal radiation. (B) Adequate bowel opacification shows this to be caecum. (See also Fig. 17.38)

• Fig 17.38 Left-sided IVC (arrows) draining into the left renal vein. This may be mistaken for lymphadenopathy. Although intravenous contrast was not used the correct diagnosis was made due to knowledge of anatomy and its variants.

• Fig. 17.39 CT scan on a patient with NHL shows enlargement of the retrucrural lymph nodes (arrowhead). A= aorta.

• Fig. 17.40 (A,B) Adult T-cell lymphoma presenting with liver and spleen disease. Although in this case the use of intravenous contrast demonstrated splenic involvement it did not change patient management.

• Fig. 17.41 CT scans showing lymphoma in the left paravertebral area (arrows) (A). On follow-up (B) there has been progression with destruction of the transverse process and encroachment on the nerve root exit foramen.

• Fig. 17.42 Lymphoma deposits in the kidney as shown by echo-poor areas on ultrasound. These rarely affect renal function but there is early hydronephrosis due to retroperitoneal lymph node disease. If bilateral this should be treated by stents or nephrostomy prior to chemotherapy.

• Fig. 17.43 CT examination showing interstitial pulmonary shadowing in an immunosuppressed patient on chemotherapy. In this case the diagnosis was varicella pneumonia.

• Fig. 17.44 CT examination showing midline fibrosis with linear borders secondary to mediastinal radiotherapy.


