1614 Energetska statistika u 2017 · 2018-12-31 · statistiČka izvjeŠĆa 1614/2018. statistical...
72
Transcript of 1614 Energetska statistika u 2017 · 2018-12-31 · statistiČka izvjeŠĆa 1614/2018. statistical...


Objavljuje i tiska Državni zavod za statistiku Republike Hrvatske, Zagreb, Ilica 3, p. p. 80.
Published and printed by the Croatian Bureau of Statistics, Zagreb, Ilica 3, P. O. B. 80
Telefon/ Phone: +385 (0) 1 4806-111 Telefaks/ Fax: +385 (0) 1 4817-666
Elektronička pošta/ E-mail: [email protected]
Internetske stranice/ Web site: http://www.dzs.hr
Odgovara ravnatelj Marko Krištof. Person responsible: Marko Krištof, Director General
Priredile: Prepared by: Ivana Zoroja Milić, Mirjana Petanjek, Željka Oršanić Kelebuh
Redaktor: Sub-editor: Darko Jukić
Urednica: Editor-in-Chief: Ljiljana Ostroški
Lektorica za hrvatski jezik: Language Editor for the Croatian Language: Maja Gregorić
Prevoditeljica i lektorica za engleski jezik: Translator and Language Editor for the English Language: Gordana Štampar
Tehnička urednica: Technical Editor: Ankica Bajzek Cesar
Statistička izvješća Statistical Reports ISSN 1332-0297
MOLIMO KORISNIKE DA PRI KORIŠTENJU PODATAKA NAVEDU IZVOR. USERS ARE KINDLY REQUESTED TO STATE THE SOURCE
Tiskano u 30 primjeraka. Printed in 30 copies
Služba za komunikaciju s korisnicima User Communication Department
Informacije i korisnički zahtjevi Information and user requests
Pretplata publikacija Subscription
Novinarski upiti Press corner
Telefon/ Phone: +385 (0) 1 4806-138, 4806-154, 4811-212 Elektronička pošta/ E-mail: [email protected] Telefaks/ Fax: +385 (0) 1 4806-148
Telefon/ Phone: +385 (0) 1 4806-115 Elektronička pošta/ E-mail: [email protected] Telefaks/ Fax: +385 (0) 1 4806-148
Telefon/ Phone: +385 (0) 1 4806-121, 4806-168 Elektronička pošta/ E-mail: [email protected] Telefaks/ Fax: +385 (0) 1 4806-148

STATISTIČKA IZVJEŠĆA 1614/2018. STATISTICAL REPORTS 3
S A D R Ž A J C O N T E N T S
UVOD INTRODUCTION .................................................................................................................................................................................... 5 KRATICE I ZNAKOVI ABBREVIATIONS AND SYMBOLS ........................................................................................................................................................ 6 METODOLOŠKA OBJAŠNJENJA NOTES ON METHODOLOGY ................................................................................................................................................................ 7 1. STATISTIČKA ENERGETSKA BILANCA REPUBLIKE HRVATSKE I OBNOVLJIVI IZVORI ENERGIJE STATISTICAL ENERGY BALANCE OF REPUBLIC OF CROATIA AND RENEWABLE ENERGY SOURCES
1.1. Statistička energetska bilanca Republike Hrvatske za 2016. Statistical energy balance of Republic of Croatia, 2016 .......................................................................................................... 11 1.2. Statistička energetska bilanca Republike Hrvatske za 2017. Statistical energy balance of Republic of Croatia, 2017 .......................................................................................................... 15 1.3. Bruto proizvodnja električne i toplinske energije iz obnovljivih izvora Electricity and heat gross production from renewable sources ............................................................................................... 19 1.3.1. Bruto proizvodnja električne i toplinske energije iz obnovljivih izvora za 2016. Electricity and heat gross production from renewable sources, 2016 ........................................................................... 19 1.3.2. Bruto proizvodnja električne i toplinske energije iz obnovljivih izvora za 2017. Electricity and heat gross production from renewable sources, 2017 ........................................................................... 20 1.4. Opskrba, transformacija i finalna potrošnja obnovljive energije Supply, transformation and final renewable energy consumption ........................................................................................... 21 1.4.1. Opskrba, transformacija i finalna potrošnja obnovljive energije za 2016. Supply, transformation and final renewable energy consumption, 2016 ....................................................................... 21 1.4.2. Opskrba, transformacija i finalna potrošnja obnovljive energije za 2017. Supply, transformation and final renewable energy consumption, 2017 ....................................................................... 23 2. STATISTIČKA ENERGETSKA BILANCA EUROPSKE UNIJE STATISTICAL ENERGY BALANCE OF EUROPEAN UNION
2.1. Statistička energetska bilanca Europske unije za 2015. Statistical energy balance of European Union, 2015 ............................................................................................................... 27 2.2. Statistička energetska bilanca Europske unije za 2016. Statistical energy balance of European Union, 2016 .............................................................................................................. 31 3. STATISTIČKA ENERGETSKA BILANCA PO ZEMLJAMA ČLANICAMA EUROPSKE UNIJE STATISTICAL ENERGY BALANCE BY EU MEMBER STATES
3.1. Potrošnja energije, neto uvoz i udio ovisnosti po zemljama članicama Europske unije za 2015. Energy consumption, net imports and dependence rate, by EU Member States, 2015 ............................................................ 37 3.2. Potrošnja energije, neto uvoz i udio ovisnosti po zemljama članicama Europske unije za 2016. Energy consumption, net imports and dependence rate, by EU Member States, 2016 ............................................................ 38 3.3. Statistička energetska bilanca po zemljama članicama Europske unije za 2015. Statistical energy balance, by EU Member States, 2015 .. ...................................................................................................... 39 3.4. Statistička energetska bilanca po zemljama članicama Europske unije za 2016. Statistical energy balance, by EU Member States, 2016 ......................................................................................................... 47 4. FINALNA POTROŠNJA ENERGIJE U INDUSTRIJI PO PODRUČJIMA I ODJELJCIMA NKD-a 2007. U REPUBLICI HRVATSKOJ FINAL ENERGY CONSUMPTION IN INDUSTRY, ACCORDING TO NKD 2007. SECTIONS AND DIVISIONS, REPUBLIC OF CROATIA
4.1. Finalna potrošnja energije u industriji po područjima i odjeljcima NKD-a 2007. u Republici Hrvatskoj za 2016. Final energy consumption in industry, according to NKD 2007. sections and divisions, Republic of Croatia, 2016 .................. 57 4.2. Finalna potrošnja energije u industriji po područjima i odjeljcima NKD-a 2007. u Republici Hrvatskoj za 2017. Final energy consumption in industry, according to NKD 2007. sections and divisions, Republic of Croatia, 2017 .................. 61
4 STATISTIČKA IZVJEŠĆA 1614/2018. STATISTICAL REPORTS
5. CIJENE ELEKTRIČNE ENERGIJE I PRIRODNOG PLINA DISTRIBUIRANOGA PLINOVODIMA PREMA EUROSTATOVIM RAZREDIMA U REPUBLICI HRVATSKOJ PRICES OF ELECTRICITY AND NATURAL GAS DISTRIBUTED VIA PIPELINES IN REPUBLIC OF CROATIA, ACCORDING TO EUROSTAT CLASSES
5.1. Cijene električne energije i prirodnog plina distribuiranoga plinovodima prema Eurostatovim razredima s PDV-om Prices of electricity and natural gas distributed via pipelines in Republic of Croatia, according to Eurostat classes, including VAT ........................................................................................................................................................................ 67 5.1.1. Cijene električne energije prema Eurostatovim razredima s PDV-om Prices of electricity, according to Eurostat classes, including VAT .............................................................................. 67 5.1.1.1. Cijene električne energije isporučene industriji Prices of electricity delivered to industry ........................................................................................................ 67 5.1.1.2. Cijene električne energije isporučene kućanstvima Prices of electricity delivered to households .................................................................................................. 67 5.1.2. Cijene prirodnog plina distribuiranoga plinovodima prema Eurostatovim razredima s PDV-om Prices of natural gas distributed via pipelines, according to Eurostat classes, including VAT ...................................... 67 5.1.2.1. Cijene prirodnog plina distribuiranoga plinovodima industriji Prices of natural gas distributed via pipelines to industry ............................................................................... 67 5.1.2.2. Cijene prirodnog plina distribuiranoga plinovodima kućanstvima Prices of natural gas distributed via pipelines to households ......................................................................... 68
5.2. Cijene električne energije i prirodnog plina distribuiranoga plinovodima prema Eurostatovim razredima bez PDV-a Prices of electricity and natural gas distributed via pipelines in Republic of Croatia, according to Eurostat classes, excluding VAT ....................................................................................................................................................................... 68 5.2.1. Cijene električne energije prema Eurostatovim razredima bez PDV-a Prices of electricity, according to Eurostat classes, excluding VAT ............................................................................. 68 5.2.1.1. Cijene električne energije isporučene industriji Prices of electricity delivered to industry ........................................................................................................ 68 5.2.1.2. Cijene električne energije isporučene kućanstvima Prices of electricity delivered to households .................................................................................................. 68 5.2.2. Cijene prirodnog plina distribuiranoga plinovodima prema Eurostatovim razredima bez PDV-a Prices of natural gas distributed via pipelines, according to Eurostat classes, excluding VAT ..................................... 69 5.2.2.1. Cijene prirodnog plina distribuiranoga plinovodima industriji Prices of natural gas distributed via pipelines to industry ............................................................................... 69 5.2.2.2. Cijene prirodnog plina distribuiranoga plinovodima kućanstvima Prices of natural gas distributed via pipelines to households ......................................................................... 69 OBJAVLJENE PUBLIKACIJE IZ PODRUČJA STATISTIKE ENERGETIKE RELEASED PUBLICATIONS IN ENERGY STATISTICS ...................................................................................................................... 70
STATISTIČKA IZVJEŠĆA 1614/2018. STATISTICAL REPORTS 5
UVOD Statistička izvješća Državnog zavoda za statistiku publikacije su s detaljnim podacima iz različitih područja statističkih istraživanja, a svako sadržava cjelovit pregled podataka jednoga statističkog istraživanja ili nekoliko njih. Serija publikacija Statistička izvješća nastavak je serije Dokumentacije, koja se do 1965. objavljivala povremeno, i to kao Bilteni, Publikacije i Saopćenja. Od 1965. objavljuje se redovito, a od 1997. nosi sadašnje ime. Ovo Statističko izvješće sadržava detaljne podatke o proizvodnji, uvozu, izvozu, potrošnji i zalihama pojedinih vrsta energenata sastavljenih iz različitih izvora. U ovom Izvješću dan je i međunarodni pregled navedenih varijabli. Do 2002. parcijalni energetski podaci prikazivali su se zajedno s drugim podacima u statističkim publikacijama industrijske statistike i robne razmjene s inozemstvom. U ovom Izvješću objavljuje se detaljna statistička energetska bilanca Republike Hrvatske za 2016. i 2017. u naturalnom izrazu, statistička energetska bilanca Europske unije te statistička energetska bilanca po zemljama članicama Europske unije za 2015. i 2016. u uvjetnoj mjernoj jedinici (tisućama tona ekvivalentne nafte); finalna potrošnja energije u industriji po područjima i odjeljcima NKD-a 2007. za 2016. i 2017. u Republici Hrvatskoj u naturalnom izrazu. U ovom izvješću objavljuju se i polugodišnje cijene električne energije i prirodnog plina distribuiranoga plinovodima u Republici Hrvatskoj. Kod sumarnog prikaza podataka može doći do manjeg odstupanja zbog zaokruživanja. Svako Statističko izvješće sadržava uvod, metodološka objašnjenja i tablični pregled. Podaci o proizvodnji, uvozu, izvozu, potrošnji i zalihama energije objavljuju se i u Statističkom ljetopisu Republike Hrvatske.
INTRODUCTION Statistical reports issued by the Croatian Bureau of Statistics are publications with detailed data from various sections of statistical surveys. Every report contains a thorough data review of one or more statistical surveys. The series entitled the Statistical Reports is a continuation of the series under the heading Documentations, which was published periodically as Bulletins, Publications and Releases until 1965. Since 1965, it has been published regularly and, since 1997, it has been published under the present heading. This Statistical Report contains detailed data, collected from various sources, on production, import, export, consumption and stocks of certain types of energy sources. The Report also presents an international review of the above-mentioned variables. Until 2002, partial energy data were presented together with other data in statistical publications titled Industrial Statistics and Foreign Trade in Goods. This Report presents the following: a detailed statistical energy balance of the Republic of Croatia for 2016 and 2017 in natural terms; a statistical energy balance of the European Union and a statistical energy balance by EU Member States for 2015 and 2016 measured in million tonnes of oil equivalent; the final energy consumption in industry in the Republic of Croatia according to the NKD 2007. sections and divisions for 2016 and 2017 in natural terms. This report also presents half-year prices of electricity and natural gas transported by pipelines in the Republic of Croatia. Minor abberations may occur in the summary presentation due to the rounding. Every Statistical Report contains an introduction, the notes on methodology and a table review. The data on the production, import, export, consumption and stocks of energy are also published in the Statistical Yearbook of the Republic of Croatia.

6 STATISTIČKA IZVJEŠĆA 1614/2018. STATISTICAL REPORTS
KRATICE d. n. drugdje nespomenuto
EIHP Energetski institut "Hrvoje Požar"
EU-28 Europska unija (28 zemalja članica)
Eurostat Statistički ured Europske unije
GJ gigadžul
GWh gigavatsat
kJ kilodžul
kg kilogram
kWh kilovatsat
m3 kubični metar
mil. milijun
MWh megavatsat
NKD 2007. Nacionalna klasifikacija djelatnosti, verzija 2007.
PDV porez na dodanu vrijednost
t tona
tis. tisuća
TJ teradžul
UN Ujedinjeni narodi
CHP kombinirana proizvodnja toplinske i električne energije
DOM donja ogrjevna moć
ZNAKOVI - nema pojave
… ne raspolaže se podatkom
0 podatak je manji od 0,5 upotrijebljene mjerne jedinice
≥ veće ili jednako
ABBREVIATIONS CHP combined heat and power generation
EIHP Energy Institute “Hrvoje Požar“
EU European Union
Eurostat Statistical Office of the European Communities
GJ giga-joule
GWh gigawatt hour
kJ kilojoule
kWh kilowatt hour
LPG liquefied petroleum gas
m3 cubic metre
mln million
MWh megawatt hour
NCV net calorific value
NKD 2007. National Classification of Activities, 2007 version
n. e. c. not elsewhere classified
NGL natural gas liquefaction
t tonne
TJ tera-joule
toe tonne of oil equivalent
TWh terawatt hour
UN United Nations
VAT value added tax
’000 thousand SYMBOLS - no occurrence
… no data available
0 value not zero but less than 0.5 of the unit of measure used
≥ more or equal
STATISTIČKA IZVJEŠĆA 1614/2018. STATISTICAL REPORTS 7
METODOLOŠKA OBJAŠNJENJA Energetska bilanca (tablice 1.1. – 3.4.) Metodološka osnova za prikupljanje podataka za sastavljanje godišnje statističke energetske bilance Republike Hrvatske i drugih država u ovom izvješću jest Metodologija UN-a i Europske unije. Pojedine tablice za Republiku Hrvatsku sastavljale su se na temelju podataka dobivenih statističkim istraživanjima, istraživanjima Energetskog instituta "Hrvoje Požar" (EIHP), administrativnih izvora i procjena EIHP-a. Proizvodnja i potrošnja energije pokrivena je statističkim istraživanjima za sljedeća područja NKD-a 2007.: Poljoprivreda, šumarstvo i ribarstvo, Rudarstvo i vađenje, Prerađivačka industrija, Opskrba električnom energijom, plinom, parom i klimatizacija, Opskrba vodom; uklanjanje otpadnih voda, gospodarenje otpadom te djelatnosti sanacije okoliša (nisu uključeni odjeljci 37, 38 i 39), Građevinarstvo te Prijevoz i skladištenje. Za ostala područja NKD-a 2007. i kućanstva podaci o energiji ne prikupljaju se statističkim istraživanjima. Njih EIHP izračunava na temelju vlastitih istraživanja i administrativnih izvora. Grupiranje podataka pri izradi Statističke energetske bilance nije izvršeno prema hijerarhiji NKD-a 2007., nego prema zahtjevima energetske bilance jer i europska i svjetska statistička praksa poštuju spomenuti način publiciranja energetskih pokazatelja. Naime, proizvodnja, uvoz, izvoz i promjene zaliha prikazuju se po energentima, a potrošnja po energentima i sektorima potrošnje onako kako su definirane metodologijom energetske bilance. Podaci objavljeni za 2016. konačni su, a za 2017. privremeni. Podaci energetske bilance Europske unije, Republike Hrvatske i država članica Europske unije preuzeti su iz publikacija Europske unije. Finalna potrošnja energije u Republici Hrvatskoj (tablice 4.1. – 4.2.) Podaci iskazani u tablicama 4.1. i 4.2. Finalna potrošnja energije u industriji po područjima, potpodručjima i odjeljcima NKD-a 2007. u Republici Hrvatskoj prikupljeni su Godišnjim istraživanjem o utrošku sirovina, materijala i energenata industrije (IND-21/REPRO). U tom istraživanju nalazi se tablica sa zadanim popisom energenata, a izvještajne jedinice dužne su količinski odgovoriti prema tom popisu u zadanoj mjernoj jedinici koliko su nabavili energije od drugih, koliko su potrošili energije i koliko je stanje zaliha. Svi spomenuti podaci iskazani su na godišnjoj razini. Podaci objavljeni za 2016. konačni su, a za 2017. privremeni. Izvještajne jedinice jesu industrijske lokalne jedinice. Izvještaj IND-21/REPRO sastavlja se na razini županije za sve industrijske lokalne jedinice industrijskih i neindustrijskih poduzeća s 10 i više zaposlenih. Cijene električne energije i prirodnog plina (tablice 5.1. – 5.2.) U ovom Izvješću prikazane su šestomjesečne prosječne cijene distribuirane električne energije i prirodnog plina distribuiranoga plinovodima prema propisanim razredima, koji su definirani metodologijom Europske komisije. Prosječne cijene električne energije dobivaju se tako da se fakturirani iznos za potrošenu električnu energiju u kunama podijeli s potrošenom električnom energijom u kWh za motreno razdoblje. Na sličan način izračunavaju se i prosječne cijene prirodnog plina, fakturirani iznos za potrošeni prirodni plin distribuiran mrežom u kunama podijeli se s potrošenim prirodnim plinom u GJ za promatrano razdoblje.
NOTES ON METHODOLOGY Energy balance (tables 1.1. – 3.4.) The methodological basis for the collection of data needed for the creation of the annual statistical energy balance of the Republic of Croatia and other countries in the Report are the UN and EU methodologies. The compilation of tables relating to the Republic of Croatia was done on the basis of the data obtained through statistical surveys, surveys conducted by the Energy Institute “Hrvoje Požar” (EIHP), administrative sources and EIHP’s estimates. The production and consumption of energy are covered by statistical surveys for the following NKD 2007. sections: Agriculture, forestry and fishing, Mining and quarrying, Manufacturing, Electricity, gas, steam and air conditioning supply, Water supply: sewerage, waste management and remediation activities (excluding divisions 37, 38 and 39), Construction and Transportation and storage. Energy data for other NKD 2007. sections and for households are not collected through statistical surveys. The EIHP calculates them on the basis of its own surveys and administrative sources. The data used in the making of the Statistical Energy Balance were grouped not according to the NKD 2007. hierarchy but rather according to the demands of the energy balance, because the practice in both European and world statistics is to use the same method of publishing of energy indicators. The production, import, export and stock changes are presented by energy sources, and consumption by energy sources and consumption sectors as defined in the energy balance methodology. The data for 2016 are final, while those for 2017 are provisional. The data on the energy balance of the European Union, the Republic of Croatia and the EU Member States were taken over from the publications of the European Union. Final energy consumption in the Republic of Croatia (tables 4.1. – 4.2.) The data presented in tables 4.1. and 4.2. Final Energy Consumption in Industry in the Republic of Croatia, according to the NKD 2007. sections, subsections and divisions were collected through the Annual Report on the Consumption of Raw Materials, Consumables and Energy Sources (IND-21/REPRO form). This survey contains a table with a given list of energy sources and reporting units are obliged to provide quantity figures for the following listed energy sources in a given unit of measure on the quantity of energy obtained from others, quantity of energy consumed and the level of stocks. All these data were given at the annual level. Data published for 2016 are final, while those for 2017 are provisional. Reporting units are industrial local units. The IND-21/REPRO report is drawn up at the county level for all industrial local units of industrial and non-industrial enterprises employing 10 and more persons. Prices of electrical energy and natural gas (tables 5.1. – 5.2.) This Report presents average half-year prices of electrical energy and natural gas distributed via pipelines by prescribed classes as defined in the methodology of the European Commission. Average prices of electrical energy are calculated in a way that the invoiced amount for consumed electrical energy expressed in kuna is divided by consumed electrical energy measured in kWh in the observed period. The calculation of average prices of natural gas is done in the similar way, that is, the invoiced amount for consumed natural gas distributed in the network is divided by consumed natural gas expressed in GJ in the observed period.
8 STATISTIČKA IZVJEŠĆA 1614/2018. STATISTICAL REPORTS
U obračun cijena prirodnog plina nisu uključeni veliki potrošači: proizvođači električne energije u elektranama ili u kogeneraciji električne energije i topline ni veliki neenergetski potrošači (npr. u kemijskoj industriji). Prikazane su dvije vrste cijena:
- cijene koje uključuju PDV - cijene koje ne uključuju PDV.
Također je iskazana podjela cijena prema vrsti krajnjih potrošača: kućanstva i industrija (svi potrošači osim kućanstava). Prema istoj metodologiji, na internetskim stranicama Eurostata mogu se pronaći cijene električne energije i prirodnog plina distribuiranoga plinovodima za Republiku Hrvatsku i države članice Europske unije. Cijene su iskazane u eurima i nacionalnim valutama. Sirova nafta u ovom Izvješću iskazana je u sljedećim količinama: a) sirova nafta u užem smislu, odnosno sva mineralna ulja prirodnog podrijetla koja sadržavaju mješavinu ugljikovodika u tekućem stanju pod normalnim uvjetima i dodatne nečistoće, npr. sumpor; ta kategorija obuhvaća i kondenzat koji se dobiva pri vađenju zemnog plina, b) prirodni tekući plinovi, a to su ukapljeni ugljikovodici dobiveni iz prirodnog plina u separacijskim postrojenjima; najčešće je riječ o etanu, propanu, butanu i pentanu, a rjeđe o kondenzatu iz postrojenja ili običnom benzinu, c) proizvedene sirovine u rafineriji, a riječ je o prerađenoj sirovoj nafti namijenjenoj daljnjoj preradi u rafinerijama (dvostrukost u iskazivanju količina isključena je na razini države) ili o povratima petrokemijske industrije rafinerijama, d) aditivi i oksidansi, spojevi koji nisu ugljikovodici, a dodaju se rafinerijskim proizvodima kako bi im se promijenila svojstva i e) ostali ugljkovodici koji uključuju naftu dobivenu iz bitumenoznih ili naftnih škriljevaca i bitumenoznog pijeska, tekućine iz likvifikacije ugljena itd. Plin je iskazan kao prirodni plin bez spomenutoga prirodnoga tekućeg plina i industrijski proizvedena plina pri iskazivanju proizvodnje plina. Rafinerijski proizvodi jesu svi proizvodi koji su proizvedeni u naftnim rafinerijama, a to su: rafinerijski plin, ukapljeni plin, motorni benzini, petrolej, mlazno gorivo, dizelsko gorivo, ekstralako loživo ulje, loživo ulje, primarni benzin, white spirit, maziva ulja, bitumen, parafin, naftni koks i ostali proizvodi rafinerija. Bunker brodova jest gorivo isporučeno brodovima svih zastava uključujući ratne, osim isporuka brodovima koji plove u unutarnjim i priobalnim vodama. Saldo skladišta jesu promjene stanja zaliha na početku i na kraju godine u nekoj državi kod proizvođača, uvoznika i poduzeća koja obavljaju transformaciju energije. Razlika se dobije tako što se od stanja zaliha na kraju posljednjeg dana u godini oduzme stanje zaliha na početku prvoga radnog dana u toj godini. Statističke razlike jesu razlike između računskih i utvrđenih ukupnih domaćih isporuka, a razlike mogu nastati i zbog primjene različitih koeficijenata za preračunavanje u uvjetne mjerne jedinice. Degazolinaža je procesno postrojenje u kojem se iz smjese prirodnog plina izdvajaju pojedini plinoviti i tekući ugljikovodici (metan, etan, propan, butan, pentan, primarni benzin). Tona ekvivalentne nafte jest standardizirana jedinica definirana kao tona nafte s donjom ogrjevnom moći od 41 868 kJ/kg. Neto proizvodnja električne energije jest električna energija isporučena elektromreži iz elektrane. To je razlika između proizvedene električne energije na generatoru i vlastite potrošnje.
The calculation of the prices of natural gas excludes large producers: producers of electrical energy in power plants or in cogeneration plants as well as large non-energy consumers (e.g. in chemical industry). Two types of prices are presented:
- Prices including VAT - Prices excluding VAT.
Moreover, the Report presents the breakdown of prices by types of end users: households and industry (all users except households). According to the same methodology, the data on prices of electrical energy and natural gas distributed via pipelines for the Republic of Croatia and EU Member States are available on the Eurostat web site. The prices are expressed in euros and national currencies. Crude oil presented in this Report comprises the following quantities: a) crude oil in a narrow sense, that is, all mineral oils of natural origin containing a mixture of hydrocarbons in a liquid state under normal conditions and additional impurities, such as sulphur; this category also includes a condensate obtained through the natural gas extraction, b) natural gas liquids, that is, liquefied hydrocarbons obtained from natural gas in separators; natural gas liquids, which most often include ethane, propane, butane and pentane, and less often condensate from separators and natural gasoline; c) refinery feedstocks, that is, refined crude oil destined for further processing in refineries (duplication in expressing quantities is excluded at a country level) or products returned from the petrochemical industry to the refining industry to refineries; d) additives and oxidants, non-hydrocarbon substances added to refinery products to modify their properties and e) other hydrocarbons that include oil obtained from bituminous or oil slate and bituminous sand, liquids from coal liquefaction, etc. Gas is expressed as natural gas excluding the above-mentioned natural liquid gas and industrially produced gas in presenting gas production. Refinery products are all products produced in petroleum refineries: refinery gas, liquefied petroleum gas, motor gasoline, kerosene, jet fuel, diesel oil, light fuel oil, fuel oil, naphtha, white spirit, lubricating oils, bitumen, paraffin waxes, petroleum coke and other refinery products. International marine bunkers cover those quantities delivered to sea-going ships of all flags, including warships. Deliveries to ships engaged in the transport in inland and coastal waters are not included. Stock changes are changes in stock levels held by producers, importers and energy transformation enterprises at the beginning and the end of a year. The difference is obtained by subtracting the stock level at the beginning of the first working day in a year from the stock level at the end of the last day of the same year. Statistical differences are differences between calculated and identified total domestic deliveries. The differences may arise due to the use of different coefficients of conversion into equivalent measurement units. NGL plant is a processing plant where individual gaseous and liquefied hydrocarbons (methane, ethane, propane, butane, pentane, naphtha) are separated from the mixture of natural gas. Tonne of oil equivalent is a conventional standardised unit defined on the basis of a tonne of oil with a net calorific value of 41 868 kJ/kg. Net electricity production is the electrical energy supplied from a power station to a power-supply grid and it represents the difference between the electrical energy produced in a generator and own supply.

1. STATISTIČKA ENERGETSKA BILANCA REPUBLIKE HRVATSKE I OBNOVLJIVI IZVORI ENERGIJE
STATISTICAL ENERGY BALANCE OF REPUBLIC OF CROATIA AND RENEWABLE ENERGY SOURCES


STATISTIČKA IZVJEŠĆA 1614/2018. STATISTICAL REPORTS 11
1.1. STATISTIČKA ENERGETSKA BILANCA REPUBLIKE HRVATSKE ZA 2016. STATISTICAL ENERGY BALANCE OF REPUBLIC OF CROATIA, 2016
Opis Ugljen i koks
Coal and coke Sirova nafta
Crude oil
Rafinerijskiproizvodi Refinery products
Motorni benzinMotor gasoline
Dizelsko gorivoDiesel oil
Ekstralako loživo ulje
Light fuel oil Description
tis. t/ ‘000 t Ukupna proizvodnja _ 743 3 755 864 1 257 177 Total production Rafinerije _ _ 3 715 864 1 257 177 Refineries Degazolinaža _ _ 40 _ _ _ NGL plant Hidroelektrane _ _ _ _ _ _ Hydro power plants Termoelektrane _ _ _ _ _ _ Thermal power plants Javne toplane _ _ _ _ _ _ Public cogeneration plants Industrijske toplane _ _ _ _ _ _ Industrial cogeneration plants Javne kotlovnice _ _ _ _ _ _ Public heating plants Industrijske kotlovnice _ _ _ _ _ _ Industrial heating plants Vjetroelektrane _ _ _ _ _ _ Wind power plants Uvoz 1 119 2 994 1 680 194 947 61 Import Izvoz _ _ 2 076 517 608 67 Export Saldo skladišta -20 -3 -81 -7 3 -6 Stock change Ukupna potrošnja 1 099 3 805 3 278 534 1 599 165 Total consumption Prerada u degazolinaži _ 40 _ _ _ _ NGL plant input Prerada u rafinerijama _ 3 765 _ _ _ _ Refinery intake Gubici u rafinerijama _ 50 _ _ _ _ Refinery losses Proizvodnja rafinerija _ 3 715 _ _ _ _ Refinery output Ukapljeni plin _ 208 _ _ _ _ LPG Motorni benzin _ 864 _ _ _ _ Motor gasoline Petrolej i mlazno gorivo _ 116 _ _ _ _ Kerosene type jet fuel Dizelsko gorivo _ 1 434 _ _ _ _ Diesel oil Ekstralako loživo ulje _ 5 _ _ _ _ Light fuel oil Loživo ulje _ 596 _ _ _ _ Fuel oil Primarni benzin _ 64 _ _ _ _ Naphtha Bitumen _ 1 _ _ _ _ Bitumen Rafinerijski plin _ 155 _ _ _ _ Refinery gas Ostali derivati _ 272 _ _ _ _ Other products Gubici prijenosa i distribucije _ _ _ _ _ _ Transmission and distribution
losses Gubici prijenosa _ _ _ _ _ _ Transmission losses Gubici distribucije _ _ _ _ _ _ Distribution losses Bunker brodova _ _ 5 _ 3 _ International marine bunkers Ukupno raspoloživo 1 099 _ 3 273 534 1 596 165 Total available Potrošnja za pogon _ _ _ _ _ _ Energy sector own use Proizvodnja nafte i plina _ _ _ _ _ _ Oil and gas extraction Elektroprivreda _ _ _ _ _ _ Electric energy supply industry Rafinerije _ _ _ _ _ _ Petroleum refineries Degazolinaža _ _ _ _ _ _ NGL plant

12 STATISTIČKA IZVJEŠĆA 1614/2018. STATISTICAL REPORTS
1.1. STATISTIČKA ENERGETSKA BILANCA REPUBLIKE HRVATSKE ZA 2016. STATISTICAL ENERGY BALANCE OF REPUBLIC OF CROATIA, 2016 (nastavak) (continued)
Opis Ugljen i koks
Coal and coke Sirova nafta
Crude oil
Rafinerijskiproizvodi Refinery products
Motorni benzinMotor gasoline
Dizelsko gorivoDiesel oil
Ekstralako loživo ulje
Light fuel oil Description
tis. t/ ‘000 t Energetske transformacije 983 _ 9 _ - 5 Total transformation sector Termoelektrane 974 _ 1 _ - 1 Thermal power plants Javne toplane _ _ _ _ _ _ Public cogeneration plants Javne kotlovnice _ _ 8 _ - 4 Public heating plants Industrijske toplane 9 _ _ _ _ _ Industrial cogeneration plants Industrijske kotlovnice _ _ _ _ _ _ Industrial heating plants Degazolinaža _ _ _ _ _ _ NGL plant Gradske plinare _ _ _ _ _ _ City gasworks Ostalo _ _ _ _ _ _ Other Neenergetska potrošnja _ _ 170 _ _ _ Non-energy use Gubici _ _ _ _ _ _ Losses Neto potrošnja 116 _ 3 094 534 1 596 160 Total consumption Potrošnja energetike _ _ 155 _ _ _ Total energy sector Proizvodnja nafte i plina _ _ 153 _ _ _ Oil and gas extraction Elektroprivreda _ _ _ _ _ _ Electric energy supply industry Hidroelektrane _ _ _ _ _ _ Hydro power plants Termoelektrane _ _ _ _ _ _ Thermal power plants Javne toplane _ _ 1 _ _ _ Public cogeneration plants Rafinerije _ _ _ _ _ _ Petroleum refineries Degazolinaža _ _ _ _ _ _ NGL plant Ostalo _ _ 1 _ _ _ Other Neposredna potrošnja 116 _ 2 939 534 1 596 160 Final demand Industrija 109 _ 470 4 87 20 Industry Željeza i čelika _ _ - _ _ _ Iron and steel Obojenih metala _ _ 2 _ - 1 Non-ferrous metals Građevnog materijala i nemetala
73 _ 386 4 87 7 Construction materials
Kemijska _ _ 17 _ _ _ Chemical Papira _ _ 7 _ - 1 Pulp and paper Prehrambena 36 _ 21 _ - 7 Food production Ostala _ _ 37 _ - 4 Not elsewhere specified Promet _ _ 2 082 523 1 339 _ Transport Željeznički _ _ 19 _ 18 _ Rail Cestovni _ _ 1 891 523 1 279 _ Road Zračni _ _ 129 _ _ _ Air Pomorski i riječni _ _ 43 _ 42 _ Sea and river Javni gradski _ _ _ _ _ _ Public city Ostali _ _ _ _ _ _ Not elsewhere specified Opća potrošnja 7 _ 387 7 170 140 Other sectors Kućanstva 7 _ 135 _ - 84 Households Usluge _ _ 59 _ - 44 Services Poljoprivreda _ _ 193 7 170 12 Agriculture Graditeljstvo _ _ _ _ _ _ Construction

STATISTIČKA IZVJEŠĆA 1614/2018. STATISTICAL REPORTS 13
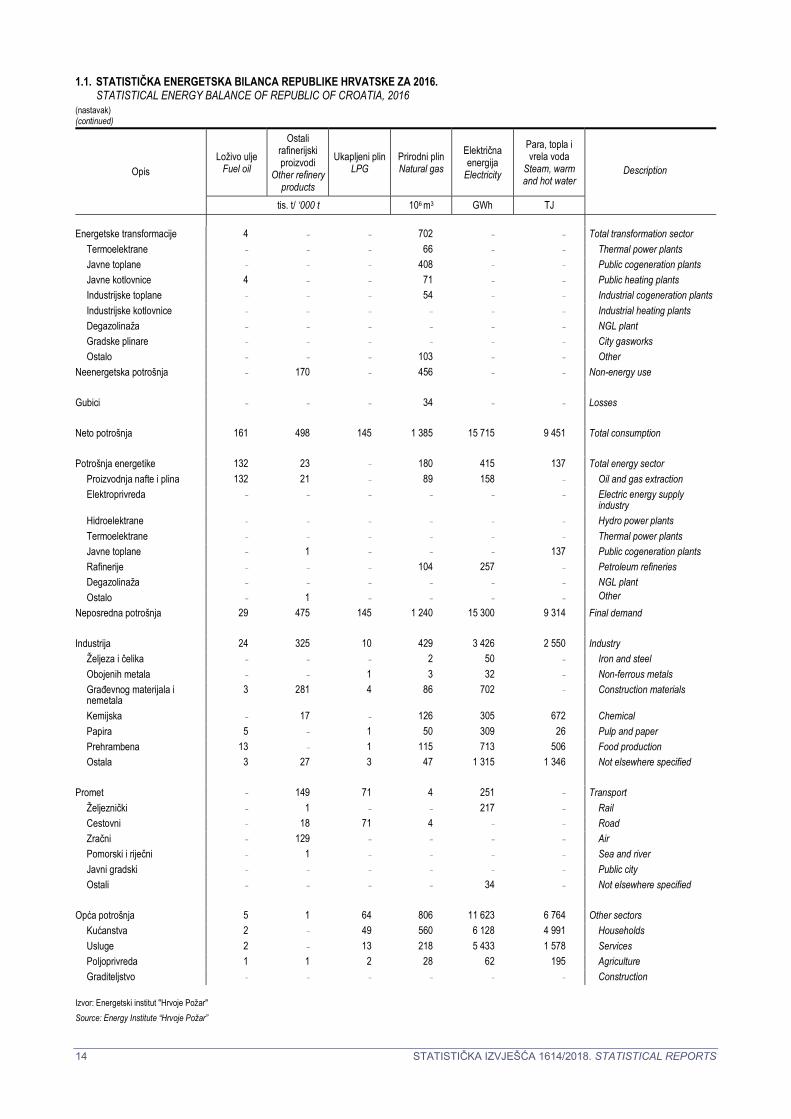
1.1. STATISTIČKA ENERGETSKA BILANCA REPUBLIKE HRVATSKE ZA 2016. STATISTICAL ENERGY BALANCE OF REPUBLIC OF CROATIA, 2016 (nastavak) (continued)
Opis Loživo ulje
Fuel oil
Ostali rafinerijski proizvodi
Other refinery products
Ukapljeni plin LPG
Prirodni plin Natural gas
Električna energija
Electricity
Para, topla i vrela voda
Steam, warm and hot water
Description
tis. t/ ‘000 t 106 m3 GWh TJ Ukupna proizvodnja 601 608 248 1 647 12 2841) 10 938 Total production Rafinerije 601 608 208 _ _ _ Refineries Degazolinaža _ _ 40 _ _ _ NGL plant Hidroelektrane _ _ _ _ 6 967 _ Hydro power plants Termoelektrane _ _ _ _ 2 651 _ Thermal power plants Javne toplane _ _ _ _ 1 276 8 718 Public cogeneration plants Industrijske toplane _ _ _ _ 314 - Industrial cogeneration plants Javne kotlovnice _ _ _ _ _ 2 220 Public heating plants Industrijske kotlovnice _ _ _ _ _ - Industrial heating plants Vjetroelektrane _ _ _ _ 1 010 _ Wind power plants Ostali izvori _ _ _ _ 66 _ Other sources Uvoz 46 378 54 1 265 12 398 _ Import Izvoz 451 278 155 389 6 867 _ Export Saldo skladišta -29 -40 -2 89 _ _ Stock change Ukupna potrošnja 167 668 145 2 612 17 815 10 938 Total consumption Prerada u degazolinaži _ _ _ _ _ _ NGL plant input Prerada u rafinerijama _ _ _ _ _ _ Refinery intake Gubici u rafinerijama _ _ _ _ _ _ Refinery losses Proizvodnja rafinerija _ _ _ _ _ _ Refinery output Ukapljeni plin _ _ _ _ _ _ LPG Motorni benzin _ _ _ _ _ _ Motor gasoline Petrolej i mlazno gorivo _ _ _ _ _ _ Kerosene type jet fuel Dizelsko gorivo _ _ _ _ _ _ Diesel oil Ekstralako loživo ulje _ _ _ _ _ _ Light fuel oil Loživo ulje _ _ _ _ _ _ Fuel oil Primarni benzin _ _ _ _ _ _ Naphtha Bitumen _ _ _ _ _ _ Bitumen Rafinerijski plin _ _ _ _ _ _ Refinery gas Ostali derivati _ _ _ _ _ _ Other products Gubici prijenosa i distribucije _ _ _ _ 2 100 1 487 Transmission and distribution
losses Gubici prijenosa _ _ _ _ 630 _ Transmission losses Gubici distribucije _ _ _ _ 1 470 1 487 Distribution losses Bunker brodova 2 _ _ _ _ _ International marine bunkers Ukupno raspoloživo 165 668 145 2 612 15 715 9 451 Total available Potrošnja za pogon _ _ _ _ _ _ Energy sector own use Proizvodnja nafte i plina _ _ _ _ _ _ Oil and gas extraction Elektroprivreda _ _ _ _ _ _ Electric energy supply industry Rafinerije _ _ _ _ _ _ Petroleum refineries Degazolinaža _ _ _ _ _ _ NGL plant Postrojenja za proizvodnju bioplina
_ _ _ _ _ _ Biogas production plants
1) Neto proizvodnja električne energije
1) Net electricity production
14 STATISTIČKA IZVJEŠĆA 1614/2018. STATISTICAL REPORTS
1.1. STATISTIČKA ENERGETSKA BILANCA REPUBLIKE HRVATSKE ZA 2016. STATISTICAL ENERGY BALANCE OF REPUBLIC OF CROATIA, 2016 (nastavak) (continued)
Opis Loživo ulje
Fuel oil
Ostali rafinerijski proizvodi
Other refinery products
Ukapljeni plinLPG
Prirodni plin Natural gas
Električna energija
Electricity
Para, topla i vrela voda
Steam, warm and hot water
Description
tis. t/ ‘000 t 106 m3 GWh TJ
Energetske transformacije 4 _ _ 702 _ _ Total transformation sector Termoelektrane _ _ _ 66 _ _ Thermal power plants Javne toplane _ _ _ 408 _ _ Public cogeneration plants Javne kotlovnice 4 _ _ 71 _ _ Public heating plants Industrijske toplane _ _ _ 54 _ _ Industrial cogeneration plants Industrijske kotlovnice _ _ _ _ _ _ Industrial heating plants Degazolinaža _ _ _ _ _ _ NGL plant Gradske plinare _ _ _ _ _ _ City gasworks Ostalo _ _ _ 103 _ _ Other Neenergetska potrošnja _ 170 _ 456 _ _ Non-energy use Gubici _ _ _ 34 _ _ Losses Neto potrošnja 161 498 145 1 385 15 715 9 451 Total consumption Potrošnja energetike 132 23 _ 180 415 137 Total energy sector Proizvodnja nafte i plina 132 21 _ 89 158 _ Oil and gas extraction Elektroprivreda _ _ _ _ _ _ Electric energy supply
industry Hidroelektrane _ _ _ _ _ _ Hydro power plants Termoelektrane _ _ _ _ _ _ Thermal power plants Javne toplane _ 1 _ _ _ 137 Public cogeneration plants Rafinerije _ _ _ 104 257 _ Petroleum refineries Degazolinaža _ _ _ _ _ _ NGL plant Ostalo _ 1 _ _ _ _ Other Neposredna potrošnja 29 475 145 1 240 15 300 9 314 Final demand Industrija 24 325 10 429 3 426 2 550 Industry Željeza i čelika _ _ _ 2 50 _ Iron and steel Obojenih metala _ _ 1 3 32 _ Non-ferrous metals Građevnog materijala i nemetala
3 281 4 86 702 _ Construction materials
Kemijska _ 17 _ 126 305 672 Chemical Papira 5 _ 1 50 309 26 Pulp and paper Prehrambena 13 _ 1 115 713 506 Food production Ostala 3 27 3 47 1 315 1 346 Not elsewhere specified Promet _ 149 71 4 251 _ Transport Željeznički _ 1 _ _ 217 _ Rail Cestovni _ 18 71 4 _ _ Road Zračni _ 129 _ _ _ _ Air Pomorski i riječni _ 1 _ _ _ _ Sea and river Javni gradski _ _ _ _ _ _ Public city Ostali _ _ _ _ 34 _ Not elsewhere specified Opća potrošnja 5 1 64 806 11 623 6 764 Other sectors Kućanstva 2 _ 49 560 6 128 4 991 Households Usluge 2 _ 13 218 5 433 1 578 Services Poljoprivreda 1 1 2 28 62 195 Agriculture Graditeljstvo _ _ _ _ _ _ Construction Izvor: Energetski institut "Hrvoje Požar"
Source: Energy Institute “Hrvoje Požar”

STATISTIČKA IZVJEŠĆA 1614/2018. STATISTICAL REPORTS 15
1.2. STATISTIČKA ENERGETSKA BILANCA REPUBLIKE HRVATSKE ZA 2017. STATISTICAL ENERGY BALANCE OF REPUBLIC OF CROATIA, 2017
Opis Ugljen i koks
Coal and coke Sirova nafta
Crude oil
Rafinerijskiproizvodi Refinery products
Motorni benzinMotor gasoline
Dizelsko gorivoDiesel oil
Ekstralako loživo ulje
Light fuel oil Description
tis. t/ ‘000 t Ukupna proizvodnja _ 753 3 924 1 005 1 332 160 Total production Rafinerije _ _ 3 882 1 005 1 332 160 Refineries Degazolinaža _ _ 42 _ _ _ NGL plant Hidroelektrane _ _ _ _ _ _ Hydro power plants Termoelektrane _ _ _ _ _ _ Thermal power plants Javne toplane _ _ _ _ _ _ Public cogeneration plants Industrijske toplane _ _ _ _ _ _ Industrial cogeneration plants Javne kotlovnice _ _ _ _ _ _ Public heating plants Industrijske kotlovnice _ _ _ _ _ _ Industrial heating plants Vjetroelektrane _ _ _ _ _ _ Wind power plants Uvoz 671 3 167 2 028 160 1 372 42 Import Izvoz 1 _ 2 484 643 900 39 Export Saldo skladišta -5 1 27 -9 -35 2 Stock change Ukupna potrošnja 665 3 905 3 495 513 1 768 165 Total consumption Prerada u degazolinaži _ 42 _ _ _ _ NGL plant input Prerada u rafinerijama _ 3 947 _ _ _ _ Refinery intake Gubici u rafinerijama _ 65 _ _ _ _ Refinery losses Proizvodnja rafinerija _ 3 882 _ _ _ _ Refinery output Ukapljeni plin _ 241 _ _ _ _ LPG Motorni benzin _ 1 005 _ _ _ _ Motor gasoline Petrolej i mlazno gorivo _ 131 _ _ _ _ Kerosene type jet fuel Dizelsko gorivo _ 1 332 _ _ _ _ Diesel oil Ekstralako loživo ulje _ 160 _ _ _ _ Light fuel oil Loživo ulje _ 576 _ _ _ _ Fuel oil Primarni benzin _ 52 _ _ _ _ Naphtha Bitumen _ - _ _ _ _ Bitumen Rafinerijski plin _ 185 _ _ _ _ Refinery gas Ostali derivati _ 200 _ _ _ _ Other products Gubici prijenosa i distribucije _ _ _ _ _ _ Transmission and distribution
losses Gubici prijenosa _ _ _ _ _ _ Transmission losses Gubici distribucije _ _ _ _ _ _ Distribution losses Bunker brodova _ _ 7 _ 4 _ International marine bunkers Ukupno raspoloživo 665 - 3 488 513 1 764 165 Total available Potrošnja za pogon _ _ _ _ _ _ Energy sector own use Proizvodnja nafte i plina _ _ _ _ _ _ Oil and gas extraction Elektroprivreda _ _ _ _ _ _ Electric energy supply industry Rafinerije _ _ _ _ _ _ Petroleum refineries Degazolinaža _ _ _ _ _ _ NGL plant

16 STATISTIČKA IZVJEŠĆA 1614/2018. STATISTICAL REPORTS
1.2. STATISTIČKA ENERGETSKA BILANCA REPUBLIKE HRVATSKE ZA 2017. STATISTICAL ENERGY BALANCE OF REPUBLIC OF CROATIA, 2017 (nastavak) (continued)
Opis Ugljen i koks
Coal and coke Sirova nafta
Crude oil
Rafinerijskiproizvodi Refinery products
Motorni benzinMotor gasoline
Dizelsko gorivoDiesel oil
Ekstralako loživo ulje
Light fuel oil Description
tis. t/ ‘000 t Energetske transformacije 535 _ 43 _ - 6 Total transformation sector Termoelektrane 527 _ 1 _ - 1 Thermal power plants Javne toplane _ _ 35 _ _ 1 Public cogeneration plants Javne kotlovnice _ _ 7 _ - 4 Public heating plants Industrijske toplane 8 _ _ _ _ _ Industrial cogeneration plants Industrijske kotlovnice _ _ _ _ _ _ Industrial heating plants Degazolinaža _ _ _ _ _ _ NGL plant Gradske plinare _ _ _ _ _ _ City gasworks Ostalo _ _ _ _ _ _ Other Neenergetska potrošnja _ _ 155 _ _ _ Non-energy use Gubici _ _ _ _ _ _ Losses Neto potrošnja 130 _ 3 291 513 1 764 159 Total consumption Potrošnja energetike _ _ 183 _ _ _ Total energy sector Proizvodnja nafte i plina _ _ 181 _ _ _ Oil and gas extraction Elektroprivreda _ _ _ _ _ _ Electric energy supply industry Hidroelektrane _ _ _ _ _ _ Hydro power plants Termoelektrane _ _ _ _ _ _ Thermal power plants Javne toplane _ _ 1 _ _ _ Public cogeneration plants Rafinerije _ _ _ _ _ _ Petroleum refineries Degazolinaža _ _ _ _ _ _ NGL plant Ostalo _ _ 1 _ _ _ Other Neposredna potrošnja 130 - 3 107 513 1 764 159 Final demand Industrija 121 _ 474 4 88 21 Industry Željeza i čelika _ _ - _ _ _ Iron and steel Obojenih metala _ _ 1 _ - _ Non-ferrous metals Građevnog materijala i nemetala
86 _ 406 4 88 8 Construction materials
Kemijska _ _ 13 _ _ _ Chemical Papira _ _ 4 _ - 1 Pulp and paper Prehrambena 34 _ 17 _ - 7 Food production Ostala _ _ 33 _ - 5 Not elsewhere specified Promet _ _ 2 252 502 1 507 _ Transport Željeznički _ _ 18 _ 18 _ Rail Cestovni _ _ 2 037 502 1 445 _ Road Zračni _ _ 152 _ _ _ Air Pomorski i riječni _ _ 45 _ 44 _ Sea and river Javni gradski _ _ _ _ _ _ Public city Ostali _ _ _ _ _ _ Not elsewhere specified Opća potrošnja 9 _ 381 7 170 138 Other sectors Kućanstva 9 _ 131 - - 83 Households Usluge _ _ 56 - - 44 Services Poljoprivreda _ _ 194 7 170 11 Agriculture Graditeljstvo _ _ _ _ _ _ Construction

STATISTIČKA IZVJEŠĆA 1614/2018. STATISTICAL REPORTS 17
1.2. STATISTIČKA ENERGETSKA BILANCA REPUBLIKE HRVATSKE ZA 2017. STATISTICAL ENERGY BALANCE OF REPUBLIC OF CROATIA, 2017 (nastavak) (continued)
Opis Loživo ulje
Fuel oil
Ostali rafinerijski proizvodi
Other refinery products
Ukapljeni plin LPG
Prirodni plin Natural gas
Električna energija
Electricity
Para, topla i vrela voda
Steam, warm and hot water
Description
tis. t/ ‘000 t 106 m3 GWh TJ Ukupna proizvodnja 577 567 283 1 484 11 5231) 11 307 Total production Rafinerije 577 567 241 _ _ _ Refineries Degazolinaža _ _ 42 _ _ _ NGL plant Hidroelektrane _ _ _ _ 5 438 _ Hydro power plants Termoelektrane _ _ _ _ 1 264 _ Thermal power plants Javne toplane _ _ _ _ 3 151 9 624 Public cogeneration plants Industrijske toplane _ _ _ _ 394 _ Industrial cogeneration plants Javne kotlovnice _ _ _ _ _ 1 683 Public heating plants Industrijske kotlovnice _ _ _ _ _ _ Industrial heating plants Vjetroelektrane _ _ _ _ 1 198 _ Wind power plants Ostali izvori _ _ _ _ 79 _ Other sources Uvoz 48 359 47 1 818 12 158 _ Import Izvoz 520 194 188 200 5 204 - Export Saldo skladišta 69 -1 1 -94 - - Stock change Ukupna potrošnja 174 732 143 3 008 18 477 11 307 Total consumption Prerada u degazolinaži _ _ _ _ _ _ NGL plant input Prerada u rafinerijama _ _ _ _ _ _ Refinery intake Gubici u rafinerijama _ _ _ _ _ _ Refinery losses Proizvodnja rafinerija _ _ _ _ _ _ Refinery output Ukapljeni plin _ _ _ _ _ _ LPG Motorni benzin _ _ _ _ _ _ Motor gasoline Petrolej i mlazno gorivo _ _ _ _ _ _ Kerosene type jet fuel Dizelsko gorivo _ _ _ _ _ _ Diesel oil Ekstralako loživo ulje _ _ _ _ _ _ Light fuel oil Loživo ulje _ _ _ _ _ _ Fuel oil Primarni benzin _ _ _ _ _ _ Naphtha Bitumen _ _ _ _ _ _ Bitumen Rafinerijski plin _ _ _ _ _ _ Refinery gas Ostali derivati _ _ _ _ _ _ Other products Gubici prijenosa i distribucije _ _ _ _ 2 052 1 534 Transmission and distribution
losses Gubici prijenosa _ _ _ _ 616 _ Transmission losses Gubici distribucije _ _ _ _ 1 436 1 534 Distribution losses Bunker brodova 3 _ _ _ _ _ International marine bunkers Ukupno raspoloživo 171 732 143 3 008 16 425 9 774 Total available Potrošnja za pogon _ _ _ _ _ _ Energy sector own use Proizvodnja nafte i plina _ _ _ _ _ _ Oil and gas extraction Elektroprivreda _ _ _ _ _ _ Electric energy supply industry Rafinerije _ _ _ _ _ _ Petroleum refineries Degazolinaža _ _ _ _ _ _ NGL plant Postrojenja za proizvodnju bioplina
_ _ _ _ _ _ Biogas production plants
1) Neto proizvodnja električne energije
1) Net electricity production

18 STATISTIČKA IZVJEŠĆA 1614/2018. STATISTICAL REPORTS
1.2. STATISTIČKA ENERGETSKA BILANCA REPUBLIKE HRVATSKE ZA 2017. STATISTICAL ENERGY BALANCE OF REPUBLIC OF CROATIA, 2017 (nastavak) (continued)
Opis Loživo ulje
Fuel oil
Ostali rafinerijski proizvodi
Other refinery products
Ukapljeni plinLPG
Prirodni plin Natural gas
Električna energija
Electricity
Para, topla i vrela voda
Steam, warm and hot water
Description
tis. t/ ‘000 t 106 m3 GWh TJ
Energetske transformacije 37 _ _ 977 _ _ Total transformation sector Termoelektrane _ _ _ 5 _ _ Thermal power plants Javne toplane 34 _ _ 743 _ _ Public cogeneration plants Javne kotlovnice 3 _ _ 76 _ _ Public heating plants Industrijske toplane _ _ _ 55 _ _ Industrial cogeneration plants Industrijske kotlovnice _ _ _ _ _ _ Industrial heating plants Degazolinaža _ _ _ _ _ _ NGL plant Gradske plinare _ _ _ _ _ _ City gasworks Ostalo _ _ _ 98 _ _ Other Neenergetska potrošnja _ 155 _ 494 _ _ Non-energy use Gubici _ _ _ 36 _ _ Losses Neto potrošnja 133 579 143 1 501 16 425 9 774 Total consumption Potrošnja energetike 114 69 _ 197 446 110 Total energy sector Proizvodnja nafte i plina 114 67 _ 91 168 _ Oil and gas extraction Elektroprivreda _ _ _ _ _ _ Electric energy supply
industry Hidroelektrane _ _ _ _ _ _ Hydro power plants Termoelektrane _ _ _ _ _ _ Thermal power plants Javne toplane _ 1 _ _ _ 110 Public cogeneration plants Rafinerije _ _ _ 106 279 _ Petroleum refineries Degazolinaža _ _ _ _ _ _ NGL plant Ostalo _ 1 _ _ _ _ Other Neposredna potrošnja 19 509 143 1 304 15 979 9 664 Final demand Industrija 17 333 11 466 3 607 2 995 Industry Željeza i čelika _ _ _ 2 54 _ Iron and steel Obojenih metala _ _ 1 9 86 _ Non-ferrous metals Građevnog materijala i nemetala
3 299 4 105 787 - Construction materials
Kemijska - 13 - 146 308 671 Chemical Papira 2 - 1 42 324 26 Pulp and paper Prehrambena 10 - 1 108 696 529 Food production Ostala 2 22 4 54 1 354 1 769 Not elsewhere specified Promet _ 172 71 5 267 _ Transport Željeznički _ - _ _ 229 _ Rail Cestovni _ 19 71 5 _ _ Road Zračni _ 152 _ _ _ _ Air Pomorski i riječni _ 1 _ _ _ _ Sea and river Javni gradski _ _ _ _ _ _ Public city Ostali _ _ _ _ 39 _ Not elsewhere specified Opća potrošnja 3 2 61 833 12 105 6 669 Other sectors Kućanstva 1 - 46 578 6 266 4 900 Households Usluge - - 12 231 5 777 1 534 Services Poljoprivreda 1 2 3 24 62 235 Agriculture Graditeljstvo _ _ _ _ _ _ Construction Izvor: Energetski institut "Hrvoje Požar"
Source: Energy Institute “Hrvoje Požar”

STATISTIČKA IZVJEŠĆA 1614/2018. STATISTICAL REPORTS 19
1.3. BRUTO PROIZVODNJA ELEKTRIČNE I TOPLINSKE ENERGIJE IZ OBNOVLJIVIH IZVORA ELECTRICITY AND HEAT GROSS PRODUCTION FROM RENEWABLE SOURCES 1.3.1. BRUTO PROIZVODNJA ELEKTRIČNE I TOPLINSKE ENERGIJE IZ OBNOVLJIVIH IZVORA ZA 2016. ELECTRICITY AND HEAT GROSS PRODUCTION FROM RENEWABLE SOURCES, 2016
Opis
Postrojenja proizvođača kojima je to glavna djelatnost
Main activity producer plants Postrojenja samostalnih proizvođača
Autoproducer plants
Description električna energija
Electricity
električna energija,
kogeneracija Electricity,
CHP
toplina, kogeneracija Heat, CHP
električna energija
Electricity
električna energija,
kogeneracijaElectricity,
CHP
toplina, kogeneracija Heat, CHP
MWh TJ MWh TJ
Ukupna proizvodnja 8 157 210 389 188 1 213 6 538 15 876 - Total production
Hidroelektrane 7 051 061 - - 6 538 - - Hydro power plants
Geotermalni izvori - - - - - - Geothermal sources
Solarni fotonaponski sustav 65 541 - - - - - Solar photovoltaic system
Solarna toplina - - - - - - Solar thermal energy
Energija plime, valova i mora - - - - - - Tide, wave and ocean energy
Energija vjetra 1 014 248 - - - - - Wind energy
Industrijski otpad - - - - - - Industrial waste
Kruta biogoriva - 194 094 930 - - - Solid biofuels
Bioplin 26 360 195 094 283 - 15 876 - Biogases
Biodizel - - - - - - Biodiesels
Izvor: Energetski institut "Hrvoje Požar"
Source: Energy Institute “Hrvoje Požar”

20 STATISTIČKA IZVJEŠĆA 1614/2018. STATISTICAL REPORTS
1.3.2. BRUTO PROIZVODNJA ELEKTRIČNE I TOPLINSKE ENERGIJE IZ OBNOVLJIVIH IZVORA ZA 2017. ELECTRICITY AND HEAT GROSS PRODUCTION FROM RENEWABLE SOURCES, 2017
Opis
Postrojenja proizvođača kojima je to glavna djelatnost
Main activity producer plants Postrojenja samostalnih proizvođača
Autoproducer plants
Description električna energija
Electricity
električna energija,
kogeneracija Electricity, CHP
toplina, kogeneracija Heat, CHP
električna energija
Electricity
električna energija,
kogeneracijaElectricity,
CHP
toplina, kogeneracija Heat, CHP
MWh TJ MWh TJ
Ukupna proizvodnja 6 808 900 485 400 1 825 5 600 16 100 - Total production
Hidroelektrane 5 502 100 - - 5 600 - - Hydro power plants
Geotermalni izvori - - - - - - Geothermal sources
Solarni fotonaponski sustav 78 700 - - - - - Solar photovoltaic system
Solarna toplina - - - - - - Solar thermal energy
Energija plime, valova i mora - - - - - - Tide, wave and ocean energy
Energija vjetra 1 204 000 - - - - - Wind energy
Industrijski otpad - - - - - - Industrial waste
Kruta biogoriva - 215 900 1 498 - - - Solid biofuels
Bioplin 24 100 269 500 327 - 16 100 - Biogases
Biodizel - - - - - - Biodiesels
Izvor: Energetski institut "Hrvoje Požar"
Source: Energy Institute “Hrvoje Požar”
STATISTIČKA IZVJEŠĆA 1614/2018. STATISTICAL REPORTS 21
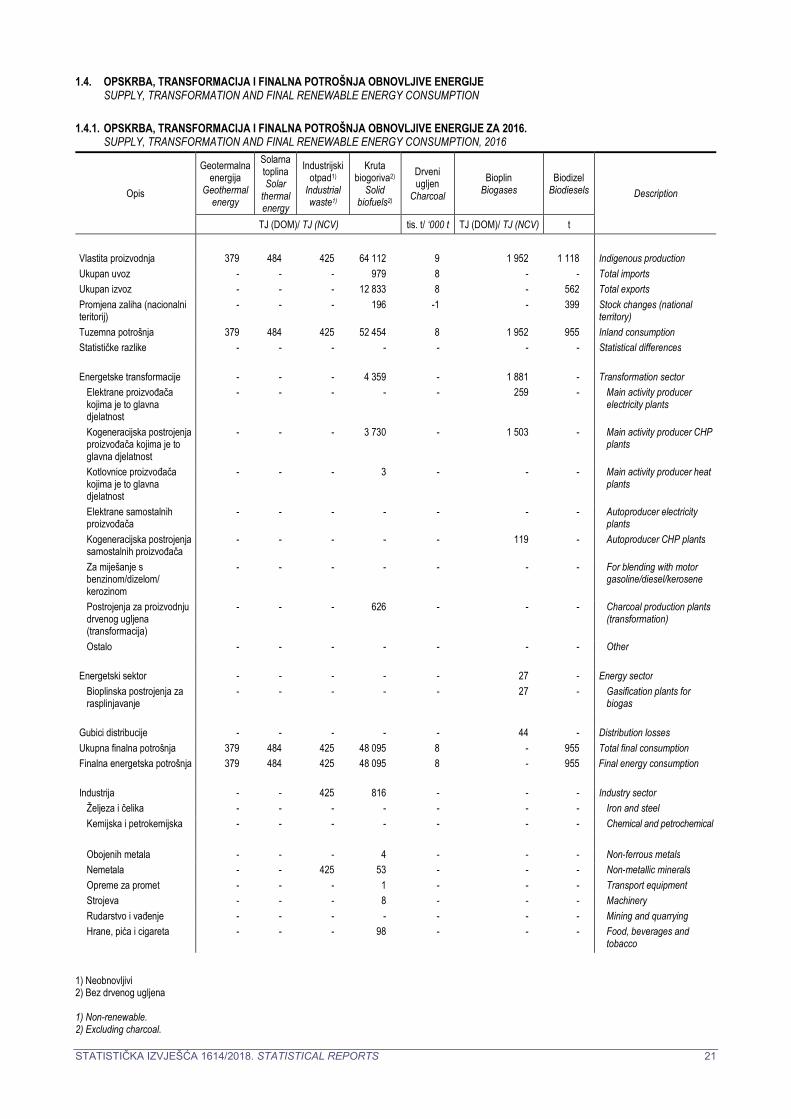
1.4. OPSKRBA, TRANSFORMACIJA I FINALNA POTROŠNJA OBNOVLJIVE ENERGIJE SUPPLY, TRANSFORMATION AND FINAL RENEWABLE ENERGY CONSUMPTION 1.4.1. OPSKRBA, TRANSFORMACIJA I FINALNA POTROŠNJA OBNOVLJIVE ENERGIJE ZA 2016. SUPPLY, TRANSFORMATION AND FINAL RENEWABLE ENERGY CONSUMPTION, 2016
Opis
Geotermalna energija
Geothermal energy
Solarna toplina Solar
thermal energy
Industrijski otpad1)
Industrial waste1)
Kruta biogoriva2)
Solid biofuels2)
Drveni ugljen
Charcoal Bioplin
Biogases Biodizel
Biodiesels Description
TJ (DOM)/ TJ (NCV) tis. t/ ‘000 t TJ (DOM)/ TJ (NCV) t Vlastita proizvodnja 379 484 425 64 112 9 1 952 1 118 Indigenous productionUkupan uvoz - - - 979 8 - - Total imports Ukupan izvoz - - - 12 833 8 - 562 Total exports Promjena zaliha (nacionalni teritorij)
- - - 196 -1 - 399 Stock changes (national territory)
Tuzemna potrošnja 379 484 425 52 454 8 1 952 955 Inland consumption Statističke razlike - - - - - - - Statistical differences Energetske transformacije - - - 4 359 - 1 881 - Transformation sector
Elektrane proizvođača kojima je to glavna djelatnost
- - - - - 259 - Main activity producer electricity plants
Kogeneracijska postrojenja proizvođača kojima je to glavna djelatnost
- - - 3 730 - 1 503 - Main activity producer CHP plants
Kotlovnice proizvođača kojima je to glavna djelatnost
- - - 3 - - - Main activity producer heat plants
Elektrane samostalnih proizvođača
- - - - - - - Autoproducer electricity plants
Kogeneracijska postrojenja samostalnih proizvođača
- - - - - 119 - Autoproducer CHP plants
Za miješanje s benzinom/dizelom/ kerozinom
- - - - - - - For blending with motor gasoline/diesel/kerosene
Postrojenja za proizvodnju drvenog ugljena (transformacija)
- - - 626 - - - Charcoal production plants (transformation)
Ostalo - - - - - - - Other Energetski sektor - - - - - 27 - Energy sector
Bioplinska postrojenja za rasplinjavanje
- - - - - 27 - Gasification plants for biogas
Gubici distribucije - - - - - 44 - Distribution lossesUkupna finalna potrošnja 379 484 425 48 095 8 - 955 Total final consumptionFinalna energetska potrošnja 379 484 425 48 095 8 - 955 Final energy consumption Industrija - - 425 816 - - - Industry sector
Željeza i čelika - - - - - - - Iron and steel Kemijska i petrokemijska - - - - - - - Chemical and petrochemical
Obojenih metala - - - 4 - - - Non-ferrous metalsNemetala - - 425 53 - - - Non-metallic mineralsOpreme za promet - - - 1 - - - Transport equipmentStrojeva - - - 8 - - - Machinery Rudarstvo i vađenje - - - - - - - Mining and quarryingHrane, pića i cigareta - - - 98 - - - Food, beverages and
tobacco 1) Neobnovljivi 2) Bez drvenog ugljena 1) Non-renewable. 2) Excluding charcoal.

22 STATISTIČKA IZVJEŠĆA 1614/2018. STATISTICAL REPORTS
1.4.1. OPSKRBA, TRANSFORMACIJA I FINALNA POTROŠNJA OBNOVLJIVE ENERGIJE ZA 2016. SUPPLY, TRANSFORMATION AND FINAL RENEWABLE ENERGY CONSUMPTION, 2016 (nastavak) (continued)
Opis
Geotermalna energija
Geothermal energy
Solarna toplina Solar
thermal energy
Industrijski otpad1)
Industrial waste1)
Kruta biogoriva2)
Solid biofuels2)
Drveni ugljen
Charcoal Bioplin
Biogases Biodizel
Biodiesels Description
TJ (DOM)/ TJ (NCV) tis. t/ ‘000 t TJ (DOM)/ TJ (NCV) t
Papira, pulpe i grafike - - - 2 - - - Paper, pulp and printingDrva i proizvoda od drva - - - 366 - - - Wood and wood productsGrađevinarstvo - - - - - - - Construction Tekstil i koža - - - 2 - - - Textiles and leatherOstalo - - - 282 - - - Other
Promet - - - - - - 955 Transport sector Željeznički - - - - - - - Rail Cestovni - - - - - - 955 Road Pomorski i riječni promet - - - - - - - Inland navigationOstalo - - - - - - - Other
Drugi sektori 379 484 - 47 279 8 - - Other sectors Komercijalne i javne usluge
209 145 - 260 1 - - Commercial and public services
Kućanstva - 339 - 47 019 7 - - Households Poljoprivreda/Šumarstvo 170 - - - - - - Agriculture/ForestryRibarstvo - - - - - - - Fishing Ostalo - - - - - - - Other
Izvor: Energetski institut "Hrvoje Požar"
Source: Energy Institute “Hrvoje Požar”

STATISTIČKA IZVJEŠĆA 1614/2018. STATISTICAL REPORTS 23
1.4.2. OPSKRBA, TRANSFORMACIJA I FINALNA POTROŠNJA OBNOVLJIVE ENERGIJE ZA 2017. SUPPLY, TRANSFORMATION AND FINAL RENEWABLE ENERGY CONSUMPTION, 2017
Opis
Geotermalna energija
Geothermal energy
Solarna toplina Solar
thermal energy
Industrijski otpad1)
Industrial waste1)
Kruta biogoriva2)
Solid biofuels2)
Drveni ugljen
Charcoal Bioplin
Biogases Biodizel
Biodiesels Description
TJ (DOM)/ TJ (NCV) tis. t/ ‘000 t TJ (DOM)/ TJ (NCV) t Vlastita proizvodnja 345 538 483 64 584 9 2 672 368 Indigenous productionUkupan uvoz - - - 1 233 10 - - Total imports Ukupan izvoz - - - 13 702 9 - - Total exports Promjena zaliha (nacionalni teritorij)
- - - 196 -1 - -5 Stock changes (national territory)
Tuzemna potrošnja 345 538 483 51 973 11 2 672 363 Inland consumption Statističke razlike - - - - - - - Statistical differences
Energetske transformacije - - - 4 912 - 2 644 - Transformation sectorElektrane proizvođača kojima je to glavna djelatnost
- - - - - 309 - Main activity producer electricity plants
Kogeneracijska postrojenja proizvođača kojima je to glavna djelatnost
- - - 4 245 - 2 217 - Main activity producer CHP plants
Kotlovnice proizvođača kojima je to glavna djelatnost
- - - 3 - - - Main activity producer heat plants
Elektrane samostalnih proizvođača
- - - - - - - Autoproducer electricity plants
Kogeneracijska postrojenja samostalnih proizvođača
- - - - - 118 - Autoproducer CHP plants
Za miješanje s benzinom/dizelom/ kerozinom
- - - - - - - For blending with motor gasoline/diesel/kerosene
Postrojenja za proizvodnju drvenog ugljena (transformacija)
- - - 664 - - - Charcoal production plants (transformation)
Ostalo - - - - - - - Other
Energetski sektor - - - - - 28 - Energy sector Bioplinska postrojenja za rasplinjavanje
- - - - - 28 - Gasification plants for biogas
Gubici distribucije - - - - - - - Distribution lossesUkupna finalna potrošnja 345 538 483 47 061 11 - 363 Total final consumptionFinalna energetska potrošnja 345 538 483 47 061 11 - 363 Final energy consumption
Industrija - - 483 1 341 - - - Industry sector Željeza i čelika - - - - - - - Iron and steel Kemijska i petrokemijska - - - - - - - Chemical and petrochemicalObojenih metala - - - 4 - - - Non-ferrous metalsNemetala - - 483 88 - - - Non-metallic mineralsOpreme za promet - - - 1 - - - Transport equipmentStrojeva - - - 12 - - - Machinery Rudarstvo i vađenje - - - - - - - Mining and quarryingHrane, pića i cigareta - - - 174 - - - Food, beverages and
tobacco Papira, pulpe i grafike - - - 52 - - - Paper, pulp and printingDrva i proizvoda od drva - - - 689 - - - Wood and wood products
1) Neobnovljivi 2) Bez drvenog ugljena 1) Non-renewable. 2) Excluding charcoal.

24 STATISTIČKA IZVJEŠĆA 1614/2018. STATISTICAL REPORTS
1.4.2. OPSKRBA, TRANSFORMACIJA I FINALNA POTROŠNJA OBNOVLJIVE ENERGIJE ZA 2017. SUPPLY, TRANSFORMATION AND FINAL RENEWABLE ENERGY CONSUMPTION, 2017 (nastavak) (continued)
Opis
Geotermalna energija
Geothermal energy
Solarna toplina Solar
thermal energy
Industrijski otpad1)
Industrial waste1)
Kruta biogoriva2)
Solid biofuels2)
Drveni ugljen
Charcoal Bioplin
Biogases Biodizel
Biodiesels Description
TJ (DOM)/ TJ (NCV) tis. t/ ‘000 t TJ (DOM)/ TJ (NCV) t
Građevinarstvo - - - - - - - Construction Tekstil i koža - - - 6 - - - Textiles and leatherOstalo - - - 316 - - - Other
Promet - - - - - - 363 Transport sector Željeznički - - - - - - - Rail Cestovni - - - - - - 363 Road Pomorski i riječni promet - - - - - - - Inland navigationOstalo - - - - - - - Other
Drugi sektori 345 538 - 45 720 11 - - Other sectors Komercijalne i javne usluge
187 162 - 317 1 - - Commercial and public services
Kućanstva - 377 - 45 403 10 - - Households Poljoprivreda/Šumarstvo 158 - - - - - - Agriculture/ForestryRibarstvo - - - - - - - Fishing Ostalo - - - - - - - Other
Izvor: Energetski institut "Hrvoje Požar"
Source: Energy Institute “Hrvoje Požar”

2. STATISTIČKA ENERGETSKA BILANCA EUROPSKE UNIJE STATISTICAL ENERGY BALANCE OF EUROPEAN UNION


STATISTIČKA IZVJEŠĆA 1614/2018. STATISTICAL REPORTS 27
2.1. STATISTIČKA ENERGETSKA BILANCA EUROPSKE UNIJE ZA 2015. STATISTICAL ENERGY BALANCE OF EUROPEAN UNION, 2015
tis. tona ekvivalentne nafte '000 toe
EU-28 Sveukupno Total
Kruta fosilna goriva
Solid fossil fuels
Sirova nafta i naftni derivati Crude oil and
petroleum products
Plin Gas
Nuklearna toplina
Nuclear heat EU-28
Primarna proizvodnja 767 430 144 881 74 944 107 330 221 202 Primary production
Proizvodi primarne proizvodnje1) 8 804 - 8 804 - - Primary production receipt1)
Povratni proizvodi 4 541 434 3 899 208 - Recovered products
Reciklirani proizvodi 1 077 - 1 077 - - Recycled products
Uvoz 1 480 633 150 570 934 868 343 927 - Imports
Saldo skladišta -1 855 5 910 -11 229 3 434 - Stock change
Izvoz 579 017 39 047 399 156 96 957 - Exports
Bunker brodova 42 263 - 42 263 - - Bunkers
Direktna potrošnja 10 033 - 10 033 - - Direct use
Ukupna potrošnja 1 629 315 262 747 560 910 357 943 221 202 Gross inland consumption
Energija za transformacije 1 305 085 247 283 657 375 108 082 221 202 Transformation input
Termoelektrane 360 918 186 484 13 359 97 598 - Thermal power stations
Nuklearne elektrane 221 202 - - - 221 202 Nuclear power stations
Javne kotlovnice 20 365 3 489 919 8 642 - District heating plants
Koksare 37 636 37 157 447 33 - Coke-oven plants
Visoke peći 13 350 13 350 - - - Blast-furnace plants
Gradske plinare 698 677 - 22 - Gas works
Rafinerije 642 382 - 642 382 - - Refineries
Ostalo 8 534 6 126 268 1 788 - Other
Proizvodnja transformirane energije 963 796 31 787 642 211 20 959 - Transformation output
Termoelektrane 177 934 - - - - Thermal power stations
Nuklearne elektrane 73 803 - - - - Nuclear power stations
Javne kotlovnice 17 042 - - - - District heating plants
Koksare 34 976 27 860 - 7 116 - Coke-oven plants
Visoke peći 13 350 - - 13 350 - Blast-furnace plants
Gradske plinare 494 - - 494 - Gas works
Rafinerije 642 211 - 642 211 - - Refineries
Ostalo 3 987 3 927 - - - Other
Promjene i transferi, povrat 2 724 - 2 724 - - Exchanges and transfers, returns
Transferi među proizvodima -110 - -110 - - Interproduct transfers
Rafinerijske sirovine 836 - 836 - - Product transferred
Povrat od petrokemijske industrije 1 998 - 1 998 - - Returns from petrochemical industry
1) Svi proizvodi koji nisu dobiveni u procesu proizvodnje u rafineriji ili degazolinažom
1) All products that are not obtained in the process of production at the refinery or NGL plants.

28 STATISTIČKA IZVJEŠĆA 1614/2018. STATISTICAL REPORTS
2.1. STATISTIČKA ENERGETSKA BILANCA EUROPSKE UNIJE ZA 2015. STATISTICAL ENERGY BALANCE OF EUROPEAN UNION, 2015 (nastavak) tis. tona ekvivalentne nafte (continued) '000 toe
EU-28 Sveukupno Total
Kruta fosilna goriva
Solid fossil fuels
Sirova nafta i naftni derivati Crude oil and
petroleum products
Plin Gas
Nuklearna toplina
Nuclear heat EU-28
Potrošnja energetike 80 486 672 33 007 19 371 - Consumption of the energy branch
Gubici distribucije 26 176 50 59 2 998 - Distribution losses
Neposredna potrošnja 1 184 088 46 530 515 405 248 451 - Available for final consumption
Neposredna neenergetska potrošnja 97 516 1 732 82 020 13 763 - Final non-energy consumption
Industrija 93 428 - 79 682 13 746 - Industry
Od toga: kemijska/petrokemijska 75 191 652 60 779 13 760 - Of that: chemical/petrochemical
Neposredna energetska potrošnja 1 086 208 45 909 429 923 236 907 - Final energy consumption
Industrija 276 137 34 529 28 251 86 201 - Industry
Industrija željeza i čelika 50 242 23 374 878 15 748 - Iron and steel industry
Industrija obojenih metala 9 546 304 298 3 280 - Non-ferrous metal industry
Kemijska industrija 51 135 3 083 7 616 17 068 - Chemical industry
Industrija stakla i građ. materijala 33 791 4 501 6 694 12 703 - Glass, pottery and building material industry
Rudarstvo 3 382 176 883 564 - Ore-extraction industry
Industrija hrane, pića i cigareta 29 089 1 291 1 870 13 587 - Food, drink and tobacco industry
Industrija tekstila, kože i odjeće 4 367 63 259 2 030 - Textile, leather and clothing industry
Industrija papira i grafike 33 687 1 068 735 7 044 - Paper and printing
Strojogradnja i metalna industrija 26 911 171 1 444 9 360 - Engineering and other metal industry
Građevinarstvo 6 742 31 3 275 1 630 - Construction
Ostalo 27 066 466 4 300 3 185 - Other
Promet 358 065 10 335 479 3 159 - Transport
Željeznički promet 6 365 10 1 994 - - Railways
Cestovni promet 293 301 - 277 456 1 706 - Road transport
Zračni promet 51 277 - 51 277 - - Air transport
Pomorski i riječni promet 4 475 - 4 471 - - Inland navigation
Cjevovodi 1 566 - 1 1 410 - Pipeline transport
Ostalo 1 081 - 280 44 - Other
Opća potrošnja 452 005 11 370 66 193 147 547 - Households, commerce, public authorities etc.
Kućanstva 276 366 9 249 34 880 98 546 - Households
Usluge 147 133 1 069 15 292 44 628 - Services
Poljoprivreda 24 760 1 016 13 942 3 286 - Agriculture
Ostalo 3 746 36 2 079 1 087 - Other
Statističke razlike 364 -1 112 3 461 -2 220 - Statistical differences

STATISTIČKA IZVJEŠĆA 1614/2018. STATISTICAL REPORTS 29
2.1. STATISTIČKA ENERGETSKA BILANCA EUROPSKE UNIJE ZA 2015. STATISTICAL ENERGY BALANCE OF EUROPEAN UNION, 2015 (nastavak) tis. tona ekvivalentne nafte (continued) '000 toe
EU-28 Obnovljivi izvori Renewed energy
Neobnovljivi otpadNon-renewable
wastes
Električna energijaElectricity
Toplinska energijaDerived heat EU-28
Primarna proizvodnja 205 781 13 291 2) 2) Primary production
Proizvodi primarne proizvodnje1) - - - - Primary production receipt1)
Povratni proizvodi - - - - Recovered products
Reciklirani proizvodi - - - - Recycled products
Uvoz 15 630 349 35 282 6 Imports
Saldo skladišta 28 1 - - Stock change
Izvoz 9 767 28 34 056 5 Exports
Bunker brodova - - - - Bunkers
Direktna potrošnja - - - - Direct use
Ukupna potrošnja 211 673 13 613 1 226 1 Gross inland consumption
Energija za transformacije 60 004 10 060 261 818 Transformation input
Termoelektrane 53 740 8 918 - 818 Thermal power stations
Nuklearne elektrane - - - - Nuclear power stations
Javne kotlovnice 5 912 1 141 261 - District heating plants
Koksare - - - - Coke-oven plants
Visoke peći - - - - Blast-furnace plants
Gradske plinare - - - - Gas works
Rafinerije - - - - Refineries
Ostalo 352 - - - Other
Proizvodnja transformirane energije 59 - 211 465 57 314 Transformation output
Termoelektrane - - 137 765 40 169 Thermal power stations
Nuklearne elektrane - - 73 700 103 Nuclear power stations
Javne kotlovnice - - - 17 042 District heating plants
Koksare - - - - Coke-oven plants
Visoke peći - - - - Blast-furnace plants
Gradske plinare - - - - Gas works
Rafinerije - - - - Refineries
Ostalo 59 - - - Other
Promjene i transferi, povrat -64 123 - 64 123 - Exchanges and transfers, returns
Transferi među proizvodima -64 123 - 64 123 - Interproduct transfers
Rafinerijske sirovine - - - - Product transferred
Povrat od petrokemijske industrije - - - - Returns from petrochemical industry
2) Nema podatka jer se energent dobiva transformacijom. Energent se iskazuje pod proizvodnjom transformirane energije.
2) No data, because the energy product is produced by transformation. Energy product is presented under the transformation output.

30 STATISTIČKA IZVJEŠĆA 1614/2018. STATISTICAL REPORTS
2.1. STATISTIČKA ENERGETSKA BILANCA EUROPSKE UNIJE ZA 2015. STATISTICAL ENERGY BALANCE OF EUROPEAN UNION, 2015 (nastavak) tis. tona ekvivalentne nafte (continued) '000 toe
EU-28 Obnovljivi izvori Renewed energy
Neobnovljivi otpadNon-renewable
wastes
Električna energijaElectricity
Toplinska energijaDerived heat EU-28
Potrošnja energetike 640 79 21 944 4 773 Consumption of the energy branch
Gubici distribucije 26 - 17 746 5 296 Distribution losses
Neposredna potrošnja 86 939 3 474 236 862 46 428 Available for final consumption
Neposredna neenergetska potrošnja - - - - Final non-energy consumption
Industrija - - - - Industry
Od toga: kemijska/petrokemijska - - - - Of that: chemical/petrochemical
Neposredna energetska potrošnja 86 917 3 473 236 623 46 455 Final energy consumption
Industrija 21 538 3 205 86 372 16 040 Industry
Industrija željeza i čelika 24 46 9 680 493 Iron and steel industry
Industrija obojenih metala 2 10 5 510 141 Non-ferrous metal industry
Kemijska industrija 322 482 15 525 7 039 Chemical industry
Industrija stakla i građ. materijala 1 649 2 391 5 767 266 Glass, pottery and building material industry
Rudarstvo 85 - 1 551 122 Ore-extraction industry
Industrija hrane, pića i cigareta 1 110 7 9 945 1 277 Food, drink and tobacco industry
Industrija tekstila, kože i odjeće 17 - 1 816 182 Textile, leather and clothing industry
Industrija papira i grafike 12 302 119 10 047 2 371 Paper and printing
Strojogradnja i metalna industrija 141 4 14 675 1 115 Engineering and other metal industry
Građevinarstvo 101 1 1 656 49 Construction
Ostalo 5 785 145 10 201 2 984 Other
Promet 13 978 - 5 439 - Transport
Željeznički promet 27 - 4 334 - Railways
Cestovni promet 13 942 - 198 - Road transport
Zračni promet - - - - Air transport
Pomorski i riječni promet 4 - - - Inland navigation
Cjevovodi - - 155 - Pipeline transport
Ostalo 5 - 752 - Other
Opća potrošnja 51 402 268 144 811 30 415 Households, commerce, public authorities etc.
Kućanstva 44 148 - 68 407 21 136 Households
Usluge 5 105 268 71 883 8 889 Services
Poljoprivreda 2 024 - 4 251 242 Agriculture
Ostalo 124 - 271 148 Other
Statističke razlike 22 1 239 -27 Statistical differences
Izvor/ Source: EUROSTAT – ENERGY BALANCE SHEETS 2015 – 2016

STATISTIČKA IZVJEŠĆA 1614/2018. STATISTICAL REPORTS 31
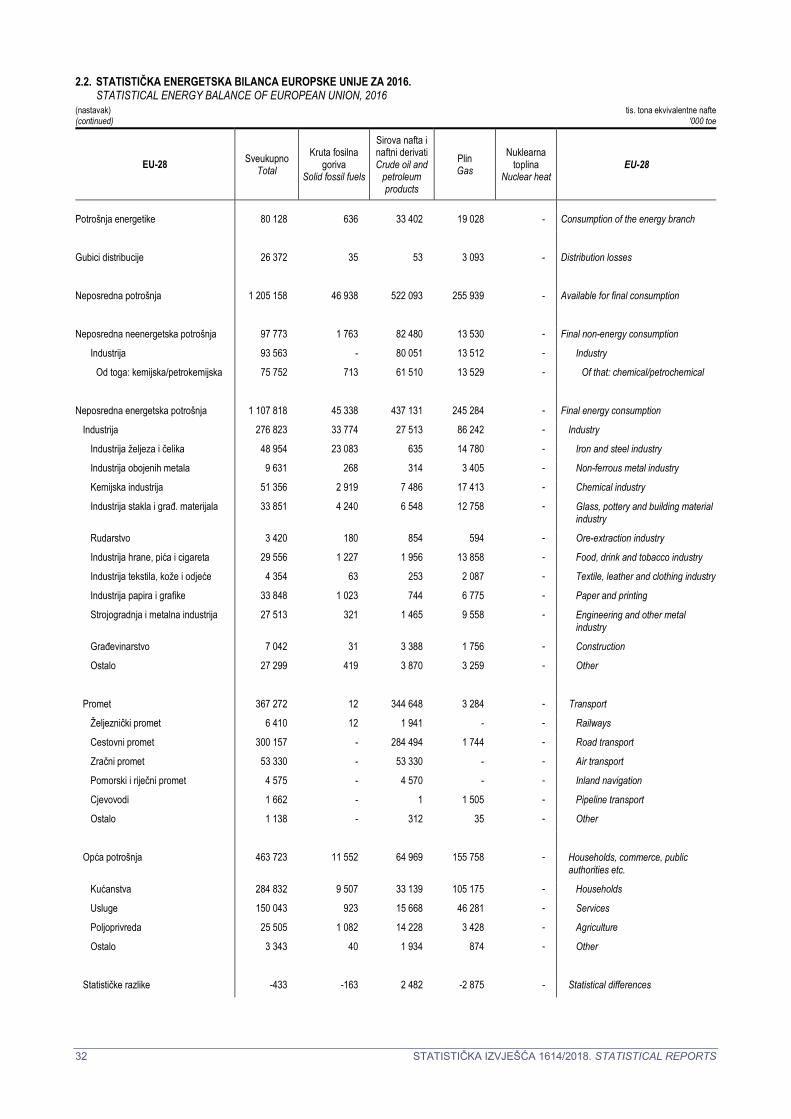
2.2. STATISTIČKA ENERGETSKA BILANCA EUROPSKE UNIJE ZA 2016. STATISTICAL ENERGY BALANCE OF EUROPEAN UNION, 2016
tis. tona ekvivalentne nafte '000 toe
EU-28 Sveukupno Total
Kruta fosilna goriva
Solid fossil fuels
Sirova nafta i naftni derivati Crude oil and
petroleum products
Plin Gas
Nuklearna toplina
Nuclear heat EU-28
Primarna proizvodnja 755 389 131 850 74 354 107 238 216 703 Primary production
Proizvodi primarne proizvodnje1) 9 397 - 9 397 - - Primary production receipt1)
Povratni proizvodi 4 522 404 3 818 300 - Recovered products
Reciklirani proizvodi 1 044 - 1 044 - - Recycled products
Uvoz 1 483 219 134 902 941 564 357 102 - Imports
Saldo skladišta 21 263 11 807 3 423 5 944 - Stock change
Izvoz 579 508 38 239 411 746 87 613 - Exports
Bunker brodova 44 152 - 44 151 1 - Bunkers
Direktna potrošnja 10 559 - 10 559 - Direct use
Ukupna potrošnja 1 640 615 240 724 567 142 382 969 216 703 Gross inland consumption
Energija za transformacije 1 294 958 224 492 654 689 125 132 216 703 Transformation input
Termoelektrane 358 478 165 433 12 820 114 576 - Thermal power stations
Nuklearne elektrane 216 703 - - - 216 703 Nuclear power stations
Javne kotlovnice 21 015 3 544 963 8 654 - District heating plants
Koksare 36 597 36 215 355 27 - Coke-oven plants
Visoke peći 12 918 12 918 - - - Blast-furnace plants
Gradske plinare 695 674 - 21 - Gas works
Rafinerije 640 308 - 640 308 - - Refineries
Ostalo 8 244 5 708 243 1 855 - Other
Proizvodnja transformirane energije 963 032 31 378 640 125 20 223 - Transformation output
Termoelektrane 181 172 - - - - Thermal power stations
Nuklearne elektrane 72 303 - - - - Nuclear power stations
Javne kotlovnice 17 770 - - - - District heating plants
Koksare 34 193 27 365 - 6 828 - Coke-oven plants
Visoke peći 12 918 - - 12 918 - Blast-furnace plants
Gradske plinare 477 - - 477 - Gas works
Rafinerije 640 125 - 640 125 - - Refineries
Ostalo 4 074 4 013 - - - Other
Promjene i transferi, povrat 2 969 - 2 969 - - Exchanges and transfers, returns
Transferi među proizvodima -123 - -123 - - Interproduct transfers
Rafinerijske sirovine 960 - 960 - - Product transferred
Povrat od petrokemijske industrije 2 133 - 2 133 - - Returns from petrochemical industry
1) Svi proizvodi koji nisu dobiveni u procesu proizvodnje u rafineriji ili degazolinažom
1) All products that are not obtained in the process of production at the refinery or NGL plants.
32 STATISTIČKA IZVJEŠĆA 1614/2018. STATISTICAL REPORTS
2.2. STATISTIČKA ENERGETSKA BILANCA EUROPSKE UNIJE ZA 2016. STATISTICAL ENERGY BALANCE OF EUROPEAN UNION, 2016 (nastavak) tis. tona ekvivalentne nafte (continued) '000 toe
EU-28 Sveukupno Total
Kruta fosilna goriva
Solid fossil fuels
Sirova nafta i naftni derivati Crude oil and
petroleum products
Plin Gas
Nuklearna toplina
Nuclear heat EU-28
Potrošnja energetike 80 128 636 33 402 19 028 - Consumption of the energy branch
Gubici distribucije 26 372 35 53 3 093 - Distribution losses
Neposredna potrošnja 1 205 158 46 938 522 093 255 939 - Available for final consumption
Neposredna neenergetska potrošnja 97 773 1 763 82 480 13 530 - Final non-energy consumption
Industrija 93 563 - 80 051 13 512 - Industry
Od toga: kemijska/petrokemijska 75 752 713 61 510 13 529 - Of that: chemical/petrochemical
Neposredna energetska potrošnja 1 107 818 45 338 437 131 245 284 - Final energy consumption
Industrija 276 823 33 774 27 513 86 242 - Industry
Industrija željeza i čelika 48 954 23 083 635 14 780 - Iron and steel industry
Industrija obojenih metala 9 631 268 314 3 405 - Non-ferrous metal industry
Kemijska industrija 51 356 2 919 7 486 17 413 - Chemical industry
Industrija stakla i građ. materijala 33 851 4 240 6 548 12 758 - Glass, pottery and building material industry
Rudarstvo 3 420 180 854 594 - Ore-extraction industry
Industrija hrane, pića i cigareta 29 556 1 227 1 956 13 858 - Food, drink and tobacco industry
Industrija tekstila, kože i odjeće 4 354 63 253 2 087 - Textile, leather and clothing industry
Industrija papira i grafike 33 848 1 023 744 6 775 - Paper and printing
Strojogradnja i metalna industrija 27 513 321 1 465 9 558 - Engineering and other metal industry
Građevinarstvo 7 042 31 3 388 1 756 - Construction
Ostalo 27 299 419 3 870 3 259 - Other
Promet 367 272 12 344 648 3 284 - Transport
Željeznički promet 6 410 12 1 941 - - Railways
Cestovni promet 300 157 - 284 494 1 744 - Road transport
Zračni promet 53 330 - 53 330 - - Air transport
Pomorski i riječni promet 4 575 - 4 570 - - Inland navigation
Cjevovodi 1 662 - 1 1 505 - Pipeline transport
Ostalo 1 138 - 312 35 - Other
Opća potrošnja 463 723 11 552 64 969 155 758 - Households, commerce, public authorities etc.
Kućanstva 284 832 9 507 33 139 105 175 - Households
Usluge 150 043 923 15 668 46 281 - Services
Poljoprivreda 25 505 1 082 14 228 3 428 - Agriculture
Ostalo 3 343 40 1 934 874 - Other
Statističke razlike -433 -163 2 482 -2 875 - Statistical differences

STATISTIČKA IZVJEŠĆA 1614/2018. STATISTICAL REPORTS 33
2.2. STATISTIČKA ENERGETSKA BILANCA EUROPSKE UNIJE ZA 2016. STATISTICAL ENERGY BALANCE OF EUROPEAN UNION, 2016 (nastavak) tis. tona ekvivalentne nafte (continued) '000 toe
EU-28 Obnovljivi izvori Renewed energy
Neobnovljivi otpadNon-renewable
wastes
Električna energijaElectricity
Toplinska energijaDerived heat EU-28
Primarna proizvodnja 210 708 14 537 2) 2) Primary production
Proizvodi primarne proizvodnje1) - - - - Primary production receipt1)
Povratni proizvodi - - - - Recovered products
Reciklirani proizvodi - - - - Recycled products
Uvoz 16 395 385 32 865 6 Imports
Saldo skladišta 89 - - - Stock change
Izvoz 10 574 29 31 301 5 Exports
Bunker brodova - - - - Bunkers
Direktna potrošnja - - - - Direct use
Ukupna potrošnja 216 618 14 893 1 564 1 Gross inland consumption
Energija za transformacije 61 875 11 027 272 768 Transformation input
Termoelektrane 54 977 9 905 - 768 Thermal power stations
Nuklearne elektrane - - - - Nuclear power stations
Javne kotlovnice 6 459 1 122 272 - District heating plants
Koksare - - - - Coke-oven plants
Visoke peći - - - - Blast-furnace plants
Gradske plinare - - - - Gas works
Rafinerije - - - - Refineries
Ostalo 439 - - - Other
Proizvodnja transformirane energije 62 - 212 054 59 192 Transformation output
Termoelektrane - - 139 854 41 319 Thermal power stations
Nuklearne elektrane - - 72 200 103 Nuclear power stations
Javne kotlovnice - - - 17 770 District heating plants
Koksare - - - - Coke-oven plants
Visoke peći - - - - Blast-furnace plants
Gradske plinare - - - - Gas works
Rafinerije - - - - Refineries
Ostalo 62 - - - Other
Promjene i transferi, povrat -65 240 - 65 240 - Exchanges and transfers, returns
Transferi među proizvodima -65 240 - 65 240 - Interproduct transfers
Rafinerijske sirovine - - - - Product transferred
Povrat od petrokemijske industrije - - - - Returns from petrochemical industry
2) Nema podatka jer se energent dobiva transformacijom. Energent se iskazuje pod proizvodnjom transformirane energije.
2) No data, because the energy product is produced by transformation. Energy product is presented under the transformation output.

34 STATISTIČKA IZVJEŠĆA 1614/2018. STATISTICAL REPORTS
2.2. STATISTIČKA ENERGETSKA BILANCA EUROPSKE UNIJE ZA 2016. STATISTICAL ENERGY BALANCE OF EUROPEAN UNION, 2016 (nastavak) tis. tona ekvivalentne nafte (continued) '000 toe
EU-28 Obnovljivi izvori Renewed energy
Neobnovljivi otpadNon-renewable
wastes
Električna energijaElectricity
Toplinska energijaDerived heat EU-28
Potrošnja energetike 654 87 21 408 4 913 Consumption of the energy branch
Gubici distribucije 24 - 17 612 5 554 Distribution losses
Neposredna potrošnja 88 886 3 780 239 565 47 957 Available for final consumption
Neposredna neenergetska potrošnja - - - - Final non-energy consumption
Industrija - - - - Industry
Od toga: kemijska/petrokemijska - - - - Of that: chemical/petrochemical
Neposredna energetska potrošnja 88 949 3 780 239 405 47 932 Final energy consumption
Industrija 22 542 3 524 87 115 16 112 Industry
Industrija željeza i čelika 5 46 9 899 506 Iron and steel industry
Industrija obojenih metala 2 11 5 481 150 Non-ferrous metal industry
Kemijska industrija 441 563 15 580 6 954 Chemical industry
Industrija stakla i građ. materijala 1 620 2 601 5 848 237 Glass, pottery and building material industry
Rudarstvo 71 - 1 603 118 Ore-extraction industry
Industrija hrane, pića i cigareta 1 147 5 10 049 1 314 Food, drink and tobacco industry
Industrija tekstila, kože i odjeće 19 - 1 784 148 Textile, leather and clothing industry
Industrija papira i grafike 12 968 125 9 975 2 239 Paper and printing
Strojogradnja i metalna industrija
182 5 14 804 1 177 Engineering and other metal industry
Građevinarstvo 108 1 1 712 45 Construction
Ostalo 5 980 167 10 381 3 223 Other
Promet 13 840 - 5 488 - Transport
Željeznički promet 33 - 4 424 - Railways
Cestovni promet 13 796 - 123 - Road transport
Zračni promet - - - - Air transport
Pomorski i riječni promet 5 - - - Inland navigation
Cjevovodi - - 156 - Pipeline transport
Ostalo 7 - 785 - Other
Opća potrošnja 52 567 256 146 801 31 820 Households, commerce, public authorities etc.
Kućanstva 45 369 - 69 494 22 148 Households
Usluge 4 889 255 72 754 9 274 Services
Poljoprivreda 2 177 1 4 337 252 Agriculture
Ostalo 131 - 217 146 Other
Statističke razlike -63 - 160 26 Statistical differences
Izvor/ Source: EUROSTAT – ENERGY BALANCE SHEETS 2015 – 2016

3. STATISTIČKA ENERGETSKA BILANCA PO ZEMLJAMA ČLANICAMA EUROPSKE UNIJE
STATISTICAL ENERGY BALANCE BY EU MEMBER STATES

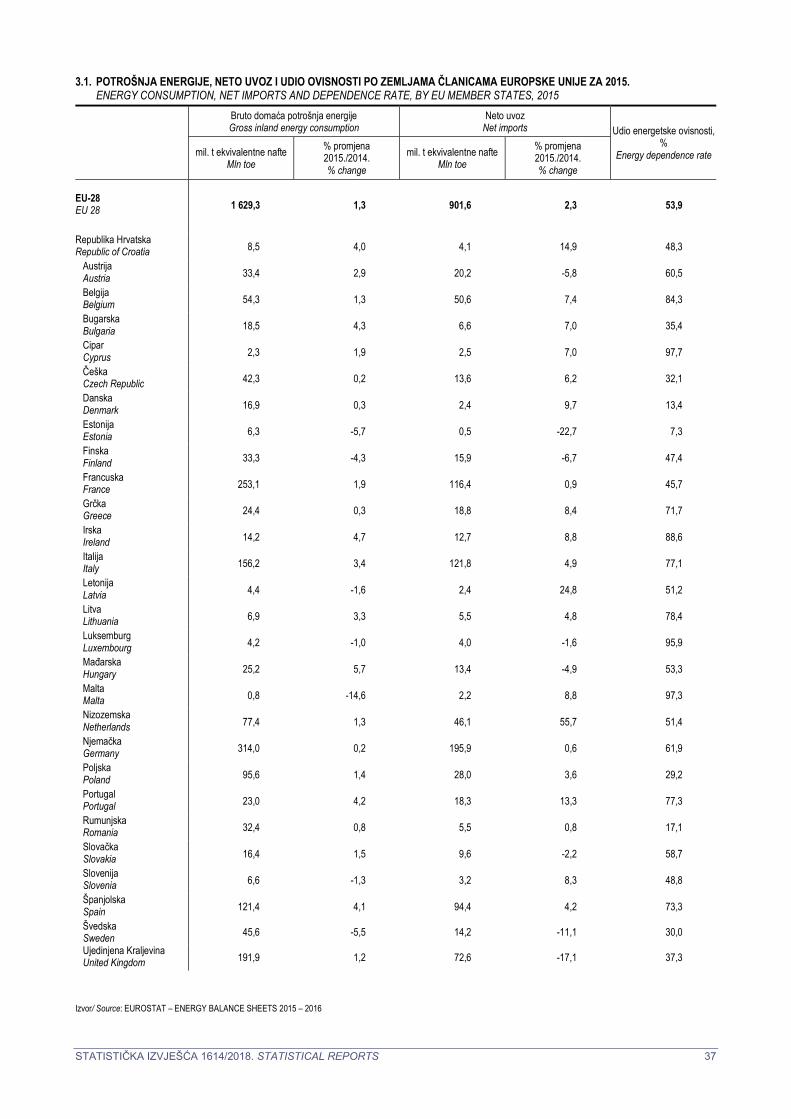
STATISTIČKA IZVJEŠĆA 1614/2018. STATISTICAL REPORTS 37
3.1. POTROŠNJA ENERGIJE, NETO UVOZ I UDIO OVISNOSTI PO ZEMLJAMA ČLANICAMA EUROPSKE UNIJE ZA 2015. ENERGY CONSUMPTION, NET IMPORTS AND DEPENDENCE RATE, BY EU MEMBER STATES, 2015
Bruto domaća potrošnja energije Gross inland energy consumption
Neto uvoz Net imports Udio energetske ovisnosti,
% Energy dependence ratemil. t ekvivalentne nafte
Mln toe
% promjena 2015./2014. % change
mil. t ekvivalentne nafte Mln toe
% promjena 2015./2014. % change
EU-28 EU 28 1 629,3 1,3 901,6 2,3 53,9
Republika Hrvatska Republic of Croatia 8,5 4,0 4,1 14,9 48,3
Austrija Austria 33,4 2,9 20,2 -5,8 60,5
Belgija Belgium 54,3 1,3 50,6 7,4 84,3
Bugarska Bulgaria 18,5 4,3 6,6 7,0 35,4
Cipar Cyprus 2,3 1,9 2,5 7,0 97,7
Češka Czech Republic 42,3 0,2 13,6 6,2 32,1
Danska Denmark 16,9 0,3 2,4 9,7 13,4
Estonija Estonia 6,3 -5,7 0,5 -22,7 7,3
Finska Finland 33,3 -4,3 15,9 -6,7 47,4
Francuska France 253,1 1,9 116,4 0,9 45,7
Grčka Greece 24,4 0,3 18,8 8,4 71,7
Irska Ireland 14,2 4,7 12,7 8,8 88,6
Italija Italy 156,2 3,4 121,8 4,9 77,1
Letonija Latvia 4,4 -1,6 2,4 24,8 51,2
Litva Lithuania 6,9 3,3 5,5 4,8 78,4
Luksemburg Luxembourg 4,2 -1,0 4,0 -1,6 95,9
Mađarska Hungary 25,2 5,7 13,4 -4,9 53,3
Malta Malta 0,8 -14,6 2,2 8,8 97,3
Nizozemska Netherlands 77,4 1,3 46,1 55,7 51,4
Njemačka Germany 314,0 0,2 195,9 0,6 61,9
Poljska Poland 95,6 1,4 28,0 3,6 29,2
Portugal Portugal 23,0 4,2 18,3 13,3 77,3
Rumunjska Romania 32,4 0,8 5,5 0,8 17,1
Slovačka Slovakia 16,4 1,5 9,6 -2,2 58,7
Slovenija Slovenia 6,6 -1,3 3,2 8,3 48,8
Španjolska Spain 121,4 4,1 94,4 4,2 73,3
Švedska Sweden 45,6 -5,5 14,2 -11,1 30,0 Ujedinjena Kraljevina United Kingdom 191,9 1,2 72,6 -17,1 37,3
Izvor/ Source: EUROSTAT – ENERGY BALANCE SHEETS 2015 – 2016

38 STATISTIČKA IZVJEŠĆA 1614/2018. STATISTICAL REPORTS
3.2. POTROŠNJA ENERGIJE, NETO UVOZ I UDIO OVISNOSTI PO ZEMLJAMA ČLANICAMA EUROPSKE UNIJE ZA 2016. ENERGY CONSUMPTION, NET IMPORTS AND DEPENDENCE RATE, BY EU MEMBER STATES, 2016
Bruto domaća potrošnja energije Gross inland energy consumption
Neto uvoz Net imports Udio energetske ovisnosti
% Energy dependence rate mil. t ekvivalentne nafte
Mln toe
% promjena 2016./2015. % change
mil. t ekvivalentne nafte Mln toe
% promjena 2016./2015. % change
EU-28 EU 28 1 640,6 0,7 903,7 0,2 53,6
Republika Hrvatska Republic of Croatia 8,6 0,7 4,1 -0,3 47,8
Austrija Austria 33,9 1,4 21,2 4,6 62,4
Belgija Belgium 57,5 5,9 48,7 -3,8 76,0
Bugarska Bulgaria 18,1 -2,1 6,8 2,8 37,2
Cipar Cyprus 2,4 7,5 2,6 6,8 96,2
Češka Czech Republic 41,8 -1,2 13,7 0,7 32,7
Danska Denmark 17,4 3,4 2,5 7,2 13,9
Estonija Estonia 6,2 -1,2 0,4 -8,4 6,8
Finska Finland 34,6 4,0 15,8 -0,7 45,3
Francuska France 248,7 -1,7 117,8 1,1 47,1
Grčka Greece 24,1 -1,3 19,0 1,2 73,6
Irska Ireland 14,8 4,6 10,4 -18,5 69,1
Italija Italy 154,7 -0,9 121,7 -0,1 77,5
Letonija Latvia 4,4 0,1 2,2 -6,5 47,2
Litva Lithuania 7,0 1,7 5,6 1,7 77,4
Luksemburg Luxembourg 4,2 0,4 4,0 0,7 96,1
Mađarska Hungary 25,7 2,1 14,3 6,4 55,6
Malta Malta 0,7 -4,0 2,5 12,0 100,9
Nizozemska Netherlands 78,5 1,5 41,6 -9,8 45,8
Njemačka Germany 317,3 1,1 203,2 3,7 63,5
Poljska Poland 99,9 4,5 30,3 8,2 30,3
Portugal Portugal 23,3 1,0 17,6 -4,0 73,5
Rumunjska Romania 32,4 -0,1 7,2 30,5 22,3
Slovačka Slovakia 16,5 0,5 9,7 1,0 59,0
Slovenija Slovenia 6,8 3,5 3,3 3,5 48,4
Španjolska Spain 122,2 0,6 93,2 -1,3 71,9
Švedska Sweden 49,2 8,1 16,4 15,1 32,0
Ujedinjena Kraljevina United Kingdom 189,4 -1,3 67,8 -6,6 35,3
Izvor/ Source: EUROSTAT – ENERGY BALANCE SHEETS 2015 – 2016

STATISTIČKA IZVJEŠĆA 1614/2018. STATISTICAL REPORTS 39
3.3. STATISTIČKA ENERGETSKA BILANCA PO ZEMLJAMA ČLANICAMA EUROPSKE UNIJE ZA 2015. STATISTICAL ENERGY BALANCE, BY EU MEMBER STATES, 2015 tis. tona ekvivalentne nafte '000 toe
Republika Hrvatska
Republic of Croatia
Austrija Austria
Belgija Belgium
BugarskaBulgaria
Cipar Cyprus
Češka Czech
Republic
Danska Denmark
Primarna proizvodnja 4 391 11 995 10 401 11 986 121 28 709 15 739 Primary production
Proizvodi primarne proizvodnje1) - - 1 187 - - - - Primary production receipt1)
Povratni proizvodi 75 - 8 144 - 174 17 Recovered products
Reciklirani proizvodi - - 31 4 5 15 - Recycled products
Uvoz 7 162 29 484 81 502 12 513 2 476 21 981 18 625 Imports
Saldo skladišta -56 1 195 -958 -127 -67 -100 -490 Stock change
Izvoz 3 041 9 260 30 876 5 928 24 8 400 16 271 Exports
Bunker brodova 4 17 5 821 87 238 - 766 Bunkers
Direktna potrošnja 2 - 1 216 -5 - 52 1 Direct use
Ukupna potrošnja 8 524 33 397 54 257 18 511 2 272 42 327 16 853 Gross inland consumption
Energija za transformacije 4 597 16 771 50 552 19 062 923 32 553 14 161 Transformation input
Termoelektrane 1 026 4 557 6 580 7 075 920 13 907 3 983 Thermal power stations
Nuklearne elektrane - - 6 733 3 983 - 6 945 - Nuclear power stations
Javne kotlovnice 68 1 001 12 225 - 651 1 023 District heating plants
Koksare - 1 227 1 165 - - 2 197 - Coke-oven plants
Visoke peći - 803 592 - - 600 - Blast-furnace plants
Gradske plinare - - - - - 521 14 Gas works
Rafinerije 3 417 9 180 35 470 6 747 - 7 664 9 140 Refineries
Ostalo 87 3 - 1 031 2 68 - Other
Proizvodnja transformirane energije 4 031 14 788 43 214 11 856 362 20 455 13 476 Transformation output
Termoelektrane 554 2 808 3 801 3 082 361 6 664 3 283 Thermal power stations
Nuklearne elektrane - - 2 244 1 338 - 2 329 - Nuclear power stations
Javne kotlovnice 54 828 3 243 - 609 1 057 District heating plants
Koksare - 1 171 1 108 - - 2 165 - Coke-oven plants
Visoke peći - 803 592 - - 600 - Blast-furnace plants
Gradske plinare - - - - - 366 - Gas works
Rafinerije 3 416 9 177 35 466 6 741 - 7 663 9 135 Refineries
Ostalo 5 1 - 452 1 58 - Other
Promjene i transferi, povrat 1 13 118 -8 - 6 14 Exchanges and transfers, returns
Transferi među proizvodima 1 - -19 - - 3 - Interproduct transfers
Rafinerijske sirovine - 13 190 -8 - 2 14 Product transferred
Povrat od petrokemijske industrije - - -53 - - 1 - Returns from petrochemical industry
1) Svi proizvodi koji nisu dobiveni u procesu proizvodnje u rafineriji ili degazolinažom
1) All products that are not obtained in the process of production at the refinery or NGL plants.

40 STATISTIČKA IZVJEŠĆA 1614/2018. STATISTICAL REPORTS
3.3. STATISTIČKA ENERGETSKA BILANCA PO ZEMLJAMA ČLANICAMA EUROPSKE UNIJE ZA 2015. STATISTICAL ENERGY BALANCE, BY EU MEMBER STATES, 2015 (nastavak) tis. tona ekvivalentne nafte (continued) '000 toe
Republika Hrvatska
Republic of Croatia
Austrija Austria
Belgija Belgium
BugarskaBulgaria
Cipar Cyprus
Češka Czech
Republic
Danska Denmark
Potrošnja energetike 622 1 406 2 236 1 154 20 2 314 1 148 Consumption of the energy branch
Gubici distribucije 220 626 368 489 18 687 775 Distribution losses
Neposredna potrošnja 7 115 29 395 44 432 9 654 1 673 27 234 14 260 Available for final consumption
Neposredna neenergetska potrošnja 530 1 925 8 516 607 24 2 447 252 Final non-energy consumption
Industrija 511 1 875 8 276 552 23 1 893 211 Industry
Od toga: kemijska/petrokemijska 414 1 451 7 611 311 - 1 608 1 Of that: chemical/petrochemical
Neposredna energetska potrošnja 6 585 27 461 35 865 9 508 1 660 24 247 14 011 Final energy consumption
Industrija 1 090 9 127 11 904 2 713 209 7 449 2 091 Industry
Industrija željeza i čelika 23 2 497 2 274 111 - 1 870 83 Iron and steel industry
Industrija obojenih metala 7 237 285 134 1 71 - Non-ferrous metal industry
Kemijska industrija 151 944 4 188 874 7 1 001 254 Chemical industry
Industrija stakla i građ. materijala 330 905 1 378 535 147 1 108 432 Glass, pottery and building material industry
Rudarstvo 15 129 47 116 5 84 85 Ore-extraction industry
Industrija hrane, pića i cigareta 202 723 1 447 249 32 584 576 Food, drink and tobacco industry
Industrija tekstila, kože i odjeće 28 67 192 67 - 138 17 Textile, leather and clothing industry
Industrija papira i grafike 58 1 578 691 245 2 608 78 Paper and printing
Strojogradnja i metalna industrija 83 700 436 142 2 1 112 239 Engineering and other metal industry
Građevinarstvo 100 513 211 86 8 190 157 Construction
Ostalo 91 835 755 156 4 683 170 Other
Promet 2 107 9 024 10 440 3 402 867 6 490 4 953 Transport
Željeznički promet 37 217 181 39 - 216 115 Railways
Cestovni promet 1 899 7 728 8 572 3 024 622 5 903 3 759 Road transport
Zračni promet 127 732 1 454 190 245 333 913 Air transport
Pomorski i riječni promet 42 3 187 - - 3 135 Inland navigation
Cjevovodi 3 270 45 149 - 34 - Pipeline transport
Ostalo - 74 - - - - 32 Other
Opća potrošnja 3 388 9 310 13 521 3 392 583 10 308 6 966 Households, commerce, public authorities etc.
Kućanstva 2 415 6 155 8 163 2 195 317 6 685 4 297 Households
Usluge 743 2 639 4 606 992 207 2 943 1 904 Services
Poljoprivreda 231 516 722 186 43 608 758 Agriculture
Ostalo - - 30 19 16 72 7 Other
Statističke razlike - 9 52 -461 -10 540 -3 Statistical differences

STATISTIČKA IZVJEŠĆA 1614/2018. STATISTICAL REPORTS 41
3.3. STATISTIČKA ENERGETSKA BILANCA PO ZEMLJAMA ČLANICAMA EUROPSKE UNIJE ZA 2015. STATISTICAL ENERGY BALANCE, BY EU MEMBER STATES, 2015 (nastavak) tis. tona ekvivalentne nafte (continued) '000 toe
Estonija Estonia
Finska Finland
FrancuskaFrance
Grčka Greece
Irska Ireland
Italija Italy
Letonija Latvia
Primarna proizvodnja 5 600 17 538 137 527 8 473 1 929 36 134 2 338 Primary production
Proizvodi primarne proizvodnje1) 83 - 277 - 44 - - Primary production receipt1)
Povratni proizvodi 867 247 487 20 43 - - Recovered products
Reciklirani proizvodi - 14 92 16 - - 7 Recycled products
Uvoz 2 589 23 382 149 150 35 286 14 579 151 070 4 504 Imports
Saldo skladišta -361 -112 643 -1 067 -334 104 -82 Stock change
Izvoz 2 106 7 470 32 727 16 474 1 867 29 240 2 134 Exports
Bunker brodova 289 294 1 618 1 783 158 1 900 253 Bunkers
Direktna potrošnja 86 27 749 20 43 - - Direct use
Ukupna potrošnja 6 297 33 279 253 083 24 449 14 193 156 169 4 380 Gross inland consumption
Energija za transformacije 4 170 28 653 191 280 36 599 7 333 124 221 1 194 Transformation input
Termoelektrane 2 690 6 354 11 108 7 924 3 799 46 778 974 Thermal power stations
Nuklearne elektrane - 5 996 112 836 - - - - Nuclear power stations
Javne kotlovnice 302 1 462 2 299 - - 128 203 District heating plants
Koksare 9 857 3 146 - - 1 593 - Coke-oven plants
Visoke peći - 360 1 201 - - 546 - Blast-furnace plants
Gradske plinare 156 - - - - - - Gas works
Rafinerije - 13 214 60 684 28 672 3 427 75 162 - Refineries
Ostalo 1 014 410 6 3 107 15 17 Other
Proizvodnja transformirane energije 1 476 22 883 110 064 31 920 5 279 99 363 919 Transformation output
Termoelektrane 1 100 5 056 5 770 3 249 1 781 22 138 756 Thermal power stations
Nuklearne elektrane - 1 999 37 612 - - - - Nuclear power stations
Javne kotlovnice 238 1 437 1 938 - - 89 155 District heating plants
Koksare 5 822 2 870 - - 1 439 - Coke-oven plants
Visoke peći - 360 1 201 - - 546 - Blast-furnace plants
Gradske plinare 127 - - - - - - Gas works
Rafinerije - 13 210 60 673 28 670 3 427 75 144 - Refineries
Ostalo 4 - - 1 71 7 8 Other
Promjene i transferi, povrat - 13 -26 -3 1 -46 - Exchanges and transfers, returns
Transferi među proizvodima - 3 -15 -2 1 - - Interproduct transfers
Rafinerijske sirovine - 23 37 -2 - - - Product transferred
Povrat od petrokemijske industrije - -13 -49 - - -46 - Returns from petrochemical industry
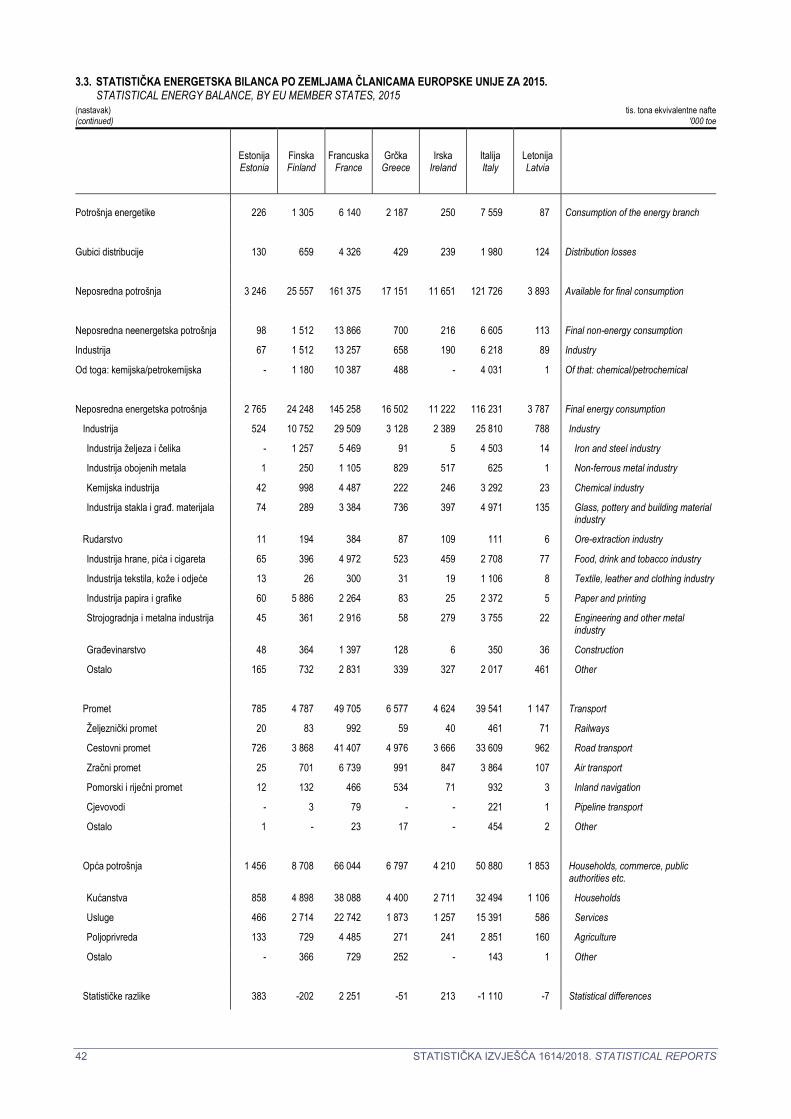
42 STATISTIČKA IZVJEŠĆA 1614/2018. STATISTICAL REPORTS
3.3. STATISTIČKA ENERGETSKA BILANCA PO ZEMLJAMA ČLANICAMA EUROPSKE UNIJE ZA 2015. STATISTICAL ENERGY BALANCE, BY EU MEMBER STATES, 2015 (nastavak) tis. tona ekvivalentne nafte (continued) '000 toe
Estonija Estonia
Finska Finland
FrancuskaFrance
Grčka Greece
Irska Ireland
Italija Italy
Letonija Latvia
Potrošnja energetike 226 1 305 6 140 2 187 250 7 559 87 Consumption of the energy branch
Gubici distribucije 130 659 4 326 429 239 1 980 124 Distribution losses
Neposredna potrošnja 3 246 25 557 161 375 17 151 11 651 121 726 3 893 Available for final consumption
Neposredna neenergetska potrošnja 98 1 512 13 866 700 216 6 605 113 Final non-energy consumption
Industrija 67 1 512 13 257 658 190 6 218 89 Industry
Od toga: kemijska/petrokemijska - 1 180 10 387 488 - 4 031 1 Of that: chemical/petrochemical
Neposredna energetska potrošnja 2 765 24 248 145 258 16 502 11 222 116 231 3 787 Final energy consumption
Industrija 524 10 752 29 509 3 128 2 389 25 810 788 Industry
Industrija željeza i čelika - 1 257 5 469 91 5 4 503 14 Iron and steel industry
Industrija obojenih metala 1 250 1 105 829 517 625 1 Non-ferrous metal industry
Kemijska industrija 42 998 4 487 222 246 3 292 23 Chemical industry
Industrija stakla i građ. materijala 74 289 3 384 736 397 4 971 135 Glass, pottery and building material industry
Rudarstvo 11 194 384 87 109 111 6 Ore-extraction industry
Industrija hrane, pića i cigareta 65 396 4 972 523 459 2 708 77 Food, drink and tobacco industry
Industrija tekstila, kože i odjeće 13 26 300 31 19 1 106 8 Textile, leather and clothing industry
Industrija papira i grafike 60 5 886 2 264 83 25 2 372 5 Paper and printing
Strojogradnja i metalna industrija 45 361 2 916 58 279 3 755 22 Engineering and other metal industry
Građevinarstvo 48 364 1 397 128 6 350 36 Construction
Ostalo 165 732 2 831 339 327 2 017 461 Other
Promet 785 4 787 49 705 6 577 4 624 39 541 1 147 Transport
Željeznički promet 20 83 992 59 40 461 71 Railways
Cestovni promet 726 3 868 41 407 4 976 3 666 33 609 962 Road transport
Zračni promet 25 701 6 739 991 847 3 864 107 Air transport
Pomorski i riječni promet 12 132 466 534 71 932 3 Inland navigation
Cjevovodi - 3 79 - - 221 1 Pipeline transport
Ostalo 1 - 23 17 - 454 2 Other
Opća potrošnja 1 456 8 708 66 044 6 797 4 210 50 880 1 853 Households, commerce, public authorities etc.
Kućanstva 858 4 898 38 088 4 400 2 711 32 494 1 106 Households
Usluge 466 2 714 22 742 1 873 1 257 15 391 586 Services
Poljoprivreda 133 729 4 485 271 241 2 851 160 Agriculture
Ostalo - 366 729 252 - 143 1 Other
Statističke razlike 383 -202 2 251 -51 213 -1 110 -7 Statistical differences

STATISTIČKA IZVJEŠĆA 1614/2018. STATISTICAL REPORTS 43
3.3. STATISTIČKA ENERGETSKA BILANCA PO ZEMLJAMA ČLANICAMA EUROPSKE UNIJE ZA 2015. STATISTICAL ENERGY BALANCE, BY EU MEMBER STATES, 2015 (nastavak) tis. tona ekvivalentne nafte (continued) '000 toe
Litva Lithuania
Luksemburg Luxemburg
MađarskaHungary
Malta Malta
NizozemskaNetherlands
NjemačkaGermany
Poljska Poland
Primarna proizvodnja 1 585 149 11 196 15 47 917 119 623 67 556 Primary production
Proizvodi primarne proizvodnje1) - - - - 3 670 3 543 - Primary production receipt1)
Povratni proizvodi 16 5 94 1 166 59 1 031 Recovered products
Reciklirani proizvodi 8 - - - 377 456 54 Recycled products
Uvoz 14 370 4 200 17 895 2 762 222 646 255 674 49 141 Imports
Saldo skladišta -85 18 520 47 -4 805 363 -724 Stock change
Izvoz 8 888 192 4 464 531 176 564 59 745 21 123 Exports
Bunker brodova 76 - - 1 537 12 335 2 398 193 Bunkers
Direktna potrošnja 16 - 57 1 3 705 3 606 116 Direct use
Ukupna potrošnja 6 913 4 180 25 184 757 77 368 313 971 95 626 Gross inland consumption
Energija za transformacije 10 392 238 16 847 264 86 130 234 012 77 862 Transformation input
Termoelektrane 756 228 3 322 264 19 771 89 509 36 723 Thermal power stations
Nuklearne elektrane - - 4 104 - 1 052 23 677 - Nuclear power stations
Javne kotlovnice 557 6 783 - 540 4 143 2 660 District heating plants
Koksare - - 950 - 2 032 8 504 9 205 Coke-oven plants
Visoke peći - - 168 - 877 4 486 795 Blast-furnace plants
Gradske plinare - - - - - - - Gas works
Rafinerije 9 077 - 7 381 - 61 598 100 078 27 681 Refineries
Ostalo 3 5 141 - 260 3 615 797 Other
Proizvodnja transformirane energije 10 329 145 12 202 104 76 355 169 538 56 936 Transformation output
Termoelektrane 717 140 1 631 104 11 234 43 272 17 492 Thermal power stations
Nuklearne elektrane - - 1 381 - 351 7 892 - Nuclear power stations
Javne kotlovnice 534 5 751 - 452 3 106 2 264 District heating plants
Koksare - - 892 - 1 852 7 577 8 710 Coke-oven plants
Visoke peći - - 168 - 877 4 486 795 Blast-furnace plants
Gradske plinare - - - - - - - Gas works
Rafinerije 9 075 - 7 378 - 61 590 100 026 27 674 Refineries
Ostalo 3 - - - - 3 180 2 Other
Promjene i transferi, povrat -9 - 5 - 2 241 56 40 Exchanges and transfers, returns
Transferi među proizvodima -9 - 23 - -289 63 - Interproduct transfers
Rafinerijske sirovine - - -4 - 211 119 2 Product transferred
Povrat od petrokemijske industrije - - -13 - 2 318 -126 38 Returns from petrochemical industry

44 STATISTIČKA IZVJEŠĆA 1614/2018. STATISTICAL REPORTS
3.3. STATISTIČKA ENERGETSKA BILANCA PO ZEMLJAMA ČLANICAMA EUROPSKE UNIJE ZA 2015. STATISTICAL ENERGY BALANCE, BY EU MEMBER STATES, 2015 (nastavak) tis. tona ekvivalentne nafte (continued) '000 toe
Litva Lithuania
Luksemburg Luxemburg
MađarskaHungary
Malta Malta
NizozemskaNetherlands
NjemačkaGermany
Poljska Poland
Potrošnja energetike 668 47 961 5 5 161 12 835 6 469 Consumption of the energy branch
Gubici distribucije 188 19 516 15 539 3 821 1 537 Distribution losses
Neposredna potrošnja 5 985 4 021 19 066 576 64 134 232 898 66 735 Available for final consumption
Neposredna neenergetska potrošnja 1 116 32 1 905 6 12 970 21 266 5 663 Final non-energy consumption
Industrija 1 097 26 1 842 6 12 879 20 569 5 213 Industry
Od toga: kemijska/petrokemijska 1 007 - 1 715 - 12 597 17 193 4 121 Of that: chemical/petrochemical
Neposredna energetska potrošnja 4 869 3 992 17 381 572 48 500 212 124 62 333 Final energy consumption
Industrija 983 638 4 244 46 14 272 60 951 15 043 Industry
Industrija željeza i čelika 2 277 584 - 2 405 13 574 2 662 Iron and steel industry
Industrija obojenih metala - - 113 - 241 2 312 433 Non-ferrous metal industry
Kemijska industrija 358 52 1 096 4 6 565 14 717 2 546 Chemical industry
Industrija stakla i građ. materijala 147 149 488 1 562 6 485 2 577 Glass, pottery and building material industry
Rudarstvo 5 2 24 - 127 362 393 Ore-extraction industry
Industrija hrane, pića i cigareta 186 21 586 5 2 072 4 886 1 857 Food, drink and tobacco industry
Industrija tekstila, kože i odjeće 31 36 41 3 89 515 116 Textile, leather and clothing industry
Industrija papira i grafike 27 5 191 2 560 5 672 1 568 Paper and printing
Strojogradnja i metalna industrija 26 11 597 12 593 8 009 1 143 Engineering and other metal industry
Građevinarstvo 38 23 209 2 573 - 157 Construction
Ostalo 162 63 316 17 484 4 419 1 593 Other
Promet 1 832 2 419 4 356 311 14 254 63 168 17 210 Transport
Željeznički promet 54 16 140 - 167 1 288 325 Railways
Cestovni promet 1 661 1 946 4 005 180 9 866 52 430 15 847 Road transport
Zračni promet 82 458 175 117 3 837 8 741 668 Air transport
Pomorski i riječni promet 5 - 6 14 384 319 2 Inland navigation
Cjevovodi 24 - 30 - - 250 369 Pipeline transport
Ostalo 6 - - - - 141 - Other
Opća potrošnja 2 054 934 8 781 215 19 974 88 004 30 079 Households, commerce, public authorities etc.
Kućanstva 1 365 508 5 970 78 9 557 53 171 18 917 Households
Usluge 577 403 2 204 126 6 555 34 716 7 829 Services
Poljoprivreda 100 24 579 8 3 768 - 3 333 Agriculture
Ostalo 12 - 29 2 95 118 - Other
Statističke razlike - -4 -219 -3 2 664 -492 -1 261 Statistical differences

STATISTIČKA IZVJEŠĆA 1614/2018. STATISTICAL REPORTS 45
3.3. STATISTIČKA ENERGETSKA BILANCA PO ZEMLJAMA ČLANICAMA EUROPSKE UNIJE ZA 2015. STATISTICAL ENERGY BALANCE, BY EU MEMBER STATES, 2015 (nastavak) tis. tona ekvivalentne nafte (continued) '000 toe
Portugal Portugal
Rumunjska Romania
Slovačka Slovakia
Slovenija Slovenia
ŠpanjolskaSpain
Švedska Sweden
Ujedinjena Kraljevina
United Kingdom
Primarna proizvodnja 5 304 26 656 6 320 3 387 33 440 33 589 117 810 Primary production
Proizvodi primarne proizvodnje1) - - - - - - - Primary production receipt1)
Povratni proizvodi 201 88 415 4 162 140 76 Recovered products
Reciklirani proizvodi - - - - - - - Recycled products
Uvoz 26 069 11 635 15 344 5 757 124 531 32 634 143 672 Imports
Saldo skladišta -139 188 90 10 972 -444 3 943 Stock change
Izvoz 7 769 6 093 5 702 2 524 30 102 18 410 71 090 Exports
Bunker brodova 642 45 - 62 7 423 1 814 2 511 Bunkers
Direktna potrošnja - - 42 4 162 133 - Direct use
Ukupna potrošnja 23 023 32 430 16 426 6 568 121 418 45 561 191 900 Gross inland consumption
Energija za transformacije 22 355 23 329 15 066 2 671 110 683 43 458 129 709 Transformation input
Termoelektrane 6 654 7 655 2 147 1 170 27 870 5 139 42 035 Thermal power stations
Nuklearne elektrane - 3 003 3 954 1 457 14 782 14 535 18 146 Nuclear power stations
Javne kotlovnice - 477 326 44 - 1 198 2 258 District heating plants
Koksare - - 1 517 - 1 416 1 133 2 685 Coke-oven plants
Visoke peći - 244 577 - 568 319 1 215 Blast-furnace plants
Gradske plinare - - - - - 7 - Gas works
Rafinerije 15 443 11 850 6 367 - 65 915 21 128 63 085 Refineries
Ostalo 257 101 178 - 132 - 285 Other
Proizvodnja transformirane energije 18 516 17 384 11 196 1 130 84 412 32 860 92 606 Transformation output
Termoelektrane 3 067 3 975 1 154 606 11 587 4 351 18 201 Thermal power stations
Nuklearne elektrane - 1 001 1 349 486 4 927 4 845 6 049 Nuclear power stations
Javne kotlovnice - 315 286 38 - 1 227 1 412 District heating plants
Koksare - - 1 464 - 1 404 1 004 2 494 Coke-oven plants
Visoke peći - 244 577 - 568 319 1 215 Blast-furnace plants
Gradske plinare - - - - - - - Gas works
Rafinerije 15 443 11 850 6 366 - 65 899 21 115 63 073 Refineries
Ostalo 6 - - - 26 - 162 Other
Promjene i transferi, povrat -8 -3 -10 - 140 178 12 Exchanges and transfers, returns
Transferi među proizvodima - - - - 123 -5 13 Interproduct transfers
Rafinerijske sirovine -2 - - - 19 183 39 Product transferred
Povrat od petrokemijske industrije -6 -3 -10 - -2 - -39 Returns from petrochemical industry

46 STATISTIČKA IZVJEŠĆA 1614/2018. STATISTICAL REPORTS
3.3. STATISTIČKA ENERGETSKA BILANCA PO ZEMLJAMA ČLANICAMA EUROPSKE UNIJE ZA 2015. STATISTICAL ENERGY BALANCE, BY EU MEMBER STATES, 2015 (nastavak) tis. tona ekvivalentne nafte (continued) '000 toe
Portugal Portugal
Rumunjska Romania
Slovačka Slovakia
Slovenija Slovenia
ŠpanjolskaSpain
Švedska Sweden
Ujedinjena Kraljevina
United Kingdom
Potrošnja energetike 1 413 2 347 1 020 109 9 611 1 632 11 555 Consumption of the energy branch
Gubici distribucije 429 1 077 363 103 2 570 756 3 173 Distribution losses
Neposredna potrošnja 17 335 23 057 11 162 4 816 83 105 32 753 140 081 Available for final consumption
Neposredna neenergetska potrošnja 1 335 1 126 1 047 126 4 310 1 774 7 429 Final non-energy consumption
Industrija 1 300 1 066 961 119 4 111 1 726 7 181 Industry
Od toga: kemijska/petrokemijska 1 098 355 782 9 2 912 1 290 4 630 Of that: chemical/petrochemical
Neposredna energetska potrošnja 16 038 21 892 10 077 4 685 80 379 31 710 132 306 Final energy consumption
Industrija 4 451 6 472 4 427 1 227 18 911 11 527 25 463 Industry
Industrija željeza i čelika 178 1 825 2 091 143 3 067 1 547 3 688 Iron and steel industry
Industrija obojenih metala 29 - 256 158 1 090 317 535 Non-ferrous metal industry
Kemijska industrija 380 1 419 352 160 2 888 661 3 208 Chemical industry
Industrija stakla i građ. materijala 1 124 940 438 180 3 312 353 2 397 Glass, pottery and building material industry
Rudarstvo 100 35 8 17 404 513 9 Ore-extraction industry
Industrija hrane, pića i cigareta 447 559 133 67 2 267 360 2 631 Food, drink and tobacco industry
Industrija tekstila, kože i odjeće 300 171 28 21 318 23 662 Textile, leather and clothing industry
Industrija papira i grafike 1 351 123 527 166 1 684 5 819 2 036 Paper and printing
Strojogradnja i metalna industrija 223 578 371 168 1 406 537 3 087 Engineering and other metal industry
Građevinarstvo 149 390 28 26 910 104 541 Construction
Ostalo 169 432 192 122 1 568 1 293 6 669 Other
Promet 6 613 5 577 2 212 1 799 33 611 8 613 51 640 Transport
Željeznički promet 36 200 44 25 327 225 986 Railways
Cestovni promet 5 305 5 058 1 990 1 746 26 916 7 450 38 181 Road transport
Zračni promet 1 172 272 43 27 5 643 872 11 903 Air transport
Pomorski i riječni promet 99 44 - - 445 66 569 Inland navigation
Cjevovodi 1 3 85 - - - - Pipeline transport
Ostalo - - 51 1 280 - - Other
Opća potrošnja 4 974 9 844 3 438 1 659 27 857 11 570 55 203 Households, commerce, public authorities etc.
Kućanstva 2 539 7 375 1 988 1 111 14 876 7 197 36 931 Households
Usluge 1 960 1 762 1 300 454 10 018 4 005 16 159 Services
Poljoprivreda 441 459 150 74 2 498 367 1 026 Agriculture
Ostalo 35 248 - 20 465 - 1 087 Other
Statističke razlike -38 39 38 5 -1 585 -731 347 Statistical differences
Izvor/ Source: EUROSTAT – ENERGY BALANCE SHEETS 2015 – 2016

STATISTIČKA IZVJEŠĆA 1614/2018. STATISTICAL REPORTS 47
3.4. STATISTIČKA ENERGETSKA BILANCA PO ZEMLJAMA ČLANICAMA EUROPSKE UNIJE ZA 2016. STATISTICAL ENERGY BALANCE, BY EU MEMBER STATES, 2016
tis. tona ekvivalentne nafte '000 toe
Republika Hrvatska
Republic of Croatia
Austrija Austria
Belgija Belgium
BugarskaBulgaria
Cipar Cyprus
Češka Czech
Republic
Danska Denmark
Primarna proizvodnja 4 409 12 349 14 969 11 218 129 27 159 14 949 Primary production
Proizvodi primarne proizvodnje1) - - 1 236 - - - - Primary production receipt1)
Povratni proizvodi 86 - 8 224 - 193 18 Recovered products
Reciklirani proizvodi - - 27 14 5 20 - Recycled products
Uvoz 7 447 31 606 79 391 12 466 2 637 21 582 18 177 Imports
Saldo skladišta -12 376 424 -22 -29 795 600 Stock change
Izvoz 3 341 10 447 30 672 5 699 17 7 900 15 655 Exports
Bunker brodova 5 18 6 663 78 282 - 668 Bunkers
Direktna potrošnja - - 1 268 -5 - 41 1 Direct use
Ukupna potrošnja 8 585 33 865 57 451 18 128 2 442 41 807 17 422 Gross inland consumption
Energija za transformacije 5 113 16 058 53 115 18 627 1 011 30 210 14 826 Transformation input
Termoelektrane 1 158 4 385 6 181 6 437 1 007 14 227 4 476 Thermal power stations
Nuklearne elektrane - - 11 227 4 084 - 6 239 - Nuclear power stations
Javne kotlovnice 67 1 047 3 235 - 712 1 048 District heating plants
Koksare - 1 243 1 143 - - 2 080 - Coke-oven plants
Visoke peći - 779 646 - - 630 - Blast-furnace plants
Gradske plinare - - - - - 537 14 Gas works
Rafinerije 3 788 8 601 33 915 7 045 - 5 720 9 288 Refineries
Ostalo 101 3 - 825 4 67 - Other
Proizvodnja transformirane energije 4 467 14 254 43 024 12 077 391 18 553 14 011 Transformation output
Termoelektrane 620 2 834 3 641 2 788 389 6 975 3 635 Thermal power stations
Nuklearne elektrane - - 3 742 1 371 - 2 094 - Nuclear power stations
Javne kotlovnice 55 869 2 251 - 661 1 090 District heating plants
Koksare - 1 171 1 081 - - 2 056 - Coke-oven plants
Visoke peći - 779 646 - - 630 - Blast-furnace plants
Gradske plinare - - - - - 364 - Gas works
Rafinerije 3 786 8 599 33 912 7 037 - 5 717 9 287 Refineries
Ostalo 6 1 - 630 1 56 - Other
Promjene i transferi, povrat 1 6 70 -7 - 3 30 Exchanges and transfers, returns
Transferi među proizvodima 1 - -21 - - -1 -1 Interproduct transfers
Rafinerijske sirovine - 6 145 -7 - 3 31 Product transferred
Povrat od petrokemijske industrije - - -54 - - 1 - Returns from petrochemical industry
1) Svi proizvodi koji nisu dobiveni u procesu proizvodnje u rafineriji ili degazolinažom
1) All products that are not obtained in the process of production at the refinery or NGL plants.

48 STATISTIČKA IZVJEŠĆA 1614/2018. STATISTICAL REPORTS
3.4. STATISTIČKA ENERGETSKA BILANCA PO ZEMLJAMA ČLANICAMA EUROPSKE UNIJE ZA 2016. STATISTICAL ENERGY BALANCE, BY EU MEMBER STATES, 2016 (nastavak) tis. tona ekvivalentne nafte (continued) '000 toe
Republika Hrvatska
Republic of Croatia
Austrija Austria
Belgija Belgium
BugarskaBulgaria
Cipar Cyprus
Češka Czech
Republic
Danska Denmark
Potrošnja energetike 565 1 275 2 302 1 114 19 2 213 1 108 Consumption of the energy branch
Gubici distribucije 220 633 366 469 23 702 810 Distribution losses
Neposredna potrošnja 7 155 30 158 44 762 9 988 1 781 27 239 14 718 Available for final consumption
Neposredna neenergetska potrošnja 516 2 027 8 458 496 39 1 764 249 Final non-energy consumption
Industrija 497 1 972 8 216 438 38 1 215 208 Industry
Od toga: kemijska/petrokemijska 391 1 507 7 582 330 - 1 096 1 Of that: chemical/petrochemical
Neposredna energetska potrošnja 6 639 28 128 36 333 9 663 1 758 24 881 14 449 Final energy consumption
Industrija 1 087 9 445 12 209 2 641 213 7 417 2 144 Industry
Industrija željeza i čelika 6 2 438 2 506 111 - 1 877 83 Iron and steel industry
Industrija obojenih metala 7 246 285 130 2 86 - Non-ferrous metal industry
Kemijska industrija 151 953 4 331 836 6 955 255 Chemical industry
Industrija stakla i građ. materijala 317 957 1 377 560 148 1 131 459 Glass, pottery and building material industry
Rudarstvo 14 136 48 117 5 83 75 Ore-extraction industry
Industrija hrane, pića i cigareta 208 806 1 502 237 32 576 603 Food, drink and tobacco industry
Industrija tekstila, kože i odjeće 26 70 188 67 - 176 17 Textile, leather and clothing industry
Industrija papira i grafike 76 1 685 708 242 2 593 74 Paper and printing
Strojogradnja i metalna industrija 86 754 416 150 2 1 135 237 Engineering and other metal industry
Građevinarstvo 97 539 200 61 10 199 161 Construction
Ostalo 98 861 649 129 5 607 179 Other
Promet 2 163 9 187 10 514 3 492 931 6 734 5 110 Transport
Željeznički promet 37 215 184 37 - 219 117 Railways
Cestovni promet 1 946 7 841 8 667 3 077 654 6 143 3 823 Road transport
Zračni promet 134 794 1 440 232 277 359 981 Air transport
Pomorski i riječni promet 43 3 186 - - 4 153 Inland navigation
Cjevovodi 3 258 36 146 - 8 - Pipeline transport
Ostalo - 77 1 - - - 36 Other
Opća potrošnja 3 389 9 496 13 610 3 529 614 10 730 7 196 Households, commerce, public authorities etc.
Kućanstva 2 393 6 324 8 135 2 254 326 6 992 4 463 Households
Usluge 763 2 652 4 656 1 075 225 3 054 1 975 Services
Poljoprivreda 233 520 773 185 46 641 753 Agriculture
Ostalo - - 46 15 16 43 5 Other
Statističke razlike - 4 -29 -170 -17 594 19 Statistical differences
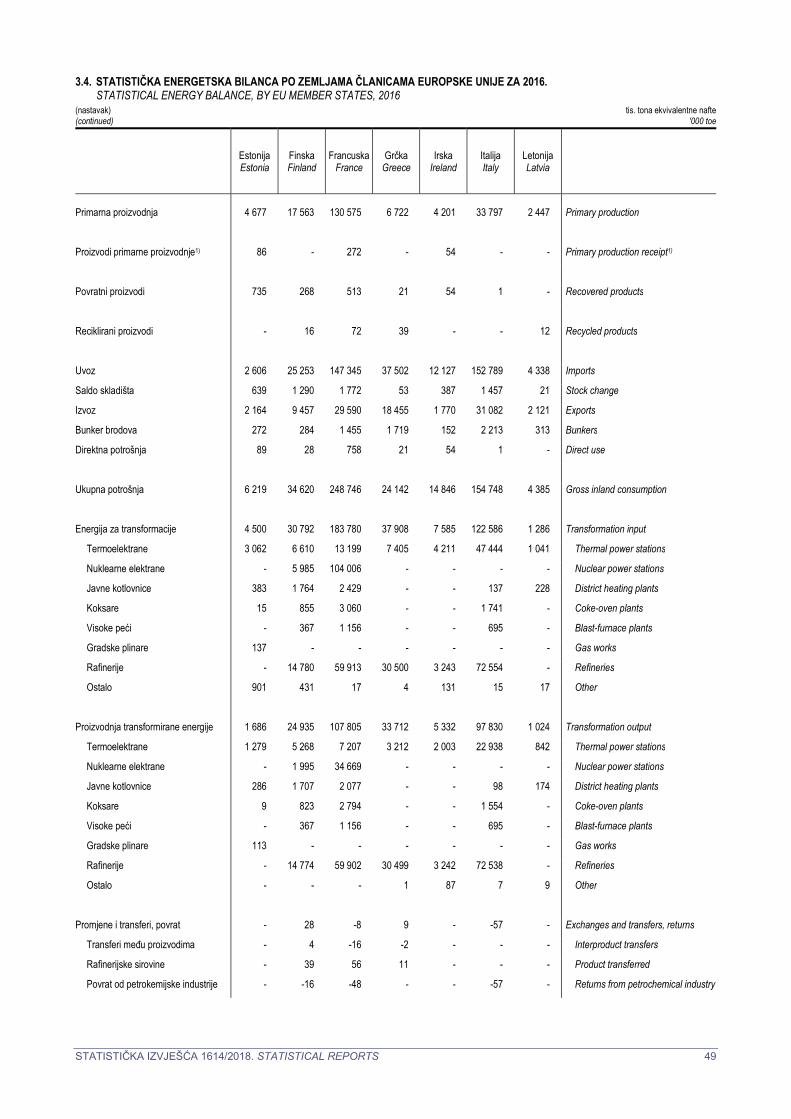
STATISTIČKA IZVJEŠĆA 1614/2018. STATISTICAL REPORTS 49
3.4. STATISTIČKA ENERGETSKA BILANCA PO ZEMLJAMA ČLANICAMA EUROPSKE UNIJE ZA 2016. STATISTICAL ENERGY BALANCE, BY EU MEMBER STATES, 2016 (nastavak) tis. tona ekvivalentne nafte (continued) '000 toe
Estonija Estonia
Finska Finland
FrancuskaFrance
Grčka Greece
Irska Ireland
Italija Italy
Letonija Latvia
Primarna proizvodnja 4 677 17 563 130 575 6 722 4 201 33 797 2 447 Primary production
Proizvodi primarne proizvodnje1) 86 - 272 - 54 - - Primary production receipt1)
Povratni proizvodi 735 268 513 21 54 1 - Recovered products
Reciklirani proizvodi - 16 72 39 - - 12 Recycled products
Uvoz 2 606 25 253 147 345 37 502 12 127 152 789 4 338 Imports
Saldo skladišta 639 1 290 1 772 53 387 1 457 21 Stock change
Izvoz 2 164 9 457 29 590 18 455 1 770 31 082 2 121 Exports
Bunker brodova 272 284 1 455 1 719 152 2 213 313 Bunkers
Direktna potrošnja 89 28 758 21 54 1 - Direct use
Ukupna potrošnja 6 219 34 620 248 746 24 142 14 846 154 748 4 385 Gross inland consumption
Energija za transformacije 4 500 30 792 183 780 37 908 7 585 122 586 1 286 Transformation input
Termoelektrane 3 062 6 610 13 199 7 405 4 211 47 444 1 041 Thermal power stations
Nuklearne elektrane - 5 985 104 006 - - - - Nuclear power stations
Javne kotlovnice 383 1 764 2 429 - - 137 228 District heating plants
Koksare 15 855 3 060 - - 1 741 - Coke-oven plants
Visoke peći - 367 1 156 - - 695 - Blast-furnace plants
Gradske plinare 137 - - - - - - Gas works
Rafinerije - 14 780 59 913 30 500 3 243 72 554 - Refineries
Ostalo 901 431 17 4 131 15 17 Other
Proizvodnja transformirane energije 1 686 24 935 107 805 33 712 5 332 97 830 1 024 Transformation output
Termoelektrane 1 279 5 268 7 207 3 212 2 003 22 938 842 Thermal power stations
Nuklearne elektrane - 1 995 34 669 - - - - Nuclear power stations
Javne kotlovnice 286 1 707 2 077 - - 98 174 District heating plants
Koksare 9 823 2 794 - - 1 554 - Coke-oven plants
Visoke peći - 367 1 156 - - 695 - Blast-furnace plants
Gradske plinare 113 - - - - - - Gas works
Rafinerije - 14 774 59 902 30 499 3 242 72 538 - Refineries
Ostalo - - - 1 87 7 9 Other
Promjene i transferi, povrat - 28 -8 9 - -57 - Exchanges and transfers, returns
Transferi među proizvodima - 4 -16 -2 - - - Interproduct transfers
Rafinerijske sirovine - 39 56 11 - - - Product transferred
Povrat od petrokemijske industrije - -16 -48 - - -57 - Returns from petrochemical industry

50 STATISTIČKA IZVJEŠĆA 1614/2018. STATISTICAL REPORTS
3.4. STATISTIČKA ENERGETSKA BILANCA PO ZEMLJAMA ČLANICAMA EUROPSKE UNIJE ZA 2016. STATISTICAL ENERGY BALANCE, BY EU MEMBER STATES, 2016 (nastavak) tis. tona ekvivalentne nafte (continued) '000 toe
Estonija Estonia
Finska Finland
FrancuskaFrance
Grčka Greece
Irska Ireland
Italija Italy
Letonija Latvia
Potrošnja energetike 269 1 329 6 075 2 063 252 6 892 90 Consumption of the energy branch
Gubici distribucije 140 706 4 475 341 244 1 913 127 Distribution losses
Neposredna potrošnja 2 996 26 756 162 213 17 552 12 098 121 130 3 906 Available for final consumption
Neposredna neenergetska potrošnja 89 1 565 13 350 593 267 6 306 97 Final non-energy consumption
Industrija 44 1 565 12 728 551 240 5 929 63 Industry
Od toga: kemijska/petrokemijska - 1 224 9 735 341 - 4 053 1 Of that: chemical/petrochemical
Neposredna energetska potrošnja 2 818 25 249 147 159 16 703 11 610 115 931 3 820 Final energy consumption
Industrija 454 11 040 29 374 3 073 2 446 26 169 749 Industry
Industrija željeza i čelika - 1 239 5 252 131 - 4 759 2 Iron and steel industry
Industrija obojenih metala 2 251 1 101 776 492 655 1 Non-ferrous metal industry
Kemijska industrija 38 1 041 4 401 154 250 3 506 23 Chemical industry
Industrija stakla i građ. materijala 70 309 3 337 776 424 4 622 110 Glass, pottery and building material industry
Rudarstvo 12 201 378 80 105 122 6 Ore-extraction industry
Industrija hrane, pića i cigareta 67 410 4 744 445 461 2 824 79 Food, drink and tobacco industry
Industrija tekstila, kože i odjeće 11 23 290 41 14 1 099 8 Textile, leather and clothing industry
Industrija papira i grafike 62 6 060 2 369 48 26 2 314 5 Paper and printing
Strojogradnja i metalna industrija 48 375 2 947 45 329 3 828 23 Engineering and other metal industry
Građevinarstvo 60 387 1 526 129 6 355 35 Construction
Ostalo 83 743 3 030 447 338 2 086 457 Other
Promet 811 4 956 49 616 6 788 4 948 39 110 1 158 Transport
Željeznički promet 16 82 966 56 40 484 61 Railways
Cestovni promet 753 4 042 41 422 5 093 3 952 32 964 968 Road transport
Zračni promet 22 703 6 671 1 068 870 4 005 123 Air transport
Pomorski i riječni promet 19 125 459 557 86 959 4 Inland navigation
Cjevovodi - 3 79 - - 246 1 Pipeline transport
Ostalo 2 1 20 14 - 452 2 Other
Opća potrošnja 1 553 9 252 68 168 6 842 4 216 50 651 1 913 Households, commerce, public authorities etc.
Kućanstva 931 5 292 39 833 4 287 2 668 32 185 1 143 Households
Usluge 494 2 861 23 198 2 035 1 321 15 440 593 Services
Poljoprivreda 128 718 4 502 283 227 2 871 175 Agriculture
Ostalo - 381 635 236 - 155 2 Other
Statističke razlike 89 -58 1 705 256 221 -1 107 -11 Statistical differences

STATISTIČKA IZVJEŠĆA 1614/2018. STATISTICAL REPORTS 51
3.4. STATISTIČKA ENERGETSKA BILANCA PO ZEMLJAMA ČLANICAMA EUROPSKE UNIJE ZA 2016. STATISTICAL ENERGY BALANCE, BY EU MEMBER STATES, 2016 (nastavak) tis. tona ekvivalentne nafte (continued) '000 toe
Litva Lithuania
Luksemburg Luxemburg
MađarskaHungary
Malta Malta
NizozemskaNetherlands
NjemačkaGermany
Poljska Poland
Primarna proizvodnja 1 620 159 11 356 18 46 059 115 650 66 415 Primary production
Proizvodi primarne proizvodnje1) - - - - 4 400 3 349 - Primary production receipt1)
Povratni proizvodi 11 5 90 1 151 59 919 Recovered products
Reciklirani proizvodi 8 - - - 302 490 39 Recycled products
Uvoz 14 771 4 189 19 329 2 778 222 285 254 829 51 311 Imports
Saldo skladišta -4 -1 24 -39 2 644 708 2 524 Stock change
Izvoz 9 198 155 5 039 279 180 705 51 619 20 990 Exports
Bunker brodova 163 - - 1 752 12 236 2 803 183 Bunkers
Direktna potrošnja 11 - 55 1 4 373 3 395 105 Direct use
Ukupna potrošnja 7 034 4 197 25 705 726 78 528 317 268 99 930 Gross inland consumption
Energija za transformacije 11 164 150 16 933 173 85 988 236 159 76 966 Transformation input
Termoelektrane 621 138 3 521 173 20 043 91 066 36 297 Thermal power stations
Nuklearne elektrane - - 4 161 - 1 021 21 832 - Nuclear power stations
Javne kotlovnice 572 8 738 - 408 4 058 2 840 District heating plants
Koksare - - 931 - 1 980 9 060 9 098 Coke-oven plants
Visoke peći - - 116 - 851 4 351 728 Blast-furnace plants
Gradske plinare - - - - - - - Gas works
Rafinerije 9 967 - 7 326 - 61 460 102 175 27 272 Refineries
Ostalo 3 5 140 - 224 3 617 731 Other
Proizvodnja transformirane energije 11 172 98 12 187 63 76 021 172 339 56 637 Transformation output
Termoelektrane 624 92 1 797 63 11 205 44 383 17 536 Thermal power stations
Nuklearne elektrane - - 1 401 - 340 7 277 - Nuclear power stations
Javne kotlovnice 580 7 732 - 348 3 081 2 467 District heating plants
Koksare - - 817 - 1 827 8 062 8 643 Coke-oven plants
Visoke peći - - 116 - 851 4 351 728 Blast-furnace plants
Gradske plinare - - - - - - - Gas works
Rafinerije 9 965 - 7 325 - 61 450 102 118 27 261 Refineries
Ostalo 4 - - - - 3 066 1 Other
Promjene i transferi, povrat -9 - - - 2 521 53 31 Exchanges and transfers, returns
Transferi među proizvodima -9 - 9 - -195 43 - Interproduct transfers
Rafinerijske sirovine - - -2 - 248 130 2 Product transferred
Povrat od petrokemijske industrije - - -8 - 2 468 -120 29 Returns from petrochemical industry

52 STATISTIČKA IZVJEŠĆA 1614/2018. STATISTICAL REPORTS
3.4. STATISTIČKA ENERGETSKA BILANCA PO ZEMLJAMA ČLANICAMA EUROPSKE UNIJE ZA 2016. STATISTICAL ENERGY BALANCE, BY EU MEMBER STATES, 2016 (nastavak) tis. tona ekvivalentne nafte (continued) '000 toe
Litva Lithuania
Luksemburg Luxemburg
MađarskaHungary
Malta Malta
NizozemskaNetherlands
NjemačkaGermany
Poljska Poland
Potrošnja energetike 682 47 1 037 4 4 937 13 376 6 383 Consumption of the energy branch
Gubici distribucije 198 19 502 19 557 4 170 1 507 Distribution losses
Neposredna potrošnja 6 153 4 079 19 420 593 65 588 235 956 71 741 Available for final consumption
Neposredna neenergetska potrošnja 1 045 35 1 848 9 13 683 21 433 5 607 Final non-energy consumption
Industrija 1 026 27 1 796 9 13 580 20 717 5 134 Industry
Od toga: kemijska/petrokemijska 921 - 1 683 - 13 354 17 269 3 987 Of that: chemical/petrochemical
Neposredna energetska potrošnja 5 108 4 039 17 865 584 49 517 216 447 66 652 Final energy consumption
Industrija 989 672 4 257 45 14 657 61 123 15 620 Industry
Industrija željeza i čelika 2 293 448 - 2 410 13 069 2 640 Iron and steel industry
Industrija obojenih metala - - 117 - 259 2 349 437 Non-ferrous metal industry
Kemijska industrija 340 57 1 098 4 6 811 14 938 2 522 Chemical industry
Industrija stakla i građ. materijala 141 151 535 1 600 6 458 2 843 Glass, pottery and building material industry
Rudarstvo 5 2 24 - 116 377 411 Ore-extraction industry
Industrija hrane, pića i cigareta 191 23 585 5 2 099 5 065 1 959 Food, drink and tobacco industry
Industrija tekstila, kože i odjeće 35 37 43 2 96 474 123 Textile, leather and clothing industry
Industrija papira i grafike 31 6 205 2 573 5 542 1 637 Paper and printing
Strojogradnja i metalna industrija 31 12 632 11 625 8 274 1 150 Engineering and other metal industry
Građevinarstvo 39 24 234 2 603 - 167 Construction
Ostalo 174 67 339 17 465 4 576 1 731 Other
Promet 1 960 2 422 4 536 321 14 295 65 173 19 240 Transport
Željeznički promet 53 17 139 - 167 1 350 339 Railways
Cestovni promet 1 776 1 891 4 159 182 9 907 53 742 17 797 Road transport
Zračni promet 96 514 192 126 3 907 9 394 708 Air transport
Pomorski i riječni promet 4 - 4 13 315 269 2 Inland navigation
Cjevovodi 25 - 41 - - 283 395 Pipeline transport
Ostalo 6 - - - - 135 - Other
Opća potrošnja 2 159 945 9 072 218 20 564 90 152 31 792 Households, commerce, public authorities etc.
Kućanstva 1 440 490 6 157 81 9 855 56 046 19 747 Households
Usluge 605 431 2 231 124 6 807 34 000 8 505 Services
Poljoprivreda 106 24 650 9 3 868 - 3 540 Agriculture
Ostalo 8 - 35 3 34 106 - Other
Statističke razlike - 5 -293 - 2 388 -1 924 -517 Statistical differences

STATISTIČKA IZVJEŠĆA 1614/2018. STATISTICAL REPORTS 53
3.4. STATISTIČKA ENERGETSKA BILANCA PO ZEMLJAMA ČLANICAMA EUROPSKE UNIJE ZA 2016. STATISTICAL ENERGY BALANCE, BY EU MEMBER STATES, 2016 (nastavak) tis. tona ekvivalentne nafte (continued) '000 toe
Portugal Portugal
Rumunjska Romania
Slovačka Slovakia
Slovenija Slovenia
ŠpanjolskaSpain
Švedska Sweden
Ujedinjena Kraljevina
United Kingdom
Primarna proizvodnja 5 998 25 044 6 198 3 570 33 970 34 565 119 605 Primary production
Proizvodi primarne proizvodnje1) - - - - - - - Primary production receipt1)
Povratni proizvodi 190 102 389 2 179 156 148 Recovered products
Reciklirani proizvodi - - - - - - - Recycled products
Uvoz 25 543 13 440 15 007 6 231 124 069 35 956 138 214 Imports
Saldo skladišta 141 55 215 - 2 440 275 4 530 Stock change
Izvoz 7 977 6 208 5 264 2 886 30 843 19 583 70 393 Exports
Bunker brodova 630 31 - 118 7 461 1 989 2 665 Bunkers
Direktna potrošnja - - 34 2 179 149 - Direct use
Ukupna potrošnja 23 264 32 402 16 511 6 797 122 176 49 231 189 440 Gross inland consumption
Energija za transformacije 22 218 23 422 14 720 2 768 107 317 45 408 124 176 Transformation input
Termoelektrane 6 527 7 258 2 121 1 252 24 346 5 542 38 731 Thermal power stations
Nuklearne elektrane - 2 911 3 858 1 474 15 125 16 277 18 502 Nuclear power stations
Javne kotlovnice - 373 315 41 - 1 296 2 312 District heating plants
Koksare - - 1 518 - 1 434 1 097 1 342 Coke-oven plants
Visoke peći - 239 609 - 531 352 868 Blast-furnace plants
Gradske plinare - - - - - 7 - Gas works
Rafinerije 15 456 12 521 6 133 - 65 750 20 837 62 065 Refineries
Ostalo 235 120 166 - 132 - 356 Other
Proizvodnja transformirane energije 18 498 17 874 10 981 1 199 83 257 33 515 90 089 Transformation output
Termoelektrane 3 036 3 813 1 188 671 10 258 4 689 18 188 Thermal power stations
Nuklearne elektrane - 970 1 318 491 5 042 5 426 6 167 Nuclear power stations
Javne kotlovnice - 331 275 37 - 1 234 1 409 District heating plants
Koksare - - 1 460 - 1 668 994 1 233 Coke-oven plants
Visoke peći - 239 609 - 531 352 868 Blast-furnace plants
Gradske plinare - - - - - - - Gas works
Rafinerije 15 456 12 521 6 131 - 65 731 20 821 62 053 Refineries
Ostalo 6 - - - 26 - 171 Other
Promjene i transferi, povrat -8 -4 -10 - 149 189 -17 Exchanges and transfers, returns
Transferi među proizvodima - - - - 78 -22 7 Interproduct transfers
Rafinerijske sirovine -2 - - - 74 211 16 Product transferred
Povrat od petrokemijske industrije -7 -4 -10 - -3 - -40 Returns from petrochemical industry

54 STATISTIČKA IZVJEŠĆA 1614/2018. STATISTICAL REPORTS
3.4. STATISTIČKA ENERGETSKA BILANCA PO ZEMLJAMA ČLANICAMA EUROPSKE UNIJE ZA 2016. STATISTICAL ENERGY BALANCE, BY EU MEMBER STATES, 2016 (nastavak) tis. tona ekvivalentne nafte (continued) '000 toe
Portugal Portugal
Rumunjska Romania
Slovačka Slovakia
Slovenija Slovenia
ŠpanjolskaSpain
Švedska Sweden
Ujedinjena Kraljevina
United Kingdom
Potrošnja energetike 1 873 2 432 1 003 109 9 924 1 645 11 109 Consumption of the energy branch
Gubici distribucije 428 1 073 336 105 2 596 904 2 792 Distribution losses
Neposredna potrošnja 17 235 23 345 11 422 5 014 85 745 34 979 141 435 Available for final consumption
Neposredna neenergetska potrošnja 1 149 1 143 978 128 4 940 2 178 7 781 Final non-energy consumption
Industrija 1 114 1 078 882 122 4 672 2 109 7 594 Industry
Od toga: kemijska/petrokemijska 902 383 734 10 3 527 1 650 5 072 Of that: chemical/petrochemical
Neposredna energetska potrošnja 16 115 22 280 10 418 4 876 82 498 32 591 133 689 Final energy consumption
Industrija 4 332 6 318 4 450 1 242 18 972 11 431 24 253 Industry
Industrija željeza i čelika 187 1 742 2 132 150 3 222 1 520 2 734 Iron and steel industry
Industrija obojenih metala 27 - 258 160 1 140 324 527 Non-ferrous metal industry
Kemijska industrija 370 1 252 367 163 2 696 616 3 222 Chemical industry
Industrija stakla i građ. materijala 1 022 999 464 177 3 263 325 2 275 Glass, pottery and building material industry
Rudarstvo 60 38 10 17 441 528 9 Ore-extraction industry
Industrija hrane, pića i cigareta 457 571 136 65 2 384 370 2 652 Food, drink and tobacco industry
Industrija tekstila, kože i odjeće 290 150 27 21 368 25 632 Textile, leather and clothing industry
Industrija papira i grafike 1 367 137 459 167 1 645 5 731 2 082 Paper and printing
Strojogradnja i metalna industrija 213 573 387 172 1 405 541 3 113 Engineering and other metal industry
Građevinarstvo 160 352 30 29 972 115 551 Construction
Ostalo 179 506 181 122 1 436 1 337 6 455 Other
Promet 6 775 6 029 2 480 1 904 34 966 9 051 52 601 Transport
Željeznički promet 42 195 44 24 303 231 993 Railways
Cestovni promet 5 334 5 472 2 202 1 857 27 663 7 771 39 059 Road transport
Zračni promet 1 289 319 50 23 6 032 999 12 003 Air transport
Pomorski i riječni promet 109 41 - - 625 49 546 Inland navigation
Cjevovodi 1 3 135 - - - - Pipeline transport
Ostalo - - 49 1 342 - - Other
Opća potrošnja 5 008 9 933 3 488 1 730 28 560 12 109 56 834 Households, commerce, public authorities etc.
Kućanstva 2 621 7 415 2 030 1 148 15 063 7 462 38 054 Households
Usluge 1 938 1 806 1 309 492 10 625 4 303 16 522 Services
Poljoprivreda 422 454 148 73 2 648 344 1 163 Agriculture
Ostalo 28 259 - 17 224 - 1 095 Other
Statističke razlike -28 -78 26 10 -1 693 210 -35 Statistical differences
Izvor/ Source: EUROSTAT – ENERGY BALANCE SHEETS 2015 – 2016

4. FINALNA POTROŠNJA ENERGIJE U INDUSTRIJI PO PODRUČJIMA I ODJELJCIMA NKD-a 2007. U REPUBLICI HRVATSKOJ
FINAL ENERGY CONSUMPTION IN INDUSTRY, ACCORDING TO NKD 2007. SECTIONS AND DIVISIONS, REPUBLIC OF CROATIA

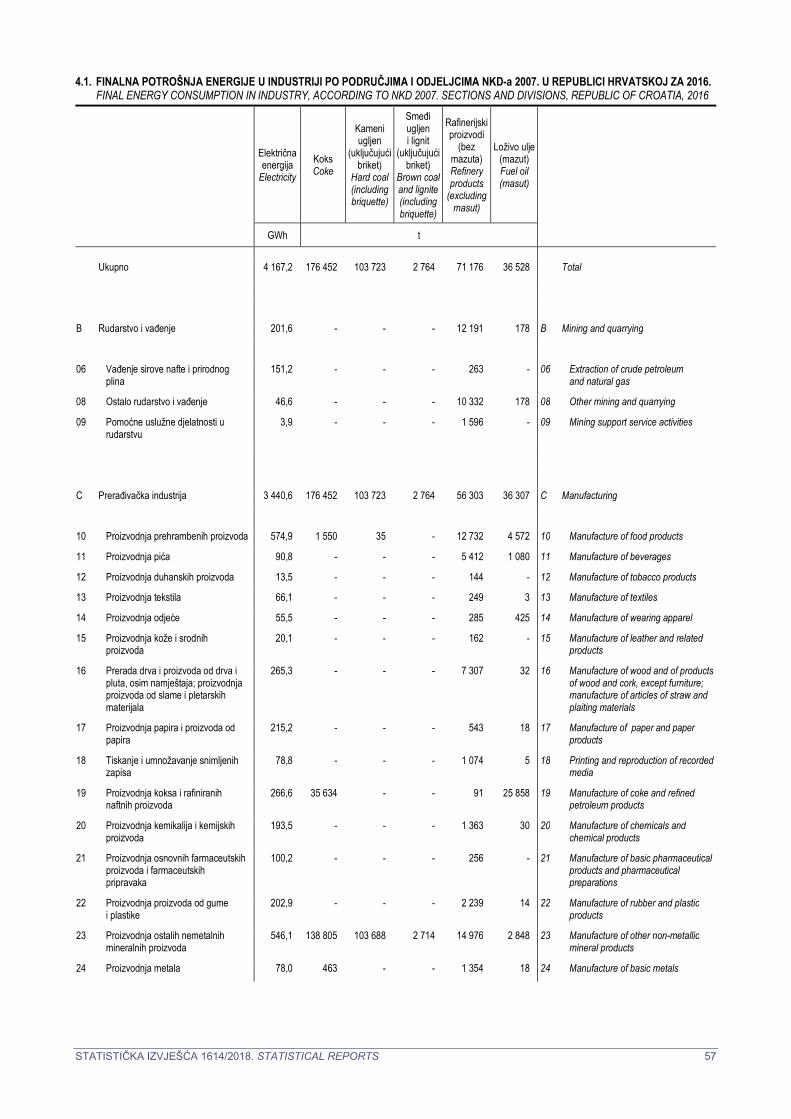
STATISTIČKA IZVJEŠĆA 1614/2018. STATISTICAL REPORTS 57
4.1. FINALNA POTROŠNJA ENERGIJE U INDUSTRIJI PO PODRUČJIMA I ODJELJCIMA NKD-a 2007. U REPUBLICI HRVATSKOJ ZA 2016. FINAL ENERGY CONSUMPTION IN INDUSTRY, ACCORDING TO NKD 2007. SECTIONS AND DIVISIONS, REPUBLIC OF CROATIA, 2016
Električna energija
Electricity Koks Coke
Kameniugljen
(uključujućibriket)
Hard coal(includingbriquette)
Smeđi ugljen i lignit
(uključujućibriket)
Brown coaland lignite(includingbriquette)
Rafinerijskiproizvodi
(bez mazuta) Refineryproducts
(excludingmasut)
Loživo ulje(mazut) Fuel oil(masut)
GWh t
Ukupno 4 167,2 176 452 103 723 2 764 71 176 36 528 Total
B Rudarstvo i vađenje 201,6 - - - 12 191 178 B Mining and quarrying
06 Vađenje sirove nafte i prirodnog plina
151,2 - - - 263 - 06 Extraction of crude petroleumand natural gas
08 Ostalo rudarstvo i vađenje 46,6 - - - 10 332 178 08 Other mining and quarrying
09 Pomoćne uslužne djelatnosti u rudarstvu
3,9 - - - 1 596 - 09 Mining support service activities
C Prerađivačka industrija 3 440,6 176 452 103 723 2 764 56 303 36 307 C Manufacturing
10 Proizvodnja prehrambenih proizvoda 574,9 1 550 35 - 12 732 4 572 10 Manufacture of food products
11 Proizvodnja pića 90,8 - - - 5 412 1 080 11 Manufacture of beverages
12 Proizvodnja duhanskih proizvoda 13,5 - - - 144 - 12 Manufacture of tobacco products
13 Proizvodnja tekstila 66,1 - - - 249 3 13 Manufacture of textiles
14 Proizvodnja odjeće 55,5 - - - 285 425 14 Manufacture of wearing apparel
15 Proizvodnja kože i srodnih proizvoda
20,1 - - - 162 - 15 Manufacture of leather and relatedproducts
16 Prerada drva i proizvoda od drva ipluta, osim namještaja; proizvodnja proizvoda od slame i pletarskih materijala
265,3 - - - 7 307 32 16 Manufacture of wood and of productsof wood and cork, except furniture; manufacture of articles of straw andplaiting materials
17 Proizvodnja papira i proizvoda od papira
215,2 - - - 543 18 17 Manufacture of paper and paper products
18 Tiskanje i umnožavanje snimljenihzapisa
78,8 - - - 1 074 5 18 Printing and reproduction of recordedmedia
19 Proizvodnja koksa i rafiniranih naftnih proizvoda
266,6 35 634 - - 91 25 858 19 Manufacture of coke and refinedpetroleum products
20 Proizvodnja kemikalija i kemijskihproizvoda
193,5 - - - 1 363 30 20 Manufacture of chemicals and chemical products
21 Proizvodnja osnovnih farmaceutskihproizvoda i farmaceutskih pripravaka
100,2 - - - 256 - 21 Manufacture of basic pharmaceuticalproducts and pharmaceutical preparations
22 Proizvodnja proizvoda od gume i plastike
202,9 - - - 2 239 14 22 Manufacture of rubber and plasticproducts
23 Proizvodnja ostalih nemetalnih mineralnih proizvoda
546,1 138 805 103 688 2 714 14 976 2 848 23 Manufacture of other non-metallicmineral products
24 Proizvodnja metala 78,0 463 - - 1 354 18 24 Manufacture of basic metals
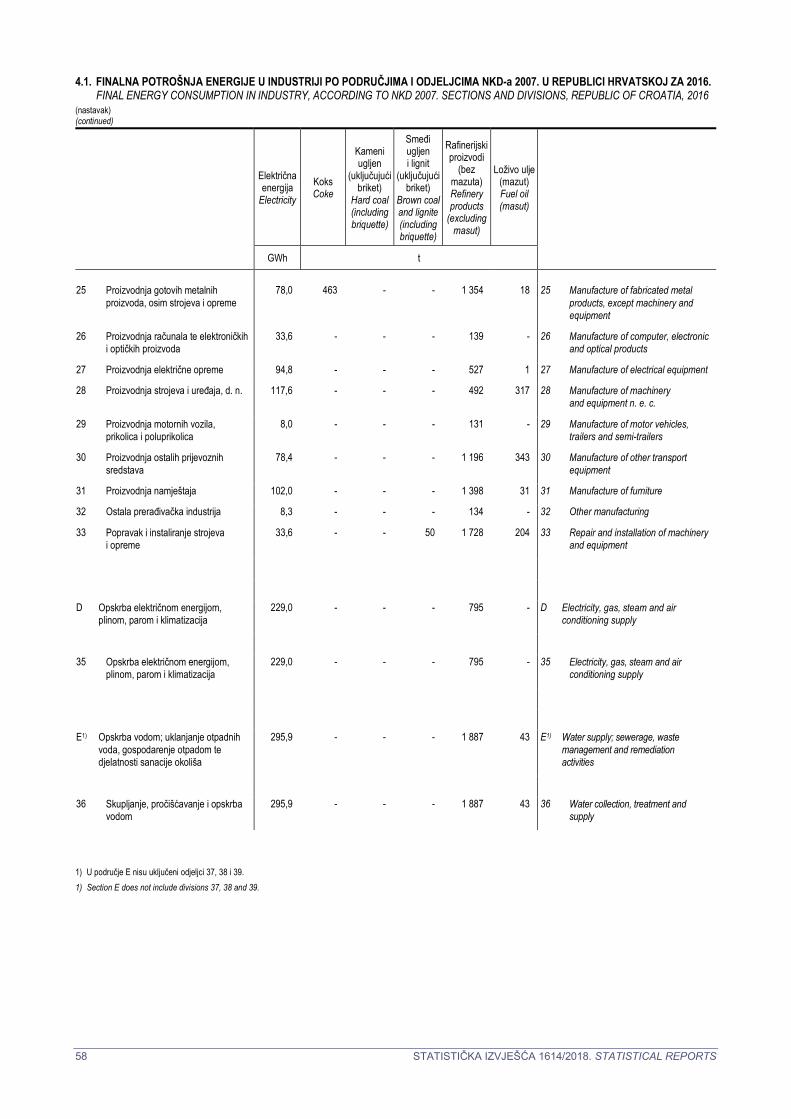
58 STATISTIČKA IZVJEŠĆA 1614/2018. STATISTICAL REPORTS
4.1. FINALNA POTROŠNJA ENERGIJE U INDUSTRIJI PO PODRUČJIMA I ODJELJCIMA NKD-a 2007. U REPUBLICI HRVATSKOJ ZA 2016. FINAL ENERGY CONSUMPTION IN INDUSTRY, ACCORDING TO NKD 2007. SECTIONS AND DIVISIONS, REPUBLIC OF CROATIA, 2016
(nastavak) (continued)
Električna energija
Electricity Koks Coke
Kameniugljen
(uključujućibriket)
Hard coal(includingbriquette)
Smeđi ugljen i lignit
(uključujućibriket)
Brown coaland lignite(includingbriquette)
Rafinerijskiproizvodi
(bez mazuta) Refineryproducts
(excludingmasut)
Loživo ulje(mazut) Fuel oil(masut)
GWh t
25 Proizvodnja gotovih metalnih
proizvoda, osim strojeva i opreme 78,0 463 - - 1 354 18 25 Manufacture of fabricated metal
products, except machinery and equipment
26 Proizvodnja računala te elektroničkihi optičkih proizvoda
33,6 - - - 139 - 26 Manufacture of computer, electronicand optical products
27 Proizvodnja električne opreme 94,8 - - - 527 1 27 Manufacture of electrical equipment
28 Proizvodnja strojeva i uređaja, d. n. 117,6 - - - 492 317 28 Manufacture of machinery and equipment n. e. c.
29 Proizvodnja motornih vozila, prikolica i poluprikolica
8,0 - - - 131 - 29 Manufacture of motor vehicles, trailers and semi-trailers
30 Proizvodnja ostalih prijevoznih sredstava
78,4 - - - 1 196 343 30 Manufacture of other transport equipment
31 Proizvodnja namještaja 102,0 - - - 1 398 31 31 Manufacture of furniture
32 Ostala prerađivačka industrija 8,3 - - - 134 - 32 Other manufacturing
33 Popravak i instaliranje strojeva i opreme
33,6 - - 50 1 728 204 33 Repair and installation of machineryand equipment
D Opskrba električnom energijom, plinom, parom i klimatizacija
229,0 - - - 795 - D Electricity, gas, steam and air conditioning supply
35 Opskrba električnom energijom, plinom, parom i klimatizacija
229,0 - - - 795 - 35 Electricity, gas, steam and air conditioning supply
E1) Opskrba vodom; uklanjanje otpadnih voda, gospodarenje otpadom te djelatnosti sanacije okoliša
295,9 - - - 1 887 43 E1) Water supply; sewerage, waste management and remediation activities
36 Skupljanje, pročišćavanje i opskrba vodom
295,9 - - - 1 887 43 36 Water collection, treatment and supply
1) U područje E nisu uključeni odjeljci 37, 38 i 39.
1) Section E does not include divisions 37, 38 and 39.

STATISTIČKA IZVJEŠĆA 1614/2018. STATISTICAL REPORTS 59
4.1. FINALNA POTROŠNJA ENERGIJE U INDUSTRIJI PO PODRUČJIMA I ODJELJCIMA NKD-a 2007. U REPUBLICI HRVATSKOJ ZA 2016. FINAL ENERGY CONSUMPTION IN INDUSTRY, ACCORDING TO NKD 2007. SECTIONS AND DIVISIONS, REPUBLIC OF CROATIA, 2016 (nastavak) (continued)
Biodizel Biodiesel
Prirodni plin(bez tekućih
plinova), tis. m3
Natural gas(excluding
liquid gases),‘000 m3
Tekući plin (propan-
-butan i dr.) Liquid gas (propane/
butane, etc.)
Para i toplavoda
Steam andhot water
t t TJ
Ukupno 408 314 822 8 183 20 900,6 Total
B Rudarstvo i vađenje - 53 868 361 1 073,1 B Mining and quarrying
06 Vađenje sirove nafte i prirodnog plina
- 53 530 - 1 073,1 06 Extraction of crude petroleum and natural gas
08 Ostalo rudarstvo i vađenje - 28 361 - 08 Other mining and quarrying
09 Pomoćne uslužne djelatnosti u rudarstvu - 310 - - 09 Mining support service activities
C Prerađivačka industrija 408 298 769 7 684 19 030,2 C Manufacturing
10 Proizvodnja prehrambenih proizvoda - 46 144 953 2 951,1 10 Manufacture of food products
11 Proizvodnja pića 7 4 793 231 521,2 11 Manufacture of beverages
12 Proizvodnja duhanskih proizvoda - 353 - 75,5 12 Manufacture of tobacco products
13 Proizvodnja tekstila - 1 876 11 39,2 13 Manufacture of textiles
14 Proizvodnja odjeće - 5 107 1 87,1 14 Manufacture of wearing apparel
15 Proizvodnja kože i srodnih proizvoda
- 1 134 1 46,0 15 Manufacture of leather and relatedproducts
16 Prerada drva i proizvoda od drva ipluta, osim namještaja; proizvodnja proizvoda od slame i pletarskih materijala
376 1 062 100 373,5 16 Manufacture of wood and of productsof wood and cork, except furniture; manufacture of articles of straw and plaiting materials
17 Proizvodnja papira i proizvoda od papira 6 45 014 86 1 907,7 17 Manufacture of paper and paper products
18 Tiskanje i umnožavanje snimljenihzapisa
- 5 086 1 078 15,8 18 Printing and reproduction of recordedmedia
19 Proizvodnja koksa i rafiniranih naftnihproizvoda
- 62 145 - 8 194,4 19 Manufacture of coke and refinedpetroleum products
20 Proizvodnja kemikalija i kemijskihproizvoda
18 2 722 7 4 130,8 20 Manufacture of chemicals and chemical products
21 Proizvodnja osnovnih farmaceutskihproizvoda i farmaceutskih pripravaka
- 4 531 - 311,9 21 Manufacture of basic pharmaceuticalproducts and pharmaceutical preparations
22 Proizvodnja proizvoda od gume i plastike
- 4 650 110 40,6 22 Manufacture of rubber and plasticproducts
23 Proizvodnja ostalih nemetalnih mineralnih proizvoda
- 83 101 1 591 21,3 23 Manufacture of other non-metallicmineral products
24 Proizvodnja metala - 4 401 510 - 24 Manufacture of basic metals

60 STATISTIČKA IZVJEŠĆA 1614/2018. STATISTICAL REPORTS
4.1. FINALNA POTROŠNJA ENERGIJE U INDUSTRIJI PO PODRUČJIMA I ODJELJCIMA NKD-a 2007. U REPUBLICI HRVATSKOJ ZA 2016. FINAL ENERGY CONSUMPTION IN INDUSTRY, ACCORDING TO NKD 2007. SECTIONS AND DIVISIONS, REPUBLIC OF CROATIA, 2016 (nastavak) (continued)
Biodizel Biodiesel
Prirodni plin(bez tekućih
plinova), tis. m3
Natural gas(excluding
liquid gases),‘000 m3
Tekući plin (propan-
-butan i dr.) Liquid gas (propane/
butane, etc.)
Para i toplavoda
Steam andhot water
t t TJ
25 Proizvodnja gotovih metalnih proizvoda,
osim strojeva i opreme 1 10 153 809 0,4 25 Manufacture of fabricated metal products,
except machinery and equipment
26 Proizvodnja računala te elektroničkih i optičkih proizvoda
- 286 - 37,5 26 Manufacture of computer, electronic and optical products
27 Proizvodnja električne opreme - 5 701 95 77,6 27 Manufacture of electrical equipment
28 Proizvodnja strojeva i uređaja, d. n. - 6 155 1 888 20,2 28 Manufacture of machinery and equipment n. e. c.
29 Proizvodnja motornih vozila, prikolica i poluprikolica
- 303 4 - 29 Manufacture of motor vehicles, trailers and semi-trailers
30 Proizvodnja ostalih prijevoznih sredstava - 1 161 37 11,6 30 Manufacture of other transport equipment
31 Proizvodnja namještaja - 1 285 138 129,6 31 Manufacture of furniture
32 Ostala prerađivačka industrija - 541 - - 32 Other manufacturing
33 Popravak i instaliranje strojeva i opreme
- 1 065 34 37,1 33 Repair and installation of machinery and equipment
D Opskrba električnom energijom, plinom, parom i klimatizacija
- 719 38 797,3 D Electricity, gas, steam and air conditioning supply
35 Opskrba električnom energijom, plinom, parom i klimatizacija
- 719 38 797,3 35 Electricity, gas, steam and air conditioning supply
E1) Opskrba vodom; uklanjanje otpadnih voda, gospodarenje otpadom te djelatnosti sanacije okoliša
- 260 100 - E1) Water supply; sewerage, waste management and remediation activities
36 Skupljanje, pročišćavanje i opskrba vodom
- 260 100 - 36 Water collection, treatment and supply

STATISTIČKA IZVJEŠĆA 1614/2018. STATISTICAL REPORTS 61
4.2. FINALNA POTROŠNJA ENERGIJE U INDUSTRIJI PO PODRUČJIMA I ODJELJCIMA NKD-a 2007. U REPUBLICI HRVATSKOJ ZA 2017.1) FINAL ENERGY CONSUMPTION IN INDUSTRY, ACCORDING TO NKD 2007. SECTIONS AND DIVISIONS, REPUBLIC OF CROATIA, 20171)
Električna energija
Electricity Koks Coke
Kameniugljen
(uključujućibriket)
Hard coal(includingbriquette)
Smeđi ugljen i lignit
(uključujućibriket)
Brown coaland lignite(includingbriquette)
Rafinerijskiproizvodi
(bez mazuta) Refineryproducts
(excludingmasut)
Loživo ulje(mazut) Fuel oil (masut)
GWh t
Ukupno 4 395,9 266 013 57 199 1 914 78 133 36 811 Total
B Rudarstvo i vađenje 207,8 - - - 13 106 - B Mining and quarrying
06 Vađenje sirove nafte i prirodnog plina
173,2 - - - 256 - 06 Extraction of crude petroleum and natural gas
08 Ostalo rudarstvo i vađenje 32,0 - - - 11 752 - 08 Other mining and quarrying
09 Pomoćne uslužne djelatnosti u rudarstvu
2,6 - - - 1 098 - 09 Mining support service activities
C Prerađivačka industrija 3 741,1 266 013 57 199 1 914 62 371 36 790 C Manufacturing
10 Proizvodnja prehrambenih proizvoda 578,0 1 767 20 - 13 968 3 612 10 Manufacture of food products
11 Proizvodnja pića 85,3 - - - 5 265 960 11 Manufacture of beverages
12 Proizvodnja duhanskih proizvoda 15,9 - - - 203 - 12 Manufacture of tobacco products
13 Proizvodnja tekstila 71,3 - - - 295 4 13 Manufacture of textiles
14 Proizvodnja odjeće 56,3 - - - 556 450 14 Manufacture of wearing apparel
15 Proizvodnja kože i srodnih proizvoda
21,4 - - - 145 - 15 Manufacture of leather and related products
16 Prerada drva i proizvoda od drva i pluta, osim namještaja; proizvodnja proizvoda od slame i pletarskih materijala
303,4 - - - 8 282 24 16 Manufacture of wood and of productsof wood and cork, except furniture; manufacture of articles of straw andplaiting materials
17 Proizvodnja papira i proizvoda od papira
222,3 - - - 895 14 17 Manufacture of paper and paper products
18 Tiskanje i umnožavanje snimljenih zapisa
95,5 - - - 1 687 21 18 Printing and reproduction of recordedmedia
19 Proizvodnja koksa i rafiniranih naftnih proizvoda
289,1 37 924 - - 89 27 892 19 Manufacture of coke and refined petroleum products
20 Proizvodnja kemikalija i kemijskih proizvoda
193,3 - - - 1 458 30 20 Manufacture of chemicals and chemical products
21 Proizvodnja osnovnih farmaceutskihproizvoda i farmaceutskih pripravaka
110,4 - - - 260 - 21 Manufacture of basic pharmaceuticalproducts and pharmaceutical preparations
22 Proizvodnja proizvoda od gume i plastike
212,6 - - - 2 643 15 22 Manufacture of rubber and plastic products
23 Proizvodnja ostalih nemetalnih mineralnih proizvoda
658,8 225 655 57 179 1 864 15 427 3 065 23 Manufacture of other non-metallic mineral products
1) Privremeni podaci 1) Provisional data.

62 STATISTIČKA IZVJEŠĆA 1614/2018. STATISTICAL REPORTS
4.2. FINALNA POTROŠNJA ENERGIJE U INDUSTRIJI PO PODRUČJIMA I ODJELJCIMA NKD-a 2007. U REPUBLICI HRVATSKOJ ZA 2017.1) FINAL ENERGY CONSUMPTION IN INDUSTRY, ACCORDING TO NKD 2007. SECTIONS AND DIVISIONS, REPUBLIC OF CROATIA, 20171)
(nastavak) (continued)
Električna energija
Electricity Koks Coke
Kameniugljen
(uključujućibriket)
Hard coal(includingbriquette)
Smeđi ugljen i lignit
(uključujućibriket)
Brown coaland lignite(includingbriquette)
Rafinerijskiproizvodi
(bez mazuta) Refineryproducts
(excludingmasut)
Loživo ulje(mazut) Fuel oil (masut)
GWh t
24 Proizvodnja metala 136,0 667 - - 652 25 24 Manufacture of basic metals
25 Proizvodnja gotovih metalnih proizvoda, osim strojeva i opreme
198,9 - - - 3 169 506 25 Manufacture of fabricated metal products, except machinery and equipment
26 Proizvodnja računala te elektroničkihi optičkih proizvoda
34,6 - - - 123 - 26 Manufacture of computer, electronicand optical products
27 Proizvodnja električne opreme 92,0 - - - 654 - 27 Manufacture of electrical equipment
28 Proizvodnja strojeva i uređaja, d. n. 118,8 - - - 1 631 145 28 Manufacture of machinery and equipment n. e. c.
29 Proizvodnja motornih vozila, prikolica i poluprikolica
11,2 - - - 206 - 29 Manufacture of motor vehicles, trailers and semi-trailers
30 Proizvodnja ostalih prijevoznih sredstava
84,1 - - - 1 385 12 30 Manufacture of other transport equipment
31 Proizvodnja namještaja 101,7 - - - 1 423 6 31 Manufacture of furniture
32 Ostala prerađivačka industrija 11,7 - - - 209 - 32 Other manufacturing
33 Popravak i instaliranje strojeva i opreme
38,4 - - 50 1 746 9 33 Repair and installation of machineryand equipment
D Opskrba električnom energijom, plinom, parom i klimatizacija
132,4 - - - 788 - D Electricity, gas, steam and air conditioning supply
35 Opskrba električnom energijom, plinom, parom i klimatizacija
132,4 - - - 788 - 35 Electricity, gas, steam and air conditioning supply
E2) Opskrba vodom; uklanjanje otpadnih voda, gospodarenje otpadom te djelatnosti sanacije okoliša
314,6 - - - 1 868 21 E2) Water supply; sewerage, waste management and remediation activities
36 Skupljanje, pročišćavanje i opskrba vodom
314,6 - - - 1 868 21 36 Water collection, treatment and supply
2) U područje E nisu uključeni odjeljci 37, 38 i 39.
2) Section E does not include divisions 37, 38 and 39.

STATISTIČKA IZVJEŠĆA 1614/2018. STATISTICAL REPORTS 63
4.2. FINALNA POTROŠNJA ENERGIJE U INDUSTRIJI PO PODRUČJIMA I ODJELJCIMA NKD-a 2007. U REPUBLICI HRVATSKOJ ZA 2017.1)
FINAL ENERGY CONSUMPTION IN INDUSTRY, ACCORDING TO NKD 2007. SECTIONS AND DIVISIONS, REPUBLIC OF CROATIA, 20171) (nastavak) (continued)
Biodizel Biodiesel
Prirodni plin(bez tekućih
plinova), tis. m3
Natural gas(excluding
liquid gases),‘000 m3
Tekući plin (propan-
-butan i dr.) Liquid gas (propane/
butane, etc.)
Para i topla voda
Steam and hot water
t t TJ
Ukupno 354 386 038 9 125 22 574,0 Total
B Rudarstvo i vađenje - 93 078 - 921,8 B Mining and quarrying
06 Vađenje sirove nafte i prirodnog plina
- 92 966 - 921,8 06 Extraction of crude petroleum and natural gas
08 Ostalo rudarstvo i vađenje - 38 - - 08 Other mining and quarrying
09 Pomoćne uslužne djelatnosti u rudarstvu - 74 - - 09 Mining support service activities
C Prerađivačka industrija 354 291 524 8 996 20 865,0 C Manufacturing
10 Proizvodnja prehrambenih proizvoda - 39 039 980 3 084,0 10 Manufacture of food products
11 Proizvodnja pića - 4 494 244 447,7 11 Manufacture of beverages
12 Proizvodnja duhanskih proizvoda - 306 - 80,5 12 Manufacture of tobacco products
13 Proizvodnja tekstila - 1 273 15 40,2 13 Manufacture of textiles
14 Proizvodnja odjeće - 4 721 1 82,4 14 Manufacture of wearing apparel
15 Proizvodnja kože i srodnih proizvoda
- 1 287 1 37,5 15 Manufacture of leather and related products
16 Prerada drva i proizvoda od drva i pluta, osim namještaja; proizvodnja proizvoda od slame i pletarskih materijala
354 1 611 134 541,9 16 Manufacture of wood and of products of wood and cork, except furniture; manufacture of articles of straw and plaiting materials
17 Proizvodnja papira i proizvoda od papira - 6 977 96 2 102,7 17 Manufacture of paper and paper products
18 Tiskanje i umnožavanje snimljenih zapisa
- 4 950 1 389 15,5 18 Printing and reproduction of recorded media
19 Proizvodnja koksa i rafiniranih naftnih proizvoda
- 76 073 - 9 185,5 19 Manufacture of coke and refined petroleum products
20 Proizvodnja kemikalija i kemijskih proizvoda
- 2 615 7 4 590,0 20 Manufacture of chemicals and chemical products
21 Proizvodnja osnovnih farmaceutskih proizvoda i farmaceutskih pripravaka
- 6 026 - 319,0 21 Manufacture of basic pharmaceutical products and pharmaceutical preparations
22 Proizvodnja proizvoda od gume i plastike
- 4 724 93 48,0 22 Manufacture of rubber and plastic products
23 Proizvodnja ostalih nemetalnih mineralnih proizvoda
- 96 674 1 583 13,8 23 Manufacture of other non-metallic mineral products
24 Proizvodnja metala - 10 861 638 - 24 Manufacture of basic metals

64 STATISTIČKA IZVJEŠĆA 1614/2018. STATISTICAL REPORTS
4.2. FINALNA POTROŠNJA ENERGIJE U INDUSTRIJI PO PODRUČJIMA I ODJELJCIMA NKD-a 2007. U REPUBLICI HRVATSKOJ ZA 2017.1) FINAL ENERGY CONSUMPTION IN INDUSTRY, ACCORDING TO NKD 2007. SECTIONS AND DIVISIONS, REPUBLIC OF CROATIA, 20171)
(nastavak) (continued)
Biodizel Biodiesel
Prirodni plin(bez tekućih
plinova), tis. m3
Natural gas(excluding
liquid gases),‘000 m3
Tekući plin (propan-
-butan i dr.) Liquid gas (propane/
butane, etc.)
Para i toplavoda
Steam andhot water
t t TJ
25 Proizvodnja gotovih metalnih proizvoda,
osim strojeva i opreme - 10 090 1 072 0,3 25 Manufacture of fabricated metal products,
except machinery and equipment
26 Proizvodnja računala te elektroničkih i optičkih proizvoda
- 334 - 37,2 26 Manufacture of computer, electronic and optical products
27 Proizvodnja električne opreme - 5 821 59 61,7 27 Manufacture of electrical equipment
28 Proizvodnja strojeva i uređaja, d. n.
- 7 009 2 307 20,3 28 Manufacture of machinery and equipment n. e. c.
29 Proizvodnja motornih vozila, prikolica i poluprikolica
- 354 6 - 29 Manufacture of motor vehicles, trailers and semi-trailers
30 Proizvodnja ostalih prijevoznih sredstava - 2 126 56 15,6 30 Manufacture of other transport equipment
31 Proizvodnja namještaja - 1 386 221 114,0 31 Manufacture of furniture
32 Ostala prerađivačka industrija - 1 424 7 - 32 Other manufacturing
33 Popravak i instaliranje strojeva i opreme
- 1 349 87 26,8 33 Repair and installation of machinery and equipment
D Opskrba električnom energijom, plinom, parom i klimatizacija
- 775 48 786,3 D Electricity, gas, steam and air conditioning supply
35 Opskrba električnom energijom, plinom, parom i klimatizacija
- 775 48 786,3 35 Electricity, gas, steam and air conditioning supply
E2) Opskrba vodom; uklanjanje otpadnih voda, gospodarenje otpadom te djelatnosti sanacije okoliša
- 661 81 - E2) Water supply; sewerage, waste management and remediation activities
36 Skupljanje, pročišćavanje i opskrba vodom
- 661 81 - 36 Water collection, treatment and supply

5. CIJENE ELEKTRIČNE ENERGIJE I PRIRODNOG PLINA DISTRIBUIRANOGA PLINOVODIMA PREMA EUROSTATOVIM RAZREDIMA U REPUBLICI HRVATSKOJ
PRICES OF ELECTRICITY AND NATURAL GAS DISTRIBUTED VIA PIPELINES IN REPUBLIC OF CROATIA, ACCORDING TO EUROSTAT CLASSES


STATISTIČKA IZVJEŠĆA 1614/2018. STATISTICAL REPORTS 67
5.1. CIJENE ELEKTRIČNE ENERGIJE I PRIRODNOG PLINA DISTRIBUIRANOGA PLINOVODIMA PREMA EUROSTATOVIM RAZREDIMA S PDV-om PRICES OF ELECTRICITY AND NATURAL GAS DISTRIBUTED VIA PIPELINES IN REPUBLIC OF CROATIA, ACCORDING TO EUROSTAT CLASSES, INCLUDING VAT 5.1.1. CIJENE ELEKTRIČNE ENERGIJE PREMA EUROSTATOVIM RAZREDIMA S PDV-om PRICES OF ELECTRICITY, ACCORDING TO EUROSTAT CLASSES, INCLUDING VAT 5.1.1.1. CIJENE ELEKTRIČNE ENERGIJE ISPORUČENE INDUSTRIJI PRICES OF ELECTRICITY DELIVERED TO INDUSTRY
Oznaka razreda Class
Godišnja potrošnja električne energije Annual electricity
consumption
Cijena električne energije koju plaća finalni potrošač, kuna/kWh Price of electricity paid by final user, kuna/kWh
MWh 2014. 2015. 2016. 2017. 2018. od
From do To VII. – XII. I. – VI. VII. – XII. I. – VI. VII. – XII. I. – VI. VII. – XII. I. – VI.
IA 1 20 1,212 1,169 1,1739 1,1742 1,1635 1,0689 0,9973 1,1008IB 21 500 1,043 1,027 1,0255 0,9999 0,9840 0,8740 0,9140 0,9594IC 501 2 000 0,878 0,877 0,8812 0,8538 0,8230 0,7354 0,7776 0,8334ID 2 001 20 000 0,747 0,754 0,7648 0,7354 0,7188 0,6404 0,6822 0,7281IE 20 001 70 000 0,623 0,602 0,6285 0,6021 0,6009 0,5351 0,5700 0,5992IF 70 001 150 000 0,527 0,557 0,5063 0,5140 0,6880 0,4242 0,4047 0,4927
5.1.1.2. CIJENE ELEKTRIČNE ENERGIJE ISPORUČENE KUĆANSTVIMA PRICES OF ELECTRICITY DELIVERED TO HOUSEHOLDS
Oznaka razreda Class
Godišnja potrošnja električne energije Annual electricity
consumption
Cijena električne energije koju plaća finalni potrošač, kuna/kWh Price of electricity paid by final user, kuna/kWh
MWh 2014. 2015. 2016. 2017. 2018. od
From do To VII. – XII. I. – VI. VII. – XII. I. – VI. VII. – XII. I. – VI. VII. – XII. I. – VI.
DA 1 1 000 1,600 1,644 1,5554 1,7131 1,5683 1,5159 1,4706 1,6143DB 1 001 2 500 1,092 1,091 1,0734 1,0751 1,0776 0,9715 0,9961 1,0473DC 2 501 5 000 1,012 1,004 0,9972 0,9912 0,9993 0,8905 0,9248 0,9724DD 5 001 15 000 0,973 0,961 0,9569 0,9485 0,9576 0,8545 0,8924 0,9375DE ≥ 15 001 0,939 0,929 0,9264 0,9194 0,9301 0,8284 0,8667 0,9125
5.1.2. CIJENE PRIRODNOG PLINA DISTRIBUIRANOGA PLINOVODIMA PREMA EUROSTATOVIM RAZREDIMA S PDV-om PRICES OF NATURAL GAS DISTRIBUTED VIA PIPELINES, ACCORDING TO EUROSTAT CLASSES, INCLUDING VAT 5.1.2.1. CIJENE PRIRODNOG PLINA DISTRIBUIRANOGA PLINOVODIMA INDUSTRIJI1) PRICES OF NATURAL GAS DISTRIBUTED VIA PIPELINES TO INDUSTRY1)
Oznaka razreda Class
Godišnja potrošnja prirodnog plina
Annual gas consumption Cijena prirodnog plina koju plaća finalni potrošač, kuna/GJ
Price of gas paid by final user, kuna/GJ
GJ 2014. 2015. 2016. 2017. 2018. od
From do To VII. – XII. I. – VI. VII. – XII. I. – VI. VII. – XII. I. – VI. VII. – XII. I. – VI.
I1 1 1 000 120,17 121,50 111,63 106,75 91,34 86,0000 83,4063 83,8125I2 1 001 10 000 112,58 110,03 102,66 97,06 81,84 75,3438 74,6563 71,4688I3 10 001 100 000 106,69 102,95 92,53 85,94 71,59 63,5313 64,2500 65,9063I4 100 001 1 000 000 100,89 94,70 75,69 68,25 62,53 58,6563 57,0938 60,3438I5 1 000 001 4 000 000 - - - - - - - -
1) Nisu uključeni veliki neenergetski potrošači i proizvođači električne energije.
1) Excluding large non-energy users and producers of electricity.

68 STATISTIČKA IZVJEŠĆA 1614/2018. STATISTICAL REPORTS
5.1.2.2. CIJENE PRIRODNOG PLINA DISTRIBUIRANOGA PLINOVODIMA KUĆANSTVIMA PRICES OF NATURAL GAS DISTRIBUTED VIA PIPELINES TO HOUSEHOLDS
Oznaka razreda Class
Godišnja potrošnja prirodnog plina
Annual gas consumption Cijena prirodnog plina koju plaća finalni potrošač, kuna/GJ
Price of gas paid by final user, kuna/GJ
GJ 2014. 2015. 2016. 2017. 2018. od
From do To VII. – XII. I. – VI. VII. – XII. I. – VI. VII. – XII. I. – VI. VII. – XII. I. – VI.
D1 0,1 20 114,09 117,15 116,03 108,00 95,59 91,0625 95,8250 93,8438D2 21 200 100,88 100,13 97,00 90,00 77,19 74,2500 75,9750 75,7500D3 ≥ 201 94,37 95,83 92,06 85,22 72,25 70,9375 71,8500 70,9063
5.2. CIJENE ELEKTRIČNE ENERGIJE I PRIRODNOG PLINA DISTRIBUIRANOGA PLINOVODIMA PREMA EUROSTATOVIM RAZREDIMA BEZ PDV-a PRICES OF ELECTRICITY AND NATURAL GAS DISTRIBUTED VIA PIPELINES IN REPUBLIC OF CROATIA, ACCORDING TO EUROSTAT CLASSES, EXCLUDING VAT 5.2.1. CIJENE ELEKTRIČNE ENERGIJE PREMA EUROSTATOVIM RAZREDIMA BEZ PDV-a PRICES OF ELECTRICITY, ACCORDING TO EUROSTAT CLASSES, EXCLUDING VAT 5.2.1.1. CIJENE ELEKTRIČNE ENERGIJE ISPORUČENE INDUSTRIJI PRICES OF ELECTRICITY DELIVERED TO INDUSTRY
Oznaka razreda Class
Godišnja potrošnja električne energije Annual electricity
consumption
Cijena električne energije koju plaća finalni potrošač, kuna/kWh Price of electricity paid by final user, kuna/kWh
MWh 2014. 2015. 2016. 2017. 2018. od
From do To VII. – XII. I. – VI. VII. – XII. I. – VI. VII. – XII. I. – VI. VII. – XII. I. – VI.
IA 1 20 0,970 0,935 0,9391 0,9396 0,9308 0,9460 0,8826 0,9741IB 21 500 0,834 0,822 0,8204 0,7999 0,7872 0,7735 0,8089 0,8490IC 501 2 000 0,702 0,702 0,7050 0,6830 0,6584 0,6508 0,6882 0,7375ID 2 001 20 000 0,598 0,603 0,6118 0,5883 0,5764 0,5666 0,6037 0,6443IE 20 001 70 000 0,499 0,482 0,5027 0,4817 0,4827 0,4737 0,5044 0,5303IF 70 001 150 000 0,422 0,451 0,4050 0,4112 0,5503 0,3754 0,3583 0,4361
5.2.1.2. CIJENE ELEKTRIČNE ENERGIJE ISPORUČENE KUĆANSTVIMA PRICES OF ELECTRICITY DELIVERED TO HOUSEHOLDS
Oznaka razreda Class
Godišnja potrošnja električne energije Annual electricity
consumption
Cijena električne energije koju plaća finalni potrošač, kuna/kWh Price of electricity paid by final user, kuna/kWh
MWh 2014. 2015. 2016. 2017. 2018. od
From do To VII. – XII. I. – VI. VII. – XII. I. – VI. VII. – XII. I. – VI. VII. – XII. I. – VI.
DA 1 1 000 1,280 1,315 1,2443 1,3705 1,2550 1,3415 1,3014 1,4286DB 1 001 2 500 0,873 0,873 0,8587 0,8600 0,8624 0,8597 0,8815 0,9268DC 2 501 5 000 0,810 0,804 0,7977 0,7929 0,7998 0,7881 0,8184 0,8606DD 5 001 15 000 0,778 0,768 0,7655 0,7589 0,7668 0,7562 0,7898 0,8296DE ≥ 15 001 0,751 0,743 0,7411 0,7355 0,7466 0,7331 0,7670 0,8075

STATISTIČKA IZVJEŠĆA 1614/2018. STATISTICAL REPORTS 69
5.2.2. CIJENE PRIRODNOG PLINA DISTRIBUIRANOGA PLINOVODIMA PREMA EUROSTATOVIM RAZREDIMA BEZ PDV-a PRICES OF NATURAL GAS DISTRIBUTED VIA PIPELINES, ACCORDING TO EUROSTAT CLASSES, EXCLUDING VAT 5.2.2.1. CIJENE PRIRODNOG PLINA DISTRIBUIRANOGA PLINOVODIMA INDUSTRIJI1) PRICES OF NATURAL GAS DISTRIBUTED VIA PIPELINES TO INDUSTRY1)
Oznaka razreda Class
Godišnja potrošnja prirodnog plina
Annual gas consumption Cijena prirodnog plina koju plaća finalni potrošač, kuna/GJ
Price of gas paid by final user, kuna/GJ
GJ 2014. 2015. 2016. 2017. 2018. od
From do To VII. – XII. I. – VI. VII. – XII. I. – VI. VII. – XII. I. – VI. VII. – XII. I. – VI.
I1 1 1 000 96,14 97,20 89,30 85,40 73,08 68,8000 66,7250 67,0500 I2 1 001 10 000 90,03 88,03 82,13 77,65 65,48 60,2750 59,7250 57,1750 I3 10 001 100 000 85,20 82,35 74,03 68,75 57,28 50,8250 51,4000 52,7250 I4 100 001 1 000 000 80,71 75,75 60,55 54,60 50,03 46,9250 45,6750 48,2750 I5 1 000 001 4 000 000 - - - - - - - -
1) Nisu uključeni veliki neenergetski potrošači i proizvođači električne energije.
1) Excluding large non-energy users and producers of electricity. 5.2.2.2. CIJENE PRIRODNOG PLINA DISTRIBUIRANOGA PLINOVODIMA KUĆANSTVIMA PRICES OF NATURAL GAS DISTRIBUTED VIA PIPELINES TO HOUSEHOLDS
Oznaka razreda Class
Godišnja potrošnja prirodnog plina
Annual gas consumption Cijena prirodnog plina koju plaća finalni potrošač, kuna/GJ
Price of gas paid by final user, kuna/GJ
GJ 2014. 2015. 2016. 2017. 2018. od
From do To VII. – XII. I. – VI. VII. – XII. I. – VI. VII. – XII. I. – VI. VII. – XII. I. – VI.
D1 0,1 20 91,27 93,73 92,83 86,40 76,48 72,8500 76,6500 75,0750 D2 21 200 80,70 80,10 77,60 72,00 61,75 59,4000 60,7750 60,6000 D3 ≥ 201 75,50 76,65 73,65 68,18 57,80 56,7500 57,4750 56,7250

70 STATISTIČKA IZVJEŠĆA 1614/2018. STATISTICAL REPORTS
OBJAVLJENE PUBLIKACIJE IZ PODRUČJA STATISTIKE ENERGETIKE RELEASED PUBLICATIONS IN ENERGY STATISTICS
I. STATISTIČKA IZVJEŠĆA I. STATISTICAL REPORTS
1189. Energetska statistika u 2002. 1189 Energy Statistics, 2002 1222. Energetska statistika u 2003. 1222 Energy Statistics, 2003 1258. Energetska statistika u 2004. 1258 Energy Statistics, 2004 1290. Energetska statistika u 2005. 1290 Energy Statistics, 2005 1320. Energetska statistika u 2006. 1320 Energy Statistics, 2006 1350. Energetska statistika u 2007. 1350 Energy Statistics, 2007 1377. Energetska statistika u 2008. 1377 Energy Statistics, 2008 1405. Energetska statistika u 2009. 1405 Energy Statistics, 2009 1432. Energetska statistika u 2010. 1432 Energy Statistics, 2010 1461. Energetska statistika u 2011. 1461 Energy Statistics, 2011 1489. Energetska statistika u 2012. 1489 Energy Statistics, 2012 1513. Energetska statistika u 2013. 1513 Energy Statistics, 2013 1537. Energetska statistika u 2014. 1537 Energy Statistics, 2014 1562. Energetska statistika u 2015. 1562 Energy Statistics, 2015 1592. Energetska statistika u 2016. 1592 Energy Statistics, 2016