16 Essential KPIs for Lead Gen Call Center Profitability
19
1 www.convoso.com 1 1 16 Essential KPIs for Lead Gen Call Center Profitability ROI-boosting metrics used by most successful outbound call centers. Are you tracking the right KPIs for your outbound call center? Anyone managing a lead generation call center is watching the numbers to keep their eye on the performance of their agents and data. But with so many variables, some call center admins rely on only a few simple metrics. Unfortunately, this may skew their perspective of what’s really going on. They’re making decisions based on inaccurate or insufficient information. If you routinely measure and under- stand how to interpret your KPIs in relation to one another, you’ll have the means to strategically guide your call center operation toward growth and profitability. This is true whether you use a predictive dialer, a power dialer, or another dialing mode. Convoso customer John Gallagher is a numbers man. He lives and breathes KPIs. “There are a variety of KPIs and they’re all really valuable to the ultimate profi- tability of the business. Profitability for me is everything.”
Transcript of 16 Essential KPIs for Lead Gen Call Center Profitability

1www.convoso.com 11
16 Essential KPIs for Lead Gen Call Center ProfitabilityROI-boosting metrics used by most
successful outbound call centers.
Are you tracking the right KPIs
for your outbound call center?
Anyone managing a lead generation
call center is watching the numbers
to keep their eye on the performance
of their agents and data.
But with so many variables, some
call center admins rely on only a few
simple metrics. Unfortunately, this
may skew their perspective of what’s
really going on. They’re making
decisions based on inaccurate or
insufficient information.
If you routinely measure and under-
stand how to interpret your KPIs in
relation to one another, you’ll have
the means to strategically guide your
call center operation toward growth
and profitability. This is true whether
you use a predictive dialer , a power
dialer, or another dialing mode .
Convoso customer John Gallagher
is a numbers man. He lives and
breathes KPIs.
“There are a variety of KPIs and they’re
all really valuable to the ultimate profi-
tability of the business. Profitability
for me is everything.”

2www.convoso.com
Some metrics should be monitored
in real time throughout the day. Some
metrics should be analyzed over
time—your historical metrics reveal
trends over a day, a week, a month,
a quarter. There are KPIs (say Agent
Talk Time) that need to be viewed
throughout the day, averaged over
time, and in relation to Number
of Sales/Transfers/Conversions
and Number of Calls. You need to
determine the right types of KPIs
that are relevant to your unique
operation [e.g., Lead to Transfer Rate,
if you do transfers]; this may mean
customizing reports with filters.
“If you can’t measure it, you can’t
improve it,” as Convoso CEO Nima
Hakimi likes to say.
We’ll look at some key metrics used
by most successful outbound call
centers. While not a comprehensive
list, these results-driven KPIs give
you the tools to improve dialer and
agent performance, which you can
effectively monitor in your custo-
mizable dashboard . We’ll finish up
with some Versatile KPI Reporting
Tools we recommend.
If you can’t measure it, you
can’t improve it
2

3www.convoso.com
Let’s get into the KPIs. Here they are in summary, with links
if you want to jump to specific descriptions below.
16 KPIs used by successful outbound and lead gen call centers to boost ROI
CALL CENTER
LEAD KPIs
CALL CENTER
LIST KPIs
• Cost Per Acquisition (CPA)
• Connection Rate
• Lead Conversion Rate
• Contact Rate
• Average Talk Time
• Total Revenue
• List Profit and Loss
CALL CENTER
AGENT KPIs
CALL CENTER
DIALING KPIs
• Talk Time
• Wrapup time
• Pause or Wait Time
• Calls per Agent
• First Call Close
• Number of Sales
• Revenue per Agent
• Average Hold Time
• Abandoned Call Rate
• Dropped Call Rate

4www.convoso.com
LEAD KPIs
4www.convoso.com

5www.convoso.com
The best in class contact centers focus on their cost per
acquisition at a lead vendor level, and how much revenue
comes out of those leads. Unfortunately, many contact
centers don’t measure CPA – they only look at it on
a cost per lead [CPL] basis. They’re making strategic
decisions about how they’re operating their call center,
but they don’t have the whole picture.
The smartest path to lead efficiency is to really under-
stand what’s going on with those leads by persistently
monitoring real-time reports that show you specific,
active lead metrics.
Your agents, your leads, and the cost of the dialer
are the major numbers in determining your cost per
acquisition. But you also need to break that down
on a lead source level so you know what the ROI is
on an hourly basis by both agent and lead source.
—Nima Hakimi, CEO & Co-Founder of Convoso
[taken from his article “Outbound Calling
Strategies: Accelerating Lead Efficiency“]

6www.convoso.com
2. CONNECTION RATE
Connection Rate tells us the
efficiency of the leads. It’s short term
and gives you a daily snapshot.
Here we look at the number of calls
placed on a given day to leads.
To determine the rate, divide the calls
answered [including voicemails]
by the total calls placed. For example,
25 calls answered / 100 calls dialed =
a Connection Rate of 25%.
3. LEAD CONVERSION RATE
How many calls did it take to make a
sale? In a nutshell, that’s the focus of
this metric. Your conversionrate is the
percentage of calls/leads resulting
in a successful sale or transfer. A low
conversion rate increases your cost
per lead and impacts your company’s
overall revenue.
Use real time reporting to track this
KPI. It indicates whether a list is
performing well, so you can make
strategic decisions about data throu-
ghout the day.
To increase your Lead Conversion
Rate, engage these four strategies
that improve both Connection and
Contact Rates .
Dial Time-out Adjustment
Dial Level Scheduling
Carrier Quality Monitoring and
Management
Recycle Logic Tools [eg, automated
workflow dialing]
Additional KPIs some of our
customers track are cost per lead and
revenue per lead. These metrics are
used to calculate KPIs such as Lead
Conversion Rate and CPA.
1. COST PER ACQUISITION
(CPA)
Your CPA provides a high-level view
into the costs associated with conve-
prting leads. This should be the top
KPI for your outbound call center.
CPA measures the total cost to get
one specific acquisition, whether
that’s an agent-sold lead or a billable
lead that you pass off to your client.
Understanding this metric allows
you to:
• Get clear insights into spending and
saving opportunities
• Optimize your call center’s return on
investment (ROI)
• View your call center’s various
activities in one simple metric
• Calculate the lifetime value of each
acquisition, marketing
costs, and expected profit
LEAD KPIs

7www.convoso.com 7
LIST KPIs
www.convoso.com

8www.convoso.com
With a higher contact rate, your
agents can spend their time
productively by reaching the right
people, especially with higher-quality
leads. If your dialer is able to dial
fewer leads while delivering the same
number of qualified leads to your
agents, you’re spending less to earn
the same results. That’s contributing
to your bottom line.
TOOLS TO MEASURE
Contact Rate Report
A contact rate report should gives you
ways to find out which call-to-actions
and lead sources are converting more
than others. In addition to showing
calls answered, this report should
tell you more details about the call,
such number of calls with no answer,
voicemail detection, DNC tagged,
busy, disconnected, call dispositions,
total revenue, and more.
List KPIs track data performance by
list and list source.
Outbound call center expert Heather
Griffin talks about the value of list
metrics:
4. CONTACT RATE
Contact rate is a list level metric
and is the key to understanding the
quality of the lead list, and how well
your campaigns are performing.
It also indicates whether your agents
and software are reaching the right
leads at the right time.
Contact rate measures the percent
of leads reached out of your total
leads. To determine the rate, we
divide the number of live person
contacts by the total leads on the list.
For example, 20 people pick up the call
/ 200 leads = a Contact Rate of 10%.
8
I can see if a list is burnt
because our contact rates
are super low. I can see a
list that’s converting. And
more importantly, I can turn
off lists where we talked to
a lot of people and it didn’t
result in sales.
LIST KPIs
9www.convoso.com
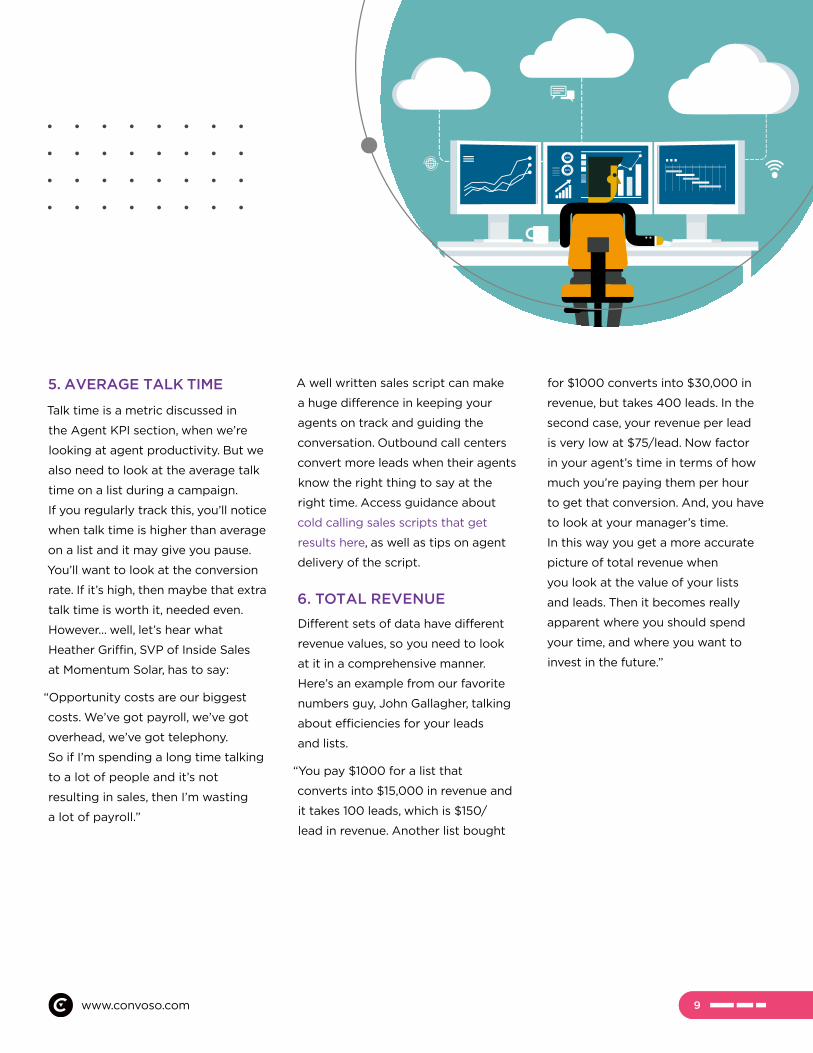
5. AVERAGE TALK TIME
Talk time is a metric discussed in
the Agent KPI section, when we’re
looking at agent productivity. But we
also need to look at the average talk
time on a list during a campaign.
If you regularly track this, you’ll notice
when talk time is higher than average
on a list and it may give you pause.
You’ll want to look at the conversion
rate. If it’s high, then maybe that extra
talk time is worth it, needed even.
However... well, let’s hear what
Heather Griffin, SVP of Inside Sales
at Momentum Solar, has to say:
“Opportunity costs are our biggest
costs. We’ve got payroll, we’ve got
overhead, we’ve got telephony.
So if I’m spending a long time talking
to a lot of people and it’s not
resulting in sales, then I’m wasting
a lot of payroll.”
A well written sales script can make
a huge difference in keeping your
agents on track and guiding the
conversation. Outbound call centers
convert more leads when their agents
know the right thing to say at the
right time. Access guidance about
cold calling sales scripts that get
results here , as well as tips on agent
delivery of the script.
6. TOTAL REVENUE
Different sets of data have different
revenue values, so you need to look
at it in a comprehensive manner.
Here’s an example from our favorite
numbers guy, John Gallagher, talking
about efficiencies for your leads
and lists.
“You pay $1000 for a list that
converts into $15,000 in revenue and
it takes 100 leads, which is $150/
lead in revenue. Another list bought
for $1000 converts into $30,000 in
revenue, but takes 400 leads. In the
second case, your revenue per lead
is very low at $75/lead. Now factor
in your agent’s time in terms of how
much you’re paying them per hour
to get that conversion. And, you have
to look at your manager’s time.
In this way you get a more accurate
picture of total revenue when
you look at the value of your lists
and leads. Then it becomes really
apparent where you should spend
your time, and where you want to
invest in the future.”
9
10www.convoso.com
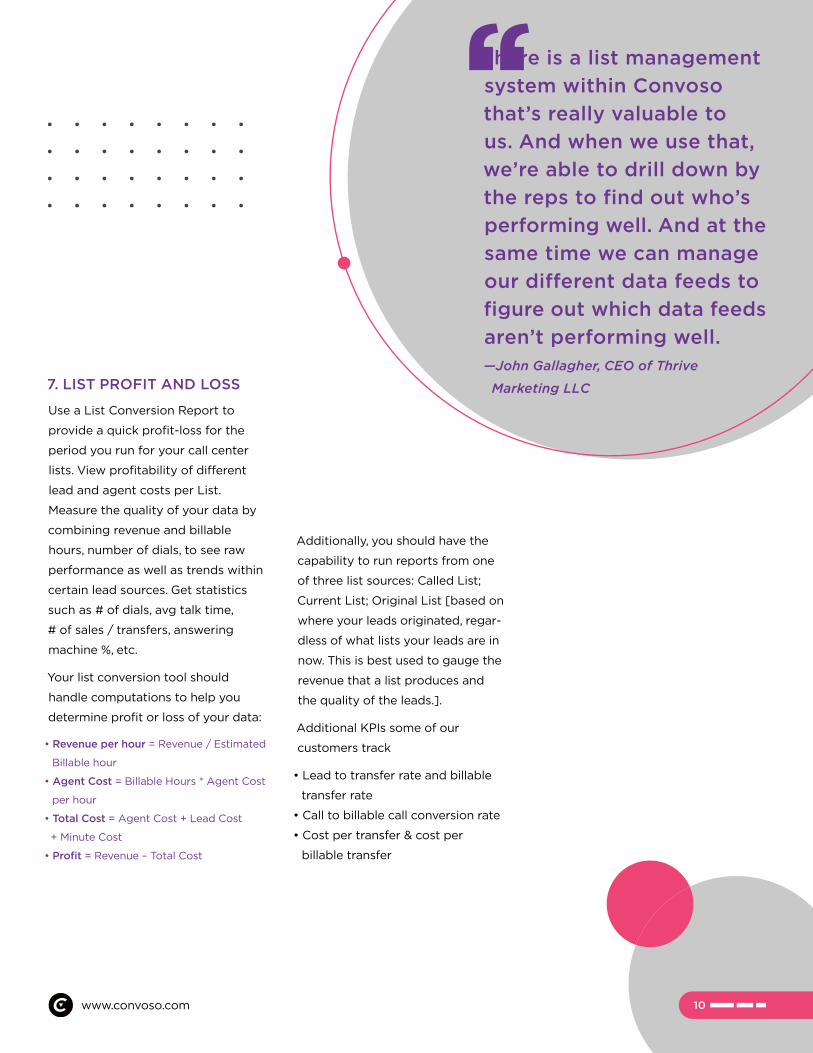
7. LIST PROFIT AND LOSS
Use a List Conversion Report to
provide a quick profit-loss for the
period you run for your call center
lists. View profitability of different
lead and agent costs per List.
Measure the quality of your data by
combining revenue and billable
hours, number of dials, to see raw
performance as well as trends within
certain lead sources. Get statistics
such as # of dials, avg talk time,
# of sales / transfers, answering
machine %, etc.
Your list conversion tool should
handle computations to help you
determine profit or loss of your data:
• Revenue per hour = Revenue / Estimated
Billable hour
• Agent Cost = Billable Hours * Agent Cost
per hour
• Total Cost = Agent Cost + Lead Cost
+ Minute Cost
• Profit = Revenue – Total Cost
There is a list management
system within Convoso
that’s really valuable to
us. And when we use that,
we’re able to drill down by
the reps to find out who’s
performing well. And at the
same time we can manage
our different data feeds to
figure out which data feeds
aren’t performing well.
—John Gallagher, CEO of Thrive
Marketing LLC
Additionally, you should have the
capability to run reports from one
of three list sources: Called List;
Current List; Original List [based on
where your leads originated, regar-
dless of what lists your leads are in
now. This is best used to gauge the
revenue that a list produces and
the quality of the leads.].
Additional KPIs some of our
customers track
• Lead to transfer rate and billable
transfer rate
• Call to billable call conversion rate
• Cost per transfer & cost per
billable transfer
10

11
www.convoso.com
An agent who’s normally a good
performer could be having a bad
week for some reason. We’d see
those results in the data within
4 hours and we’d be able to
address it. Sometimes they just
need time off. They need a break.
Sometimes the agents burn out.
—John Gallagher
11
AGENT KPIs
www.convoso.com
12
www.convoso.com
Understanding agent productivity
starts with objective metrics that are
tracked over time. The numbers show
who your top producers are, who
may need more training/coaching,
and when someone may just be
having an off day [unless it’s the data,
which is why we track list metrics
simultaneously].
8. TALK TIME
Sometimes, more time on a call is
just what’s needed to make a
successful sale or transfer. Tracking
talk time shows you whether this
is about time to convert or the agent
getting off track.
If calls are taking too long, try to
streamlining your script. A call center
solution that offers dynamic scripting
will show your agents a clear path of
conversation, addressing common
questions, or even flagging an area
that’s giving them trouble in a sales
call. Agents become more effective
and efficient.
9. WRAPUP TIME
Also sometimes called ACW or After
Call Work, track this metric by indiv-
idual agent and over all agents, both
daily and over a period, so you
can determine if this time can be
tightened up.
Minutes spent assigning dispositions,
notes, and other manual tasks at the
end of a call add up. Those accum-
ulated minutes are costing you.
That’s time your agent isn’t making
other calls, and a break in the calling
rhythm that makes your agents
productive. Automating these tasks
will add up to a noticeable impro-
vement in productivity.
Managers fear losing speed
or lack of performance.
We used to sacrifice the
agent in a push to meet
our fulfillment goals.
By managing the list at a
higher level, our contacts
and conversions are at
slower rates, but our agents
are delivering optimal
performance.
— Michael Velardi, Sr VP at Resource
Marketing Corp
10. PAUSE OR WAIT TIME
This metric tracks the amount of time
between calls. Our customer Michael
Velardi recently found that by incre-
asing the pause or rest time for
agents between calls—just slightly—
that they ultimately became more
productive, and weren’t overdialing.
Finding a balance is key—one that
works for your operation.
Of course you want to make sure your
agents are productive so be sure to
find the sweet spot by adjusting the
wait time of your predictive dialer as
you track this metric.
AGENTS KPIs

13
www.convoso.com
11. CALLS PER AGENT
Calls per Agent is a metric to indicate
if your agents are on task. This can
be an added challenge for a remote
contact center operation where your
agents work from home. Effectively
managing productivity of your at-
home agents means utilizing the
agent monitoring tools and real time
analytics of your cloud-based dialer.
To improve your Calls per Agent
KPI, your system should have
the capabilities to monitor agent
performance, to automate workflows,
to offer communication channels
such as broadcast messaging and
listen & whisper, to manage break
requests and time clock, and to set
auto logouts for pause codes.
Agent motivation naturally improves
with a system that supports their
success. Find and integrate features
for your agents that streamline the
calling process and automate tasks.
Do your agents have access to these
tools?
• Intelligent dynamic scripting
to streamline calls and improve
conversions
• Customizable dashboards
• Workflow dialing
• One-click to next call or transfer
(Quick Dispositions), saving time and
maintaining a calling rhythm
If your agents are consistently dialing,
but your Calls per Agent metric
is still low, the issue could be your
dialer system. While automated
dialing is now commonplace—hand
dialing is obviously extremely taxing—
your dialer must be optimized for
maximum dialing efficiency, for
example by automatically resetting
the list and finding the sweet spot for
predictive dial levels.
12. FIRST CALL CLOSE
The First Call Close (FCC) metric
indicates the number of sales that
were made on an agent’s “first call”
or contact with the customer. While
closing a sale on the first call may be
difficult for some business models
or even campaigns, the ability to do
so will not only drastically improve
your business’s overall efficiency, but
will ultimately allow you to generate
more revenue, faster.
Identify trends in the metric that have
led to successful sales. Then constantly
tweak and optimize your campaigns
to account for those factors.
The best way to improve this KPI is
by providing your sales reps/agents
with a well thought out, dynamic
script that will not only guide them
through the success-proven process
of a sales call, but will also help build
your agents’ confidence. When your
contact center software provides
dynamic scripting, your agents have
a very calculated approach to building
rapport on the first call. Build that
script with proven closing techniques
and phrases, as shown, for example,
in this Hubspot blog, 25 Closing
Phrases to Seal a Sales Deal in 2020.
14
www.convoso.com
13. NUMBER OF SALES AND
REVENUE PER AGENT
Separate but related metrics that
tell the story of daily productivity of
an agent, and how those sales and
revenue numbers compare with the
agent’s averages over time.
Additional Agent KPIs some of our
customers track
• Call to transfer rate [with separate
metrics for types of transfers: to
Closer; to Lead Buyers]
• Avg connected duration (Transfer)
• Call to billable call conversion rate
• Billable time vs Non-billable time
• Billable calls per hour.
TOOLS TO MEASURE
AGENT KPIs
Agent Calls Report – This report
tells you the total number of calls
an agent makes and takes each day/
week/month/etc, and breaks it down
into outbound, inbound and manual
call backs. It should provide their call
times, such as talk time, pause time,
wrapup time, etc.
Agent Productivity Report – This
report gives an agent by agent by
agent breakdown of their time spent
with the dialer. It’s broken into total
time, billable time (i.e., time they are
making calls), login time, not ready
time, and ready time.
Kyle Andersson of Digital Market
Media says, “We use this report to see
how the agents are spending their
time within the dialer. This is a huge
help for us, as we are a 100% remote
team (including the agents), so the
supervisors can’t be checking in
on them as they would in an office.”
15www.convoso.com
DIALING KPIs
15www.convoso.com

16
www.convoso.com
Exclude the first 5 seconds of calls
to remove dropped calls due to incor-
rect dials and wrong number dials.
• Abandonment Rate = [Total Aband-oned
Calls] / [Total Number of Calls]
To fix abandonment, look at adjusting
call forecasting. Your outbound efforts
might be too effective at certain
times–leaving customers without
a live agent to talk to. You should
constantly be upgrading your messa-
ging if you see your customers
leaving during their IVR or in-queue
messages.
16. AVERAGE DROPPED
CALL RATE
If no agent is available to take a call
when a dialer has dialed, the call will
be dropped. Monitoring the dropped
call KPI is critical because, for legal
reasons, your drop rating should not
be above 3% over a 30 day period.
You should be able to view the
average drop rating for all of your
campaigns.
14. AVERAGE HOLD TIME
With automated dialing systems,
customers are sometimes stuck on
hold waiting for an agent to sell them
a product or receive a certain deal.
Prospects should not need to wait
on hold before an agent answers
an outbound call. It leads to call
abandonment and reduces overall
profitability.
If you see that your customers
are waiting too long in queues, you
will likely need to reduce your
dialing level.
15. ABANDONED CALL RATE
The abandoned call rate shows us the
percentage of callers who hang up,
or abandon the queue, prior to conne-
cting with a live agent. This represents
a possible lost lead, and indicates
there may be issues with your dialer
settings.
Here’s how to calculate Abandoned
Call Rate for a selected timeframe.
If your dropped call rating is too
high, that’s a clear indication you are
burning through leads, which is simply
an inefficient dialing strategy for any
call center trying to be profitable.
To minimize dropped calls, make sure
you have enough agents working
on the dialer, and that you’re using
quality data. Balancing Agent Wait
Time with the Drop Rate will create
an efficient use of the dialer and
leads. Keep tweaking your dial levels
to find your sweet spot.
DIALING KPIs

17www.convoso.com
Your cloud based contact center
software should be able to customize
reports. From standard reports, you
want to be able to access metrics
easily in the combinations that give
you the most insight by using filters,
fields, and breakdowns.
With good reporting tools you’ll
quickly find out which lists, lead
sources, and agents are performing—
and which aren’t. A wide range of
filters will let you set the reporting
criteria that gets the information you
need. At a minimum, your dialer’s
reporting capabilities should provide
the following:
Conversion Reports
Which of your lists are performing
and which are not? Easily find out by
comparing and sorting all of your lists
based on success rate.
Lead Reports
Your leads are valuable assets.
View all their information at a glance,
filtered by status, campaign, list,
and user.
Versatile KPI Reporting Tools
Contact Rate Reports
An effective campaign begins with
reaching your leads. Quickly see
how many of your calls are making
contact and how many are missing
the target.
Agent Calls
Are your agents experiencing too
much down time? Track call counts
by agent and adjust workflows
accordingly to increase productivity.
Custom Reports
Create your own reports to suite your
operation’s needs. Filter reports and
drill down based a variety of variables,
from call type to dispositions.
Scheduled Reports
Running reports manually wastes
valuable time. Increase efficiency
by scheduling reports to be run and
emailed automatically at a specific
time — hourly, daily or weekly.

18
www.convoso.com
Monitoring many KPIs with snapshot
reports can be critical for quick decis-
ions in a daily call center operation.
They’re like taking the temperature.
But alone they are inadequate
to assess the health of a campaign,
because they don’t reflect the
influence of factors that need to be
reviewed comprehensively, as well
as over time.
Strategic decisions based on
a strong grasp of your KPIs creates
greater efficiencies for your leads/
lists, agents, and management.
Improving these efficiencies will yield
a dramatically higher ROI.
Is your call center TCPA
compliant?
Compliance is more important
now than ever in our ever changing
and increasingly regulated industry.
If you’re monitoring the KPIs
discussed here and using smart
dialing strategies, you’re taking
actions to ensure compliance.
Convoso’s software platform and
support is designed to help contact
centers stay in compliance. By using
the right tools and strategies,
you can prevent call blocking and
maintain a strong Caller ID reputation .
For KPIs and Metrics, keep in mind that...

2021 Convoso
Get dramatic results for YOUR call center.
ABOUT CONVOSO
Request a Demo
Convoso is the leading innovator of cloud-based
omnichannel contact center software. Our call
center customers report dramatic increases in
contact rates of 30% and more, giving them higher
conversions and significantly improved ROI.
The Convoso system works best with 10 or more
seats, and scales efficiently to over 1000 seats to
meet enterprise level requirements.
See for yourself with a live demo how Convoso
can help to boost the productivity of your contact
center.
convoso.com
(888) 456-5454